Value-added measures of school effectiveness in the United Kingdom
18
VALUE-ADDED MEASURES OF SCHOOL EFFECTIVENESS IN THE UNITED KINGDOM 1 Sally Thomas Introduction Over the last thirty years much research has been undertaken on the influence of the school. Early work by Coleman, Jencks and others (Coleman et al., 1966; Jencks et al., 1972) concluded that family and neighbourhood characteristics have a greater impact on pupil performance than individual school characteristics. However, subsequent research (Rutter et al., 1979; Mortimore et al., 1988; Goldstein et al., 1993; Sammons, Thomas & Mortimore, 1997) has demonstrated both that schools typically receive variable intakes of pupils and that the outcomes of schooling are not totally determined by their intakes. For example, Thomas and Mortimore (1996) have reported that up to 70-75% of the school variation in 16-year-olds' performance in the General Certification of Secondary Education (GCSE) is explained by pupil intake measures. However, importandy, the remaining unexplained variation between schools--25-30%--incorporates the impact of individual schools (and other external factors) on the performance of pupils. The issue of appropriate and valid ways of reporting schools' performance is of vital importance. Few would disagree that there are a wide variety of important Original language: English Sally Thomas (United Kingdom) Ph.D. SeniorResearchLecturerand AssociateD/rector of the International School Effectiveness and Improvement Centre (ISEIC), University of London Institute of Education. She has contributed to a wide varietyof research projects coveringeducation, psychologyand statistics, and has acted as a consultant on assessment in Australia, Brazil, China, Netherlands and the United States. Her publications include articles in a variety of academic journals and a recent book (with P. Sammons and P. Mortimore) on Forging links: effective schools and effective departments. She is on the editorial board of the British educational research journal. E-maih [email protected] Prospects, vol. XXVIII, no. 1, March 1998
Transcript of Value-added measures of school effectiveness in the United Kingdom
V A L U E - A D D E D M E A S U R E S
O F S C H O O L E F F E C T I V E N E S S
I N T H E U N I T E D K I N G D O M 1
S a l l y T h o m a s
I n t r o d u c t i o n
Over the last thirty years much research has been undertaken on the influence of the school. Early work by Coleman, Jencks and others (Coleman et al., 1966; Jencks et al., 1972) concluded that family and neighbourhood characteristics have a greater impact on pupil performance than individual school characteristics. However, subsequent research (Rutter et al., 1979; Mortimore et al., 1988; Goldstein et al., 1993; Sammons, Thomas & Mortimore, 1997) has demonstrated both that schools typically receive variable intakes of pupils and that the outcomes of schooling are not totally determined by their intakes. For example, Thomas and Mortimore (1996) have reported that up to 70-75% of the school variation in 16-year-olds' performance in the General Certification of Secondary Education (GCSE) is explained by pupil intake measures. However, importandy, the remaining unexplained variation between schools--25-30%--incorporates the impact of individual schools (and other external factors) on the performance of pupils.
The issue of appropriate and valid ways of reporting schools' performance is of vital importance. Few would disagree that there are a wide variety of important
Original language: English
Sally Thomas (United Kingdom) Ph.D. Senior Research Lecturer and Associate D/rector of the International School Effectiveness and Improvement Centre (ISEIC), University of London Institute of Education. She has contributed to a wide variety of research projects covering education, psychology and statistics, and has acted as a consultant on assessment in Australia, Brazil, China, Netherlands and the United States. Her publications include articles in a variety of academic journals and a recent book (with P. Sammons and P. Mortimore) on Forging links: effective schools and effective departments. She is on the editorial board of the British educational research journal. E-maih [email protected]
Prospects, vol. XXVIII, no. 1, March 1998
92 Sally Thomas
goals of schooling, such as enhancing positive pupil attitudes towards learning and behaviour, encouraging community values and vocational aspirations, as well as promoting academic achievement. However, the scope of this paper is mostly limited to the aspect of schools' performance measured by examination and test results, although examples of other types of outcomes are also described. Recent trends in Government policy in the United Kingdom have focused attention on schools' raw examination results, taking no account of the context of the school or the characteristics of the pupil intake. Nevertheless, it has been argued strongly by many educational practitioners as well as academic researchers that, taken on its own, information about schools' raw exam resul tsmsuch as those published by the Department for Education and Employment (DfEE)--will always be a very inadequate measure of performance and, without any knowledge of the context of that school, can be misleading (McPherson, 1992; National Commission on Education, 1993). For example, the late Desmond Nuttall (1990, p. 25) argued that 'natural justice demands that schools are held accountable only for those things that they can influence (for good or ill) and not for the pre-existing differences between their intakes.'
Raw results are the appropriate answer to the question 'How has my son or daughter performed?' but not to questions about the school's performance. They do not answer questions about how effective the learning and teaching is in the individual classroom or school. They do not indicate if a school is performing as well as it might be.
This paper aims to provide an overview and examples of what are commonly called 'value-added measures of school effectiveness' (VAM). Illustrations of how VAMs have been incorporated into school self-evaluation frameworks in the United Kingdom are also provided. In contrast to raw examination results, VAMs provide the starting point for a way of evaluating school performance that takes account of intake factors outside the control of the school but which have a considerable impact on pupil attainment. In addition, I will show how more detailed VAMs can also be employed to examine the internal variations in a school's effectiveness at the classroom, subject and departmental levels.
The diff iculty with league tables
Policy makers and academic researchers (Nuttall et al., 1989; Dearing, 1993) have highlighted the danger of using league tables solely based on raw results. Schools with high achieving intakes will tend to do well for that reason alone. Neither the initially high achieving nor the initially low achieving school is assisted by the publication of raw league tables. In the former, the need for improvement may not be appreciated; in the latter, serious demoralization of staff may occur through no fault of their own. Crucially, VAMs show whether some schools are performing markedly better or worse than other schools having taken into account intake factors. This point was powerfully illustrated in The Guardian's publication of schools' raw and value added 'A'-level examination results in 1992 and 1993 (Thomas, Nuttall & Goldstein, 1992) (see Table 1).
Prospects, vol. XXVIII, no. 1, March 1998

Value-added measures of school effectiveness 93
TABLE 1. The Guardian analysis, 1992
Value added Raw Number of post-16 institutions (n = 402)
A C 1 A B 48 C A 6 C B 39
Notes: A = scores in top 25%; B = scores in middle 50%; C = scores in bottom 25%
In Table 1, out of a total of 402 institutions for post-obligatory education (age 16), six were in the top 25% (Group A) of raw 'A'-level scores, but when contextual factors and prior attainment at the GCSE level were taken into account, their value-added scores were in the bottom 25% (Group C). Overall, almost one in four institutions changed their categorization from the raw to the value-added results.
Therefore, to make judgements about an individual school's performance, a range of information is needed in addition to the raw test or examination results. Information about the value added by a school to individual pupil's progress is one important source.
Measuring the educational value added contributed by a school to individual pupil achievement has a number of purposes: �9 it offers a fairer and more meaningful way of presenting school examination
results; �9 it is a tool which can provide both detailed and summary data that a school
can analyse as part of its self-evaluation; �9 it can be used to examine trends in value-added performance over time, in
relation to school improvement initiatives; �9 it provides performance measures that can be contrasted against other types
of data available in schools such as measures of pupils' affective or vocational outcomes or information about the views of key groups obtained using teacher, parent and pupil questionnaires; and
�9 it can provide additional guidance in monitoring and target-setting for individual pupils and specific groups of pupils (such as boys or girls, or certain ethnic
groups). The concept of value added is, therefore, both an indicator of a school's effectiveness and a tool for head teachers and their staff to analyse the extent to which they have effectively raised pupil achievement. As argue below, however, it is not a magic wand. It has real limitations which need to be well understood.
Prospects, vol. XXVIII, no. 1, March 1998
94 Sally Thomas
What is meant by value added
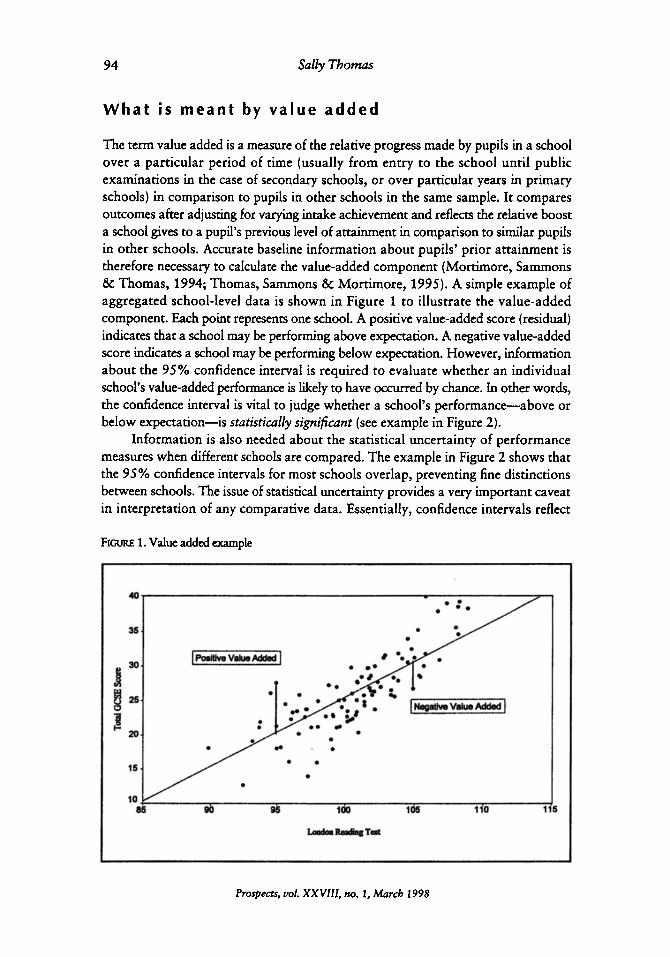
The term value added is a measure of the relative progress made by pupils in a school over a particular period of time (usually from entry to the school until public examinations in the case of secondary schools, or over particular years in primary schools) in comparison to pupils in other schools in the same sample. It compares outcomes after adjusting for varying intake achievement and reflects the relative boost a school gives to a pupil's previous level of attainment in comparison to similar pupils in other schools. Accurate baseline information about pupils' prior attainment is therefore necessary to calculate the value-added component (Mortimore, Sammons & Thomas, 1994; Thomas, Sammons & Mortimore, 1995). A simple example of aggregated school-level data is shown in Figure 1 to illustrate the value-added component. Each point represents one school. A positive value-added score (residual) indicates that a school may be performing above expectation. A negative value-added score indicates a school may be performing below expectation. However, information about the 95% confidence interval is required to evaluate whether an individual school's value-added performance is likely to have occurred by chance. In other words, the confidence interval is vital to judge whether a school's performance--above or below expectation--is statistically significant (see example in Figure 2).
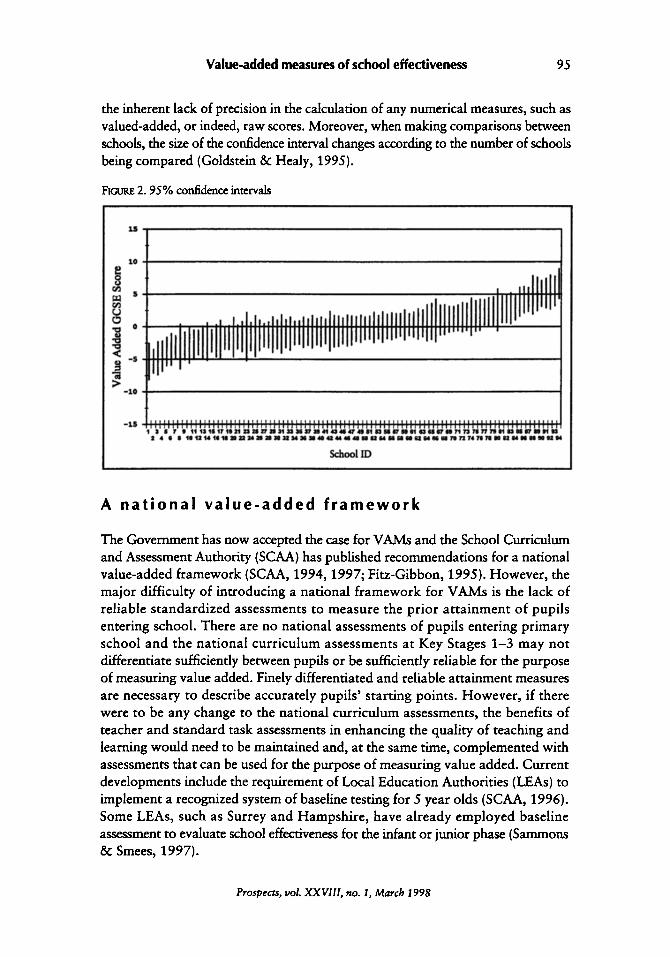
Information is also needed about the statistical uncertainty of performance measures when different schools are compared. The example in Figure 2 shows that the 95% confidence intervals for most schools overlap, preventing fine distinctions between schools. The issue of statistical uncertainty provides a very important caveat in interpretation of any comparative data. Essentially, confidence intervals reflect
FIGUR~ 1. Value added example
411
35
3O
15
loj
Qo ~ 1 ' / , . I q'
/ " .. ". ; I
9() 95 1()0 105 11'0 115
Prospects, uol. XXVIII, no. ~, March 1998
Value-added measures of school effectiveness 95
the inherent lack of precision in the calculation of any numerical measures, such as valued-added, or indeed, raw scores. Moreover, when making comparisons between schools, the size of the confidence interval changes according to the number of schools being compared (Goldstein &: Healy, 1995).
FIGU~ 2. 95% confidence intervals
I . , t
xo
- 10
-~L5
,., ,,I,i,.,,,,,,,,,i,,,ll,l,,i,,llJllJlllllll IIIIIII IIIIIIllii 'l' iIIfll,!!lll II llll Illl Illlllllll IIJll,J,,I,l,,,',',,', '""
I ~ l t l l T I t r ~ ' 1 I ~ 1 r r ~ ' 1 1 ~ 1 ~ t ~ 1 ~ t ~ t t t t t ~ t t t ~ I 1 ~ t ~ 1 ~ I 1 I ~ r ~ r ~ r ~ 1 ~ r ~
School ID
A n a t i o n a l v a l u e - a d d e d f r a m e w o r k
The Government has now accepted the case for VAMs and the School Curriculum and Assessment Authority (SCAA) has published recommendations for a national value-added framework (SCAA, 1994, 1997; Fitz-Gibbon, 1995). However, the major difficulty of introducing a national framework for VAMs is the lack of reliable standardized assessments to measure the prior attainment of pupils entering school. There are no national assessments of pupils entering primary school and the national curriculum assessments at Key Stages 1-3 may not differentiate sufficiently between pupils or be sufficiently reliable for the purpose of measuring value added. Finely differentiated and reliable attainment measures are necessary to describe accurately pupils' starting points. However, if there were to be any change to the national curriculum assessments, the benefits of teacher and standard task assessments in enhancing the quality of teaching and learning would need to be maintained and, at the same time, complemented with assessments that can be used for the purpose of measuring value added. Current developments include the requirement of Local Education Authorities (LEAs) to implement a recognized system of baseline testing for 5 year olds (SCAA, 1996). Some LEAs, such as Surrey and Hampshire, have already employed baseline assessment to evaluate school effectiveness for the infant or junior phase (Sammons & Smees, 1997).
Prospects, vol. XXVIII, no. 1, March 1998
96 Sally Tbornas
The development of VAMs
The development of VAMs as indicators of school effectiveness has arisen from a variety of sources.
T H E NEEDS OF A C A D E M I C R E S E A R C H
Many school effectiveness studies, in particular those carried out prior to the mid- 1980s, were hampered by the limited statistical techniques available (Scheerens, 1992) and did not have access to the recently developed, sophisticated and now widely preferred method of analysisnmulti-level modelling (Goldstein, 1987, 1995; Paterson & Goldstein, 1991).
T H E NEEDS OF LEAS
The requirements of the 1980 Education Act and the 1991 (Schools) Bill (section 16) for schools to publish their 'raw' public examination results placed a much greater emphasis on the search for fairer and more accurate measures of school performance and this has led to the increasingly widespread and systematic collection of pupil data by local education authorities including information about pupil examination and assessment outcomes and other pupil and school characteristics (Hill, 1994, 1997).
T H E NEEDS OF I N D I V I D U A L S C H O O L S
Individual schools have also addressed the issues of school performance and effectiveness as an aspect of their own internal monitoring and evaluation and external inspections, such as those carried out by the local education authority and, at the national level, by the Office for Standards in Education (OFSTED) and DfEE (DfEE, 1996). Various projects such as those set up by the London Institute of Education, the University of Durham and the National Foundation for Educational Research have assisted schools by providing VAMs (Spours & Hodgson, 1996; Hill, 1997).
Academic researchers, LEAs and schools have employed a wide variety of different procedures for measuring school effects using either pupils' background factors (such as socio-econornic status) or pupils' prior attainment data (or both), as well as different levels of sophistication in the analysis (employing individual pupil-level data or cruder aggregated school-level data) (Gray, Jesson & Sime, 1990; Thomas, Nuttall & Goldstein, 1993a, 1993b; Thomas, Pan & Goldstein, 1994; Hill, 1994, 1997). However, recent research has shown that pupils' prior attainment is the most important and reliable indicator and predictor of their subsequent attainment--explaining up to 59% of the total variance in pupils' academic outcomes and consequently up to 76% of the variance between schools' performances (Thomas & Smees, 1997).
Prospects, vol. XXVIII, no. 1, Marcb 1998

Value-added measures of school effectiveness 97
An important issue revolves around what value-added methodology should be employed when prior attainment data are lacking (whether at the national or local level). In the absence of prior attainment data, socio-economic information and other pupil characteristics (e.g. fluency in English, gender, age, education of parents, entitlement to free school meals) have sometimes been used as approximate measures of previous attainment.
An example of this approach is described in an OFSTED report (Sammons et al., 1994) which proposes an interim procedure for evaluating school performance in the absence of nationally available attainment data on entry to secondary schools. However, it should be emphasized that research shows that when intake attainment data are available, the inclusion of socio-economic information in the calculation of VAMs adds little in accounting for differences between schools (Thomas & Mortimore, 1996). Nonetheless it is useful as a method of 'fine-tuning' the VAMs and will make a difference to the estimates obtained for a few individual schools. This is particularly important for schools which serve skewed intakes with high numbers of certain groups (e.g. boys, or those from low-income families). It must also be emphasized that the presence of good intake attainment data on individual pupils is crucial as without this, valid value-added analysis is not possible. In terms of the value-added concept-- pupils" relative progress in attainment--this aspect of performance cannot be evaluated without a longitudinal methodology incorporating both baseline and outcome measures. Thus, merely having socio-economic data or aggregate school level data is, to a large extent, inadequate.
Stat is t ica l techniques and methodo logy for measur ing value added
It is important to use the appropriate statistical techniques and methodology for measuring value added as an indicator of school effectiveness. The following section describes different approaches and issues related to this methodology. The points raised are not exclusive but aim to provide a stimulus for further investigation and development of VAMs.
DETAILED PUPIL LEVEL DATA AND MULTI-LEVEL M O D E L L I N G
Calculating the effect that a school has on an individual pupil's progress is complex. The more information it is possible to have about individual pupils, sub-groups of pupils, and all pupils in a school as well as across schools in a LEA, the more reliable and informative any subsequent analysis is likely to be. Multiple regression analysis is the statistical technique that enables this analysis to happen, whilst multi-level modelling is a recent development of this technique.
A key challenge for researchers has been to develop models which allow the statistical analysis to separate out the effect of the school experience on individual pupil outcomes (what pupils achieve) and the extent to which pupil intake
Prospects, vol. XXVI I I , no. 1, March 1998

98 Sally Thomas
characteristics (those things the pupils arrive at school with such as the level of attainment they have already reached, their socio-economic background) affect pupil outcomes. Multi-level modelling is now widely recognized as the most accurate and flexible tool for examining the hierarchical nature of pupil attainment data, especially when the aim is to disentangle the complexity of schools' effectiveness (Goldstein, 1987, 1995).
DIFFERENT MODELS FOR SEPARATING AND MEASURING EFFECTS
Thomas and Mortimore (1996) compared five alternative models to establish the best value-added approach. The best model for calculating VAMs involved controlling for a range of individual pupil intake factors: * pupils' prior attainments in verbal, quantitative and non-verbal cognitive ability
tests; �9 gender; �9 age; �9 ethnicity; * mobility; and �9 entitlement to free school meals. However, as noted previously, the level of attainment an individual pupil has when s/he begins at a school is the key component in valid value-added analyses.
CONTINUITY OF PRIMARY SCHOOL EFFECTS
Other value-added research has focused on the issue of the continuity of primary school effects at the secondary level (Sammons et al., 1996; Goldstein & Sammons, 1997). Initial results indicate a lasting impact of primary school effectiveness on pupils" progress in secondary school. In other words, pupils from primary schools where the learning and teaching was effective appear to continue to make better progress at secondary school than pupils from less effective primary schools. Therefore new developments in the methodology of calculating VAMs may need explicitly to take into account previous schools attended by individual pupils.
PUPILS CHANGING SCHOOLS
This last point is also directly relevant in dealing with the sometimes frequent occurrence of pupils changing schools within an educational stage. Hill and Goldstein have recently argued that this issue has important implications for the accuracy of a school's effectiveness measures which relate to a period of time when many pupils may have left and other new pupils have started (Hill & Goldstein, forthcoming). Further work is required to examine how this issue can be addressed in a national value-added framework.
Prospects, vol. XXVIII, no. I, March 1998
Value-added measures of school effectiveness 99
STABILITY OVER TIME AND I N T E R N A L V A R I A T I O N S IN S C H O O L S '
E F F E C T I V E N E S S
Overall statistics of pupil performance cannot give an accurate picture of how effective a school is at raising and maintaining the achievement of all its pupils, or how capable it is of sustaining its standards over time. The availability and analysis of individual pupil-level data is essential to examine different aspects of a school's effectiveness. Some schools that may appear to be effective in terms of the overall VAM may not be so effective in terms of individual departments, for different groups of pupils or over different periods of time.
As an example, I will use the results of a study of ninety-four inner-city London secondary schools (Thomas et al., 1997a, 1997b). This project analysed three aspects of schools' GCSE performance: �9 stability of results over three years (1990-92); �9 consistency across subject departments; and �9 differential effects for different groups of pupils (such as high and low attainers). A value-added approach was employed controlling for selected pupil background measures of prior attainment at secondary transfer, gender, age, ethnicity and income. Seven different school-outcome measures were investigated: total GCSE score, and scores in English, English literature, mathematics, science, French and history.
Stability over time
The evidence over the three years showed that schools' effects on the total GCSE performance score were more stable (with correlations year to year ranging from 0.82 to 0.85--a perfect relationship being represented by 1.00) than those for specific subjects. At the subject level, results for French were the least stable and those for history the most stable. These correlations are slightly lower than similar research by Gray and colleagues that looks at total GCSE score only (Gray et al., 1995; Gray, Goldstein &; Jesson, 1996), but this may be due to the special influence of teacher and pupil mobility in inner-city schools. Despite evidence of broad stability in some areas, the correlations indicate that there is also a substantial degree of change over time in subject results, and highlight the necessity of looking at results in more than one year and trends in results over a minimum of three years. It is important to emphasize that 'real' improvement (or decline) in performance resulting perhaps from a shift in educational policy or practice can only be identified by examining long-term changes in results over time.
Consistency across departments
The evidence concerning consistency between departmental and overall school results (taking into account three years of data) ranges from fairly strong in some cases to fairly weak in others. For a substantial proportion of schools (e.g. approximately one-third in 1991), there were significant departmental differences in terms of
Prospects, uol. XXVIII , no. 1, March 1998
1 O0 Sally Thomas
effectiveness. These differences would not be apparent if only total GCSE scores for a school were used. These findings are in line with previous research which looks at a more limited range of outcomes (Goldstein, 1993) and suggests strongly the need to look at school performance in detail--not just at total GCSE performance but also at the subject levelmto tease out effective departments. Similar work at the primary level has been carried out by Tymms and colleagues as part of the SCAA national value-added project (Tymms & Henderson, 1995). However, one limitation of looking at individual subjects is that sometimes there are only a few pupils taking a particular examination (particularly at 'A'-levels) and therefore the statistical uncertainty of the value-added score may be relatively large. Nevertheless, the impact of this limitation will naturally reduce as data are built up over time and sample sizes increase.
Differential effects for different groups of pupils
The study also addressed the important question, 'Are some schools more effective for particular pupil groups?' The value-added analysis showed that some schools obtained differing value-added results for different groups of pupils. The findings were particularly strong for pupils categorized by prior attainment measures and by ethnicity. Significant differential effects were also found for girls versus boys and for pupils from low-income families versus other pupils.
However, the results also suggested that all pupils in schools and departments that were effective for the average pupil were likely to perform relatively well at the GCSE level but particular groups (such as those not entitled to free school meals) were likely to perform especially well. In contrast, all pupils in schools and departments that were less effective for the average pupil were likely to perform poorly but particular groups (such as Asian pupils) were likely to perform not quite so poorly. These findings highlight again the usefulness of value-added techniques in allowing a more sensitive analysis of data, and ensuring that under-achievement of particular groups of pupils within each school is recognized.
Similar work has been carried out with primary schools (Sammons, Nuttall & Cuttance, 1993; Thomas, 1995) and post-16 institutions (Goldstein & Thomas, 1996; O'Donoghue et al., 1997), indicating that internal variations in effectiveness need to be monitored at all stages of statutory education. Overall this evidence strongly suggests that schools need to monitor and evaluate their performance using a range of different VAMs for particular groups of pupils, for individual departments, for different pupil cohorts and points in time (and where possible also for different year groups within the school).
V a l u e - a d d e d r e s u l t s as a t o o l fo r school s e l f - e v a l u a t i o n
I have emphasized the need for schools to analyse data in a more sensitive and detailed way, at a range of levels: individual pupils, various pupil groups, sub-groups,
Prospects, vol. XXVIII , no. I, March 1998
Value-added measures of school effectiveness 101
subject level, whole school and LEA-wide. Importantly, schools need to collaborate with other schools at the local, regional and national levels in order to provide comparative data for value-added analyses. Numerous LEA projects are currently in progress and further details can be found in a recent report by the United Kingdom's National Foundation for Educational Research (Hill, 1994, 1997).
However, the collection and analysis of both quantitative and qualitative data is essential ff schools are to be %elf-evaluating' institutions. 'Indicators do not provide the diagnosis or prescribe the remedy--they are simply suggestive of the need for action' (Nuttall, 1990).
Value-added data are helpful for school self-evaluation by raising questions about changes and/or consistency in results over time, highlighting differences between individual departments in a school compared to the whole school value added, and allowing schools to compare themselves with other schools (within limits of statistical uncertainty).
There are numerous different issues and approaches to be considered when interpreting value-added results: �9 Consider the importance of confidence limits when making comparisons between
schools--if the confidence intervals of two particular schools overlap then there is no significant difference between their performances (see for example Figure 1).
�9 Bear in mind limitations of the methodology for your school. How relevant to your school's results are issues of- measurement error, missing data, data accuracy and the retrospective nature of the data?
* Track changes in results over time to examine real improvements and/or random fluctuations in performance
�9 examine departmental and/or teacher effectiveness versus summary measures of school effectiveness (e.g. total GCSE performance for the average pupil) and their implications for whole school policies
�9 examine differential effectiveness for different groups of pupils (e.g. boys/girls, high/low attainers) and implications for equal opportunities
�9 employ a wider range of VAMs to reflect more fully the aims of schooling (e.g. using pupil attitudes and vocational as well as academic outcomes)
An example of an LEA v a l u e - a d d e d analysis
In 1992 a project was initiated by Lancashire LEA aimed at developing, as far as possible, the most accurate, appropriate and fair measures of secondary school effectiveness. Results were to be fed back to schools, in confidence, to assist individual self-evaluation. The project is ongoing, and since 1993 ninety-eight secondary schools in Lancashire have been involved in collecting detailed information about individual pupils. The method of analysis uses multi-level modelling techniques to calculate a wide range of different VAMs (Thomas & Mortimore, 1996).
Pupils' attainment on entry to the school is employed for the GCSE analysis, including three different measures of prior attainment (National Foundation for
Prospects, voL XXVIII , no. 1, March 1998
102 Sally Thomas
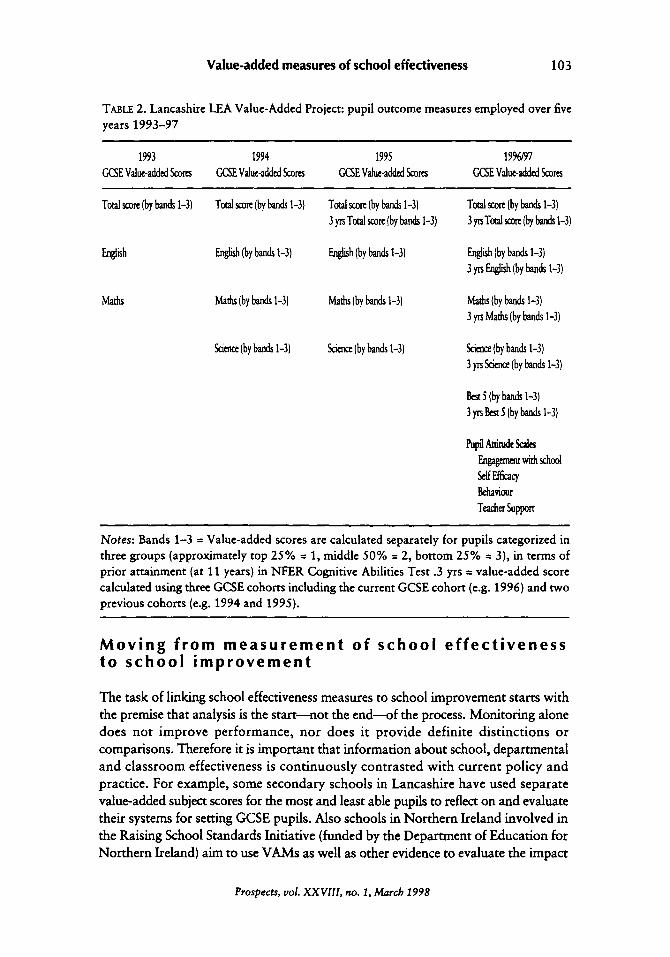
Educational Research Cognitive Abilities Test Verbal, Quantitative and Non-Verbal scores). A wide variety of pupils' background factors---such as gender, ethnicity and mobili ty--outside the control of the school, are also included in the multi-level analysis of pupil outcomes. Key findings from the study include that in 1993, one- quarter of the seventy-nine schools moved up or down twenty or more places when their value-added results were compared with average raw scores. More than half moved ten or more places. As can be seen in Table 2, the project has been extended each year. In 1996, forty different VAMs were provided for each school, incorporating five different GCSE outcomes (total, best five, English, mathematics and science), relating either to the current year (e.g. 1996) or the combined results of three years (e.g. 1993-96). For the purpose of examining trends over time, the approach of employing separate measures which reflect the results of three consecutive GCSE cohorts provides a 'rolling average' measure of school and departmental performance. Additional scores for each outcome relating to pupils of above, below and average attainment on entering the school were also provided. Schools were then able to use this information to focus their attention on individual pupils, groups of pupils or subject departments. Lancashire LEA advisors have also provided additional information to schools as well as giving support and development in using the value- added results for school self-evaluation (Scanlon, 1996).
New developments of the Lancashire value-added project have included collecting pupil attitude data for all Year 9 (14-year-old) and Year 11 (16-year-old) pupils in the spring terms of 1996 and 1997, using instruments designed originally for the Improving School Effectiveness Project (ISEP) (MacBeath & Mortimore, 1994; Thomas, Smees &: McCall, 1997). The 1996 findings from seventy schools summarized in Table 3 suggest that in some cases pupil attitudes (represented by five attitude scales: pupil culture, self efficacy, engagement with school, behaviour and teacher support) can vary substantially between schools. This information is used confidentially by schools to evaluate their impact on pupils' experience at school. In other words, pupils" reported attitudes are employed as important outcomes in their own right, in addition to GCSE examination outcomes. Interestingly, recent evidence from the Lancashire project (Thomas & Smees, 1998) shows that the correlation between schools' GCSE value-added scores and pupil attitude outcomes is low (ranging from -0.24 to 0.16). These findings suggest that different dimensions of effectiveness may exist that relate to different--but equally important--aspects of schooling. Both the ISEP and the Lancashire project aim to expand the range of outcomes and VAMs used to evaluate school effectiveness, to reflect more fully the aims of schooling. In addition, head teachers in Lancashire have completed a questionnaire concerning the characteristics, educational processes, and quality of teaching and learning in their school as well as their views about effective schools in general. The aim is that this kind of information will assist schools in linking trends over time in value-added performance to each schools' individual context, targets and strategies for improvement.
Prospects, voL XXVIIL no. 1, March 1998
Value-added measures of school effectiveness 103
TABLE 2. Lancashire LEA Value-Added Project: pupil outcome measures employed over five years 1993-97
1993 1994 1993 1996/97 GCSE Value-added Scores GCSE Value-added So.ore GCSE Value-added Scores GCSE Value-added Scores
Total score (by bands I-3) Total ~re (by bands I-3) Total score (by bands 1-3) 3 yrs Total score (by bands 1-3)
Total score (by bands I-3) 3 m Total score (by bands I-3)
English English (by bands 1-3) English (by bands I-3) English (by bands 1-3) 3 yrs English (by bands 1-3)
~ths Maths (by bands 1-3) Maths (by bands 1-3) Ma~ (by bands 1-3) 3 yrs Maths (by bands 1-3)
Science (by bands I-3) Scicncc (by bands 1-3) sdmcc (by ~ds I-3) 3 m Sc~ (by bands I-3)
5 (by ~ds 1-3) 3 yrs Best 5 (by bands l-3)
1 ~ ~itudt Scalts Eagagerr~t wi~ school ~Efficacy Ik~viour T~&er Support
Notes: Bands 1-3 = Value-added scores are calculated separately for pupils categorized in three groups (approximately top 25% = 1, middle 50% = 2, bottom 25% = 3), in terms of prior attainment (at 11 years) in NFER Cognitive Abilities Test .3 yrs = value-added score calculated using three GCSE cohorts including the current GCSE cohort (e.g. 1996) and two previous cohorts (e.g. 1994 and 1995).
M o v i n g f rom m e a s u r e m e n t of school e f f e c t i v e n e s s to school i m p r o v e m e n t
The task of linking school effectiveness measures to school improvement starts with the premise that analysis is the s ta r t - -not the end - -o f the process. Monitor ing alone does no t improve per formance , nor does it provide defini te d is t inc t ions or comparisons. Therefore it is important that information about school, departmental and c lassroom effectiveness is con t inuous ly cont ras ted wi th cur ren t policy and practice. For example, some secondary schools in Lancashire have used separate value-added subiect scores for the most and least able pupils to reflect on and evaluate their systems for setting GCSE pupils. Also schools in Nor thern Ireland involved in the Raising School Standards Initiative (funded by the Department of Educat ion for Northern Ireland) aim to use VAMs as well as other evidence to evaluate the impact
Prospects, vol. XXVIII, no. 1, March 1998

104 Sally Thomas
TABLE 3. Lancashire Pupil Attitude Questionnaire Scales (1996)
Mean Standard* Score* Deviation
Scale 1. ENGAGEMENT WITH SCHOOL
Item 1 Item 3 Item 5 Item 6 Item 31
I always like school I always get on well with teachers
Teachers are always fair
School work is always interesting
Teachers are nearly always friendly towards pupils
Scale 2. PUPIL CULTU~
Item 2 Item 20 Item 33 Item 36
I always get on well with others in my year
I never fell leo out of things I never get bullied
I find it easy to make friends
Scale 3. SELF EFFICACY
Item 26 Item 28 Item 29
My work in class is very good
I think I'm very clever
All my teachers think my work in class is good
Scale 4. BEHA~OUR
Item 3 Item 37 Item 38
[0.171 [0.271 [0.331 I0.19] [0.201
[o.341 [o.381 [o.171 [o.281
[o.511 [o.17] [o.371
I always get on well with teachers [0.07] How would you describe your bebaviour in class? Good [0.40] How do you think teachers would describe your bebavioud Good [0.56]
Scale 5. TEACHER SUPPORT
Teachers always help me to understand my work [0.19] Teachers always tell me I can do well [0.25] Teachers always tell me bow I am getting on with work [0.31] Teachers always praise me when I have worked hard [0.29] Teachers are nearly always friendly towards pupils [0.14]
Item 8 Item 11 Item 14 Item 16 Item 31
2.85 0.08
3.28 0.07
2.93 0.08
3.25 0.10
2.87 0.12
Notes: The Lancashire pupil attitude scales were calculated using the LISREL statistical software [Linear Structural Equation Model for Latent Variables] (Joreskog & Sorbom, 1989). LISREL weights shown in brackets. Attitude scale range: 1 (most negative response category) to 4 (most positive response category, shown in table). * estimates calculated across schools.
Prospects, vol. XXVIII, no. I, March 1998

Value-added measures of school effectiveness 105
of particular improvement strategies at the school and classroom levels (Thomas, 1996).
Future developments in value-added research are likely to build on current findings that investigate the relationship between measures of school performance and the conditions that appear to enhance or hinder school effectiveness in different types of school contexts. This approach requires the use of both qualitative and quantitative data. For example, research by Sammons and colleagues (Sammons, Thomas & Mortimore, 1997) employed a value-added methodology to evaluate school performance and combined this with interview and questionnaire data to investigate factors and processes related to greater depas and school effectiveness.
However, further attention is required on the crucial issue of which school improvement initiatives or strategies for improvement provide successful levers to the improved performance of schools over time. A particular issue relates to the variety of strategies that may be successful in different types of context, such as in areas of high versus low socio-economic disadvantage. The ISEP (MacBeath & Mortimore, 1994) is currently addressing these issues. The project's findings will provide important information regarding the implementation and impact of particular strategies for school improvement.
C o n c l u s i o n s
This paper has mostly focused on the performance of schools in terms of examination and test results. On their own, such results are insufficient for proper judgements about schools' performance. Other pupil outcomes such as pupil attendance, capacity for independent learning, attitudes towards school and learning, behaviour and self- concept are also important. School effectiveness research aims to investigate a broad range of educational outcomes. Examples of this approach are provided by the Junior School Project (Mortimore et al., 1988), the Lancashire project (Thomas & Mortimore, 1996) and the ISEP in Scotland (MacBeath & Mortimore, 1994) which involves collecting pupil, teacher and parent attitude data in addition to academic outcomes. Nevertheless, the main performance indicator for schools continues to be how successful they are at ensuring that as many pupils as possible achieve their full academic potential.
Therefore monitoring of internal variations in performance in any year and across years should be encouraged to facilitate a review of standards for different groups of pupils, and at the departmental, subject and classroom levels as well as overall, to see how these standards may change over time. Results from research where schools are grouped into strictly defined effectiveness categories show that few schools perform both consistently across subjects and with stability over time (Thomas, et al., 1997a). These findings are of practical as well as theoretical importance. School performance that varies greatly over time or between departments in secondary schools has implications for whole school policies and may provide important evidence about the impact of school improvement initiatives. School performance that varies greatly for different groups of pupils (such as boys and girls) has implications for equal opportunities and pupil entitlement. Similarly, significant differences between subject
Prospects, vol. XXVIII, no. I, March 1998
106 Sally Thomas
areas at the primary level have important implications for teacher effectiveness across the whole range of national curriculum subjects (Thomas, 1995; Sammons & Smees, 1997). Hopefully, evidence of this kind--employed as part of a confidential framework for school and teacher self-evaluation--will stimulate and inform teachers' evaluation of their own educational practices as well as the overall quality of teaching and learning in their school and its capacity for improvement in order to work towards raising educational standards for all children.
Note
. This research paper was completed via a grant awarded by the United Kingdom Economic and Social Science Research Council. I am very grateful for the helpful comments of my colleagues Louise Stoll, Pare Sammons, Harvey Goldstein and Hillary Street on a previous version of this paper.
References
Coleman, J.S., et al. 1966. Equality o[ educational opportunity. Washington, DC, United States Government Printing Office.
Dearing, R. 1993. The national curriculum and its assessment: interim report. London, National Curriculum Council 6c School Examination Assessment Council.
Department for Education and Employment. 1996. Setting targets to raise standards: a survey o[ good practice. London, DfEE.
Fitz-Gibbon, C.T. 1995. National value-added project. General report: issues to be considered in the design of a national value-added system. London, School Curriculum and Assessment Authority.
Goldstein, H. 1987. Multi-level models in educational and social research. London, Charles Griffin &: Co.; New York, Oxford University Press.
�9 1993. Assessment and accountability, Education (TOWN), vol. 183, no. 3, p. 33--4. .1995. Multi-level statistical models, 2nd ed. London, Sydney, Auckland, Edward Arnold.
(Kendall's library of statistics vol. 3.) Goldstein, H.; Healy, M. 1995. The graphical presentation of a collection of means. Journal
of the Royal Statistical Society (Oxford), vol. 581, no. 1, p. 175-77. Goldstein, H.; Sammons, P. 1997. The influence of secondary and junior schools on sixteen
year examination performance: a cross-classified multi-level analysis. School effectiveness and school improvement (Lisse, Netherlands), vol. 8, no. 2, p. 219-30.
Goldstein, H.; Thomas, S. 1996. Using examination results as indicators of school and college performance. Journal o[ tbe RoyalStatistic~Society (Oxford), vol. 159, no. 1, p. 149-63.
Goldstein, H., et al. 1993. A multi-level analysis of school examination results. Oxford review o[ education (Oxford), vol. 19, no. 4, p. 425-33.
Gray, J.; Goldstein, H.; Jesson, D. 1996. Changes and improvements in schools' effectiveness: trends over five years. Research papers m education (London), vol. 11, no. 1, p. 35-51.
Gray, J.; Jesson, D.; Sime, N. 1990. Estimating differences in the examination performance of secondary schools in six LEAs: a multi-level approach to school effectiveness. Ox[ord review of education (Oxford), vol. 16, no. 2, p. 137-58.
Gray, J., et al. 1995. A multi-level analysis of school improvement: changes in schools'
Prospects, voL XXVIII, no. 1, March 1998
Value-added measures of school effectiveness 107
performance over time. School effectiveness (y school improvement (Lisse, Netherlands), vol. 6, no. 2, p. 97-114.
Hill, N. 1994. Value-added analysis: current practice in local educational authorities. Slough, National Foundation for Educational Research in England and Wales, Education Management Information Exchange.
�9 1997. Value-added and school performance: recent LEA initiatives. Slough, National Foundation for Educational Research in England and Wales, Education Management Information Exchange.
Hill, P.; Goldstein, H. forthcoming. Multi-level modelling of educational data with cross- classification and missing identification for units. Journal of educational and bebavioural statistics (Washington).
Jencks, C.S., et al. 1972. Inequality: a reassessment of the effect of family and schooling in America. New York, Basic Books.
Joreskog, K.G.; Sorbom, D. 1989. LISREL 7: user's reference guide. Chicago, SPSS Inc. MacBeath, J.; Mortimore, P. 1994. Improving school effectiveness--a Scottish approach.
(Paper presented at the British Educational Research Association 20th Annual Conference, September, St Anne's College, Oxford.)
McPherson, A. 1992. Measuring added value in schools. National Commission on Education Briefing No. 1, February 1992, London.
Mortimore, P.; Sammons, P.; Thomas, S. 1994. School effectiveness and value-added measures. Assessment in education: principles, policy & practice (Abingdon, U.K.), vol. 1, no 3, p. 315-32.
Mortimore, P., et al. 1988. School matters: t.be junior years. Wells, Open Books. National Commission on Education. 1993. Learning to succeed. London, Heinemann. Nut'tall, D. 1990. Differences in examination performance. London, Research and Statistics
Branch, Inner London Education Authority. Nutrall, D., et al. 1989. Differential school effectiveness. International journal of educational
research (Kidlingron, U.K.), vol. 13, no. 7, p. 769-76. (Special issue Developments in school effectiveness research.)
O'Donoghue, C., et al. 1997. 1996 D/EE study of value added for 16-18 year olds in England. London, HMSO.
Paterson, L.; Goldstein, H. 1991. New statistical methods of analysing social structures: an introduction to multi-level models. British educational research journal (Abingdon, U.K.), vol. 17, no. 4, p. 387-93.
Rutter, M., et al. 1979. F/fteen thousand bouts: secondary schools and their effects on children. London, Open Books.
Sammons, P.; Nuttall, D.; Cuttance, P. 1993. Differential school effectiveness: results from a reanalysis of the Inner London Education Authority's Junior School Project data. British educational research journal (Abingdon, U.K.), vol. 19, no 4, p. 381--405.
Sammons, P.; Smees, R. 1997. Surrey LEA baseline screening. London, Institute of Education. Sammons, P.; Thomas, S.; Mortimore, P. 1997. Forging links: effective schools and effective
departments. London, Paul Chapman�9 Sammons, P., et al. 1994. Assessing school effectiveness: developing measures to put school
performance m context. London, O~ce for Standards in Education (OFSTED). .; .1996. Continuity of school effects: a longitudinal analysis of primary and secondary school effects on GCSE performance. School effectiveness (r school improvement (l.Jsse, Netherlands), vol. 6, no. 4, p. 285-307.
Prospects, uol. XXVIII, no. 1, March 1998
108 Sally Thomas
Scanlon, N. 1996. Lancashire LEA value-added project�9 Preston, Lancashire LEA. Scbeerens, J. 1992. Effective schooling: research, theory and practice. London, Cassell. School Curriculum and Assessment Authority. 1994. Value-added performance indicators
for schools. London, SCAA. �9 1996. Baseline assessment draft proposals. London, SCAA. .1997. The value-added national project--report to the Secretary of State. London, SCAA.
Spouts, K.; Hodgson, A. 1996. Value-added and raising artainment---a formative approach. London, Institute of Education�9
Thomas, S. 1995. Considering primary school effectiveness: an analysis of 1992 Key Stage 1 results. The curriculum iournal (London), vol. 6, no 3, p. 279-95.
�9 1996. Research proposal for DEN1 RSSI value-added project�9 London, Institute of Education�9
Thomas, S.; Mortimore, P. 1996. Comparison of value-added models for secondary school effectiveness. Research papers in education (London), vol. 11, no. 1, p. 5-33.
Thomas, S.; Nut-tall, D.; Gotdstein, H. 1992. The Guardian survey (of A-level examination results). The Guardian (Manchester), 20 October.
�9 1993a. The Guardian survey (of A-level examination results). The Guardian (Manchester; U.K.), 30 November�9
�9 1993b. Report on analysis of 1991 examination results�9 London, Association of Metropolitan Authorities.
Thomas, S.; Pan, H.; Goldstein, H. 1994. Report on analysis of 1992 examination results�9 London, Association of Metropolitan Authorities.
Thomas, S.; Sammons, P.; Mortimore, P. 1995. Determining what 'adds value' to student achievement�9 Educational leadership international (Alexandria, VA), vol. 52, no. 6, p. 19-22.
Thomas, 54 Smees, R. 1997. Dimensions of school effectiveness : comparative analyses across regions. (Paper presented at the Tenth International Congress for School Effectiveness and Improvement, Memphis, Tennessee, January.)
.; . 1998. Examining the dimensions of secondary school effectiveness and improvement�9 (Paper presented at the Eleventh International Congress for School Effectiveness and Improvement, Manchester, United Kingdom.)
Thomas, S.; Smees, R.; McCall, J. 1997. Room for improvement: analysis oflSEP primary baseline measures. (Paper presented at a symposium Critical Issues in School Effectiveness Research at Tenth International Congress for School Effectiveness and Improvement, Memphis, Tennessee, January.)
Thomas, S., et al. 1997a. Stability and consistency in secondary schools' effects on students' GCSE outcomes over three years. School effectiveness and school improvement (Lisse, Netherlands), vol. 8, no. 2, p. 169-97.
�9 1997b. Differential secondary school effectiveness: examining the size, extent and consistency of school and departmental effects on GCSE outcomes for different groups of students over three years. British educational research journal (Abingdon, U.K.), vol. 23, no. 4, p. 451-69.
Tymms, P.; Henderson, B. 1995. The value-added national project, technical report: primary. London, School Curriculum and Assessment Authority.
Prospects, vol. XXVIII, no. I, March 1998