The Sensitivity of Value-Added Teacher Effect Estimates to Different Mathematics Achievement...
21
Journal of Educational Measurement Spring 2007, Vol. 44, No. 1, pp. 47–67 The Sensitivity of Value-Added Teacher Effect Estimates to Different Mathematics Achievement Measures J. R. Lockwood, Daniel F. McCaffrey, Laura S. Hamilton, Brian Stecher, Vi-Nhuan Le, and Jos´ e Felipe Martinez The RAND Corporation Using longitudinal data from a cohort of middle school students from a large school district, we estimate separate “value-added” teacher effects for two subscales of a mathematics assessment under a variety of statistical models varying in form and degree of control for student background characteristics. We find that the variation in estimated effects resulting from the different mathematics achievement measures is large relative to variation resulting from choices about model specification, and that the variation within teachers across achievement measures is larger than the variation across teachers. These results suggest that conclusions about individual teachers’ performance based on value-added models can be sensitive to the ways in which student achievement is measured. In response to the testing and accountability requirements of No Child Left Be- hind (NCLB), states and districts have been expanding their testing programs and improving their data systems. These actions have resulted in increasing reliance on student test score data for educational decision making. One of the most rapidly ad- vancing uses of test score data is value-added modeling (VAM), which capitalizes on longitudinal data on individual students to inform decisions about the effectiveness of teachers, schools, or programs. VAM is gaining favor because of the perception that longitudinal modeling of student test score data has the potential to distinguish the effects of teachers or schools from nonschooling inputs to student achievement. As such, proponents of VAM have advocated its use for school and teacher account- ability measures (Hershberg, 2005). VAM is currently being used in a number of states including Ohio, Pennsylvania, and Tennessee as well as in individual school districts, and is being incorporated (as “growth models”) into federal No Child Left Behind compliance strategies (U.S. Department of Education, 2005). However, because VAM measures rely on tests of student achievement, re- searchers have raised concerns about whether the nature of the construct or con- structs being measured might substantially affect the estimated effects (McCaffrey, Lockwood, Koretz, & Hamilton, 2003; Martineau, 2006; Schmidt, Houang, & McKnight, 2005). The relative weights given to each content area or skill, and the degree to which these weights are aligned with the emphases given to those topics in teachers’ instruction, are likely to affect the degree to which test scores accurately capture the effects of the instruction provided. Prior research suggests that even when a test is designed to measure a single, broad construct such as mathematics, and even when it displays empirical unidimensionality, conclusions about relationships 47
-
Upload
independent -
Category
Documents
-
view
0 -
download
0
Transcript of The Sensitivity of Value-Added Teacher Effect Estimates to Different Mathematics Achievement...

Journal of Educational MeasurementSpring 2007, Vol. 44, No. 1, pp. 47–67
The Sensitivity of Value-Added Teacher EffectEstimates to Different Mathematics
Achievement Measures
J. R. Lockwood, Daniel F. McCaffrey, Laura S. Hamilton,Brian Stecher, Vi-Nhuan Le, and Jose Felipe Martinez
The RAND Corporation
Using longitudinal data from a cohort of middle school students from a large schooldistrict, we estimate separate “value-added” teacher effects for two subscales of amathematics assessment under a variety of statistical models varying in form anddegree of control for student background characteristics. We find that the variationin estimated effects resulting from the different mathematics achievement measuresis large relative to variation resulting from choices about model specification, andthat the variation within teachers across achievement measures is larger than thevariation across teachers. These results suggest that conclusions about individualteachers’ performance based on value-added models can be sensitive to the ways inwhich student achievement is measured.
In response to the testing and accountability requirements of No Child Left Be-hind (NCLB), states and districts have been expanding their testing programs andimproving their data systems. These actions have resulted in increasing reliance onstudent test score data for educational decision making. One of the most rapidly ad-vancing uses of test score data is value-added modeling (VAM), which capitalizes onlongitudinal data on individual students to inform decisions about the effectivenessof teachers, schools, or programs. VAM is gaining favor because of the perceptionthat longitudinal modeling of student test score data has the potential to distinguishthe effects of teachers or schools from nonschooling inputs to student achievement.As such, proponents of VAM have advocated its use for school and teacher account-ability measures (Hershberg, 2005). VAM is currently being used in a number ofstates including Ohio, Pennsylvania, and Tennessee as well as in individual schooldistricts, and is being incorporated (as “growth models”) into federal No Child LeftBehind compliance strategies (U.S. Department of Education, 2005).
However, because VAM measures rely on tests of student achievement, re-searchers have raised concerns about whether the nature of the construct or con-structs being measured might substantially affect the estimated effects (McCaffrey,Lockwood, Koretz, & Hamilton, 2003; Martineau, 2006; Schmidt, Houang, &McKnight, 2005). The relative weights given to each content area or skill, and thedegree to which these weights are aligned with the emphases given to those topicsin teachers’ instruction, are likely to affect the degree to which test scores accuratelycapture the effects of the instruction provided. Prior research suggests that even whena test is designed to measure a single, broad construct such as mathematics, andeven when it displays empirical unidimensionality, conclusions about relationships
47
Lockwood et al.
between achievement and student, teacher, and school factors can be sensitive to dif-ferent ways of weighting or combining items (Hamilton, 1998; Kupermintz, Ennis,Hamilton, Talbert, & Snow, 1995). These issues become even more complex invalue-added settings with the possibility of construct weights varying over time oracross grade levels, opening the possibility for inferences about educator impacts tobe confounded by content shifts (Hamilton, McCaffrey, & Koretz, 2006; McCaffreyet al., 2003; Martineau, 2006). Examinations of test content and curriculum inmathematics have shown that these content shifts are substantial (Schmidt et al.,2005).
If VAM measures are highly sensitive to specific properties of the achievementmeasures, then educators and policy makers might conclude that VAM measures aretoo capricious to be used fairly for accountability. On the other hand, if the measuresare robust to different measures of the same broad content area, then educators andpolicy makers might be more confident in their use. Thus, the literature has advocatedempirical evaluations of VAM measures before they become formal components ofaccountability systems or are used to inform high stakes decisions about teachersor students (AERA, APA, & NCME, 1999; Braun, 2005; McCaffrey, Lockwood,Koretz, Louis, & Hamilton, 2004b). The empirical evaluations to date have consid-ered the sensitivity of VAM measures of teacher effects to the form of the statisticalmodel (Lockwood, McCaffrey, Mariano, & Setodji, forthcoming; McCaffrey, Lock-wood, Mariano, & Setodji, 2005; Rowan, Correnti, & Miller, 2002) and to whetherand how student background variables are controlled (Ballou, Sanders, & Wright,2004; McCaffrey, Lockwood, Koretz, Louis, & Hamilton, 2004a), but have not di-rectly compared VAM teacher effects obtained with different measures of the samebroad content area.
In this article, we consider the sensitivity of estimated VAM teacher measures totwo different subscales of a single mathematics achievement assessment. We con-duct the comparisons under a suite of settings obtained by varying which statisticalmodel is used to generate the measures, and whether and how student backgroundcharacteristics are controlled. This provides the threefold benefits of ensuring that thefindings are not driven by a particular choice of statistical model, adding to the litera-ture on the robustness of VAM teacher measures to these other factors, and permittinga direct comparison of the relative influences of these factors and the achievementmeasure used to generate the VAM estimates.
Data
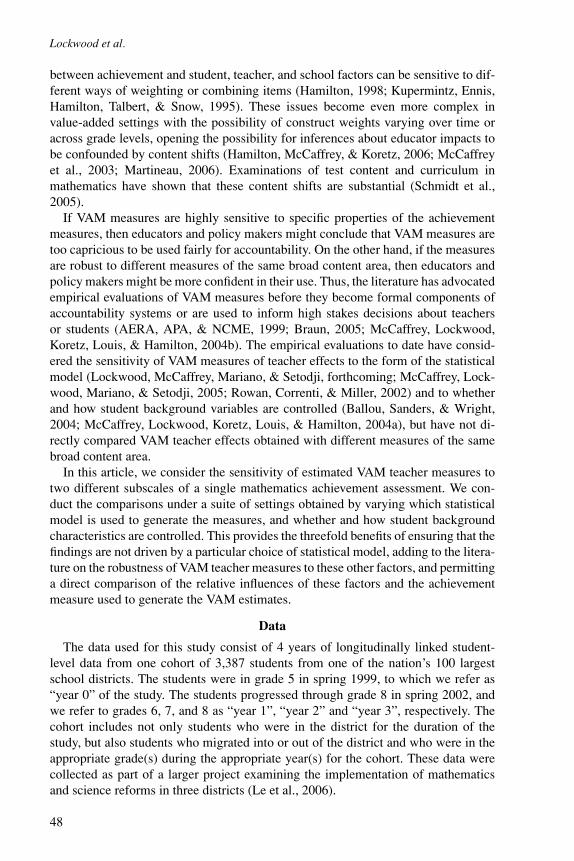
The data used for this study consist of 4 years of longitudinally linked student-level data from one cohort of 3,387 students from one of the nation’s 100 largestschool districts. The students were in grade 5 in spring 1999, to which we refer as“year 0” of the study. The students progressed through grade 8 in spring 2002, andwe refer to grades 6, 7, and 8 as “year 1”, “year 2” and “year 3”, respectively. Thecohort includes not only students who were in the district for the duration of thestudy, but also students who migrated into or out of the district and who were in theappropriate grade(s) during the appropriate year(s) for the cohort. These data werecollected as part of a larger project examining the implementation of mathematicsand science reforms in three districts (Le et al., 2006).
48

Outcome Variables
For grades 6, 7, and 8, the data contain student IRT scaled scores from the Stanford9 mathematics assessment from levels Intermediate 3, Advanced 1 and Advanced 2(Harcourt Brace Educational Measurement, 1997). In addition to the Total scaledscores, the data include scaled scores on two subscales, Problem Solving and Pro-cedures, which are the basis of our investigation of the sensitivity of VAM teachereffects. Both subscales consist entirely of multiple-choice items with 30 Proceduresitems per grade and 48, 50, and 52 Problem Solving items for grades 6, 7, and 8, re-spectively. The subscales were designed to measure different aspects of mathematicsachievement. Procedures items cover computation using symbolic notation, round-ing, computation in context and thinking skills, whereas Problem Solving covers abroad range of more complex skills and knowledge in the areas of measurement, esti-mation, problem solving strategies, number systems, patterns and functions, algebra,statistics, probability, and geometry. This subscale does not exclude calculations, butfocuses on applying computational skills to problem-solving activities. The two setsof items are administered in separately timed sections.
Across forms and grades, the internal consistency reliability (KR-20) estimatesfrom the publisher’s nationally representative norming sample are approximately .90for both subscales (ranging from .88 to .91). These values are nearly as high as theestimates for the full test of approximately .94 across forms and grades (HarcourtBrace Educational Measurement, 1997). Also, the publisher’s subscale reliabilitiesare consistent with those calculated from our item-level data, which are .93 for Prob-lem Solving in each of years 1, 2, and 3 and .90, .89, and .91 for Procedures in years1, 2, and 3, respectively.
In our data, the correlations of the Problem Solving and Procedures subscoreswithin years within students are .76, .69, and .59 for years 1, 2, and 3, respectively.These correlations are somewhat lower, particular in year 3, than the values of .78,.78, and .79 reported for grades 6, 7, and 8 in the publisher’s norming sample (Har-court Brace Educational Measurement, 1997). The lower values in our sample couldreflect the fact that the characteristics of the students in the district are markedlydifferent than the norming sample. The students in our district are predominantlynon-White, the majority participate in free and reduced-price lunch (FRL) programs,and the median Total score on the Stanford 9 mathematics assessment for the stu-dents in our sample is at about the 35th percentile of the national norming sampleacross years 1 to 3. Another possible explanation for the lower correlations maybe the behavior of the Procedures subscores; the pairwise correlations across yearswithin students are on the order of .7 for Problem Solving but only .6 for Procedures.That is, Procedures subscores are less highly correlated within student over time thanProblem Solving subscores. In addition, Procedures gain scores have about twice asmuch between-classroom variance in years 2 and 3 than the Problem Solving gainscores.
Control Variables
Our data include the following student background variables: FRL program par-ticipation, race/ethnicity (Asian, African American, Hispanic, Native American, and
49

Lockwood et al.
White), limited English proficiency status, special education status, gender, and age.Student age was used to construct an indicator of whether each student was behindhis/her cohort, proxying for retention at some earlier grade. The data also includescores from grade 5 (year 0) on the mathematics and reading portions of the state-developed test designed to measure student progress toward state standards1. Boththe student background variables and year 0 scores on the state tests are used ascontrol variables for some of the value-added models.
Teacher Links
The data set links students to their grade 6–8 mathematics teachers, the key in-formation allowing investigation of teacher-level value added measures (no teacherlinks are available in year 0). There are 58, 38, and 35 unique teacher links in grades6,7, and 8, respectively. Because teacher-student links exist only for teachers whoparticipated in the larger study of reform implementation, the data include links forabout 75% of the district’s 6th grade mathematics teachers in year 1 and all but oneor two of the district’s 7th and 8th grade mathematics teachers in years 2 and 3, re-spectively. Our analyses focus on estimated teacher effects from years 2 and 3 only(estimates for year 1 teachers are not available under all models that we consider),and because the data were insufficient for estimating two teachers’ effects with somemodels, the analyses include only the 37 year 2 and 34 year 3 teachers for whomestimates are available under all models.
Missing Data
As is typical in longitudinal data, student achievement scores were unobserved forsome students due to the exclusion of students from testing, absenteeism, and mobil-ity into and out of the district. To facilitate the comparison of teacher measures madewith the two alternative mathematics subtest scores, we constrained students to haveeither both the Problem Solving and Procedures subscores, or neither score, observedin each year. For students who had only one of the subscores reported in a given year(approximately 10% of students per year), we set that score to missing, making thestudent missing both subscores for that year. The result is that the longitudinal patternof observed and missing scores for the Problem Solving and Procedures measures isidentical for all students, ensuring that observed differences in teacher effects acrossachievement measures cannot be driven by a different sample of available studentscores. The first row of Table 1 provides the tabulation of observation patterns afterapplying this procedure for the scores in years 1, 2, and 3 for the 3,387 students. The532 students with no observed scores in any year, predominantly transient studentswho were in the district for only 1 year of the study, were eliminated from all anal-yses. This leaves a total of 2,855 students, most (nearly 71%) of whom do not havecomplete testing data.
About 27% of these 2,855 students were missing test scores from year 0; thisgroup comprises primarily students who entered the district in year 1 of the studyor later. Plausible values for these test scores were imputed using a multistage mul-tiple imputation procedure supporting the broader study for which these data werecollected (Le et al., 2006). The results reported here are based on one realization of
50
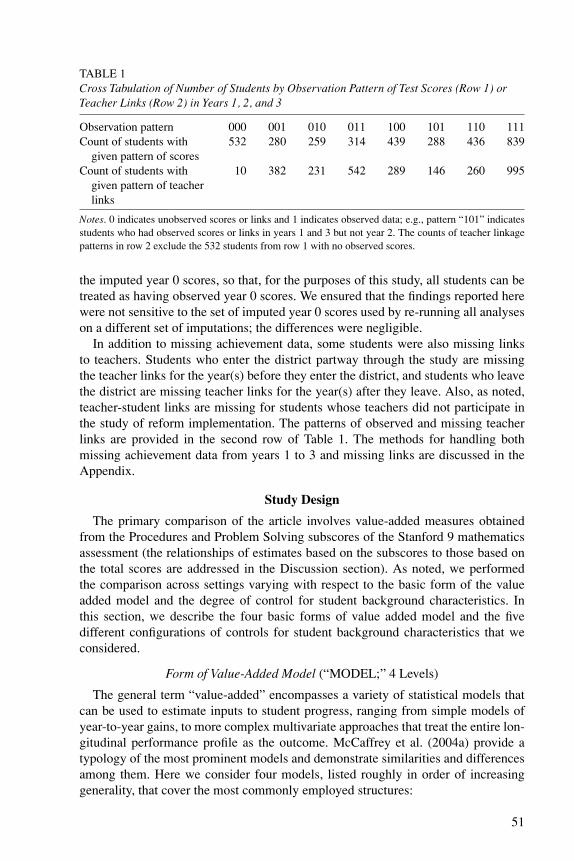
TABLE 1Cross Tabulation of Number of Students by Observation Pattern of Test Scores (Row 1) orTeacher Links (Row 2) in Years 1, 2, and 3
Observation pattern 000 001 010 011 100 101 110 111Count of students with
given pattern of scores532 280 259 314 439 288 436 839
Count of students withgiven pattern of teacherlinks
10 382 231 542 289 146 260 995
Notes. 0 indicates unobserved scores or links and 1 indicates observed data; e.g., pattern “101” indicatesstudents who had observed scores or links in years 1 and 3 but not year 2. The counts of teacher linkagepatterns in row 2 exclude the 532 students from row 1 with no observed scores.
the imputed year 0 scores, so that, for the purposes of this study, all students can betreated as having observed year 0 scores. We ensured that the findings reported herewere not sensitive to the set of imputed year 0 scores used by re-running all analyseson a different set of imputations; the differences were negligible.
In addition to missing achievement data, some students were also missing linksto teachers. Students who enter the district partway through the study are missingthe teacher links for the year(s) before they enter the district, and students who leavethe district are missing teacher links for the year(s) after they leave. Also, as noted,teacher-student links are missing for students whose teachers did not participate inthe study of reform implementation. The patterns of observed and missing teacherlinks are provided in the second row of Table 1. The methods for handling bothmissing achievement data from years 1 to 3 and missing links are discussed in theAppendix.
Study Design
The primary comparison of the article involves value-added measures obtainedfrom the Procedures and Problem Solving subscores of the Stanford 9 mathematicsassessment (the relationships of estimates based on the subscores to those based onthe total scores are addressed in the Discussion section). As noted, we performedthe comparison across settings varying with respect to the basic form of the valueadded model and the degree of control for student background characteristics. Inthis section, we describe the four basic forms of value added model and the fivedifferent configurations of controls for student background characteristics that weconsidered.
Form of Value-Added Model (“MODEL;” 4 Levels)
The general term “value-added” encompasses a variety of statistical models thatcan be used to estimate inputs to student progress, ranging from simple models ofyear-to-year gains, to more complex multivariate approaches that treat the entire lon-gitudinal performance profile as the outcome. McCaffrey et al. (2004a) provide atypology of the most prominent models and demonstrate similarities and differencesamong them. Here we consider four models, listed roughly in order of increasinggenerality, that cover the most commonly employed structures:
51

Lockwood et al.
• Gain score model. It considers achievement measures from two adjacent years(e.g., 6th and 7th grade or 7th and 8th grade), and uses as the outcome the gainin achievement from one year to the next.
• Covariate adjustment model. It also considers two adjacent years, but regressesthe achievement measure from the second year on that from the first.
• Complete persistence model. It is a fully multivariate model specifying the3-year trajectory of achievement measures as a function of current and pastteacher effects, and assumes that past teacher effects persist undiminished intofuture years.
• Variable persistence model. It is equivalent to the complete persistence exceptthat the data are used to inform the degree of persistence of past teacher effectsinto future years.
Controls for Student Background Variables (“CONTROLS;” 5 Levels)
The goal of VAM is to distinguish educational inputs from nonschooling inputsto student achievement. However, there is considerable debate about whether or notstatistical modeling with test score data alone is sufficient to achieve this goal, orwhether models that explicitly account for student background variables are requiredto remove the effects of nonschooling inputs from estimated teacher effects. In ap-plications, models have ranged from those with no controls for student backgroundvariables (Sanders, Saxton, & Horn, 1997) to models that include extensive controlsfor such variables (Webster & Mendro, 1997). In this study we consider five differentconfigurations of controls:
• None. It includes no controls for student background variables.• Demographics. It includes all individual-level demographic information (e.g.,
FRL participation, race/ethnicity, etc. listed previously).• Scores. It includes individual-level year 0 test scores.• Both. It includes both individual-level demographics and year 0 test scores.• Aggregates. It includes three teacher-level aggregates of student characteristics
(percentage of students participating in the FRL program, the total percent-age of African-American and Hispanic students, and the average year 0 mathscore).
The consideration of the aggregate variables addresses a specific concern about theimpact of contextual factors on estimated teacher effects (Ballou et al., 2004; Bal-lou, 2005; McCaffrey et al., 2004a). Additional details on the model and covariatespecifications are provided in the Appendix.
For each of the 20 cells defined by the full crossing of these two factors (MODELand CONTROLS), each teacher receives one estimated VAM measure based on theProcedures achievement outcomes and one based on the Problem Solving achieve-ment outcomes, for a total of 40 estimated effects per teacher. Because the gain scoreand covariate adjustment models provide estimated teacher effects for only year 2and year 3 teachers, we consider the estimated effects for only these teachers in ourcomparisons.
A final clarification is that the student records available for the gain score and co-variate adjustment models are a subset of those available for the multivariate models
52

Sensitivity of Value-Added Estimates
because the former require observed scores in adjacent pairs of years and observedteacher links in the second year of each pair, while the latter can handle arbitrarypatterns of observed and missing scores as well as missing teacher links. All 2,855students with at least one observed score were used for the multivariate models, while1,155 and 1,104 students were used for the gain score and covariate adjustment mod-els for years 2 and 3, respectively. We examined the results using only the subset ofstudents who had scores available in all 3 years and teacher links available in years2 and 3, which ensures that all models use precisely the same students. The findingsfrom this restricted analysis were nearly identical to those presented here.
Results
Consistent with the descriptive information provided in the Data section, the dataprovide evidence of score variation at the teacher level, and this share of the vari-ance varies notably across the two outcomes. For the Problem Solving scores, theestimated teacher value-added variance components (see the Appendix) account forabout 5% of the total year 2 variance and about 7% of the total year 3 variance, aver-aging across all levels of MODEL and CONTROLS. The analogous percentages forthe Procedures scores are 13% for year 2 and 27% for year 3, indicating that Proce-dures scores exhibit stronger variation among teachers than do the Problem Solvingscores. These values for the teacher’s share of the total variance in scores are consis-tent with, and for the Procedures scores go somewhat beyond, those reported in othersettings (McCaffrey et al., 2004a; Nye, Konstantopoulos, & Hedges, 2004; Rowanet al., 2002).
In addition to having different variation, the teacher effects from the two out-comes are only weakly correlated. Table 2 presents the correlations between theestimates from the two different outcomes, holding the levels of MODEL andCONTROLS constant. The rows indicate the model and the columns indicate the
TABLE 2Correlations of Estimated Teacher Effects Across Procedures and Problem Solving OutcomesConditional on Year, MODEL and CONTROLS
CONTROLS
MODEL None Demographics Scores Both Aggregates
Year 2Gain score .24 .30 .29 .32 .29Covariate adjustment .43 .39 .37 .38 .26Complete persistence .38 .35 .30 .30 .28Variable persistence .46 .43 .40 .40 .29
Year 3Gain score .24 .24 .23 .24 .11Covariate adjustment .25 .27 .16 .21 .09Complete persistence .20 .20 .13 .14 .06Variable persistence .21 .19 .06 .09 .01
Notes. Each cell contains the correlation between teacher effects estimated from Procedures and ProblemSolving outcomes for the given combination of MODEL (rows) and CONTROLS (columns).
53

Lockwood et al.
covariate configuration used with both outcomes to estimate the effects. For example,in the rows labeled “Gain Score,” the column labeled “None” contains the correla-tion between estimated teacher effects based on the Problem Solving score from thegain score model without controls and the estimated effects based on the Proceduresscore under the same conditions. These correlations are uniformly low, with a max-imum value of .46 in year 2 and .27 in year 3. The correlations are particularly lowwhen the models include aggregate covariates. In year 3, the estimates from thesemodels fit to the two outcomes are essentially uncorrelated ranging from .01 to .11depending on the model. The Spearman rank correlations (not shown) are also low,averaging only about .06 larger than the Pearson correlations in the table. Thus thetwo achievement outcomes lead to distinctly different estimates of teacher effects.
However, the story is quite different when we compare the value-added estimatesfor the same achievement outcome, but based on different models or degrees of con-trol for student covariates. In these cases correlations of the teacher effects are gener-ally high. For each year and outcome we calculated the (20 × 20) correlation matrixof the estimated teacher effects across the levels of MODEL and CONTROLS, con-taining 190 unique pairwise correlations for each year and outcome. These 190 corre-lations can be broken into three categories: 40 are for a given MODEL with differentlevels of CONTROLS, 30 are for different MODELs with a given level of CON-TROLS, and the remaining 120 are from design points varying on both MODELand CONTROLS. For each year and outcome, Table 3 summarizes these correla-tions by category. The full correlation matrices are available from the authors uponrequest.
As indicated by the final column of Table 3, the average correlation when MODELis held fixed and the level of CONTROLS is varied ranges from .92 to .98 acrossyears and outcomes. Based on the full suite of correlations (not shown), the corre-lations were generally highest among the levels of CONTROLS that include only
TABLE 3Summaries of Correlations of Teacher Effects Obtained from Conditions Varying on EitherCONTROLS, MODEL, or Both, Conditional on Year and Outcome
Min Q1 Q2 Q3 Max Mean
Year 2, Procedures Varying CONTROLS .92 .96 .98 1.00 1.00 .98Varying MODEL .81 .88 .93 .95 .98 .91Varying Both .79 .87 .91 .94 .98 .90
Year 2, Problem Solving Varying CONTROLS .72 .89 .94 .97 .99 .92Varying MODEL .60 .82 .88 .94 .98 .87Varying Both .49 .76 .84 .90 .96 .82
Year 3, Procedures Varying CONTROLS .78 .90 .99 1.00 1.00 .94Varying MODEL .73 .88 .92 .96 .98 .91Varying Both .57 .81 .89 .94 .98 .86
Year 3, Problem Solving Varying CONTROLS .92 .95 .98 .99 1.00 .97Varying MODEL .76 .91 .94 .95 .98 .92Varying Both .79 .89 .92 .94 .96 .91
Notes. For each year and outcome, the three rows provide summaries of the 190 unique correlationsobtained by varying MODEL and CONTROLS, partitioned as described in the text.
54

Sensitivity of Value-Added Estimates
student-level variables. Each of the minimum correlations in Table 3 (first column)when CONTROLS are varied is obtained for a model with controls for teacher-levelaggregates compared to the same model with one of the student-level control settings.This indicates a greater sensitivity of the estimates to the inclusion of aggregate-levelcovariates compared to individual-level covariates, but the high average correlationsindicate a general robustness to both types of controls.
The estimates are slightly more sensitive to different levels of MODEL than todifferent levels of CONTROLS, but are still quite robust. The average correlationwhen MODEL is varied and the level of CONTROLS is held fixed ranges from .87 to.92 across years and outcomes. Certain pairs of models tend to show more consistentdifferences; for example, each of the minimum correlations in Table 3 when MODELis varied for fixed CONTROLS occurs for the variable persistence model comparedto the gain score model. As is to be expected, the correlations when both MODELand CONTROLS differ are generally lower than those obtained when one factor isheld constant, but even then the average correlations substantially exceed .8.
Overall, the sensitivity of the estimates to MODEL and CONTROLS is only slightcompared to their sensitivity to the achievement outcome. The smallest of any of the760 (=190 × 2 outcomes × 2 years) correlations related to changing MODEL orCONTROLS is .49 (first column of Table 3), which is larger than the largest correla-tion between teacher effects from the Procedures and Problem Solving outcomes (.46from Table 2) under any of the combinations of MODEL and CONTROLS.
Table 4 further quantifies the strong influence of the achievement outcome on es-timated teacher effects relative to MODEL and CONTROLS. The table providesanalysis of variance (ANOVA) decompositions of the variability of the 1,480 teachereffect estimates from year 2 (37 teachers times 40 estimated effects per teacher), and
TABLE 4Variance Decomposition for Estimated Teacher Effects by Year
Sums of Mean Estimated VarianceTerm Squares Squares Component
Year 2Teacher 63 1.8 .02Teacher ∗ OUTCOME 37 1.0 .05Teacher ∗ MODEL 6 .1 .01Teacher ∗ CONTROLS 2 .0 .00Residual 3 .0 .00
Year 3Teacher 100 3.0 .01Teacher ∗ OUTCOME 81 2.4 .12Teacher ∗ MODEL 7 .1 .01Teacher ∗ CONTROLS 6 .0 .00Residual 8 .0 .01
Notes. Rows correspond to model terms of teacher main effect and interactions of teachers with eachfactor. Main effects for factors are zero due to centering of estimated effects in each design cell. Columnsare sums of squares and mean squares from fixed effects regression model, and the estimated variancecomponents from a random effects model.
55

Lockwood et al.
for the 1,360 teacher effect estimates from year 3 (34 teachers times 40 estimatedeffects per teacher). Terms included in the decomposition are variability due to teach-ers and to the interactions between teachers and each of the factors. There are no maineffects for the factors because estimated effects were pre-centered to have mean zeroby design cell.2
As shown in the table, including teachers and the interaction of teachers with eachof the factors in the design accounts for most of the observed variance in the esti-mated teacher effects (R2 = .97 for year 2 and .96 for year 3). However, teachers andtheir interaction with outcome account for the majority of this explained variability(R2 = .89 for year 2 and .89 for year 3), corroborating the correlation findings thatMODEL and CONTROLS have relatively little impact on estimated teacher effects.While teachers have the highest mean square for both years, part of this observedvariation among teacher means is due to the contributions of the other factors. Thevariance component estimates (final column of Table 4) separate these alternativesources of variance. For both years, and particularly for year 3, the largest variancecomponent is for the teacher by outcome interaction, which is substantially largerthan even the main effect for teachers. This indicates that in these data, the varia-tion across achievement outcomes within teachers is larger than the overall variationamong teachers.
Discussion
In response to the pressing need to empirically study the validity of VAM mea-sures of teacher effects for educational decision making and accountability, this studyexamined the sensitivity of estimated teacher effects to different subscales of a math-ematics assessment. Across a range of model specifications, estimated VAM teachereffects were extremely sensitive to the achievement outcome used to create them.The variation resulting from the achievement outcome was substantially larger thanthat due to either model form or degree of control for student covariates, factors thathave been raised in the literature as potentially influential. And the variation withinteachers across outcomes was substantially larger than the variation among teachers.
Our results provide a clear example that caution is needed when interpreting esti-mated teacher effects because there is the potential for teacher performance to dependon the skills that are measured by the achievement tests. Although our findings areconsistent with the warnings about the potential sensitivity of value-added estimatesto properties of the achievement measures (Martineau, 2006; Schmidt et al., 2005),we must be careful not to overinterpret results from a single data set examining about70 teachers on a single set of tests. The subscales behave somewhat differently in ourdata than in the national norming sample, and the lower student-level correlationsbetween the subscale scores, particularly at grade 8, could be strongly related to ourfindings about the sensitivity of estimated teacher effects. The low student-level cor-relations and the lack of correspondence of the teacher effects from the subscoresboth could result from two distinctly different scenarios: (1) one or both of the sub-scales is behaving poorly in our data, so that subscores at any level of aggregationshow low correlation; or (2) real phenomena at the classroom level are differentiallyaffecting the two subscales. While we cannot definitively establish which scenario
56

Sensitivity of Value-Added Estimates
is closer to the truth, the fact that our estimated subscale reliabilities are consistentwith the reasonably high values reported by the publisher suggests that differentialclassroom or teacher effects on the subscales in our data set are more likely to be asource of the low marginal correlations rather than a symptom. However, regardlessof the true nature of the relationship, the differences we find in our sample relativeto the norming sample could indicate that our results might not generalize to othercontexts.
On the other hand, our district is similar to many large urban districts seeking in-novative ways to improve student outcomes. It seems plausible that local conditions(in terms of student populations, curriculum characteristics, instructional practices,assessment properties, or other policies), like those that may have led to the low cor-relation between subscales and the resulting teacher effects in this district, could existin any given district. If this school district were to use Procedures scores to evalu-ate its middle school mathematics teachers, it would come to conclusions that weresubstantially different than evaluations based on Problem Solving scores. Althoughthese two outcomes are intended to measure different constructs within the broaderdomain of mathematics, they are from the same testing program and use the samemultiple-choice format. The use of other measures of middle school mathematicsachievement might reveal an even greater sensitivity of teacher effects to choice ofoutcome, particularly if the format is varied to include open-ended measures.
In practice, it is unlikely that separate teacher effects would be estimated fromthe Procedures and Problem Solving outcomes, or more generally from subscoresintended to capture performance on different constructs. This would require groupsof items forming subscales to be explicitly identified each year, subscale scores tobe computed and reported, and separate value-added measures to be computed andreported for the subscales. While such detailed information could be a valuable partof growing efforts to use student test score data to improve educational decisionmaking, it is more plausible (and more consistent with existing practice such asthe Tennessee Value Added Assessment System (Sanders et al., 1997) and Florida’sE-Comp bonus plan (http://www.floridaecomp.com) that value-added measures fora particular subject would be based on a single assessment that measures a numberof constructs within the relevant domain. For example, the Stanford 9 Total mathe-matics score is based on a combination of the performance on the Procedures andProblem Solving subscales, and most mathematics achievement tests that would beused in a value-added context address both procedures and problem solving evenif groups of items forming the subscales are not explicitly identified and separatelyscored.
The results of this study indicate that value-added teacher effect estimates calcu-lated from total scores may be sensitive to the relative contributions of each constructto the total scores. To explore this issue further, we used the Procedures and ProblemSolving scores to estimate teacher effects based on hypothetical aggregate outcomesthat weight the two subscales differently. In particular, we used the Procedures andProblem Solving score data to create aggregate outcomes of the form λ Procedures +(1 − λ) Problem Solving for values of λ ranging from 0 to 1 in increments of .2. λ =0 corresponds to the Problem Solving outcome and λ = 1 to the Procedures out-come, while intermediate values correspond to unequally weighted combinations of
57

Lockwood et al.
the two subscales. We then estimated teacher effects using each of the resulting sixhypothetical outcomes, using the complete persistence model and including controlsfor student demographics and year 0 scores.
The analysis shows that inferences about teacher effects can be sensitive to thecontent mix of the test. Figure 1 plots the VAM measures estimated for the six hypo-thetical outcomes for each teacher connected by a light gray line, with year 2 teachersin the top frame and year 3 teachers in the bottom frame. Black dots indicate effectsthat are detectably different from the average effect and gray dots indicate effects
-0.4
0.0
0.2
0.4
0.6
0.8
Teac
her
Effe
ct S
cale
-0.5
0.0
0.5
1.0
Teac
her
Effe
ct S
cale
Note. Gray lines connect estimated effects for the same teacher. Black dotsindicate effects that are detectably different from average, and gray dotsindicate effects not detectably different from average. All estimates arebased on the complete persistence model including controls for bothstudent-level demographic variables and year 0 scores. For year 2, thecorrelations between the estimates based on the Procedures scores andthose based on the composite scores as lambda goes from zero to 1 are (.30,.60, .83, .95, .99, 1.00) and the corresponding correlations for the ProblemSolving scores are (1.00, .94, .77, .57, .42, .30). The analogous values foryear 3 are (.14, .59, .86, .96, .99, 1.00) and (1.00, .88, .62, .39, .24, .14).FIGURE 1. Year 2 (top frame) and year 3 (bottom frame) teachereffects calculated from composite scores as described in text.
58

Sensitivity of Value-Added Estimates
that are not. There is a large amount of crossing of the lines for teachers, indicat-ing that differentially weighting the subscales changes the ordering of the teachereffects and their statistical significance. The spread widens as λ approaches 1, re-flecting the larger variation in teacher effects for Procedures subscores. Importantly,the composite scores with λ = .4 correlate greater than .99 with the Stanford 9 Totalscaled scores each year, so that this analysis effectively includes a comparison of thesubscale-specific estimates to those based on the Total score as a special case. Asshown in Table 5, inferences remain constant for about 62% of year 2 teachers and38% of year 3 teachers; for the remaining teachers the classification of the teachereffect is sensitive to the weighting of the subscores. Moreover, the substantial ma-jority of the consistent effects are those that are not detectably different from zero.Restricting attention to only those effects that are ever classified as detectably differ-ent, only 26% for year 2 and 16% for year 3 have classifications insensitive to theweighting.
Interpreting the differences arising from the alternative subscores is difficult. Itcould mean that teachers are differentially effective at helping students develop skillsand knowledge across the two subdomains. If so, valid use of information from VAMsystems might require the estimation of multiple teacher effects rather than a sin-gle summative measure. Teacher effect estimates broken down by subdomain wouldprovide the additional benefit of more fine-grained diagnostic feedback that couldbe used for targeted professional development or instructional interventions. Thedifferences across subscores might also indicate the impacts of other factors at theclassroom level that are not accounted for in the models. For example, if studentsare taking different courses and the curriculum varies across courses this could re-sult in students with different levels of achievement growth on the two subscales.Whether this difference is truly a curriculum difference or teacher by curriculum dif-ference would be hard to determine and it would make the interpretation of effectschallenging.
Although this study did not examine subjects other than mathematics, prior re-search has shown that inferences about factors that affect achievement in both mathand science are dependent on features of the outcome measure (Hamilton, 2004), andthere is no reason to believe that other subjects would be immune to this problem.The findings of this study are particularly important given the high-stakes nature of
TABLE 5Cross-Tabulation of Teacher Effects by Year According to Sensitivity of the Estimated Effectsto the Composite Outcome Described in the Text
− 0 + − 0 0 + − 0 +Year 2 (n = 37) 3 (8%) 18 (49%) 2 (5%) 6 (16%) 7 (19%) 1 (3%)Year 3 (n = 34) 2 (6%) 9 (26%) 2 (6%) 11 (32%) 9 (26%) 1 (3%)
Notes. Columns 1, 2, and 3 are teacher effects that were negative, not detectably different, or positive,respectively, across all composite outcomes. Column 4 represents teacher effects that were negative forsome composite outcomes and not detectably different for others. Column 5 is analogous but for teachereffects that were positive in some cases. Finally, Column 6 represents teacher effects that were estimatedto be either negative, not detectably different, or positive depending on which composite outcome wasconsidered.
59

Lockwood et al.
many state and district testing systems and the likelihood that value-added methodswill be incorporated into those systems in the future. To the extent that these findingsare indicative of what might occur in other settings, they raise concerns about thegeneralizability of inferences drawn from estimated teacher effects.
In contrast to the sensitivity of estimated teacher effects to the mathematics sub-scores, the relative insensitivity to model form and degree of control for studentcovariates is encouraging. The finding of robustness to differing controls for student-level covariates corroborates the findings of Ballou et al. (2004) and McCaffrey et al.(2004a), and is particularly encouraging because in our data there is substantial varia-tion across teachers in the characteristics of the students that they teach. For example,in each of years 1 to 3, the percentage of African-American students linked to eachteacher ranges from less than 10% to more than 80%, and the percentage of studentsparticipating in free lunch programs covers nearly the full range from 0% to 100%.Thus, the robustness found here suggests that value-added methods are living up totheir promise of removing the effects of student background variables that are be-yond the control of the teachers whose effects we are interested in estimating. On theother hand, while the covariates are notably related to levels of student achievement,they explain only a tiny fraction of the variation of year-to-year gain scores (R2 onthe order of .05). It is thus not entirely surprising that these covariates do not stronglyinfluence the value-added estimates in this study, and this robustness may not nec-essarily hold in other contexts or with other less coarse student-level information.On balance, however, this study adds to a growing body of empirical evidence thatsuggests that value-added methods are robust to omitted student variables in somecontexts.
The situation with the aggregate student variables, as well as model form, requiressomewhat more cautious optimism. Generally, estimates are highly correlated acrossmodel forms, which cover a representative set of model specifications, and acrossmodels with and without aggregate student variables. But the correlations are notuniformly high (recall that the minimum correlation from Table 3 is .49). There areparticular combinations of model forms, most notably the gain score model versusthe variable persistence model, in which real differences are evident. This is similarto the findings of Lockwood et al. (forthcoming), who report that in an empiricalstudy using elementary school data, the complete persistence model and the variablepersistence model agreed on whether or not teacher effects were above, below, ornot detectably different from the average for only about two-thirds of the teachers.Thus, although the influences of model form and the inclusion of aggregate variablesare small in this study, issues surrounding model specification still require carefulconsideration.
A number of unanswered questions remain, and this analysis suggests several stepsthat should be taken in future investigations of the effects of student achievementmeasure on value-added estimates. First, as noted this study was limited to a singletest, a single subject, and a limited grade span, and used only multiple-choice items.The effects of varying the outcome measure in other contexts (e.g., elementary read-ing), and of expanding the range of measures to include additional test publishersor a broader range of item formats, should be explored. Second, this study relies onpredefined subscales, but other research shows that subscales based on test specifi-
60

Sensitivity of Value-Added Estimates
cations might not capture all of the important distinctions among items within tests.For example, one important factor appears to be the extent to which the test contentwas included in school curricula: a science subscale created from items closely re-sembling problems presented in textbooks showed greater sensitivity to school andclassroom factors than a subscale that emphasized material that was less well-alignedwith school curricula (Hamilton, 1998). The use of existing test specifications on thetest used in this study would not have revealed this difference. Although this find-ing is unsurprising, it has important implications for high-stakes uses of informationfrom tests. Given our finding of sensitivity of value-added estimates to the subscales,empirical analysis to examine alternative ways of creating subscales could be espe-cially informative in the context of value-added modeling of teacher effects.
In short, the results of this study suggest that conclusions about whether a teacherhas improved student achievement in mathematics can be relatively insensitive toassumptions about model form or the inclusion of student controls, compared to dif-ferences in how mathematics achievement is measured. This study shows that evensubscales of the same test, by the same test developer, can yield different results, ascan different weighting among subscales in a composite score. Although the specificfindings from this district might not be replicated in other contexts, they provide ev-idence that inferences based on VAM can, at least in some cases, be affected by thecharacteristics of the outcome measure. Additional research is needed to understandhow our findings would be affected by changes in the student or teacher population orin the outcome measure used, but these findings do suggest reason for caution. Usersof VAM must resist the temptation to interpret estimates as pure, stable measuresof teacher effectiveness. Application of VAM, particularly for high-stakes purposes,should be accompanied by an examination of both the test and its alignment withthe desired curriculum and instructional approach. And to the extent possible, anal-yses should explore the sensitivity of the estimates to different ways of combininginformation from test items.
Appendix: Model Specification and Estimation
In this appendix, we describe the statistical models we used to create VAM teachermeasures. As described in the text, we considered four different models: two thatexamine gains across adjacent pairs of years (gain score model and covariate ad-justment model) and two multivariate models for the 3-year trajectories of scores(complete persistence model and variable persistence model). We keep the descrip-tions of the models brief because all of the models we consider have been discussedin detail elsewhere in the literature (see, e.g., McCaffrey et al., 2003, 2004a). Weprovide more specific references where appropriate.
We use the following notation in describing the models. We let Yit be an achieve-ment score for student i in year t; this is used generally to refer to either the ProblemSolving or Procedures score depending on which achievement measure is being mod-eled. We let DEMOi denote the vector of student-level demographic variables forstudent i, which as noted in the text include free or reduced priced lunch programparticipation, race/ethnicity, limited English proficiency status, special educationstatus, gender, and an indicator of being behind cohort. We let SCORE0i denotea vector consisting of the mathematics and reading test scores from year 0 for stu-
61

Lockwood et al.
dent i, as well as the squares of those scores, to account for a slightly nonlinearrelationship between their scales and those of the Stanford 9. Teachers are indexedby j ranging from 1 to the total number of teachers in all years. We let TAGGj denotethe vector of aggregates of some of the student-level variables for the students linkedto teacher j. The aggregates include the percentage of students participating in theFRL program, the total percentage of African-American and Hispanic students, andthe average year 0 math score. In order to accommodate student-teacher linkages inboth the year-to-year models and the more complex multivariate models with consis-tent notation, the subscript j(i,t) is used to denote the index j of the teacher to whomstudent i is linked in year t.
Year-to-Year Modeling of Gains
This approach involves fitting one model to estimate teacher effects in year 2 usingthe gains students make in seventh grade, and then fitting a separate model to estimateteacher effects in year 3 using the gains students make in eighth grade. For each yeart = 2, 3 and for each of the Procedures and Problem Solving achievement measures,we fit the following hierarchical linear model:
Yit = µt + λt Yit−1 + β ′t DEMOi + γ ′
t SCORE0i + δ′t TAGG j(i,t)
+ θ j(i,t) + εi t .(A1)
The coefficients of all predictor variables are subscripted with t to make explicitthe fact the coefficients are estimated separately for each successive pair of annualscores. The teacher effects θ j are modeled as independent, mean zero normal randomvariables with a common variance estimated from the data.
We consider two variants of this model. The first forces λt = 1. For this variantsimple algebra shows that Equation (A1) can be rewritten as:
(Yit − Yit−1) = µt + β ′t DEMOi + γ ′
t SCORE0i + δ′t TAGGj(i,t)
+ θj(i,t) + εit.(A2)
This variant of the model is a hierarchical linear model for gain scores (Yit − Yit−1)and we thus refer to it as the gain score model. The second variant estimates λt alongwith all the other model parameters. Because this model treats the prior year score asa covariate we call this the covariate adjustment model. Both models are discussedin detail in McCaffrey et al. (2004a).
As discussed in the text, we replicated fitting the models in Equations (A1) and(A2) with subsets of (β t, γ t, δ t) set to zero corresponding to the different levels ofCONTROLS. Separate estimates were made for both the Procedures and ProblemSolving scores and for years 2 and 3, using only the students who had scores inboth the current year and prior year and who had an observed link to a teacher inthe current year. In all cases model parameters and teacher effects were estimatedusing the hierarchical linear model routines available in the nlme package (Pinheiro& Bates, 2000) for the R Statistics Environment (R Development Core Team, 2005).As is standard for hierarchical linear models, teacher effects were estimated usingthe Best Linear Unbiased Predictor (BLUP) of the random effects θ j (Robinson,
62

Sensitivity of Value-Added Estimates
1991).
Multivariate Modeling
The second approach to modeling teacher effects simultaneously considers theyear 1, 2, and 3 scores for a given achievement measure using a multivariate modelthat includes terms for the correlations over time among scores for the same student.Because students switch classes each year, the simple nesting structure of the tra-ditional hierarchical models does not hold. Rather the data are cross-classified withmultimembership as students are crossed with multiple teachers (Goldstein, 2003;Raudenbush & Bryk, 2002).
To accommodate this complex data structure we adopt the general multivariatevalue-added model of McCaffrey et al. (2004a). The model begins by writing Yit =Uit + Zit where Uit does not depend on the student’s teachers whereas Zit dependson the student’s current teacher and possibly also former teachers. As with the year-to-year models (Equations (A1) and (A2)), the student component Uit depends ona grand mean, the student’s background variables and year 0 scores, the classroomaggregates of the student variables, and residual errors:
Uit = µt + β ′t DEMOi + γ ′
t SCORE0i + δ′t TAGGj(i,t) + εit. (A3)
The model assumes that ε i 1, ε i 2, and ε i 3 are multivariate normal variables with meanzero and an unstructured covariance (i.e., variance parameters vary by year and cor-relations are unconstrained).
The model for teacher effects assumes that teachers impact their students’ scoresboth when they have them in class and in subsequent years although at a possiblydiminished level, specified as:
Zi1 = θ j(i,1)
Zi2 = α21θ j(i,1) + θ j(i,2)
Zi3 = α31θ j(i,1) + α32θ j(i,2) + θ j(i,3).
(A4)
The contribution in year 1 includes only student i’s year 1 teacher effect, θ j ( i,1 ).Later years contain teacher effect contributions from not only the current year, butalso prior years. The strengths of the contributions of prior teacher effects to cur-rent scores are controlled by the persistence parameters (α21, α31, and α32). If thepersistence parameters are less than 1, then the effects of prior teachers on currentoutcomes are diminished relative to the teachers’ initial contributions. Alternatively,if the persistence parameters equal 1, then past teacher effects persist and accumulatewith undiminished strength.
As with the year-to-year models, we employed two variants of the multivariatemodeling approach. In the first variant the persistence parameters (α21, α31, and α32)are treated as unknown and are estimated from the data. We call this the variablepersistence model to signify that the persistence parameters are estimated. The sec-ond variant of the multivariate modeling approach forces all the persistence param-eters to be equal to 1. We refer to this model as the complete persistence model.As shown by McCaffrey et al. (2004a), when all the components of (β t, γ t, δ t) in
63

Lockwood et al.
Equation (A3) are equal to zero, the complete persistence model is equivalent to thelayered model of the Tennessee Value Added Assessment System (Sanders et al.,1997).
Model parameters (including the regression coefficients, the persistence param-eters, the teacher effect variance components, and the variance-covariance matrixof the residual error terms) and teacher effects were estimated using the Bayesianapproach of Lockwood et al. (forthcoming).3 Separate models were fit for the Pro-cedures and Problem Solving scores. Teacher effects were estimated by their pos-terior means, which are the analogs to the BLUPS used in the year-to-year gainsanalyses.
An advantage of the multivariate approach is that data from all students, eventhose missing some test scores, contribute to the estimation of model parameters andteacher effects. The missing data are effectively imputed as part of the computationalalgorithm under the assumption that the test scores are missing at random (Little& Rubin, 2002); that is, missing scores for each year do not differ systematicallyfrom the observed scores conditional on the students’ observed scores from otheryears. Inclusion of students with incomplete data does, however, require specializedmethods for handling missing student-teacher links. We used the “pseudo-teacher”approach of Lockwood et al. (forthcoming) where each missing link is assigned toits own teacher to serve as a placeholder in the layering of the effects in Equation(A4). The pseudo-teacher effects are estimated with the real teacher effects but arelater discarded. The study by Lockwood et al. (forthcoming) indicates that estimatedeffects for actual teachers were essentially invariant to diverse methods for handlingmissing teacher links, including the pseudo-teacher method used here.
Notes
This article is based on work supported by the National Science Foundation under Grant No.ESI-9986612 and the Department of Education Institute of Education Sciences under GrantNo. R305U040005. Any opinions, findings, conclusions, or recommendations expressed inthis article are those of the author(s) and do not necessarily reflect the views of these orga-nizations. We thank the Editor and three reviewers for feedback that greatly improved thearticle.
1To maintain anonymity of the school district, we have withheld the identification of thestate.
2For the gain score and covariate adjustment models, the estimated effects for a given yearhave mean zero. For the multivariate models, the estimated teacher effects for the teachershave nonzero means that depend on design cell. This results from a complex interplay of themethods used to deal with missing teacher links and the fact that students missing teacherlinks are generally lower scoring. This variation in mean effect across cells is nuisance for thedesired comparisons of this study, and thus for each design cell using the multivariate model,the teacher effects were centered to have mean zero.
3We used standard noninformative prior distributions in the current study, allowing the esti-mated teacher effects to be driven by the data. Markov Chain Monte Carlo methods are used tosample the posterior distribution of all parameters (Gelman, Carlin, Stern, & Rubin, 1995). Foreach teacher effect for each instance of the multivariate model, the posterior means and stan-dard deviations were estimated from 5,000 Markov Chain Monte Carlo samples after 1,000burn-in iterations. This sample size was sufficient to make Monte Carlo error in the estimates
64

Sensitivity of Value-Added Estimates
negligible.
References
American Educational Research Association (AERA), American Psychological Association(APA), National Council on Measurement in Education (NCME) (1999). Standards foreducational and psychological testing. Washington, DC: APA.
Ballou, D., Sanders, W., & Wright, P. (2004). Controlling for student background in value-added assessment of teachers. Journal of Educational and Behavioral Statistics, 21, 37–66.
Ballou, D. (2005, April). Distinguishing teachers from classroom context. Paper presented atthe annual conference of the American Education Research Association, Montreal, Canada.
Braun, H. (2005). Value-added modeling: What does due diligence require? In R. Lissitz (Ed.),Value added models in education: Theory and practice (pp. 19–38). Maple Grove, MN:JAM Press.
Gelman, A., Carlin, J. B., Stern, H. S., & Rubin, D. B. (1995). Bayesian data analysis. London:Chapman & Hall.
Goldstein, H. (2003). Multilevel statistical models (3rd ed.). London: Edward Arnold.Hamilton, L. S. (1998). Gender differences on high school science achievement tests: Do
format and content matter? Educational evaluation and policy analysis, 20, 179–195.Hamilton, L. S. (2004). Improving inferences about student achievement: A multi-dimensional
perspective. In S. J. Paik (Ed.), Advancing educational productivity: Policy implicationsfrom national databases (pp. 175–201). Greenwich, CT: Information Age Publishing.
Hamilton, L. S., McCaffrey, D. F., & Koretz, D. M. (2006). Validating achievement gains incohort-to-cohort and individual growth-based modeling contexts. In R. Lissitz (Ed.), Longi-tudinal and value added modeling of student performance. Maple Grove, MN: JAM Press.
Harcourt Brace Educational Measurement (1997). Stanford achievement test series: Technicaldata report (9th ed.). San Antonio: Harcourt Brace and Company.
Hershberg, T. (2005, February). Value-added assessment and systemic reform: A responseto America’s human capital development challenge. Paper prepared for the Aspen In-stitute’s Congressional Institute, Cancun, Mexico. Available at http://www.cgp.upenn.edu/pdf/aspen.pdf (retrieved 1/12/06).
Kupermintz, H., Ennis, M. M., Hamilton, L. S., Talbert, J. E., & Snow, R. E. (1995). Enhanc-ing the validity and usefulness of large-scale educational assessments: I. NELS:88 mathe-matics achievement. American Educational Research Journal, 32, 525–554.
Le, V., Stecher, B., Lockwood, J. R., Hamilton, L. S., Robyn, A., Williams, V., Ryan, G.,Kerr, K., Martinez, F., & Klein, S. (2006). Improving mathematics and science education:A longitudinal investigation of the relationship between reform-oriented instruction andstudent achievement. MG-480-EDU. Santa Monica, CA: RAND.
Little, R., & Rubin, D. B. (2002). Statistical analysis with missing data (2nd ed.). New York:John Wiley & Sons.
Lockwood, J. R., McCaffrey, D. F., Mariano, L. T., & Setodji, C. (forthcoming). Bayesianmethods for scalable multivariate value-added assessment. Journal of Educational and Be-havioral Statistics.
Martineau, J. A. (2006). Distorting value added: The use of longitudinal, vertically scaledstudent achievement data for value-added accountability. Journal of Educational and Be-havioral Statistics, 31, 35–62.
McCaffrey, D. F., Lockwood, J. R., Koretz, D. M., & Hamilton, L. S. (2003). Evaluatingvalue-added models for teacher accountability, MG-158-EDU. Santa Monica, CA: RAND.
McCaffrey, D. F., Lockwood, J. R., Koretz, D. M., Louis, T. A., & Hamilton, L. S. (2004a).
65

Lockwood et al.
Models for value-added modeling of teacher effects. Journal of Educational and BehavioralStatistics, 29, 67–101.
McCaffrey, D. F., Lockwood, J. R., Koretz, D. M., Louis, T. A., & Hamilton, L. S. (2004b).Let’s see more empirical studies of value-added models of teacher effects: A reply to Rau-denbush, Rubin, Stuart and Zanuto. Journal of Educational and Behavioral Statistics, 29,139–144.
McCaffrey, D. F., Lockwood, J. R., Mariano, L. T., & Setodji, C. (2005). Challenges for value-added assessment of teacher effects. In R. Lissitz (Ed.), Value added models in education:Theory and practice (pp. 272–297). Maple Grove, MN: JAM Press.
Nye, B., Konstantopoulos, S., & Hedges, L. V. (2004). How large are teacher effects? Educa-tional Evaluation and Policy Analysis, 26, 237–257.
Pinheiro, J. C., & Bates, D. M. (2000). Mixed-effects models in S and S-PLUS. New York:Springer-Verlag.
Raudenbush, S. W., & Bryk, A. S. (2002). Hierarchical linear models: Applications and dataanalysis methods (2nd ed.). Thousand Oaks, CA: Sage Publications.
R Development Core Team (2005). R: A language and environment for statistical computing.Vienna, Austria: R Foundation for Statistical Computing.
Robinson, G. K. (1991). That BLUP is a good thing: The estimation of random effects (withdiscussion). Statistical Science, 6, 15–51.
Rowan, B., Correnti, R., & Miller, R. J. (2002). What large-scale survey research tells us aboutteacher effects on student achievement: Insights from the Prospects study of elementaryschools. Teachers College Record, 104, 1525–1567.
Sanders, W., Saxton, A., & Horn, B. (1997). The Tennessee value-added assessment system:A quantitative outcomes-based approach to educational assessment. In J. Millman (Ed.),Grading teachers, grading schools: Is student achievement a valid evaluation measure?(pp. 137–162). Thousand Oaks, CA: Corwin Press, Inc.
Schmidt, W. H., Houang, R. T., & McKnight, C. C. (2005). Value-added research: Right ideabut wrong solution? In R. Lissitz (Ed.), Value added models in education: Theory and prac-tice (pp. 272–297). Maple Grove, MN: JAM Press.
U.S. Department of Education (2005). Secretary Spellings announces growth model pi-lot, addresses Chief State School Officers’ Annual Policy Forum in Richmond (pressrelease, November 18, 2005). Retrieved November 25, 2005 from http://www.ed.gov/news/pressreleases/2005/11/11182005.html.
Webster, W., & Mendro, R. (1997). The Dallas value-added accountability system. In J. Mill-man (Ed.), Grading teachers, grading schools: Is student achievement a valid evaluationmeasure? (pp. 81–99). Thousand Oaks, CA: Corwin Press, Inc.
Authors
J.R. LOCKWOOD is a Statistician, The RAND Corporation, 4570 Fifth Avenue, Suite 600,Pittsburgh, PA 15213; [email protected]. His primary research interests include value-added modeling and evaluation of educational interventions.
DANIEL F. McCAFFREY is a Senior Statistician, The RAND Corporation, 4570 Fifth Av-enue, Suite 600, Pittsburgh, PA 15213; [email protected]. His primary research interestsinclude value-added modeling.
LAURA S. HAMILTON is a Senior Behavioral Scientist, The RAND Corporation, 4570 FifthAvenue, Suite 600, Pittsburgh, PA 15213-2665; [email protected]. Her primary research in-terests include educational assessment and accountability.
BRIAN M. STECHER is a Senior Social Scientist, The RAND Corporation, 1776 Main Street,
66

Sensitivity of Value-Added Estimates
PO Box 2138, Santa Monica, CA 90407-2138; [email protected]. His primary researchinterests include educational assessment and accountability.
VI-NHUAN LE is a Behavioral Scientist, The RAND Corporation, 1776 Main Street, PO Box2138, Santa Monica, CA 90407-2138; [email protected]. Her primary research interestsinclude educational measurement and early childhood education.
JOSE FELIPE MARTINEZ is an Assistant Professor, UCLA Graduate School of Ed-ucation and Information Studies, 2019B Moore Hall, Los Angeles, CA 90095-1521;[email protected]. His primary research interests include educational assessment, evaluation,and quantitative methods.
67