Neanderthal demographic estimates
12
S202 Current Anthropology Volume 54, Supplement 8, December 2013 2013 by The Wenner-Gren Foundation for Anthropological Research. All rights reserved. 0011-3204/2013/54S8-0004$10.00. DOI: 10.1086/673725 Neanderthal Demographic Estimates by Jean-Pierre Bocquet-Appel and Anna Degioanni CA Online-Only Material: Supplement A This article offers a critical review of population estimates for the Neanderthal metapopulation based on (paleo-) biological, archaeological, climatic, and genetic data. What do these data tell us about putative Neanderthal de- mography? Biological data suggest a similar demographic frame (life-history traits, such as potential maximum longevity, age at menarche, and duration of gestation) between Neanderthals and modern humans. Archaeological data have revealed a contradiction between the mortality pattern corresponding to 45 yr in Neanderthals and the longevity displayed by the manifest continuum of extant mammals, including primates. Paleoclimatic data suggest that the demography of Neanderthals, living as they did under highly fluctuating climatic conditions, was subject to frequent bottlenecks. This demographic instability combined with the fragmentation of geographical areas and variations in their distribution and extent could account for the fact that potential for technical creativity in the Neanderthal metapopulation would have been limited precisely because of its small numbers, leading it into what is known as a “Boserupian trap” in macrodemographic theory. Finally, genetic literature reports different—but always very low—estimations of the effective size (N e ) of the Neanderthal metapopulation. It is not easy to relate N e to the census size of a population, but by combining different demographic values, this study produced nine different scenarios that were used to obtain an order of magnitude ranging from 5,000 to 70,000 individuals. The cause of the cultural limitation of the Neanderthal metapopulation, compared with that of modern humans, may well have resided in its small numbers alone. In population biology, it is known that the number of indi- viduals of a species (its metapopulation)—that is, its demo- graphic size in terms of census data—is a measure of its adaptive success. Thus, a population explosion is the result of successful adaptation. We also know that this number of individuals determines the rate of evolutionary change. The rate is fast when the population size is small, initiating a stochastic evolutionary direction; it is slow when a large pop- ulation pushes through the filter of purifying selection and against the resistance of niche construction (Kendal, Tehrani, and Odling-Smee 2011). This shows the value of linking de- mography to paleoanthropology. But there are many diffi- culties, mainly due to the nature of nondedicated information Jean-Pierre Bocquet-Appel is Professor at the E ´ cole Pratique des Hautes E ´ tudes (Paris) and Research Director at the Centre National de la Recherche Scientifique (UPR2147 44, rue de l’Amiral Mouchez, 75014 Paris, France [[email protected]]). Anna Degioanni is Assistant Professor in the Department of Anthropology at Aix-Marseille Universite ´, Centre National de la Recherche Scientifique (UMR 7269, Centre National de la Recherche Scientifique, Maison Me ´diterrane ´enne des Sciences de l’Homme, Laboratoire Me ´diterrane ´en de Pre ´histoire [Europe-Afrique], BP 647, 5 rue du Cha ˆteau de l’Horloge, 13094 Aix-en-Provence cedex 2, France). This paper was submitted 3 VII 13, accepted 13 VIII 13, and electronically published 19 XII 13. of every kind that one must try to interpret demographically and to the amount of this information, which decreases dras- tically with temporal depth. In this paper, inferences about the Neanderthal metapopulation are critically reviewed on the basis of (paleo-) biological, climatic, archaeological, and pa- leogenetic data. What do these data tell us about the putative demography of Neanderthals? Demographic Inferences from (Paleo-) Biological Data: The Frame of Reference of Extant Mammals Estimation of Potential Maximum Longevity in Mammals For nearly 50 yr, thanks to the research initiated by Sacher (1959, 1975) and Sacher and Staffeldt (1974), a close rela- tionship has been known in extant mammals, including pri- mates, between maximum potential longevity (L) and the biometric characters of brain weight (E) and body weight (P; Cutler 1975; Hofman 1993; for a review, see Hawkes 2006). This relationship is based on the biological quasi continuum between related species, which are connected by their phy- logenies, and the many similarities they generate. Used as an estimator of L for fossil hominins, this relationship has pro- duced values of 52, 78, 93, and 94 yr for Homo habilis, Homo This content downloaded from 193.50.65.21 on Mon, 20 Jan 2014 10:03:51 AM All use subject to JSTOR Terms and Conditions
Transcript of Neanderthal demographic estimates

S202 Current Anthropology Volume 54, Supplement 8, December 2013
� 2013 by The Wenner-Gren Foundation for Anthropological Research. All rights reserved. 0011-3204/2013/54S8-0004$10.00. DOI: 10.1086/673725
Neanderthal Demographic Estimates
by Jean-Pierre Bocquet-Appel and Anna Degioanni
CA� Online-Only Material: Supplement A
This article offers a critical review of population estimates for the Neanderthal metapopulation based on (paleo-)biological, archaeological, climatic, and genetic data. What do these data tell us about putative Neanderthal de-mography? Biological data suggest a similar demographic frame (life-history traits, such as potential maximumlongevity, age at menarche, and duration of gestation) between Neanderthals and modern humans. Archaeologicaldata have revealed a contradiction between the mortality pattern corresponding to 45� yr in Neanderthals and thelongevity displayed by the manifest continuum of extant mammals, including primates. Paleoclimatic data suggestthat the demography of Neanderthals, living as they did under highly fluctuating climatic conditions, was subjectto frequent bottlenecks. This demographic instability combined with the fragmentation of geographical areas andvariations in their distribution and extent could account for the fact that potential for technical creativity in theNeanderthal metapopulation would have been limited precisely because of its small numbers, leading it into whatis known as a “Boserupian trap” in macrodemographic theory. Finally, genetic literature reports different—butalways very low—estimations of the effective size (Ne) of the Neanderthal metapopulation. It is not easy to relateNe to the census size of a population, but by combining different demographic values, this study produced ninedifferent scenarios that were used to obtain an order of magnitude ranging from 5,000 to 70,000 individuals. Thecause of the cultural limitation of the Neanderthal metapopulation, compared with that of modern humans, maywell have resided in its small numbers alone.
In population biology, it is known that the number of indi-viduals of a species (its metapopulation)—that is, its demo-graphic size in terms of census data—is a measure of itsadaptive success. Thus, a population explosion is the resultof successful adaptation. We also know that this number ofindividuals determines the rate of evolutionary change. Therate is fast when the population size is small, initiating astochastic evolutionary direction; it is slow when a large pop-ulation pushes through the filter of purifying selection andagainst the resistance of niche construction (Kendal, Tehrani,and Odling-Smee 2011). This shows the value of linking de-mography to paleoanthropology. But there are many diffi-culties, mainly due to the nature of nondedicated information
Jean-Pierre Bocquet-Appel is Professor at the Ecole Pratique desHautes Etudes (Paris) and Research Director at the Centre Nationalde la Recherche Scientifique (UPR2147 44, rue de l’Amiral Mouchez,75014 Paris, France [[email protected]]).Anna Degioanni is Assistant Professor in the Department ofAnthropology at Aix-Marseille Universite, Centre National de laRecherche Scientifique (UMR 7269, Centre National de la RechercheScientifique, Maison Mediterraneenne des Sciences de l’Homme,Laboratoire Mediterraneen de Prehistoire [Europe-Afrique], BP 647,5 rue du Chateau de l’Horloge, 13094 Aix-en-Provence cedex 2,France). This paper was submitted 3 VII 13, accepted 13 VIII 13,and electronically published 19 XII 13.
of every kind that one must try to interpret demographicallyand to the amount of this information, which decreases dras-tically with temporal depth. In this paper, inferences aboutthe Neanderthal metapopulation are critically reviewed on thebasis of (paleo-) biological, climatic, archaeological, and pa-leogenetic data. What do these data tell us about the putativedemography of Neanderthals?
Demographic Inferences from (Paleo-)Biological Data: The Frame ofReference of Extant Mammals
Estimation of Potential Maximum Longevity in Mammals
For nearly 50 yr, thanks to the research initiated by Sacher(1959, 1975) and Sacher and Staffeldt (1974), a close rela-tionship has been known in extant mammals, including pri-mates, between maximum potential longevity (L) and thebiometric characters of brain weight (E) and body weight (P;Cutler 1975; Hofman 1993; for a review, see Hawkes 2006).This relationship is based on the biological quasi continuumbetween related species, which are connected by their phy-logenies, and the many similarities they generate. Used as anestimator of L for fossil hominins, this relationship has pro-duced values of 52, 78, 93, and 94 yr for Homo habilis, Homo
This content downloaded from 193.50.65.21 on Mon, 20 Jan 2014 10:03:51 AMAll use subject to JSTOR Terms and Conditions

Bocquet-Appel and Degioanni Neanderthal Demographic Estimates S203
erectus, Neanderthals, and modern humans, respectively, aswell as age at sexual maturity taken as one-fifth of L, that is,12–13, 13–14, 18–19, and 18–19 yr, respectively (Cutler 1975;Sacher 1975). These estimates were incorporated into paleo-demography 35 yr ago as parameters influencing the shapeof the death distribution of fossil hominins (Bocquet andMasset 1977, 1982; Bocquet-Appel 1982). Updated estimatesof L, from biometric (estimated) data in more recent literatureusing the Hofman regression (1993),1 have produced 111.7and 111.2 yr for Neanderthals and modern humans, respec-tively, that is, identical figures between the two metapopu-lations and figures similar to those of Sacher (1975) and Cutler(1975). These estimates also suggest that other important de-terminants of life history, such as age at menarche or durationof gestation, were similar between Neanderthals and modernhumans, which allows them to be set within a common de-mographic frame.
Paleodemographic Estimates
Two death distributions by age, pre-Neanderthal (Homo hei-delbergensis; Bermudez de Castro and Nicolas 1997; Bocquet-Appel and Arsuaga 1999; minimum number of individuals p32, now 29; Bermudez de Castro et al. 2004) and Neanderthal(Trinkaus 1995; N p 206 registration numbers), were obtained,along with life span estimates of the australopithecines, un-til modern humans (Caspari and Lee 2004). The pre-Neanderthal distribution was obtained by a technique of ageestimation by self-reference2 based on dental attrition developedby Miles (1963, 2001; Bocquet-Appel and Arsuaga 1999). TheNeanderthal age distribution was obtained using the usual sta-tistical techniques exploiting morphological age indicators foradults (Trinkaus 1995), which are known to be biased towarda younger age (Bocquet and Masset 1982). These two sampledpaleontological distributions produce very high proportions ofyoung and mature adults (in the Neanderthal sample fromTrinkaus 1995, 80% of adults aged 20 yr and over die beforethe age of 40, not counting the question of children under 5yr of age, who are still significantly underrepresented in paleo-demographic data). These proportions have no equivalent inthe many controlled distributions of attritional death in otherprimates (Rawlins and Kessler 1987; Richard 1985), apes(Courtenay and Santow 1989; Hill et al. 2001; Teleki, Hunt,
1. Brain weight E p 1.036 # cranial capacity (Isler et al. (2008);average cranial capacity 1,519 cc, n p 9 (Trinkaus and Tompkins 1990);body weight P, 17 males, 77.6 � 4.5 kg; 9 females, 66.4 � 4.8 kg;averaged, 72 � 4.6 kg (Ruff, Trinkaus, and Holliday 1997, supplementaldata); Hofman regression no. 4, given with no standard deviation, R p0.896 (Hofman 1993:214).
2. This technique is described as “self-referencing” because the sampleanalyzed is its own anthropological age/indicator reference sample, unlikein other estimation techniques that require reference samples that areexternal to the sample analyzed. Moreover, the self-referencing approachis the technique of choice in paleoanthropology (Mann 1968), where itis impossible to make up anthropological age/indicator reference samplesof extinct hominins.
and Pfifferling 1976), preindustrial humans (Henry and Blayo1975; Jannetta and Preston 1991), or ethnographic humans(Hill and Hurtado 1996; Howell 1979).3
Caspari and Lee (2004, 2005a, 2005b, 2006) have detected“increased longevity, expressed as the number of individualssurviving to adulthood” (Caspari and Lee 2004:10895) fromthe ratios of old (30� yr) to young (15–29 yr) adults (notedOY, which is written in demographic notation as ωd30/15d15 andread as ωd30, the number of deaths at age 30 plus a number ofyears coinciding with the end of life, noted ω, over 15d15, thenumber of deaths at age 15, plus 15 yr (i.e., between 15 and29.9 yr). With samples of australopithecines, early Homo, Ne-anderthals, and Early Upper Paleolithic (modern human), Cas-pari and Lee obtained OY values of 0.12, 0.25, 0.39, and 2.08,respectively, with an abrupt change between Neanderthals andanatomically modern humans. If the information provided bythe data is true, then these ratios, with an increasing numberof older individuals relative to younger ones, express a trendtoward an increasing average life span in the metapopulationof extinct hominins (Caspari and Lee 2004, 2005a, 2005b,2006). The robustness of Caspari and Lee’s demonstration re-sides especially in the relatively large sizes of the paleontologicalsamples collected and in the use of the age estimation techniqueof Miles, which is homogeneous between groups and allowshuman groups to be set into a common comparative framewithout which this demographic signal, based on the OY in-dicator alone, would not have been detected.
Derived OY values express another interesting point of in-formation that combined with the estimates of potential lon-gevity L given above (111.7 and 111.2) produces the outlinesof living population pyramids. Assuming that populations arestable on average, the pyramids for these populations areregular and can be represented here by a triangular polygonwhere the height represents the ages and the width the agedistribution of the living population. The technical details forthe construction of the population pyramid from Caspari andLee’s data and an observed statistical relationship between OYvalues for dead and living in sample life tables of modernhuman populations (table 1; fig. 1) are given in CA� onlinesupplement A. What is obtained is a highly schematic rep-resentation of a population pyramid at 15� yr. The pyramidsfor the two groups are represented in figure 2. They show theflattening effect produced by the departure of the pyramid atthe point of the statistical longevity ω rather than at the
3. It is this observation of the systematic structural deviation betweencontrolled demographic patterns in primates, including humans, and thepatterns obtained most frequently from paleodemographic data thatbrought the results of the latter into question 40 yr ago (Bocquet andMasset 1982, 1985; Bocquet-Appel 1986; Masset 1973). The alternativeposition was to accept the paleodemographic distributions as true, toconsider them as ancestral patterns of the demographic distributions ofextant primate populations, and to consider the conflicting references ofcontrolled distributions of extant primates as expressing the tyranny ofactualist demography. This was the main thrust of the arguments givenby the American Journal of Physical Anthropology to one of us in 1977in rejecting a manuscript that discussed past orthodoxy.
This content downloaded from 193.50.65.21 on Mon, 20 Jan 2014 10:03:51 AMAll use subject to JSTOR Terms and Conditions

S204 Current Anthropology Volume 54, Supplement 8, December 2013
Table 1. Paleodemographic statistical data
GroupDeath at 15 � 29 yr p
Y p 15d15
Death at 15� yr pO p ωd15
Y/(Y � O) dead p
15d15/ωd15
Estimated OYlivinga p 15L30/15L15
Estimated maximumlongevity L
Australopithecinesb 316 353 .895 .505 51.5c
Early Homo 166 208 .798 .539 73.5d
Neanderthal 96 133 .721 .569 111a,b
Early Upper Paleolithic 24 74 .324 .805 111a,b
a From , , , preindustrial life tables with low life expectancy2OY living p 0.47274 � 0.29547 # log [Y/(Y � O)] dead � 0.01904 R p 0.940 N p 44at birth, excluding Yanomamo, stationary population (see Bocquet and Masset 1977; Bocquet-Appel 2002), , , .F p 658.1 df p 1, 42 P ! .00001b Number of Australopithecines to Early Upper Paleolithic, aged by Miles’s technique (Caspari and Lee 2004).c Australopithecine and early Homo (Cutler 1975, table 2, excluding Homo habilis; see Caspari and Lee 2004).d Homo erectus, average.
Figure 1. Relationship between OY living (15L30/15L15, vertical axis)and the variable Y/(Y � O) dead (15d15/ωd15, horizontal axis) ina sample of 44 preindustrial life tables representing stationarypopulations (r p 0).
maximum longevity L, which gives the population pyramidsa more acute angle.
The first pyramid for the australopithecines, compared withthe others, resembles those known for the great apes. Partic-ularly notable is the similarity of the Neanderthal and EarlyUpper Paleolithic pyramids, which both have a base width at15 yr similar to that for early Homo, estimated from pale-ontological data, and a height identical to the Early UpperPaleolithic, estimated from zoological data. If L and ω arecorrectly estimated, then in the Neanderthal paleontologicaldata, the proportion of deaths corresponding to 45 � ω ofthe population pyramid is either missing or not recognizedamong the skeletal remains. The similarity in the represen-tation of population pyramids for Neanderthals and the EarlyUpper Paleolithic highlights the contradiction between thebiodemographic pattern of longevity of extant mammals, in-
cluding primates, and the paleodemographic signal detectedby Caspari and Lee that does not fit in the frame. We haveno solution to this contradiction, but it cannot be ignored(see also Trinkaus 2011). It raises two issues: one is technicaland concerns the recurrent problems of paleodemographicage estimation, while the other concerns population biologyand the assumption of faster maturation in Neanderthals thanmodern humans, which we will now discuss.
Miles’s technique is based on a self-reference in the ana-lyzed sample. It therefore seems to escape from the a prioriprobabilities that are encysted in the anthropological ages/indicators reference sample used in other techniques, whichpredetermine the age estimates and for which there is now arange of solutions currently under evaluation (Bocquet-Appeland Bacro 2008; Caussinus and Courgeau 2010; Hoppa andVaupel 2002; Lucy, Ackroyd, and Pollard 2002; Lucy et al.1996). Nevertheless, it may seem surprising that Miles’s tech-nique, which has been used many times in paleoanthropologysince its publication in 1963 (for an overview, see Miles 2001),has never, to the best of our knowledge, been tested with asample of skeletons of known ages, with its share of immatureindividuals to calibrate the standards and its share of adultsto apply them to. An old idea is that tooth wear is not linearwith chronological age, as implied in the technique, but de-creases asymptotically in older individuals. As long as thisvalidation test has not been done, in particular to estimatethe confidence intervals (CIs), this technique should be con-sidered conservatively, as indicated by Miles himself, as “anart, not a precise science” (Miles 2001:980).
The hypothesis of significantly faster biological maturationin Neanderthals than in modern humans has been put for-ward in recent years as estimated from the growth of toothenamel (Guatelli-Steinberg et al. 2005; Ramirez-Rozzi andBermudez de Castro 2004; Smith et al. 2007). As there is acorrelation between tooth development and other life-historytraits, then there are grounds for asking whether the life spanof Neanderthals, despite their large brains, could also havebeen shorter, as revealed by the growth of tooth enamel. Ifthis is indeed the case, it would suggest a death distributionat a younger age, on average, than in anatomically modernhumans. But there is no consensus over this hypothesis offaster maturation for reasons to do with the dental techniques
This content downloaded from 193.50.65.21 on Mon, 20 Jan 2014 10:03:51 AMAll use subject to JSTOR Terms and Conditions

Bocquet-Appel and Degioanni Neanderthal Demographic Estimates S205
Figure 2. Schematic representation of the population pyramids for ages 15� yr of living populations of australopithecines, earlyHomo, Neanderthals, and Early Upper Paleolithic (modern humans) estimated from the 15L30/15L15 ratios, derived values of OY(Caspari and Lee 2004), and estimated maximum potential longevity (regression: Hofman 1993). Regarding the australopithecines,because the statistical demographic longevity ω is lower than the upper limit of the area representing the living at 30–45 yr of age,of unit density, this limit of 15L30 was set at ω.
used, the sizes of samples counted in units, and the failureto consider interindividual variations in Neanderthals andmodern human in comparisons (for a summary, see Guatelli-Steinberg 2009). Moreover, the hypothesis of rapid matura-tion does not imply, in paleodemographic distributions, anabsence of individuals with recognized aging markers, asseems to be the case in the data. These faster-maturing in-dividuals would also have these markers of aging, but theywould simply be chronologically younger than their modernhuman counterparts. Finally, ethnographic assumptions(Trinkaus 1995, 2011), or assumptions by analogy with eth-nohistorical environmental crises (Bocquet-Appel and Arsu-aga 1999), have been put forward to explain the apparentdeficit of adults over 40 yr old and even over 25 yr old inpre-Neanderthal and Neanderthal samples.
To summarize, the mortality pattern of Neanderthals, asrevealed by paleontological data, does not correspond to thepromise of longevity displayed by the manifest continuum ofextant mammals, including primates. Could one of the twobe wrong? This question, which is beyond the scope of thispaper, cannot be evaded.
Demographic Inferences from Paleoclimaticand Archaeological Data
We know there is a connection between climatic variationsin isotopic stages and the frequency of Mousterian archaeo-
logical sites in Europe (van Andel, Davies, and Weninger2003). This link is determined—via the amount of biomedistribution of primary biomass—by the biomass of ungulatepopulations available for hunter populations. From these rel-atively long-cycle climatic variations in the isotopic stages ofcelestial mechanics, it gradually becomes clear that medium-cycle cold fluctuations (Heinrich events 10–8 kyr [H]) aresuperimposed over relatively short-cycle and short-durationtemperate-cold fluctuations (Oeshger-Dansgaar events 1.5 kyr[DO]). These DO changes, which occur rapidly over time,significantly amplify the predominant climate in the isotopicstages. From oxygen isotope stage (OIS) 5 of the Eemianonward, 25 DO events occurred in Europe (Sanchez-Goni etal. 2008). Others would be expected to appear in earlier pe-riods when Neanderthals lived but are so far unknown forlack of data. A correlation between the frequency of UpperPaleolithic archaeological sites and the variation in DO eventshas been interpreted in terms of demographic and culturalchanges in Europe, which roughly correspond via changes inthe ecological zones of primary and secondary ungulate bio-mass (d’Errico, Sanchez-Goni, and Vanhaeren 2006). Howdid local populations react to these significant variationsacross their expansion area? Rather than a model of the ebband flow of small local populations on the geographical mar-gins of the metapopulation to and from attested refuge zonesover evolutionary time—which were, in fact, already occupied
This content downloaded from 193.50.65.21 on Mon, 20 Jan 2014 10:03:51 AMAll use subject to JSTOR Terms and Conditions

S206 Current Anthropology Volume 54, Supplement 8, December 2013
by the cores of the metapopulation—a model of regionalextinction in situ is proposed (Hublin and Roebroeks 2009).
Other consequences of large-amplitude and long-durationclimatic fluctuations—in their low points of glacial temper-ature, moreover amplified by H and DO events—were likelyto create demographic bottlenecks for the Neanderthals, whoavoided permafrost zones (Aiello and Wheller 2003), thatdetermine stochastic genetic drifts (Bruner and Manzi 2006).But it is not certain, on the other hand, that the peak inter-glacial temperatures (isotopic stage 5e and 7e), which weresimilar to current temperatures and corresponded to a plantrecolonization on the latitudes, also corresponded to periodsof population growth. Recolonization can occur with a verylow population density. This is because for the interglacialperiods, account must be taken of the result, in terms ofungulate biomass, of the combined effects of (i) the expansionof habitable areas due to the withdrawal of ice masses anddespite the rise in sea level (3–7 m above the current level),and (ii) the decrease in the area of the steppe tundra as itshifted toward the high latitudes up to the pole. The con-ditions that brought this expansion of habitable areas werefavorable to forests (van Andel and Tedzakis 1996; Kukla etal. 2002), where ungulate biomass was very low. The north-ward shift of steppe tundra toward the high latitudes resultednot only in a smaller area, as mentioned above, but also inlower productivity as available sunlight diminished. Until allnet effects relative to the distribution of the major biomesduring the Eemian have been simulated, taking into accountthe conflicting effects described above, it will not be possibleto equate the interglacial with a demographic expansion ofthe Neanderthal metapopulation (see also Frenzel 1985; Gam-ble 1987).
Bottleneck situations and purifying selection are both chro-nologically identifiable. These correspond to the low (Brunerand Manzi 2006) and likely midpoints of climate series. Nev-ertheless, and underlying the anatomical traits that appearedin some glacial episodes because of drift (Hublin 1998), even-tually producing the classic Neanderthal morphotype de-scribed as “hyperarctic” (Aiello and Wheeler 2003; Holliday1997), the metapopulation had to reach a significant size inthese cold and harsh environments for the filter of purifyingselection to act on the phenotypes carrying selected genotypes,in particular via Bergman and Allen’s rule. These periods,when populations were relatively more numerous, may havematched phases of OIS 8 and 6, in which long, cold, but notextreme periods emerge (except H and DO events, which arenot yet listed).
Finally, from the differential distribution of well-docu-mented archaeological remains in the Perigordian region—between the Chatelperronian 45,000–40,000 yr ago and theAurignacian 40,000–35,000 yr ago, attributed respectively toNeanderthals and to anatomically modern humans—Mellarsand French (2011) have estimated vestige quantity as 10 timeslarger for the modern human population. The authors equatethis relative difference in the amount of remains in this area
to the demographic sizes of both populations. This area is arefuge zone on the evolutionary timescale. It should be re-membered that the size of the Aurignacian population in thissame area has been estimated at 795–12,980 individuals witha 95% CI (Bocquet-Appel et al. 2005:1665, fig. 5). By applyingthe magnitude of the relative difference estimated by Mellarsand French (2011) to this Aurignacian population size, weobtain a local Neanderthal population of 80–1,300 individualsin the Perigordian refuge area before the time of contact.
Hypothesis of a Boserupian NeanderthalPopulation Trap
The homogeneity of the lithic cultural remains of Neander-thals during their last 150 kyr is striking, except, apparently,at the point of their extinction (Bocquet-Appel and Tuffreau2009), suggesting very low technical elasticity despite the sig-nificant pressure of the environmental hazards summarizedabove, which should have favored innovations because of theoverall change in the ungulate biomass. Questions about thecognitive efficiency of Neanderthals are thereby raised (Neu-bauer and Hublin 2012). But the hypothesis of technical lim-itations in the production system of Neanderthal hunters dueto a demographic trap (Bocquet-Appel and Tuffreau 2009)must also be put forward again but more properly defined.
In any population, the production of innovations dependsnot only on its cognitive biological capacities but also on itsdemographic size. With the same cognitive capacity, underthe simple assumption that innovations are produced at a lowfrequency in any population, then the most demographicallynumerous population, in absolute terms, will produce thegreatest number of innovations (Kremer 1993; Kuznets 1973;Simon 1977; see also Powell, Shennan, and Thomas 2009;Shennan 2001). If the size of the Neanderthal metapopulationremained very low in terms of carrying capacity—that is tosay, the maximum number of mouths that it was possible tofeed per square kilometer of ungulate biomass given its pro-duction system (the technical and social relationships in anenvironment)—then the metapopulation could have main-tained itself in a state of demographic equilibrium at a “criticallevel of density” (Boserup 1965:33), but its potential technicalcreativity would have been strongly limited in what is knownas a “Boserupian trap” in macrodemography theory.
The technical and social characteristics of the Neanderthalproduction system might, in central and northern Europe,have operated in an open environment: high residential mo-bility but not to great distances (Conarda, Bolusc, and Mun-zeld 2012) and targeted to large gregarious herbivores andresources (horses, bison, reindeer, and ibex) with a smalleramount of many other larger game species typically domi-nating the assemblages (Conarda, Bolusc, and Munzeld 2012;Gamble 1999; Patou-Mathis 2000); consumption of shellfish,birds, and turtles in the peripheral southern latitudinal zonesof the expansion area (Finlayson et al. 2001); direct and dan-gerous contact with prey animals by killing with lances rather
This content downloaded from 193.50.65.21 on Mon, 20 Jan 2014 10:03:51 AMAll use subject to JSTOR Terms and Conditions
Bocquet-Appel and Degioanni Neanderthal Demographic Estimates S207
than killing at a distance using projectiles (spears; Gamble1999) with the aid of beaters and with no division of laborby gender (or by age? Kuhn and Stiner 2006) between huntingand gathering, as observed ethnographically, that is, with bothmales and females working as hunters and beaters. The car-rying capacity of this hunter-gatherer production systemalong with high incidental mortality (Trinkaus 1995) shouldbe lower than in other systems in which clearly more efficienthunter-gatherer hunting techniques (spears, bows) were used.In addition, the energy balance of this putative productionsystem, combining high energy expenditure due to mobility(following herds) and energy gain from a low calorie diet(essentially game), determines long birth intervals in modernhuman females and, therefore, low fertility (see Bocquet-Appel 2008). By analogy, it may be thought that the energybalance/fertility reaction norm was similar in Neanderthalsand that their female fertility (total fertility rate) thereforetended, on average, toward low values (!Kung: 5 children andless) rather than high values. The relatively low fertility andhigh mortality of the Neanderthal hunter-gatherer productionsystem would have been a contributing factor in locking theminto the Boserupian trap.
Although ethnographic demographic control data are lack-ing on this point, there are two conceivable circumstances inwhich a population of hunters may have escaped stagnationin a Boserupian trap: (i) the outcome of the rate of innovation,which would sporadically increased the carrying capacity, and(ii) favorable environmental change (Wood 1998:112). Unlikethe realization of the rate of innovation, which is a simplestatistical function of the rate and the metapopulation sizeand cannot be located precisely in time, favorable environ-mental changes were a certainty in western Eurasia, especiallyover the relatively long durations of OIS 5 and 7. These fa-vorable environmental changes resulted in the extension ofsteppe savannah and grassland areas together with the cor-responding ungulate biomass and its carnivorous predators,which included the increasing Neanderthal metapopulation.Along with this demographic growth, the population expan-sion area was gradually homogenized, particularly through adefragmentation of the geographical structure inherited fromthe previous cold period, the increase in interpopulation mi-gration, and the redensification of local populations, all ofwhich favored the spread of innovations.
With no change in hunting technique (“in the herd”: Gam-ble 1999) but simply by virtue of the increase in the overallbiomass of ungulates during OIS 5 and 7, the logistic mobilityof the Neanderthal hunter system could have diminished. Theeffect of reduced logistic mobility (with the correspondingdecrease in energy expenditure) is to improve the energy bal-ance, which results in a rise in female fertility through areduction in the birth interval (Bocquet-Appel 2008). An in-crease in the metapopulation or local populations could thenoccur through an opportunistic adjustment of female fertilityto the new carrying capacity rather than a “technological”reduction in mortality due to hunting accidents (via killing
at distance). But 150 kyr of apparent Neanderthal techno-logical stability do not make the case for an escape from theBoserupian trap during the climate windows of OIS 5 and 7.
Demographic Inference from AncientNeanderthal DNA
While there has been general agreement since the 1970s overthe effective population size (Ne) of 10,000 individuals formodern humans (Hammer and Zegura 1996; Harding et al.1997; Nei and Graur 1984; Rogers and Jorde 1995; Takahata1993; Takahata, Satta, and Klein 1995; Wilson et al. 1985),there is no such consensus over the Neanderthal Ne. Thereis now enough data from Neanderthal DNA analysis to pro-vide an outline. Analysis of Neanderthal DNA sequences be-gan in 1997 (Krings et al. 1997) from the original specimendiscovered in 1856, but information has since become avail-able on mitochondrial sequences from 14 additional Nean-derthal specimens (see Degioanni, Fabre, and Condemi 2011for a review), including complete mitochondrial genome se-quences from nine Neanderthal individuals (Briggs et al. 2009;Green et al. 2008, 2010). Neanderthal genomic DNA has alsobeen sequenced since 2006 (Green et al. 2006; Noonan et al.2006: 65,000 and 1,000,000 base pairs, respectively). Finally,in 2010, the genes of three Neanderthal individuals to 1.3-fold genomic coverage were sequenced by the NeanderthalGenome Project (Green et al. 2010). This project mainly aimsto determine the complete sequence of Neanderthal DNA, toanswer the question of recent interbreeding between Nean-derthals and modern humans, and to provide a catalog ofdifferences between the human and Neanderthal genomes.The Neanderthal Genome Project has also revealed the se-quence of several Neanderthal protein-coding genes that haverecently evolved adaptively in modern humans (Green et al.2010). Several publications on Neanderthal DNA sequencesfocus on the time of the most recent common ancestor ofNeanderthals and modern humans, and several publicationsreport estimations for Neanderthal Ne.
The following is a brief digest of the demographic findingsof these studies. A first study comparing three short mtDNAsequences (Krings et al. 2000) suggested that Neanderthalshad expanded from a small population to explain the lowerdiversity of Neanderthal mtDNA than in the great apes andthe same order of magnitude in modern humans. This resultwas confirmed by analyzing five Neanderthal mtDNA ge-nomes (Briggs et al. 2009): the Ne was small and probablyincluded fewer than 3,500 females (mean Ne p 1,476; 268 to3,510, 95% HPD), and the authors proposed that the lowmtDNA diversity might reflect a low Neanderthal Ne over alarge part of their history. Estimating the θ p Neμ parameter(θ is the nucleotide diversity among sequences, and μ is thesubstitution rate per generation), assuming constant popu-lation size and 20 yr per generation over a short sequence of9 HVI mtDNA, Lalueza and colleagues (2005) propose an Ne
ranging from 5,000 to 9,000 individuals and confirm that this
This content downloaded from 193.50.65.21 on Mon, 20 Jan 2014 10:03:51 AMAll use subject to JSTOR Terms and Conditions

S208 Current Anthropology Volume 54, Supplement 8, December 2013
population would have been constant over time. The com-plete Vindija 33.16 mitochondrial genome sequence (Greenet al. 2008) showed a significantly higher ratio of nonsynon-ymous to synonymous evolutionary (dN/dS) rates in Nean-derthals versus modern humans. This result could be ex-plained by a smaller Neanderthal Ne and contrasts with HVI1 sequence results from Teshik Tash and Okladnikov indi-viduals (Krause et al. 2007)—based on mean pairwise differ-ences, which suggested that Neanderthals had an Ne similarto that of modern Europeans or Asians but lower than thatof modern Africans—and also contrasts with the results ofOvchinnikov and Kholina (2010), where the dN/dS ratio in-dicates that the Ne for their common ancestor (the human-Neanderthal branch) tends to be larger than in either Ne-anderthals or modern humans.
On mtDNA data again, but using a modeling approach,Fabre, Condemi, and Degioanni (2009) found that the de-mographic scenario that best explains the variability of Ne-anderthal is a population with an Ne ranging from 3,000 to25,000 individuals that will grow in size up to 50,000 yr BPand then decline slowly until extinction. A larger distributionvalue for Neanderthal Ne, whose median corresponds to32,263 individuals, was proposed instead by the best scenarioanalyzing a possible admixture process between Neanderthalsand early European modern humans (Ghirotto et al. 2011).Ne values from nuclear DNA are very rare but confirm thatNeanderthals derived from a very small ancestral populationwith an Ne of about 3,000 ranging up to 12,000 (Green et al.2006). This estimated Ne turns out to be similar to that pro-posed for a population of modern humans: this “small pop-ulation” character seems to be a feature of both Neanderthaland modern human evolution.
As we have seen, the literature offers different Ne values,but all publications agree that the Neanderthal Ne would bevery low. But what is the Ne? Ne is defined as the size of anideal population, a Wright-Fisher population (Fisher 1930;Wright 1931) that has the same rate of change of allele fre-quencies or heterozygosity as the population under study. Itis not easy to relate the Ne to the census size of a population(Nc). The Ne is almost always smaller than the actual size Nc.Some authors (Belle et al. 2006; Ray 2003; Wood 1987; for areview, see Hawk 2008) propose that the Ne is approximatelyone-half of the census size corresponding to the reproductiveindividuals of the population. Moreover, many parameterscan affect the Ne value; this raises the question of whether Ne
is in fact a reliable predictor of Nc.In the field of animal species conservation, where it is es-
sential not only to maintain a sufficient population size forthe survival of the species but also some degree of geneticvariability, researchers were already focusing in the 1970s onthe relationship between Ne and Nc, for which Hill (1972)proposed an initial formula. This formula, modified by Nun-ney (1993) and widely used in animal studies, is written
N 4r(1 � r)Te p ,N [rA (1 � I ) � (1 � r)A (1 � I ) � (1 � r)I � rI ]f A m A bm bff m
where Ne is the effective size, N the population size, r the sexratio; A is the adult life span; T is the generation time; IA isthe standardized variance (variance/mean2) in the adult lifespan; Ib is the standardized variance (variance/mean2) in thereproductive success of sex; m indicates male and f female.N corresponds exactly to the size of the population (Nc) ofanimals with early sexual maturity and to the size of the adultpopulation only (Na) in late-maturing species (see Nunneyand Elan 1994). To obtain the N census value for Neander-thals, being presumably also late maturing like modern hu-mans, the fraction of the juvenile population (0–19.9 yr old,or 20L0 in demographic notation) must therefore be added toNa. While these parameters are readily available for ecologicalstudies on living animals (e.g., livestock), estimating Na forpast populations, for which none of the parameters of theformula are known, is much more complicated. It is never-theless possible to put forward known values for living hunter-gatherer populations and to use these values in the knowledgethat although they are not “real” values for Neanderthal pop-ulations, it is probable that the real values would be in thesuggested range. Our aim is to obtain an order of magnituderather than exact values. By cross-referencing the values, sev-eral scenarios are obtained. To reduce their number, and sincewe have no evidence to the contrary at present, we considerthat the population consisted of equal numbers of men andwomen (r p 0.5), that the men and women had the sameadult life span (Af p Am p Ai) and the same reproductivesuccess (Ibm p Ibf p Ibi). Regarding the adult life span, thereare only two detailed demographic studies of hunter-gatherers(Hill and Hurtado 1996; Howell 1979) giving this information(for individuals of 20� yr, both sexes). The adult life spansfor both sexes are virtually identical, at 36.5 for !Kungs and37 yr for Aches. These two poulations live in the tropics,unlike the Neanderthals, who lived in temperate and, mostfrequently, subarctic regions. These studies include inconsis-tencies, which are discussed by the authors (e.g., Hill andHurtado 1996:258; Howell 1979:116). However, in the ab-sence of any other information, these demographic data onliving hunter-gatherers are used in this article to estimate arange of adult life span (�3 yr: 33–40 yr), which are extendedto lower values for the lower class boundary to take the effectof a cool or cold climate into account as well as the demo-graphic reality possibly reflected by the very small proportionof adult Neanderthal skeletons found. The result is a relativelybroad range of 25–40 yr for the hypothetical life span ofNeanderthal adults, with an estimated SD (deviation/mean2)in the adult life span (both sexes) of 38.88888/(25 or 30 or
.240)Combining these values produced nine different scenarios.
For each scenario, we apply the formula to estimate the Na
value of the Neanderthal population given the extreme values
This content downloaded from 193.50.65.21 on Mon, 20 Jan 2014 10:03:51 AMAll use subject to JSTOR Terms and Conditions
Bocquet-Appel and Degioanni Neanderthal Demographic Estimates S209
Table 2. Values of the parameters used to calculate theNe/Na ratio
Parameter Value
r p sex ratio .5T p generation time 17.5, 20, 25Ai p Af p Am p adult life span 25, 30, 40a
IAi p IAf p IAm p standardized variance(variance/mean2) in the adult lifespan of sex i
38.8888/Ai p .06222,.04320, .02430
Ibi p Ibf p Ibm p standardized variance(variance/mean2) in the reproductivesuccess of sex i
6/22 p 1.5
a Based on Hill and Hurtado (1996:196) and Howell (1979:88).
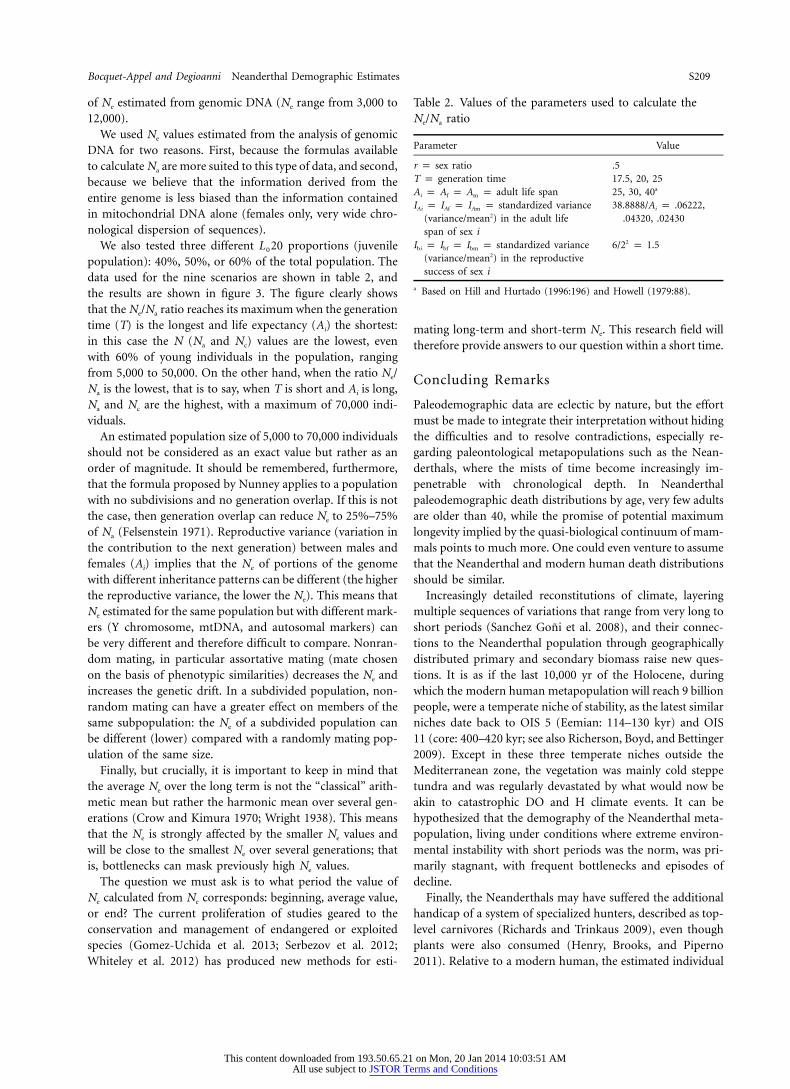
of Ne estimated from genomic DNA (Ne range from 3,000 to12,000).
We used Ne values estimated from the analysis of genomicDNA for two reasons. First, because the formulas availableto calculate Na are more suited to this type of data, and second,because we believe that the information derived from theentire genome is less biased than the information containedin mitochondrial DNA alone (females only, very wide chro-nological dispersion of sequences).
We also tested three different proportions (juvenileL 200
population): 40%, 50%, or 60% of the total population. Thedata used for the nine scenarios are shown in table 2, andthe results are shown in figure 3. The figure clearly showsthat the Ne/Na ratio reaches its maximum when the generationtime (T) is the longest and life expectancy (Ai) the shortest:in this case the N (Na and Nc) values are the lowest, evenwith 60% of young individuals in the population, rangingfrom 5,000 to 50,000. On the other hand, when the ratio Ne/Na is the lowest, that is to say, when T is short and Ai is long,Na and Nc are the highest, with a maximum of 70,000 indi-viduals.
An estimated population size of 5,000 to 70,000 individualsshould not be considered as an exact value but rather as anorder of magnitude. It should be remembered, furthermore,that the formula proposed by Nunney applies to a populationwith no subdivisions and no generation overlap. If this is notthe case, then generation overlap can reduce Ne to 25%–75%of Na (Felsenstein 1971). Reproductive variance (variation inthe contribution to the next generation) between males andfemales (Ai) implies that the Ne of portions of the genomewith different inheritance patterns can be different (the higherthe reproductive variance, the lower the Ne). This means thatNe estimated for the same population but with different mark-ers (Y chromosome, mtDNA, and autosomal markers) canbe very different and therefore difficult to compare. Nonran-dom mating, in particular assortative mating (mate chosenon the basis of phenotypic similarities) decreases the Ne andincreases the genetic drift. In a subdivided population, non-random mating can have a greater effect on members of thesame subpopulation: the Ne of a subdivided population canbe different (lower) compared with a randomly mating pop-ulation of the same size.
Finally, but crucially, it is important to keep in mind thatthe average Ne over the long term is not the “classical” arith-metic mean but rather the harmonic mean over several gen-erations (Crow and Kimura 1970; Wright 1938). This meansthat the Ne is strongly affected by the smaller Ne values andwill be close to the smallest Ne over several generations; thatis, bottlenecks can mask previously high Ne values.
The question we must ask is to what period the value ofNe calculated from Ne corresponds: beginning, average value,or end? The current proliferation of studies geared to theconservation and management of endangered or exploitedspecies (Gomez-Uchida et al. 2013; Serbezov et al. 2012;Whiteley et al. 2012) has produced new methods for esti-
mating long-term and short-term Ne. This research field willtherefore provide answers to our question within a short time.
Concluding Remarks
Paleodemographic data are eclectic by nature, but the effortmust be made to integrate their interpretation without hidingthe difficulties and to resolve contradictions, especially re-garding paleontological metapopulations such as the Nean-derthals, where the mists of time become increasingly im-penetrable with chronological depth. In Neanderthalpaleodemographic death distributions by age, very few adultsare older than 40, while the promise of potential maximumlongevity implied by the quasi-biological continuum of mam-mals points to much more. One could even venture to assumethat the Neanderthal and modern human death distributionsshould be similar.
Increasingly detailed reconstitutions of climate, layeringmultiple sequences of variations that range from very long toshort periods (Sanchez Goni et al. 2008), and their connec-tions to the Neanderthal population through geographicallydistributed primary and secondary biomass raise new ques-tions. It is as if the last 10,000 yr of the Holocene, duringwhich the modern human metapopulation will reach 9 billionpeople, were a temperate niche of stability, as the latest similarniches date back to OIS 5 (Eemian: 114–130 kyr) and OIS11 (core: 400–420 kyr; see also Richerson, Boyd, and Bettinger2009). Except in these three temperate niches outside theMediterranean zone, the vegetation was mainly cold steppetundra and was regularly devastated by what would now beakin to catastrophic DO and H climate events. It can behypothesized that the demography of the Neanderthal meta-population, living under conditions where extreme environ-mental instability with short periods was the norm, was pri-marily stagnant, with frequent bottlenecks and episodes ofdecline.
Finally, the Neanderthals may have suffered the additionalhandicap of a system of specialized hunters, described as top-level carnivores (Richards and Trinkaus 2009), even thoughplants were also consumed (Henry, Brooks, and Piperno2011). Relative to a modern human, the estimated individual
This content downloaded from 193.50.65.21 on Mon, 20 Jan 2014 10:03:51 AMAll use subject to JSTOR Terms and Conditions

Figu
re3.
Ne/
Na
and
Na
and
Nc
vari
atio
nde
pen
din
gon
T,
Ai
valu
e,an
d20
L 0pr
opor
tion
s.a,
Tge
ner
atio
nti
me
p17
.5.
b,T
p20
.c,
Tp
25.
This content downloaded from 193.50.65.21 on Mon, 20 Jan 2014 10:03:51 AMAll use subject to JSTOR Terms and Conditions

Bocquet-Appel and Degioanni Neanderthal Demographic Estimates S211
metabolic cost of an adult Neanderthal is very high (3,500–5,000 kcal/d vs. 2,150–2,400 kcal/d for a male modern human;Churchill 2007; Sorensen and Leonard 2001; Steegman, Cerny,and Holliday 2002). Assuming a similar distribution of nu-trients between Neanderthals and modern humans, food in-take per capita for Neanderthals would have required almosttwice the mass of ungulate meat as that consumed by modernhumans. Mechanically, given similar natural hunting condi-tions, this level of ungulate consumption implies that theNeanderthal population density was half that of modern hu-mans. The demographic instability of this metapopulation ofspecialized hunters, which was small on average, and the var-iation of its geographical area of expansion and fragmentation,should help to understand why it stagnated technologically(Bocquet-Appel and Tuffreau 2009) and probably also socially(see the array of Hayden 2012), as it spent most of its evo-lutionary time moldering in the depths of a Boserupian de-mographic trap.
Measuring the acquisition or lack of acquisition by Ne-anderthals of a modern form of human behavior—that is,the ability, usually shown in modern humans, to express avery wide range of cognitive responses to contrasting so-cionatural situations—by simply comparing lists of archae-ological cultural items between the two groups is not anappropriate approach (see Shea 2011). If one of the meta-populations (the Neanderthals) remained largely within theconfines of the experience of the Boserupian traps men-tioned above while the other (modern human), numberingseveral million, was able to experience the African and Eur-asian population expansion, then comparing their lists ofcultural items at a point of fortuitous spatiotemporal contact(say in the Perigord at 40–35 kyr) does not inform us abouttheir different biological cognitive potential. The differencesbetween these lists will mirror those of the amplitudes ofthe socionatural experiences of these contemporaneousmetapopulations whose demographic numbers varied by afactor of 100 and perhaps even more. The cause of thecultural limitation of the Neanderthal metapopulation com-pared with that of modern humans may well have residedin its small numbers alone.
Acknowledgments
We thank the organizers and the Wenner-Gren Foundationfor taking the opportunity to participate in this very stimu-lating conference, Christine Verna for her comments, and twoinsightful anonymous reviewers. The figures were producedby Daniele Fouchier, Nathan Bocquet-Appel, and StephaneRenault.
References CitedAiello, Leslie C., and Peter Wheeler. 2003. Neanderthal thermoregulation and
the glacial climate. In Neanderthals and modern humans in the Europeanlandscape during the last glaciation: archaeological results of the Stage 3 project.
Tjeerd H. van Andel and William Davies, eds. Pp. 147–166. Cambridge:McDonald Institute.
Belle, Elise M. S., Uma Ramakrishnan, Joanna L. Mountain, and Guido Bar-bujani. 2006. Serial coalescent simulations suggest a weak genealogical re-lationship between Etruscans and modern Tuscans. Proceedings of the Na-tional Academy of Sciences of the USA 103:8012–8017.
Bermudez de Castro, Jose Maria, Maria Martinon-Torres, Marina Lozano,Susana Sarmiento, and Ana Muela. 2004. Paleodemography of the Ata-puerca-Sima de los Huesos hominin sample: a revision and new approachesto the paleodemography of the European Middle Pleistocene population.Journal of Anthropological Research 60(1):5–26.
Bermudez de Castro, Jose Maria, and Marıa Elena Nicolas. 1997. Palaeode-mography of the Atapuerca-SH Middle Pleistocene hominid sample. Journalof Human Evolution 33(2/3):333–355.
Bocquet, Jean-Pierre, and Claude Masset. 1977. Estimateurs en paleodemo-graphie. L’Homme 17:65–90.
———. 1982. Farewell to paleodemography. Journal of Human Evolution 11:321–333.
———. 1985. Paleodemography: resurrection or ghost? matters of moment.Journal of Human Evolution 14:107–111.
Bocquet-Appel, Jean-Pierre. 1982. Une esquisse de quelques mecanismes de-mographiques au paleolithique. In 1er Congres international de paleontologiehumaine. Jean Piveteau and Henry de Lumley, eds. Pp. 971–992. Paris:Institute de paleontologie humaine.
———. 1986. Small populations: demography and paleoanthropological in-ferences. Journal of Human Evolution 14:683–691.
———. 2002. Paleoanthropological traces of Neolithic demographic transi-tion. Current Anthropology 43:638–650.
———. 2008. Explaining the Neolithic demographic transition. In The Ne-olithic demographic transition and its consequences. Jean-Pierre Bocquet-Appel and Ofer Bar-Yosef, eds. Pp. 35–56. Dordrecht: Springer.
Bocquet-Appel, Jean-Pierre, and Juan Luis Arsuaga. 1999. Age distributionsof hominid samples at Atapuerca (SH) and Krapina indicate accumulationby catastrophe. Journal of Archaeological Science 26(3):327–338.
Bocquet-Appel, Jean-Pierre, and Jean-Noel Bacro. 2008. Estimation of an agedistribution with its confidence intervals using an iterative Bayesian pro-cedure and a bootstrap sampling approach. In Recent advances in paleo-demography: data, techniques, patterns. Jean-Pierre Bocquet-Appel, ed. Pp.63–82. New York: Springer.
Bocquet-Appel, Jean-Pierre, Pierre-Yves Demars, Lorette Noiret, and DmitryDobrowsky. 2005. Estimates of Upper Palaeolithic meta-population size inEurope from archaeological data. Journal of Archaeological Science 32:1656–1668.
Bocquet-Appel, Jean-Pierre, and Alain Tuffreau. 2009. Technological responsesof Neanderthals to macroclimatic variations (240,000–40,000 BP). HumanBiology 81:287–307.
Boserup, Ester. 1965. The conditions of agricultural growth. London: Allen &Unwin.
Briggs, Adrian W., Jeffrey M. Good, Richard E. Green, Johannes Krause,Tomislav Maricic, Udo Stenzel, Carles Lalueza-Fox, et al. 2009. Targetedretrieval and analysis of five Neandertal mtDNA genomes. Science325(5938):318–321.
Bruner, Emiliano, and Giorgio Manzi. 2006. Saccopastore 1: the earliest Ne-anderthal? a new look at an old cranium. In Neanderthals revisited: newapproaches and perspectives. Harvati Katerina and Terry Harrison, eds. Pp.23–36. Dordrecht: Springer.
Caspari, Rachel, and Sang-Hee Lee. 2004. Older age becomes common latein human evolution. Proceedings of the National Academy of Sciences of theUSA 101(30):10895–10900.
———. 2005a. Are OY ratios invariant? a reply to Hawkes and O’Connell.Journal of Human Evolution 49:654–659.
———. 2005b. Taxonomy and longevity: a reply to Minichillo. Journal ofHuman Evolution 49:646–649.
———. 2006. Is human longevity a consequence of cultural change or modernbiology? American Journal of Physical Anthropology 129(4):512–517.
Caussinus, Henri, and Daniel Courgeau. 2010. Estimer l’age sans le mesurer.Population 65(1):117–146.
Churchill, Steven E. 2007. Bioenergetic perspectives on Neandertal thermo-regulatory and activity budgets. In Neanderthals revisited: new approachesand perspectives. Harvati Katerina and Terry Harrison, eds. Pp. 113–133.Dordrecht: Springer.
Coale, Ansley J., Paul George Demeny, and Barbara Vaughan. 1983. Regional
This content downloaded from 193.50.65.21 on Mon, 20 Jan 2014 10:03:51 AMAll use subject to JSTOR Terms and Conditions

S212 Current Anthropology Volume 54, Supplement 8, December 2013
model life tables and stable populations. Princeton, NJ: Princeton UniversityPress.
Conarda, Nicholas J., Michael Bolusc, and Susanne C. Munzeld. 2012. MiddlePaleolithic land use, spatial organization and settlement intensity in theSwabian Jura, southwestern Germany. Quaternary International 247:236–245.
Courtenay, Jackie, and Gigi Santow. 1989. Mortality of wild and captive chim-panzees. Folia Primatologia 52:67–177.
Crow, James F., and Motoo Kimura. 1970. An introduction to population ge-netics theory. New York: Harper & Row.
Cutler, Richard G. 1975. Evolution of human longevity and the genetic com-plexity governing aging rate. Proceedings of the National Academy of Sciencesof the USA 72(11):4664–4668.
Degioanni, Anna, Virginie Fabre, and Silvana Condemi. 2011. Genetique etpaleoanthropologie: deux approches pour un dialogue autour des Nean-dertaliens. Bulletins et Memoires de la Societe d’anthropologie de Paris 23(1):1–18.
d’Errico, Francesco, Maria Fernanda Sanchez-Goni, and Marian Vanhaeren2006. L’impact de la variabilite climatique rapide des OIS 3–2 sur le peu-plement de l’Europe. In L’homme face au climat. Paris: Odile Jacob.
Fabre, Virginie, Silvana Condemi, and Anna Degioanni. 2009. Genetic evi-dence of geographical groups among Neanderthals. PLoS ONE 4(4):e5151.
Felsenstein, Joseph. 1971. Inbreeding and variance effective numbers in pop-ulations with over-lapping generations. Genetics 168:581–597.
Finlayson, Clive, Darren A. Fa, Geraldine Finlayson, Francisco Giles Pacheco,Jose Marıa Gutierrez-Lopez, and Antonio Santiago Perez. 2001. Use of thelandscape by humans from the Middle Palaeolithic to the Neolithic: thecase of the northern shore of the Strait of Gibraltar. Almoraima 25:65–71.
Fisher, Ronald Aylmer. 1930. The genetic theory of natural selection. Oxford:Oxford University Press.
Frenzel, Burkhard. 1985. Die Umwelt des Menschen im Eiszeitalter. Quartar35/36:7–33.
Gamble, Clive. 1987. Man the shoveler: alternative models for Middle Pleis-tocene colonization in northern latitudes. In The Pleistocene old world: re-gional perspectives. Olga Soffer, ed. Pp. 81–98. New York: Plenum.
———. 1999. The Palaeolithic societies of Europe. Cambridge: Cambridge Uni-versity Press.
Ghirotto, Silvia, Francesca Tassi, Andrea Benazzo, and Guido Barbujani. 2011.No evidence of Neandertal admixture in the mitochondrial genomes ofearly European modern humans and contemporary Europeans. AmericanJournal of Physical Anthropology 146(2):242–252.
Gomez-Uchida, Daniel, Friso P. Palstra, Thomas W. Knight, and Daniel E.Ruzzante. 2013. Contemporary effective population and metapopulationsize (Ne and meta-Ne): comparison among three salmonids inhabiting afragmented system and differing in gene flow and its asymmetries. Ecologyand Evolution 3(3):569–580.
Goux, Jean-Michel. 1982. L’estimation du rapport de masculinite et de savariance en fonction de l’effectif. In 1er Congres international de paleontologiehumaine. Jean Piveteau and Henry de Lumley, eds. Pp. 993–996. Paris:Institute de paleontologie humaine.
Green, Richard E., Johannes Krause, Adrian W. Briggs, Tolmislav Maricic,Udo Stenzel, Martin Kircher, Nick Patterson, et al. 2010. A draft sequenceof the Neandertal genome. Science 328:710–722.
Green, Richard E., Johannes Krause, Susan E. Ptak, Adrian W. Briggs, MichaelT. Ronan, Jan F. Simons, Lei Du, et al. 2006. Analysis of one million basepairs of Neanderthal DNA. Nature 444(7117):330–336.
Green, Richard E., Anna-Sapfo Malaspinas, Johannes Krause, Adrian W.Briggs, Philip L. F. Johnson, Caroline Uhler, Matthias Meyer, et al. 2008.A complete Neandertal mitochondrial genome sequence determined byhigh-throughput sequencing. Cell 134:416–426.
Guatelli-Steinberg, Debbie. 2009. Recent studies of dental development inNeandertals: implications for Neandertal life histories. Evolutionary An-thropology 18:9–20.
Guatelli-Steinberg, Debbie, Donald J. Reid, Thomas A. Bishop, and ClarkSpencer Larsen. 2005. Anterior tooth growth periods in Neandertals werecomparable to those of modern humans. Proceedings of the National Acad-emy of Sciences of the USA 102(40):14197–14202.
Hammer, Michael F., and Stephen L. Zegura. 1996. The role of the Y chro-mosome in human evolutionary studies. Evolutionary Anthropology 5:116–134.
Harding, Rosalind M., Stephanie Malia Fullerton, Robert C. Griffiths, Jac-quelyn Bond, Martin J. Cox, Julie A. Schneider, Danielle S. Moulin, and J.
B. Clegg. 1997. Archaic African and Asian lineages in the genetic ancestryof modern humans. American Journal of Human Genetics 60:772–789.
Hawk, John. 2008. From genes to numbers: effective population sizes in hu-man evolution. In Recent advances in palaeodemography. Jean-Pierre Boc-quet-Appel, ed. Pp. 9–30. Dordrecht: Springer.
Hawkes, Kristen. 2006. Life history theory and human evolution: a chronicleof ideas and findings. In The evolution of human life history. Kristen Hawkesand Richard R. Paine, eds. Pp. 45–93. Oxford: Currey.
Hayden, Brian. 2012. Neandertal social structure? Oxford Journal of Archae-ology 31(1):1–26.
Henry, Amanda G., Alison S. Brooks, and Dolores R. Piperno. 2011. Micro-fossils in calculus demonstrate consumption of plant and cooked foods inNeanderthal diets (Shanidar III, Iraq; Spy I and II, Belgium). Proceedingsof the National Academy of Sciences of the USA 108(2):486–491.
Henry, Louis, and Yves Blayo. 1975. La population de la France de 1740 a1860. Population 30:71–122.
Hill, Kim, Christophe Boesch, Jane Goodall, Anne Pusey, Jennifer Williams,and Richard Wrangham. 2001. Mortality rates among wild chimpanzees.Journal of Human Evolution 40:437–450.
Hill, Kim Ronald, and A. Magdalena Hurtado. 1996. Ache life history: theecology and demography of a foraging people. New York: Aldine.
Hill, William G. 1972. Effective size of populations with overlapping gener-ations. Theoretical Population Biology 3:278–289.
Hofman, Michel A. 1993. Encephalization and the evolution of longevity inmammals. Journal of Evolutionary Biology 6:209–227.
Holliday, Trenton W. 1997. Body proportions in Late Pleistocene Europe andmodern human origins. Journal of Human Evolution 32:423–447.
Hoppa, Robert D., and James W. Vaupel. 2002. Paleodemography: age distri-butions from skeletal samples. Cambridge: Cambridge University Press.
Howell, Nancy. 1979. Demography of the Dobe !Kung. New York: AcademicPress.
Hublin, Jean Jacques. 1998. Climatic changes, paleogeography, and the evo-lution of the Neandertals. In Neandertals and modern humans in westernAsia. Akazawa Takeru, Kenichi Aoki, and Ofer Bar-Yosef, eds. Pp. 295–310.New York: Plenum.
Hublin, Jean Jacques, and Wil Roebroeks. 2009. Ebb and flow or regionalextinctions? on the character of Neandertal occupation of northern envi-ronments. Comptes rendus Palevol 8(5):503–509.
Isler, Karin, Christopher E. Kirk, Joseph M. A. Miller, Gene A. Albrecht, BruceR. Gelvin, and Robert D. Martin. 2008. Endocranial volumes of primatespecies: scaling analyses using a comprehensive and reliable data set. Journalof Human Evolution 55:967–978.
Jannetta, Ann Bowman, and Samuel H. Preston. 1991. Two centuries of mor-tality change in central Japan: the evidence from a temple death register.Population Studies 45:417–436.
Kendal, Jeremy, Jamshid J. Tehrani, and John Odling-Smee. 2011. Humanniche construction in interdisciplinary focus. Philosophical Transaction ofthe Royal Society B 366:785–792.
Krause, Johannes, Ludovic Orlando, David Serre, Bence Viola, Kay Prufer,Michael P. Richards, Jean-Jacques Hublin, Catherine Hanni, Anatoly P.Derevianko, and Svante Paabo. 2007. Neanderthals in central Asia andSiberia. Nature 449(7164):902–904.
Kremer, Michael. 1993. Population growth and technological change: onemillion BC to 1990. Quarterly Journal of Economics 108(3):681–716.
Krings, Matthias, Cristian Capelli, Frank Tschentscher, Helga Geisert, SonjaMeyer, Arndt von Haeseler, Karl Grossschmidt, Goran Possnert, Maja Pau-novic, and Svante Paabo. 2000. A view of Neandertal genetic diversity.Nature Genetics 26:144–146.
Krings, Matthias, Anne Stone, Ralf W. Schmitz, Heike Krainitzki, Mark Stone-king, and Svante Paabo. 1997. Neandertal DNA sequences and the originof modern humans. Cell 90:19–30.
Kuhn, Steven L., and Mary C. Stiner. 2006. What’s a mother to do? a hy-pothesis about the division of labor among Neandertals and modern hu-mans in Eurasia. Current Anthropology 47(6):953–980.
Kukla, George J., Michael L. Bender, Jacques-Louis de Beaulieu, Gerard Bond,Wallace S. Broecker, Piet Cleveringa, Joyce E. Gavin, et al. 2002. Last in-terglacial climates. Quaternary Research 58(1):2–13.
Kuznets, Simon. 1973. Modern economic growth: findings and reflections.American Economic Review 63(3):247–258.
Lalueza-Fox, Carles, Maria L. Sampietro, David Caramelli, Yvonne Puder,Martina Lari, Francesc Calafell, Cayetana Martinez-Maza, et al. 2005. Nean-dertal evolutionary genetics: mitochondrial DNA data from the Iberianpeninsula. Molecular Biology and Evolution 22:1077–1081.
This content downloaded from 193.50.65.21 on Mon, 20 Jan 2014 10:03:51 AMAll use subject to JSTOR Terms and Conditions

Bocquet-Appel and Degioanni Neanderthal Demographic Estimates S213
Lucy, Dave, Robert. G. Ackroyd, and A. Mark. Pollard. 2002. Non-parametriccalibration for age estimation. Applied Statistics 52(2):185–196.
Lucy, Dave, Robert G. Ackroyd, A. Mark. Pollard, and Tore Solheim. 1996.A Bayesian approach to adult human age estimation from dental obser-vations by Johanson’s age changes. Journal of Forensic Sciences 41:189–194.
Mann, Alan. 1968. The paleodemography of Australopithecus. PhD disserta-tion, University of California, Berkeley.
Masset, Claude. 1973. La demographie des populations inhumees: essai depaleodemographie. L’Homme 13:95–131.
Mellars, Paul, and Jennifer C. French. 2011. Tenfold population increase inwestern Europe at the Neandertal-to-modern human transition. Science 333:623–627.
Miles, A. E. W. 1963. The dentition in the assessment of individual age inskeletal material. In Dental anthropology. Don Brothwell, ed. Pp. 191–209.Oxford: Pergamon.
———. 2001. The Miles method of assessing age from tooth wear revisited.Journal of Archeological Science 28:973–982.
Nei, Masatoshi, and Dan Graur. 1984. Extent of protein polymorphism andthe neutral mutation theory. Evolutionary Biology 27:73–118.
Neubauer, Simon, and Jean-Jacques Hublin. 2012. The evolution of humanbrain development. Evolutionary Biology 39(4):568–586.
Noonan, James P., Graham Coop, Sridhar Kudaravalli, Doug Smith, JohannesKrause, Joe Alessi, Feng Chen, et al. 2006. Sequencing and analysis ofNeanderthal genomic DNA. Science 314(5802):1113–1118.
Nunney, Leonard. 1993. The influence of mating system and overlappinggenerations on effective population size. Evolution 47(5):1329–1341.
Nunney, Leonard, and Diane. R. Elam. 1994. Estimating the effective popu-lation size of conserved populations. Conservation Biology (8):175–184.
Ovchinnikov, Iogor V., and Olga I. Kholina. 2010. Genome digging: insightinto the mitochondrial genome of Homo. PLoS ONE 5(12):e14278.
Patou-Mathis, Marie Helene. 2000. Neanderthal subsistence behaviours inEurope. International Journal of Osteoarchaeology 10(5):379–395.
Powell Adam, Stephen Shennan, and Mark G. Thomas. 2009. Late Pleistocenedemography and the appearance of modern human behavior. Science 324:1298–1301.
Ramirez-Rossi, Fernando V., and Jose Maria Bermudez de Castro. 2004. Sur-prisingly rapid growth in Neanderthals. Nature 428:936–939.
Rawlins, Richard G., and Matt J. Kessler. 1987. Demography of the free rangingCayo Santiago Macaques (1976–1983). In The Cayo Santiago Macaques.Richard G. Rawlins and Matt J. Kessler, eds. Pp. 48–72. Albany: StateUniversity of New York Press.
Ray, Nicolas. 2003. Modelisation de la demographie des populations humainesprehistoriques a l’aide de donnees environnementales et genetiques. PhDdissertation, Universite de Geneve.
Richard, Alison F. 1985. Primates in nature. New York: W. H. Freeman.Richards, Michael P., and Eric Trinkaus. 2009. Isotopic evidence for the diets
of European Neanderthals and early modern humans. Proceedings of theNational Academy of Science of the USA 1064(38):16034–16039.
Richerson, Peter J., Robert Boyd, and Robert L. Bettinger. 2009. Culturalinnovations and demographic changes. Human Biology 81(2):211–235.
Rogers, Alan R., and Lynn B. Jorde. 1995. Genetic evidence on modem humanorigins. Human Biology 67:1–36.
Ruff, Christopher B., Erik Trinkaus, and Trenton W. Holliday. 1997. Bodymass and encephalization in Pleistocene Homo. Nature 387:173–176.
Sacher, George A. 1959. Relation of lifespan to brain weight and body weightin mammals. In The lifespan of animals. Gordon Ethelbert Ward Wolsten-holme and Cecilia Mary O’Connor, eds. Pp. 115–133. CIBA FoundationColloquia on Ageing, vol. 5. Boston: Little-Brown.
———. 1975. Maturation and longevity in relation to cranial capacity inhominid evolution. In Primate functional morphology and evolution. RussellTuttle, ed. Pp. 417–441. The Hague: Mouton.
Sacher, George A., and Everett F. Staffeldt. 1974. Relation of gestation timeto brain weight for placental mammals: implications for the theory ofvertebrate growth. American Naturalist 108:593–615.
Sanchez Goni, Marıa Fernanda, Amaelle Landais, William J. Fletcher, FilipaNaughton, Stephanie Desprat, and Josette Duprat. 2008. Contrasting im-pacts of Dansgaard-Oeschger events over a western European latitudinal
transect modulated by orbital parameters. Quaternary Science Reviews27(11/12):1136–1151.
Serbezov, Dimitar, Per Erik Jorde, Louis Bernatchez, Esben Moland Olsen,and Leif Asbjørn Vøllestad. 2012. Life history and demographic determi-nants of effective/census size ratios as exemplified by brown trout (Salmotrutta). Evolutionary Applications 5:607–618.
Shea, John J. 2011. Neanderthal news: extinct species exhibits variability. Evo-lutionary Anthropology 20(5):198–200.
Shennan, Stephen. 2001. Demography and cultural innovation: a model andits implications for the emergence of modern human culture. CambridgeArchaeological Journal 11:5–16.
Simon, Julian. L. 1977. The economics of population growth. Princeton, NJ:Princeton University Press.
Smith, Tanya M., Michel Toussaint, Donald J. Reid, Anthony J. Olejniczak,and Jean-Jacques Hublin. 2007. Rapid dental development in a MiddlePaleolithic Belgian Neanderthal. Proceedings of the National Academy ofSciences of the USA 104(51):20220–20225.
Sorensen, M. V., and W. R. Leonard. 2001. Neandertal energetics and foragingefficiency. Journal of Human Evolution 40:483–495.
Steegmann, A. Theodore, Jr., Frank J. Cerny, and Trenton W. Holliday. 2002.Neandertal cold adaptation: Physiological and energetic factors. AmericanJournal of Human Biology 14:566–583.
Takahata, Naoyuki. 1993. Allelic genealogy and human evolution. MolecularBiology and Evolution 10:2–22.
Takahata, Naoyuki, Yoko Satta, and Jan Klein. 1995. Divergence time andpopulation size in the lineage leading to modem humans. Theoretical Pop-ulation Biology 48:198–221.
Teleki, Geza, Edward E. Hunt, and John-Henry Pfifferling. 1976. Demographicobservations (1963–1973) on the chimpanzees of Gombe National Park,Tanzania. Journal of Human Evolution 5:559–598.
Trinkaus, Erik. 1995. Neanderthal mortality patterns. Journal of ArchaeologicalScience 22:121–144.
———. 2011. Late Pleistocene adult mortality patterns and modern humanestablishment. Proceedings of the National Academy of Sciences of the USA108(4):1267–1271.
Trinkaus, Erik, and Robert L. Tompkins. 1990. The Neandertal life cycle: thepossibility, probability, and perceptibility of contrasts with recent humans.In Primate life history and Evolution. C. Jean De Rousseau, ed. Pp. 153–180. Monographs in Primatology 14. New York: Wiley-Liss.
van Andel, Tjeerd H., William Davies, and Bernard Weninger. 2003. Thehuman presence in Europe during the Last Glacial period. 1. Human mi-grations and the changing climate. In Neanderthals and modern humans inthe European landscape during the last glaciation: archaeological results of theStage 3 project. Tjeerd H. van Andel and William Davies, eds. Pp. 31–56.Cambridge: McDonald Institute for Archaeological Research.
van Andel, Tjeerd H., and P. Chronis Tzedakis. 1996. Palaeolithic landscapesof Europe and environs: 150,000–25,000 years ago: an overview. QuaternaryScience Reviews 15:481–500.
Whiteley, Andrew R., Jason A. Coombs, Mark Hudy, Zachary Robinson, KeithH. Nislow, and Benjamin H. Letcher. 2012. Sampling strategies for esti-mating brook trout effective population size. Conservation Genetics 13:625–627.
Wilson, Allan C., Rebecca L. Cann, Steven M. Carr, Matthew George, Ulf B.Gyllensten, Kathleen M. Helm-Bychowski, Russell G. Higuchi, et al. 1985.Mitochondrial DNA and two perspectives on evolutionary genetics. Bio-logical Journal of the Linnean Society 26:375–400.
Wood, James W. 1987. The genetic demography of the Gainj of Papua NewGuinea. 2. Determinates of effective population size. American Naturalist129(2):165–187.
———. 1998. A theory of pre-industrial population dynamics: demography,economy, and well-being in Malthusian systems. Current Anthropology 39:99–135.
Wright, Sewall. 1931. Evolution in Mendelian populations. Genetics 16:97–159.
———. 1938. Size of population and breeding structure in relation to evo-lution. Science 87:430–431.
This content downloaded from 193.50.65.21 on Mon, 20 Jan 2014 10:03:51 AMAll use subject to JSTOR Terms and Conditions