Key Selection Attributes and Demographic Effects
12
ISSN: 2278-3369 International Journal of Advances in Management and Economics Available online at www.managementjournal.info RESEARCH ARTICLE Thomas Anning-Dorson |Sep.-Oct. 2013 | Vol.2 | Issue 5|132-143 132 Shop Selection at the Mall: Key Selection Attributes and Demographic Effects Thomas Anning-Dorson* Dept. of Marketing and Customer Management, University of Ghana Business School, Ghana. *Corresponding Author:Email: [email protected] Abstract This study intends to investigate shop selection attributes at the mall and their demographic effect. The study adopts the quantitative approach and employs the survey method as its data collection vehicle. Exploratory factor analysis is used to ascertain the key shop selection attributes. The study reveals five (5) key shop attributes that attract shoppers. The findings suggest that display had the most favorable influence on the store selection attribute followed by store personnel, store price, physical store and merchandise quality. There is also a significant relationship between the shoppers’ demographic variables and their store selection attributes. Retailers at the mall can segment their markets based on the demographic features of their target markets as the study found a strong relationships with shop selection variables and demographic idiosyncrasies. This study provides empirical support for the mall and shopping behavior literature from the perspectives of shopping behavior as it shows the key shop selection variables and how they are affected by shoppers characteristics. Keywords: Shop selection, Shopper behavior, Ghana, Shoppers’ demography. Introduction Understanding how preferences vary with consumer factors is a key element in developing successful retail marketing strategies. The varying needs and wants of shoppers coupled with their demographic and psychographic dynamics immensely influence their selection of a retail outlet. Since Tauber’s [1] study on “why do people shop”, efforts have been made by other scholars to find out the general motives for shopping. Since, then, shopping behaviour has emerged as one of the key constructs of contemporary research in retail marketing and consumer behaviour, discussed in numerous empirical [2,3] and conceptual scholarly articles [4], doctoral dissertations [5], as well as marketing textbooks [6]. In recent times scholars such as Hunter [7]; Soars [8]; Ali and Kapoor [9]; and Beynon [10] have dealt well with the subject shopping in different contexts which are largely developed. The choice the shopper makes is of significant interest to retailers and manufacturers as these decisions eventually inform their marketing and promotion strategies. Kotler and Keller [11] opine that, such information is critical in formulation of marketing strategy and retailing planning. In the marketing literature, it has been revealed that, many factors affect shoppers' attitude at the retail environment and may include individual and psychological characteristics. These factors eventually inform the choice of retail outlet that will be eventually selected amidst the marketer’s promotional strategies. Previous studies indicate that people have various motivations for shopping: some for a purely utilitarian purpose, others for hedonistic reasons [12-15].It must however be indicated that these motivations may be affected by contextual factors as most of the studies are done in the developed context. These various motivations for shopping trip is defined by a consumer may affect his/her behaviour. These motivations may lead to the specific attributes sought before selecting a shop especially in the midst of myriad of shops which is normally found in a mall. The existing literature has identified that consumer decision making is likely to be related to a number of consumer traits such as, age, gender, social class, educational level, income, lifestyle and life-stage-all of which can exert an influence over store choice [16]. However, there is very limited literature focusing on store choice within the mall environment which is a collection of stores. It has been acknowledged that one area of interest to the supermarket chains is still
-
Upload
khangminh22 -
Category
Documents
-
view
0 -
download
0
Transcript of Key Selection Attributes and Demographic Effects

ISSN: 2278-3369 International Journal of Advances in Management and Economics
Available online at www.managementjournal.info RESEARCH ARTICLE
Thomas Anning-Dorson |Sep.-Oct. 2013 | Vol.2 | Issue 5|132-143 132
Shop Selection at the Mall: Key Selection Attributes and Demographic
Effects
Thomas Anning-Dorson*
Dept. of Marketing and Customer Management, University of Ghana Business School, Ghana.
*Corresponding Author:Email: [email protected]
Abstract
This study intends to investigate shop selection attributes at the mall and their demographic effect. The study
adopts the quantitative approach and employs the survey method as its data collection vehicle. Exploratory factor
analysis is used to ascertain the key shop selection attributes. The study reveals five (5) key shop attributes that
attract shoppers. The findings suggest that display had the most favorable influence on the store selection attribute
followed by store personnel, store price, physical store and merchandise quality. There is also a significant
relationship between the shoppers’ demographic variables and their store selection attributes. Retailers at the mall
can segment their markets based on the demographic features of their target markets as the study found a strong
relationships with shop selection variables and demographic idiosyncrasies. This study provides empirical support
for the mall and shopping behavior literature from the perspectives of shopping behavior as it shows the key shop
selection variables and how they are affected by shoppers characteristics.
Keywords: Shop selection, Shopper behavior, Ghana, Shoppers’ demography.
Introduction
Understanding how preferences vary with
consumer factors is a key element in developing
successful retail marketing strategies. The
varying needs and wants of shoppers coupled with
their demographic and psychographic dynamics
immensely influence their selection of a retail
outlet. Since Tauber’s [1] study on “why do people
shop”, efforts have been made by other scholars
to find out the general motives for shopping.
Since, then, shopping behaviour has emerged as
one of the key constructs of contemporary
research in retail marketing and consumer
behaviour, discussed in numerous empirical [2,3]
and conceptual scholarly articles [4], doctoral
dissertations [5], as well as marketing textbooks
[6]. In recent times scholars such as Hunter [7];
Soars [8]; Ali and Kapoor [9]; and Beynon [10]
have dealt well with the subject shopping in
different contexts which are largely developed.
The choice the shopper makes is of significant
interest to retailers and manufacturers as these
decisions eventually inform their marketing and
promotion strategies. Kotler and Keller [11] opine
that, such information is critical in formulation of
marketing strategy and retailing planning. In the
marketing literature, it has been revealed that,
many factors affect shoppers' attitude at the retail
environment and may include individual and
psychological characteristics. These factors
eventually inform the choice of retail outlet that
will be eventually selected amidst the marketer’s
promotional strategies.
Previous studies indicate that people have various
motivations for shopping: some for a purely
utilitarian purpose, others for hedonistic reasons
[12-15].It must however be indicated that these
motivations may be affected by contextual factors
as most of the studies are done in the developed
context. These various motivations for shopping
trip is defined by a consumer may affect his/her
behaviour. These motivations may lead to the
specific attributes sought before selecting a shop
especially in the midst of myriad of shops which is
normally found in a mall.
The existing literature has identified that
consumer decision making is likely to be related
to a number of consumer traits such as, age,
gender, social class, educational level, income,
lifestyle and life-stage-all of which can exert an
influence over store choice [16]. However, there is
very limited literature focusing on store choice
within the mall environment which is a collection
of stores. It has been acknowledged that one area
of interest to the supermarket chains is still

Available online at www.managementjournal.info
Thomas Anning-Dorson |Sep.-Oct. 2013 | Vol.2 | Issue 5|132-143 133
whether these consumer dynamics influence
shoppers’ choice of a store within the mall.
Consumer behaviour study has been said by
Tauber [1] and emphasized by Anning-Dorson et
al. (2013) to be consisting of three distinctive
activities: shopping, buying, and consuming.
However, Ahmed et al, [17] postulated that, much
less empirical studies have concentrated on the
determinants of consuming and shopping
behaviour under which the store selection falls.
This study therefore provides empirical support
for the mall and shopping behaviour literature
from the perspectives of shopping behaviour. The
objective of the study is therefore to find out the
shop selection attribute shoppers consider most at
the mall and how these selection attributes are
influenced by the demographic variables of the
shopper.
Literature Review and Hypothesis
Shop Selection Attributes
Retail store attributes affect store choice and
purchases [18, 19]. Store attributes are considered
to be the evaluative criteria consumers have
toward the store [20]. Accordingly, the importance
of various store attributes varies by store format
and customer base [21]. Store attributes are
viewed as part of the overall image of a store [22].
Store attributes can be defined as the ‘‘summation
of all attributes of a store as perceived by the
shoppers through their experience of that store’’
[23].
Existing literature has presented various and
varying conceptualizations of store attributes. For
example, Lindquist [24] suggests nine key
attributes: merchandise; services; clientele;
physical facilities; convenience; promotion; store
ambience; institutional factors; post-transaction
satisfaction. Ghosh [25] introduces eight
elements: locations; merchandise; store
atmosphere; customer services; price; advertising;
personal selling; sales incentive programs. Koo
[26] proposes seven components: store
atmosphere; location; convenient facilities; value;
employee services; after sale services;
merchandising. In addition, the results of a study
conducted by Nguyen and Nguyen [27] of
supermarkets in Vietnam indicate that
supermarket atmosphere, locations, and
convenient facilities were conceptually distinct
but empirically unidimensional. The lack of
consistency in the literature further lay credence
to the importance of further developing the
concept of shop selecting attributes.
According to Hu and Jasper [28], the central focus
of a store is the point of sale. The sales
transaction that occurs here – the exchange
between salesperson and customer – is the
defining social moment in a store’s existence. The
quality of this social encounter is determined by
how well a salesperson can interpret customers’
needs and interact in a congenial manner. An
enhanced interaction between the sales associate
and customer is referred to as personalization of
service [28]. Personalization is characterized by
an employee’s politeness and courtesy, attempts
to get to know customers as individuals, and
engagement in friendly conversation [29]. Mittal
and Lassar [29] found that personalization
significantly influences customer evaluations of
service quality; and that consumers seek familiar,
friendly service providers and retail salespeople.
Ko and Kincade [30] posit that, friendly personnel
distinguish one store from other stores.
Ko and Kincade [30] asserted that, price is a
critical strategic weapon in a competitive
environment. Leszczyc and Timmermans [31]
found that consumers tended to choose variety of
stores, and overall preferred to shop at specialty
stores for price reasons. Furthermore, consumers
were increasingly likely to select a single store
when prices were lower, parking costs were less,
better assortments were offered, travel time was
reduced, and checkout lanes were shorter [19]. All
of the above Timmermans [18] suggest that the
shopper is always looking for value for money and
would certainly consider price of a store as a
major store selection attribute.
Among the nine key store attributes that
Lindquist [24] studied, price happened to be one
of the top three attributes that influence retail
store choice of the shopper. In recent studies most
scholars have found price as a major store
selection attribute of the retail format [32-34].
A market survey showed that 26 percent of
consumers are often enticed by window displays
to make a purchase; 15 percent of consumers use
seasonal product displays (e.g. Christmas,
Valentine’s Day) to reach purchase decisions [35].
In-store graphics contain social cues which convey
such a compelling message that the consumer will
feel tantalized enough to step into a store and
make a purchase [36].
The ability to modify in-store behaviour through
the creation of an atmosphere is recognized by
many retail executives and retail organizations
[37]. In a recent review of 60 experiments that
manipulated portions of a store’s complex
atmosphere, Turley and Milliman [38] note that
each of these studies found some statistically
significant relationship between atmospherics and

Available online at www.managementjournal.info
Thomas Anning-Dorson |Sep.-Oct. 2013 | Vol.2 | Issue 5|132-143 134
shopping behaviour. Based on this review they
conclude that the effect of the retail environment
on consumer behaviour is both strong and robust,
and that it can be shaped to increase the
likelihood of eliciting particular behaviours from
shoppers.
Producing high quality products within a
reasonable lead time is necessary, but not
sufficient, in today’s fiercely competitive market
[39]. Providing quality merchandise in a
convenient and friendly atmosphere is also
needed [7]. Retailers try to improve sales and
develop better store image through, convenient
store layout quality merchandise and the right
merchandise type for target market [30].
Convenient store layout is also enhanced by
reduction in inventory size [30]. Well spaced
merchandise and price-marked shelves or
products allow consumers to find products easily
[40]. Inventory management systems can be
combined with graphics packages to provide
retailers with visual displays of inventory levels
and placements [30]. In the study of Pualins and
Geistfeld [19], merchandise quality and display
are seen as one of the many preference set that
are likely to influence the shopper at the retail
store.
Shoppers’ Demography and Shopping
Behaviour
Several researchers have posited that
demographic characteristics of customers affect
their purchasing behavior [16,41,42], however,
this relationship is currently considered unclear
as research findings have been found to be
controversial [16,20,43].With the aim of assessing
the demographic idiosyncrasies in respect of shop
selection attribute, the study tested the
association of sex, age, educational status,
employment status, marital status and monthly
income against the various shop selection
attribute that were identified through exploratory
factor analysis.
Researchers have investigated how these
individual idiosyncrasies affect consumer
decision-making and market behaviour. For
example, when making decisions about visiting a
fine restaurant, susceptibility to spousal influence
is an important determinant in a consumer’s
decision-making process. Research has also
showed variations of susceptibility to
interpersonal influences across different
consumer demography [44].
Demographic characteristics of customers such as
age, income level and education affect store
choice. Forsythe and Bailey [45] found that age,
marital status, occupational status, and consumer
shopping enjoyment affect the amount of time
spent shopping. Forsythe and Bailey [45] study
revealed that shopping enjoyment was positively
related to time spent shopping while age was
negatively associated with time spent shopping
for females. Although income was not identified
as a significant variable, consumers with
professional careers spent less time shopping than
non-professional consumers [19].
Research Questions
What are the distinct attributes of shops sought
by shoppers in the mall?
What is the shop attributes hierarchy effects on
general store selection
Do these distinct shop attribute vary among
shoppers’ demographic variables?
What is the relationship between the store
selection attribute and demographic
idiosyncrasies of shoppers?
Methodology
A deductive reasoning approach was seen as a
useful option for this study where research works
from the more general to the more specific [46]. A
topic of interest was thought up through theory
and then narrowed down into more specified
research questions to be tested. Just as in earlier
works (see Anning-Dorson et al 2013), this leads
the study to test the hypothesis with specific data
-a confirmation(or not) of our original theories
[47]. A survey approach with quantitative data
collected in cross-sectional manner was
considered appropriate as Saunders et al [47]
submit to be usually associated with deductive
approach as the purpose was to test formulated
hypotheses borne out of empirical literature
reviews. For this specific study, data were
collected from Ghana’s two foremost malls i.e. the
Accra Mall and the A&C Mall. These malls are
seen as prominent, flagship and widely patronized
by the citizenry. Structured questionnaire were
distributed to visitors of these malls. These
questionnaires were Likert in nature for easy fill
out and in conformity with previous studies.
Shoppers were intercepted at the entrance of the
shops within the mall to allow respondents to
easily recall activities and give appropriate
responses because of environmental influence.
This study adopted probability sampling method.
Saunders et al. [47] contest that, even though we
may generalize from non-probability sampling, it
cannot be done on statistical grounds. As
probability sampling makes it possible to answer
research questions and achieve research
objectives that require the researcher to estimate

Available online at www.managementjournal.info
Thomas Anning-Dorson |Sep.-Oct. 2013 | Vol.2 | Issue 5|132-143 135
statistically the characteristics of the population
from the sample, the researchers followed this
sampling technique to make meaningful
generalizations. By the choice of the probability
sampling technique, this study further adopted
simple random sampling technique where
elements had equal chance of being selected
through a mall intercept approach. The study’s
sample frame was all mall shoppers in Ghana.
With the difficulty ascertaining a list of mall
shoppers in the country, the researchers sought to
consider every person who visits the malls as part
of the sample frame to follow previous researchers
[48]. In this study, every tenth person from a shop
within the mall was intercepted to be part of the
sample. When the tenth person was unable to
answer the questionnaire, the next person was
approached.
In probability sampling, it is argued that the
larger the sample’ size the lower the likelihood of
error in generalizing to the entire population [47].
However, when critiquing business education
research, Wunsch [49] stated that “two of the
most consistent flaws of probability sampling
included (1) disregard for sampling error when
determining sample size, and (2) disregard for
response and non-response bias”. The question
then is, how large of a sample is required to infer
research findings back to a population? With the
researchers’ inability to correctly estimate the
number of visitors of the mall per day, it was
prudent to estimate a sample size consistent with
previous researchers in mall studies. The table
below shows a number of researchers done in the
past years in the area of mall shopping and the
sample size used.
Table 1: Sample size used by scholars in the past Author(s) Number of Malls Sample Used Sample Per Mall
Rajagopal, 2009 6 600 100
Ahmed et al 2007 150
Yavas & Babakus 2009 400
Nguyen et al 2007 4 608 152
Hunter, 2006 337
Rajamma, et al, 2009 Internet Survey 720
Wang et al, 2010 174
Yan & Eckman, 2009 410
Ali et al, 2010 101
Tendai & Crisper 320
Hemalatha et al, 2009 300
Wegner, 2007
Tai 2008
Ooi & Sim, 2007 9 1283 142.5
Base on the above table and the unavailability of
known number of mall visitors, the study used a
total sample size of six hundred (600) for two
shopping malls which is consistent with previous
studies. The sample size per mall compared to
previous studies has been increased to minimize
the sampling error normally associated with
surveys using probability sampling. Proceeding
from that, a total of 600 questionnaires were
printed and distributed to shoppers of Accra and
A&C Shopping Malls. Shoppers were intercepted
while they were within the mall and requested to
help fill the questionnaires. Respondents were
asked to fill and return the instruments
immediately as it would have been difficult to
collect them later. The distributions of the
questionnaires were done over a period of four-
weeks. A total of 528 were successfully returned
as some abundant the questionnaire midway into
the filling. However, 467 were usable which were
finally used in the final analysis representing a
usable response rate of 77.83%.
Data Analysis
Due to the large nature of the scales used for both
constructs, a data purification exercise was
conducted through an exploratory factor analysis
(EFA) to cleans the scales and group the scales
under factors to set the pace for the hypotheses to
be tested. The exploratory factor analysis leads to
testing for the reliability of the factors that were
extracted through the EFA and validity proofs
shown to allow for the testing of the hypotheses.
In terms of demographic characteristics of the
respondents, most of the respondents
representing over 74% have had tertiary
education and therefore did not require further
explanation of the questionnaires which normally
account for interviewer biases. Only 6.4% have
had basic formal education but did not require

Available online at www.managementjournal.info
Thomas Anning-Dorson |Sep.-Oct. 2013 | Vol.2 | Issue 5|132-143 136
much interpretation of the questions to affect
their responses. Single in terms of marital status
attend the mall than married ones as 43% of the
respondents were married leaving the rest never
married; or divorced, separated or widowed. A
sizeable portion of the sample representing 66%
were employed and therefore deemed to have the
purchasing power to visit the mall.
In terms of the income of the respondents, a
chunk of the respondents representing 32.8% earn
between GH¢100 and 500 while another 26.9%
earn between GH¢501 and 1000 and 22.9% also
earning more than GH¢1000 showing that, those
considered in the study had purchasing power and
therefore visit the mall with the possibility of
spending. Finally, since there are different people
with different origin in Accra, it was important to
assess the differences in country or geographical
origin and be used as a demographic variable for
assessment of mall visitation motivation and shop
selection attributes. The study largely included
more Ghanaians visit the malls with 71.3%,
followed by Americans/Europeans with 10.3%,
Asians with 8.8%, other Africans with 8.4% and
the rest representing 1.3%.
The next respondent characteristic assessment
done was in respect of shoppers time spent at the
mall, the different number of shops visited and
their number of mall visits per week. On the
average, mall shoppers in Ghana spend between
1.5 and 2.5 hours (an average of 2 hours) at the
mall which is consistent with the findings of
Ahmed et al, [17] in the Malaysian study in the
American study. In more specific terms, Ahmed et
al, [17] in the Malaysian study found that, the
average time spent by student shoppers was
about two and a half hours, while other reported
that Malaysian shoppers (inclusive of students
and working people) spend an average 96 min,
found that American shoppers spent about 78 min
in a mall. This indicates that shoppers in Ghana
appear to spend significantly more time in the
mall compared to the developed subjects.
In terms of the number of different stores visited
during a normal trip to the mall, the study found
that, on average, respondents visited about three
stores per trip. By comparison, American
shoppers visited about five stores per trip and
Malaysian visited six stores per visit [17]. This
finding suggests that shoppers in Ghana visit a
comparatively less number of stores per their mall
visit. The graph below indicated that, 62.74%
visited between 1-2 stores, 25.27% visited
between 3-4 stores while 11.99% visited more
than five stores at the mall.
Presentation of Results
To answer the research question one, Scale
Purification through Exploratory Component
Factor Analysis was conducted to determine the
distinct shop selection attributes at the mall.
According to the literature, there are number of
scale measures for store selection attribute. This
study sought to maximize the usefulness of these
scales and therefore considered a number of them
amid additions from the researcher. Where there
were inconsistencies in the scales from different
scholars, the researcher rephrased the questions
to make it more relevant to the context of the
study.
A total of twenty-one items were used for shop
selection attributes (SSA). Respondents were to
indicate their level of agreement for all of the
items used for SSA on a five-point Likert scale
where strongly agree represented the highest
level of agreement with 5-points and 1-point for
strongly disagree and a mid level of 3-points
representing neither agree nor disagree. In
accordance with best practices as suggested by
Tull and Howkins [50], Parasuraman et al., [51]
and Churchil [52] exploration of the underlying
structure of the data carried out through
exploratory factor analysis (EFA) and stepwise
process suggested by Hair et al. [53] was followed.
Initial assessment of the correlation matrices for
shop selection attribute indicated considerable
degree of inter-factor correlation as indicated in
table. In addition, from the correlation matrices,
the Bartlett test of Sphericity (Chi-
square=3293.30, df=210; p<0.000) for Shop
Selection Attribute and Kaiser-Meyer-Olkin
(KMO) measure of sampling adequacy indices and
(value of 0.782) for Shop Selection Attribute
confirmed the appropriateness of the data for
EFA. Given that the aim was to identify the
minimum portion of the variance of the original
items, principal component analysis was selected
[54] to reduce the number of factors where the
Eigen value greater than 1 and a cumulative
percentage of variance explained being greater
than 50% were the criteria used in determining
the number of factors. On the basis of these
criteria7 factors were extraction for Shop
Selection Attribute which collectively accounted
for a satisfactory 65.25% of the variance.
Furthermore, the communality column in tables
provides further evidence of the overall
significance of the solution.
In order to obtain a clear picture of the structure,
the initial solution was rotated and the absence of
a compelling analytical or theoretical reason, no
Available online at www.managementjournal.info
Thomas Anning-Dorson |Sep.-Oct. 2013 | Vol.2 | Issue 5|132-143 137
prior assumption in terms of factor dependence
was made and consequently an oblique rotation
was applied to the data [51]. On the basis of the
sample size, the criterion for the significance of
the factor loading for the extracted common factor
was stipulated to be greater than the absolute
value of 0.5 suggested by Hair et al. [53].
Communality was also examined in order to
assess how much variance of each item was
accounted for by the extracted factors and shed
light into possible elimination of items (given the
lack of accepted guidelines a cut-off value of 0.3
was used). The initial analysis through the
principal component analysis produced seven
factors on which internal consistency and
reliability check were performed.
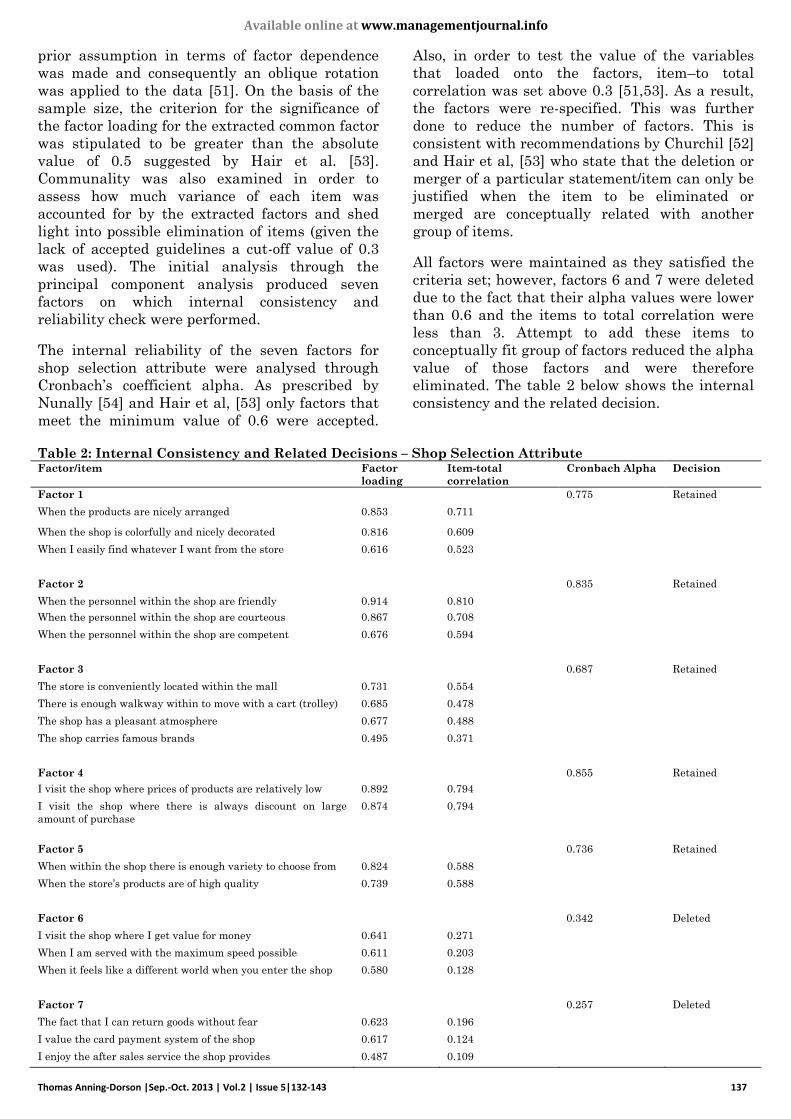
The internal reliability of the seven factors for
shop selection attribute were analysed through
Cronbach’s coefficient alpha. As prescribed by
Nunally [54] and Hair et al, [53] only factors that
meet the minimum value of 0.6 were accepted.
Also, in order to test the value of the variables
that loaded onto the factors, item–to total
correlation was set above 0.3 [51,53]. As a result,
the factors were re-specified. This was further
done to reduce the number of factors. This is
consistent with recommendations by Churchil [52]
and Hair et al, [53] who state that the deletion or
merger of a particular statement/item can only be
justified when the item to be eliminated or
merged are conceptually related with another
group of items.
All factors were maintained as they satisfied the
criteria set; however, factors 6 and 7 were deleted
due to the fact that their alpha values were lower
than 0.6 and the items to total correlation were
less than 3. Attempt to add these items to
conceptually fit group of factors reduced the alpha
value of those factors and were therefore
eliminated. The table 2 below shows the internal
consistency and the related decision.
Table 2: Internal Consistency and Related Decisions – Shop Selection Attribute Factor/item Factor
loading
Item-total
correlation
Cronbach Alpha Decision
Factor 1 0.775 Retained
When the products are nicely arranged 0.853 0.711
When the shop is colorfully and nicely decorated 0.816 0.609
When I easily find whatever I want from the store 0.616 0.523
Factor 2 0.835 Retained
When the personnel within the shop are friendly 0.914 0.810
When the personnel within the shop are courteous 0.867 0.708
When the personnel within the shop are competent 0.676 0.594
Factor 3 0.687 Retained
The store is conveniently located within the mall 0.731 0.554
There is enough walkway within to move with a cart (trolley) 0.685 0.478
The shop has a pleasant atmosphere 0.677 0.488
The shop carries famous brands 0.495 0.371
Factor 4 0.855 Retained
I visit the shop where prices of products are relatively low 0.892 0.794
I visit the shop where there is always discount on large
amount of purchase
0.874 0.794
Factor 5 0.736 Retained
When within the shop there is enough variety to choose from 0.824 0.588
When the store’s products are of high quality 0.739 0.588
Factor 6 0.342 Deleted
I visit the shop where I get value for money 0.641 0.271
When I am served with the maximum speed possible 0.611 0.203
When it feels like a different world when you enter the shop 0.580 0.128
Factor 7 0.257 Deleted
The fact that I can return goods without fear 0.623 0.196
I value the card payment system of the shop 0.617 0.124
I enjoy the after sales service the shop provides 0.487 0.109

Available online at www.managementjournal.info
Thomas Anning-Dorson |Sep.-Oct. 2013 | Vol.2 | Issue 5|132-143 138
The revision in accordance with conceptual fit had
five attributes that affect Ghanaians shop
selection at the Mall. These attributes are display,
store personnel, physical store, price and
merchandise quality. These attributes for store
selection at the mall were further checked by
their Cronbach alphas which were all more than
0.6 to ensure reliability. The table below shows
the details.
Table 3: Internal Constancy of Revised Structure for Shop Selection Attribute
Factor Number of
Factor
Item-total
correlation
Weighted
Mean
Cronbach
Alpha
Factor 1/Display 3 4.1892 0.775
When the products are nicely arranged 0.711
When the shop is colorfully and nicely decorated 0.609
When I easily find whatever I want from the store 0.523
Factor 2/Store Personnel 3 3.9057 0.835
When the personnel within the shop are friendly 0.810
When the personnel within the shop are courteous 0.708
When the personnel within the shop are competent 0.594
Factor 3/Physical Store 4 4.0733 0.687
The store is conveniently located within the mall 0.554
There is enough walkway within to move with a cart
(trolley)
0.478
The shop has a pleasant atmosphere 0.488
The shop carries famous brands 0.371
Factor 4/Price 2 4.0471 0.855
I visit the shop where prices of products are
relatively low
0.794
I visit the shop where there is always discount on
large amount of purchase
0.794
Factor 5/ Merchandise Quality 2 4.0439 0.736
When within the shop there is enough variety to
choose from
0.588
When the store’s products are of high quality 0.588
As an answer to research question one, the
distinctive shop selection attributes therefore are
display, store personnel, physical attributes, price
and merchandise quality.
Question Two
Research question two sought to assess the shop
attributes hierarchy effect on general store
selection. Two statistical analyses were necessary
to be performed. Firstly, a comparison of the
means of the various factors could tell which of
the motivations respondents rated higher than
the rest. However since the comparison of the
factors means cannot tell the real effect on the
overall store selection orientation, a multiple
regression analysis was performed. The
regression analysis’s β values tell the direction
and the level of the effect of each factor on the
general model.
The descriptive statistics for the SSA showed
that, the highest average mean factor was display
Table 4: Descriptive statistics for SSA
Variables N Mean Std. Deviation
Display 467 4.1892 .67177
Physical Store 467 4.0733 .50993
Store Price 467 4.0471 .85035
Merchandise Quality 467 4.0439 .62297
Store Personnel 467 3.9507 .73712
Valid N 467

Available online at www.managementjournal.info
Thomas Anning-Dorson |Sep.-Oct. 2013 | Vol.2 | Issue 5|132-143 139
(4.18) followed by physical store (4.07), store price
(4.05), merchandise quality (4.04) and store
personnel (3.95). However, as indicated earlier,
these ranking does not tell the effect on the
overall store selection orientation, therefore the
regression analysis was needed.
The relationship of all the variables in the casual
model was assessed based on the research
question and the results displayed in the three
following tables below.
The multiple coefficient (R) is 0.930, suggesting
reasonably good correlation between all the
influencing factors taken together and SSA, and
the adjusted R2 figure of 0.863 suggests that they
can explain 86% of the variance, leaving only 14%
unexplained. As shown in Table 4.20.2, regarding
the analysis of variance, the statistical
significance is 0.000, and the analysis of
relationships between all the influencing factors
and mall visitation can be accepted.
Table 5: Regression Analysis of SSA Factors Unstandardized Coefficients Standardized Coefficients
Model B SE β t Significance
1 (Constant) .503 .066 7.644 .000
Display .200 .013 .332 15.977 .000***
Store Personnel .176 .011 .321 16.679 .000***
Physical Store .187 .016 .235 11.645 .000***
Store Price .125 .009 .263 14.435 .000***
Merchandise Quality .140 .013 .215 10.992 .000***
Note: Dependent Variable: Store Selection Attribute R2= 0.865 adjusted R2= 0.863 F= 588.439 Sig. at p<0.001
Table 5 suggests that a person’s store selection
attribute can be positively influenced by all the
factors as significant predictors of SSA.
Considering the level of significance of those
factors, the said table still shows that, all the
factors were significant (sig. of 0.000). In general,
display (0.33) favourably influenced the store
selection attribute more than the rest of the
factors followed by store personnel (0.32), store
price (0.26), physical store (0.24) and merchandise
quality (0.22).
Question Three
A one way ANOVA (F-test) was conducted to test
whether there were difference in mean of the
various demographic factors and their shop
selection attribute. In orders words, is one’s choice
of shop at the mall has any association with their
demographic idiosyncrasies. The results are
shown in the table below with heir hypothesis
decisions
Table 6: ANOVA for shop selection attribute against demographic variable
Sum of Squares df
Mean
Square F
Sig Decision
Sex Between Groups .038 1 .038 .231 .631 Reject
Within Groups 75.304 464 .162
Total 75.341 465
Age Between Groups 1.326 4 .331 2.037 .088 Reject
Within Groups 74.850 460 .163
Total 76.176 464
Education Between Groups .926 3 .309 1.907 .128 Reject
Within Groups 74.476 460 .162
Total 75.402 463
Marital status Between Groups .577 2 .289 1.772 .171 Reject
Within Groups 75.606 464 .163
Total 76.183 466
Employment Between Groups 1.109 2 .554 3.427 .033* Accept
Within Groups 75.074 464 .162
Total 76.183 466
Estimated
income
Between Groups 2.862 5 .572 3.589 .003**
Accept
Within Groups 72.555 455 .159
Total 75.417 460
***Significant at p<0.001 **Significant at p<0.01 *Significant at p<0.05
The results show that only one’s employment
status and their estimated monthly income has a
link with the shoppers shop selection attribute at
the mall. Estimated monthly income was more
significant at 0.01 while employment was
significant at 0.05 with 3.589 and 3.427 F-values

Available online at www.managementjournal.info
Thomas Anning-Dorson |Sep.-Oct. 2013 | Vol.2 | Issue 5|132-143 140
respectively. This therefore means that, ones age,
sex, education, marital status do not have any
association with their choice of shop within the
mall.
The next hypothesis sought to assess the
relationship between SSA and Demographic
Variables and a Chi-square test was conducted to
test that;
Question Four
The table 4.16 below shows the Chi-square test
results for the H4. The table 4.16 shows that, all
of the demographic variables had a significant
relationship with SSA with the exception of
marital status and nationality.
Table 7: Relationship between SSA and Demographic Variables
Demo variable Pearson R Cramer’s V Contingency
Coefficient
Decision
Sex Value 73.074 0.396 0.368 Accept
Df 44
Asymp. Sig (2-sided) 0.004
Approx. Sig 0.004 0.004
Age Value 2.696 0.381 0.606 Accept
Df 176
Asymp. Sig (2-sided) 0.000
Approx. Sig 0.000 0.000
Education Value 1.707 0.350 0.519 Accept
Df 132
Asymp. Sig (2-sided) 0.013
Approx. Sig 0.013 0.013
Marital status Value 1.090 0.342 0.435 Reject
Df 88
Asymp. Sig (2-sided) 0.064
Approx. Sig 0.064 0.064
Employment Value 1.643 0.419 0.510 Accept
Df 88
Asymp. Sig (2-sided) 0.000
Approx. Sig 0.000 0.000
Estimated income Value 2.979 0.360 0.627 Accept
Df 220
Asymp. Sig (2-sided) 0.000
Approx. Sig 0.000 0.000
***Significant at p<0.001 **Significant at p<0.01 *Significant at p<0.05
The table above showed that, there was a
significant relationship between sex and SSA as
the overall chi square value of 73.074 with 44 df
was significant at 0.01. It can therefore be
concluded that, the relationship between sex of
the shopper and SSA was extremely unlikely to be
explained by chance factors alone which therefore
meant that there is a significant relationship
between the two variables. The Cramer’s V value
of 0.396 showed a positive direction of the
relationship while the contingency coefficient of
0.368 showed a weak relationship.
There was a significant relationship between age
and SSA as the overall chi square value of
269.589 with 176 df was significant at 0.001. It
can therefore be concluded that, the relationship
between age of the shopper and SSA was
extremely unlikely to be explained by chance
factors alone which therefore meant that there is
a significant relationship between the two
variables. The Cramer’s V value of 0.381 showed a
positive direction of the relationship while the
contingency coefficient of 0.607 showed that, there
is a strong relationship between the age of the
shopper and his/her shop selection attribute.
There was a significant relationship between
educational level attained and SSA as the overall
chi square value of 170.497 with 132 df was

Available online at www.managementjournal.info
Thomas Anning-Dorson |Sep.-Oct. 2013 | Vol.2 | Issue 5|132-143 141
significant at 0.05. It can therefore be concluded
that, the relationship between education level of
the shopper and SSA was extremely unlikely to be
explained by chance factors alone which therefore
meant that there is a significant relationship
between the two variables. The Cramer’s V value
of 0.35 showed a positive direction of the
relationship while the contingency coefficient of
0.519 showed a not too strong relationship.
On the part of shoppers’ employment status, there
was a significant relationship between
employment and SSA as the overall chi square
value of 164.335 with 88 df was significant at
0.001. It can therefore be concluded that, the
relationship between employment of the shopper
and SSA was extremely unlikely to be explained
by chance factors alone which therefore meant
that there is a significant relationship between
the two variables. The Cramer’s V value of 0.396
showed a positive direction of the relationship
while the contingency coefficient of 0.368 showed
a weak relationship.
Lastly, there was a significant relationship
between estimated monthly income and SSA as
the overall chi square value of 297.908 with 220 df
was significant at 0.001. It can therefore be
concluded that, the relationship between income
level of the shopper and SSA was extremely
unlikely to be explained by chance factors alone
which therefore meant that there is a significant
relationship between the two variables. The
Cramer’s V value of 0.360 showed that, there is a
positive relationship while the contingency
coefficient of 0.627 showed a strong relationship
[54-59].
Conclusion and Implications
It was also shown in the study that, within the
mall, there are key reasons/motivations for the
store shopper select. As the study sought to find
the attributes peculiar to Ghanaian shoppers, it
was revealed that there are five (5) key attributes
that normally invite the shopper to the shop
within the mall which are display, store
personnel, physical store, price and merchandise
quality. However, these have different level of
effect on the general shop selection. It was shown
that display had the most influence on the store
selection attribute followed by store personnel,
store price, physical store and merchandise
quality.
Another key finding was that, there is largely a
significantly relationship between the shoppers
demographic variables and their store selection
attributes. Ones marital status and nationality
had no relationship with his/her motivation for
store choice, however, the rest of the demographic
variables i.e. sex, age, educational level,
employment status, and estimated monthly
income had significant influence on their store
selection attribute.
The competitive nature of the retail industry
especially at the mall which is seen as a more
relaxed atmosphere for selecting merchandise
shows the importance of properly managing
marketing activities. Retailers must understand
the idiosyncrasies of their markets to plan the
right marketing mix in order to compete
favorably.
Considering the findings of this study, retailers to
be careful about how products are displayed
within the shop which includes the arrangement
on the shelves and the colourful decoration and
the atmospheric effect the display can have a
lasting effect on the shopper. Furthermore, the
competence of the store staff, the friendliness and
the speed at which they are able to deal with the
shopper will make him/her choose a particular
retail outlet over the other. Therefore maximum
training on customer service, complain handling
and service recovery strategy should be
trumpeted to the staff. The choice of the store in
terms of the location within the mall, the
availability of spacious walkways, trolley-
provision and check out time play key role and
therefore must be critically considered by the
retailer. High quality product sales coupled with
value for money customer cost helps the store
within the mall to meet its sales targets and gain
loyalty customers.
Segmentation based on demographic variables of
consumers has been espoused by many
researchers over the years. In this study, it has
come to light that, mall developers and retailers
in particular in a developing economy like can
have its market well segmented on the
demographic variables such as age, educational
level, employment status, and estimated monthly
income. These variables were favorably related to
the shop selection and therefore can serve as a
good measure of segmentation.
As a limitation of this study, the findings are
generally based on shoppers in Ghana therefore
users of the findings must be guided in its
application to other sub-Saharan African
countries in spite of the similarities in such
economies. Future research should also consider a
broader demographic profile representing
multiple geographical locations in Africa as well
as other region given that consumer’ shopping-

Available online at www.managementjournal.info
Thomas Anning-Dorson |Sep.-Oct. 2013 | Vol.2 | Issue 5|132-143 142
related perceptions and expectations are likely to
differ across countries or cultures throughout the
world. Future research covering wider
perspectives is desirable to enable comparisons,
benchmarking and setting standards. With many
mall developers and mall managers now
operating as MNCs (multi-national corporations),
this international perspective is particularly
important.
References
1. Tauber EM (1972) ‘Why do people shop? Journal of
Marketing Management, Fall, 58-70.
2. Dholakia RR (1999) Going shopping: key determinants of
shopping behaviours and motivations. International
Journal of Retail & Distribution Management 27(4):154-
65.
3. Anning-Dorson T, Kastner A, Mahmoud MA (2013)
Investigation into Mall Visitation Motivation and
Demographic Idiosyncrasies in Ghana, Management
Science Letters 3:367-84.
4. Woodruffe-Burton H, Eccles S, Elliott R (2002) Towards a
theory of shopping: a holistic framework. Journal of
Consumer Behaviour 1(3):256-66.
5. Perner LE (1998) Optimal stimulation level as a
moderator of ‘high-low’ and EDLP pricing effectiveness”,
unpublished doctoral dissertation, University of Southern
California, Los Angeles, CA.
6. McGoldrick P (2002) Retail Marketing, 2nd ed., McGraw-
Hill, Maidenhead.
7. Hunter GL (2006) The role of anticipated emotion, desire,
and intention in the relationship between image and
shopping center visits. International Journal of Retail &
Distribution Management 34(10): 709-21.
8. Soars B (2009) Driving sales through shoppers’ sense of
sound, sight, smell and touch, International Journal of
Retail & Distribution Management 37(3):286-98.
9. Ali J , Kapoor S (2010) Buying behaviour of consumers for
food products in an emerging economy, British Food
Journal, 112(2):109-124.
10. Beynon MJ (2010) Gender differences in supermarket
choice - An expositional analysis in the presence of
ignorance using CaRBS. European Journal of Marketing,
44(1/2):267-290
11. Kotler P, Keller P (2006) Marketing Management. Prentic
Hall, New Jersey.
12. Arnold MJ , Reynolds KE (2003) Hedonic shopping
motivations. Journal of Retailing, 79:77-95.
13. Babin BJ , Attaway JS (2000) Atmospheric affect as a tool
for creating value and gaining share of a customer.
Journal of Business Research, 49:91-9.
14. Batra R , Olli TA, (1991) Measuring the Hedonic and
Utilitarian Sources of Consumer Attitudes. Marketing
Letters, 2 :159-170.
15. Baumann DJ, Robert BC, Douglass TK (1981) Altruism
as Hedonism: Helping and Self-Gratification as
Equivalent Responses. Journal of Personality and Social
Psychology, 40 (June), 1039-1046.
16. Mitchell VW, Walsh G (2004) Gender differences in
German consumer decision-making styles. Journal of
Consumer Behaviour, 3(4):331-46.
17. Ahmed ZU, Ghingold M , Dahari Z (2007) Malaysian
shopping mall behaviour: An exploratory study, Asia
Pacific Journal of Marketing and Logistics,19(4):331-348.
18. Timmermans HJP (2001) Consumer choice of shopping
centre: an information integration approach, Regional
Studies.16(3):171-82.
19. Paulins VA, Geistfeld LV (2003) The effect of consumer
perceptions of store attributes on apparel store
preference. Journal of Fashion Marketing & Management
7(4):371-85.
20. Jin B, Kim JO (2003) A typology of Korean discount
shoppers: shopping motives, store attributes, and
outcomes. International Journal of Service Industry
Management, 14(3/4):396-419.
21. Kim YK, Kang-Park J (1995) The shopping patterns of
ethnic consumer groups in the United States. Journal of
Shopping Center Research, 2(1):65-89.
22. Bloemer J, de Ruyter K (1998) On the relationship
between store image, store satisfaction and store loyalty.
European Journal of Marketing 32 (5/6):499-513.
23. Omar O (1999) Retail Marketing, Pitman Publishing,
London p.103.
24. Lindquist JD (1974-1975) Meaning of image – a survey of
empirical and hypothetical evidence, Journal of Retailing
50,(Winter), 29-38.
25. Ghosh A (1990) Retail Management, The Dryden Press,
Chicago, IL.
26. Koo DM (2003) Inter-relationships among store images,
store satisfaction, and store loyalty among Korea discount
retail patrons. Asia Pacific Journal of Marketing and
Logistics15(4):42-71.
27. Nguyen TMT, Nguyen TD (2003) Measurement of Service
Quality of Supermarkets in Vietnam – A Customer
Perspective. Technical Report 01.04, Vietnam National
University, Ho Chi Minh City.
28. Hu H, Jasper CR (2006) Social cues and their impact on
store image. International Journal of Retail &
Distribution Management 34(1):25-48.
29. Mittal B, Lassar WM (1996) The role of personalization in
service encounter. Journal of Retailing, 72(1): 95-109.
30. Ko E, Kincade DH (1997) The impact of quick response
technologies on retail store attributes. International
Journal of Retail & Distribution Management. 25(2):90–
98.
31. Leszczyc P, Popkowski TL, Timmermans H (2001)
Experimental choice analysis of shopping strategies.
Journal of Retailing Winter 77(4):493
32. Lee M (2008) When in China, Communication World,
25(6):34-7.
33. Chuang Y (2003) A study on store image and brand
perception toward consumers’ choice of chain store’’ (in

Available online at www.managementjournal.info
Thomas Anning-Dorson |Sep.-Oct. 2013 | Vol.2 | Issue 5|132-143 143
Chinese), National Chaotung University Institute of
Business & Management, Hsinchu.
34. Cox R ,Brittain P (2000) Retail Management. Pearson
Education, Harlow.
35. Caine R (2003) Store design. Design Week, July (17):31-3.
36. Bell J , Ternus K (2002) Silent Selling. Fairchild
Publications, New York, NY.
37. Michon R, Chebat JC, Turley LW (2005) Mall
atmospherics: the interaction effects of the mall
environment on shopping behaviour. Journal of Business
Research 58(5):576-83.
38. Turley LW, Milliman RE (2000) Atmospheric effects on
shopping behaviour: A review of the experimental
evidence. Journal of Business Research 49(2):193-211.
39. Schmidt SL, Kernan JB (1985) The many meanings (and
implications) of satisfaction guaranteed. Journal of
Retailing 61(4):89-108.
40. Berman B, Evans JR (1992) Retail Management: A
Strategic Approach, 5th ed., Macmillan, New York, NY.
41. Raju PS (1980) Optimum stimulation level: its
relationship to personality, demographics, and
exploratory behaviour. Journal of Consumer Research,
7:272-82.
42. Wood, M. (1998). Socio-economic status, delay of
gratification, and impulse buying. Journal of Economic
Psychology, 19, 295-320.
43. Mai LW, Zhao H (2004) The characteristics of
supermarket shoppers in Beijing. International Journal of
Retail & Distribution Management, 32(1):56-62.
44. Lalwani AK (2002) Interpersonal orientation of spouses
and household purchase decisions: the case of
restaurants. The Service Industries Journal 22(1):184-
200.
45. Forsythe SM, Bailey AW (1996) Shopping enjoyment,
perceived time poverty, and time spent shopping.
Clothing and Textiles Research Journal, 14(3):185-91.
46. Robson C (2002) Real world research. (2nd ed), Oxford,
Blackwell.
47. Saunders M, Lewis P,Thornhill A (2007) Research
methods for business students (4th ed.) Prentice Hall, UK.
48. Ooi JTL, Sim LL (2007) The magnetism of suburban
shopping centers: do size and Cineplex matter. Journal of
Property Investment & Finance 25(2):111-36.
49. Wunsch D (1986) Survey research: Determining sample
size and representative response. Business Education
Forum, 40(5):31-34.
50. Tull DS, Hawkins DI (1990) Marketing Research. 5th Ed.
New York: Macmillian Publishing Company.
51. Parasuraman A, Zeithaml VA , Berry LL (1988)
SERVQUAL: A Multiple-Item Scale for Measuring
Consumer Perceptions of Service Quality. Journal of
Retailing 64(1):12-40.
52. Churchill GA (1995) Marketing Research: Methodological
Foundations. 6th ed. Fort Worth: Dryden Press.
53. Hair JF, Jr. Babin B, Money AH, Samouel P (2003)
Essentials of business research methods. New York:
Wiley.
54. Nunnally JC (1978) Psychometric Theory. 2nd ed.,
McGraw-Hill Book Company, New York, NY.
55. Rajagopal (2009) Growing shopping malls and behaviour
of urban consumers, Journal of Retail and Leisure
Property, 8 (2):123-140.
56. Rajamma RK, Paswan AK, Hossain MM (2009) Why do
shoppers abandon shopping cart? Perceived waiting time,
risk, and transaction inconvenience. Journal of Product &
Brand Management 18(3):188-97.
57. Wang YJ, Doss SK, Guo C, Li W (2010) An investigation
of Chinese consumers’ outshopping motives from a
culture perspective Implications for retail and
distribution, International Journal of Retail &
Distribution Management. 38 (6):423-442.
58. Yan R N , Eckman M (2009) Are lifestyle centres unique?
Consumers’ perceptions across locations. International
Journal of Retail & Distribution Management 37 (1): 24-
42.
59. Yavas U , Babakus E (2009) Modeling patronage
behaviour: a tri-partite conceptualization, Journal of
Consumer Marketing 26(7):516–26.