1 WORK-RELATED ATTRIBUTES AND RETENTION
178
1 WORK-RELATED ATTRIBUTES AND RETENTION: COMPARING MILLENNIALS AND OTHER GENERATIONS The members of the Committee approve the doctoral dissertation of: Official Student Name Raymond P. Pasko Committee Chair Name Rosemary Maellaro, Ph.D. Committee Member Name Michael Stodnick, Ph.D. Director of Doctoral Programs R. Greg Bell, Ph.D. Dean of the College of Business Brett J. L. Landry, Ph.D.
-
Upload
khangminh22 -
Category
Documents
-
view
2 -
download
0
Transcript of 1 WORK-RELATED ATTRIBUTES AND RETENTION

1
WORK-RELATED ATTRIBUTES AND RETENTION:
COMPARING MILLENNIALS AND
OTHER GENERATIONS
The members of the Committee approve the doctoral dissertation of:
Official Student Name Raymond P. Pasko
Committee Chair Name Rosemary Maellaro, Ph.D.
Committee Member Name Michael Stodnick, Ph.D.
Director of Doctoral Programs R. Greg Bell, Ph.D.
Dean of the College of Business Brett J. L. Landry, Ph.D.


2
Copyright © by Raymond P. Pasko
All Rights Reserved
3
WORK-RELATED ATTRIBUTES AND RETENTION:
COMPARING MILLENNIALS AND
OTHER GENERATIONS
by
RAYMOND P. PASKO
Presented to the Faculty of the
The University of Dallas in Partial Fulfillment
of the Requirements
for the Degree of
DOCTOR OF BUSINESS ADMINISTRATION
THE UNIVERSITY OF DALLAS
October 2017

4
ACKNOWLEDGEMENTS
October 25, 2017
There are so many people I would like to acknowledge and thank for their support
and guidance throughout this journey.
First, I would like to thank my employer, Alcon Laboratories, and all of the
leaders who have supported me along the way while I pursued my dream of earning a
doctorate degree. Their understanding and compassion coupled with the financial support
from the company helped ease the burden of working while chasing my dream.
I would like to convey my heartfelt gratitude to my dissertation committee chair,
Dr. Rosemary Maellaro, for her continuing support and guidance throughout this process.
Rosemary’s attention to detail, support and feedback helped me become a better writer, a
better researcher, and overall a more intellectually curious person, all of which will
benefit me throughout the rest of my career. Thank you Dr. Maellaro! I would also to like
to express my sincere appreciation to the other member of my dissertation committee, Dr.
Michael Stodnick. I could also count on Michael to add a profound insight forcing me to
dig deeper and find the connection between thoughts and ideas which I had not fully
developed. While in the heat of the battle I often felt that Dr. Stodnick was adding
additional work on my plate, I realize now that he was making my research and my
dissertation better and was adding tremendous value. Thank you Dr. Stodnick.
I would also like to thank the rest of the faculty at the University of Dallas’ who
helped steer our inaugural DBA class on this wild and intense journey. Each and every
one of these faculty members helped mold and shape us into better students, and

5
researchers. I hope we all make them proud and I wish them success with the DBA
cohorts which follow us.
I couldn’t have gotten through this three plus year journey without the support
and camaraderie of my fellow DBA cohort members. Each and every one of them made
the experience fun, exciting, and rewarding. And I will be as proud when they finish their
dissertations and become doctors, as I am of my own accomplishments. I was lucky to
learn and develop alongside such fine and noble scholars!
I would also like to acknowledge the love and support of my mother, Dorothy
Pasko, who always encouraged me to dream big, and helped me believe that I could do
whatever I set my mind to. I know early on, Mom wanted me to me a doctor, and I know
she was a little disappointed when I changed my major in college from pre-med to
business. I hope that earning my doctorate degree now will take a little of the sting out of
that initial disappointment.
Last, but certainly not least, I would never have had the courage to undertake this
initiative without the love and support of my family. My daughter Lindsey, who I thought
would become a Dr. before me, gave me the encouragement, love and prodding to take
on this challenge. And that leads me to my greatest supporter, the one person who has
always been there for me, through the best and worst of times, my wife Susan Ann
Greene Pasko. It was her pushing and prodding that encouraged me to apply to the
University of Dallas’ DBA program, and who stood beside me and supported me every
step of the way. I can recall countless times when she would read and reread my papers,
proofreading them and correcting the myriad of spelling and grammar mistakes. Her love
and support never wavered, and when things got tough and I thought of throwing in the

6
towel and quitting the program, Susan was the calming voice talking me down off the
ledge. Without her encouragement and love I would never have made it through the
program to realize my dream of becoming a doctor. Thank you, Susan, I love you and so
appreciate all of your support.
I couldn’t have done this without the support and encouragement of each and
every one of you, and I am so eternally grateful to all of you! I hope that I can pay your
support forward as I continue my scholarly journey!
God bless you all!

7
DEDICATION
I dedicate this dissertation to the one person that has always been there for me,
cheering me along, my loving wife, Susan Ann Green Pasko. Without her love and
support I would never have made it successfully to the end of this incredible journey. The
doctoral degree that I have earned as a result of this dissertation is as much yours as it is
mine. Thank you, sweetheart!

8
ABSTRACT
WORK-RELATED ATTRIBUTES AND RETENTION:
COMPARING MILLENNIALS AND
OTHER GENERATIONS
Raymond P. Pasko, DBA.
The University of Dallas, 2017
Supervising Professor: Rosemary Maellaro, Ph.D.
Employers need to fill a widening gap within the U.S. workforce as a result of older
generations aging out and retiring. Millennial employees, the fastest growing generational
cohort, are the primary worker group that employers must rely upon to close this gap.
However, Millennials’ expectations regarding work-related attributes are different from
previous generations. Therefore, companies need to understand what Millennials expect
from their employers and become proactive in meeting those expectations, so they can
retain millennial workers. This study surveyed three generations of workers currently
employed by a health care company headquartered in the southwestern part of the U.S. to
identify which combination of work-related attributes is most effective in influencing
them to stay. The results indicate that job security, having a say, career advancement, and
work/life balance were the most significant work-related attributes to influence

9
Millennials to stay with their current employer. This combination varies from the work-
related attributes most valued by other generations. Additional findings show that older
Millennials prefer a different combination of work-related attributes than younger
Millennials and that supervisors value different work-related attributes than non-
supervisors. The results of this study can be used by employers to adjust the work-related
attributes offered to both Millennials and workers from other generations to increase
employee retention. Additionally, employers can provide different combinations of work-
related attributes to all of its employees to meet the needs of the different generations.
Key words: Millennials, generation theory, psychological contract, conjoint analysis,
intention to stay, retention, worker gap

10
TABLE OF CONTENTS
ABSTRACT ........................................................................................................................ 8
TABLE OF CONTENTS .................................................................................................. 10
LIST OF ILLUSTRATIONS ............................................................................................ 16
LIST OF TABLES ............................................................................................................ 17
Chapter 1 ........................................................................................................................... 19
1.1 Research Objectives .................................................................................................... 24
1.2 Contribution to Business Practice ............................................................................... 24
1.3 Contribution to Academic Literature .......................................................................... 26
1.4 Research Methods ....................................................................................................... 26
1.5 Structure of the Dissertation ....................................................................................... 28
1.6 Research Question ...................................................................................................... 28
Chapter 2 ........................................................................................................................... 29
2.1 Theoretical Framework Literature Discussion ............................................................ 29
2.2 Operational Definitions ............................................................................................... 31
2.3 Theoretical Lens 1: Generational Cohort Theory ....................................................... 34
2.3.1 Definition of the generations. .................................................................................. 35
2.3.2 The Traditionalist Generation. ................................................................................. 36
2.3.3 The Baby Boomer Generation. ................................................................................ 37
2.3.4 Generation X. ........................................................................................................... 38
2.3.5 The Millennial Generation. ...................................................................................... 39
2.3.6 The Post-Millennial generation................................................................................ 40
2.3.7 Comparison of the generations. ............................................................................... 41

11
2.3.8 Comparison of engagement levels. .......................................................................... 42
2.3.9 Generational job seekers. ......................................................................................... 42
2.3.10 How Millennials are Different. .............................................................................. 43
2.4 Theoretical Lens 2: Psychological Contract Theory ................................................... 44
2.4.1 Work-related attributes. ........................................................................................... 47
2.4.2 Millennials’ Expectations Regarding Work-related Attributes. .............................. 48
2.4.3 Overall compensation. ............................................................................................. 48
2.4.4 Career Advancement and Promotion. ...................................................................... 50
2.4.5 Recognition. ............................................................................................................. 50
2.4.6 Training and development. ...................................................................................... 51
2.4.7 Coaching and frequent feedback. ............................................................................. 51
2.4.8 Meaningful work experiences. ................................................................................. 52
2.4.9 Flexibility/Flexible Work Hours. ............................................................................. 53
2.4.10 Work/life Balance. ................................................................................................. 53
2.4.11 Personal Relationship with Supervisor/Co-workers. ............................................. 54
2.4.12 Workplace Fun. ...................................................................................................... 55
2.4.13 Job security. ........................................................................................................... 56
2.4.14 Strong leadership. .................................................................................................. 57
2.4.15 Having a say. .......................................................................................................... 57
2.4.16 Study relevance to organizations. .......................................................................... 57
2.5 Theoretical Lens 3: Employee Turnover and Intention to Stay .................................. 59
2.5.1 Categories of turnover. ............................................................................................. 62
2.5.2 Intention to stay........................................................................................................ 63
12
2.5.3 Organization challenges. .......................................................................................... 64
2.5.4 Millennial turnover. ................................................................................................. 64
2.6 Hypothesis................................................................................................................... 65
2.7 Summary ..................................................................................................................... 66
Chapter 3 ........................................................................................................................... 68
3.1 Independent Variables ................................................................................................ 69
3.2 Dependent Variable .................................................................................................... 69
3.3 Research Design.......................................................................................................... 70
3.4 Research Study - Phase 1 ............................................................................................ 71
3.4.1 Research design and methodology – phase 1. ......................................................... 71
3.4.2 Participant profile and recruitment process - phase 1. ............................................. 72
3.4.3 Ethical considerations – phase 1. ............................................................................. 72
3.4.4 Data collection – phase 1. ........................................................................................ 73
3.4.5 Results – phase 1. ..................................................................................................... 74
3.5 Research Study - Phase 2 ............................................................................................ 78
3.5.1 Research design and methodology – phase 2. ......................................................... 79
3.5.2 Participant profile and recruitment process - phase 2. ............................................. 86
3.5.3 Ethical considerations – phase 2. ............................................................................. 88
3.5.4 Survey pilot test – phase 2. ...................................................................................... 89
3.5.5 Data collection – phase 2. ........................................................................................ 89
3.5.6 Data analysis – phase 2. ........................................................................................... 90
3.6 Limitations .................................................................................................................. 92

13
3.7 Summary ..................................................................................................................... 93
Chapter 4 ........................................................................................................................... 95
4.1 Survey Response Patterns ........................................................................................... 96
4.1.1 Participant background information ........................................................................ 96
4.2 Overall Attribute Importance ...................................................................................... 99
4.3 Overall Attribute Part-Worth Utilities ...................................................................... 101
4.4 Survey Validation – Hold-out Task Comparisons .................................................... 102
4.5 Segmented Survey Result ......................................................................................... 105
4.5.1 Statistical significance determination. ................................................................... 106
4.5.2 Attribute importance by generational cohort. ........................................................ 107
4.5.3 Attribute importance by gender. ............................................................................ 112
4.5.4 Attribute importance by respondent position. ........................................................ 113
4.5.5 Attribute importance by respondent education level. ............................................ 114
4.5.6 Most Important attribute to improve. ..................................................................... 114
4.5.7 Most important attribute to improve by generation. .............................................. 115
4.5.8 Self-reported intention to stay. ............................................................................... 117
4.5.9 Self-reported intention to stay by generation. ........................................................ 117
4.6 Summary of Results .................................................................................................. 119
4.6.1 Research question answered. ................................................................................. 119
Chapter 5 ......................................................................................................................... 121
5.1 Findings..................................................................................................................... 122

14
5.1.1 Importance of job security. .................................................................................... 122
5.1.2 Work-related attribute preference - Millennials. ................................................... 123
5.1.3 Work-related attribute preference - Millennials and non-Millennials. .................. 124
5.1.4 Work-related attribute preference - older and younger Millennials. ..................... 125
5.1.5 Work-related attribute preference - males and females. ........................................ 125
5.1.6 Work-related attribute preference - supervisors and non-supervisors. .................. 126
5.2 Research Contributions ............................................................................................. 126
5.2.1 Managerial Contributions. ..................................................................................... 127
5.2.2 Managerial contributions that confirm research. ................................................... 127
5.2.3 Managerial contributions that extend research. ..................................................... 128
5.2.4 Academic Contributions. ....................................................................................... 128
5.3 Implications for Management ................................................................................... 130
5.3.1 Implications for managing Millennials. ................................................................. 131
5.3.2 Implications for addressing generational differences. ........................................... 133
5.3.3 Implications for addressing gender differences. .................................................... 136
5.3.4 Implications for addressing differences between employee roles. ........................ 136
5.3.5 Implications for the participating company. .......................................................... 137
5.4 Limitations ................................................................................................................ 138
5.5 Future Research ........................................................................................................ 141
5.6 Summary and Conclusion ......................................................................................... 143
REFERENCES ............................................................................................................... 144
APPENDIX A ................................................................................................................. 155

15
APPENDIX B ................................................................................................................. 156
APPENDIX C ................................................................................................................. 157
APPENDIX D ................................................................................................................. 158
APPENDIX E ................................................................................................................. 159
APPENDIX F.................................................................................................................. 160
APPENDIX G ................................................................................................................. 161
APPENDIX H ................................................................................................................. 166
APPENDIX I .................................................................................................................. 168
APPENDIX J .................................................................................................................. 169
APPENDIX K ................................................................................................................. 170
APPENDIX L ................................................................................................................. 174
APPENDIX M ................................................................................................................ 175
APPENDIX N ................................................................................................................. 176
APPENDIX O ................................................................................................................. 177

16
LIST OF ILLUSTRATIONS
Figure 1: Job-Related Attribute Expectations and Impact on Retention .......................... 31

17
LIST OF TABLES
Table 1: Generational Composition of the U.S. Workforce ............................................. 20
Table 2: Work Values and Preferences by Generation ..................................................... 41
Table 3: Importance of Work-related Attributes .............................................................. 43
Table 4: Phase 1 Survey Completion Rates ...................................................................... 73
Table 5: Phase 1 Participant Survey Composition ............................................................ 74
Table 6: Phase 1 Results by Respondent Group ............................................................... 76
Table 7: Phase 1 Results by Generation ........................................................................... 77
Table 8: Phase 1 Results by Combined Ranking Method................................................. 78
Table 9: Composition and Turnover History of Participating Company .......................... 87
Table 10: CBC Survey Response by Generation .............................................................. 97
Table 11: CBC Survey Response by Millennial Generation Sub Group .......................... 97
Table 12: Survey Response by Educational Level ........................................................... 99
Table 13: Average Importances ...................................................................................... 100
Table 14: CBC/HB Attribute Utilities Summary ............................................................ 102
Table 15: CBC/HB Attribute Utilities Summary Comparison ....................................... 102
Table 16: Hold-out Task 1 .............................................................................................. 103
Table 17: Hold-out Task 2 .............................................................................................. 104
Table 18: Hit or Miss Table for Hold-out Questions ...................................................... 105
Table 19: Attribute Ranking by Generational Cohort ..................................................... 107

18
Table 20: Attribute Importance and Statistical Significance by Generational Cohort ... 109
Table 21: Attribute Importance Older Millennials compared to Other Generations ...... 110
Table 22: Attribute Importance Younger Millennials compared to Other Generations . 111
Table 23: Attribute Importance Older Millennials compared to Younger Millennials .. 112
Table 24: Attribute Importance by Gender ..................................................................... 113
Table 25: Attribute Importance Supervisor compared to Non-Supervisor ..................... 114
Table 26: Work-Related Attribute to Improve................................................................ 115
Table 27: Work-Related Attribute to Improve by Generation ........................................ 116
Table 28: Attribute to Improve for Older and Younger Millennials .............................. 117
Table 29: Self-reported Intention to Stay ........................................................................ 117
Table 30: Self-reported Intention to Stay by Generational Cohort ................................. 119
Table 31: Self-reported Intention to Stay by Millennial Sub-group ............................... 119

19
CHAPTER 1
INTRODUCTION
The generational composition of the American workforce is rapidly changing.
Many Traditionalists (born between 1900 and 1945) have already exited the workforce,
and large numbers of Baby Boomers (born between 1946 and 1965) are in the process of
leaving (Fry, 2015). This creates an employee shortage in the United States that continues
to grow, and is expected to continue for at least the next 15 years (Hartman, 2016). In
order to close this gap employers must look to subsequent generations. While Generation
X (those born between 1965 and 1979) would be the logical source of replacement
employees, the number of Millennials (people born between 1980 and 1996) has
surpassed Generation X to become the largest generational segment available in the
American workforce (Fry, 2015) and, is therefore more likely to fill this employee gap.
The subsequent generation of post-Millennials (born after 1996) provides little help to fill
the worker gap as it has not yet fully entered the workforce. Therefore, the ability to
retain Millennials in the organization has arisen as a critical need for employers today.
Table 1 shows the current generational composition of the American workforce
(Fry, 2015), significant because it shows the importance of the millennial generation in
total, as they represent the largest number of workers. Because they are still entering the
workforce, they can help fill the gap that Traditionalists and Baby Boomers are creating
as they leave. This importance of millennial employees means that organizations must
focus on retaining Millennials to prevent diminished financial success that could result
from the loss of the experienced members of previous generations. The situation becomes
even more urgent because Millennials change jobs and careers more frequently than

20
previous generations (Lyons, Schweitzer, Ng, & Kuron, 2012). Losing millennial
employees because of their accelerated job changing further exacerbates the worker gap
issue for companies; therefore, understanding why this loss is occurring and preventing it
are important.
Table 1: Generational Composition of the U.S. Workforce
Generational Composition of the U.S. Workforce
Generation Birth Years # of U.S.
workers (M) % of U.S. workforce
Traditionalists 1900 – 1945 3.7 2% Baby Boomers 1946 – 1964 44.6 29% Generation X 1965 – 1979 52.7 34% Millennials 1980 – 1996 53.5 34% Post-Millennials 1996 – present 1.7 1% Total 156.2
Note: Adapted from Fry, 2015
The millennial generation has been described as radically different than previous
generations entering the workforce (Solnet & Hood, 2008; Solnet, Kraly, &
Kandampully, 2012). According to Brack (2012), Millennials are unlike preceding
generations in the way they view the world and define success, both on a personal and
professional level. Millennials define success according to the quality and level of
experiences they have, the connectivity to their relationships, and the organization for
which they work, all resulting in having a job they love (Landrum, 2016). Relationships
are critical to Millennials, both at home and at work (Deal & Levenson, 2016). In
addition, Millennials desire and expect a communal approach to management, which
requires that organizations develop and engage with their employees in different ways
(Canals, 2010; Karsh & Templin, 2013). Perhaps because of their different approach to
the workplace, Millennials are plagued by stereotypes, such as they are lazy, apathetic,

21
and lack motivation (Caraher, 2014; Sashittal, Jassawalla, & Markulis, 2012), to name a
few. On the other hand, Giancola (2006) contends that Millennials are not significantly
different than others who are faced with the life changes and challenges of entering the
workforce for the first time. Regardless of the preconceptions held about Millennials,
organizations must understand how to retain this large and expanding segment of the
workforce; otherwise, they risk losing billions of dollars to unwanted turnover (Sujansky
& Ferri-Reed, 2009). This study focuses on what work-related attributes are most
important to retain Millennials.
In this study, the term work-related attributes is used to describe the benefits, both
tangible and non-tangible, that employees receive in return for the work they do for their
companies. Within the tangible category are monetary and non-monetary considerations.
The monetary category includes salary, commission, bonuses, tuition reimbursement, and
stock options, while the non-monetary category includes health insurance coverage, life
and disability insurance, paid time off, and sick leave. The non-tangible category includes
career development and advancement, flexible working schedules, quality of
management and leadership of the company, feedback and coaching, and working
environment. Millennials have specific career goals and expectations, and the work-
related attributes that a company provides them will determine whether they will be loyal
to the company and remain or leave in search of opportunities with other employers who
will provide attributes they find more appealing.
A preponderance of empirical research demonstrates marked differences in
attitudes, preferences, and expectations of Millennials compared to other generations
(Myers & Sadaghiani, 2010; Ng, Schweitzer, & Lyons, 2010). While a lot has been

22
written about Millennials, questions remain about the generation’s attraction, retention,
and organizational commitment (Hershatter & Epstein, 2010; Twenge, 2010). Research
demonstrates that good work–life balance (Twenge, 2010), meaningful work (Lancaster
& Stillman, 2002; Ng et al., 2010), and frequent recognition (Hershatter & Epstein, 2010;
Ng et al., 2010) can contribute to Millennial loyalty and retention. However, an
increasing amount of research points to the critical nature of relationships at work as a
significant factor in the job satisfaction and retention of Millennials. Specifically,
relationships with immediate managers may be the key to increasing motivation and
retention among Millennials (Hershatter & Epstein, 2010; Lancaster & Stillman, 2010;
Ng et al., 2010). Despite the growing amount of research published about them,
Millennials present greater challenges than previous generations for employers who wish
to understand and retain them (Hershatter & Epstein, 2010). Millennials also represent a
paradox, in that they do not always act in accordance with their intentions. A study by
Kowske, Rasch, & Wiley (2010) confirmed this inconsistency; it found Millennials’
turnover was higher than members of other generations, despite the fact that Millennials
report lower turnover intentions. In other words, Millennials’ behavior with respect to
leaving organizations is inconsistent with their stated intention to stay.
When considering the retention of employees, an important element often
investigated is the employee’s role within an organization. Roles are differentiated
between employees who manage others and individual contributors without management
responsibility. Millennials who have reached a management position might be more
likely to stay with their current employer because they have started to realize the career
importance and significance that Millennials desire (Ng et al., 2010).

23
Length of time with an organization is often measured and reported as a way to
determine employee satisfaction. For this reason, company human resource (HR)
departments and trade associations focused on HR issues routinely track and report the
tenure of employees who leave organizations. The U.S. Bureau of Labor Statistics reports
the average tenure of employees who leave an organization and calculates whether these
employees are leaving faster (with less tenure) than in years past. While the agency’s age
classification does not exactly match the current Millennial age range of 20-36, it does
report that the median tenure of workers 25 to 34 is only three years (U.S. Bureau of
Labor Statistics, 2017b). This figure is slightly lower than the 2012 study results, when
Millennials' median tenure was 3.2 years, indicating that Millennials are leaving
companies at an accelerating pace.
In summary, current and future employee shortages due to the Baby Boomer and
Traditionalist generations aging out of the workplace make retaining Millennials an
imperative for U.S. businesses. As a generational cohort, Millennials have specific and
unique job factor requirements that motivate them to stay with their current employer
rather than seeking employment elsewhere. The literature indicates that some of the
work-related attributes that attract Millennials to an organization and motivate them to
stay include work/life balance, meaningful work, feedback based on their strengths,
frequent recognition, and having a personal relationship with their boss (Adkins, 2016;
Deal & Levenson, 2016; Rainer & Rainer, 2011; Sujansky & Ferri-Reed, 2009).
Additionally, Millennials’ role and length of time they have already spent working in an
organization can impact their decision to remain with that organization.

24
1.1 Research Objectives
The goal of this research is to assess the influencing power of specific work-
related attributes and to determine the ideal combination of these attributes that might
best predict Millennials’ intention to stay with an organization. Millennials do not always
act in accordance with what they say (Kowske et al., 2010); therefore, getting to their
deeper motivations and intentions is critically important. This study assesses such
motivations and intentions by using a conjoint analysis methodology. Conjoint analysis is
an analytical technique adapted from marketing research, used in this study to analyze the
trade-offs Millennials are willing to make among work-related attributes when deciding
to stay with their current employer or to seek employment elsewhere. Conjoint analysis
allows the investigation of the impact of individual work-related attributes, as well as
how the combination of these attributes affects Millennials’ intention to stay. Many of the
published retention / intention to stay studies have concentrated on the individual work-
related attributes that influence workers. This study offers a unique perspective in that it
investigates the impact of both individual and combinations of work-related attributes,
and considers the effect of moderating variables with a specific focus on Millennials.
1.2 Contribution to Business Practice
One goal of this study is to help employers retain their millennial employees by
understanding what Millennials want and expect in return for their work. By knowing
what is important to Millennials, employers can modify and customize the work-related
attributes they provide, thereby increasing the likelihood Millennials will remain with the
company. It is not fiscally possible for a company to provide employees with all of the
work-related attributes they may desire. Therefore, a company should seek the optimal

25
combination of work-related attributes that lead to higher retention. Limited published
empirical research has been done on the topic of millennial retention through work-
related attributes, therefore heightening the significance of this study. Findings may also
be useful for practitioners who wish to understand and leverage the expectations of
millennial job seekers within the U.S.
One way organizations can better understand the needs of Millennials is to pay
attention to what they ask for and are willing to negotiate for while being recruited.
Organizations can then utilize this information to provide the desired levels of work-
related attributes that increase millennial satisfaction, thereby increasing the probability
of retention. Investing the time and effort to determine what they are looking for in an
employment relationship will help a company better understand Millennials’ needs.
Findings from this study will provide an additional benefit to employers with respect to
successfully hiring millennial workers. Millennial job seekers are likely to be motivated
by the same work-related attributes that influence their intention to stay with their
company. Job seekers will consider companies that they believe can offer the most
appealing combination of work-related attributes and will look for such information by
investigating a company’s corporate website, searching the available public data on the
internet, contacting the company’s HR department, or speaking with current or past
employees. This study can provide information and insights so that companies can craft
their recruitment strategy toward millennial job seekers in the most attractive light
possible. Therefore, in addition to the retention of Millennials, this study also informs and
aids companies in their recruitment of Millennials.

26
1.3 Contribution to Academic Literature
Much of the academic literature pertaining to employee turnover and intention to
stay deals with employees as a group. This study specifically addresses a key
generational subset of employees – Millennials. Within the extant academic research
involving all employees, the issue of turnover has been identified and discussed, but
researchers have not, to date, discovered why specifically Millennials have a strong
preference for multiple job changes (Ng et al., 2010; Rupp, Vodanovich, & Crede, 2006)
and choose to “job-hop” instead (Meier, Austin, & Crocker, 2010). This study attempts to
understand the work-related attributes that, if present, may influence Millennials to stay
with their current employer. The classic literature on employee intention to stay and
turnover also identifies the reasons why employees choose to leave companies, but
perhaps the work-related attributes that Millennials find enticing and rewarding differ
from past generations (Kaifi, Nafei, Khanfar, & Kaifi, 2012). This study suggests
answers to these questions, adding to the empirical literature on Millennials.
1.4 Research Methods
The research design for this study is a field study focused on millennial workers.
The key benefit of this research strategy is the realism it affords, because it engages
subjects (in this case, workers) and surveys them about their existing work experience
and expectations. It is less obtrusive to the study participants because they can respond in
their natural setting to questions about which work-related attributes would influence
them to stay with their employer longer. Despite the benefit of realism, a potential
downside of field studies is the possible lack of generalizability to the entire population.

27
This study’s research methodology employs conjoint analysis, typically used to
analyze the trade-offs a consumer is willing to make when deciding among multi-
attributed products or services (Green & Srinivasan, 1978; Green, Krieger and Wind,
2001). This method of research presents combinations of work-related attributes that
respondents evaluate according to their preference. From these evaluations, the relative
importance of each attribute can be determined (Green & Wind, 1975; Kapur, Kumar,
Banga, & Surana, 2008) based on posterior probabilities (Gilbride, Lenk, & Brazell,
2008). While conjoint analysis is primarily used to study consumer preferences regarding
traditional products and goods, with the aim of product evaluation, repositioning,
competitive analysis, or pricing (Engleberg, Pierson, & Kashio, 1992), it has also been
used within the Organization Behavior discipline to investigate which employer
characteristics influence candidates’ job choice decisions, and how applicants evaluate
certain organizational characteristics to decide which companies to work for (Baum &
Kabst, 2013). Recasting this study with regard to the traditional actors in a conjoint
analysis requires replacement of the components. This study investigates Millennials (in
place of consumers), companies (in place of products), and work-related attributes (in
place of product attributes).
This research was conducted in two phases. The first phase was a survey sent to
several groups, including members of the three relevant generation groups to determine
the key work-related attributes that influence their intention to stay with an organization.
I utilized a preliminary list of work-related attributes as a stimulus in this phase, and
participants were allowed to write in other attributes that would motivate them to stay
with their employer. The results of this survey were combined with the information
28
identified in the literature review to distinguish which work-related attributes would
cause Millennials to continue working in their current organization. This process was
iterative to make sure the correct work-related attributes were identified. Once
determined, these key work-related attributes became the basis for formulating a priori
hypotheses, which were investigated in phase 2 of the study. Phase 2 employed choice-
based conjoint (CBC) analysis to survey working Millennials and empirically assess the
relative importance they place on the key work-related attributes to determine the ideal
combination of work-related attributes that are most likely to influence them to stay with
their current employer.
1.5 Structure of the Dissertation
The rest of this study is organized as follows: Chapter Two begins with a
literature review of the pertinent conceptual theories within the organization behavior
discipline, including the notions of generational cohorts, work-related attributes,
workplace motivation, and intention to stay to establish the conceptual framework for the
research. It then does a deep dive into the research involving Millennials to better
understand what makes them unique and what guides their workplace expectations in
order to examine the central research question. Chapter Three describes the methodology
for conducting this research. Subsequent chapters discuss the study’s results and examine
the practical implications and limitations of the study, along with future areas of research.
1.6 Research Question
The central research question of this study is: What work-related attributes should
organizations provide to increase millennial workers’ retention and are these different for
other generations?

29
CHAPTER 2
LITERATURE REVIEW
The foundational frameworks used in this study are generational cohort,
psychological contract, and employee turnover / intention to stay theories. Within
psychological contract theory, the work-related attributes that companies provide
employees are discussed, followed by an examination of the four key generational
cohorts that comprise the U.S. workforce (Traditionalist, Baby Boomers, Generation X
and Millennials). While the specific characteristics of each generational cohort are
discussed, significant time and attention are devoted to the millennial generation due to
their importance in filling the U.S. worker gap. Millennials are then compared to the
other generations, focusing on the work-related attributes they expect to receive in
exchange for their work at a company. Following this comparison is a discussion of the
importance of companies delivering on these expectations and the resulting impact on
millennial employees and the companies themselves if they do not. I next examine
existing research regarding organizations’ efforts to understand, attract, and retain
Millennials. Finally, I discuss the importance of the extant literature to both academia and
business.
2.1 Theoretical Framework Literature Discussion
Three theoretical lenses guide this study and, therefore, are the focus of this
literature review: generational cohort theory, psychological contract theory, and
employee turnover / intention to stay theory. Within psychological contract theory, the
sub-lens of work-related attributes is discussed and explored relative to both employee
intention to stay and turnover. This study reflects an evolving theoretical model using

30
empirical data to identify the need for companies to understand Millennials and then
utilize this understanding to determine which job-related attributes to offer, and at what
levels, to retain these important employees.
The model focuses on workers from different generational cohorts, both
Millennials and non-Millennials. The Non-Millennials will be grouped into Baby
Boomers and Generation Xers and studied through the theoretical lens of generational
cohort theory. Expectations of these workers with regard to work-related attributes were
investigated, as was their valuation of the importance of potential work-related attributes
that companies can offer them. Through the use of conjoint analysis, these workers
evaluated and selected the combinations and levels of work-related attributes most
appealing to them, as well as most likely to cause them to remain with their employer,
presented in hypothetical job offerings. The combination of work-related attributes most
likely to meet their expectations was investigated through the theoretical lens of
psychological contract theory. Millennials’ preference for the hypothetical job options
that best meet their expectations would perhaps lead to an increase in their intention to
stay; this behavior was studied through an employee turnover and intention to stay
theoretical lens. However, the measurement of intention to stay was not included as itis
outside the scope of this study. The theoretical frames and their relationships to the
constructs of investigation in this study are identified in Figure 1.

31
Figure 1: Job-Related Attribute Expectations and Impact on Retention
2.2 Operational Definitions
Several terms are important to this study, used repeatedly throughout the
document. A brief definition and explanation of each of these terms follows.
Baby Boomers: The term given to the generational group whose individuals were
born between 1946 and 1964 (Caraher, 2014; Fry, 2015; Gallup, 2016; Lancaster &
Stillman, 2010; Tulgan, 2016; Twenge, 2010). This group has also been referred to as
Thirteenth, or the Lost Generation (Parry & Urwin, 2011). With regard to the U.S.
workforce, this generation numbers 44.6 million and comprises 29% of the total labor
force (Fry, 2015).
Generation X: Generation X is the label given to the generational group whose
individuals were born between 1965 and 1979 (Caraher, 2014; Fry, 2015; Gallup, 2016;
Lancaster & Stillman, 2010; Tulgan, 2016; Twenge, 2010). There are currently 42.7
million Generation X workers in the U.S. and they comprise 34% of the total labor force
(Fry, 2015).

32
Generational cohort theory: The theory that describes and explains the behavior
of a group of people of a similar age who experience similar historical events (Costanza,
Badger, Fraser, Severt, & Gade, 2012). Parry and Urwin (2011) describe a generational
cohort as a group of individuals born at the same time who behave similarly because of
shared experiences.
Intention to stay: This term refers to an employee’s plan to remain working for
their current employer and is essentially the opposite of intention to leave (Chew & Chan,
2008). Intention to stay is important because it is an indication of whether an employee is
at risk of leaving the organization.
Millennials: The generational group whose individuals were born between 1980
and 2000 (Caraher, 2015; Deal & Levenson, 2016; Hartman & McCambridge, 2011;
Legas & Sims, 2011; Rainer & Rainer, 2011). This group has also been called
“Generation Y,” “Nexters,” and “Echo Boomers” (Parry & Urwin, 2011), and numerous
literature studies and publications, both academic and business–related, discuss this
group. While the literature identifies a range of birth years, for this study, I am using the
birth years 1980 - 2000 to define the millennial generation. This age range was selected
using the mathematical averages (median and mode) from an analysis of 32 publications
focused on Millennials, including both research studies and business publications. This
recap of published studies and the birth year range they identify for the different
generational cohorts is attached in Appendix A. There are currently 53.5 million
millennial workers in the U.S., comprising 34% of the total labor force (Fry, 2015).
Post-Millennials: The generational group whose individuals were born after 2000
(Deal & Levenson, 2016). The oldest members of this cohort are now turning 16 and

33
have not yet entered the full-time work force (Fry, 2015). For this reason, Post-
Millennials will not be addressed in this study.
Psychological contract theory: A theory describing an individual’s beliefs
regarding the terms and conditions of their employment and what is expected in the
exchange agreement between employees and their organizations, and vice versa
(Rousseau, 1989). The establishment of any psychological contract involves the belief
that a promise (either implicit or explicit) has been made and that a consideration has
been offered in exchange for the promise (Turnley & Feldman, 2000). A psychological
contract exists between an employer and its employees and is a reciprocal relationship,
meaning that both parties expect to get something out of the relationship. For example,
employers benefit from the work and effort of their employees, and in return, employees
expect fair treatment, safe working conditions, and continued employment (Bingham,
Oldroyd, Thompson, Bednar, & Bunderson, 2014).
Traditionalists: The term given to the generational group whose individuals were
born between 1925 and 1945 (Caraher, 2014; Costanza et al., 2012; Fry, 2015; Lancaster
& Stillman, 2010). This group has also been referred to as the “Silent Generation”
(Costanza et al., 2012; Fry, 2015), “Veterans” or “Matures” (Parry & Urwin, 2011). At
present there are 3.7 million Traditionalist workers in the U.S., and this group comprises
2% of the total labor force (Fry, 2015).
Work-related attributes: This term refers to what employees hope to receive
during the course of their employment with a specific organization. This construct is
drawn from the inducements or expectations in the psychological contract between the
employee and their employer (De Hauw & De Vos, 2010). Regarding these work-related

34
attributes, an employee’s expectations include, but are not limited to, salary, benefits,
training, professional development, career advancement, job security, work/life balance,
social connections, and meaningful work. Each of these terms is explored in greater depth
within the psychological contract section.
2.3 Theoretical Lens 1: Generational Cohort Theory
The task of trying to understand, motivate, and design human resource (HR)
policies to address each individual is daunting and almost impossible. Large
organizations can employ tens of thousands of workers, and to try to address the
preferences of every one of them individually is not feasible or practical. Therefore, the
idea of grouping them together based on some common attributes, needs, or expectations
is appealing. Many studies have demonstrated that various traits, such as loyalty to
organizations, work values, work motivators, and desired relationship with a boss diverge
across the generations, and for this reason generational cohort theory is often used to
explain these differences (D’Amato & Herzfeldt, 2008; Edmunds & Turner, 2005).
A generational cohort is a group of individuals similar in age who have
expereienced the same historical events within the same time period (Ryder, 1965).
According to generational cohort theory, important events and social changes in society
affect the values, attitudes, beliefs, and preferences of individuals (Ryder, 1965; Sessa,
Kabacoff, Deal, & Brown, 2007). Therefore, individuals born during a particular time,
who belong to the same cohort, will often share specific tendencies and cognitive styles.
These effects are assumed to continue over time (Jurkiewicz, 2000). Influential incidents
of a generational cohort could be positive or negative and might include traumatic
occurrences such as political events, wars, or armed conflicts. They could also involve

35
economic events – for example, financial market crashes or sizeable shifts in the
distribution of resources. Examples of other epic events that have affected the mindset of
previous generations include landing on the moon, the Civil Rights movement, major
wide-spread health events, and experiences like Woodstock that symbolize an ideology
(Sessa et al., 2007). Significant events that unfold during the earlier years of one’s life are
especially impactful because of how impressionable individuals are when they are very
young.
An alternative to generational cohort theory is the assumption that values,
attitudes, beliefs, and inclinations are primarily a function of age and maturity of
individuals, regardless of their generation. Generational cohort theory differs from this
perspective, suggesting that changes across generations are primarily a function of social
events rather than biological processes (Sessa et al., 2007). As such, cohort theory’s focus
on personal attributes supports the aspirations of this study to examine the relationship
between the millennial cohort, their expectations regarding the presence and levels of
work-related attributes, and what companies can provide Millennials to entice them to
stay.
2.3.1 Definition of the generations. The poulation today is comprised of five
generational cohorts whose ages range from infancy to over 100 years old. Within the
generational literature, the precise demarcation of each generation varies depending on
the author, but usually these variations are only a few years. The five generations are
commonly referred to as the Traditionalists, Baby Boomers, Generation X, Millennials
and Post-Millennials. Because this study focuses on retaining employees within
organizations, the Traditionalists and the post-millennial generation will not be discussed
36
in detail. The youngest Traditionalists are 71 years old and have exited, or are in the
process of exiting, the U.S. workforce. The oldest members of the post-millennial
generation are 16 years old and have not yet entered the workforce on a full-time basis.
However, the discussion of Baby Boomers, Generation X, and especially Millennials is
robust, as these are the generational cohorts that comprise 97% of the U.S. labor force
today (Fry, 2015).
Each generational cohort possesses different values, personalities, and skills based
on its experiences with life-defining events. These differences are most notable in the
workplace, where generational attitudes, values, and skills impact workplace
performance. Within the investigation of each generation, the birth range, characteristics,
and work preferences for each group are discussed in an attempt to better understand the
similarities and differences among the cohorts. After each generation is discussed
individually, the Baby Boomer, Generation X, and Millennial generations are compared
and contrasted with respect to work values and expectations concerning work-related
attributes.
2.3.2 The Traditionalist Generation. Employees born between 1925 and 1945
belong to the Traditionalist Generation (Gallup, 2016; Lancaster & Stillman, 2010) and
are also referred to as “Veterans” or the “Silent Generation” (Costanza et al., 2012; Parry
& Urwin, 2011). Today, only 3.7 million members of this cohort remain in the U.S.
workforce, and they account for just 2% of U.S. workers (Fry, 2015). This group, the
eldest generation represented in today’s workforce, was affected by several significant
world events, notably World War II and the Great Depression (Buahene & Kovary,
2003). They grew up in tough times where even the necessities of life - food, clothing,

37
and money - were scarce. The hardship of the war and the Great Depression had an
influence on the Traditionalists’ values, and as a result, many members of this group were
selfless with respect to their jobs, family, friends and communities (Cekada, 2012). This
group learned the value of hard work and followed rules in their working lives. Some of
the core values of this generation that carried over into their work ethic include loyalty,
discipline, respect for authority, dedication, and a desire to learn and gain knowledge
(Buahene & Kovary, 2003; Cekada, 2012).
2.3.3 The Baby Boomer Generation. Employees born between 1946 and 1964
belong to the Baby Boomer Generation (Buahene & Kovary, 2003; Caraher, 2014;
Cekada, 2012; Gallup, 2016; Howe & Strauss, 1991; Lancaster & Stillman, 2010) and are
also referred to as the “Thirteenths,” or the “Lost Generation” (Parry & Urwin, 2011).
There are 44.6 million members of this cohort in the U.S. workforce, accounting for 29%
of U.S. workers (Fry, 2015). The values and core beliefs of this cohort were shaped by
the Vietnam War, the Civil Rights movement, Watergate, the space race, the sexual
revolution, and Woodstock (Buahene & Kovary, 2003). According to Scheef and
Thielfoldt (2014), the Baby Boomer generation grew up during a period of economic
success, suburban prosperity with a strong family unit, thanks in large part to their
parents’ strong work ethic and self-sacrificing behavior. With this support and
confidence, once they entered the workforce, Baby Boomers made an impact
immediately. The members of this cohort are competitive, extremely hard working,
success-oriented, and loyal to their careers (Bell & Griffin, 2013; Scheef & Thielfoldt,
2003). With respect to their work attitudes, Baby Boomers are viewed as workaholics
who are “living to work” and who thrive on challenging work assignments (Callanan &
38
Greenhaus, 2008). Baby Boomers believe in company loyalty and lifetime employment
(McGuire, Todnem, & Hutchings, 2007); hence, they are more likely to stay with an
employer and not change jobs as frequently as other generations.
2.3.4 Generation X. Employees born between 1965 and 1979 belong to
Generation X (Caraher, 2014; Cekada, 2012; Gallup, 2016) and are also referred to as
“Baby Busters” or “Twentysomethings” (Parry & Urwin, 2011). Additionally, they are
sometimes labeled as the “lost” generation because this generation did not attract the
same level of attention from parents, teachers, government, or the media as Baby
Boomers did (Buahene & Kovary, 2003). This cohort is the second largest contributor to
the U.S. work force – with 52.7 million members representing 34% of the total U.S.
workers (Fry, 2015). This generation grew up in the shadow of the baby boom and due to
the hard-working, success-seeking mentality of the Baby Boomers; Generation X grew
up in a new type of environment. Unlike their own mothers, most Baby Boomer moms of
Generation X worked while their children were young. Divorce rates increased, and
children of this generation became “latchkey kids,” aptly named because they were often
home without adult supervision for some part of the day (Galambos & Garbarino, 1982).
Because members of this generational cohort did not have their parents fully involved in
their lives, they value work/life balance, choosing to spend time with their family and
having leisure time to enjoy (Bell & Griffin, 2013; Twenge, Campbell, Hoffman, &
Lance, 2010). Additionally, Generation X often saw their parents face job insecurity and
layoffs, so as they entered the workforce, they were skeptical and distrusting of their
employers (Bell & Griffin, 2013; Cekada, 2012; Lyons & Kuron, 2013). Therefore,

39
members of this generation do not hold the loyalty or commitment to a company that
previous generations did (Cekada, 2012).
2.3.5 The Millennial Generation. Employees born between 1980 and 2000
belong to the millennial generation (Caraher, 2015; De Hauw & De Vos, 2010; Deal &
Levenson, 2016; Hartman & McCambridge, 2011; Houck, 2011; Legas & Sims, 2011;
Rainer & Rainer, 2011) and are also called “Generation Y,” the “Entitled Generation,”
the “Net Generation,” “Nexters,” or “Echo Boomers” (Buahene & Kovary, 2003;
Cekada, 2012). They are also sometimes negatively referred to as “Slackers,” “Trophy
Kids,” “Digital Natives,” and the “Net Gen” (Chaudhuri & Ghosh, 2012). This cohort
contributes the largest number of workers, 53.5 million, to the U.S. workforce and
represents 34% of all U.S. workers (Fry, 2015). If Generation X was the ‘lost’ generation,
then this group could be considered the ‘found’ generation because, according to Zemke,
Raines, and Filipczak (2000), two-thirds of this generation were planned for and wanted
by their parents, who were typically very involved in the lives of their children.
Millennials have grown up leading overscheduled lives (Bell & Griffin, 2013), with
pressure to achieve as their parents obsessed over their accomplishments. They have
grown up surrounded by technology with video games, internet connectivity, social
media, and friends instantly accessible through the click of a few buttons on their mobile
phones. As a generation, Millennials have been encouraged to build closer relationships
with their parents, teachers, and coaches; as a result, they expect to develop personal
relationships with their supervisors and co-workers as well (Hershatter & Epstein, 2010).
Millennials have been categorized as spoiled, entitled, and impatient; this is likely
due to the way they were parented (Deal & Levenson, 2016). As children, Millennials

40
were encouraged to take part in many extracurricular activities and to take leadership
roles in school associations and clubs. All of their influential adult role models – parents,
teachers, advisors, and coaches – encouraged Millennials to collaborate with them rather
than simply follow their directives (Lancaster & Stillman, 2010). This led to Millennials
feeling confident and empowered, and expecting to not only have a voice and be heard
(Lancaster & Stillman, 2010), but for their ideas to be taken seriously (Caraher, 2014).
Therefore, it is no surprise that Millennials have high expectations to participate in
decision making.
This group has been affected by several significant world events, including
political and economic instability. For example, they have seen large multi-national
companies (such as Enron and MCI) exposed for their greed and corruption and
subsequently go out of business, leaving many people unemployed and without
retirement benefits. They have seen wide swings in the performance of the global stock
markets, double digit unemployment rates, and they witnessed the unthinkable 9/11
terrorists’ attacks on U.S. citizens.
2.3.6 The Post-Millennial Generation. These individuals were born after 2000,
and since the oldest members of this cohort are just turning 17, they have not yet entered
the adult U.S. workforce as full-time employees (Fry, 2015). This generation has also
been referred to as “Generation Z” (Homan, 2015; Horovitz, 2012), the “iGeneration“
(Rosen, 2010), and the “Homeland Generation” (Strauss & Howe, 1997). Since they are
not currently part of the U.S. workforce, this group will not be discussed or considered
within this study.

41
2.3.7 Comparison of the generations. Members of a generational cohort,
through shared experiences, tend to have similar values, motivators, preferences, and
priorities that they bring to work. Companies can keep these individuals engaged,
motivated, and desirous of staying with the organization by understanding what is
important to them. A comparison of the work values and preferences of the three key
generational cohorts that collectively comprise 97% of today’s U.S. workforce (Fry,
2015) is shown in Table 2. The defining characteristics indicated for each generational
cohort have emerged based on the events and experiences shared throughout their lives,
as discussed above.
Table 2: Work Values and Preferences by Generation
Work Values and Preferences by Generation
Characteristic Baby Boomers Generation X Millennials Work Values Success-oriented,
loyal to career Seek work/life balance
Self-reliant and team- oriented
Work Motivators Appreciation Autonomy Making a difference Relationship with Boss
Love/hate Boss is teacher Boss is mentor
View on Technology Mixed Tool Critical part of life Priorities Work Work/Family Social causes/family This generation works best when pursuing
Personal achievement Team-oriented goals
Career advancement and working in teams
Work style Sequential tasks Multitask Multitask Feedback preference Annually well-
documented Frequent feedback Instant feedback
Career Goals Build a stellar career Build a portable career
Multiple careers simultaneously
Outlook Optimistic Skeptical Hopeful Rules Change the rules Question the rules Norms or what rules?Most Valued Reward
Flexible work/retirement options
Flexible work, Professional Development
Respect & Financial Security
Note: Adapted from Bell & Griffin, 2013.
42
2.3.8 Comparison of engagement levels. Employee engagement is the key to
performance and retention (Corporate Leadership Council, 2004), and therefore,
companies spend a great deal of time, effort, and money trying to increase it. Highly
committed employees are 87% less likely to leave than employees with low levels of
commitment (Corporate Leadership Council, 2004). With this frame of reference, it is
important to investigate engagement levels and how they vary across the generations. In
their 2016 study of Millennials, the Gallup (2016) organization compared this generation
to the other generations that make up the U.S. workforce to assess levels of employee
engagement in the workplace. Their findings were that 29% of Millennials reported being
engaged; this compared to 32% for Generation X, 33% for Baby Boomers, and 45% for
Traditionalists. Gallup (2016) also measured those who were not engaged, and
Millennials reported the highest level of disengagement at 55%, followed by Generation
X at 50%, Baby Boomers 48%, and Traditionalists 41%. These findings are significant -
by not engaging millennial workers, companies are missing out on the opportunity to
leverage the skills and knowledge of this group and run the risk of having them leave
their organization in a time when having enough employees to meet their needs will be
difficult (Hartman, 2016).
2.3.9 Generational job seekers. One way to determine what is important to an
employee or a group of employees is to consider what they are looking for when
considering a new job. Gallup (2016) found that job-seekers were looking for several key
work-related attributes, and that the importance of these attributes varied by generation.
The attributes and relative importance to each of the generations are highlighted in Table
3. The top five attributes identified by Gallup (2016) as extremely important to

43
Millennials in order of importance were (1) opportunities to learn and grow, (2) quality of
manager, (3) quality of the company’s management, (4) interest in type of work, and (5)
opportunities for advancement. Opportunities to learn and grow and opportunities for
advancement refer to Millennials’ expectations that the company will invest in their
growth and development, which will lead to promotions. Additionally, Millennials want
to work for a great boss and an organization whose overall management team is
competent and presents themselves well (Jamieson, Kirk, & Andrew, 2013; Montana &
Petit, 2008; Uen, Wu, & Huang, 2009). Millennials need to be personally connected to
the company for which they work and, therefore, having an interest in the type of work
they do is high on their list of priorities. The scores for opportunities to learn and grow,
interest in type of work, and opportunities for advancement were higher for Millennials
then either Generation X or Baby Boomers (Gallup, 2016).
Table 3: Importance of Work-related Attributes
Importance of Work-Related Attributes
Millennials Generation X Baby Boomers Opportunities to learn and grow 59% 44% 41% Quality of manager 58% 50% 60% Quality of management 58% 52% 60% Interest in type of work 58% 57% 43% Opportunities for advancement 50% 42% 40%
Note: Adapted from How Millennials Want to Work and Live, Gallup, 2016
2.3.10 How Millennials are different. Millennials are, and will continue to be, a
key to filling the employment gap caused by previous generations exiting the workforce
because they comprise the largest group of workers in the U.S. workforce (Fry, 2015).
Therefore, companies have been focused on identifying and recruiting millennial
employees. However, Millennials are increasingly mobile and do not stay with
companies for long; the average tenure of Millennial employees with a company in their

44
first job is only 1 ½ years (Suleman & Nelson, 2011). Among all Millennials who leave
an organization, the median tenure is only 1.8 years (Ware, 2014). The Bureau of Labor
Statistics reported that from 2006 to 2016, the average employee between the ages of 20
and 24 stayed with an organization for 1.3 years, whereas the average employee between
the ages of 25 and 34 stayed with an organization for approximately 3 years. Ng,
Schweitzer, and Lyons (2010) opined that this high level of turnover for Millennials was
because they preferred multiple job movements. By changing jobs frequently, Millennials
believe they can get ahead quicker and make the level of salary they feel they deserve.
Others suggest that this sense of entitlement in Millennials is linked to their being
impatient about advancement, perhaps fueled by having been raised in an environment of
hyper support with rewards for even the smallest accomplishments (Tulgan, 2016).
2.4 Theoretical Lens 2: Psychological Contract Theory
Psychological contracts are an important consideration in the employee-employer
relationship and have been described as “individual beliefs in a reciprocal obligation
between the individual and the organization” (Rousseau, 1989, p. 121). In organizational
research, the typical parties involved in a psychological contract are the individual
employee and the organization (Argyris, 1960; Levinson, Price, Munden, Mandi, &
Solley, 1962). From the employee perspective, a psychological contract describes what
the employee expects to receive from the employer in return for their work output.
Employees first have these beliefs and expectations during the pre-employment stage,
more specifically referred to as an “anticipatory psychological contract” (De Hauw & De
Vos, 2010; Rousseau, 1990). Employees continue to hold these expectations throughout
45
their employment with an organization, though their expectations will likely change and
evolve.
Although most often cited, Rousseau was not the originator of the term
psychological contract; the concept was first introduced by Argyris (1960) in describing
the evolving relationship between shop foremen and employees. However, in
contemporary research, Rousseau (1989)advanced the concept, which describes the
relationship between the employee and their employer. A psychological contract also
defines the work to be done. This agreement is separate and apart from the formal written
contract of employment which, for the most part, only identifies mutual duties and
responsibilities in a generalized form.
Psychological contracts are made up of transactional obligations and relational
obligations, both of which are important to employees (Rousseau, 1995). The
transactional expectations that employees hold are for adequate compensation, safe
working conditions, and a guarantee of short term employment in exchange for
fulfillment of their contractual work obligation (Rousseau, 1995). The relational
expectations involve training, development, fair treatment, and long-term job security,
again in exchange for the employee satisfactorily fulfilling their job duties.
These promises often develop during recruiting, orientation, and subsequent
interaction with coworkers and supervisors. Therefore, psychological contracts are
naturally subjective, making it difficult for organizations to understand and fulfill them.
In addition, employers do not always take the time to clarify expectations, which lowers
the likelihood of meeting the employees’ expectations, resulting in a breach of the
psychological contract. Ignorance of an employee’s expectations regarding work-related

46
attributes is just one form of breach of the psychological contract. Another breach
involves an employer knowing what an employee expects but not delivering or only
partially meeting the employee’s expectations. Not honoring a commitment to the
employee results in more than an unfulfilled promise; it also leads to lower trust in the
organization (Robinson, 1996). When an organization fails to fulfill its promises,
employees can respond in three ways: increased intention to quit, neglect of in-role job
duties, and/or decreased organizational citizenship behaviors (Turnley & Feldman, 2000).
Additionally, if an employee feels that the promises made by the employer are not
honored, they will likely become dissatisfied, not feel valued (Porter & Steers, 1973), and
their intention to leave the company to work for another that will meet their expectations
regarding work-related attributes will increase.
In summary, Millennials have many expectations of both the company and the
supervisor for whom they work (De Hauw & De Vos, 2010). They expect high salaries,
promotions soon after they join the organization, professional and personal development,
the opportunity to have sufficient work/life balance, and flexibility in their job.
Millennials also expect to have fulfilling personal relationships with their supervisor and
co-workers and to do work that makes a difference within their organization. Many of
these expectations would not be in their formal, written job offer and hence comprise a
psychological contract with the person who hired them and the overall organization. If
their immediate manager were to leave or move on, the employee would still expect the
organization to honor this contract.
The concept of a psychological contract is tied to the individual’s commitment to
the organization. Commitment to the organization, according to Mowday, Porter and

47
Steers (1982), can be characterized by three factors – acceptance of the organization’s
culture and values, willingness to exert extra effort on behalf of the organization, and
willingness to remain an employee of the organization. The willingness to stay factor is
of most interest with respect to this study because it is closely linked to the dependent
variable under investigation – an employee’s, specifically a millennial employee’s,
intention to stay.
Understanding the impact of psychological contract theory on employees’ work
expectations is crucially important to this study. Millennials have high expectations of the
work-related attributes of salary, advancement, development, work/life balance, and
personal relationships at work, to name just a few. If these expectations are not met,
Millennials may consider it a violation of the psychological contract they believe they
have with their employer, which “can have detrimental effects on a number of outcomes”
(De Hauw & De Vos, 2010, p. 293). Since the list of Millennials’ work expectations is
long and the components costly, organizations must develop and offer creative and
inexpensive ways to successfully manage Millennials’ expectations.
2.4.1 Work-related attributes. Work-related attributes are what employees
receive in return for their employment contributions with a specific employer. This
construct is drawn from the inducements or expectations in the psychological contract
between the employee and employer (De Hauw & De Vos, 2010). There are many types
of work-related attributes, some financial and others non-financial. These include, but are
not limited to, salary, benefits, training, professional development, career advancement,
job security, work/life balance, social connections, and meaningful work. The value and
impact of work-related attributes vary across individuals and generations; attributes that

48
may be valued by a member of the Baby Boomer Generation might not be valued by a
member of the millennial generation. Since this study focuses primarily on Millennials, it
is important to understand their expectations regarding work-related attributes.
2.4.2 Millennials’ expectations regarding work-related attributes. Millennials,
like all employees, have specific expectations of what they want from their careers and
what they hope to receive in return for their employment with a specific organization.
These expectations around work-related attributes incorporate many of the same
expectations of other generations, including good salary, benefits, training, professional
development, career advancement, and job security. But Millennials have other
expectations that may be a direct result of how they were raised, such as the need for
work/life balance, accelerated promotion and advancement, social connections at work,
and meaningful work. Such expectations of Millennial employees differ from other
generations (Bell & Griffin, 2013; Gallup, 2016), and it is important for company leaders
to understand this divergence. Understanding the job expectations of Millennials can help
a company determine the offerings both extrinsic and intrinsic that would best meet the
needs of these employees (Bannon, Ford, & Meltzer, 2011) and thus increase the
likelihood of their remaining with the company for a longer period of time.
2.4.3 Overall compensation. Salary is an important factor to all employees, and
Millennials are no exception (Gallup, 2016). According to Gallup (2016), nearly half
(48%) of Millennials say that overall compensation is extremely important. There are
differences of opinion regarding how important salary is to Millennials. Some of the
literature indicates salary is the single most important factor to Millennials and that the
level of pay and financial benefits drive Millennials’ choice of employers more than

49
anything else (Deloitte Touche Tohmatsu, 2016b). Others claim that while pay is
important, different work-related attributes are more important to Millennials, such as
working in a job and for a company where the work is meaningful and contributes to
society (Rawlins, Indvik, & Johnson, 2008). Millennials are not interested in money for
materialistic purposes or what it can buy, as were the Baby Boomers. Rather, Millennials
are interested in the flexibility and social connectivity that it provides (Rainer & Rainer,
2011). They want good salaries so that they can travel and pay for their mobile phones
and service so that they can stay connected to family and friends.
Salary is likely of key importance to Millennials because of the financial situation
that most Millennials find themselves in. Debt is a significant concern for Millennials
(Pew Research Center, 2014), as many are saddled with high levels of student loans
(Gallup, 2016) and feel the pressure of making these payments for many years after they
leave school. In fact, 46% of the Millennials surveyed by Deal & Levenson (2016) say
that financial debt affects their career decisions, which is why they are so focused on
compensation. Millennials’ need to make enough money to pay off their student loans
quickly becomes a principal driver for their career decisions (Deal & Levenson, 2016).
Millennials feel that once these debts are paid off, they can save enough money to buy a
home and still have discretionary income to pursue leisure activities and personal
interests (Deal & Levenson, 2016). Additionally, many Millennials see their parents
being downsized or made redundant as well as increasing numbers of homeless people.
The fear of that happening to them likely drives them to seek a salary large enough to
protect themselves.

50
2.4.4 Career advancement and promotion. One job expectation of Millennials
frequently mentioned in the literature is the opportunity for career advancement (Bell &
Griffin, 2013; Deal & Levenson, 2016; Deloitte Touche Tohmatsu, 2016b; Erickson,
2009; Gallup, 2016; Solnet & Hood, 2008; Solnet et al., 2012; Suleman & Nelson, 2011;
Wong, Gardiner, Lang, & Coulon, 2008). At ease with new technology and the notion of
constant change, Millennials have come to expect everything immediately, including
challenging career opportunities. Millennials desire and expect to be promoted quickly
within their organizations (Erickson, 2009; Lau, Chan, Tai, & Ng, 2010; Ng et al., 2010).
Pooley (2006) reiterated this assertion, suggesting that Millennials are so impatient for
advancement that they are not willing to wait more than two years to get promoted.
Pooley (2006) went on to assert that Millennials are willing to leave a company for
another opportunity that promises a faster track to advancement. This desire for quick
advancement often leads to the criticism that Millennials come into organizations feeling
‘entitled’ not willing to pay their dues or put in the time necessary to earn a promotion
(Deal & Levenson, 2016; Ferri-Reed, 2012; Lancaster & Stillman, 2010). If this desire
for fast advancement is not fulfilled, it could lead to dissatisfaction and an increased
intention to leave the organization.
2.4.5 Recognition. Recognition is a special type of feedback that is important to
Millennials (Hershatter & Epstein, 2010; Ng et al., 2010). Being recognized for their
work and contributions is important to Millennials and research has demonstrated that
sufficient attention and recognition can contribute to Millennial loyalty and intention to
stay (Hershatter & Epstein, 2010; Ng et al., 2010). Recognition can come in the form of
both formal recognition such as awards, promotions, letters of commendation; and

51
informal recognition such as verbal praise, or highlighting an individual’s
accomplishment in a team or company meeting. According to Deal and Levenson (2016),
Millennials would like rewards and recognition more frequently than organizations
typically offer them. They identified that Millennials frequently receive rewards or
recognition annually but would prefer to receive them monthly or quarterly.
2.4.6 Training and development. Millennials do not feel their skills are being
fully developed by their current employers, a key reason why many leave a company for
other opportunities (Deloitte Touche Tohmatsu, 2016b). Training and development are
important to Millennials, and they expect to receive both from the companies for which
they work. A significant amount of published literature identifies professional
development as one of the most important job-related attributes for Millennials (Caraher,
2014; Deal & Levenson, 2016; Deloitte Touche Tohmatsu, 2016b; Rainer & Rainer,
2011). A predominant number of Millennials consider professional or career growth and
development opportunities as extremely important (Gallup, 2016), as they view such
opportunities as the vehicle to achieve promotions and salary increases more quickly.
2.4.7 Coaching and frequent feedback. With respect to how they are managed,
Millennials do not want bosses, they want coaches (Brack, 2012; Gallup, 2016).
Millennials care about having managers who can coach them, helping them identify and
build their strengths. They see coaching and mentoring from their boss as a large part of
their professional development, which is extremely important to them. Regarding the
coaching they expect to receive, Millennials desire more frequent feedback (Bannon et
al., 2011; Gallup, 2016; Kilber, Barclay, & Ohmer, 2014) on their performance than
generations before them (Caraher, 2014; Hays, 2014; Twenge, Campbell, & Freeman,

52
2012) . Within this feedback, Millennials expect their manager to focus on their strengths
and what they are doing well (Gallup, 2016) to ensure that they are on a linear
progressive path which will lead to them ascending to the next level (Epstein & Howes,
2008). Additionally, Millennials want relevant feedback about their performance
frequently enough so they can act on it (Rainer & Rainer, 2011). Constant feedback and
performance readjustments are ways Millennials have learned to stay on track during
times of change. “Feedback and praise serve as reinforcement as well as a corrective
mechanism for this generation” (Suleman & Nelson, 2011, p. 42).
Millennials are often described as needy because they want to know how they are
doing on a regular basis (Deal & Levenson, 2016). This need for ongoing feedback is
likely attributable to their pre-employment experiences where they received frequent
feedback. In school and then through college, grades on papers, tests, and quizzes
provided ongoing feedback. During non-school time, feedback was frequent as well, from
activities such as playing sports and interacting with friends (either face-to-face or
virtually) (Deal & Levenson, 2016, p. 53). This need for ongoing, frequent, and
supportive feedback could be related to their use of, prowess with, and dependency on,
technology. Finally, with respect to the timing of feedback, Millennials want it monthly
or more frequently (daily or weekly), and only 23% say they get feedback that often
(Rainer & Rainer, 2011).
2.4.8 Meaningful work experiences. Millennials desire work that is meaningful,
makes a difference (Hewlett, Sherbin, & Sumberg, 2009; Ng et al., 2010), and benefits
society in some way (Kapoor & Solomon, 2011). Therefore, this need for meaning
perhaps drives their desire to work for a company that, in their mind, is doing important

53
work that makes society a better place. Research has demonstrated that performing
meaningful work can contribute to Millennial loyalty and retention (Lancaster &
Stillman, 2010; Ng et al., 2010). In their work, Rawlins, et al. (2008) found that for
Millennials, doing meaningful work was more important than the salary they earned.
Broadly speaking, Millennials want to do work they feel is meaningful with organizations
they believe are good corporate citizens (Deal & Levenson, 2016). What this means will
likely vary from one Millennial to another, but companies need to invest the time to
determine how to leverage Millennials' desire for meaningfulness.
2.4.9 Flexibility/flexible work hours. Millennials desire freedom, flexibility and
variety in their job. With regard to performing their job, Millennials value the freedom to
be creative in solving problems and performing tasks in their own way, and in the way
they think is best (Holt, Marques, & Way, 2012; Ozcelik, 2015). The importance of
flexibility to Millennials was highlighted by Rainer and Rainer (2011), who found that
Millennials value flexibility in their work almost as much as money. Given the
importance that earning a high salary has to Millennials, this desire for flexibility is
significant. There are a number of other studies that highlight the importance of
flexibility to Millennials (Bell & Griffin, 2013; Deloitte Touche Tohmatsu, 2016b;
Terjesen, Vinnicombe, & Freeman, 2007). This desire for flexibility is also likely related
to another key job expectation that Millennials have – work/life balance.
2.4.10 Work/life balance. Work/life balance is extremely important to the
millennial generation (Holt et al.,2012),. In their work, Rainer & Rainer, 2011) found that
having good work/life balance was the number one factor in job selection for
Millennials., perhaps due to the Millennials seeing their parents working long hours,
54
prioritizing work over family, being extremely loyal to their employer yet still getting
laid off and divorced (Ng et al., 2010). In addition, escalating terrorism and the 9/11
attack on U.S. soil may have heightened Millennials’ awareness of their own mortality
and that they must appreciate and enjoy their families more. In addition, Millennials tend
to have close relationships with their parents and want to spend time with them. Perhaps
for some or all of these reasons, this generation values work/life balance, greatly
preferring to spend time with their family and having leisure time to enjoy (Bell &
Griffin, 2013; Twenge et al., 2010).
2.4.11 Personal relationship with Supervisor / co-workers. Personal
relationships are very important to Millennials, and they have a strong need to feel
connected to someone (Hays, 2014; Lyons et al., 2012). This need carries over to their
working life and can be satisfied by having a meaningful relationship with their
supervisor or co-workers, or both. Though they love technology, Millennials are high
touch and “relational beyond their immediate families” (Rainer & Rainer, 2011, p. 19),
meaning they seek healthy relationships at work and beyond. Therefore, despite the
importance of having easy access to the latest technology at their workplace, the human
aspect of work is even more important to them. Feeling personally connected to the
company they work for is important to Millennials (Rainer & Rainer, 2011). If they do
not feel emotionally connected to their work, whether through workplace friends, team
members, or their boss, they are more likely to consider leaving the company. A
connection, with a boss who they feel cares about them, or colleagues with whom they
have things in common and can relate to, are important to Millennials. Wong et al. (2008)
referred to this as a desire for social connectedness. This desire to be connected carries

55
over to Millennials’ attitudes about collaboration and working in teams, which they enjoy
(Tews, Michel, Xu, & Drost, 2015). Working closely with others in a team environment
reminds them of the comfortable and safe feelings they had while working in teams when
they were younger, both in school and out of school.
Hershatter and Epstein (2010) found that Millennials expect to develop a
personal relationship with their superiors at work, which was echoed in the Gallup (2016)
study where Millennials indicated that conversations with their boss “must be about more
than work” (Gallup, 2016, p. 38) . While Millennials do not always feel comfortable
discussing life outside of work with their manager, those who feel they can talk with their
manager about non-work-related issues plan to stay with their current organization
(Gallup, 2016). Their relationships with their bosses are just as important to Millennials
as their relationships with their friends at work or the teams of which they are a part
(Gallup, 2016), but often times this need is not being met. In their study of Millennials,
Rainer and Rainer (2011) found that 20 to 40% of Millennials do not feel as if their
managers are meeting their needs for this connection and sense of community.
2.4.12 Workplace fun. Millennials expect and desire their work to be
challenging and fun (Caraher, 2014; Rainer & Rainer, 2011); however, this is not fun for
fun’s sake. Millennials desire to make the act of performing their job fun, believing they
can be more productive at work if they can have a little fun along the way (Lancaster and
Stillman, 2010). The millennial generation grew up having fun when learning in school.
Teachers often used fun and learning through play to engage and interest them. This
phenomenon has been extended into the workplace through gamification as a way to aid
and enhance adult learning. Having fun at work has been found to positively impact job
56
satisfaction and diminish Millennials’ intention to leave an organization (Tews, Michel,
& Stafford, 2013). Additionally, Tews et al (2015) found that Millennial job seekers were
more attracted to workplaces involving fun than those that just offered attractive
compensation packages and promising advancement opportunities. Rainer and Rainer
(2011) supported this desire for fun on the part of Millennials, saying having fun at work
was among the top five work-related attributes in job selection for Millennials. Working
in teams is one source of fun at work for Millennials (Myers & Sadaghiani, 2010).
Companies wishing to retain their millennial workers should therefore make sure that
they provide an opportunity for Millennials to have fun at work, such as incorporating
team-building into the work environment.
2.4.13 Job security. Millennials want stability for their job and paycheck, and
Gallup (2016) found that over half of Millennials (53%) identified job security as very
important to them. Similarly, Guillot-Soulez & Soulez (2014) confirmed in their study
that Millennials graduating college and entering the work force, on the whole, had a
preference for job security. According to Hershatter & Epstein (2010), Millennials
believe that their employers should provide job security. This was also found to be true
by Murphy, Gibson, and Greenwood (2010), who determined that security was in the top
five most valued attributes for Millennials. While Millennials enter the workforce with
low expectations regarding job security, they do value job security highly (“Focus on
Millennials,” 2016). Millennials often view job security as feeling confident that they will
be able to keep their positions during tough economic times, rather than seeing job
security as working for the same company for 25 years and retiring with a company paid

57
pension (Kowske et al., 2010). Still other studies found Millennials more in need of job
security than previous generations (Smola & Sutton, 2002; Twenge et al., 2010).
2.4.14 Strong leadership. According to their study on Millennials, Gallup
(2016) found that 58% of Millennials said that the quality of a company’s management /
leadership is extremely important to them and that they wanted to work for a company
where they can be proud of how the leaders present and conduct themselves. Millennials
want to be able to trust company leadership and have confidence in the direction in which
it is steering the company. This dimension of quality of leadership is tied closely to the
overall reputation of the company. In addition, the nature and tone of the communication
coming from leadership is important to Millennials. Good communication will help
Millennials understand their role in the organization, and may break down some of the
distrust Millennials have of big business (Brack, 2012).
2.4.15 Having a say. Millennials expect to have more involvement in decision-
making, a flat hierarchy, and a lack of formality regarding status and structure (Myers &
Sadaghiani, 2010). They also expect access to senior leadership (Hershatter & Epstein,
2010). Unlike their older colleagues, who may have been expected to hold their tongues
and do what was asked of them, Millennials not only want and expect to be heard
(Hartman & McCambridge, 2011) but expect that their ideas will be taken seriously
(Caraher, 2014). They also expect open communication from their supervisors and
managers, even about matters normally reserved for more senior employees (Gursoy,
Chi, & Karadag, 2013; Martin, 2005).
2.4.16 Study relevance to organizations. With respect to this study, a company
must understand the characteristics and work preferences of their employees and appeal
58
to what is important to retain their employees. Millennials are a key to filling the
employment gap but they typically leave companies much more quickly than employees
from previous generations. Therefore, it is crucial for managers to understand what
Millennials expect and provide it to them. In so doing, managers can satisfy and retain
these employees, thereby taking advantage of their talents and skills (Bannon et al.,
2011). Preventing the loss of valuable human capital and the company-specific
knowledge and skills they hold is just one key reason for retaining employees. There are
also a significant number of financial benefits to retaining employees. These include
higher productivity, lower recruiting and training costs, fewer temporary employee costs
to cover for the vacancy, and the forgone opportunity costs associated with managers
having to replace the employee instead of running the business. These costs can be
categorized into opportunity costs and direct costs. Opportunity costs include the
management time associated with recruitment, selection, induction, onboarding, training,
and administration. Direct costs associated with employee turnover include
advertisements, recruiter agencies (recruiter) fees, and the costs of interviewing and
running assessments.
Millennials have a higher likelihood of changing jobs, making it vital for
organizations to understand them and provide the work-related attributes that Millennials
expect. By so doing, companies can increase the probability of keeping them and keeping
them longer. On the flip side, Millennials’ enthusiasm to look for better opportunities
means organizations that understand what is important to Millennials can be more
successful in attracting them (Gallup, 2016). As the shortage of talent increases,
Millennials will continue to be a key to filling this gap for workers in the U.S. Companies

59
that know what Millennials are seeking at work and in their careers, will have a
competitive advantage in acquiring them.
2.5 Theoretical Lens 3: Employee Retention, Turnover and Intention to Stay
Employee turnover and retention are important topics facing companies in the
U.S., and turnover continues to command widespread—and now global—attention (Hom,
2011). Employee turnover occurs when employees leave their jobs and must be replaced
(Goud, 2014), which results in costs to the employer from lost productivity, job
advertising costs, training new employees, etc. Companies want to monitor the movement
of employees out of the organization so they can identify and minimize causes of
turnover. Monitoring turnover is an important activity for organizations, and controlling
turnover is one of the many quantitative ways to positively impact an organization’s
bottom line. With respect to the cost associated with turnover, both Gilbert (2011) and
(Deloitte Touche Tohmatsu, 2016a) estimate it to be as high as 150% of the lost
employee’s annual salary. As an example, using the 150% cost of turnover from Gilbert
(2011) and Deloitte (2016a), a 500 person company experiencing 10% annual turnover,
which pays its employees an average of $70,000 per year, would experience an annual
turnover cost of $5.25 million.
Turnover is an issue because of lost productivity and increased organizational
costs. Hancock, Allen, Bosco, McDaniel, and Pierce (2013) found a negative relationship
between turnover and organization performance, which was confirmed by Hausknecht
and Trevor (2011). One reason for this negative relationship might be that organizational
performance is impacted by the turnover of talented team members. The loss of skilled
employees can slow reaction time, thereby allowing competition to get an advantage

60
(Kiessling, Harvey, & Moeller, 2012). The costs of turnover can be categorized into four
areas: separation of employee (such severance pay, payment of accrued benefits, etc.),
loss of productivity (a new person may take 1 to 2 years to reach the productivity of an
existing person), recruiting costs to find a replacement, and training costs of the new
employee. Another cost is the disengagement and lessened productivity of those
employees who remain with an organization and see employees leaving. Other negative
impacts involve customer service issues, exacerbated by new workers who can make
errors, take longer to solve problems, and disrupt the relationships built between an
organization and its customers (Goud, 2014). A final cost of turnover is the psychological
and emotional impact upon employees who remain after experiencing employees exiting
an organization. There are two types of psychological and emotional impacts that concern
the employees who have not left. One type is survivor guilt - which concerns why they
were lucky enough to get to stay. Survivor guilt, according to Brockner, Grover, Reed,
DeWitt, and O’Malley (1987), describes the psychological reactions including anxiety
about job loss, decreased loyalty to the firm, and guilt feelings regarding departed co-
workers. Survivor guilt involves the remaining employees’ feelings about getting
additional overtime or receiving paychecks when their former co-workers no longer work
at the company.
The second type of psychological and emotional impact on remaining employees
is their envy of seeing departing employees getting to start over, sometimes after
receiving generous severance packages, which causes those who remain to feel more like
victims rather than survivors (Noer, 2009). What these employees are feeling, according

61
to organizational psychologists, are the emotional, psychological and physical effects of
remaining employed after other employees have left an organization.
In addition, staff turnover can create insecurity for remaining staff members, who
may begin questioning whether their own job is set to be eliminated. If the turnover was
due primarily to departing employees, remaining staffers might struggle with questions of
why they left and if there are better opportunities. This type of insecurity can cause
employees to be less efficient and spend an undue amount of time questioning the state of
the company as they may attribute turnover to the nature of the workplace (Hom &
Griffeth, 1995; Hom, Lee, & Griffeth, 2012). These and other social and human capital
costs can often be far greater than the salary of the replacement employee, which in most
cases is essentially the same as the salary of the departing workers (Hancock et al., 2013).
Retention, the decision of an employee to stay with their current employer, is
preceded by an employee’s intention to stay. Therefore, the intention to stay construct is
often viewed as the opposite of intention to leave and is usually considered in the realm
of employee retention and turnover. An employee leaving a company is not unusual and
not unexpected; during their 20 – 30 year working career, workers will typically change
jobs several times. Millennials, on the other hand, change jobs much more frequently and
often do not stay at their employers long. According to Adkins (2016), Millennials
change jobs four times in their first decade out of college. That is nearly double the
number of job changes Baby Boomers made in their first ten years out of college (Long,
2016). Therefore, in order to meet their human resource needs, companies must
determine how to retain their millennial employees.

62
2.5.1 Categories of turnover. There are two broad categories of turnover:
voluntary and involuntary. Voluntary turnover involves the conscious and purposeful
decision on the part of the employee to leave the organization, while involuntary turnover
generally is a departure that is not the employee’s choice. The U.S. Bureau of Labor
Statistics (2017b), tracks the number of employees who leave organizations and
categorizes these separations into quits, layoffs and discharges, and other separations.
Quits are generally voluntary separations initiated by the employee, and the ‘quits rate’
can serve as a measure of workers’ willingness or ability to leave jobs. Layoffs and
discharges, on the other hand, are involuntary separations initiated by the employer.
Finally, other separations include retirement, death, disability, and transfers to other
locations of the same firm. There are many reasons why workers choose to leave their
jobs voluntarily. According to Yang, Wan and Fu (2012), there are five primary reasons
employees voluntarily leave their jobs:
1. salary and benefits
2. individual emotional conditions
3. company factors
4. responsibilities and work style
5. content of the work
Employees often leave their current employee for financial reasons to increase
their overall compensation, which can include a higher salary or bonus, and/or improved
benefits, such as better health insurance coverage, enhanced retirement/pension options,
and tuition assistance. Other times employees leave their current employers due to
individual emotional conditions, which include stress, burnout, emotional exhaustion,
depersonalization, and reduced confidence in one’s ability to be successful (Maslach,
Schaufeli, & Leiter, 2001). A third category of reasons why employees leave is related to

63
the company and includes such factors as reputation loss, scandal, change in ownership
leading to uncertainty, and bankruptcy or insolvency. A fourth category includes
responsibilities and work style-- how much or how little responsibility an employee is
entrusted with and how the work actually gets done. This can include whether decisions
are made centrally or locally and whether the work is done in formal, structured meetings
or informal engagements. The final category of reasons why employees leave their
employers involves the actual content of the work, specifically what workers do and how
what they do is changing. As the nature of their work changes, employees may feel
uncertainty and angst, which could lead to dissatisfaction and then departure (Shropshire
& Kadlec, 2012).
For this study, I am most interested in voluntary turnover, especially preventable
voluntary turnover, that which Abelson (1987) refers to as turnover that is
organizationally avoidable. By this he means that if the organization had acted to address
something that was causing the employee to be dissatisfied, then the organization might
have prevented the employee from leaving.
2.5.2 Intention to stay. Intention to stay refers to an employee’s plan to remain
in the present employment relationship, working for their current employer for the
foreseeable future. This is essentially the opposite of intention to leave (Chew & Chan,
2008) and is an inverse concept of turnover intention or intention to quit. Vandenberg
and Nelson (1999) defined employees’ intention to quit as the estimated probability that
an employee would permanently leave their organization at some point in the near future.
Intention to stay is important because it is an indication of whether an employee is at risk
of leaving. If a company knows one of their employees is at risk for leaving, and they

64
want this employee to stay, then they can take pro-active steps to address areas of
dissatisfaction for that employee. If these preventative actions are significant enough as
determined by the employee, then it will likely influence the employee to reconsider how
they feel about the organization and, perhaps, decide to stay. Managers are often not
aware that an employee is unhappy and contemplating leaving the organization until it is
too late and the employee has resigned.
2.5.3 Organization challenges. As a result of the competition for skilled
employees, which Chambers, Foulton, Handfield-Jones, Hankin, and Michaels III (1998)
have called a “war for talent”, retention has been a significant problem for managers
(Goud, 2014). Millennials, who by 2020 will represent approximately half of the U.S.
workforce (Mayfield & Mayfield, 2014), are a key to filling this employment gap. In
order to hold on to their important and scarce human capital, companies should use
different retention approaches in managing each generation. Company managers and
their HR partners need to understand what is causing their valuable employees to leave
and provide the incentives needed to prevent them from leaving their organization (Goud,
2014).
2.5.4 Millennial turnover. The relationship between age and retention is
significant when it involves the intention of employees to leave a job (Govaerts, Kyndt,
Dochy, & Baert, 2011). Millennials change jobs and leave companies more frequently
than workers from other generations. Lyons, Schweitzer and Ng (2015) studied the
frequency of job changes per year to compare this phenomenon across generations, and
they found that Millennials had significantly more career moves annually than other
generations. Millennials experienced twice the number of career moves than Generation

65
X, three times the moves of Baby Boomers, and 4.5 times as many as Traditionalists
(Lyons et al., 2015). Millennials are a challenging set of employees to keep, since they
have so many characteristics that differ from past generations (Lyons et al., 2015).
Millennials view employment and their ability to get a job differently due in part to their
higher levels of education, prowess with technology, and the confidence that have
developed throughout their lives (Gilbert, 2011). Furthermore, Millennials are more
prepared to leave when a good opportunity arises, or proactively look for other
opportunities when their needs are not being met within their current organization
(Crainer & Dearlove, 1999). Some of the reasons that turnover is higher for Millennials
than for other generations include the importance that Millennials place on career goals,
especially the time it takes to achieve their aspirations, and other unexpected events, such
as a mentor leaving or a change in the flexibility in their working schedule (Seibert,
Kraimer, Holtom, & Pierotti, 2013). Other contributing factors to high rates of Millennial
turnover include the absence of promotions, job security, challenging and exciting work
tasks, training, and development of new skills (Goud, 2014).
Based on the literature review, including academic and professional contributions,
this study will advance a hypothesis regarding Millennials and the impact that work-
related attributes have on retaining them. It will also consider whether or not employees
from different generations value these work-related attributes differently. The hypothesis
driving this study is identified in the following section.
2.6 Hypotheses
Millennials are quite different from other generational cohorts. These differences
manifest themselves in many ways, including the values and expectations concerning

66
their work. Specifically, Millennials have different expectations with respect to the work-
related attributes they want from an employer compared to other generations. While this
phenomenon has been addressed in the literature, it has primarily been a theoretical
discussion. This study investigates it from a practical and empirical approach, studying
working Millennials to determine what work-related attributes a company can provide to
retain them. Additionally, the work-related attributes preferred by Millennials are
compared to those that are important to other generations, in an effort to determine if they
differ. Thus, I offer the following two hypotheses, the null hypothesis which asserts that
there is no difference in how Millennials and other generations value work-related
attributes, and the alternate hypothesis which asserts that Millennials value work-related
attributes differently than other generations. Specifically, these two hypotheses are stated
as:
H0: There is no difference in the value Millennials place on work-related attributes
compared to the value that workers from other generations place on these attributes.
H1: Millennials place different values on work-related attributes than workers from other
generations.
Based on the generational differences in attitudes and preferences among the
generations, I expect to find that the work-related attributes that are important to
Millennials will differ from those that are important to workers from the previous two
generations and, therefore, I expect to reject the null hypothesis and accept the alternate.
2.7 Summary
While in the past the workforce faced the problem of job scarcity, meaning that
there were not enough jobs to go around, today organizations are dealing with the issue of

67
talent scarcity (D’Amato & Herzfeldt, 2008). As older generations exit the U.S.
workforce through retirement, new workers are needed to fill these voids. It is expected
that more workers will be needed to feed the growing U.S. economy. Millennials will be
the key to filling both gaps. However, Millennials are different than previous generations
regarding their work expectations and what they are looking for from employers in
exchange for the blood, sweat, and tears they shed on the employer’s behalf. The ability
to retain Millennials will require organizations to understand the needs, wants, and
expectations of this generation. Managers and HR professionals will need to tailor their
policies and procedures relative to work-related attributes to retain Millennials (Gilbert,
2011). With regard to their future staffing needs, organizational leaders that cannot keep
skilled workers within their firm will have to search for talent outside the organization
(Kiessling et al., 2012), and these replacement workers will likely come from the
millennial generation given the large and growing contribution of Millennials to the U.S.
workforce. Therefore, it is in a company’s best interest to focus on satisfying the
expectations of their current millennial employees in an effort to retain them.

68
CHAPTER 3
METHODOLOGY
Using the conceptual theories of generational cohort, psychological contract and
employee turnover and intention to stay, this study focuses on identifying the importance
that various work-related attributes play in millennial employees’ intention to stay with a
company. One way to increase the likelihood that Millennials will stay with a company is
to provide them every work-related attribute possible and at generous levels; however,
this is not feasible or sustainable. Therefore, it is imperative for companies to determine
which attributes hold the highest relative importance for Millennials. Employees’
intention to stay is addressed by identifying which specific combination of work-related
attributes might influence Millennials to continue working for their current employer. It
is proposed that the strength of such attributes’ influence upon Millennials’ intention to
stay with their employer may be moderated by the position of the employee (manager vs.
non-manager). This study of the derived preferences for these work-related attributes was
done using conjoint analysis to survey a sample of employees, including Millennials,
Baby Boomers, and Generation Xers, in a health care company headquartered in the
southwestern U.S. The purpose of the study was to empirically assess the relative
importance employees places on key work-related attributes. The goal of this research is
to determine the ideal combination of work-related attributes that are most likely to retain
Millennials and to determine if this combination is different for workers from other
generations.
The first step in any conjoint analysis study is to determine which attributes will
be included in the survey. Because the search of the literature identified many work-
related attributes that are important to workers, and because these vary in strength
69
between different generations, I first had to identify which work-related attributes to
include in the conjoint analysis instrument before I could field the survey. Therefore, my
research was conducted in two phases.
Described first are the objective of the study, the targeted population, and the
recruitment methods I used for phase 1, followed by a description of the research design,
the methodology used to collect data, a profile of the participants, and the results. I then
provide a full report of the methods and procedures used in phase 2, - from an overview
of the conjoint method of multivariate analysis to survey design, survey pilot test,
identification of the sample population, participant recruitment, data collection, and data
analysis techniques.
3.1 Independent Variables
The independent variables in the study are the work-related attributes provided to
employees in exchange for their employment; these attributes include monetary and non-
monetary components. After completing the literature review and an initial screening
survey in phase 1 of the research, I narrowed the independent variable list to six specific
work-related attributes. These are (1) career advancement, (2) work/life balance, (3)
company leadership, (4) job security, (5) having a say, and (6) role clarity. Other
variables include demographic information and the employee’s position within the
organization, specifically whether they are a manager of other employees or an individual
contributor.
3.2 Dependent Variable
Within this study, the dependent variable of interest is the job selected by
employees from among multiple sets of hypothetical jobs presented. Employees selected

70
the job that would increase their intention to stay with their current employer. The job
that most satisfies the employee would likely lead to increased job satisfaction, thereby
influencing the employee to stay. While intention to stay is an important construct in this
model, as previously mentioned, measuring it is outside the scope of this study.
3.3 Research Design
The research design was a field study focused on workers who were grouped
together into generational cohorts. The generational cohort of prime interest is millennial
workers; their preferences regarding work-related attributes were compared with the
preferences of workers from other generational cohorts. The key benefit of this research
strategy is the realism it affords, because it engages subjects and surveys them about their
existing work experience and expectations. It is less obtrusive to the study participants
because they can respond in their natural setting to questions about which work-related
attributes they would like to receive, that will influence them to stay with their employer
longer. Despite this benefit of realism, field studies do have issues, namely lack of
generalizability to the entire population.
Conjoint analysis was used to determine the relative importance of these work-
related attributes to Millennials; results were compared with the values that other
generations place on the same work-related attributes. Conjoint analysis is a popular
marketing research method primarily used to analyze the trade-offs a consumer is willing
to make when deciding among multi-attributed products or services (Green, Krieger, &
Wind, 2001; Green & Srinivasan, 1978). It presents combinations of attributes that
respondents are asked to evaluate according to their preference. From these evaluations,
the relative importance of each attribute can be determined (Green & Wind, 1975; Kapur

71
et al., 2008) based on posterior probabilities (Gilbride et al., 2008). Conjoint analysis has
also been used in the fields of organization behavior and management to investigate and
understand trade-offs made in various aspects of these disciplines. These studies include
how work-related attributes influence candidates’ decisions to join and stay with a
company (Baum & Kabst, 2013), how personality impacts hiring (Moy & Lam, 2004),
and how understanding the strategic consensus process within organizations is vital
(Stepanovich & Mueller, 2002).
3.4 Research Study - Phase 1
The first phase was designed to take the information gathered in the literature
review to determine the key work-related attributes that influence workers’ intention to
stay with their organization. Based on the literature, the 25 work-related attributes found
to be important to Millennials are listed in Appendix B. These attributes were then placed
in an on-line survey executed via Survey Monkey and sent to a convenience sample
sourced using contacts at the University where I am completing my doctoral degree. This
survey ranked the work-related attributes in order of importance. The participants’
responses were collated and grouped according to generational cohort, from most to least
important, and then distilled down to a smaller, more manageable number.
3.4.1 Research design and methodology – phase 1. As mentioned, the first step
in creating a CBC survey is to identify the attributes of the product of interest to the
researcher. The objective of phase 1 of my study, therefore, was to narrow down the 25
work-related attributes listed in Appendix B to the most important ones, which would be
carried into phase 2 of the research. I developed a survey that asked participants to rate
each of 25 work-related attributes on how important they were to the respondent and how

72
much they would influence the respondent’s decision to continue working for their
current employer. The respondents were asked to rate each attribute on the following
Likert scale:
1 - Not at all important to me in influencing me to stay with my current company
2 - Somewhat important to me in influencing me to stay with my current company
3 - Important to me in influencing me to stay with my current company
4 - Very important to me in influencing me to stay with my current company
5 - Extremely important to me in influencing me to stay with my current company
3.4.2 Participant profile and recruitment process - phase 1. The sample for
the first phase of the research included 76 undergraduate, graduate and doctoral students
from the University of Dallas Gupta College of Business. This sample was chosen
because of the access I have there as a doctoral student and because these groups would
align with the target participant group for the study – workers from different generations
– Millennials, Baby Boomers and Generation X. Having representation from each
generational cohort helped validate, augment, and prioritize the preliminary list of work-
related attributes that had been derived from the extant literature. The undergraduate
students were invited to participate by their instructor who sent them a link to the survey
and offered extra credit for their participation. The graduate students and doctoral
students were invited to participate via email, which included the link to the survey.
Copies of these emails are included in Appendix C (doctoral students) and Appendix D
(graduate students).
3.4.3 Ethical considerations – phase 1. I have been trained in the appropriate
and responsible protocols in dealing with human subjects in research, and my National
Institute of Health (NIH) Office of Extramural Research certificate of training is included
in Appendix E. I utilized this knowledge and training to ensure each participant was

73
treated ethically and responsibly. The required University of Dallas Institutional Review
Board (IRB) approval was obtained prior to the research beginning, which is included in
Appendix F. Informed consent was addressed within the survey instrument through the
inclusion of the following statement in the survey instructions – “Your completion of the
survey constitutes your affirmation that your participation is voluntary, that you are at
least 18 years of age, and that you grant the researcher(s) permission to use your data.”
All information was gathered and stored on a password protected computer to safeguard
the anonymity of the source. Additionally, the results of phase 1 are only reported in the
aggregate, and no individual responses are identified.
3.4.4 Data collection – phase 1. Phase 1 of the research was executed via a
Survey Monkey questionnaire in April and May 2017; this survey is attached in
Appendix G. Of the 118 surveys distributed, 76 of them were completed, which is a 64%
response rate. The number of surveys sent out, responses received, and the response rate
from each of these three groups is listed in Table 4. The undergraduate student response
rate of 95% was extremely high, likely because the course instructor offered course extra
credit for participation. The doctoral students’ DBA response rate was 59% while the
graduate student group’s response rate was 44%.
Table 4: Phase 1 Survey Completion Rates
Phase 1 Survey Completion Rates
Group Requests
Sent Completed Responses
Completion Rate
UD undergraduate students 41 39 95% UD doctorate students 22 13 59% UD graduate students 55 24 44% Total 118 76 64%

74
The respondents for phase 1 of the study were made up of members from each of
the key generational cohorts – Baby Boomers, Generation X, and Millennials. Of the 76
respondents, 7 (9%) were Baby Boomers, 13 (17%) were Generation X and 56 (74%)
were Millennials. The Millennial group had a larger number of respondents because it
was offered to three classes of undergraduate students who were given extra credit for
participating. The generational cohort composition of this group is identified in Table 5.
Table 5: Phase 1 Participant Survey Composition
Phase 1 Participant Survey Composition
Group
Baby Boomers
Generation X
Millennials
Completed Responses
UD undergraduate students
0 0 39 39
UD DBA doctoral students
6 6 1 13
UD graduate students 1 7 16 24
Total 7 13 56 76
Composition 9% 17% 74% 100%
3.4.5 Results – phase 1. The results from phase 1, tabulated by respondent
group, reveal the top ranked work-related attributes on a scale of 1 to 5 as advancement
(4.27), strong manager (4.16), strong senior leadership (4.14), role clarity (4.05), job
security (3.99), and work/life balance (3.98). The remainder of the top 10 rankings
includes retirement plan (3.93), coaching (3.93), role importance (3.87) and having a say
(3.84). The complete ranking of the attributes is shown in Table 6.
Since the focus of this study is Millennials and how their preferences for work-
related attributes compare to those of workers from other generational cohorts, it is
important to analyze the results through this strategic lens. The work-related attributes are
ranked from 1 – 25 by generation in Table 7. The top ranked attributes for Millennials are
advancement (4.29), strong management (4.13), role clarity (4.13), strong senior

75
leadership (4.09), job security (4.02) and work/life balance (3.88). For Generation X, the
top attributes are work/life balance (4.38), strong senior leadership (4.31), having a say
(4.31), strong management (4.27), and advancement (4.23). Finally, for Baby Boomers,
having a say (4.83) is the top ranked attribute followed by role importance (4.50),
work/life balance (4.17), strong management (4.08), strong senior leadership (4.00) and
advancement (4.00).
In order to combine the results from all generations, I calculated the straight-line
average of the rankings by adding the scores for each attribute for the three generations
and then dividing by 3. The resultant ranking of this approach is (1) having a say, (2)
advancement, (3) strong manager, (4) work/life balance, (5) strong senior leadership and
(6) role clarity. The results of this ranking are shown in Table 8.
Another way to get an average score would be to take the overall combined score
for each attribute; however, the high concentration of Millennials (74%) would influence
the average making it closer to the Millennial score, and in the process, discount the
results from the other generations. Therefore, this method was not used.

76
Table 6: Phase 1 Results by Respondent Group
Phase 1 Results by Respondent Group
Work-related Attribute Undergrads DBA
Students Graduate Students Total Rank
Advancement 4.31 3.92 4.39 4.27 1 Strong Manager 4.05 3.75 4.57 4.16 2 Strong Sr. Leadership 4.08 3.92 4.36 4.14 3 Role Clarity 4.08 3.50 4.30 4.05 4 Job Security 3.90 3.17 4.57 3.99 5 Work/Life Balance 3.85 3.92 4.22 3.98 6 Retirement Plan 3.77 4.00 4.17 3.93 7 Coaching 3.97 3.33 4.17 3.93 8 Role Importance 3.85 4.00 3.83 3.87 9 Having a say 3.72 4.17 3.87 3.84 10 Salary 3.64 3.67 4.13 3.80 11 Reputable Company 3.69 3.67 4.04 3.80 12 Personal Development 3.69 3.83 3.78 3.74 13 Recognition 3.74 3.58 3.78 3.73 14 Creativity 3.49 4.08 3.65 3.64 15 Supervisor Availability 3.46 3.33 3.96 3.59 16 Fun Place to work 3.74 3.17 3.48 3.57 17 Friendly relationships 3.49 3.08 3.57 3.45 18 Flex Hours 3.15 3.50 3.87 3.43 19 Social Responsibility 3.36 3.25 3.48 3.38 20 Tuition reimbursement 3.23 2.67 3.35 3.18 21 Social connectivity 3.33 3.00 2.91 3.15 22 Giving Back 2.77 2.17 3.04 2.76 23 Student loan assistance 3.08 2.00 2.22 2.64 24
Work from Home 2.54 2.33 2.96 2.64 25

77
Table 7: Phase 1 Results by Generation
Phase 1 Results by Generation
Attribute Score Attribute Score Attribute Score
Advancement 4.29 Work/Life Balance 4.38 Having a say 4.83
Strong Management 4.13 Strong Sr. Leadership 4.31 Role Importance 4.50
Role Clarity 4.13 Having a say 4.31 Work/Life Balance 4.17
Strong Sr. Leadership 4.09 Strong Management 4.27 Strong Management 4.08
Job Security 4.04 Advancement 4.23 Strong Sr. Leadership 4.00
Coaching 4.02 Personal Development 4.08 Advancement 4.00
Work/Life Balance 3.88 Retirement Plan 4.08 Supervisor Availability 4.00
Retirement Plan 3.82 Creativity 4.08 Reputable Company 4.00
Role Importance 3.78 Salary 4.00 Salary 4.00
Salary 3.73 Flex Hours 4.00 Creativity 3.83
Personal Development 3.73 Role Clarity 4.00 Role Clarity 3.83
Reputable Company 3.71 Job Security 3.92 Friendly relationships 3.83
Recognition 3.67 Role Importance 3.85 Retirement Plan 3.83
Having a say 3.64 Reputable Company 3.77 Flex Hours 3.67
Fun Place to work 3.62 Social Responsibility 3.77 Coaching 3.67
Supervisor Availability 3.53 Recognition 3.77 Recognition 3.67
Creativity 3.47 Supervisor Availability 3.69 Job Security 3.67
Friendly relationships 3.44 Coaching 3.62 Fun Place to work 3.50
Flex Hours 3.29 Friendly relationships 3.46 Social Responsibility 3.50
Social Responsibility 3.26 Tuition reimbursement 3.38 Personal Development 3.33
Tuition reimbursement 3.18 Fun Place to work 3.38 Social connectivity 3.17
Social connectivity 3.16 Social connectivity 3.08 Tuition reimbursement 2.67
Student loan assistance 2.80 Work from Home 2.92 Giving Back 1.50
Giving Back 2.78 Giving Back 2.85 Work from Home 1.33
Work from Home 2.64 Student loan assistance 2.38 Student loan assistance 1.17
MILLENNIALS (n=55) GENERATION X (n=13) BABY BOOMERS (n=6)

78
Table 8: Phase 1 Results by Combined Ranking Method
Phase 1 Results by Combined Ranking Method
COMBINED - straight line average Attribute Score RankHaving a say 4.26 1 Advancement 4.17 2 Strong Manager 4.16 3 Work/Life Balance 4.14 4 Strong Sr. Leadership 4.13 5 Role Clarity 4.04 6 Role Importance 3.99 7 Retirement Plan 3.91 8 Salary 3.91 9 Job Security 3.88 10 Reputable Company 3.83 11 Creativity 3.79 12 Coaching 3.77 13 Supervisor Availability 3.74 14 Personal Development 3.71 15 Recognition 3.70 16 Flex Hours 3.65 17 Friendly relationships 3.58 18 Social Responsibility 3.51 19 Fun Place to work 3.50 20 Social connectivity 3.13 21 Tuition reimbursement 3.08 22 Giving Back 2.38 23 Work from Home 2.30 24 Student loan assistance 2.12 25
3.5 Research Study - Phase 2
Phase 2 of my study consisted of designing and fielding an online choice-based
conjoint (CBC) analysis survey to determine workers’ preferences for jobs that contained
different combinations of work-related attributes. Conjoint analysis is a set of quantitative
tools or techniques that include many different conjoint methods (Orme, 2009), and while

79
asking respondents to rank or rate hypothetical product profiles has been a common
conjoint approach in market research, I chose to use CBC analysis for my study. The use
of CBC methodology is becoming more prevalent as analysis techniques have become
more sophisticated, and it is now the methodology used most often in academic research
(Orme, 2009).
3.5.1 Research design and methodology – phase 2. The generally accepted
protocol for designing and implementing conjoint analysis research projects consists of
these steps: 1) select attributes, 2) determine attribute levels, 3) determine attribute
combinations, 4) select the form of presentation of stimuli and nature of judgments to
secure from respondents, 5) select the analysis technique, 6) evaluate and interpret
results, and 7) apply the results (Hair, Black, Babin, Anderson, & Tatham, 1998; North &
De Vos, 2010). Using Sawtooth Software’ Lighthouse Studio program, which was
provided through an academic grant for my research, I created my CBC survey
instrument by completing steps 1-4, which are discussed below; steps 5 - 7 are discussed
in subsequent chapters.
Step 1: Select attributes - Attributes are the key features of the product in question
(American Marketing Association, 2000); in this study, the ‘product’ was a job with
specific work-related attributes that a company provides its employees. The literature
suggests that the selection of attributes be guided by the objectives of the study (North &
De Vos, 2010). As noted above, I used work-related attributes important to Millennials
and other generations. I then used the results from phase 1 to narrow down the list of
attributes to 6, because this is the maximum number of attributes that can be used for full
profile CBC analyses (Chrzan & Orme, 2000).

80
I used the ranking of attributes from phase 1 as the starting point. I decided to
combine strong manager and strong senior leadership into one attribute called ‘company
leadership’ since both attributes seem closely related and intertwined. In addition, since
this study is focused on investigating which work-related attributes are important to
Millennials, I chose the top five ranked attributes to Millennials (after combining strong
management and strong senior leadership), and then I added the attribute of having a say.
I chose to add this attribute because it was the highest ranked attribute in the combined
ranking and was ranked first with Baby Boomers and third with Generation X
participants. Considering that another key objective of this study is to compare how the
different generations value work-related attributes, it made sense to include an attribute
that, while not necessarily important to Millennials (ranking 14th to the millennial
participants), was important to non-Millennials. Thus, career advancement, company
leadership, work/life balance, role clarity, job security and having a say became the six
attributes to carry into phase 2 of the study.
Salary, an attribute that has been purported to be very important to Millennials, is
not one of the attributes that was included in the Phase 2 study. The principal reason for
not including it is because it was not in the top six for either Millennials or the combined
group of participants in Phase 1. Since only six attributes can be accommodated with the
CBC analysis tool, salary therefore did not warrant being included. Another primary
reason for not including it was the concern that respondents could become fixated on one
of the only hard numbers to be included in the attribute list, which might have
overshadowed all other attributes. For this reason, and because it was not in the top six of
the attribute rankings, salary was excluded from the Phase 2 portion of the study.

81
Participants were told to consider the various job profiles assuming that salary, and all
other non-represented attributes, were the same for all of job profiles presented.
It is important to the success of any conjoint study that the attributes are clearly
understood by participants so that perceptual differences between individual respondents
are not mistaken for actual differences as to their preference for the work-related
attributes (American Marketing Association, 2000). In order to reduce possible
confusion, it was important that the attributes - in this case the work-related attributes - be
clearly understood by respondents (Hair et al., 1998). To address this possible confusion,
I provided descriptions / definitions of the work-related attributes immediately prior to
the task profile questions.
Step 2: Determine attribute levels - Attribute levels refer to the specific quantities
or qualities of the attributes or features of the product under study; as such, attribute
levels should be meaningful, informative, and realistic (American Marketing Association,
2000). The literature suggests that the range for various attributes be larger than the range
normally available, but with consideration that a larger number of levels will increase the
number of stimuli that respondents will be asked to judge (North & De Vos, 2010). For
the attributes of having a say, company leadership, role clarity, and job security, the
levels I chose to use were gradients of the attributes, meaning little to none, an average
level of the attribute, or high levels of the attribute. For example, for the attribute of
having a say, the three levels of the attribute I chose to use are having little to no say,
having an average level of say, or having a high level of say. Having a say refers to
having the opportunity to provide input into company decisions. Regarding work/life
balance and career advancement, I chose to use more specific, numerical ranges. For

82
work life balance, the levels I selected were work 40 – 45 hours per week, work 46 – 50
hours per week, and work greater than 50 hours per week. Similarly, for the attribute of
career advancement, the levels I used were advancement within 2 years, advancement in
2 -4 years, and advancement after 4 years or more.
Step 3: Determine attribute combinations - One of the most important decisions in
designing a conjoint analysis study is the selection of profiles or concepts - that is, the
combination of attributes and levels for the respondent to evaluate (Hair et al., 1992). In a
CBC study, three questions need to be answered here: 1) whether to present full or partial
profiles; 2) how many profiles to present per task; and 3) how many tasks respondents
should be asked to complete (Orme, 2014).
Full profiles are those that display every attribute from the study in every profile;
partial profiles include only a subset of the attributes under study. Full profiles yield
better response data and can be used for studies with up to about six attributes (Chrzan &
Orme, 2000); because there were six attributes that I wanted to investigate in my study, I
used full profiles.
To decide upon the number of profiles per task and the number of choice tasks to
include in my survey, I considered several factors. A critical aspect of CBC survey design
is to maximize the number of choice tasks that respondents will complete to optimize the
precision of results, while not making the survey so long that respondents become
fatigued or bored and abandon the survey before completion (Chrzan & Orme, 2000).
According to Orme (2014), a CBC survey with 200 – 250 respondents and as few as 8
choice tasks can yield sufficient and valid data. Surveys with a lower number of
respondents require participants to answer a larger number of tasks. A study of conjoint

83
analysis research projects revealed respondents could be expected to provide reliable
answers on surveys with up to 20 choice tasks (Johnson & Orme, 2002). Typically, a
CBC survey consists of an average of 12 to 15 choice tasks (Orme, 2014). To determine
the exact number of tasks for my survey, I needed to consider the number of participants
I expected would complete the survey because the number of tasks and the number of
responses are closely related.
At this point in my research, the number of qualified respondents I would be able
to recruit was unknown and I was concerned that I might not be able to identify enough
participants to ensure a statistically significant sample. Considering this fact, I needed to
select and present enough choice tasks to compensate for the unknown number of
respondents. The recommended rule of thumb for determining sample sizes for full-
profile CBC analysis is as follows:
∗ ∗500
where n is the number of respondents, t is the number of tasks, a is the number of
alternatives - or concepts - per task, and c is the number of analysis cells, which is equal
to the largest product of levels of any two attributes (Orme, 2010b). Typical CBC studies
include 3 to 5 profiles per task (Orme, 2014). To simplify the choices for my respondents
and because I anticipated using a higher than average number of tasks, I decided to offer
the lower number of choice alternatives, thus making my value of a = 3. I also knew that
my c was equal to 9 (3 x 3). I conservatively estimated my value of n to be 200. Inserting
these values for n, a, and c, I solved for t as follows:
200 ∗ 12 ∗ 39
500
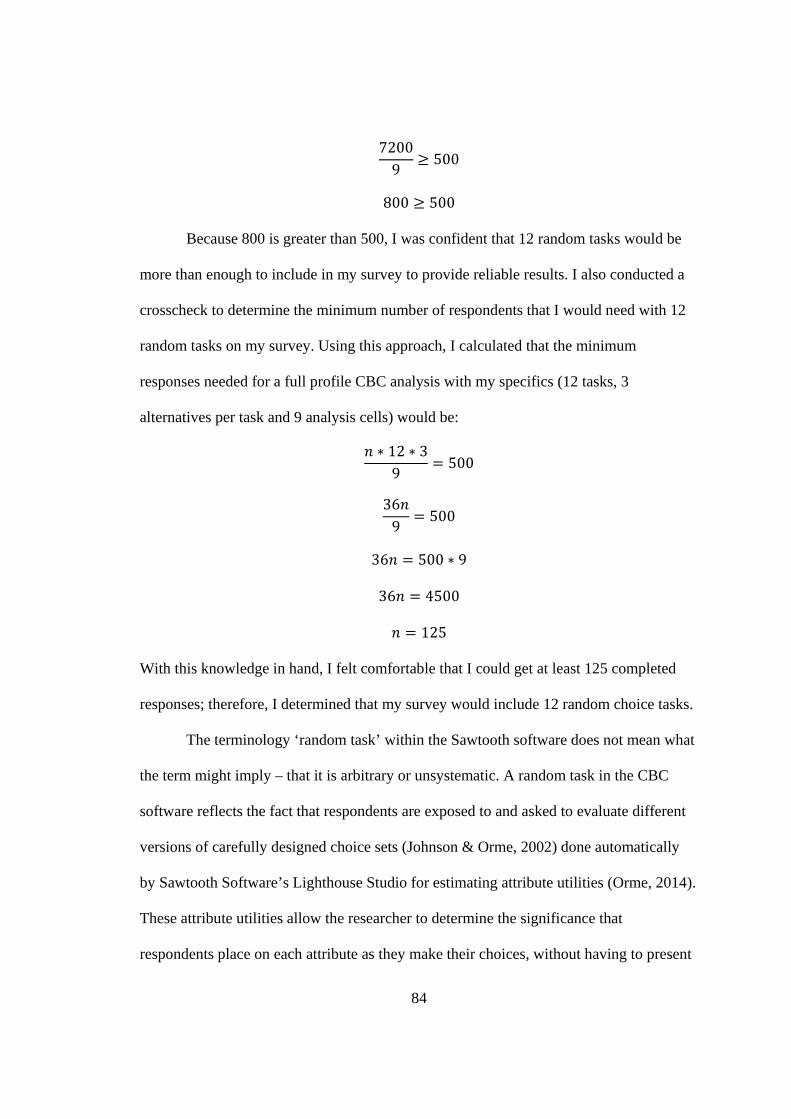
84
72009
500
800 500
Because 800 is greater than 500, I was confident that 12 random tasks would be
more than enough to include in my survey to provide reliable results. I also conducted a
crosscheck to determine the minimum number of respondents that I would need with 12
random tasks on my survey. Using this approach, I calculated that the minimum
responses needed for a full profile CBC analysis with my specifics (12 tasks, 3
alternatives per task and 9 analysis cells) would be:
∗ 12 ∗ 39
500
369
500
36 500 ∗ 9
36 4500
125
With this knowledge in hand, I felt comfortable that I could get at least 125 completed
responses; therefore, I determined that my survey would include 12 random choice tasks.
The terminology ‘random task’ within the Sawtooth software does not mean what
the term might imply – that it is arbitrary or unsystematic. A random task in the CBC
software reflects the fact that respondents are exposed to and asked to evaluate different
versions of carefully designed choice sets (Johnson & Orme, 2002) done automatically
by Sawtooth Software’s Lighthouse Studio for estimating attribute utilities (Orme, 2014).
These attribute utilities allow the researcher to determine the significance that
respondents place on each attribute as they make their choices, without having to present

85
all possible choices to all respondents. Random CBC survey design uses profiles
(sampled randomly, with replacement) from the universe of all possible profiles and
places them into choice sets. Although some overlap occurs, no two profiles are
permitted within a choice set that are identical on all attributes (Orme, 2010b).
In addition to random tasks, the inclusion of between 2 and 4 fixed choice tasks,
also known as hold-out tasks, is recommended as a means of checking the validity of the
utilities found for the random choice tasks (Orme, 2014). In my study, I included 2 fixed
choice questions - questions that are asked exactly the same way for each respondent - for
a total of 14 choice tasks. Additionally, my survey included various definition and
instruction screens and requests for background data about the respondents. The
background data, including age, gender, job type, and education level, were all used to
analyze the results in different ways to investigate the effect they may have had on the
selected work-related attributes’ importance.
While the 14-task full profiles made up the bulk of the survey, I did add two
additional questions at the request of the participating company. After briefing them on
the conjoint questions that were going to included, the company asked if I could include a
question about the employee’s intention to stay with the organization, as management
wanted to know how the employees were feeling about the company and if they were
looking to leave. To that end the first question I added was - Based on your current
situation, do you see yourself with this organization three years from now? The answer
choices provided were yes, no, or unsure.
The company also wanted to come away from the survey with something it could
address immediately that would have a significant short-term impact and improve

86
employees’ likelihood of staying with the company. As such, the final additional question
I added was - If (company name removed) was going to improve any one of the work-
related attributes addressed in this survey, which one would have the greatest positive
impact on you continuing to work for the company? In responses to this question,
participants could select from career advancement, company leadership, role clarity,
work/life balance, job security or having a say. These questions were an accommodation
to the participating company, and the results from these questions will not be combined
with the results from the conjoint analysis survey. The reason for not combining these
two sets of data is because the conjoint survey was based on hypothetical roles within an
organization, while the two added questions deal with the actual working environment
within the participating company.
3.5.2 Participant profile and recruitment process - phase 2. The sample for
this portion of the research was comprised of the members of the commercial team of a
specific division of a large healthcare company operating in the medical device field,
located in the Southwest part of the U.S. For confidentiality reasons, the company’s name
and specific industry are withheld in order to protect its identity. The total number of
employees for this division is approximately 450, of which over 150 are Millennials. The
details of this sample, including composition by generation, both in raw numbers and
mix, as well as the company’s turnover history, are shown in Table 9. Based on the age
stratification within the millennial group, I was able to split Millennials into 2 sub-
groups: Millennials (born 1980 – 1989) and younger Millennials (born 1990 – 2000). I
did this because the literature indicates that the values and behaviors of the younger set of

87
Millennials differ from older Millennials (Bell & Griffin, 2013; Deloitte Touche
Tohmatsu, 2016b; Gallup, 2016; Rainer & Rainer, 2011).
This sample was selected for several reasons, but primarily because I had ready
access and permission to use it. In addition, it was selected because the sample is made
up of a large percentage (34%) of Millennials, but also includes significant numbers of
the other generational groups under examination. A third reason for selecting this sample
was because of the disproportionately high millennial turnover rates this organization is
experiencing. Over the last 2 years, millennial turnover accounted for 40% of all turnover
as compared to the 30% of the company’s workforce that Millennials represent. This is
reflective of the business problem being addressed by this research. A final reason that
this sample was chosen is because I have a relationship with this organization, and I am
hopeful that the findings of my research may help the company reduce its high millennial
turnover rates.
Table 9: Composition and Turnover History of Participating Company
Composition and Turnover History of Participating Company
Generation Birth Years # of
Employees
% of Division
Work Force
Voluntary Turnover
% of Turnover
Traditionalists 1900 – 1945 1 0% 0 0% Baby Boomers 1946 – 1964 82 17% 4 11% Generation X 1965 – 1979 227 49% 18 49% Millennials 1980 – 2000 157 34% 15 40% Post Millennials 2001– present 0 0% 0 0% Total 467 100% 37 100%
Step 4: Select how the profiles (grouping of attributes) will be presented and how
to present these profiles to the respondents in order to collect their reaction and response
to them - This step was completed simultaneously with step 3 as the Sawtooth Software

88
program created the 12 random choice tasks based upon the specific attributes and level
descriptions that I had identified in steps 1 and 2.
As a final step, I used the functionality with the Sawtooth software to ensure that
my survey design was efficient. An optimally efficient CBC study is level balanced -
meaning that each attribute level appears approximately the same number of times
throughout the surveys. The software evaluates survey efficiency by estimating standard
errors for the survey design and comparing them to ideal standard errors for a design that
was precisely orthogonal (Orme, 2014). The actual standard errors and ideal standard
errors for each attribute level within my survey were between 0.02532 and 0.02578
respectively, thereby confirming that the design was indeed efficient. The results of this
design evaluation are included in Appendix H.
3.5.3 Ethical considerations – phase 2. The same process described in the phase
1 ethical considerations was followed to ensure that each participant in phase 2 was
treated ethically and responsibly. The required IRB approval was obtained prior to the
research beginning. I addressed informed consent with each participant by the inclusion
of the following statement in the survey instructions: “Your completion of the survey
constitutes your affirmation that your participation is voluntary, that you are at least 18
years of age, and that you grant the researcher(s) permission to use your data.” The letter
of IRB approval for phase 2 of the study is included in Appendix I. All information was
gathered and stored on a password protected computer to safeguard the anonymity of the
respondents. Like the approach used in phase 1, the results will only be reported in the
aggregate. Additionally, to honor the desire for confidentiality of the company
participating in the research, the company will not be identified by name or specific

89
industry. Additionally, the company will only be described by the field of business in
which it operates and general location to protect its identity.
3.5.4 Survey pilot test – phase 2. Prior to launching the CBC survey within the
participating company, I conducted a pilot test to evaluate the survey and the process of
accessing and completing it. I invited 14 colleagues to participate in the pilot test by
completing the on-line CBC survey, which they accessed through a secure link sent via
email. The email that I sent to request their participation in the process is included in
Appendix J. The goal of the pilot phase was to have several people, whose opinions I
trusted and valued, take the survey and provide critical feedback and suggestions for
improvement. The feedback I received allowed me to make minor adjustments to the
survey, specifically to further clarify the instructions and to present a more realistic
estimate for completing the survey (8 minutes, versus the 10 -15 that I had originally
anticipated).
3.5.5 Data collection – phase 2. Phase 2, the conjoint analysis survey, was
executed using Sawtooth Software’s Lighthouse Studio package and is attached as
Appendix K. The communication and permission to participate in the survey were
emailed to the members of the participating organization from the General Manager and
the Vice President of Sales. This email communication was distributed on June 30, 2017
and is attached in Appendix L. I followed up this communication with an email on the
same day which explained the survey and provided the link to the Sawtooth Software
server site that hosted the survey and stored the data. My email included an explanation
of the process and the procedures I would use to ensure anonymity of the participants and
the confidentiality of their individual responses, along with the information needed to

90
access the survey. This email is attached in Appendix M. Final reminder notifications
from the organization and me are attached in Appendix N and Appendix O, respectively.
3.5.6 Data analysis – phase 2. The first four recommended steps in conducting a
conjoint analysis study as suggested by Hair et al. (1998) and North and De Vos (2010) -
selecting attributes, determining attribute levels, determining attribute combinations, and
determining and selecting how the profiles will be presented and participants’ responses
collected - were discussed in the Survey Design section above. Step 5 - selecting the
analysis technique and deciding how to aggregate responses – is discussed here. The final
two steps in the process - evaluating and interpreting results and applying the results -
will be discussed in the fifth and final chapter.
Conjoint analysis is a set of techniques; therefore, the results of conjoint analysis
studies can be analyzed by looking at the data in various ways. In my study, I used
techniques to calculate part-worth utilities and determined attribute importances, each of
which is explained below.
Part-worth utilities are the marginal utilities of the independent variables (each of
the six work-related attribute levels) and are numeric indications of how much impact
each level of each attribute has on the dependent variable, which is the respondents'
choice of job profiles. Part-worth utilities, therefore, are a measure of the relative
desirability of each level of each attribute. The higher the utility, the more desirable the
attribute level and the greater impact it has on how respondents choose products (Orme,
2014) - or in this case, select among job offerings with various combinations of work-
related attributes. The part-worth utilities were calculated using the Choice-Based

91
Conjoint | Hierarchical Bayes (CBC-HB) module within Sawtooth Software's Lighthouse
Studio software.
There are two ways that conjoint data can be examined - on an aggregated or
disaggregated basis. The disaggregated method produces utilities at the individual level
before combining them and, therefore, captures the true heterogeneity of the respondents'
preferences (Orme, 2014; Orme & Heft, 2002). On the other hand, the aggregated method
produces a single set of utilities that summarizes the preferences of the entire sample. In
using the Hierarchical Bayes (HB) method to estimate the part-worth utilities of the CBC
data I gathered, I obtained disaggregated (individual) data that was then aggregated for
the entire sample. The software also allowed for the investigation of sub-groupings based
on demographic information and generational cohort membership based on the
respondent’s age. Based on the concept of posterior probability, and using the actual
choice data obtained from my respondents, the HB method of estimation allowed me to
capture the unique preferences of my individual respondents, as well as segmented
groups of respondents, without having to present all 729 (6 attributes, 3 level possibilities
= 3 ) possible combinations to each of my respondents. The relative importances of
attributes were analyzed to determine how much impact each attribute had on the total
utility, or desirability, of the hypothetical work-related attributes (Orme, 2010a). An
output from Sawtooth Software's CBC-HB model is the attribute importances for each
attribute in the study.
The results of these conjoint analyses are presented in Chapter Four and discussed
in Chapter Five.

92
3.6 Limitations
While the CBC methodology offers many advantages over other conjoint
techniques, it does have some disadvantages. First, because each concept is described
using several attributes and each choice set contains several concepts, respondents must
read and process a lot of information before making their choice on each task. This can
lead to respondent fatigue and / or inconsistency in their choices, which could
compromise the reliability of the data (Orme, 2014). My survey consisted of a total of 14
choice tasks (12 random and 2 fixed), which is more tasks than average for most CBC
studies. This could have increased the drop-out rate and resulted in more incompletes. It
does not appear that survey fatigue was a significant problem in my survey, as there were
32 incompletes representing only 9.6% of all respondents.
Another potential limitation of the conjoint analysis method in general can stem
from the way attributes are selected for inclusion on a survey. In this case, the selection
of attributes (the six categories of work-related attributes) was based on the phase 1 study
of attributes that were gleaned from the relevant literature. The set of participants in
phase 1, while generationally diverse, all came from one educational institution and from
one part of the U.S., which could limit the generalizability and application of the results.
Another disadvantage of CBC questionnaires is that they lead to sparse data. The
part-worth utility estimates require larger sample sizes than Adaptive Choice-Based
Conjoint (ACBC) or ratings-based conjoint methods to stabilize. It is standard to think of
sample sizes for CBC projects in terms of at least 300 to 500 respondents. For sample
sizes below 100, the researcher may face difficulty using CBC effectively, but since I

93
secured over 300 completed responses, I believe this potential limitation did not affect
my study.
3.7 Summary
The goal of my study was to determine which combinations of work-related
attributes are most desired by employees of a health care company in the Southwest U.S.
and to compare these preferences across the various generations. The purpose of the first
phase of my study was to reduce a large number of potential work-related attributes down
to a smaller set of the most important ones. This goal was accomplished via an on-line
survey which asked the participants to identify the importance of work-related attributes.
The responses collected in phase 1 resulted in the selection of six work-related attributes I
used to design the CBC survey that comprised the foundation for the second phase of the
study.
For the second phase, I used Sawtooth Software’s Lighthouse Studio program to
design a CBC survey to measure employees’ preferences for various combinations of the
six work-related that were identified in phase 1. In addition to background and
demographic questions, the survey consisted of 14 questions - 12 were random-choice
tasks created by the software program and 2 were fixed-choice tasks designed as hold-out
questions to measure the reliability of the resulting data.
Each choice task included 3 full-profile hypothetical jobs, and the survey was
designed to be completed in approximately 10 - 15 minutes. These profiles were
presented to approximately 450 employees of the participating company. A total of 301
completed and validated responses (59% response rate) were gathered via Sawtooth
Software's web hosting service between June 30 and July 10, 2017.

94
Survey results were analyzed using Sawtooth Software's CBC-HB module to
calculate the individual part-worth utilities of each level of each attribute and then
average them across all respondents for aggregated results. The market simulator in
Sawtooth Software's SMRT module conducted simulations, which provided information
as to the average importance for each attribute and estimated the job selection likelihood
using various combinations of the six work-related attributes.
The survey also contained two questions that the participating company asked to
be included. The first dealt with the employee’s intention to stay with the organization. It
asked each respondent if, based on their current work situation, they saw themselves still
working for the company three years from now. The second question, added at the
request of the participating company, asked which attribute, if improved, would increase
the likelihood of the respondents continuing to work for the company. The questions
were important to the company, and the results will be identified along with the results
from the two surveys. However, since the surveys deal with hypothetical jobs, and the
last two questions deal with the employee’s specific situation at the company, the results
of those two questions will not be combined in this study. That said, all of the findings
from the analysis of the survey responses are reported in the next chapter.

95
CHAPTER 4
RESULTS
The purpose of this study was to determine which work-related attributes were
important to Millennials and would influence them to remain working for their current
employer. In addition, this study sought to determine if the work-related attributes valued
by Millennials are different than those preferred by workers from the other generational
cohorts that makeup the current U.S. workforce.
Using conjoint analysis techniques, I analyzed employees’ responses to an online
CBC survey to find answers to the following research questions: How much does each
work-related attribute influence respondents' choices of jobs, and what relative value do
the respondents place on each level of an attribute when making trade-off choices.
After completing the 12 random and 2 fixed tasks, the respondents were asked to
answer two questions: (1) what one work-related attribute that, if improved, would
increase your likelihood of remaining with the organization? and (2) do you see yourself
still working for this organization 3 years from now? As previously mentioned, the
participating company requested that these questions be added. The goal of these
questions was to have the respondents identify the work-related attribute they believe
most needed improvement to increase their chances of staying with the company and to
assess the current level of intention to stay for each employee. Armed with this
information, the company could take immediate action to address any pressing issues that
might lead to employee turnover.
Finally, based on the participants’ responses and answers to these questions, I was
able to answer my overall research question: What work-related attributes do

96
organizations need to provide to increase millennial workers’ intention to stay, and are
these different for other generations?
This chapter is a report of my findings. The presentation of results begins with
information about survey response patterns, background information about the
respondents, and an explanation of the techniques I used to analyze respondents' choices.
The chapter concludes with outcomes of my analysis.
4.1 Survey Response Patterns
Of the 510 people invited to participate in the survey, 301 completed the entire
survey. This is a participation rate of 59.0%. Thirty-two individuals started the survey but
did not complete it, equating to a 9.6% incompletion rate. Of those individuals who did
not complete the survey, 3 completed the background and demographic questions only,
while the remaining 29 completed some but not all the task questions. Given that this
survey was completely voluntary and sent during the summer vacation period, I am not
surprised by the number of incompletes and am satisfied and pleased with the overall
completion rate.
4.1.1 Participant background information
Since this study focuses on workers as members of generational cohorts, it is
vitally important to see how the survey respondents are distributed among the different
generations. Out of the total 301 respondents, 1 (0%) came from the Traditionalist
Generation, 58 (19%) from the Baby Boomer Generation, 149 (50%) from Generation X
and 93 (31%) were Millennials. The recap of responses is shown in Table 10.
The millennial participants were further broken down into older Millennials born
between 1980 and 1989 and younger Millennials born between 1990 and 2000. This

97
break down of Millennials into the two sub groups is shown in Table 11. There were 77
(26%) older Millennials and 16 (5%) younger Millennials. Of the total millennial cohort,
older Millennials comprised 83% while younger Millennials made up the remaining 17%.
Table 10: CBC Survey Response by Generation
CBC Survey Response by Generation
Generation Birth Years # of Completed
Responses % of Completed
Responses Traditionalists 1900 – 1945 1 0% Baby Boomers 1946 – 1964 58 19% Generation X 1965 – 1979 149 50% Millennials 1980 – 2000 93 31% Total 301
Table 11: CBC Survey Response by Millennial Generation Sub Group
CBC Survey Response by Millennial Generation Sub Group
Cohort Birth Years Respondents% All
Millennials Older Millennials 1980 – 1989 77 82.8% Younger Millennials 1990 - 2000 16 17.2% Total Millennials 1980 – 2000 93 100%
This dispersion among the generations, when compared to the overall U.S.
Workforce (Fry, 2015), has a slightly greater concentration of Generation X employees
and fewer Baby Boomers. Generation X workers made up 50% of the survey respondents
compared to 34% for the U.S. workforce, while Baby Boomers accounted for 19% of the
respondents compared to the 29% concentration within the U.S. workforce. The
concentration of Millennials, at 31%, closely mirrors the total U.S. workforce
concentration of Millennials at 34% (Fry, 2015). This higher level of concentration of
younger employees (Millennials and Generation X) is not particularly surprising as the
bulk of the participating company’s employees are sales people where the components of

98
the job - travel and variable compensation based on bonuses - tend to skew towards a
younger group.
Another way to segment the respondents is by gender. There were 140 completed
responses from females, which represented 47% of the total responses, and 161 responses
from males, representing 53% of the total sample. This split between males and females
almost exactly matches the composition of the total U.S. workforce – 46.4% female and
53.6% male (U.S. Bureau of Labor Statistics, 2017a). Given that the sample closely
mirrors the total U.S. workforce, it is, therefore, a reliable sample from which valid
gender specific predictions can be made regarding work-related attributes preferences.
Another demographic dimension that can be analyzed with respect to the sample
is educational level. With respect to education, 1 respondent had not completed high
school, 6 had only completed high school or GED equivalent, 4 had completed a 2-year
Associate degree, 226 had completed a 4-year Undergraduate degree, 58 held a graduate
degree, and another 6 had completed a doctorate or post-doctorate education. This high
level of undergraduate degree or higher is not surprising. The HR business partner for the
company has confirmed that having an undergraduate degree is a prerequisite for most
positions within the company. The recap of the educational composition of the survey
participants is shown in Table 12.
A final dimension I investigated pertains to the type of role the respondent has
within the organization: whether they supervise other employees or not. With respect to
the respondents within this survey, 63 were supervisors and this equated to 21% of the
respondents, while most respondents, 238 in total, did not supervise others. These
individual contributors accounted for 79% of the total survey respondents. These results

99
are a little more skewed towards supervisors than expected, as this division has a 1:6
supervisor to employee ratio; however, supervisors likely had a greater interest in
participating in the study. Additionally, they may have responded in greater numbers
because of their greater loyalty to the company and interest in understanding how to
better manage their own employees.
Table 12: Survey Response by Educational Level
Survey Response by Educational Level
Education Level (highest level completed)
# of Completed Responses
% of Completed Responses
High school or GED equivalent 1 0% Some college 6 2% Associate (2 year) degree 4 1% Undergraduate (4 year) degree 226 75% Graduate degree 58 20% Doctorate or Post Doctorate degree
6 2%
Total 301 100% Using the Sawtooth SMRT program, I then imported the part-worth utility
estimates for each respondent to the 12 random tasks and the two hold-out tasks. I used
the SMRT module to complete multiple sets of analysis. These analyses included
calculating the average utilities and average importances across all respondents and by
generational cohort membership, and measuring and confirming the validity of my survey
using the hold-out tasks. In addition, throughout the analysis process I ran the appropriate
statistical tests to determine if any observed dissimilarities between groups were
statistically significant.
4.2 Overall Attribute Importance
Sawtooth Software’s CBC approach provided a systematic way in which trade-
offs were varied for respondents, and the result is a calculation of the average importance

100
of an attribute to respondents in making their selection among job choices (Orme, 2014).
Importance can also be interpreted as a weight assigned to each attribute (Orme, 2010a),
and in this study it shows the extent to which employees were willing to tradeoff one
work-related attribute for another. Importances are calculated by subtracting the lowest
utility value from the highest utility value within each attribute and then calculating the
percentage weight across attributes; the importances for all attributes add to 100%.
Because these data are ratio-scaled, an attribute with 20% importance can be considered
twice as important in the choice process as an attribute with 10% importance (Orme,
2014). Average importances were estimated individually for each of the 301 respondents
and then averaged across the entire group to provide insight into how much each attribute
influenced respondents' choices of jobs. The attribute average importances along with
their standard deviation are displayed in Table 13.
Table 13: Average Importances
Average Importances
Attribute Average
ImportancesStandard Deviation
Job Security 28.85 14.21 Having a Say 21.79 10.70 Work/life Balance 15.06 11.4 Role Clarity 12.07 5.48 Senior Leadership 11.13 6.37 Advancement 11.10 8.19 Total 100
Note: Output from Sawtooth Software
The work-related attribute that had the highest average importance was job
security with an average importance score of 28.85, followed by having a say at 21.79.
The remainder of the work-related attributes and their average importance scores are

101
work/life balance (15.06), role clarity (12.07), and senior leadership (11.13).
Advancement, the last of the 6 attributes, had an average importance score of 11.10.
4.3 Overall Attribute Part-Worth Utilities
An output from the software is the average utilities for each level of attribute
included in the survey, which are calculated as zero-based numbers, meaning that the
sum of the average utilities for all levels of an attribute adds up to zero. This indicates
that the larger the number, the more respondents valued it. The complete recap of the
average utilities for all attributes and their levels is identified in Table 14. It is not
surprising that the more ‘positive’ levels of the attributes, such as greater role clarity,
have higher average utility scores than less positive levels, such as low clarity about
roles. But because these levels do represent actual levels within roles in companies, it is
not only important but necessary to include them in the survey and build profiles that
contain all levels of each attribute. The Sawtooth Software application created random
profiles so that every possible combination of attributes was shown to the respondents.
For clarification, though, this did not mean that every respondent saw every profile, but
rather that every possible profile was seen by at least one respondent.
Another way to analyze the relative importance of the different levels within an
attribute is to measure how much more valued one level is from another. For example, by
subtracting the average utility for one particular level of an attribute from a successive
level, it can be determined how much more valued that level is in comparison. These
comparisons are identified in Table 15. From this data, it is clear that there is a strong
preference for job security because the average importance score for a job that is secure is
102.02 points greater than one that is potentially unsecure. Similarly, a job where the
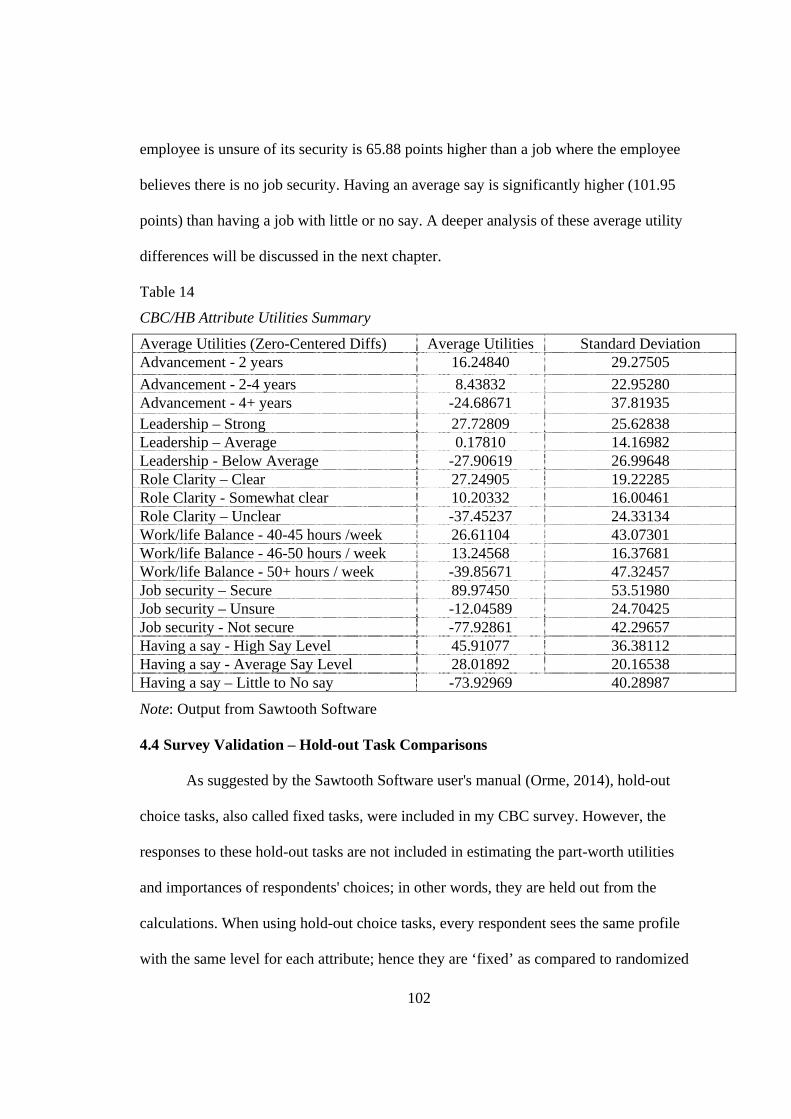
102
employee is unsure of its security is 65.88 points higher than a job where the employee
believes there is no job security. Having an average say is significantly higher (101.95
points) than having a job with little or no say. A deeper analysis of these average utility
differences will be discussed in the next chapter.
Table 14: CBC/HB Attribute Utilities Summary
CBC/HB Attribute Utilities Summary
Average Utilities (Zero-Centered Diffs) Average Utilities Standard Deviation Advancement - 2 years 16.24840 29.27505
Advancement - 2-4 years 8.43832 22.95280 Advancement - 4+ years -24.68671 37.81935 Leadership – Strong 27.72809 25.62838 Leadership – Average 0.17810 14.16982 Leadership - Below Average -27.90619 26.99648 Role Clarity – Clear 27.24905 19.22285 Role Clarity - Somewhat clear 10.20332 16.00461 Role Clarity – Unclear -37.45237 24.33134 Work/life Balance - 40-45 hours /week 26.61104 43.07301 Work/life Balance - 46-50 hours / week 13.24568 16.37681 Work/life Balance - 50+ hours / week -39.85671 47.32457 Job security – Secure 89.97450 53.51980 Job security – Unsure -12.04589 24.70425 Job security - Not secure -77.92861 42.29657 Having a say - High Say Level 45.91077 36.38112 Having a say - Average Say Level 28.01892 20.16538 Having a say – Little to No say -73.92969 40.28987
Note: Output from Sawtooth Software
4.4 Survey Validation – Hold-out Task Comparisons
As suggested by the Sawtooth Software user's manual (Orme, 2014), hold-out
choice tasks, also called fixed tasks, were included in my CBC survey. However, the
responses to these hold-out tasks are not included in estimating the part-worth utilities
and importances of respondents' choices; in other words, they are held out from the
calculations. When using hold-out choice tasks, every respondent sees the same profile
with the same level for each attribute; hence they are ‘fixed’ as compared to randomized

103
tasks in the survey. The specific job profiles that comprised the hold-out tasks utilized in
my survey are shown in the top six rows of Tables 16 and 17. Table 16 details fixed task
1 and was shown to every respondent after the fourth random task; Table 17 identifies
fixed task 2 which was shown to every respondent after the eighth random task.
Table 15: CBC/HB Attribute Utilities Summary Comparison
CBC/HB Attribute Utilities Summary Comparison
Average Utilities (Zero-Centered Diffs) Average Utilities
Difference to next level
Advancement - 2 years 16.24840 7.81008 Advancement - 2-4 years 8.43832 33.12503 Advancement - 4+ years -24.68671 Leadership – Strong 27.72809 27,54999 Leadership – Average 0.17810 28.08429 Leadership - Below Average -27.90619 Role Clarity – Clear 27.24905 17.04573 Role Clarity - Somewhat clear 10.20332 47.65569 Role Clarity – Unclear -37.45237 Work/life Balance - 40-45 hours /week 26.61104 13.36536 Work/life Balance - 46-50 hours / week 13.24568 53.10239 Work/life Balance - 50+ hours / week -39.85671 Job security – Secure 89.97450 102.02039 Job security – Unsure -12.04589 65.88272 Job security - Not secure -77.92861 Having a say - High Say Level 45.91077 17.89185 Having a say - Average Say Level 28.01892 101.94861 Having a say – Little to No say -73.92969 Note: Output from Sawtooth Software
As noted above, the respondents' choices on these two tasks were not used for
estimating the attribute utilities presented previously in this chapter but instead to check
the validity of the estimated part-worth utilities generated by the CBC-HB software. This
was accomplished by conducting a market simulation using the randomized first choice

104
(RFC) method to estimate the part-worth utilities for the attributes as they were presented
to the respondents in the two hold-out tasks. This simulation tool uses these part-worth
utilities calculated for each individual respondent to predict which job option the
respondent would select, which is then compared to the actual job that was selected. The
determination of the quality or validity of the model is through this holdout validation,
calculated by measuring the ‘hit rate’ of the model’s predictive ability (Orme, Alpert, &
Christensen, 1997).
Table 16: Hold-out Task 1
Hold-out Task 1
Attribute Option 1 Option 2 Option 3
Career Advancement 2-4 years Within 2 years 4+ years
Company Leadership Strong Average Average
Role Clarity Unclear Somewhat clear Clear
Job Security Unsure Not secure Secure
Work/Life Balance 46-50 hours 50+ 40-45 hours
Having a Say High Little / No Say Average
Table 17: Hold-out Task 2
Hold-out Task 2
Attribute Option 1 Option 2 Option 3 Career Advancement 2-4 years 4+ years Within 2 years Company Leadership Average Strong Below average Role Clarity Somewhat clear Clear Unclear Job Security Unsure Secure Not secure Work/Life Balance 50+ 40-45 hours 46-50 hours Having a Say Average High Little / No Say
For CBC studies, the hit rate refers to how accurately the model predicts an
individual’s responses to the holdout choice task. Using the part-worth utilities developed
from the 12 random choice tasks, one can predict responses. If the prediction matches the
respondent's choice, a hit is recorded for this respondent. If not, a miss is recorded. The

105
hit rate across the sample is the percent of correctly predicted holdout responses using the
model.
Using this approach, the hit rate for each of the hold-out questions was calculated.
The predicted response to actual response comparison is summarized in Table 18. For
hold-out question 1, the model predicted the correct choice 228 times for the 301
respondents for a ‘hit’ rate of 75.7%. Similarly, for hold-out question 2, the model
predicted the correct choice for each respondent 254 times for a hit rate of 84.4%. .
The result of these two market simulations indicates that the models constructed
to determine part-worth utilities and importances, while not perfect, are generally good
fits. According to Orme et al. (1997), hit rates for holdout choice tasks involving three or
four product alternatives usually range from 55 to 75 percent. Since the results achieved
in the two hold-out tasks both exceed the upper limit of what is typically achieved, I am
confident that the model does offer valid predictability.
Table 18: Hit or Miss Table for Hold-out Questions
Hit or Miss Table for Hold-out Questions
Hold-out #1 Hold-out #2
Total Responses 301 301
Correct Predictions 228 254
% Correct 75.7% 84.4%
4.5 Segmented Survey Result
Using the demographic information provided, I was able to analyze the estimated
attribute importances and the average attribute utilities by generation, gender, position,
and education level. This section consists of a review of the average attribute importances
for each of the segments.

106
Segment importance scores are an indication of the extent to which employees are
willing to trade off one work-related attribute for another and are presented below. The
importance scores by segment answer the question - how much does each attribute
influence a respondent’s choices of jobs for the corresponding segments of respondents?
Within each section, the importance scores are identified and compared to other groups.
There are many ways to determine if the average attribute scores are different for
different groups. One way is to rank the attributes from most important to least important
and compare the rank across the groups. Another is to compare the actual score for an
attribute importance and compare it to the score for that attribute for other groups. The
problem with both approaches, while simplistic and easy to comprehend, is that they do
not measure whether the differences in the measures are statistically significant. To
determine if the average importance for an attribute is statistically significantly different
than the average attribute score for another group, statistical analysis must be used. In this
study, I have used two different types of statistical significance tests, t-tests when
comparing two groups, and ANOVA tests when comparing three or more groups. These
tests will be explained in the next section and, furthermore, when scores are compared
across groups, the statistical significance is reported.
4.5.1 Statistical significance determination. A two-tailed t-test and ANOVA
testing are both used to test an alternative hypothesis which says that the results, in this
case the average importance for a work-related attribute, are statistically different for one
group compared to another group or set of groups. The two-tailed t-test was used when
comparing the mean averages for two samples, i.e. males and females, or older
Millennials and younger Millennials. The ANOVA test was used when three or more

107
sample means were compared such as Millennials compared to Generation X and Baby
Boomers. In total, I ran 13 distinct statistical tests to validate the statistical significance of
findings in this survey.
4.5.2 Attribute importance by generational cohort. A key area of investigation
in this study involves the work-related attributes that are important to Millennials and
how these compare to the other generational cohorts’ preferences for such attributes.
Consequently, it is necessary to analyze the preferences for each generation
independently and then compare results to the other generations. As previously
mentioned, one way to analyze these results is to compare the preference ranking for each
attribute. In so doing, Millennials show rank order preference differences in four of the
six attributes in comparison with both Baby Boomers and Generation X. Compared to
Baby Boomers, Millennials place a greater value on advancement and work/life balance
and a lower value on company leadership and role clarity. Compared to Generation X
respondents, Millennials place an even greater value on advancement and work/life
balance as each of these work-related attributes is ranked three positions higher than the
rankings from Generation X respondents. The results of this analysis are displayed in
Table 19.
As noted above, the respondents' choices on these two tasks were not used for
estimating the attribute utilities presented previously in this chapter but instead to check
the validity of the estimated part-worth utilities generated by the CBC-HB software. This
was accomplished by conducting a market simulation using the randomized first choice
(RFC) method to estimate the part-worth utilities for the attributes as they were presented
to the respondents in the two hold-out tasks. This simulation tool uses these part-worth

108
utilities calculated for each individual respondent to predict which job option the
respondent would select, which is then compared to the actual job that was selected. The
determination of the quality or validity of the model is through this holdout validation,
calculated by measuring the ‘hit rate’ of the model’s predictive ability (Orme, Alpert, &
Christensen, 1997).
As previously mentioned, comparing the average utility scores based on ranking
alone is not enough, nor does it address whether these results are statistically significant.
As such, an ANOVA statistical test was performed to determine if the utility scores for
Millennials were statistically significantly different from those of Baby Boomers and
Generation X. Significance is determined by calculating the p-value from the attribute
average utilities and their corresponding standard deviations. The results of the ANOVA
tests confirm that there are statistical differences in four work-related attributes –
advancement (p = 0.0000), company leadership (p = 0.0001), work/life balance (p =
0.0025), and job security (p = 0.0179). The average utilities and the resulting p-values
from the ANOVA test are shown in Table 20. It is important to note that these were not
the same attributes that the rank order methodology highlighted; having a say is not
determined to be statistically different, while job security is significant. For this reason,
only attribute comparisons using statistical calculations will be shown in the remainder of
this study. Rank order comparisons can be easily determined by comparing the attribute
importance scores across the groups if so desired.
From this data, it is clear that there are statistical differences in how much
Millennials value four of the six attributes – advancement, company leadership, work/life
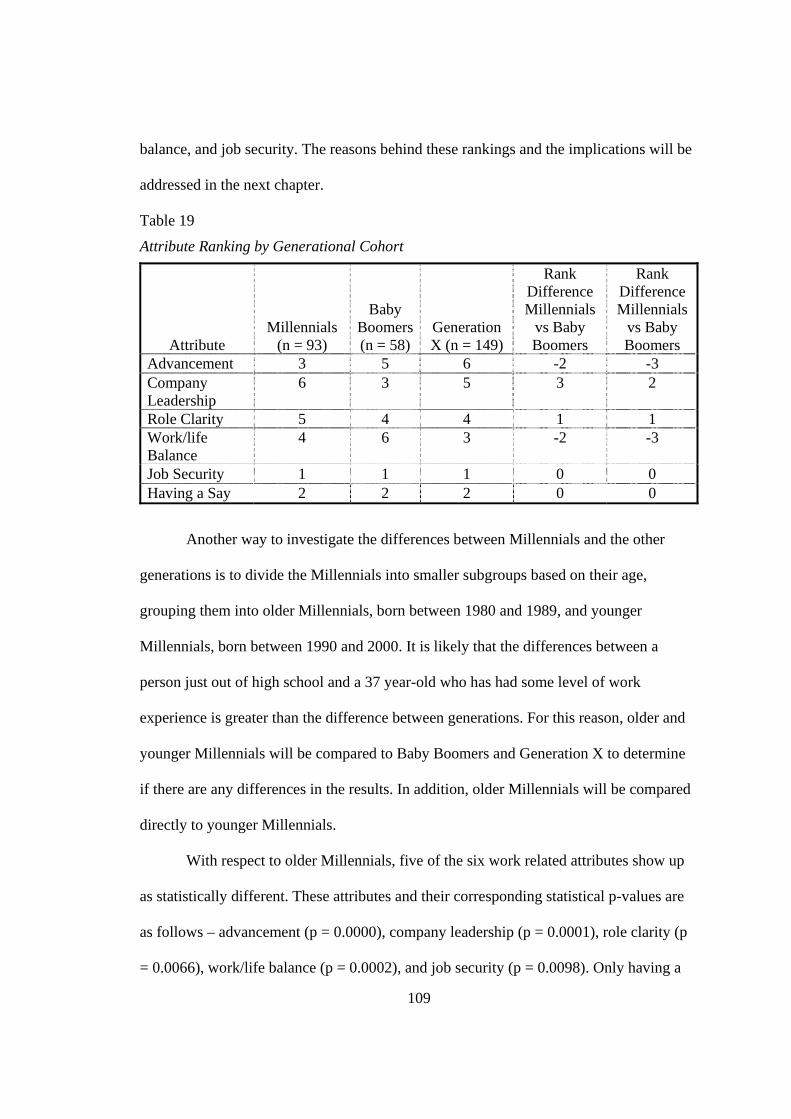
109
balance, and job security. The reasons behind these rankings and the implications will be
addressed in the next chapter.
Table 19: Attribute Ranking by Generational Cohort
Attribute Ranking by Generational Cohort
Attribute Millennials
(n = 93)
Baby Boomers (n = 58)
Generation X (n = 149)
Rank Difference Millennials
vs Baby Boomers
Rank Difference Millennials
vs Baby Boomers
Advancement 3 5 6 -2 -3 Company Leadership
6 3 5 3 2
Role Clarity 5 4 4 1 1 Work/life Balance
4 6 3 -2 -3
Job Security 1 1 1 0 0 Having a Say 2 2 2 0 0
Another way to investigate the differences between Millennials and the other
generations is to divide the Millennials into smaller subgroups based on their age,
grouping them into older Millennials, born between 1980 and 1989, and younger
Millennials, born between 1990 and 2000. It is likely that the differences between a
person just out of high school and a 37 year-old who has had some level of work
experience is greater than the difference between generations. For this reason, older and
younger Millennials will be compared to Baby Boomers and Generation X to determine
if there are any differences in the results. In addition, older Millennials will be compared
directly to younger Millennials.
With respect to older Millennials, five of the six work related attributes show up
as statistically different. These attributes and their corresponding statistical p-values are
as follows – advancement (p = 0.0000), company leadership (p = 0.0001), role clarity (p
= 0.0066), work/life balance (p = 0.0002), and job security (p = 0.0098). Only having a

110
say is not statistically different as confirmed by its p-value of 0.9486. The comparison of
the attribute importances for older Millennials to Baby Boomers and Generation X is
shown in Table 21.
Table 20: Attribute Importance and Statistical Significance by Generational Cohort
Attribute Importance and Statistical Significance by Generational Cohort
Attribute Millennials
(n = 93)
Baby Boomer (n = 58)
Generation X (n = 149)
p value (significance level = .01)
Statistically Different
Advancement 16.49 11.11 8.34 0.0000 Yes Company Leadership
9.24 13.60 12.13 0.0001 Yes
Role Clarity 11.25 12.46 12.51 0.2100 No Work/life Balance
16.37 10.48 15.58 0.0025 Yes
Job Security 25.16 30.29 29.82 0.0179 Yes Having a Say 21.48 22.06 21.63 0.9442 No
Note: ANOVA test used test for statistical difference calculation
Table 21: Attribute Importance Older Millennials compared to Other Generations
Attribute Importance Older Millennials compared to Other Generations
Attribute
Older Millennials
(n = 77)
Baby Boomer (n = 58)
Generation X (n = 149)
p value (sig. level =
.01) Statistically
Different 1980 – 1989 1946 - 1964 1965 – 1979 Advancement 16.03 11.11 8.34 0.0000 Yes Company Leadership
8.99 13.60 12.13 0.0001 Yes
Role Clarity 10.12 12.46 12.51 0.0066 Yes Work/life Balance
18.43 10.48 15.58 0.0002 Yes
Job Security 24.42 30.29 29.82 0.0098 Yes Having a Say 22.01 22.06 21.63 0.9486 No
Note: ANOVA test used test for statistical difference calculation
When comparing younger Millennials, only three work-related attributes are
determined to be statistically different. These differing attributes and their corresponding
p-values are advancement (p = 0.0000), role clarity (p= 0.0001), and work/life balance (p

111
= .0010). The comparison of the attribute importance between younger Millennials and
Baby Boomers and Generation X is presented in Table 22.
Table 22: Attribute Importance Younger Millennials compared to Other Generations
Attribute Importance Younger Millennials compared to Other Generations
Attribute
Younger Millennials
(n = 16)
Baby Boomer (n = 58)
Generation X (n = 140)
p value (sig. level
= .01) Statistically
Different 1990 – 2000 1946 - 1964 1965 – 1979 Advancement 18.83 11.11 8.34 0.0000 Yes Company Leadership
11.27 13.60 12.13 0.2692 No
Role Clarity 18.89 12.46 12.51 0.0001 Yes Work/life Balance
8.95 10.48 15.58 0.0010 Yes
Job Security 24.91 30.29 29.82 0.3550 No Having a Say 17.15 22.06 21.63 0.2119 No
Note: ANOVA test used test for statistical difference calculation
An additional way to investigate the difference between younger Millennials and
older Millennials is to compare their average importance scores directly. As this is a
comparison between two groups, the 2-tailed t-test method will be used rather than the
ANOVA statistical test. When comparing these older and younger Millennials, only 2
work-related attributes are determined to be statistically different, role clarity (p =
0.0000) and work/life balance (p = 0.0019). The remaining four attributes are not
statistically different between the groups. The comparison of the attribute importance
between younger and older Millennials is shown in Table 23.

112
Table 23: Attribute Importance Older Millennials compared to Younger Millennials
Attribute Importance Older Millennials compared to Younger Millennials
Attribute Older
Millennials (n = 77)
Younger Millennials
(n = 16)
p value (significance level = .01)
Statistically Different
1980 – 1990 1991 – 2000 Advancement 16.03 18.83 0.2901 No Company Leadership 8.99 11.27 0.1439 No Role Clarity 10.12 18.89 0.0000 Yes Work/life Balance 18.43 8.95 0.0019 Yes Job Security 24.42 24.91 0.8882 No Having a Say 22.01 17.15 0.1078 No
Note: 2-tailed t-test used test for statistical difference calculation
4.5.3 Attribute importance by gender. With the U.S. workforce split nearly
equally by gender, it is important to look at the work-related attribute preferences
identified by male and female respondents to determine if there are differences. While the
top four work-related attributes were identical for males and females, there was three
work-related attributes that were statistically different in how they were valued by
genders. These were work/life balance, career advancement, and role clarity. Work/life
balance was more highly valued for females than for males as evidenced by the average
importance score of 18.43 compared with 8.95 for males. This distinction is statistically
significant as confirmed by the p-value of 0.0000. Career advancement was more highly
valued by the average importance score for males of 18.83 compared to 16.03 for
females. This difference was statistically significant as confirmed by the p-value of
0.0191. Lastly, role clarity was more highly valued for males at 18.89 compared to 10.12
with a p-value of 0.0146. The recap of the attribute importance differences between male
and female respondents in the study is presented in Table 24.
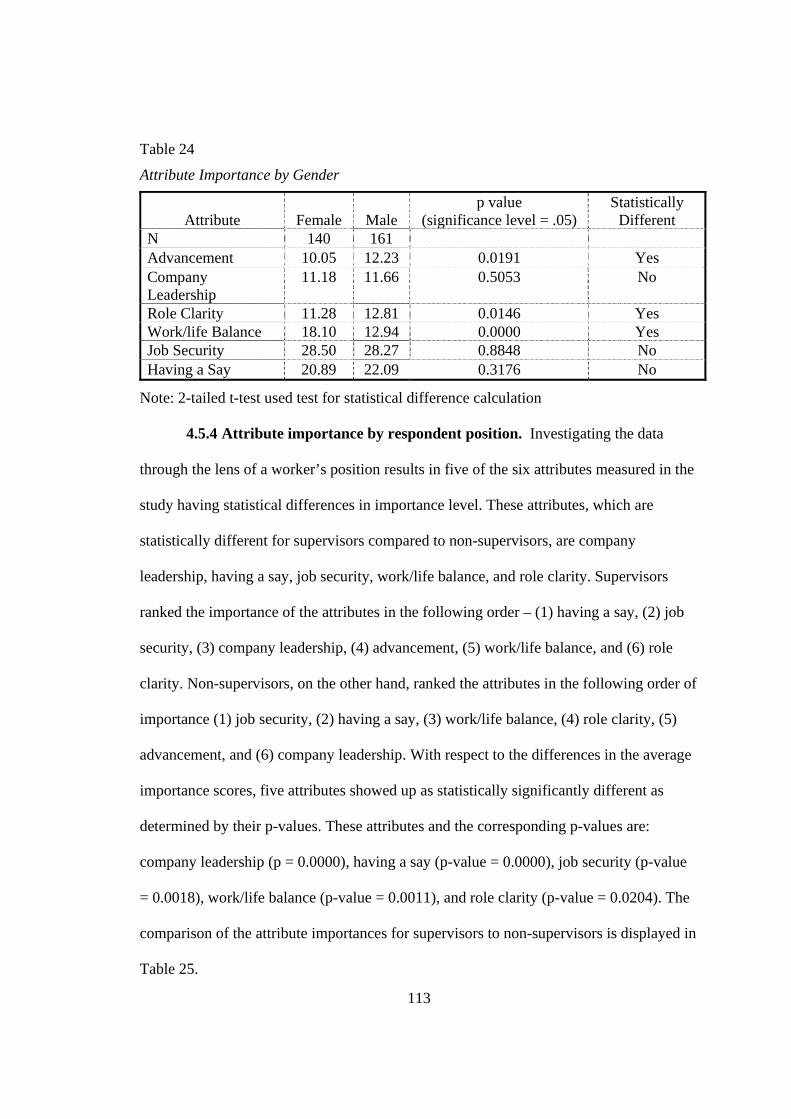
113
Table 24: Attribute Importance by Gender
Attribute Importance by Gender
Attribute Female Male p value
(significance level = .05) Statistically
Different N 140 161 Advancement 10.05 12.23 0.0191 Yes Company Leadership
11.18 11.66 0.5053 No
Role Clarity 11.28 12.81 0.0146 Yes Work/life Balance 18.10 12.94 0.0000 Yes Job Security 28.50 28.27 0.8848 No Having a Say 20.89 22.09 0.3176 No
Note: 2-tailed t-test used test for statistical difference calculation
4.5.4 Attribute importance by respondent position. Investigating the data
through the lens of a worker’s position results in five of the six attributes measured in the
study having statistical differences in importance level. These attributes, which are
statistically different for supervisors compared to non-supervisors, are company
leadership, having a say, job security, work/life balance, and role clarity. Supervisors
ranked the importance of the attributes in the following order – (1) having a say, (2) job
security, (3) company leadership, (4) advancement, (5) work/life balance, and (6) role
clarity. Non-supervisors, on the other hand, ranked the attributes in the following order of
importance (1) job security, (2) having a say, (3) work/life balance, (4) role clarity, (5)
advancement, and (6) company leadership. With respect to the differences in the average
importance scores, five attributes showed up as statistically significantly different as
determined by their p-values. These attributes and the corresponding p-values are:
company leadership (p = 0.0000), having a say (p-value = 0.0000), job security (p-value
= 0.0018), work/life balance (p-value = 0.0011), and role clarity (p-value = 0.0204). The
comparison of the attribute importances for supervisors to non-supervisors is displayed in
Table 25.

114
Table 25: Attribute Importance Supervisor compared to Non-Supervisor
Attribute Importance Supervisor compared to Non-Supervisor
Attribute Supervisor
(n = 63)
Non-Supervisor(n = 237)
p value (significance level = .05)
Statistically Different
Advancement 12.46 10.80 0.1394 No Company Leadership 14.02 10.09 0.0000 Yes Role Clarity 10.85 12.76 0.0204 Yes Work/life Balance 10.97 16.20 0.0011 Yes Job Security 23.88 30.08 0.0018 Yes Having a Say 27.82 20.07 0.0000 Yes
Note: 2-tailed t-test used test for statistical difference calculation
4.5.5 Attribute importance by respondent education level. Because nearly
96% of the respondents have at least an undergraduate degree and having at least an
undergraduate degree is a prerequisite for employment with the organization, it likely
adds no value to analyze the work-related attribute preference by educational level.
Therefore, an analysis of educational level was not conducted for this study due to the
low number (11) of non-undergraduate degree respondents. This distinction might
provide valuable insight to the professional and academic constituencies; however, the
sample data in this study is not robust enough for this type of analysis.
4.5.6 Most important attribute to improve. In response to the first question
requested by the company regarding which work-related attribute would have the greatest
positive impact on the employee continuing to work for them, five of the six attributes
received a significant number of selections. Role clarity was the only attribute that
received less than 5% of the selections, being identified by only 8 out of the 301 total
respondents. Job security and work/life balance were the two most selected attributes,
combining for over 50% of the responses with 79 and 77 selections respectively. The
number and percent of respondents selecting the remaining attributes are as follows:

115
advancement, 53 selections (17.6%), company leadership, 47 selections (15.6%), and
having a say, 37 selections (12.3%). The complete recap of these responses is shown in
Table 26.
Table 26: Work-Related Attribute to Improve
Work-Related Attribute to Improve
Attribute Responses % of Responses Advancement 53 17.6% Company Leadership 47 15.6% Role Clarity 8 2.7% Work/life Balance 77 25.6% Job Security 79 26.2% Having a Say 37 12.3% Total 301 100%
4.5.7 Most important attribute to improve by generation. Since the focus of
this study is Millennials and how they compare to other generations, it is appropriate and
valuable to investigate how the different generations respond to the question about which
work-related attributed would positively impact their intention to stay if it was improved.
With respect to this question, advancement was the most identified attribute at 26.9% of
the time for Millennials compared to 16.8% for Generation X and only 5.2% for Baby
Boomers. Company leadership and having a say were identified significantly more
frequently for Baby Boomers at 19.0% and 17.32% respectively, with Generation X at
18.1% and 12.1% respectively compared to Millennials with 9.6% for both attributes.
There was little difference in the frequency of selection for job security, which was the
first or second most frequently selected attribute across all three generations. Similarly,
the number of respondents selecting role clarity as the attribute to improve the likelihood
of their retention was low for all three generations. The complete results identified by
generation are recapped in Table 27.

116
Table 27: Work-Related Attribute to Improve by Generation
Work-Related Attribute to Improve by Generation
Attribute
TraditionalistBaby
Boomer Generation X Millennials
1900 - 1945 1946 - 1964 1965 – 1979 1980 – 2000Advancement n
% 3
5.2% 25
16.8% 25
26.9% Company Leadership n
% 11
19.0% 27
18.1% 9
9.6% Role Clarity n
% 1
1.7% 1
0.7% 6
6.5% Work/life Balance n
% 18
31.0% 41
26.5% 18
19.4% Job Security n
% 1
100% 15
25.9% 37
24.8% 26
28.0% Having a Say n
% 10
17.32% 18
12.1% 9
9.6% Total n 1 58 149 93
Investigating how older and younger Millennials responded to the question about
which attribute if improved would increase their intention to stay yields interesting
results. While the opportunity to advance within the organization is the attribute most
frequently identified by both sub-groups, it is identified more frequently by younger
Millennials (37.5%) compared to older Millennials (24.7%). Job security is the second
most frequently identified attribute, with 27.3% of older Millennials selecting it
compared with 31.2% of younger Millennials. Two other attributes with significant
selections are work/life balance with 22.1% for older Millennials and only 6.2% for
younger Millennials, and company leadership with 11.7% for older Millennials and 0%
for younger Millennials. The comparison of the attribute for improvement selected by
older Millennials and younger Millennials is highlighted in Table 28.
4.5.8 Self-reported intention to stay. As mentioned previously, the final
question was also included at the request of the participating company. It asked the

117
respondents to indicate whether or not they saw themselves still working for the company
3 years from now. Seventy-seven percent of the respondents answered yes, while 5% said
no, and 19% were unsure. The recap of responses to this question is listed in Table 29.
Table 28: Attribute to Improve for Older and Younger Millennials
Attribute to Improve for Older and Younger Millennials
Attribute Older Millennials Younger Millennials
1980 – 1989 1990 – 2000 Advancement n
% 19
24.7% 6
37.5% Company Leadership n
% 9
11.7% 0
0% Role Clarity n
% 4
5.2% 2
12.5% Work/life Balance n
% 17
22.1% 1
6.2% Job Security n
% 21
27.3% 5
31.2% Having a Say n
% 7
9.1% 2
12.5% Total n 77 16
Table 29: Self-reported Intention to Stay
Self-reported Intention to Stay
Response # of Responses % of Responses Yes 231 77% No 14 4% Unsure 56 19%Total 301 101%
Note: Adds up to more than 100% due to rounding
4.5.9 Self-reported intention to stay by generation. Investigating the intention
to stay by generation is important and valuable for the company represented in this study.
It indicates how confident the company can be about retaining its employees and which
generational cohort might be more at risk than others. Overall the intention to stay
working for the company is high, and there is not a significant amount of variation across

118
the generations. Over 80% of Millennials responded that they intend to stay working for
the company compared to 75.8% for Generation X and 72.4% for Baby Boomers. There
were also consistent responses for both the unsure and no responses across the
generations. Baby Boomers who said they did not intend to stay equaled 6.9% compared
with 5.4% for Generation X and only 2.2% for Millennials. The percentage of
respondents unsure about staying was 20.7% for Baby Boomers, 18.8% for Generation X,
and 17.2% for Millennials. The comparison of the responses to the intention to stay
question by generation is shown in Table 30.
Investigating the response to the intention to stay question among the two sub-
groups of Millennials shows that there is a higher percentage of younger Millennials who
are unsure about staying with the company compared to older Millennials. Older
Millennials have either decided to stay or go, and fewer of them are unsure. A high
percentage of older Millennials said they planned to stay, 81.8% compared to younger
Millennials, 75.0%. Twenty-five percent of younger Millennials responded that they were
unsure about staying compared to older Millennials at 15.6%. Finally, the number of
respondents indicating that they were not planning to stay was very small: 2.6% for older
Millennials and 0% for younger Millennials. The recap of responses to the intention to
stay question for the Millennials sub-groups is recapped in Table 31.

119
Table 30: Self-reported Intention to Stay by Generational Cohort
Self-reported Intention to Stay by Generational Cohort
Response Traditionalist Baby Boomer Generation X Millennials 1900 - 1945 1946 – 1964 1965 – 1979 1980 – 2000 Yes n
% 1
100% 42
72.4% 113
75.8% 75
80.6% No n
% 4
6.9% 8
5.4% 2
2.2% Unsure n
% 12
20.7% 28
18.8% 16
17.2% Total N 1 58 149 93
Table 31: Self-reported Intention to Stay by Millennial Sub-group
Self-reported Intention to Stay by Millennial Sub-group
Attribute Older Millennials
(1980 – 1989) Younger Millennials
(1990 – 2000) Yes 63
81.8% 12
75.0% No 2
2.6% 0
0% Unsure 12
15.6% 4
25.0% Total 77 16
4.6 Summary of Results
4.6.1 Research question answered. The intent of this study was to answer the
fundamental research question of What work-related attributes do organizations need to
provide to increase millennial workers’ intention to stay, and is this different for other
generations? Based on my review of the literature, I discovered that there were many
work-related attributes that were important to Millennials, including career advancement,
recognition, development, coaching, work/life balance, fun, job security, strong company
leadership and having a say. In phase 1 of the research, several different groups
comprised of members of the key generations that make up nearly 97% of the U.S.

120
workforce were exposed to a long list of these attributes. Based on their responses, I
determined that the six most important work-related attributes to workers were
advancement, company leadership, role clarity, work/life balance, job security, and
having a say. This list of attributes was then used to build a CBC survey fielded by a
large medical device company based in the southern part of the U.S.
The results from the survey indicated that four of these attributes – job security,
having a say, advancement, and work/life balance were most important to Millennials,
while role clarity and company leadership were not very important to them. In addition,
the results confirmed that five of the six work-related attributes were statistically different
for Millennials compared to Baby Boomers and Generation X. These five attributes were
advancement, company leadership, role clarity, work/life balance, and job security. Only
having a say was not statistically significant for Millennials in comparison to the other
generations.
Therefore, based on these results H0, the null hypothesis, can be rejected and the
alternate hypothesis, H1, that Millennials place different values on work-related attributes
than workers from other generations can be accepted as supported.
The significance of these findings will be discussed in the next chapter.

121
CHAPTER 5
DISCUSSION, MANAGERIAL IMPLICATIONS, AND CONCLUSION
As Baby Boomers retire and leave the workforce Millennials will be counted on
to fill the resultant worker gap. In order to address this worker gap, company managers
must focus attention on retaining their millennial employees. By providing the work-
related attributes most valued by Millennials, managers can increase the likelihood of
retaining millennial workers within their organization. This key business challenge of
retaining Millennials was investigated through the lens of psychological contract and
generational cohort theories.
To address this need, this study investigated Millennials and the value they place
on work-related attributes, and identified the work-related attributes that were most
important to Millennials. It found that Millennials place different value on key work-
related attributes than Baby Boomers and Generation Xers. Additionally, this research
discovered significant differences in the work-related attributes valued by older versus
younger Millennials. This chapter provides a descriptive and analytical synthesis of the
research findings to align best practices with Millennials’ expectations regarding work-
related attributes.
This study was executed with 301 participants who worked for a company based
in the southwest part of the U.S. The participating company is a division of a larger
global company headquartered outside of the U.S. The participating company is largely a
commercial division and the respondents were mainly sales and marketing professionals.
The future of the participating company is in a state of uncertainty as its parent company
has announced it is considering several alternatives for the participating company,

122
including the outright sale of the division or spinning it off. These options have been
announced both in company statements and financial publications. As implications of this
study are discussed, it will be important to keep this special circumstance regarding the
participating company and its uncertain future in mind.
5.1 Findings
There are many important findings relevant to organizations that can be derived
from this study. These involve findings related specifically to Millennials, and
differences between the following groups: Millennials and the other key generations that
comprise the U.S. workforce – Baby Boomers and Generations Xers, older Millennials
and younger Millennials; females and males; and supervisors and non-supervisors. In
addition, the study provides insight about managing employee retention within a multi-
generational workplace. Each of these findings will be discussed in the following
sections.
5.1.1 Importance of job security. Within this study, job security was found to
be the most highly valued work-related attribute across all generations. It is interesting
that when studying work-related motivation factors, job security has consistently been
identified as important to employees over the last forty years, but typically it is not
identified as the most important attribute (Wiley, 1997). The finding in this study that
indicates job security is the most important attribute might be influenced by factors
unique to the participating company. Job security may be overly weighted in importance
due to the uncertainty of the participating company’s future, as referenced earlier. This
uncertainty is likely intensifying the importance of job security for the participants in this
study, thereby explaining why it ranked higher than expected. Care must be taken when

123
offering suggestions to address the implications of the maximal importance of job
security, both for companies in general, as well as for the participating company.
5.1.2 Work-related attribute preference - Millennials. The study found that
while there are many work-related attributes that are important to and valued by
Millennials, there are a few that are of primary importance. The work-related attributes
that were found to be the most highly valued by Millennials were job security, having a
say, career advancement, and work/life balance. Two others, role clarity and company
leadership, were found to be of lesser importance to Millennials.
Job security was found to be the work-related attribute that was most highly
valued. While its value may have been overstated in this study due to the company’s
uncertain future, this finding that job security is important to Millennials is consistent
with extant literature (Gallup, 2016; Guillot-Soulez & Soulez, 2014; Hershatter &
Epstein, 2010; Murphy et al., 2010). In their report on Millennials, Pew (2013) found
Millennials more likely to value job security more than other generations.
Millennials also highly valued having a say. It was the work-related attribute that
had the second highest importance score behind job security. This is likely important to
Millennials as a result of their upbringing wherein family members, teachers, coaches and
other adult role models encouraged them to be bold and share their thoughts and
opinions. This feeling of importance and being entitled to voice their opinion is likely
linked to being rewarded and praised for every little thing they did, including being
rewarded with trophies and medals in sporting events for merely participating.
With regard to career advancement, findings of this study provide further
evidence that Millennials place a high value on this work-related attribute and seek

124
recognition through title, praise, promotion, and pay. The level which was chosen most
frequently in the study survey was advancement in less than two years, indicating that
Millennials preferred jobs where they would advance at a very quick pace. This is
confirmed in the literature which shows that one of the primary reasons Millennials leave
organizations is due to advancing more slowly than they prefer. Pooley (2006) found that
Millennials were not willing to wait more than two years to get promoted and would
leave a company for another opportunity that promised a faster track to advancement.
The final work-related attribute that was found to be very important to Millennials
was work/life balance. This desire for a better balance in their working life likely comes
from their desire to spend quality time with friends and family, and enjoying activities
and experiences. Millennials value experiences and social connections (Rainer & Rainer,
2011; Wong et al., 2008) and are more interested in activities such as travel abroad and
going to concerts and festivals rather than having material things. Having ample time off
which comes from good work/life balance is necessary for Millennials to enjoy these
experiences.
5.1.3 Work-related attribute preference - Millennials and Non-Millennials.
The study found that certain generational sub-groups have different preferences
for work-related attributes and have different perceptions about what types of attributes
will influence their retention. Specifically, Millennials placed different value on the
work-related attributes compared to workers from the Baby Boomer and Generation X
generations. Four of the six attributes that were studied were found to be statistically
different in importance between Millennials and workers from other generations. These
attributes ranked in order of difference were: (1) career advancement, (2) company

125
leadership, (3) work/life balance, and (4) job security. Specifically, career advancement
and work/life balance were found to be more important for Millennials, while company
leadership and job security were less important for Millennials. With regard to career
advancement Baby Boomers are willing to wait their turn for promotions and rewards,
while Millennials, on the other hand, want immediate recognition through title, praise,
promotion, and pay.
5.1.4 Work-related attribute preference - older and younger Millennials. An
additional finding from the study is that older Millennials, those born between 1980 and
1989, had different work-related attribute preferences than younger Millennials, born
between 1990 and 2000. Out of the six attributes investigated, two were found to be
statistically different between these two segments of Millennials. These attributes ranked
in order of difference were: (1) role clarity, and (2) work/life balance. Specifically, role
clarity was found to be less important for older Millennials and more important for
younger Millennials, while work/life balance was found to be more important for older
Millennials, and less important for younger Millennials.
5.1.5 Work-related attribute preference - males and females. A further
finding related to gender and found that there were differences in employee preferences
with regard to work-related attributes. Work/life balance was statistically more important
for females (regardless of generational cohort membership) than it was for males. This is
likely attributed to the fact that a portion of the female participants were mothers and,
perhaps, felt a greater burden / responsibility to be available for their children. This
statistical preference for work/life balance was also true for female millennial
respondents.

126
5.1.6 Work-related attribute preference - supervisors and non-supervisors.
Differences were found between how supervisors and non-supervisors valued the various
work-related attributes. Out of the six attributes investigated, four were found to be
statistically significantly different. These attributes ranked in order of importance
difference were: (1) company leadership, (2) having a say, (3) work/life balance, and (4)
job security. Specifically, having a say and company leadership were found to be more
important for supervisors, while work/life balance and job security were more important
for non-supervisors. Since supervisors likely view themselves as part of the company
leadership, it is not surprising that they value company leadership more than non-
supervisors and want to have a say in company key decisions. Non-supervisors, on the
other hand, likely have lower expectations of being involved in decisions and having a
say, because it is not part of their job description.
5.2 Research Contributions
The contributions of this research are divided into two categories: managerial
contributions and academic contributions. However, dividing the contributions is strictly
a classifying mechanism, as there is substantial overlap between the two. Additional
categorizations include the research the study confirms, as well as the research it extends,
which also reveals some overlap. Nevertheless, I believe the benefit of added clarity
outweighs any potential disadvantage of overlap and duplication. Within the managerial
and academic contributions sections, I first identify the research this study confirms, and
then how this study extends existing research.

127
5.2.1 Managerial contributions. This study provides several managerial
contributions, including insights and understanding about Millennials and how to manage
them. It also contributes to management practice by identifying the impact of company
provided work-related attributes on the following groups of employees: Millennials,
Baby Boomers and Generation Xers; males and females; and supervisors and non-
supervisors. These findings provide direction to companies with respect to the work-
related attributes that should be incorporated into differentiated retention strategies so
companies can accommodate the preferences of the various generations. The findings
derived from this study can help organizations increase retention of their employees in all
generations. Lastly, this study offers specific practical implications for the company that
participated and provides recommendation of strategies it could employ to increase
retention of its employees.
5.2.2 Managerial contributions that confirm research. This study confirms
research that addresses Millennials, their differences from other generations, and what
they expect from their employer with regard to work-related attributes. The first
contribution involves understanding that millennial workers have specific expectations
regarding work-related attributes. Specifically, it substantiates research that identifies the
importance of job security to Millennials (Gallup, 2016; Guillot-Soulez & Soulez, 2014;
Hershatter & Epstein, 2010; Kowske et al., 2010; Murphy et al., 2010; Smola & Sutton,
2002; Twenge et al., 2010). This study also confirms research about what work-related
attributes are valued by Millennials. Specifically, it finds that career advancement (Bell &
Griffin, 2013; Deal & Levenson, 2016; Deloitte, 2016b; Erickson, 2009; Gallup, 2016;
Solnet et al., 2012; Suleman & Nelson, 2011; Wong et al., 2008), work/life balance (Bell

128
& Griffin, 2013; Holt et al., 2012; Rainer & Rainer, 2011; Twenge et al., 2010), and
having a say (Caraher, 2014; J. L. Hartman & McCambridge, 2011; Hershatter &
Epstein, 2010; Myers & Sadaghiani, 2010) are all work-related attributes valued by this
generation. Finally, this study affirms that Millennials’ preferences toward work-related
attributes are different from those of Baby Boomers and Generation Xers (Bell & Griffin,
2013; Gallup, 2016), validating the assertion that companies need to provide different
reward strategies for different generational sub-groups to meet different expectations
(Close & Martins, 2015).
5.2.3 Managerial contributions that extend research. This study extends the
research on generation cohort theory and Millennials by deconstructing Millennials into
two sub-groups: older Millennials and younger Millennials. There are differences in the
work-related attributes preferred by these two distinct sub-groups, which suggests that it
may not be appropriate to treat all Millennials the same; differences in preferences
between older and younger Millennials suggests that the commonly applied demarcation
points of the generation are not accurate.
5.2.4 Academic contributions. This study offers several findings that carry
implications for management theory. The academic contributions of this study include the
discovery of generational differences at work, specifically the understanding that
employees from different generations have different expectations from their employer.
This study further contributes to generational cohort theory in that it finds a difference in
work-related attributes preferences between both older and younger Millennials and other
generational cohorts. Furthermore, the study contributes academically to the relevance of
generational segmentation with regard to employee retention. A final academic
129
contribution of the study involves the significance of using conjoint analysis to help
organizations solve real business problems.
The study confirms research that generational differences do exist (Mannheim,
1952, 1970) and that such differences occur (Lyons et al., 2012) with regard to the
importance employees place on work-related variables (Costanza et al., 2012). It also
confirms that employees from different generations have different expectations and
preferences (Costanza et al., 2012; Twenge et al., 2010), and these expectations define
what employees expect from their employer in exchange for their work (Rousseau, 1989;
Turnley & Feldman, 2000).
This study extends the generational differences research because it adds
psychological contract theory to explain the impact of work-related attributes on
employee expectations as well as the jobs employees would select. This finding extends
the research because the extant literature is largely descriptive rather than theoretical
(Lyons & Kuron, 2013); in fact, most of the research regarding key work expectations
and values of multi-generational employees is essentially “atheoretical” (Broadbridge,
Maxwell, & Ogden, 2007). This study also extends the research because it is not just
theoretical but empirical, using real subjects from all of the key generational cohorts.
Within this study, conjoint analysis proves to be a useful research methodology. It
is especially valuable because it facilitates uncovering the respondents’ deeply held
preferences, which they may not have even been aware of, rather than merely
investigating their stated preferences. It does so by determining the derived importance of
the various work-related attributes. The notion that conjoint analysis delivers deeper and
more robust insights was summed up well by one participant who said, “Thanks for the

130
chance to participate. I was surprised with the priorities that floated to the top and these
weren’t the ones I’d have predicted if you’d asked me to just rank them. Thanks for the
personal insight.”
The value of applying conjoint analysis to business issues and problems confirms
Moy and Lam's (2004) research, which utilized conjoint analysis to investigate selection
criteria and the impact of personality on getting hired. In addition, this study confirms the
value of conjoint analysis as demonstrated in three other studies that dealt with an actual
business problem similar to the one investigated in this study. Montgomery and Ramus
(2011) studied trade-off decisions and choices with respect to the job preferences of
MBAs; Guillot-Soulez and Soulez (2014) used conjoint analysis to determine the
importance of job preferences across generations; and Baum and Kabst (2013) employed
conjoint analysis in their study of the employer characteristics that drive job choice. This
study confirms the value and impact of conjoint analysis as a useful tool to investigate
employee choices with regard to their employment condition.
5.3 Implications for Management
The goal of this study was to investigate and offer solutions to a key business
problem facing companies today – retaining Millennials in order to fill the worker gap
brought on by older generations exiting the workforce. As such, a key outcome of the
study is to identify implications for managers and offer recommendations on what they
can do to tackle this problem. The remainder of this section will concentrate on the
unique features of the study with the goal of translating the findings into simple
statements about their impact on managerial practice. Each of these practical implications
will be addressed in the following section.

131
5.3.1 Implications for managing Millennials. There are several practical
implications regarding managing and retaining Millennials. First, organizations and their
leaders should consider assessing the strategies and methods they use to retain their
Millennial employees. Leaders must design work-related attributes that appeal to all
generations using strategies that will allow them to maximize the resources they dedicate
to satisfying the preferences for work-related attributes for all members of the
organization, especially Millennials (Hendricks & Cope, 2012). Organizations, business
leaders, and human resource professionals can use these results to influence Millennials’
behaviors and attitudes, which will help organizations reach their goals (Chacko,
Williams, & Schaffer, 2012).
Based on the preferences of Millennials found in this study, companies should
consider customizing their work-related attribute offerings to meet Millennials’
requirements to increase the likelihood of retaining them. With regard to their desire for
job security, companies can engage in ongoing dialogue with millennial workers, and let
them know they are valued and appreciated. Also, keeping Millennials informed of any
expected changes with the company, including potential changes in ownership of the
company could help address Millennials’ concerns over job security. One measure that an
organization can take to prevent the most negative impact of job insecurity from
occurring is by providing accurate information, and enhancing communication to its
employees (Sverke & Hellgren, 2002.) The most valuable millennial employees could be
offered retention bonuses that would signal and confirm how important they are to the
company and keep them financially motivated to stay, thereby, limiting the fear and
uncertainty of losing their jobs.

132
In order to address Millennials’ need for having a say, companies need to provide
this group of workers a forum to express their thoughts and ideas and have their opinions
heard. To do so would require more than a suggestion box or an email address where
Millennials can submit their ideas or comments. Millennials grew up with parents,
teachers, coaches and other significant adults encouraging them to speak up and be heard
(Caraher, 2014; Lancaster & Stillman, 2010). With this early life experience, Millennials
want to make a difference, have their opinions and ideas heard and taken seriously. One
way companies can do this is by having supervisors of Millennials promote and showcase
their ideas. By supporting Millennials’ ideas publicly in an organization, a manager can
bolster the confidence of the employee, making them feel valuable and that their thoughts
and ideas make a difference. Another way to address this need to be heard is to schedule
roundtables or lunches that give Millennials the opportunity to share their ideas directly
with key leaders of the company.
A key finding of the study is that advancement is very important to Millennials--
so important, in fact, that if Millennials are not promoted fast enough, they will likely
leave the organization (Pooley, 2006; Tulgan, 2016). This impatience is likely due to
Millennials’ confidence and need to overachieve, which drives them to seek out career
enhancing opportunities in an organization (De Hauw & De Vos, 2010). As a result of
this confidence, Millennials are less likely to feel they must stay with their current
employer and ‘wait their turn’ in order to be promoted. Therefore, companies must
address this need or risk losing them. To address this desire for career advancement
companies could implement in-role promotions and career development opportunities. In-
role promotions could involve an increase in pay, opportunities to manage, train, or

133
mentor others, or perhaps enhanced job titles. All of these would appeal to Millennials’
need for faster promotion and advancement without costing the organization a
tremendous amount of money. Dan Epstein, the CEO of ReSource Pro, a New York City-
based company that provides outsourcing services for the insurance industry addressed
this situation within his company. His staff is roughly 90 percent Millennials and he
proactively adjusted his company’s compensation program to accommodate Millennials’
need to move up the corporate ladder quickly. He replaced infrequent promotions and the
accompanying large increases, with more frequent promotions that carried smaller salary
increases which helps Millennials feel they’re moving forward (Reuteman, 2015).
The final key work-related attribute that was highly valued by Millennials was
work/life balance. This is likely significant to Millennials because real life experiences
with other people are more important to them than possessions (Rainer & Rainer, 2011;
Wong et al., 2008). Experiences such as travel, concerts, festivals, and sporting events are
activities that Millennials really look forward to, and that they will always remember. In
order to have the time to enjoy these experiences, Millennials want a job that gives them
time away from work to pursue them. Ways to address this need include providing
additional vacation time, flexible working arrangements, and/or opportunities for
employees to swap lesser important benefits for more time off. All of these options will
afford Millennials the time to purse the experiences and social connections that are
important to them.
Using this study’s findings about the preferences of Millennials, companies can
tailor or customize the work-related attributes they provide to make the company more

134
attractive as a potential employer to millennial candidates and to increase the likelihood
of retaining Millennials once they are on board.
5.3.2 Implications for addressing generational differences. Multi-generational
workplaces bring about a need for managers to understand generational differences and
how to best manage each generation so as to retain them within their organization. In
today’s highly competitive market for talent, organizations that effectively manage their
demographically diverse workforce will enjoy a competitive advantage (Chaudhuri &
Ghosh, 2012). However, diversity is a key defining feature of the twenty-first century,
and logically this diversity shows up in the workplace. Shaw and Fairhurst (2008)
highlight the importance of effectively managing diversity saying organizations must
recognize the influence and work preferences of different generations to be effective in
the future. Actions that employers can take to address these generational differences
include generational diversity training, mentoring programs, and enhanced
communication methods (Kapoor & Solomon, 2011).
This study found that Millennials place different value on work-related attributes
than other generations. Work-related attributes most important to older Millennials are
different than those most valued by younger Millennials. The implication here is that no
one set of work-related attributes is optimal for all employees, even those of the same
generational cohort. Therefore, organizations must find a way to provide flexibility and
choices to meet the needs and expectations of the different generations that make up their
workforce. To address this, companies need to adopt a flexible approach to work-related
attributes that allows employees to tailor their reward structure to their own needs (Close
& Martins, 2015). One potential way to execute this customization is via a cafeteria or

135
menu-based approach where employees select the work-related attributes that are
important to them. It is not economically feasible for companies to offer limitless pay,
benefits, and opportunities for its employees; to do so would drive costs up and
negatively impact company profit. However, by using the results from this study,
companies can enhance the current work-related attribute offerings they provide and
focus on improving those that would improve employee retention. In order to do so,
companies must first assess how the work-related attributes they currently provide are
valued by their employees. Then, they need to determine how much effort they are
willing to expend and how many resources they have available, finally deciding which
work-related attributes to enhance or modify. These enhancements and modifications can
be implemented specifically to make jobs more appealing for each generational cohort.
Another practical implication of this study involves how companies can continue
to ensure that they are providing the optimal set of work-related attributes to retain their
employees. One way to do this is for companies to continually monitor the external
environment and analyze qualitative and quantitative data to learn which approaches and
benefits provide the most value to their employees. This will allow companies to identify
what other employers are offering with respect to work-related attributes. If a company
discovers something that is being offered that it believes would be viewed as a positive
addition, it could consider presenting this to an employee task force for their reaction.
Involving employees in the development and revision of a company’s work-related
attributes could be another way to address this issue, which would simultaneously
address the employees’ need to have a say. It is critical that organizations introduce
workplace policies that are strongly endorsed by their employees if retention rates are to

136
be increased. As employees’ needs vary from one organization to another, each
organization must engage with their staff to identify the policies that are likely to have
the most impact. Other ways to determine what is important to employees include
gleaning this information from exit interviews, and making note of what prospective
employees ask for in job negotiations. Using these resources, a company can accumulate
the necessary information to create the differential work-related attribute offerings that
would be valued by workers from different generations.
5.3.3 Implications for addressing gender differences. It is important for
companies to address work/life balance, which was the attribute that was most highly
valued by females. This is likely related to the fact that working mothers typically
experience work–family conflict because they want to spend more time with their
children (Karatepe & Karadas, 2014). Companies can address the unique challenges
females may face in balancing the competing demands of professional and family
responsibilities by offering more work flexibility, part-time opportunities, the ability to
work from home, or allowing employees to trade off other benefits for more personal
time off. Another strategy that companies could employ would be to encourage and pay
for family leave. While family leave is required by law, pay during this leave is not
required. Offering paid leave - and encouraging employees to take advantage of the leave
-would be beneficial and highly valued. Additionally, companies could provide on
premise company child care, which would lessen time demands away from the job.
5.3.4 Implications for addressing differences between employee roles. There
are several practical implications of the findings concerning an employee’s role within
the company. An employee’s role may affect their commitment to the organization and

137
impact their intention to stay. As a manager of people, an employee may feel responsible
for the employees they manage and, therefore, be less likely to leave an organization out
of a sense of responsibility to their direct reports. Individual contributors, who do not
have responsibility for managing others, may not feel as obligated to others and likely
find it easier to leave an organization. Therefore, supervisors may be more committed to
an organization, and retention efforts might be better focused towards individual
contributors, rather than supervisors.
5.3.5 Implications for the participating company. The company that
participated in this study can benefit from the study findings and proposed
recommendations. Specifically, the company should consider addressing employee
concerns over job security. In addition, having a say, work/life balance, and advancement
are all areas that company managers should address to increase employee retention. As
mentioned previously, one specific finding from the study that might be unique to the
company involves the high importance that participants placed on job security. The
company would benefit from acknowledging these concerns to provide as much
reassurance as it can to its employees. If not, then its employees may begin to look for
jobs outside the organization and later depart the company altogether
The importance that participants placed on having a say is another finding that
might be particularly valuable for the participating company to address. Several
participants responded directly to me expressing appreciation for being included in the
survey and for being asked for their opinion. Others, like the response mentioned
previously, expressed that they gained personal insight after completing the survey and

138
were grateful for this learning. With this in mind, it would be advisable for the company
to communicate to its employees about this survey.
After deciding what to do with the study findings, the company should broadly
share the results from the survey and communicate how it plans to address the findings.
Sharing the results of the survey is important in order to instill confidence in the
employees that the survey results will be utilized well, an issue highlighted by a number
of authors (Dodd & Pesci, 1977; Ilgen, Fisher, & Taylor, 1979; Klein, Kraut, & Wolfson,
1971). According to (Kraut, 1996), there are three primary ways in which companies
share survey results with their employees: (1) distributing a written (or video) summary
of the results, (2) presenting the results to employees in a large “town hall” meeting,
and/or (3) sharing the results in small departmental meetings. Of these, a combination of
sharing these results in a “town hall” forum and following up with individual
departmental meetings is recommended. This would allow company leaders to address
the overall results pertaining to everyone’s feedback, and department managers to then
tailor the message and response to the generational make-up of the team. By sharing
results, employees will see the value of their input and the company’s desire to act on
their feedback. This would likely be well-received by the employees since ‘having a say’
is the second most valued work-related attribute behind job security. In addition, acting
on employees’ feedback could work to counteract the concern over job security and
influence them to stay with the organization.
5.4 Limitations
There are some limitations that apply to this study. Even though the main study
consisted of 301 participants, some category groups were relatively small with n < 20.

139
Sample sizes of less than 20 can make it challenging to draw valid conclusions about the
responses, and conclusions made about this sub-group might not be generalizable.
Another limitation is the participating company’s uncertain future, which was
previously mentioned. Because employees might have been concerned about the whether
their position will continue in the future, this may likely have led the participants to value
job security more highly than Millennials in general.
A further limitation involves the strength of the wording of the attributes and the
levels within the attributes. Wording like ‘position is not secure’ with respect to job
security or ‘position has little to no say’ may have strongly influenced respondents away
from these selections to something that was less polarizing. Similarly, strong positively
worded levels such as ‘completely clear’ with respect to job expectations or ‘company
leadership that is extremely skilled and effective’ may have biased and influenced
respondents to choose these desired levels more frequently. Though it was necessary to
have levels that represented true and distinct variation between the levels, it could be that
the wording may have been too extreme and these extreme words could have strongly
influenced respondents away from selecting these levels of the work-related attributes.
The implication of this would be to move more of the respondent’s choices to the very
positively worded levels and away from the very negatively worded levels, thereby
skewing the results.
Another limitation of the study is that individual differences have not been
adequately considered in this study. Respondents were grouped together based on birth
year into generational cohorts and studied as subgroups. This approach ignored the
individual differences between people, thereby, considering all respondents of the same

140
age (from same generational cohort) as the same. In actuality, participants are unique
individuals whose heredity, home environment and education, as well as specific life and
work experiences influence who they are and what they want. Furthermore, individual
differences in race, ethnicity, religion, and education levels could impact what work-
related attributes employees value. These individual differences likely impacted and
influenced what employees wanted with regard to work-related attributes, but were not
considered in this study.
A limitation specific to the phase 1 portion of the research involves the
participant selection. Since all respondents live in the same part of the U.S. and are
actively pursuing higher education, the results may be biased. Because the results of
phase 1 led to the ranking and selection of the attributes carried into the phase 2 conjoint
analysis, the homogeneity of the sample could be a limitation.
An additional limitation of the study is that the conjoint analysis portion of the
study was executed within a single company in one country. This might mean that the
results are not generalizable to a wider population in other industries or geographic
locations. Also, since all of the respondents are from the sales and marketing functions,
the results might not be applicable to employees working in different functional
disciplines.
This study’s findings are based on cross-sectional research data gathered in a
specific point in time. As Parry and Urwin (2011) noted, cross-sectional generational
research poses a number of methodological challenges. These include the difficulties of
disentangling generational cohort effects from life-cycle or career-cycle stage differences
and the period effect related to the point in history in which the study was conducted.

141
Executing this study at a single point where the results could be influenced by current
events of the company or the country’s economy in general could bias the results. An
employee’s perception of the organization may have been impacted by recent events in
the organization, thereby, influencing their responses.
5.5 Future Research
Recommendations from this study can inform future research on the topics of
Millennials’ work-related attribute expectations, millennial employee retention, and
managing a multi-generational workforce. In addition, the use of conjoint analysis to
analyze trade-offs with respect to workplace topics is a fertile area for future research.
Because limited empirical research has been conducted to study Millennial
preferences regarding work-related attributes (Costanza et al., 2012; Kowske et al.,
2010), it would be valuable for others to test whether the attributes found significant in
this study can be repeated in future studies. Such replication research would further
inform the development of strategies and recommendations for managers regarding
retention across different generational groups. To make future studies regarding
Millennial’s work-related attribute preferences more valuable, it would be beneficial to
include multiple companies in different industries and in different parts of the U.S.
Including greater variety in the sample could yield results that are much more
generalizable to a wider population. Also, since this study focused on workers within a
commercial division who were primarily sales and marketing professionals, future
research should attempt to include workers from different occupational functions. By
including other functions future studies can increase the generalizability of the results
obtained in this study.

142
Additional future research could include investigating differences among
generations globally and geographically. Researchers could consider generational
differences between cultures and countries and investigate what could cause worldwide
differences in generations’ preferences for work-related attributes. Just as attitudes,
beliefs, and culture differ by country, so too may workers’ preferences regarding work-
related attributes. Results of these studies would be valuable to international companies
with employees located in different parts of the world.
Another perspective for future research would be to conduct a longitudinal study
to assess whether Millennials change their preferences for work-related attributes as they
age and gain more experience. With a longitudinal study, workers could be queried as
they progress through their career, thereby allowing researchers to further verify whether
generations are truly different and have different expectations with regard to work-related
attributes, or if these differences are just a phenomenon of age and life experience. Only
longitudinal research with multiple generational cohorts will allow us to know for certain
whether the career patterns of different generations vary significantly (Lyons et al.,
2012); and there have only been a few longitudinal studies (Smola & Sutton, 2002;
Tulgan, 2016) where the effects of aging have been detangled from the effects of
generational differences (Pilcher, 1994).
Another area for future research would be to investigate how companies could
provide and enhance the most important work-related attributes for their employees. For
example, what specific practices can a company employ to help create a "work life
balance" or emphasize "having a say”? One idea might be to provide a list of questions
and see which are the most important in creating the abstract construct of "work/life

143
balance". This list would provide practical actions that companies could take to influence
and retain their employees
This research has explicated in some detail what Millennials want and expect
from their employer compared to what other generations want, which builds on the
growing amount of literature about managing and motivating Millennials. However, there
is limited literature on the effectiveness of employers’ responses. Therefore, it would be
valuable to examine employers’ responses to the work-related attribute preferences of
Millennials and determine how effective companies are in engaging and retaining their
millennial employees.
5.6 Summary and Conclusion
This study set out to learn more about the millennial generation in the workforce,
discovering what is known about Millennials and their preferences with respect to work-
related attributes. The systematic review sought viable solutions to a pressing problem
facing the subject organization today, while it also explored the gaps in published
literature relative to understanding Millennials’ expectations and how they differ from the
expectations of workers from other generations. While scholarly and practitioner-focused
literature has discussed this phenomenon and offered suggestions on how to address it,
there is a paucity of empirical studies.
It is estimated that by 2025, Millennials will become 75 percent of the global
workforce (Schawbel, 2013). Therefore, it will be extremely important for companies to
acquire and retain millennial workers to effectively meet their labor force needs.
Retaining millennial employees will be a vital component of an organization’s human
resources strategic plan. By applying the results and implementing the proposed solutions

144
offered within this study, companies can increase the likelihood of retaining these
valuable employees. While this study does offer recommendations on what companies
can do to retain their millennial workers, more empirical research is still needed in this
domain to help companies continue to better understand the needs of this generation.

145
REFERENCES Abelson, M. A. (1987). Examination of avoidable and unavoidable turnover. Journal of
Applied Psychology, 72(3), 382–386. Adkins, A. (2016). What millennials want from work. Gallup Business Journal. Retrieved
from http://www.gallup.com/businessjournal/191435/millennials-work-life.aspx American Marketing Association. (2000). Preference structure measurement: Conjoint
analysis and related techniques; A guide for designing and interpreting conjoint studies. IntelliQuest.
Argyris, C. (1960). Understanding organizational behavior. London: Avistock Publications.
Bannon, S., Ford, K., & Meltzer, L. (2011). Understanding Millennials in the workplace. CPA Journal, 81(11), 61–65.
Baum, M., & Kabst, R. (2013). Conjoint implications on job preferences: The moderating role of involvement. The International Journal of Human Resource Management, 24(7), 1393–1417.
Bell, S., & Griffin, H. F. (2013). Recruiting college graduates: Results of a survey on upperclassmen’s life and workplace priorities. Conflict Resolution & Negotiation Journal, 1, 129–139.
Benson, J., & Brown, M. (2011). Generations at work: Are there differences and do they matter? International Journal of Human Resource Management, 22(9), 1843–1865.
Bingham, J. B., Oldroyd, J. B., Thompson, J. A., Bednar, J. S., & Bunderson, J. S. (2014). Status and the true believer: The impact of psychological contracts on social status attributions of friendship and influence. Organization Science, 25(1), 73–92.
Brack, J. (2012). Maximizing Millennials in the Workplace. UNC Executive Development, 1–15.
Broadbridge, A. M., Maxwell, G. A., & Ogden, S. M. (2007). 13_2_30: Experiences, perceptions and expectations of retail employment for Generation Y. Career Development International, 12(6), 523–544.
Brockner, J., Grover, S., Reed, T., DeWitt, R., & O’Malley, M. (1987). Survivors’ reactions to layoffs: We get by with a little help for our friends. Administrative Science Quarterly, 32(4), 526–541.
Buahene, A. K., & Kovary, G. (2003). The road to performance success: Understanding and managing the generational divide. n-gen People Performance Inc. Toronto, ON.
Callanan, G. A., & Greenhaus, J. H. (2008). The Baby Boom generation and career management: A call to action. Advances in Developing Human Resources, 10(1), 70–85.
Canals, J. (2010). The future of leadership development: Corporate needs and the role of business schools. Houndsmill: Palgrave Macmillan.
Caraher, L. (2014). Millennials & management: The essential guide to making it work at work. Brookline, MA: Bibliomotion.
Catano, V. M., & Hines, H. M. (2015). The influence of corporate social responsibility, psychologically healthy workplaces, and individual values in attracting millennial job applicants. Canadian Journal of Behavioural Science, 48, 142–154.
Cekada, T. L. (2012). Training a multigenerational: Understanding key needs and learning styles. Professional Safety, 57(3), 40–44.
Chacko, H. E., Williams, K., & Schaffer, J. (2012). A conceptual framework for

146
attracting Generation Y to the hotel industry using a seamless hotel organizational structure. Journal of Human Resources in Hospitality & Tourism, 11(2), 106–122.
Chambers, E. G., Foulton, M., Handfield-Jones, H., Hankin, S. M., & Michaels III, E. G. (1998). The war for talent. McKinsey Quarterly, (3), 44–57.
Chaudhuri, S., & Ghosh, R. (2012). Reverse mentoring: A social exchange tool for keeping the boomers engaged and millennials committed. Human Resource Development Review, 11(1), 55–76.
Chew, J., & Chan, C. C. A. (2008). Human resource practices, organizational commitment and intention to stay. International Journal of Manpower, 29(6), 503–522.
Chrzan, K., & Orme, B. (2000). An overview and comparison of design strategies for choice-based conjoint analysis. Sawtooth Software Research Paper Series.
Close, D., & Martins, N. (2015). Generatiional motivation and preference for reward and recognition. Journal of Governance and Regulation, 4(3), 258–270.
Corporate Leadership Council. (2004). Driving performance and retention through employee engagement. Corporate Executive Board.
Costanza, D. P., Badger, J. M., Fraser, R. L., Severt, J. B., & Gade, P. A. (2012). Generational differences in work-related attitudes: A meta-analysis. Journal of Business and Psychology, 27(4), 375–394.
Crainer, S., & Dearlove, D. (1999). Death of executive talent. Management Review, 88(7), 16–23.
D’Amato, A., & Herzfeldt, R. (2008). Learning orientation, organizational commitment and talent retention across generations: A study of European managers. Journal of Managerial Psychology, 23(8), 929–953.
De Hauw, S., & De Vos, A. (2010). Millennials’ career perspective and psychological contract expectations: Does the recession lead to lowered expectations? Journal of Business and Psychology, 25(2), 293–302.
Deal, J. J., & Levenson, A. (2016). What millennials want from work- How to maximize engagement in today’s workforce. New York, NY: McGraw Hill Professional.
Deloitte Touche Tohmatsu. (2016a). Calculating the true cost of voluntary turnover: The surprising ROI of retention.
Deloitte Touche Tohmatsu. (2016b). The 2016 Deloitte Millenial survey: Winning over the next generation of leaders. Retrieved from http://www2.deloitte.com/global/en/pages/about-deloitte/articles/millennialsurvey.html
Dodd, W. E., & Pesci, M. L. (1977). Managing morale through survey feedback. Business Horizons, 20(3), 36–45.
Edmunds, J., & Turner, B. S. (2005). Global generations: Social change in the twentieth century. British Journal of Sociology, 56(4), 559–577.
Elmore, T. (2010). Generation iY: Our last chance to save their future. Atlanta, Georgia: Poet Gardener Publishing.
Engleberg, M., Pierson, R. M., & Kashio, H. (1992). Applying conjoint analysis to social advertisements. Advances in Consumer Research, 19, 696–705.
Epstein, M., & Howes, P. (2008). Recruiting, retaining and managing the millennial generation. Selected Readings 2008-Management of a Practice [CD ROM]. New York: American Institute of Certified Public Accountants.

147
Erickson, T. J. (2009). Gen Y in the workforce: How I learned to love Millennials and stop worrying about what they are doing with their iPhones. Harvard Business Review, 87(2), 43–49.
Ferri-Reed, J. (2012). Three ways leaders can help Millennials succeed. Journal for Quality & Participation, 35(1), 18–19.
Focus on Millennials. (2016). Retrieved October 26, 2016, from http://www.voced.edu.au/content/focus-millennials
Fry, R. (2015). Millennials surpass Gen Xers as the largest generation in U.S. labor force. Retrieved April 8, 2016, from http://www.pewresearch.org/fact-tank/2015/05/11/millennials-surpass-gen-xers-as-the-largest-generation-in-u-s-labor-force/
Galambos, N. L., & Garbarino, J. (1982). Identifying the missing links in the study of latchkey children. Child Today, 12(4), 2–4.
Gallup. (2016). How Millennials want to work and live. Omaha, Nebraska. Giancola, F. (2006). The generation gap: More myth than reality. People and Strategy,
29(4), 32. Gilbert, J. (2011). The Millennials: A new generation of employees, a new set of
engagement policies. Ivey Business Journal, 75(5), 26–28. Gilbride, T. J., Lenk, P. J., & Brazell, J. D. (2008). Market share constraints and the loss
function in choice-based conjoint analysis. Marketing Science, 27(6), 995–1011. Goud, P. V. (2014). Employee retention for sustainable development. In International
Journal of Innovative Technology & Adaptive Management (IJITAM) (Vol. 1, pp. 10–16).
Govaerts, N., Kyndt, E., Dochy, F., & Baert, H. (2011). Influence of learning and working climate on the retention of talented employees. Journal of Workplace Learning, 23(1), 35–55.
Green, P. E., Krieger, A. M., & Wind, Y. (2001). Thirty years of conjoint analysis: Reflections and prospects. Interfaces, 31(3), 56–73.
Green, P. E., & Srinivasan, V. (1978). Conjoint analysis in consumer research: Issues and outlook. Journal of Consumer Research, 5(2), 103–123.
Green, P. E., & Wind, Y. (1975). New way to mesure consumers’ judgements. Harvard Business Review, (July-August), 107–117.
Guillot-Soulez, C., & Soulez, S. (2014). On the heterogeneity of Generation Y job preferences. Employee Relations, 36(4), 319–332.
Gursoy, D., Chi, C. G. Q., & Karadag, E. (2013). Generational differences in work values and attitudes among frontline and service contact employees. International Journal of Hospitality Management, 32(1), 40–48.
Hair, J. F., Black, W. C., Babin, B., Anderson, R. E., & Tatham, R. L. (1998). Multivariate data analysis (Volume 5). Upper Saddle River; NJ: Prentice Hall.
Hancock, J. I., Allen, D. G., Bosco, F. A., Mcdaniel, K. R., & Pierce, C. A. (2013). Meta-analytic review of employee turnover as a predictor of firm performance. Journal of Management, 39(3), 573–603.
Hartman, J. L., & McCambridge, J. (2011). Optimizing Millennials’ communication styles. Business Communication Quarterly, 74(1), 22–44.
Hartman, M. (2016). 15 years of labor shortages predicted for the U.S. economy. Retrieved January 12, 2017, from

148
https://www.marketplace.org/2016/04/19/world/15-years-labor-shortages-predicted-us-economy
Hausknecht, J. P., & Trevor, C. O. (2011). Collective turnover at the group, unit, and organizational levels: evidence, issues, and implications. Journal of Management, 37(1), 352–388.
Hays, D. W. (2014). Examining differences between millennial and all employee levels of job satisfaction and importance and satisfaction with the immediate supervisor relationship. International Journal of Managerial Studies and Research, 2(8), 1–7.
Hendricks, J., & Cope, C. V. (2012). Generational diversity: What nurse managers need to know. Clinical Pharmacology and Therapeutics, 69(3), 717–725.
Hershatter, A., & Epstein, M. (2010). Millennials and the world of work: An organization and management perspective. Journal of Business and Psychology, 25(2), 211–223.
Hewlett, S. A., Sherbin, L., & Sumberg, K. (2009). How Generation Y and Boomers will reshape your agenda. Harvard Business Review, 7/8, 71–76.
Holt, S., Marques, J., & Way, D. (2012). Bracing for the Millennial workforce: Looking for ways to inspire Generation Y. Journal of Leadership, Accountability and Ethics, 9(6), 81–93.
Hom, P. W. (2011). Organizational exit. In S. Zedeck (Ed.), Handbook of industrial/organizational psychology (Vol. 2, pp. 67–117). Washington, DC: American Psychological Association.
Hom, P. W., & Griffeth, R. W. (1995). Employee turnover. Cincinnati, OH: SouthWestern Publishing.
Hom, P. W., Mitchell, T. R., Lee, T. W., & Griffeth, R. W. (2012). Reviewing employee turnover: Focusing on proximal withdrawal states and an expanded criterion. Psychological Bulletin, 138(5), 831–858.
Homan, A. (2015). Who Is Generation X? Retrieved February 4, 2017, from http://tiie.w3.uvm.edu/blog/who-are-generation-z/#.WJWsApInaru
Horovitz, B. (2012). After Gen X, Millennials, what should next generation be? Retrieved February 4, 2017, from http://usatoday30.usatoday.com/money/advertising/story/2012-05-03/naming-the-next-generation/54737518/1 %0D
Houck, C. (2011). Multigenerational and virtual: How do we build a mentoring program for today’s workforce? Performance Improvement, 50(2), 25–30.
Howe, N., & Strauss, W. (1991). Generations: The history of America’s future, 1584 to 2069. New York: William Morrow.
Howe, N., & Strauss, W. (2000). Millennials rising: The next great Generation. Vintage. Ilgen, D. R., Fisher, C. D., & Taylor, M. S. (1979). Consequences of individual feedback
on behavior in organizations. Journal of Applied Psychology, 64(4), 349–371. Jamieson, I., Kirk, R., & Andrew, C. (2013). Work-life balance: What Generation Y
nurses want. Nurse Leader, 11(3), 36–39. Johnson, R. M., & Orme, B. (2002). How many questions should you ask in choice-based
conjoint studies? Sawtooth Software Research Paper Series, 98382(360), 1–24. Jurkiewicz, C. L. (2000). Generation X and the public employee. Public Personnel
Management, 29(1), 55–74. Kaifi, B. A., Nafei, W. A., Khanfar, N. M., & Kaifi, M. M. (2012). A multi-generational
workforce: Managing and understanding Millennials. International Journal of

149
Business and Management, 7(24), 88–93. Kapoor, C., & Solomon, N. (2011). Understanding and managing generational
differences in the workplace. Worldwide Hospitality and Tourism Themes, 3(4), 308–318.
Kapur, S., Kumar, B., Banga, G., & Surana, M. (2008). Comparison of full profile approach and self-explicated approach of conjoint analysis: An empirical evidence. Journal of Management Research, 8(1), 46–56.
Karatepe, O. M., & Karadas, G. (2014). The effect of psychological capital on conflicts in the work-family interface, turnover and absence intentions. International Journal of Hospitality Management, 43, 132–143.
Karsh, B., & Templin, C. (2013). Manager 3.0: A Millennial’s guide to rewriting the rules of management. AMACOM. New York, NY: AMACOM Div American Mgmt Assn.
Kiessling, T., Harvey, M., & Moeller, M. (2012). Supply-chain corporate venturing through acquisition: Key management team retention. Journal of World Business, 47(1), 81–92.
Kilber, J., Barclay, A., & Ohmer, D. (2014). Seven tips for managing Generation Y. Journal of Management Policy and Practice, 15(4), 80–92.
Klein, S. M., Kraut, A. I., & Wolfson, A. (1971). Employee reactions to attitude survey feedback: A study of the impact of structure and process. Administrative Science Quarterly, 16(4), 497–514.
Kowske, B. J., Rasch, R. L., & Wiley, J. W. (2010). An empirical examination of generational effects on work attitudes. Journal of Business and Psychology, 25(2), 265–279.
Kraut, A. I. (Ed.). (1996). Organizational surveys: Tools for assessment and change (Vol. 3). San Francisco, CA: Jossey-Bass.
Lancaster, L. C., & Stillman, D. (2010). The M-factor: How the Millennial generation is rocking the workplace. New York, NY: HarperCollins.
Landrum, S. (2016). How Millennials are changing the workplace. Retrieved March 9, 2017, from https://www.forbes.com/sites/sarahlandrum/2016/12/30/how-millennials-are-changing-how-we-view-success/#519792a53b94
Lau, T., Chan, K. F., Tai, S. H. C., & Ng, D. K. C. (2010). Corporate entrepreneurship of IJVs in China. Management Research Review, 33(1), 6–22.
Legas, M., & Sims, C. (2011). Leveraging generational diversity in today’s workplace. Online Journal for Workforce Education and Development, V(3).
Levinson, H., Price, C., Munden, K., Mandi, H., & Solley, C. (1962). Men, management, and mental health. Cambridge, MA: Harvard University Press.
Lewis, R. A. (2015). Generation Y at work: Insight from experiences in the hotel sector Literature review. International Journal of Business and Management, III(1), 1–17.
Long, H. (2016). The new normal: 4 job changes by the time you’re 32. Retrieved November 7, 2016, from http://money.cnn.com/2016/04/12/news/economy/millennials-change-jobs-frequently/
Lyons, S. T., & Kuron, L. (2013). Generational differences in the workplace: A review of the evidence and directions for future research. Journal of Organizational Behavior, 35, 139–157.

150
Lyons, S. T., Schweitzer, L., & Ng, E. S. W. (2015). How have careers changed? An investigation of changing career patterns across four generations. Journal of Managerial Psychology, 30(1), 8–21.
Lyons, S. T., Schweitzer, L., Ng, E. S. W., & Kuron, L. K. J. (2012). Comparing apples to apples. Career Development International, 17(4), 333–357.
Mannheim, K. (1952). The Problem of Generations. Essays on the Sociology of Knowledge, 24(19), 276-322–24.
Mannheim, K. (1970). The sociological problem of generations. Psychoanalytic Review, 57(3), 163–195.
Martin, C. A. (2005). From high maintenance to high productivity: What managers need to know about Generation Y. Industrial and Commercial Training, 37(1), 39–44.
Maslach, C., Schaufeli, W. B., & Leiter, M. P. (2001). Job burnout. Annual Review of Psychology, 52, 397–422.
Mayfield, J., & Mayfield, M. (2014). Step by step to better performance: Organizational-citizenship behavior can transform employees and the workplace. Human Resource Management International Digest, 22(4), 36–39.
McGuire, D., Todnem, R., & Hutchings, K. (2007). Towards a model of human resource solutions for achieving intergenerational interaction in organisations. Journal of European Industrial Training, 31(8), 592–608.
Meier, J., Austin, S. F., & Crocker, M. (2010). Generation Y in the workforce: Managerial challenges. The Journal of Human Resource and Adult Learning, 6(1), 68–79.
Montana, P. J., & Petit, F. (2008). Motivating Generation X and Y on the job and preparing Z. Global Journal of Business Research, 2(2), 139–149.
Montgomery, D. B., & Ramus, C. A. (2011). Calibrating MBA job preferences for the 21st century. Academy of Management Learning and Education, 10(1), 9–26.
Moreno, F. M., Carreón, F. A., & Moreno, S. M. (2016). The adoption of the green marketing in the Millennium generation. International Journal of Marketing Studies, 8(2), 97.
Mowday, R. T., Porter, L. W., & Steers, R. M. (1982). Employee-organizational linkages: The psychology of commitment, turnover, and absenteeism. New York: Academic Press.
Moy, J. W., & Lam, K. F. (2004). Selection criteria and the impact of personality on getting hired. Personnel Review, 33(5), 521–535.
Murphy, E. F., Gibson, J. W., & Greenwood, R. A. (2010). Analyzing generational values among managers and non-managers for sustainable organizational effectiveness. Sam Advanced Management Journal, 33–44.
Myers, K. K., & Sadaghiani, K. (2010). Millennials in the workplace: A communication perspective on millennials’ organizational relationships and performance. Journal of Business and Psychology, 25(2), 225–238.
Ng, E. S. W., Schweitzer, L., & Lyons, S. T. (2010). New generation, great expectations: A field study of the millennial generation. Journal of Business and Psychology, 25(2), 281–292.
Noer, D. M. (2009). Healing the wounds: Overcoming the trauma of layoffs and revitalizing downsized organizations. John Wiley and Sons.
Nolan, L. S. (2015). The roar of Millennials: Retaining top talent in the workplace.

151
Journal of Leadership, Accountability and Ethics, 12(5), 69–75. North, E., & De Vos, R. (2010). The use of conjoint analysis to determine consumer
buying preferences: A literature review. Journal of Family Ecology and Consumer Sciences, 30(1), 32–39.
Orme, B. (2009). Which conjoint method should I use? Sawtooth Software: Research Paper Series.
Orme, B. (2010a). Interpreting the results of conjoint analysis. Getting Started with Conjoint Analysis: Strategies for Product Design and Pricing Research, 77–88.
Orme, B. (2010b). Sample size issues for conjoint analysis. Getting Started with Conjoint Analysis: Strategies for Product Design and Pricing Research, 57–66.
Orme, B. (2014). SSI Web v8.3: Software for web interviewing and conjoint analysis. SIWeb v8.3 Manual, (March).
Orme, B., Alpert, M., & Christensen, E. (1997). Assessing the validity of conjoint analysis–continued. Sawtooth Software Research Paper Series, 1–20.
Orme, B., & Heft, M. A. (2002). Predicting actual sales with CBC: Improves results. Sawtooth Software: Research Paper Series, 1–18.
Ozcelik, G. (2015). Engagement and retention of the Millennial generation in the workplace through internal branding. International Journal of Business and Management, 10(3), 99–107.
Parry, E., & Urwin, P. (2011). Generational differences in work values: A review of theory and evidence. International Journal of Management Reviews, 13(1), 79–96.
Pew Research Center. (2013). On pay gap millennial women near parity – for now, 78. Retrieved from http://www.pewsocialtrends.org/2013/12/11/on-pay-gap-millennial-women-near-parity-for-now/
Pew Research Center. (2014). Millennials in adulthood. Retrieved December 16, 2016, from http://www.pewsocialtrends.org/2014/03/07/millennials-in-adulthood/%0D
Pilcher, J. (1994). Mannheim’s sociology of generations: An undervalued legacy. British Journal of Sociology, 45(3), 481–495.
Pooley, E. (2006). Generation Y: How twenty somethings are changing the workplace. Retrieved December 31, 2016, from http://www.canadianbusiness.com/business-strategy/generation-y-how-twentysomethings-are-changing-the-workplace/
Porter, L. W., & Steers, R. M. (1973). Organizational, work, and personal factors in employee turnover and absenteeism. Psychological Bulletin, 80(2), 151–176.
Rainer, T. S., & Rainer, J. (2011). The Millennials: Connecting to America’s largest generation. Nashville, TN: B&H Publishing Group.
Rawlins, C., Indvik, J., & Johnson, P. R. (2008). Understanding the new generation: What the millennial cohort absolutely, positively must have at work. Journal of Organizational Culture, Communications and Conflict, 12(2), 1–8.
Reuteman, R. (2015). This is how millennials will change management. Retrieved September 7, 2017, from https://www.entrepreneur.com/article/242507
Robinson, S. L. (1996). Trust and breach of the psychological contract. Administrative Science Quarterly, 41(4), 574–599.
Rosen, L. (2010). Welcome to the iGeneration! Retrieved February 4, 2017, from https://www.psychologytoday.com/blog/rewired-the-psychology-technology/201003/welcome-the-igeneration
Rousseau, D. M. (1989). Psychological and implicit contracts in organizations. Employee

152
Responsibilities and Rights Journal, 2(2), 121–139. Rousseau, D. M. (1990). New hire perceptions of their own and their employer’s
obligations: A study of psychological contracts. Journal of Organizational Behavior, 11(5), 389–400.
Rousseau, D. M. (1995). Psychological contracts in organizations: Understanding written and unwritten agreements. Thousand Oaks, CA: Sage Publications.
Rupp, D. E., Vodanovich, S. J., & Crede, M. (2006). Age bias in the workplace: The impact of ageism and causal attributions. Journal of Applied Social Psychology, 36, 1337–1364.
Ryder, N. B. (1965). The Cohort as a Concept in the Study of Social Change. American Sociological Review, 30(6), 843–861.
Sashittal, H. C., Jassawalla, A. R., & Markulis, P. (2012). Students’ perspective into the apathy and social disconnectedness they feel in undergraduate business classrooms. Decision Sciences Journal of Innovative Education, 10(3), 413–446.
Schawbel, D. (2013). Why You Can’t Ignore Millennials. Retrieved July 13, 2017, from www.forbes.com/sites/danschawbel/2013/09/04/why-you-cant-ignore-millennials/#4500704c207c%0D
Scheef, D., & Thielfoldt, D. (2003). Engaging multiple generations among your workforce. Linkandlearn Newsletter, 15.
Seibert, S. E., Kraimer, M. L., Holtom, B. C., & Pierotti, A. J. (2013). Even the best laid plans sometimes go askew: Career self-management processes, career shocks, and the decision to pursue graduate education. The Journal of Applied Psychology, 98(1), 169–82.
Sessa, V. I., Kabacoff, R. I., Deal, J., & Brown, H. (2007). Generational differences in leader values and leadership behaviors. The Psychologist-Manager Journal, 10(1), 47–74.
Shaw, S., & Fairhurst, D. (2008). Engaging a new generation of graduates. Education + Training, 50(5), 366–378.
Shropshire, J., & Kadlec, C. (2012). Where are you going? A comparative analysis of job and career change intentions among USA it workers. Journal of Internet Banking and Commerce, 17(2), 1–20.
Smith, S. D., & Galbraith, Q. (2012). Motivating Millennials: Improving practices in recruiting, retaining, and motivating younger library staff. Journal of Academic Librarianship, 38(3), 135–144.
Smola, K. W., & Sutton, C. D. (2002). Generational differences: Revisiting generational work values for the new millennium. Journal of Organizational Behavior, (23), 363–382.
Solnet, D., & Hood, A. (2008). Generation Y as hospitality employees: Framing a research agenda. Journal of Hospitality and Tourism Management, 15(1), 59–68.
Solnet, D., Kraly, A., & Kandampully, J. (2012). Generation Y employees: An examination of work attitude differences. Journal of Applied Management and Entrepreneurship, 17(3), 36–53.
Stepanovich, P. L., & Mueller, J. D. (2002). Mapping strategic consensus. Journal of Business and Management, 8(2), 147–163. Retrieved from http://proquest.umi.com.ezproxylocal.library.nova.edu/pqdweb?did=167153051&

153
Strauss, W., & Howe, N. (1997). The fourth turning. New York: Broadway Books. Sujansky, J. G., & Ferri-Reed, J. (2009). Keeping the Millennials: Why companies are
losing billions in turnover to this generation - And what to do about it. Hoboken, New Jersey: John Wiley & Sons, Inc.
Suleman, R., & Nelson, B. (2011). Motivating the Millennials: Tapping into the potential of the youngest generation. Leader to Leader, 2011(62), 39–44.
Sverke, M., & Hellgren, J. (2002). The nature of job insecurity: Understanding employment uncertainty on the brink of a new millennium. Applied Psychology, 51(1), 23–42.
Terjesen, S., Vinnicombe, S., & Freeman, C. (2007). Attracting Generation Y graduates: Organisational attributes, likelihood to apply and sex differences. Career Development International, 12(6), 504–522.
Tews, M. J., Michel, J. W., & Stafford, K. (2013). Does fun pay? The Impact of workplace fun on employee turnover and performance. Cornell Hospitality Quarterly, 54(4), 370–382.
Tews, M. J., Michel, J., Xu, S., & Drost, A. J. (2015). Workplace fun matters … but what else? Employee Relations, 37(2), 248–267.
Thompson, C., & Gregory, J. B. (2012). Managing Millennials: A framework for improving attraction, motivation, and retention. The Psychologist-Manager Journal, 15(4), 237–246.
Tulgan, B. (2016). Not everyone gets a trophy: How to manage Generation Y. Hoboken, New Jersey: John Wiley & Sons, Inc.
Turnley, W. H., & Feldman, D. C. (2000). Re-examining the effects of psychological contract violations: Unmet expectations and job. Journal of Organizational Behavior, 21(1), 25.
Twenge, J. M. (2010). A review of the empirical evidence on generational differences in work attitudes. Journal of Business and Psychology, 25(2), 201–210.
Twenge, J. M., Campbell, S. M., Hoffman, B. J., & Lance, C. E. (2010). Generational differences in work values: Leisure and extrinsic values increasing, social and intrinsic values decreasing. Journal of Management, 36(5), 1117–1142.
Twenge, J. M., Campbell, W. K., & Freeman, E. C. (2012). Generational differences in young adults’ life goals, concern for others, and civic orientation, 1966-2009. Journal of Personality and Social Psychology, 102(5), 1045–62.
U.S. Bureau of Labor Statistics. (2017a). Employment status of the civilian population by sex and age. Bureau of Labor Statistics. Washington, DC. Retrieved from https://www.bls.gov/news.release/empsit.t01.htm%0D
U.S. Bureau of Labor Statistics. (2017b). Job openings and labor turnover - November 2016. Washington, DC. Retrieved from https://www.bls.gov/news.release/pdf/jolts.pdf
Uen, J. F., Wu, T., & Huang, H. Y. (2009). Young managers’ interpersonal stress and its relationship to management development practices: An exploratory study. International Journal of Training and Development, 13(1), 38–52.
Vandenberg, R. J., & Nelson, J. B. (1999). Disaggregating the motives underlying turnover intentions: When do intentions predict turnover behavior? Human Relations, 52(10), 1313–1336.
Vinichenkon, M. V., Melnichuk, A. V., Kirillov, A. V., Makushin, S. A., & Melnnichuk,

154
Y. A. (2016). Modern views on the gamification of business. Journal of Internet Banking and Commerce, 21(3), 1–13.
Ware, B. L. (2014). Stop the Gen Y revolving door. T+D, 68(5), 58–64. Wiley, C. (1997). What motivates employees according to over 40 years of motivation
surveys. International Journal of Manpower, 18(3), 263–280. Wong, M., Gardiner, E., Lang, W., & Coulon, L. (2008). Generational differences in
personality and motivation: Do they exist and what are the implications for the workplace? Journal of Managerial Psychology, 23(8), 878–890.
Wüst, K. (2015). Interesting tasks, independence or importance to society? - The vocational expectations of Generation Y. Econviews, 307–324.
Yang, J. Te, Wan, C. S., & Fu, Y. J. (2012). Qualitative examination of employee turnover and retention strategies in international tourist hotels in Taiwan. International Journal of Hospitality Management, 31(3), 837–848.
Yoo-lee, E., & Lee, T. H. (2013). Planning library spaces and services for Millennials: An evidence-based approach. Library Management, 34(6/7), 98–511.
Zemke, R., Raines, C., & Filipczak, B. (2000). Generations at work: Managing the clash of Veterans, Boomers, Xers, and Nexters in your workplace. New York. New York, NY: AMACOM Division American Management Association.

155
APPENDIX A
Meta-analysis of Millennial-focused Studies
Source Millennial Birth
Range Begin End Adkins, 2016 1980-1996 1980 1996 Fry, 2015 1981-1997 1981 1997 Caraher, 2015 1980-2000 1980 2000 Deal & Levenson, 2016 1980-2000 1980 2000 Rainer & Rainer, 2011 1980-2000 1980 2000 Elmore, 2010 1984-2002 1984 2002 Tulgan, 2016 1978-1989 1978 1989 Lancaster & Stillman, 2010 1982-2000 1982 2000 Holt, Marques, & Way, 2012 1977-1981 1977 1981 Lyons, Schweitzer, Ng, & Kuron, 2012 Post 1980 1980 Lyons & Kuron, 2013 late 1970s -late 1990s 1977 1995 Gursoy, Chi, & Karadag, 2013 1981-2000 1981 2000 Twenge, Campbell, Hoffman, & Lance, 2010 Post 1982 1982 Lewis, 2015 1980-1993 1980 1993 Solnet, Kraly, & Kandampully, 2012 1979-1994 1979 1994 Benson & Brown, 2011 Post 1976 1976 Wüst, 2015 1978-2000 1978 2000 Legas & Sims, 2011 1980-2000 1980 2000 Thompson & Gregory, 2012 1980-late 1990s 1980 1997 De Hauw & De Vos, 2010 1980-2000 1980 2000
Nolan, 2015 Mid-1970s-early
2000s 1975 2002 Vinichenkon, et al., 2016 1983-2003 1983 2003 Smith & Galbraith, 2012 1981-2000 1981 2000 Kaifi, Nafei, Khanfar, & Kaifi, 2012 Post 1980 1980 Hartman & McCambridge, 2011 1980-2000 1980 2000 Catano & Hines, 2015 1979-1994 1979 1994 Moreno, Carreón, & Moreno, 2016 early 1980s-early 2000 1982 2002 Kapoor & Solomon, 2011 1980-1999 1980 1999 Yoo-lee & Lee, 2013 Post 1982 1982 Howe & Strauss, 2000 Post 1982 1982 Parry & Urwin, 2011 Post 1982 1982 MEAN MEDIAN, MODE
1978 1980
2000 2000

156
APPENDIX B
List of work-related attributes important to Millennials from literature review # Work-related Attributes
1 Competitive salary – pay is in line with salaries from other companies 2 Flex hours – company has flexible work hours / days
3 Ability to work from home – employees can work from home at times 4 Strong manager – managers are skilled and effective 5 Strong senior leadership - leadership is skilled and effective of company 6 Career advancement – employees can advance and get promoted quickly 7 Personal development – company provides personal growth opportunities 8 Fun – the company is a fun place to work 9 Creativity - organization encourages employee creativity 10 Role clarity – employees know what is expected of them 11 Coaching and feedback – employees get feedback on performance and improvement
areas 12 Supervisor availability –managers / supervisors are available when employees need
them 13 Friends at work – employees can have friends / social relationships with co-workers 14 Volunteering – organization supports employees giving back to society 15 Work from home – employees can occasionally work from home 16 Student loan assistance – company helps employees pay-off student loans
17 Reputable company - company has a good reputation
18 Tuition assistance – company helps pay for ongoing educational expenses 19 Work/life balance – employees work load and hours allow them to have a life
outside of work 20 Having a say – employees are listened to and their voice / opinions matter
21 Job security – employees have confidence that their job is secure
22 Retirement plan – company provides a retirement plan 23 Role importance – employees feel that what they do contributes to the success of the
organization 24 Recognition – employees get recognition for a job well done 25 Social responsibility – company is a good corporate citizen and treats the world and
the environment respectfully

157
APPENDIX C
Email Communicating Phase 1 Survey – Doctoral Students
May 6, 2017 Hi friends,
Can you please help me out? As part of the data collection for my dissertation, I have developed a pilot study to help me gather and distill the most important work-related attributes. Can you please complete this survey monkey for me? It should only take 5 minutes. I have already gathered data from Michael Stodnick’s undergraduates, but I now need data from other generational cohorts. I have asked for and received approval from Dr. Bell to contact and survey both our cohort and the DBA cohort behind us.
If you are willing to help me out, would you please click on this link and follow the instructions?
https://www.surveymonkey.com/r/work-attributes
Also, I welcome any feedback you have on the instrument such as were the instructions easy to follow, were the questions clear, and how long it took you to complete the survey.
Thank you so much for your help. And please know I will return the favor and participate in any survey or data collection you made need.
I hope you are all doing well! Best regards, Ray Pasko Student, Doctor of Business Administration Program University of Dallas Satish & Yasmin Gupta College of Business Accredited by AACSB International [email protected] 1845 E. Northgate Drive | Irving, Texas 75062 | USA cell (UK) +44 739 375 3356

158
APPENDIX D
Email Communicating Phase 1 Survey – Graduate Students
May 7, 2017 Hello all- First, let me introduce myself and let you know why you are getting this email. I am a DBA student in cohort I of the University of Dallas’ DBA program, and I am a working on my dissertation. l would sincerely appreciate if you could help me out my participating in and completing a brief survey. As part of the data collection for my dissertation, I have developed a pilot study to help me gather and distill the most important work-related attributes. It should only take 5 minutes. I have already gathered data from undergraduate students in Dr. Stodnick’s classes, and I now need data from other generational cohorts. I have asked for, and received, approval from Dr. Bell to contact and survey both U.D. DBA cohorts. If you are willing to help me out, would you please click on this link, follow the instructions, and complete the survey? https://www.surveymonkey.com/r/work-attributes Also, I welcome any feedback you have on the instrument, such as, were the instructions easy to follow, were the questions clear, and how long it took you to complete the survey. Thank you so much for your help. And please know I will return the favor and participate in any survey or data collection you made need. I hope you are all doing well in your academic journey! I can tell you it does get easier as you progress. Best regards, Ray Pasko Student, Doctor of Business Administration Program University of Dallas Satish & Yasmin Gupta College of Business Accredited by AACSB International [email protected] 1845 E. Northgate Drive | Irving, Texas 75062 | USA cell (UK) +44 739 375 3356

159
APPENDIX E
NIH Certification
160
APPENDIX F
IRB Approval Letter - Phase 1 Survey
1845 East Northgate Drive, Irving, TX 75062‐4736
April 7, 2017
Ray Pasko University of Dallas Irving, TX 75062 RE: IRB expedited review of proposal #2017030
Dear Ray Pasko: Thank you for submitting your research proposal for prior approval by the Institutional Review Board (IRB). Your proposal was reviewed under the procedure for expedited review, as it poses minimal risk for participants. You indicate that steps will be taken to obtain informed consent from participants as well as the steps to be taken to protect participants’ identities. The reviewer(s) recommended approval of your request to complete Phase 1 of the research described in your proposal under the conditions stated above and under the guidance of your instructor.
As you complete your research, please keep in mind that substantive changes to the research method or participant population will require IRB review, and that any participant injuries or complaints must be reported to the IRB at the time they occur. The IRB policies require that you provide an annual report of the progress of this research project, or a report upon completion, whichever occurs first.
On behalf of the members of the IRB, I wish you success in this project.
Sincerely,
Gilbert Garza, Ph.D. IRB Chair

161
APPENDIX G
Phase 1 Survey

162

163

164

165

166
APPENDIX H
Conjoint Survey Test Design Diagnostics
Legacy (OLS) Efficiency Test ------------------------------------------------------------- Att/Lev Freq. Actual Ideal Effic. 1 1 3600 (this level has been deleted) 2 years 1 2 3600 0.0256 0.0256 1.0009 2-4 years 1 3 3600 0.0257 0.0256 0.9977 4+ years 2 1 3600 (this level has been deleted) Strong 2 2 3601 0.0257 0.0257 0.9988 Average 2 3 3599 0.0257 0.0257 0.9995 Below Average 3 1 3600 (this level has been deleted) Clear 3 2 3600 0.0257 0.0256 0.9918 Somewhat clear 3 3 3600 0.0256 0.0256 1.0009 Unclear 4 1 3600 (this level has been deleted) 40-45 4 2 3600 0.0255 0.0255 1.0037 46-50 4 3 3600 0.0256 0.0255 0.9946 50+ 5 1 3600 (this level has been deleted) Secure 5 2 3600 0.0256 0.0256 1.0006 Unsure security 5 3 3600 0.0257 0.0256 0.9974 Not secure 6 1 3600 (this level has been deleted) High Say Level 6 2 3601 0.0255 0.0255 1.0008 Average Say Level 6 3 3599 0.0255 0.0255 1.0008 No Say
Note: The efficiencies reported above for this design assume an equal number of respondents complete each version. Logit Efficiency Test Using Simulated Data ------------------------------------------------------------- Main Effects: 1 2 3 4 5 6 Build includes 300 respondents. Total number of choices in each response category: Category Number Percent ----------------------------------------------------- 1 1178 32.72%
2 1207 33.53% 3 1215 33.75%

167
There are 3600 expanded tasks in total, or an average of 12.0 tasks per respondent. Iter 1 Log-likelihood = -3950.77310 Chi Sq = 8.46228 RLH = 0.33373 Iter 2 Log-likelihood = -3950.60457 Chi Sq = 8.79933 RLH = 0.33374 Iter 3 Log-likelihood = -3950.59781 Chi Sq = 8.81285 RLH = 0.33374 Iter 4 Log-likelihood = -3950.59754 Chi Sq = 8.81339 RLH = 0.33374 Iter 5 Log-likelihood = -3950.59753 Chi Sq = 8.81341 RLH = 0.33374 Iter 6 Log-likelihood = -3950.59753 Chi Sq = 8.81342 RLH = 0.33374 *Converged Std Err Attribute Level 1 0.02568 1 1 2 years 2 0.02563 1 2 2-4 years 3 0.02566 1 3 4+ years 4 0.02578 2 1 Strong 5 0.02554 2 2 Average 6 0.02571 2 3 Below Average 7 0.02566 3 1 Clear 8 0.02582 3 2 Somewhat clear 9 0.02541 3 3 Unclear 10 0.02552 4 1 40-45 11 0.02547 4 2 46-50 12 0.02568 4 3 50+ 13 0.02570 5 1 Secure 14 0.02562 5 2 Unsure security 15 0.02567 5 3 Not secure 16 0.02565 6 1 High Say Level 17 0.02532 6 2 Average Say Level 18 0.02557 6 3 No Say A general guideline is to achieve standard errors of 0.05 or smaller for main effect utilities and 0.10 or smaller for interaction effects or alternative-specific effects.

168
APPENDIX I
IRB Approval Letter – Phase 2 Survey

169
APPENDIX J
Pilot Survey Request to Participate Email

170
APPENDIX K
Phase 2 Survey – Conjoint Analysis

171
Hold-out Question #1 – Every respondent sees the same exact question with same levels for each attribute

172
Hold-out Question #2 – Every respondent sees the same exact question with same levels for each attribute

173

174
APPENDIX L
Email Communicating Phase 2 Survey
U.S. Vision Care Team-
Congratulations and thank you for closing Q2 strong over the last few weeks. We look
forward to celebrating our 1H finish at the upcoming POAs in late July or early August and
preparing for a strong finish to our year.
We are asking for your assistance for one of our colleagues and friends, Ray Pasko. As most
of you know, he is in the process of completing his Doctoral Degree. His work centers
around examining the effect that work-related attributes have on employee satisfaction and
retention, including differences across key demographics.
This survey should take less than 10 minutes to complete. Your responses will be
anonymous, meaning that specific responses cannot be identified with a particular
individual. In addition, all responses will be combined and reported in aggregate only. The
combined results of the survey will be shared with the both the Alcon U.S. and U.K.
organizations; however, no individual responses will be reported.
Your participation in this survey is completely voluntary, but it would be nice if we could get
as many members of our team to complete the survey. Ray told us that the UK team’s
participation level in the survey was 76%. We know that we can exceed that number! The
survey will be sent via email directly from Ray’s Alcon email address –
[email protected], so please be on the look-out for the email. This will be coming out
within the next day or so.
Please complete this survey within the next week if possible by the close of business July 7th.
Thank you in advance for your participation.
Eric Bruno Ben Nobles
175
APPENDIX M
Email Communicating Phase 2 Survey
From: Pasko, Ray Sent: 30 June 2017 20:07 Subject: Request for Participation in my Dissertation Survey
Hello Alcon U.S. colleagues-
I believe that you have already received the below communication from Eric Bruno and Ben Nobles communicating their support and encouragement for you to participate in this survey for me.
As many of you may know, I am in the process of completing my doctorate degree. My
dissertation involves the effect that work-related attributes have on employee satisfaction and retention. Work-related attributes are what employees expect to receive in exchange for their employment. These include tangible and intangible components.
Specifically, I am interested in determining if employees’ preferences for these work-attributes vary by age (generational cohort, to be exact), and if there are differences between employees in the UK/Ireland and the U.S.
This survey should only take between 5 – 7 minutes, and I do have permission from the company to send this out to you. All responses are anonymous and cannot be identified with a particular individual. In addition, these results will be used in my dissertation and perhaps future academic papers (if I am fortunate), and your responses will only be reported in the aggregate. The combined results of the survey will be shared with the Alcon USVC organization, but again only in aggregate form.
Here is the link to the survey:
https://ALCONWorkAttributesJune24.sawtoothsoftware.com/login.html
If you have any specific questions or concerns about the survey or my dissertation, please feel free to reach out directly to me. May I ask that you please complete this survey within 1 week, by the close of business Friday, July 7th? I may, though, keep the survey open longer in case I have missed some people who may be on vacation.
Thank you in advance for your participation. Best regards and Cheers, Ray Pasko
176
APPENDIX N
Email Reimder Phase 2 - Company
Voluntary Survey Last week, you received a message from Ben and Eric regarding the opportunity to participate in a very short survey regarding work place satisfaction. Thank you for taking the time to complete the 7 – 8 minute survey. By doing so, you will help our previous VP of Sales, Ray Pasko, complete his Doctoral Degree.

177
APPENDIX O
Email Reminder Phase 2 - Researcher
Hello Alcon U.S. Vision Care friends! Greetings from across the pond! Thanks to those of you who have already completed the survey. So far over 200 of you have responded and completed the survey, and I sincerely appreciate each and every one of you! For those of you who have not yet had a chance to complete it, there is still time to have your thoughts and opinions included! And to do so won’t take much of your time, as the average time to complete the survey has been just about 7 minutes. I will be closing the survey soon so can I please ask that you complete the survey today? Below is the survey link for your use - all you need to do is click on the hyperlink and it will take you directly to the survey. https://ALCONWorkAttributesJune24.sawtoothsoftware.com/login.html Thank you so much for your time and insights. Best personal regards, Ray Pasko