
OBSERVATOIRE EUROPÉEN LEADER LEADER EUROPEAN OBSERVATORY LIAISON ENTRE ACTIONS
Upload
khangminh22Category
view
3download
0
University of Arkansas, FayettevilleScholarWorks@UARK
Theses and Dissertations
5-1992
Generic Strategies, Leader Attributes,Environmental Uncertainty, and OrganizationalPerformance: An Empirical Investigation ofContingencies and Configurational OutcomesTope Adeyemi-BelloUniversity of Arkansas, Fayetteville
Follow this and additional works at: https://scholarworks.uark.edu/etd
Part of the Business Administration, Management, and Operations Commons, Community-Based Research Commons, and the Training and Development Commons
This Dissertation is brought to you for free and open access by ScholarWorks@UARK. It has been accepted for inclusion in Theses and Dissertations byan authorized administrator of ScholarWorks@UARK. For more information, please contact [email protected], [email protected].
Recommended CitationAdeyemi-Bello, Tope, "Generic Strategies, Leader Attributes, Environmental Uncertainty, and Organizational Performance: AnEmpirical Investigation of Contingencies and Configurational Outcomes" (1992). Theses and Dissertations. 2996.https://scholarworks.uark.edu/etd/2996

GENERIC STRATEGIES, LEADER ATTRIBUTES, ENVIRONMENTAL UNCERTAINTY, AND ORGANIZATIONAL PERFORMANCE: AN EMPIRICAL INVESTIGATION OF CONTINGENCIES AND CONFIGURATIONAL OUTCOMES
Reproduced with perm ission o f the copyright owner. Further reproduction prohibited w ithout permission.

GENERIC STRATEGIES, LEADER ATTRIBUTES, ENVIRONMENTALUNCERTAINTY, AND ORGANIZATIONAL PERFORMANCE: AN EMPIRICALINVESTIGATION OF CONTINGENCIES AND CONFIGURATIONAL OUTCOMES
A dissertation submitted in partial fulfillmentof the requirements for the degree of
Doctor of Philosophy
By
TOPE ADEYEMI-BELLO, B.S., M.B.A.Eastern Illinois University, 1983Eastern Illinois University, 1984
May, 1992University of Arkansas
Reproduced with perm ission o f the copyright owner. Further reproduction prohibited w ithout permission.

ACKNOWLEDGEMENTS
This dissertation could not have been completed without the help of several important individuals. To the chairman of this project, Dr. John Todd, I express my gratitude for his invaluable assistance, inspiration, and tireless efforts on my behalf. Special thanks also goes to Dr. Lew Taylor for helping me to improve my research and critical thinking skills and to Dr. C. P. Rao for his invaluable assistance as a member of my dissertation committee. The help and encouragement that was provided by Drs. Don White, Bill Currington, Judith Hunt, Rick Hebert, and Gene Hughes are also appreciated.
I am forever in debt to my parents, Mr. and Mrs. Adeyemi Bello for their prayers and for training me never to settle for anything tut the best. To my sisters— Yirika, Yetunde, and Oluwaseun— Mr. and Mrs. Fred McCoy, Mr. and Mrs. Don Nichols, Mr. and Mrs. Mike Freeman, and Dr. and Mrs. Sesan Sokoya I say a big thank you. Finally, this dissertation would not have been completed without the never-ending support and encouragement of ny wife, Kathy. I will always be thankful to our Creator for you.
iii
Reproduced with perm ission o f the copyright owner. Further reproduction prohibited w ithout permission.
TABLE OF CONTENTSTITLE PAGE
ACKNOWLEDGEMENTS.......................................iii
LIST OF TABLES........................................ x
LIST OF FIGURES....................................... xiv
CHAPTERX. INTRODUCTION...................................... 1
A. Objectives of Research Study...................... 7B. Theoretical Foundation.......................... 8
Conceptual Model.............................. 8Strategy................................... 9Leadership................................. 10Environmental Uncertainty..................... 16
C. Research Questions............................. 21D. Summary of Study............................... 22E. Summary...................................... 24
2. LITERATURE REVIEW AND RESEARCH HYPOTHESES ............... 26A. Generic Strategies Typologies..................... 26
Portfolio Models.............................. 28BCG Matrix................................. 28The Shell Directional Policy Matrix............. 29The GE Business Screen........................ 33
Product/Market Evolution Typologies............... 37Investment Typologies.......................... 42Hofer and Schendel's typology.................. 42Buzzell, Gale, and Sultan's typology............ 44
Competitive Typologies......................... 45Wissema, Van De Pol, and Messer's typology........ 47Porter's typology........................... 50
iv
Reproduced with perm ission o f the copyright owner. Further reproduction prohibited w ithout permission.

CHAPTER PAGEAdaptive Typologies........................... 55Miles and Sncw's typology..................... 55Galbraith and Schendel1 s typology............... 58Herbert and Deresky's typology................. 62
Summary of Models and Typologies................. 68B. Environmental Uncertainty........................ 72C. Leadership Issues.............................. 75
Leadership and Performance....................... 75Leader Attributes............................. 77Value Orientation........................... 77Leadership Style............................ 79Locus of Control............................ 81
D. Contingency theory.............................. 83E. Hypotheses.................................... 86
Leader Attributes and Environmental Uncertainty..... 87Value Orientation and Environmental Uncertainty.... 88locus of Control and Environmental Uncertainty......89Leadership Style and Environmental Uncertainty......89
Strategy and Leader Attributes................... 90Strategy and Value Orientation................. 91Strategy and Leadership Style.................. 92Strategy and Locus of control.................. 93
Strategy and Environmental Uncertainty............ 94Strategy, Environmental Uncertainty, and Leaderattributes................................. 96
F. Summary...................................... 98
3. METHOD.......................................... 99A. The sample.................................... 99
Task....................................... 104Variables....................................105Independent variables.........................105Dependent variables.......................... 105
Measures.................................... 106Strategy...................................106Value Orientation............................107Locus of Control............................ 108Leadership Style............................ 109Environmental uncertainty..................... 110Organizational Performance.....................Ill
v
Reproduced with perm ission o f the copyright owner. Further reproduction prohibited w ithout permission.

CHAPTER PAGE
B. Data Collection.................................IllC. Data Analysis.................................. 113D. Pilot Study.................................... 116
Variables....................................117Independent Variables.........................117Dependent Variables.......................... 117
Subjects.................................... 118Task........................................118
E. Pilot Study Results..............................119Hypotheses................................... 120Summary....................................129
F. Contributions of the Pilot Study to the Main Study..... 129Measures.................................... 130The Sairple................................... 130Data Analysis................................ 131Miscellaneous................................ 134
G. Contributions of this Study....................... 135H. Main Sturfy.....................................138
Variable.................................... 138Dependent variables.......................... 138Independent variables.........................140
Subjects.................................... 142Task........................................144
I. Summary....................................... 145
4. DATA ANALYSIS, INTERPRETATION, AND EVALUATION............ 146A. Reliability of research instruments.................. 146
Environmental uncertainty....................... 149Strategy.................................... 151Leadership style.............................. 156Value orientation............................. 158Locus of control.............................. 163Summary..................................... 166
B. Hypotheses..................................... 166Hypothesis 1................................. 167
vi
Reproduced with perm ission o f the copyright owner. Further reproduction prohibited w ithout permission.

CHAPTER PAGEEnvironmental uncertainty, task-orientation,and the dependent variables...................168
Environmental uncertainty, people-orientation,and the dependent variables...................176
Environmental uncertainty, business affairs values,and the dependent variables.................. 181
Environmental uncertainty, human welfare values,and the dependent variables.................. 184
Environmental uncertainty, locus of control, and thedependent variables......................... 187
Conclusion................................... 190Hypothesis 2................................. 194Leader attributes, growth strategy, and residentialmembership................................201
Leader attributes, growth strategy, andnonresidential membership.................... 203
Leader attributes, growth strategy, and averageSunday school attendance.....................205
Leader attributes, growth strategy, and financialreceipts................................. 206
Conclusion................................... 208Hypothesis 3................................. 212Environmental 'uncertainty and growth strategy......212Environmental uncertainty and stabilize strategy 220Environmental uncertainty and harvest-tumaroundstrategy................................. 222
Conclusion................................... 225Hypothesis 4................................. 230Stage I: Separate analysis within each environment.230Stage II: Measuring the degree of configuration 231Step 1................................... 231Step 2................................... 232Step 3................................... 237
Stage III: Assessment of the performance impact ofconfiguration...................... 238
Profile Validation........................... 242C. Summary....................................... 244
5. DISCUSSION........................................247A. Hypotheses-results (In) consistencies................ 247
Hypothesis 1................................. 248Hypothesis 2................................. 250Hypothesis 3................................. 254
vii
Reproduced w ith perm ission o f the copyright owner. Further reproduction prohibited w ithout permission.

CHAPTER PAGEHypothesis 4................................. 254Alternative theoretical explanations forinconsistencies............................. 256
Summary................. 258B. Limitations of study.............................259
Statistical conclusion validity.................. 259Weak effects................................260Conclusions................................ 260
Internal validity............................. 260Instrumentation............................. 261Inequity perceptions......................... 261Demoralization.............................. 262Conclusion................................. 262
Construct validity............................ 263Inadequate construct explication................ 263Mono-method bias.............................264Hypothesis guessing.......................... 264Evaluation apprehension....................... 264Experimenter expectancies......................265Restricted generalizability across constructs......265Conclusion................................. 266
External validity............................. 266Generalizability over people...... 266Generalizability over setting.................. 267Generalizability over time..................... 268Conclusion................................. 268
C. Contributions and Implications..................... 268Multiple approaches to fit...................... 268contributions............................... 268Implications................................270
Not-for-profit sector.......................... 271Contributions............................... 272Implications................................274
Summary and Conclusions.........................275D. Future research................................ 275
Propositions................................. 276Sample.................................... 277Measures...................................278
Summary and Conclusions.........................278E. Summary and Final Comments........................ 279
viii
Reproduced with perm ission o f the copyright owner. Further reproduction prohibited w ithout permission.

APPENDICES PAGEAPPENDIX A....................................... 281
Prenotification letter for pilot study's questionnaire...282Cover letter for pilot study's questionnaire..........283Questionnaire for pilot study..................... 284Reminder postcard letter for pilot study.............294
APPENDIX B....................................... 295Prenotification letter for main study's questionnaire... .296Cover letter for main study's questionnaire.......... 297Main study's questionnaire........................298Reminder postcard letter for main study..............306Letter to Associate Executive Director of the ArkansasBaptist State convention........................307
BIBLIOGRAPHY..........................................308
ix
Reproduced with perm ission o f the copyright owner. Further reproduction prohibited w ithout permission.

LIST OF TABLES
TABLE PAGE1 Summary of Research Questions....................... 232 Stages in the Product Life Cycle..................... 403 Summary of Hofer & Schendel's Typology................ 434 Summary of Buzzell, Gale, and Sultan's Typology......... 465 Summary of Wissema, Van De Pol, and Messer's Typology 486 Summary of Porter's typology........................ 527 Summary of Miles & Snow's typology................... 568 Summary of Galbraith & Schendel's typology (consumer) 609 Summary of Galbraith & Schendel's (Industrial) typology 6310 Summary of Herbert & Deresky's typology................ 6511 Summary of all models and typologies.................. 7012 Summary of operational definitions................... 112
13 Pcwer analysis for the test of HI.................... 122(Low environmental uncertainty subgroup)
14 Power analysis for the test of HI.................... 123(High environmental uncertainty subgroup)
15 Power analysis for the test of H2.................... 125(Type I strategy subgroup)
16 Pcwer analysis for the test of H2.................... 126(Type II strategy subgroup)
x
Reproduced w ith perm ission o f the copyright owner. Further reproduction prohibited w ithout permission.

TABLE PAGE17 Power analysis for the test of H3.................... 12818 Summary of the changes necessitated by the pilot study..... 13919 Factor analysis of environmental uncertainty scale items....15020 Correlation between micro and macro environments.......... 15221 Factor analysis of generic strategies scale items..........15322 Correlation between risk propensity and strategy types..... 15523 Factor analysis of leadership style scale items........... 15724 Factor analysis of business affairs values scale items..... 15925 Factor analysis of human welfare values scale items........ 16026 Correlation between the two business affairs values........ 16127 Correlation between the two human welfare values.......... 16228 Factor analysis of locus of control scale items........... 164
29 Leader attributes, environmental uncertainty, andresidential membership.............................169
30 Leader attributes, environmental uncertainty, andnonresidential membership.......................... 170
31 Leader attributes, environmental uncertainty, and averageSunday school attendance........................... 171
32 Leader attributes, environmental uncertainty, andfinancial receipts................................ 172
33 Performance summary of the interactions between leaderattributes and environmental uncertainty.............. 192
xi
Reproduced with perm ission o f the copyright owner. Further reproduction prohibited w ithou t permission.

TABLE PAGE
34 Power analysis for the test of hypothesis 1.............. 193
35 Leader attributes, grcwth strategy, and residentialmembership......................................196
36 Leader attributes, grcwth strategy, and nonresidentialmembership......................................197
37 Leader attributes, growth strategy, and average Sundayschool attendance................................ 198
38 Leader attributes, grcwth strategy, and financial receipts.. .199
39 Performance summary of the interactions between leaderattributes and grcwth strategy...................... 210
40 Pcwer analysis for the test of hypothesis 2.............. 211
41 Strategy, environmental uncertainty, and residentialmembership......................................213
42 Strategy, environmental uncertainty, and nonresidentialmembership......................................214
43 Strategy, environmental uncertainty, and average Sundayschool attendance................................ 215
44 Strategy, environmental uncertainty, and financial receipts. .216
45 Summary findings of the relationships between strategy,environmental uncertainty, and the dependent variables... 226
xii
Reproduced with perm ission o f the copyright owner. Further reproduction prohibited w ithout permission.

TABLE PAGE
46 Power analysis for the test of hypothesis 3.............. 228
47 Profiles of mean leader attributes and strategy scoresfor high efficient, lew, medium, and high environmental uncertainty units— Residential membership..............233
48 Profiles of mean leader attributes and strategy scoresfor high efficient, lew, medium, and high environmental uncertainty units— Nonresidential membership........... 234
49 Profiles of mean leader attributes and strategy scoresfor high efficient, low, medium, and high environmental uncertainty units— average Sunday school attendance......235
50 Profiles of mean leader attributes and strategy scoresfor high efficient, low, medium, and high environmental uncertainty units— Financial receipts.................236
51 Correlations of the distance measure with dependentvariables excluding high-performance units.............239
52 Validation of ideal profiles using pilot study data........243
53 Summary finding of the relationships between leaderattributes, environmental uncertainty, and the dependent variables.......................................251
54 Summary finding of the relationship between leaderattributes, growth strategy, and the dependent variables...253
xiii
Reproduced with perm ission o f the copyright owner. Further reproduction prohibited w ithout permission.

Ltsr OF FIGURESFIGURE TOPIC PAGE1. Leader attributes-strategy interactions and performance.... 15
2 Leader attributes-environment interactions and performance. 18
3 Strategy-environment-leader's attributes configuration 20
4 Boston Consulting Group Matrix....................... 30
5 Hie Shell Directional Policy Matrix.................. 32
6 General Electric Business Screen..................... 34
xiv
Reproduced with perm ission o f the copyright owner. Further reproduction prohibited w ithou t permission.

CHAPTER 1
INTRODUCTION
As the strategic management field has developed over the years, researchers have attempted to accumulate and disseminate knowledge through laboratory and field studies. The goal has been to solidify knowledge through additive replication (i.e. building on the works done by others) or exploration of new areas of research. In effect, attempts have been and are being made, not only to expand the knowledge base in this area, but also to test already existing knowledge in new contexts. Since the strategic management field as a formal discipline only came into existence within the last twenty-five to thirty years (Mintzberg, 1990), there are still areas where potentially useful research contributions can be made.
Science is concerned with developing the knowledge and understanding for natural phenomena. The behavioral sciences study and seek to understand humans and its institutions, actions, and behaviors (Kerlinger, 1979). Specifically, strategic management researchers usually want to know what accounts for performance differences between organizations. Researchers have focused on a host of variables/constructs in their atterrpt to explain why seme organizations are more effective than others. Among this myriad of variables/
1
Reproduced with perm ission o f the copyright owner. Further reproduction prohibited w ithout permission.

constructs, a select few— which are discussed in the following paragraphs— have dominated strategic management research.
Traditionally, strategic management researchers have focused on the importance of certain variables/constructs to organizational performance. During the early years of the strategic management field, the normative orientation to strategic management was the idea of aligning organizational strengths and weaknesses with environmental opportunities and threats (e.g. Andrews, 1971; Uyterhoeven, Ackerman, & Rosenblum, 1973). These early researchers considered each organization to be unique and as such were more likely to analyze case studies since they believed that little or no generalizations could be made about firms' strategies and performance. These early studies— components of what Mintzberg (1990) referred to as the 'design' school of thought in strategic management research— were mostly descriptive in orientation (Hambrick & Lei, 1985).
As the field of strategic management continues to develop, more empirical works are being done to investigate the relationships between individual, organizational, and contextual variables and performance (e.g. Hansen & Wemerfelt, 1989;Kimberly & Evanisko, 1981). One of the schools of strategic management thought that Mintzberg (1990) identified as generating grcwing interest is in the 'configuration' area. The variables/ constructs that have received most of the research attention under the umbrella of this school of thought are strategy, structure,
2
Reproduced with perm ission o f the copyright owner. Further reproduction prohibited w ithout permission.

and the environment (e.g. Drazin & Van de Ven, 1985; Gresov,1989; Venkatraman & Prescott, 1990).
The importance of strategy to organizational performance has been the focus of many conceptual and theoretical studies (e.g. Andrews, 1980; Hambrick, MacMillan, & Day, 1982; Hofer, 1975; Jones & Butler, 1988). Additionally, studies have been done to distinguish corporate from business-level strategies, operationalize and measure the concept of strategy (including the introduction of generic strategy typologies), and develop strategic contingency theory (e.g. Beard & Dess, 1981; Datta, 1979; Hambrick, 1980; Miles & Sncw, 1978; Murray, 1988).
Other studies have conceptualized or investigated the importance of the environment to organizational performance (e.g. Aldrich & Pfeffer, 1976; Lenz, 1980; Prescott, 1986). Early strategic management researchers viewed the external environment as mostly deterministic (e.g. Andrews, 1971). Organizational leaders were encouraged to identify factors/variables in the external environment that were sources of opportunities or threats to their organizations' survival. It was then proposed that the ability of organizations to build upon their strengths in response to environmental opportunities, would determine to a large degree the success or failure of these organizations (Stevenson, 1976). Recently, seme empirical works have focused on the importance of the environment to contextual and organizational performance variables (e.g. Prescott, 1986).
3
Reproduced with perm ission o f the copyright owner. Further reproduction prohibited w ithout permission.

It is worth noting that strategic management research has been both univariate and bivariate in orientation (e.g. Hambrick, 1981a; Horowitz & Thietart, 1982; Kim & Lim, 1988). Some researchers have investigated the importance of strategy and structure, or strategy and environment, to organizational performance (e.g. Child, 1972; Bourgeois & Asley, 1979; Jauch, Osborn, & Glueck, 1980). More recently, there is a move toward multivariate— research studies dealing with the importance of three or more variables to organizational performance— studies (e.g. Miller, 1988). It is within the context of these multivariate studies, that a modem stream of configuration-based research has evolved.
Traditional contingency theory generally suggests that one variable/construct can interact with another variable/construct to predict a third variable, usually a performance variable (Schoonhoven, 1981). It also suggests that the impact of the interaction of these variables/constructs on the performance variable would be most meaningful within a particular context (e.g. technology). In other words, contingency theory identifies the variables/constructs that best facilitate performance when situational differences have been analyzed and understood. Among others like Bums and Stalker (1961) and Lawrence and Lorsch (1967), Hofer (1975) sometimes gets the credit for introducing contingency thinking to the management literature even though the landmark work began years before. For example, Chandler (1962)
4
Reproduced with perm ission o f the copyright owner. Further reproduction prohibited w ithout permission.

did the foundational work on the importance of structure to strategy. His thesis that "structure follows strategy" has since been the focus of seme research studies (e.g. Pavan, 1976). Chandler found that the more successful organizations had what is often referred to as a "strategy-structure fit". Other theoretical studies have suggested the appropriate organizational structure based on other contingencies like the environment (e.g. Duncan, 1972; Lawrence & Lorsch, 1967). Hall and Saias (1980) even proposed and investigated the opposing hypothesis that "strategy follows structure". They found that "... the hypothesis of a dependent relationship between strategy and structure could be made in both directions ..." (p. 161). In effect, these researchers concluded that one can accept Chandler's thesis that structure follows strategy, but, equally tenable is the hypothesis that strategy follows structure (Hall & Saias, 1980).
Configuration or alignment, like contingency theory is based on the concept of "fit" among variables (Miller & Mintzberg,1983). Configuration theory is different from traditional contingency theory in that it takes a more "holistic" approach to the study of organizations. While contingency theorists typically isolate and focus on a narrow conceptualization of a few variables/constructs in explaining performance— the reductionistic perspective, configuration theory focuses on a broader conceptualization of more variables— the holistic
5
Reproduced with perm ission o f the copyright owner. Further reproduction prohibited w ithout permission.

perspective (Venkatraman & Prescott, 1990). Thus, configuration theory in explaining organizational effectiveness focuses more upon the consistency of multiple contingencies and structural characteristics rather than on the interaction between pairs of contextual or structural factors (Drazin & Van de Ven, 1985). Therefore, unlike traditional contingency theory, configuration theory makes it possible to formulate effective multiple patterns of interdependence among variables/constructs, enabling management researchers to advance the study of organizations from simple to more complete descriptions of these complex enterprises.
Configuration theorists have often been quick to criticize and highlight the deficiencies of the traditional contingency approach to the study of organizations. While the emphasis on these inadequacies may be necessary, equally important is the fact that configuration and traditional contingency theories are not mutually exclusive. In fact, Drazin and Van de Ven (1985) suggested that researchers should employ multiple approaches to "fit" in the study of organizations because of the advantages that can accrue from each approach. Typically, traditional contingency theorists claim that "fit" theory applies when significant interaction terms exist between pairs of variables/ constructs in explaining effectiveness. Conversely, configuration theorists contend that the lack of significant interactions should not be interpreted as meaning that "fit"
6
Reproduced with perm ission o f the copyright owner. Further reproduction prohibited w ithout permission.

theory does not apply because "fit" may occur only at the level of multiple patterns of interdependence between the variables/ constructs— testable only when a systems/configurational approach is used (Van de Ven & Drazin, 1985). Therefore, the combination of the traditional contingency and configuration theories should lead to more complete descriptions of the organizations in this study. The simultaneous use of these two approaches to "fit" highlights one of the more inportant undertakings of this study. The other objectives of this research study are enumerated in the following section.
Objectives of Rp.qpar-ch Study
Through the use of multiple approaches to examining "fit" theory in organizational research, this researcher hopes to achieve the following objectives:
(1) to determine the performance implications of the contingencies between leader attributes and different strategies.
(2) to determine the leader attributes that are most effective in environments with different levels of uncertainty.
(3) to examine the strategies that are effective in environments with different levels of uncertainty.
(4) to explore the effectiveness that result from the internally consistent relationships between leader attributes and strategy in an environmental uncertainty context.
7
Reproduced with perm ission o f the copyright owner. Further reproduction prohibited w ithout permission.

The first three objectives are comparable to the ones that would be found in studies that use the traditional contingency approach, which basically focuses on the interaction between the specified variables/constructs. Conversely, the fourth objective is holistic or configurational because it incorporates the previous three objectives into a form where multiple patterns of effective interdependence between the variables/constructs can be studied— a feature lacking in the traditional contingency theory approach.
Theoretical Foundation
This section includes a discussion of the variables/ constructs whose contingencies and configurations will be explored in explaining the performance differences between organizations. To date, most of these variables/constructs have been used primarily in traditional contingency-based research studies. The use of these variables/constructs in a configuration-based research, could lead to a richer and more complete description of the complex organizations that are used in this study (e.g. Hambrick, 1984).
Conceptual ModelIn the preceding section, strategy, structure, and the
environment were identified as the variables/constructs that have
8
Reproduced w ith perm ission o f the copyright owner. Further reproduction prohibited w ithout permission.

dominated strategic management research. The contingencies among these variables/constructs have received some attention in the management literature (e.g. Hambrick, 1984; Miller & Mintzberg,1983). Recently, theorists and researchers have suggested that leadership factors should be included in contingency theory-based research studies (e.g. Miller, Kets de Vries, & Toulouse, 1982). In general, management theorists are calling for more generic models that would be useful for understanding organizations regardless of industry, type, or size. Furthermore, some theorists have suggested the variables or constructs that should be included in such a model (e.g. Hadaway, 1989; Hatten, 1982). The most recurring variables or constructs include leadership (i.e. styles and/or attributes), the strategy pursued by the organization, and the environment (e.g. the perception of the rapidity of change in environmental factors). The relevance and importance of these variables or constructs is further reinforced by Ginsberg and Venkatraman1 s (1985) call for research studies that focus on the importance of strategy, organizational, and contextual factors to the performance of organizations.
Strategy. The importance of strategy to effectiveness, especially in for-profit organizations has been well researched in the management literature (e.g. Miles and Snow, 1978). In an attempt to make the strategy concept more parsimonious, various generic strategy models and typologies have also been developed (e.g. Porter, 1980). More recently, generic strategies models
9
Reproduced with perm ission o f the copyright owner. Further reproduction prohibited w ithout permission.

and typologies have been used to study the importance of this construct to other organizational, individual, and contextual variables or constructs (e.g. Miller & FTiesen, 1986; Kim & Lim, 1988). A study like the present one, that is based upon the suggested direction for contemporary research studies about strategy, could build upon previous works by exploring how strategy and the other variables— like environmental uncertainty and leader attributes— factor into configurations that delineate the more from the less effective organizations (e.g. Drazin and Van de Ven, 1985; Venkatraman, 1989).
Leadership. Generally, the management literature suggests that leaders are important to the effectiveness of organizations (e.g. Thomas, 1989). Specifically, some theorists claim that leaders are more important to the effectiveness of not-for-profit organizations because their role is even more central to the success of their organizations (e.g. Hadaway, 1989). The main drawback to this line of reasoning is that there are very few research studies that have examined the importance of leaders to the effectiveness of these organizations. While Smith, Carson, and Alexander (1984) found that there were effective and less effective leaders in the not-for-profit organization from which they drew their sample, no attributes were used to describe these effective and ineffective leaders. This is not surprising because even for the profit-oriented organizations, which have received most of the research attention over the years in the
10
Reproduced with perm ission o f the copyright owner. Further reproduction prohibited w ithou t permission.

strategic management area, there are few studies that have gone to the extent of delineating effective from ineffective leaders based on their attributes. The importance of this demarcation is perhaps highlighted by theorists that have suggested that there is a need to distinguish effective leaders from those that are not in order to have the proper "manager-to-strategy fit" (Giata,1984).
One possible reason why strategic management researchers have not attempted to delineate effective from ineffective leaders could be attributed to the organizational perspective that has traditionally been taken by them. In general, a 'sociological' perspective, which explains and describes organizations by focusing on structural, rather than personality factors has dominated strategic management research (Perrow,1970). conversely, most of the leadership studies have been done from a psychological perspective and can be found primarily in the 'organizational behavior' area (e.g. Kimberly, 1979). Miller et al. 's (1982) study which examined the relationship between top executive locus of control and strategy formulation is one of the few attempts that have been made to integrate the sociological and psychological perspectives into strategic management research. This researcher will build upon Miller et al. 's study by examining how locus of control, other leaders attributes, environmental uncertainty, and strategy factor into a configuration to explain organizational performance.
11
Reproduced with perm ission o f the copyright owner. Further reproduction prohibited w ithou t permission.

In order to delineate effective from ineffective leaders, there are various biographical and personality variables from which a researcher might choose. However, one personality variable that has been found to affect the type of strategy that a leader pursues is locus of control (Govindarajan, 1989). Locus of control is the extent to which a person attributes the events in his/her life to his/her actions or to forces beyond his/her control. When someone believes that s/he has very little control over what happens to her/him, that person is said to have an external locus of control. On the other hand, the person with an internal locus of control believes that s/he is in control of what happens to her/him. Govindarajan (1989) found that more effective managers were more likely to have internal locus of control. Locus of control is one of the leader attributes of interest to this researcher, because it is important to determine if leaders with internal locus of control— when examined in a different context— are still preferred to those with external locus of control. Furthermore, a more complete understanding of the importance of a leader's locus of control to performance can be developed in conjunction with other leader attributes.
Andrews (1980) suggested that in order for organizations to be effective, a manager's values must fit with the strategy that is pursued. Sturdivant, Ginter, and Sawyer (1985) found that a manager's values had implications for organizational performance (i.e. conservatism was associated with lew earnings per share
12
Reproduced with perm ission o f the copyright owner. Further reproduction prohibited w ithout permission.

growth). Kotter (1982) suggested that the differences observed in biographical and personality orientations of leaders would lead to differences in their behaviors, knowledge, skills, and values. It is practically impossible (because of the magnitude of the variables and the needed large sample size) to observe the behaviors of the leaders of the organizations from which the sample for this study will be drawn. Similarly, to study the various facets of skills and values of these leaders is again too broad a scope for this study. Consequently, the approach taken by Sturdivant et al. (1985) where they reduced values to a more parsimonious variable with liberalism and conservatism at opposite ends of a continuum, will be adopted for use in this research study. The main drawback to this approach is that there may be other types of values that are equally as important but are left out in this attempt to achieve parsimony. On the other hand, one of the primary advantages of using this approach is that it will be possible to compare the findings of this research study to Sturdivant et al. 's.
Leadership style is an attribute that has received substantial attention in the literature (e.g. Anderson, 1977; Life, 1986). A leader's style can be oriented toward task and/or people. Task oriented leaders are more concerned with 'getting the job done', while people oriented leaders are interested in creating a friendly work atmosphere and satisfying their followers needs and desires. Contemporary research findings
13
Reproduced with perm ission o f the copyright owner. Further reproduction prohibited w ithout permission.

suggest that effective leaders can be task and/or people oriented depending on certain contingencies (e.g. Bass, 1981). For example, Hadaway (1989) concluded that the effective leaders in the not-for-profit organization that he"studied were people oriented. Nevertheless, another factor that may determine effective leadership style is the 'internally consistent' relationships that could exist between leadership style and other leader attributes. Thus, people oriented leaders may be more effective when the leader also has an internal or an external locus of control. In other words, leaders that are people oriented and have internal locus of control may be more effective leaders than any other combination of these two leader attributes in a specific context.
In summary, a leader's locus of control, value orientation, and style are the attributes of interest in this research study. The contingencies that are developed using these leader attributes pertain to the most effective combinations of the same, given that: (1) certain strategies are being pursued, and (2) a particular environmental context has been specified. In other words, the attributes that are effective within the context of a particular strategy or environment may or may not be appropriate within the context of another strategy or environment. A depiction of the postulated relationships between leader attributes in particular strategic context is shewn in Figure 1. The specific attributes that may be more congruent
14
Reproduced with perm ission o f the copyright owner. Further reproduction prohibited w ithout permission.

FIGURE 1
LEADER ATTRIBUTES-STRATEGY INTERACTIONS AND PERFORMANCE
LEADER ATTRIBUTES STRATEGY nmfflMES
Performance-1
Performance-Z
Performance-2
Strategy #1
Strategy #N
Strategy #2
Value Orientation
Value Orientation
Locus of control
Value Orientation
Locus of Control
Leadership Style
Leadership Style
Locus of Control
Leadership Style
where N==the number of strategy types and Performance-1 may be equal to, less than, or greater than the other performance levels (i.e. Performance-2 to -Z).
15
Reproduced with perm ission o f the copyright owner. Further reproduction prohibited w ithou t permission.

with specific strategies are discussed in Chapter 2.Environmental Uncertainty. The importance of the
environment to organizational effectiveness has been the focus of many enpirical and conceptual studies (e.g. Anderson & Paine, 1975; Prescott, 1986). In fact, scsne authors have gone so far as to suggest that coping with environmental turbulence is a commonality among all organizations that would supersede any and all differences that may be observed in their activities (Gawthorp, 1971).
Bourgeois (1980) in summarizing the studies on the environments faced by organizations claimed that there are three perspectives. First, the external objects perspective focuses on the general and task (i.e. customers, competitors, suppliers, and regulatory agencies) environments. Second, the external attributes perspective concentrates on the complexity or heterogeneity (i.e. number of task environment components) and dynamism or volatility (i.e. rate of change of technology and market) of the environment. Finally, the internal perceptions approach focuses on the perceived environmental uncertainty as seen through the eyes of the organization's leader(s). The third perspective is the one that was adopted for use in this study.
Environmental uncertainty can range from lew to high. When environmental uncertainty is low, such an environment could be considered to be stable and/or predictable. Conversely, an environment that has a high degree of uncertainty could be
16
Reproduced with perm ission o f the copyright owner. Further reproduction prohibited w ithout perm ission.

considered to be neither stable nor predictable (Duncan, 1972). Researchers have found that environmental characteristics cannot be ignored when one seeks to explain the determinants of organizational effectiveness (e.g. Boulton, Lindsay, Franklin, & Rue, 1982). Furthermore, these characteristics have been found to be even more critical within the context of other contingency variables/constructs like strategy and/or structure (e.g.Grinyer, Yasai-Ardekani, & Al-Bazzaz, 1980). Most of the studies— like Boulton et al. 's piece— have a univariate or bivariate contingency orientation. Moreover, configuration studies could provide complementary information that would serve to solidify the knowledge base with respect to the importance of this variable (i.e. the environment) to organizational performance (Venkatraman & Prescott, 1990). Specifically, an important area of research that has been neglected to date concerns hew leader attributes in an environment with different levels of uncertainty factor into a configuration to explain performance differences between organizations. This is in line with Vickers' (1965) proposition that inevitable relationships exist among organizational variables in predicting the performance of organizations. A depiction of the relationship that is postulated between environmental uncertainty and the leader attributes in this study is shewn in Figure 2. This figure implies that the combination of leader attributes that are effective in a specific type of environment may or may not be as
17
Reproduced w ith perm ission o f the copyright owner. Further reproduction prohibited w ithout permission.

FIGURE 2
LEADER ATTRIBUIES-ENVTRONMENT INTERACTIONS AND PERFORMANCE
T .FADER ATTRIBUTES TYPE OF ENVIRONMENT OUrmMRR
Performance-2
Performance-1
Performance-Z
Environment #1
Environment #2
Environment #N
Leadership Style
Value Orientation
Value Orientation
Locus of Control
Leadership Style
Locus of Control
Locus of Control
Value Orientation
Leadership Style
where N=the number environment types and Performance-1 may be equal to, less than, or greater than other performance levels (i.e. Performance-2 to -Z).
18
Reproduced with perm ission o f the copyright owner. Further reproduction prohibited w ithout permission.

successful in a different type of environment.In addition to exploring the effective leader attributes in
different environments, the strategies that are congruent or consistent within each type of environment will also be explored. In other words, the implications for performance of pursuing specific strategies in different environmental contexts will be investigated.
An overall configuration of all the variables/constructs in this study and performance measures will also be investigated.Ihe primary difference between this overall configuration and the prior three contingent relationships (i.e. leader attribute- strategy, leader attribute-environment, and strategy-environment) is that it suggests that there is a congruence among all the constructs in this study that translate to different performance levels for these organizations. Furthermore, this internal consistency could lead to multiple effective combinations among the constructs. This is in contrast to investigating the interactions between dual combinations of these constructs. In effect, the configuration relationship examines the effectiveness implications of the simultaneous congruence among all the constructs in this study. The formulation of this congruence or configuration is also in line with Miller and Mintzberg's (1983) and Drazin and Van de Ven's (1985) call for configuration-based research that focus on environment, strategy, and the leaders of organizations. Figure 3 depicts this overall configuration and
19
Reproduced with perm ission o f the copyright owner. Further reproduction prohibited w ithout permission.

FIGURE 3
SIRATEGY-ENVIRONMENr-LEADER ATTRIBUTES CONFIGURATIONS
EN
TAL
Locus of Control
Strategy
Value Orientation
Leadership Style
Performance 'A1
Performance 'B
Strategy
Value Orientation
Locus of Control
Leadership Style
where Performance 'A' and Performance 'B' are effective because of the fit between leader attributes and strategy in environments with different levels of uncertainty.
20
Reproduced w ith perm ission o f the copyright owner. Further reproduction prohibited w ithout permission.

hew it differs from the traditional contingency relationships between the constructs.
Research Questions
In this research study, the importance of strategy, leadership, and environmental variables to organizational performance will be investigated. Are the differences in the performance of organizations explained by the pursuit of particular strategies by the leaders with certain attributes?Are these effective leaders conservative or liberal in value orientation, internals or externals with respect to locus of control, people oriented and/or task oriented? What combinations of these attributes are most effective when certain strategies are pursued? Also, hew much of the performance differences between organizations can be attributed to having certain leaders in 1 appropriate1 environments? Are the leaders in the ' appropriate' environments conservative or liberal in value orientation, internals or externals with respect to locus of control, people and/or task oriented? Furthermore, hew much of the performance differences between organizations can be explained by pursuing strategies that fit with the characteristics of certain environments? Finally, when organizations are in environments with different levels of uncertainty, do the internally consistent congruencies— as opposed to incongruencies— between strategy and leader attributes
21
Reproduced with perm ission o f the copyright owner. Further reproduction prohibited w ithout permission.

factor into configurations that explain relatively higher performance? Table 1 gives a summary listing of these research questions.
Summary of Study
There are five chapters in this dissertation. The first chapter or the "Introduction"— of which this summary is a part— contains the theoretical foundation, an outline of the research questions, and the enumeration of this study's objectives.
The second chapter, "Literature Review and Research Hypotheses", contains a review and synthesis of the existing conceptual and empirical literature from which the hypotheses that guide this research study were developed. These hypotheses were formulated such that they would be traditional contingency and configuration-based.
The third chapter, "Method", outlines how the sample for this study was selected. A justification was also provided for the sample. This chapter also contains the operational definitions of the variables/ constructs in this study. Furthermore, there was a discussion of the research instruments/scales, the source of the data for this study, and the analyses of the data collected.
In order to uncover any design flaws in the instrument/
22
Reproduced with perm ission o f the copyright owner. Further reproduction prohibited w ithout permission.

TABLE 1
SUMMARY OF RESEARCH QUESTIONS
What is the impact of the leader attributes (i.e. locus of control, value orientation, and style) on performance when the organization is in a particular environment? What are the combinations of attributes that are better predictors of performance in a given environment?What is the impact of these leader attributes on performance when a particular strategy is being pursued? In addition, what are the combinations of attributes that are better predictors of performance given a certain type of strategy?Does the pursuit of a particular strategy in a certain environment translate to superior performance? Or, is strategy-environment fit important to organizational performance?Do the deviations from congruent or internally consistent relationships between leader attributes and strategy in environments with different levels of uncertainty factor into a configuration to explain the performance differences between organizations?
23
Reproduced with perm ission o f the copyright owner. Further reproduction prohibited w ithout permission.

scales, a pilot study was undertaken. Moreover, the effect sizes from the pilot study were used to determine the sample sizes that were needed to find significant results in the main study.In addition, the pilot study was used to highlight and make provisions for potential problems in the main study. The results of the pilot study are also reported in Chapter 3.
The fourth chapter contains the analysis, interpretation, and evaluation of the data collected for the main study. The reliability estimates of the variables/constructs measures were calculated and reported. Thereafter, the description and presentation of the empirical tests of the research hypotheses, as well as the interpretation and discussion of the results of this study were undertaken.
The fifth chapter, "Discussion" highlights the limitations of this research study and their implications for future research studies. In addition, the validity issues, pertaining to the main study were discussed. Finally, the potential contributions of this dissertation to the management literature were enumerated.
Summary
In this chapter, after a brief introduction, the variables/ constructs that will be investigated in this study were identified. These variables/constructs are: strategy,
24
Reproduced with perm ission o f the copyright owner. Further reproduction prohibited w ithout permission.

environmental uncertainty, leader's value orientation, leadership style, and leader's locus of control. In addition, the objectives of this research study were discussed. A theoretical foundation was developed to justify the importance of these variables/constructs to this study. Furthermore, the relevant research questions were summarized and listed. Finally, a summary of the organization of this project was presented.
25
Reproduced with perm ission o f the copyright owner. Further reproduction prohibited w ithout permission.

CHAPTER 2
LITERATURE REVIEW AND RESEARCH HYPOTHESES
This chapter contains a discussion and synthesis of the management literature as it pertains to the variables of interest in this research study. First, an evolutionary review of the literature on generic strategies typologies is presented. These typologies are then used as the basis for the strategy descriptions that are used in this study. Second, there is a brief discussion of the environmental uncertainty variable and its implications for organizational performance. Third, the leader attributes that are relevant to this study are presented and examined in light of their importance to the performance variables. Thereafter, a conceptual synthesis of the literature review is used to formulate the research hypotheses. Three of the four hypotheses are traditional contingency or interaction- based while the fourth is configuration-based.
Generic Strategies Typologies
Various studies have attempted to determine the importance of the type of strategies that organizations pursue to the
26
Reproduced w ith perm ission o f the copyright owner. Further reproduction prohibited w ithout permission.

effectiveness of such organizations (Abernathy & Wayne, 1974; Datta, 1979; Hatten, Schendel, & Cooper, 1978; Kohl, 1984; Miles & Snow, 1978; Hofer, Murray, Jr., Charan, & Pitts, 1980; Schoeffler, Buzzell, & Heany, 1974; and Sncw & Hrebiniak, 1980). Overall, the strategy that the organization chooses/formulates and implements determines to a large degree its survival or demise (Buzzell & Wiersema, 1981; Buzzell, Gale, & Sultan, 1975; Glueck, 1976; Govindarajan, 1986; Hambrick, 1983a; Hambrick & Mason, 1984; Hammermesh, Anderson, & Harris, 1978; Hatten, Schendel & Cooper, 1978; Hofer, 1973; Lenz, 1978; Pfeffer & Salancik, 1978; Rumelt, 1974; Schendel & Patton, 1978; Scott & Marks, 1968; Ward, 1976; and Wrigley, 1970). In addition, there are many situational and/or contingency variables that need to be considered and analyzed in order for one to accurately capture an organization's strategy (e.g. Harrigan, 1983; Hofer, 1975). Herbert and Deresky (1987) claim that these myriad of variables have slewed down strategy research.
Therefore, in an attempt to make the strategy concept more parsimonious, various attempts have been made to develop "generic" classifications for strategy. The goal in each case has been to reduce the large number of variables needed to study strategic activity into a manageable but representative few, without sacrificing accuracy for parsimony (e.g. Bourgeois, 1980; Hambrick, 1984). Each classification is based upon same commonalities that the author/researcher observed. A generic
27
Reproduced with perm ission o f the copyright owner. Further reproduction prohibited w ithou t permission.

strategy then, can be defined as a "broad categorization of strategic choice which would apply generally regardless of industry, organization type or size" (Herbert & Deresky, 1987, p. 135). The various classification schemes for strategy ranges frcan the earlier portfolio models to the more contemporary typologies like Miles & Snow's (1978) or Porter's (1985),
Portfolio modelsDeveloping generic strategies typologies has always been of
interest to management researchers (e.g. Chandler, 1962). The landmark beginnings for generic classification of strategies is considered by most management researchers to have started with the portfolio models. While there are various forms of the portfolio models, the major ones that are discussed in this section are the Boston Consulting Group (BOG) matrix, the Shell's Directional Policy Matrix (DTM), and the General Electric (GE) Business Screen.
The BOG matrix. The BOG matrix (Boston Consulting Group, 1968) is based on the premise that high market share is an indication of strength in an industry, and that industry's grcwth rate signifies opportunity. The BOG matrix mainly focuses on the cash flow of the organization. In this model, both relative market share and the industry's grcwth rate are rated as either low or high. The business’ relative market share is on one axis (e.g. horizontal) while the industry's grcwth rate is on the
28
Reproduced with perm ission o f the copyright owner. Further reproduction prohibited w ithou t permission.

other axis (e.g. vertical). The result is a 2 X 2 matrix (Figure 4) that leads to the identification of four product/business strategy types: stars, dogs, question marks, and cash cows. (e.g. Higgins & Vincze, 1989).
The BOG matrix suggests four potentially useful strategic orientation for managers. One or a combination of these four categories can then be used to determine the appropriate strategies for that business to pursue. For example, the appropriate strategy for a "star" product or business is to increase investment so that it (the product or business) can achieve rapid growth and be a source of cash for the organization in the future (Aldag & Steams, 1987). The BCG matrix has been used by many management researchers (e.g. Hambrick, MacMillan, & Day, 1982). However, controversy still surrounds the characteristics (e.g. cash flow patterns) and the validity of this model (e.g. Swanson & Digman, 1988). Many theorists and researchers have also written about the weaknesses of the BCG matrix, which are discussed later in this section (e.g. Coate, 1983). In fact, it is the inadequacies of the BCG matrix that have led to the development of seme of the other portfolio models in this category (e.g. the General Electric Business Screen).
The Shell Directional Policy Matrix. The Shell Directional Policy matrix or DFM, like most portfolio models, is a two-dimensional matrix. On each of the two axes are the business sector prospjects, and the organization's competitive
29
Reproduced with perm ission o f the copyright owner. Further reproduction prohibited w ithout permission.

FIGURE 4
MARKET GRCWIH RATE
BOSTON CONSULTING GROUP MATRIX
RELATIVE MARKET SHARE
High LowHigh
Lew
STARS QUESTION MARKS
CASH COWS DOGS
30
Reproduced with perm ission o f the copyright owner. Further reproduction prohibited w ithout permission.

capabilities. The business sector prospects is classified as attractive, average, or unattractive while the organization's competitive capabilities is regarded as strong, average, or weak (Shell International Chemical Company, 1975). Consequently, the DEM, unlike the BOG matrix, results in a nine cell matrix. The placement of a product or business in each of these nine quadrants, is based on the scores and wei its of the responses that are given to a set of questions that deal with the factors that are relevant to business sector prospects (e.g. the market grcwth rate), and to the organization's competitive capabilities (e.g. its production capacity). The responses to these questions are then used to position the organization on the DFM matrix which consequently dictates the correct strategic posture for the organization to take (Hussey, 1978; Young and Hussey, 1978).
Robinson, Hichens, and Wade (1978) claim that the nine cells in the DFM (Figure 5) have irregular shapes, flexible boundaries, and can sometimes overlap. Regardless, the DEM recommends the following strategies: disinvest, leader, grcwth, cash generation, try harder, custodial, and phased withdrawal (Hussey, 1978; Robinson et al., 1978).
Hussey (1978) summarized the problems that he encountered in using the DFM as follows: (1) the questions needed to be changed to suit different markets because the DFM was initially developed for the petrochemical industry; (2) there were weighting problems associated with determining the location of the business on the
31
Reproduced with perm ission o f the copyright owner. Further reproduction prohibited w ithout permission.

FIGURE 5
THE SHELL DIRECTIONAL POLICY MATRIX
BUSINESS SECTOR PROSPECTS
Attractive Average Unattractive
Strong
Average
Weak
Leader GrcwthLeader
CashGenerator
ORGANIZATION1SCOMPETITIVE Try Harder Custodial PhasedCAPABILITIES Growth Withdrawal
Double or Phased DivestQuit Withdrawal
Reproduced with perm ission o f the copyright owner. Further reproduction prohibited w ithout permission.

axes; (3) the assessment of the impact of environmental factors on the business was unsystematic and inadequate; (4) there was ambiguous definition of businesses and markets; (5) no usefulness was found for the "star scoring system" that was recommended by Shell; and (6) the market growth scores were difficult to use in conglomerates where different market grcwth rates existed for different businesses. Overall, Hussey claimed that he found the reliability and validity of the DEM to be questionable.
The General Electric (GE) Business Screen. Ihe General Electric Business (GE) Screen like the DEM is a nine cell two-dimensional matrix (Figure 6). One axis measures the industry's attractiveness while the other measures the organization1 s strengths in that industry. Both industry attractiveness and the organization's strengths are rated as either high, medium, or low (Taylor, 1976). For this model, the major factors that determine industry's attractiveness are: size of potential sales, annual rate of sales grcwth, pricing, competitive structure, industry profitability, customer purchasing patterns, government regulations, ease of entry, environmental concerns, legal situation, and technical characteristics. On the other hand, the major factors used to determine the organization's strengths are based on market share, profitability, image, technology, managerial capabilities, distribution system, sales skills, service capability, patent protection, product efficiency, raw material availability, and
33
Reproduced with perm ission o f the copyright owner. Further reproduction prohibited w ithout permission.

FIGURE 6
GENERAL ELECTRIC BUSINESS SCREEN
INDUSTRY ATTRACTIVENESS
High Medium Lew
ORGANIZATION1S STRENGTHS
1 = Invest/Grow2 = Hold/Selective Investment3 = Harvest/Divest
34
Reproduced with perm ission o f the copyright owner. Further reproduction prohibited w ithout permission.
High
Lew

ability to adhere to government regulations.The GE Business Screen was developed for the General
Electric Company by the Boston Consulting Group and McKinsey and Company. The GE Business Screen was designed so that it would not have have the same weaknesses as the BOG matrix.Particularly, the GE Business Screen offers more strategies frcm which to choose, depending on which cell the product or business in question falls in to. There are three possible strategic postures: invest/grew, selectivity/earnings or hold, and harvest/divest (Higgins & Vincze, 1989; Steiner, Miner, & Gray, 1982).
Overall, the main contribution of the portfolio models pertains to the different strategies that may be pursued under different conditions. The strategic posture that is taken by an organization that uses the portfolio models' approach is based on: (1) the constraints or opportunities placed upon the firm by its environment, and (2) the resource availability within the organization. While the portfolio models have received substantial attention in the management literature (e.g. Bettis & Hall, 1981; Harohrick, MacMillan, & Day, 1982; Hussey, 1978; MacMillan, Hambrick, & Day, 1982; Swanson & Digman, 1988; and Wensley, 1982), they do have seme deficiencies. The contemporary debate about the p»rtfolio models deals with the issue of cash flews and its implication for organizational investment decisions. For example, in the most recent study done by Swanson
35
Reproduced with perm ission o f the copyright owner. Further reproduction prohibited w ithout permission.

and Digman (1988), they concluded that: (1) the average "star" generates enough cash-flow to support its capital needs, (2) the average "dog" does not generate a positive cash flew, and (3) the average "cash cow" generates substantial cash flow. While the first and third conclusions agree with previous prescriptions and empirical findings, the second conclusion clearly conflicts with the results of an earlier study done by Hambrick et al. (1982). Hambrick et al. found that the "dogs" in their study generated positive cash flows. Swanson and Digman attributed the conflicting results to the different cut off points that were used to classify companies into high or lew market share groups by the different groups of researchers.
Furthermore, while the portfolio models address the issue of investment decisions by organizations, they fail to adequately explain how an organization should integrate its activities in order to optimize its resources (Herbert & Deresky, 1987). Organizations are concerned about both issues (i.e. investment patterns and integration) in order to determine how to compete in a given business or industry (Hofer and Schendel, 1978; Hofer et al., 1980). Finally, the adequacy of the portfolio models to capture the essence of strategy in organizations that use the portfolio approach has been called into question by such writers as Bettis and Hall (1981), Christensen, Cooper, and de Kluyver (1982), Coate (1983), Day (1977), Fruhan (1972), Haspeslagh (1982), and Kiechel (1982).
36
Reproduced w ith perm ission o f the copyright owner. Further reproduction prohibited w ithout permission.

Coate (1983) identified the following limitations in using the portfolio models: (1) defining business units is a lot more complex than these models suggest (Haspeslagh, 1982); (2) these models are strenuous and consume excessive amounts of time when used; and (3) the validity of the recommended strategies by these models are questionable. Finally, Porter (1985) in a study of 33 major companies concluded that portfolio models are inadequate to the task of corporate strategy. As a result, other generic strategies typologies have been developed.
Product/Market involution TypologiesIhe next generation of generic strategies typologies are
based on the product and/or market evolution stages. Basically, these product life cycle (PLC) based typologies claim that the product and/or market go(es) through certain stages from the inception of the product in the market place or introduction to the time that the product is eventually taken off the market or decline (e.g. Anderson & Zeithaml, 1984; Brockoff, 1967). Cox(1967), Day (1981), de Kluyver (1977), Field (1971), Hofer (1975), Kotler (1965), Levitt (1965), Mackenzie (1971a & b), Patton (1959), Polli and Cook (1969), Rink and Swan (1979) and Scheuing (1969) claim that the duration of the stages or life cycles cannot be predetermined.
Ihe PLC concept is well documented in the management literature and is supported by sane empirical research (e.g. Anderson & Zeithaml, 1984; Cox, Jr., 1967; de Kluyver, 1977).
37
Reproduced with perm ission o f the copyright owner. Further reproduction prohibited w ithout permission.

Anderson & Zeithaml, 1984; Cox, Jr., 1967; de Kluyver, 1977).The PIC describes the evolution of a product over time, as measured by its sales or percent saturation. The PLC typologies typically have four stages: introduction, growth, maturity, and decline (e.g. Polli & Cook, 1969). Fox's (1973) typology included an additional stage, which preceded the introduction stage, that he referred to as the precommercialization stage. James (1974) also included a stage that he referred to as the regeneration stage— which is similar to Michael's (1971) product petrification stage— prior to the decline stage. According to Fox (1973), there are three interdependent dimensions that are of significance in properly using PLC-based typologies: (1) the length or duration of each of the cycles, (2) the subdivisions within each cycle, and (3) the type as well as the definition of the product.
Each stage of the PLC has a recommended functional focus.For example, Fox recommends that the organization focus on production during the growth phase of the PIC. At each stage of the cycles, there are also recommended operational focus on other important variables like research and development, production, marketing, finance, management accounting, personnel, and physical distribution. In addition, there are prescriptions as to what the focus of the organization should be with respect to customers and competitors, depending on the strategic orientation of the organization and the stage of the PLC that the product is
38
Reproduced with perm ission o f the copyright owner. Further reproduction prohibited w ithou t permission.

presently situated.During the introduction stage (Table 2), sales volume is
growing slcwly, and initial resource outlays for product and market development usually result in the organization operating at a loss. Hay and Ginter (1979) and Hofer (1975) recommend strategies that: (1) focus on the needs of the buyers; (2) increase buyers purchase frequency; (3) emphasize informative advertising; and (4) encourage product development.
The growth stage is characterized by a booming sales level. The sales level at first increases at an increasing rate, then it continues to increase at a decreasing rate. Competitors enter the market at this stage because of the substantial profit potential that they envisage. Hay and Ginter (1979), Hambrick et al. (1982), MacMillan, Hambrick, and Day (1982), and Rumelt (1979) recommend strategies that focus on: (1) efficiency in production and marketing; (2) strategic segmentation; (3) product modification and/or improvement; (4) modem technology in manufacturing; (5) intensive physical distribution; and (6) advertising aimed at achieving a certain degree of product differentiation.
At the maturity stage of the PLC, the rate of growth is decreasing rapidly as the product reaches its saturation point, price competition intensifies, and more services are offered. Buzzell and Wiersema (1981), Hall (1980), Hambrick et al. (1982), Hammermesh, Anderson, and Harris (1978), Hammermesh and Silk
39
Reproduced with perm ission o f the copyright owner. Further reproduction prohibited w ithout permission.

TABLE 2
STAGES IN THE PRODUCT LIFE CYCLE (SUMMARY TABLE)
STAGE NAME FUNCTIONAL FOCUS1 Precommercialization Coordination of R&D and
other functions
2 IntroductionEngineering: debugging in R&D production and field
3 Grcwth Production4 Maturity Marketing and Logistics5 Regeneration Recommercialization and
Reintroduction6 Decline Finance
40
Reproduced w ith perm ission o f the copyright owner. Further reproduction prohibited w ithout permission.

(1979), Hay and Ginter (1979), Hofer (1975), Luck and Prell(1968), and MacMillan et al. (1982) recommend strategies that focus on: (1) further product differentiation and/or market segmentation; (2) increased efficiency in operations or overall cost reduction in production, marketing, and distribution; and (3) highly differentiated product/service/quality relative to the rest of the industry.
Ihe decline stage is characterized by an accelerated decrease in sales volume and the introduction of substitute products or entry into new markets. Ihe patterns of product decline vary, therefore, alternative strategies may be pursued for products in the decline phase (e.g. Michael 1970). Harrigan (1979), Hay and Ginter (1979), and Hofer (1975), among others, recommend the following strategies: reduce advertising expenditures, use only marginal plant size, discontinue the product, and reintroduce a "new and improved version" of the product.
The PLC and PLC-based typologies have received seme attention in the literature which, reinforces the importance of the stage of the product life cycle to organizations' strategic orientations (e.g. Anderson & Zeithaml, 1984). These strategic postures are based primarily on the sales or demand patterns for the products of these organizations. Consequently, for the PLC and PLC-based typologies, the appropriate strategy is dictated by forces in the organization's external environment. In an
41
Reproduced with perm ission o f the copyright owner. Further reproduction prohibited w ithout permission.

integrative frame work, this dependence on an external environmental factor (i.e. sales or demand patterns) is in agreement with one of the important determinants of positioning in the quadrants of the portfolio models, like the industry's attractiveness dimension.
Investment TypologiesIhe Investment typologies were developed around the same
time as the PLC-based typologies. The major Investment typologies include those of Buzzell, Gale, and Sultan (1975) and Hofer and Schendel (1978).
Hofer and Schendel's Typology. Hofer and Schendel's (1978) typology suggests the possibility of six strategy types: share increasing, grcwth, profit, market concentration and asset reduction, turnaround, and liquidation strategies. The share increasing strategy (Table 3) is appropriate for the organization that seeks to improve its market share through increased investment expenditures. The growth strategy is for the organization that seeks to maintain its share position in an expanding market. If the grcwth strategy is to be pursued, then the organization should make investment outlays at the industry norm level. Like the grcwth strategy, the profit strategy also calls for investment expenditures to be made at the industry norm level. In addition, the organization institutes cost control measures to "threw off cash". The market concentration and asset
42
Reproduced with perm ission o f the copyright owner. Further reproduction prohibited w ithou t permission.

TABLE 3
SUMMARY OF HOFER AND SCHENDEL'S TYPOLOGY
STRATEGY FOCUS AND INVESTMENT DIRECTION
Share Increasing Invest highly to improve market share
Grcwth Invest at industry norm to maintain market share position
Profit Invest at industry norm and institute cost control measures to increase cash flew
Market Concentration Invest in narrowly defined product line or market
Asset Reduction Invest in narrowly defined product line or market
Turnaround Improve strategic posture from loser to winner by sizing dewn operations and investing very selectively
Liquidation Seek to withdraw product/fream marketSqueeze all cash outAbsolutely no additional investment
43
Reproduced with perm ission o f the copyright owner. Further reproduction prohibited w ithout permission.
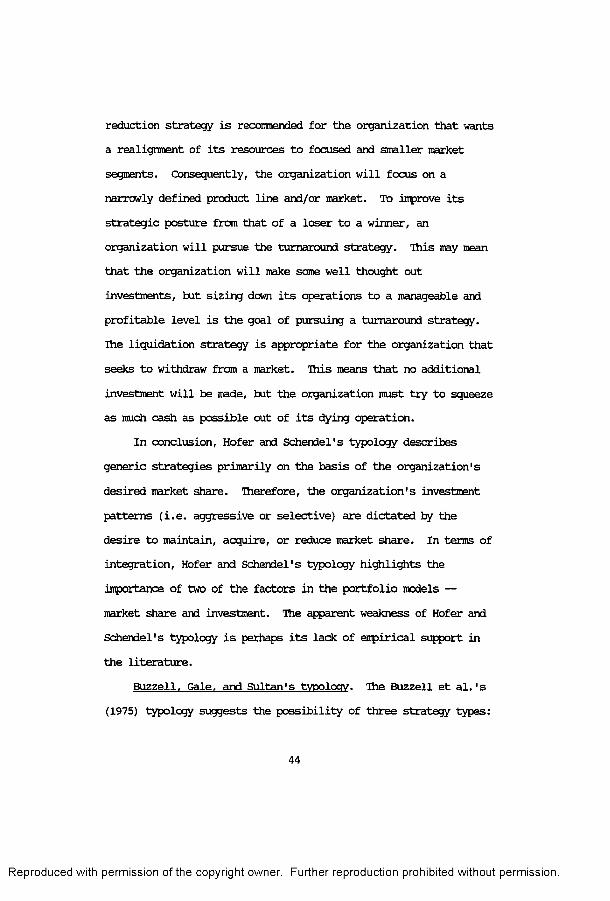
reduction strategy is recommended for the organization that wants a realignment of its resources to focused and smaller market segments. Consequently, the organization will focus on a narrowly defined product line and/or market. To improve its strategic posture from that of a loser to a winner, an organization will pursue the turnaround strategy. This may mean that the organization will make some well thought out investments, tut sizing dcwn its operations to a manageable and profitable level is the goal of pursuing a turnaround strategy. Ihe liquidation strategy is appropriate for the organization that seeks to withdraw from a market. This means that no additional investment will be made, but the organization must try to squeeze as much cash as possible out of its dying operation.
In conclusion, Hofer and Schendel's typology describes generic strategies primarily on the basis of the organization's desired market share. Therefore, the organization's investment patterns (i.e. aggressive or selective) are dictated by the desire to maintain, acquire, or reduce market share. In terms of integration, Hofer and Schendel's typology highlights the importance of two of the factors in the portfolio models — market share and investment. The apparent weakness of Hofer and Schendel's typology is perhaps its lack of empirical support in the literature.
Buzzell. Gale, and Sultan's typology. The Buzzell et al.'s (1975) typology suggests the possibility of three strategy types:
44
Reproduced with perm ission o f the copyright owner. Further reproduction prohibited w ithout permission.

build, hold, and harvest. Ihe build strategy (Table 4) is similar to Hofer and Schendel's (1978) share increasing strategy and calls for high investment to increase market share. The hold strategy is similar to Hofer and Schendel's growth or profit strategies and recommends that the organization invest at the industry norm level to maintain market share. The harvest strategy means that the organization will make minimal investment expenditures, allow its market share to decrease, and control costs with the goal of generating cashflow and experiencing profitability in the process.
Unlike the PLC-based typologies, the investment typologies focus on the organization's internal resources. In effect, these typologies suggest that the strategic postures of organizations are reflected primarily in their investment decisions.Therefore, strategies are described by the investment choices that are made by organizations, which is comparable to suggesting that organizations should "put their money where their mouths are". In the integrative scheme of things, the investment typologies highlight the positive relationship between investment expenditures and market share. For one reason or another, the investment typologies have not received much attention in the management literature.
Competitive TypologiesCompetitive typologies were developed after the PLC-based
45
Reproduced with perm ission o f the copyright owner. Further reproduction prohibited w ithout permission.

TABLE 4
SUMMARY OF BUZZELL, GALE, AND SULTAN'S TYPOLOGY
STRATEGY FOCUS AND INVESTMENT DIRECTION
Build Invest highly to improve market share
Hold Invest at industry norm to maintain market share position
Harvest Minimal investment expenditures
Reproduced with perm ission o f the copyright owner. Further reproduction prohibited w ithout permission.

typologies. Hie typologies proposed by Wissema, Van de Pol, and Messer (1980) and Porter (1980) are representative of those in this category.
Wissema. Van de Pol, and Messer's Typology. Ihe Wissema et al.'s (1980) typology basically has six types of generic strategies. The explosion strategy (Table 5) is appropriate when the organization's objective is to strongly improve its competitive position in a very short time period. Basically, the explosion strategy is for entering new product markets, marketing the product of an acquired organization, or "dumping from excess production capacity elsewhere".
The expansion strategy (like the explosion strategy) is geared towards improving the organization's competitive position but over a longer time period. This strategy calls for the organization to expand its production capacity. In order for this strategy to be successfully pursued, the organization must have good planning capabilities and the ability to deal with high levels of risk.
The continuous grcwth strategy is recommended when the organization seeks to maintain its competitive position in a growing industry. Additional and timely investments are necessary in order for the organization not lose ground to its competitors but, excessive over-capacity must be avoided.
The slip strategy is appropriate for the organization that for one reason or another seeks not to maintain its competitive
47
Reproduced with perm ission o f the copyright owner. Further reproduction prohibited w ithout permission.

TABLE 5
SUMMARY OF WISSEMA, VAN DE POL, AND MESSER'S TYPOLOGY
STRATEGY OBJECTIVES
ExplosionStrongly improve competitive position over a very short time period
ExpansionStrongly improve competitive position over a longer period of time
Continuous Grcwth Maintain competitive positionSlip Seek NOT to maintain competitive
position in a growing industry
ConsolidationUse in saturated or diminishing markets. Requires cost efficiency to milk all the revenues available
ContractionUse in negative grcwth markets with an eye toward closure or sale of product
Reproduced w ith perm ission o f the copyright owner. Further reproduction prohibited w ithout permission.

position in a growing industry. With this strategy, the organization's market share declines as no additional financial outlays are made with regard to such important factors as investment, capacity, and promotional activities. Eventually, the organization will exit from the product market for which a slip strategy is pursued.
Ihe consolidation strategy is appropriate for markets that are either saturated or diminishing but not yet extinct. While a minimal amount of grcwth to match population increases and prosperity is desirable, opening up of new markets is not recommended. Because of the nature of saturated markets,consolidation strategy "-- requires above all, therefore,dexterity, adaptability over the short term and artistry in arriving continuously in the market with cost-saving initiatives, with few resources." (Wissema et al., 1980, p. 44). The contraction strategy is used for negative grcwth markets where there is a discontinuation or sale of the product.
The Wissema et al.'s typology has not received empirical support in the management literature. A unique contribution of this typology is the introduction of a time frame (i.e. short or long time period) to strategy characteristics. Therefore, the descriptions of strategies differ primarily because of the differences in time duration within which the organization seeks to achieve its goal. Finally, the Wissema et al.'s typology also highlights the importance of certain factors in the external
49
Reproduced w ith perm ission o f the copyright owner. Further reproduction prohibited w ithout permission.

environment (e.g. competitors) to strategy descriptions and strategy choice.
Porter's Typology. Another competitive typology is that of Porter's (1980). Ihe basic premise of Porter's typology is that the nature and degree of competition that confronts an organization should determine its appropriate strategic posture. In formulating strategy, Porter suggests that the following factors be taken into consideration:
(1) the competitive rivalry among existing firms— deals with such factors as promotional battles, new product introductions, and the like that managers use with the intent of improving their organization's competitive position in the industry.
(2) the threat of substitute products or services frompotential competitors— dictates to seme extent the price that the organization can charge for its products or services. If consumers perceive the price of a certain product/service to be high, they are liable to opt for a less expensive substitute.
(3) the bargaining power of customers in the industry— canresult in lower profitability margin for the organization as they (the buyers) play one competitor against the other. They can also use their bargaining power to demand lewer prices and higher quality for the product or service.
Reproduced with perm ission o f the copyright owner. Further reproduction prohibited w ithout permission.

(4) the threat of new entrants into the industry— dependson hew substantial the barriers to potential entrants to the industry are, and the type of response that these entrants can expect from existing competitors. This threat of entry can in seme cases dictate the ceiling price for the product or service.
(5) the bargaining power of suppliers in the industry—which may and very often include labor unions can lead to increases in the price of materials, and/or lower the materials' quality. Consequently, powerful suppliers can in certain cases reduce the profitability margins of competing organizations.
Porter claims that once management has determined the importance and relevance of each of these factors to their particular industry, they can then select from one of three strategy types. Ihe overall cost leadership strategy (Table 6) is appropriate for the organization that has the following characteristics: a high market share, easy access to raw materials, products designed for ease of manufacturing, and a wide range of related products or services. The overall cost leadership strategy calls for manufacturing efficiency, cost reduction (through minimal research and development, sales, service, and promotional expenditures), avoidance of marginal customer accounts, and operational and overhead cost control. Ultimately, the pursuance of this strategy should result in an
51
Reproduced with perm ission o f the copyright owner. Further reproduction prohibited w ithout permission.

TABLE 6
SUMMARY OF PORTER'S TYPOLOGY
TYPECOMMONLY REQUIRED SKILLS & RESOURCES
OOMMON ORGANIZATIONAL REQUIREMHfrS
OverallCostLeader
ship
Sustained capital investment and access to capital
Process engineering skills Intense supervision of labor Products designed for ease
in manufacture Low-cost distribution system
Tight cost control Frequent, detailed reports Structured organization & responsibilities Incentives based on meeting strict quantitative targets
Differentiation
Strong marketing abilities Product engineering Creative flair Strong capability in basic
research Corporate reputation for
quality or technological leadership
Long tradition in theindustry or unique combination of skills drawn from other businesses
Strong coordination among functions in R&D, product development, & marketing Subjective measurement and incentives instead of quantitative measures Amenities to attract highly skilled labor, scientists, or creative people
Focus Combination of the above policies directed at the particular strategic target
Combination of the above policies directed at the regular strategic target
Adapted from Aldag and Steams (1987)
52
Reproduced with perm ission o f the copyright owner. Further reproduction prohibited w ithou t permission.

efficient and low-cost organization. The primary tools of competition are efficiency and product/service price.
The differentiation strategy "... is successful through emphasis on strong marketing abilities, creative product engineering, strong commitment to research and development, a reputation for quality or technological leadership, and a long tradition in the industry for having highly skilled employees" (Aldag & Steams, 1987, p. 232). Unlike the overall cost leadership strategy, cost and market share are only of secondary importance to the organization that pursues a differentiation strategy. With the differentiation strategy, the organization seeks to distinguish its product from those of its competitors by highlighting its unique features and overall superiority. This differentiation then makes it possible for the organization to charge a premium price for its product.
For the organization that finds the overall cost leadership or differentiation strategy unsuitable or inappropriate, there is the focus strategy to serve a narrowly defined market segment. This strategy is recommended for the organization that wants to focus on serving a particular customer group, has a narrow product line, and/or wants to serve a specific geographical market. Depending on which of these two alternative strategies (i.e. overall cost leadership or differentiation) the organization finds more appropriate, it can then focus that strategy on its "niche".
53
Reproduced with perm ission o f the copyright owner. Further reproduction prohibited w ithout perm ission.

In general, and except for Porter's typology, the competitive typologies have not received any attention in the literature. Ihe competitive typologies reinforce the importance of the external environment to strategy choice as suggested by the portfolio models. Specifically, these typologies focus on the "competitors" in the external environment. Consequently, the appropriate strategy for the organization that uses the "competitive typologies' approach" is dictated by its desired competitive positioning within its industry. In the integrative scheme of things, the competitive typologies highlight the importance of competitors and competitive positioning to describing generic strategies. Because organizational success depends on both internal (e.g. investment outlays) and external factors (e.g. competitors), none of the typologies described so far (because of their emphasis on one factor or another) is independently adequate to describe strategy types. Perhaps, if the characteristics of the models and typologies that have been discussed so far could be combined in a meaningful way, it could be possible to develop more comprehensive typologies. Seme theorists and researchers (e.g. Herbert & Deresky, 1987) have proposed more comprehensive typologies that are based on the synthesis of the earlier models and typologies. The following section includes a discussion of seme of these contemporary typologies.
54
Reproduced w ith perm ission o f the copyright owner. Further reproduction prohibited w ithout permission.

Arfanhivp. TypologiesIhe contemporary generic strategy typologies are usually
called "adaptive" or "adaptation" models (Aldag & Steams,1987). Ihe major models include those of Miles and Snow (1978), Galbraith and Schendel (1983), and Herbert and Deresky (1987).
Miles and Sncw's Typology. Ihe Miles and Snow's (1978) typology (Table 7) is based on the field study of four (i.e. college textbook publishing, electronics, food processing, and health care) industries. They were able to identify four types of generic strategies: defender, prospector, analyzer, and reactor. The defender strategy is appropriate when management seeks or creates a stable environment. In this situation, the organization is forced to concentrate its efforts on scsne niches within its industry, because it (i.e. the organization) engages in little or no product/market development. Therefore, the organization that pursues a defender strategy would compete primary on the basis of price, quality, and/or service.
The prospector is opposite to the defender strategy. The prospector strategy is considered to be most appropriate in: (1) an unstable environment where there is rapid change, and (2) a market with a high rate of growth. Management's main focus is on locating and exploiting new product/market opportunities. Consequently, an innovative organizational setting is created, and a broad and general definition of the environment is used, in order for the organization to better diversify its operations.
55
Reproduced with perm ission o f the copyright owner. Further reproduction prohibited w ithout permission.

TABLE 7
SUMMARY OF MILES AND SNOW'S TYPOLOGY
STRATEGY TYPES
PROBLEMSDefender Prospector Analyzer Reactor
StableEnvironment
UnstableEnvironment
Stable & Unstable Environ.
ReformulateOrganizationMission
Entrepreneurial
Engineering
Routine & Flexible Production Method
Flexible & Innovative Production Method
Routine, Efficient, & Flexible Production Method
Reformulate Method of Production
Administrative
Tight control of decision & activity
Loose control of decisions & activities
Tight control of older lines Loose control of new lines
Reformulateorganizationstructure
Adapted from Miles and Snow (1978)
56
Reproduced with perm ission o f the copyright owner. Further reproduction prohibited w ithout permission.

The development and proliferation of new markets is the primary means of competition for an organization that pursues the prospector strategy.
The analyzer strategy is a combination of the prospector and defender strategies. Fewer and slower product changes than the prospector strategy are made, and efficiency is not as strictly pursued as will be required for a defender strategy. The analyzer consistently identifies two areas of activity for the organization— a stable environment for using its defender strategy, and a changing environment for its prospector strategy. The most inportant concern for an organization that pursues the analyzer strategy is the challenging balance that is required to effectively manage its subunits that pursue different strategies. The primary tools of competition for each of the subunits also depend on the particular strategy (i.e. prospector or defender) that is pursued.
The reactor strategy is considered to have been pursued by an organization that is experiencing strategic difficulties as a result of seme wrong decisions and choices that the organization has made. Specifically, a reactor strategy can result from the fact that the chosen strategy: (1) does not fit with the organization's structure and/or processes; (2) has not been clearly communicated; and/or (3) is no longer appropriate in li it of the new environmental conditions that are confronting the organization. Therefore, an organization that pursues a
57
Reproduced with perm ission o f the copyright owner. Further reproduction prohibited w ithout permission.

reactor strategy will need to reformulate its strategy, reformulate its organization's mission, and/or reformulate its structure and processes.
The Miles and Snow's typology has been used for research in the management literature (e.g. Hambrick, 1983b; Kohl, 1984). Perhaps, the main contribution of the Miles and Snow's typology (based on empirical research) is the congruence that exists between strategy and environment. Ironically, Miles and Snow claim that either the prospector or defender strategy could be successful in any environment (i.e. it all depends on strategy implementation). However, Zajac and Shortell (1989) found that organizations do not perceive generic strategies to be equally effective in different environments; that organizations change from defender to prospector strategy as the environment becomes more dynamic, unstable, or unpredictable.
Galbraith and Schendel1 s Typology. Galbraith and Schendel' s (1983) strategy typology consists of two main parts: one typology is for consumer products, and the other is for industrial products, unlike some of the other strategy typologies,Galbraith and Schendel's typology was developed from empirical data. They used a particular segment of the Profit Impact on Marketing Strategy (PIMS) research data base called SPIYR as the data source for their analyses. Using principal component and cluster analyses, they were able to identify six strategy types for consumer variables and four strategy types for industrial
58
Reproduced with perm ission o f the copyright owner. Further reproduction prohibited w ithou t permission.

products.The consumer goods strategy types are harvest, builder,
continuity, climber, niche, and cashout. The harvest strategy (Table 8) is a strategy of disinvestment. Therefore, organizations that pursue this strategy usually have weak competitive positions within their industries. Additionally, the pursuance of this strategy frequently means that the organization's promotional and research and development expenditures are insufficient to adequately compete with the other organizations. It is an indication that the product is in a phaseout mode whereever the harvest strategy is pursued. Usually, an organization will sell most (if not all) of its assets whenever a product or business is in a phaseout mode. Galbraith and Schendel's harvest strategy is similar to Vesper's (1979) liquidation strategy.
The builder strategy is recommended for the organization that seeks to rapidly expand its sales and/or improve its market share position. The organization that pursues this strategy needs to cultivate high visibility for its product, be active in product development, and successfully differentiate its product. Therefore, a high level of commitment to promotional and investment expenditures is required. The builder strategy is similar to Utterback and Abernathy's (1975) sales maximization strategy or Buzzell et al.'s (1975) build strategy.
The main goal of the continuity strategy can best be
59
Reproduced with perm ission o f the copyright owner. Further reproduction prohibited w ithou t permission.

TABLE 8
SUMMARY OF GALBRAITH AND SCHENDEL'S TYPOLOGY CONSUMER GOODS CLASSIFICATION SCHEME
STRATEGY FOCUS & OBJECTIVESHarvest Organization has weak competitive position
and seeks disinvestment Inadequate promotional and R & D
expenditures
Builder Organization seeks rapid expansion of sales &/or improve market share
Product differentiation is crucial to success High levels of promotional and investment
expenditures
Continuity Adhere to industry norms Promotional and investment expenditures are
at competitors' levels The strategy of most organizations
Climber Organization desires to improve its competitive position
Initially appears to be noncompetitive tut is competitive eventually if successfully implemented
Niche Is a strategy of specialization Emphasizes product quality or service High R & D expenditures Promotional expenditures may be below
industry norm
Cashout Second most often used strategy Cost advantages over competitors are
emphasizedExpenditures on investment, and R & D are
not emphasized
60
Reproduced with perm ission o f the copyright owner. Further reproduction prohibited w ithout permission.

summarized as "keeping up with the Jones1". Galbraith and Schendel found this type of strategy to be the most commonly pursued by consumer goods' organizations. The organization that pursues a continuity strategy essentially: (1) adheres to industry norms with regard to such factors as promotional and investment expenditures, or (2) reacts in like manner to competitors' strategies.
The organization that wants to improve its competitive position within its industry will need to pursue a climber strategy. While organizations that pursue this strategy seem to have high cost, lew prices, narrowly defined product lines, and lew quality products initially, in the long run, they appear to be competitive in promotional, pricing, research and development, and new product development activities.
The pursuance of the niche strategy requires specialization. This strategy emphasizes product quality or service, and while it may initially be a high cost strategy, the tendency is for the organization to become more cost competitive. Additionally, the organization incurs significant expenditures on research and development, and new product introductions, even though its promotional outlays may be somewhat inadequate. Utter back and Abernathy's (1975) performance maximizing and Vesper's (1979) specialization strategy types are similar to the niche strategy.
The second most often used strategy by Consumer Products
61
Reproduced with perm ission o f the copyright owner. Further reproduction prohibited w ithout permission.

businesses— based upon Galbraith and Schendel's findings— is the cashout strategy. Organizations that pursue this strategy do not emphasize investment, research and development or new product development, rather, they seek cost advantages over their competitors. Furthermore, these organizations usually have high outlays for promotional expenditures.
The strategy types for Industrial Products include: lew commitment, maintenance, growth, and niche. The lew commitment strategy (Table 9) is equivalent to the harvest strategy, while the maintenance strategy is similar to the combination of the continuity and cashout strategies of the consumer goods classification. The growth strategy though similar to the builder strategy for consumer goods classification, calls for a higher level of price competition. Finally, the niche strategy for the industrial product classification is exactly the same as for the consumer goods classification.
Galbraith and Schendel1 s typology has a fairly comprehensive description for each strategy because it is based on important organizational factors like investments, competitors, research and development (etc). One apparent weakness of the Galbraith and Schendel's typology is that it has not yet received empirical support in the management literature.
Herbert and nprpskv's Typology. Another adaptive typology is that of Herbert and Deresky's (1987). They claim to have reviewed, synthesized, and categorized what they considered to be
62
Reproduced with perm ission o f the copyright owner. Further reproduction prohibited w ithou t permission.

TABLE 9
SUMMARY OF GAIBRAITH AND SCHENDEL'S TYPOLOGY INDUSTRIAL GOODS CLASSIFICATION SCHEME
STRATEGY FOCUS & OBJECTIVESLew
CommitmentOrganization has weak competitive position
and seeks disinvestment Inadequate promotional and R & D
expenditures
GrowthHigher price competition than consumer goods Organization seeks rapid expansion of sales
&/or improve market share Product differentiation is crucial to success High levels of promotional and investment
expenditures
MaintenanceAdhere to industry normsPromotional and investment expenditures are
at competitors' levels Cost advantages over competitors are
emphasized
Niche Is a strategy of specialization Emphasizes product quality or service High R & D expenditures Promotional expenditures may be below
industry norm
Reproduced with perm ission o f the copyright owner. Further reproduction prohibited w ithout permission.

the major and most representative typologies of strategy. Their review and synthesis of the literature led to a typology that "... encarrpasses/explains major and common types of generic strategies and their characteristics" (Herbert & Deresky, 1987, p. 138). Herbert and Deresky contend that their typology is more complete and valid, because it was based on observed commonalities that exist in the generic strategy typologies and models typically found in the management literature (i.e. the portfolio models, product/market evolution typology, Galbraith and Schendel's typology, and Miles and Sncw's). They also claim that their typology is comprehensive enough to capture, accurately identify, and test the different types of strategies in the literature. Herbert and Deresky identified four types of generic strategies: develop, stabilize, turnaround, and harvest.
Herbert and Deresky found the develop strategy (Table 10) to be most appropriate for organizations that: (1) are just starting out, (2) seek to enter new markets, or (3) find themselves in industries with volatile technology and/or products. These organizations emphasize innovation, even though most of their research and development is likely to be purchased or contracted from the outside. The focus of this strategy is on the location and exploitation of new product and market opportunities. Therefore, marketing and research and development are crucial to the success of organizations pursuing a develop strategy. The pursuance of this strategy also requires: (1) a constant
64
Reproduced with perm ission o f the copyright owner. Further reproduction prohibited w ithout permission.

TABLE 10
SUMMARY OF HERBERT AND DERESKY'S TYPOLOGY
STRATEGY FOCUS OF STRATEGY
Develop Location and exploitation of newproduct and/or market opportunities
Emphasizes marketing and R&D Intensive pursuit of market share Innovative and entrepreneurial behavior
Stabilize Maintain competitive position Efficient utilization of assets Focus on particular market/product Use strict cost control measures Develop a distinctive competence
Turnaround Rebuild the organization Step the 'bleeding'Cost and efficiency controls are
immediately instituted Sizing dewn of operations Do something drastic e.g. reorganize
Harvest Wind dewn, 'milk', and divestCost and asset reductionIntensive pruning of products/marketsEmphasizes immediate profitsLook for opportunity to sell productCould be the aftermath of an
unsuccessful turnaround strategy
Reproduced with perm ission o f the copyright owner. Further reproduction prohibited w ithout permission.

monitoring of the relevant environment, (2) high investment outlays for the development and introduction of new products and/or processes, (3) an active effort to develop existing or potential markets, (4) the intensive pursuit of market share, (5) the willingness and ability to change operations or technology,(6) an entrepreneurial/risk-taking behavior, and (7) the desire and drive to competitively pursue new opportunities. The main objective of an organization that pursues a develop strategy is long term growth and earnings.
Herbert and Deresky concluded that organizations in mature, stable industries typically pursue stabilize strategy. The main objective of this strategy is the maintenance of the organization's competitive position through the efficient use of its assets, and/or a focus on particular market segment. The effectiveness of this strategy depends on: (1) defending brands by using strict cost control measures (in order to increase profitability through the production of a limited number of products), (2) emphasizing efficiency of standardized operations, and (3) the organization's ability to acquire a technical production leadership position. Alternatively, competitive position can be maintained by finding and focusing on a niche in the marketplace that is difficult for existing or potential competitors to penetrate. Consequently, "profitability is maintained in a mature market with either a 'cost leadership' approach to stable and technical market conditions, and/or
66
Reproduced with perm ission o f the copyright owner. Further reproduction prohibited w ithout permission.

pursuing market advantage through product specialization/high quality product/distinctive service, etc." (Herbert & Deresky, 1987, p. 143). Finally, the pursuance of this strategy necessitates capital reinvestment because a prerequisite for successful product specialization or production efficiency is modem technological processes.
The turnaround strategy is a rebuilding strategy. One of the immediate goals of the organization that needs a turnaround strategy is to "stop the bleeding". Consequently, the organization needs to institute cost and efficiency controls to generate short-term cash to make the organization viable. For the business that is worth saving, the organization nay need to use one or a combination of the following measures: change leadership, reorganize, diversify and/or expand, acquire or merge with other businesses, and scale down operations by discontinuing unprofitable businesses.
The final strategy classification in Herbert and Deresky (1987) typology is the harvest strategy. In Herbert and Deresky's words, "The basic strategy for this organization or unit is to wind down, 'milk', and divest; to disinvest while retaining interim operational viability in order to generate at least minimum returns toward such financial targets as cash flow or ROA, and to attract buyers. Immediate or eventual divestiture (sale as an ongoing unit) or liquidation (of some or all assets) is contemplated. Immediate divestiture might be sought after an
67
Reproduced with perm ission o f the copyright owner. Further reproduction prohibited w ithout permission.

unsuccessful turnaround effort has failed to generate operational or strategic vitality; divestiture may also be sought because of recognition of long-term industry-structural/campetitive inevitabilities. In either case, operational efficiency is emphasized, with intensive pruning of less profitable market lines/markets, cost and asset reduction, etc.; emphasis is on the short run. Market share is sacrificed in favor of cashflow or immediate profits; strengths are capitalized on and the business continued only so long as the SBU's products or services are needed for other vital company operations" (Herbert & Deresky, 1987, p. 144).
While the Herbert and Deresky's typology is not the only basis for classifying generic strategies in this study, it does appear— at least intuitively— to be more comprehensive because it was based on a synthesis of the other major typologies. In fact, this typology, because it was based on the review and synthesis of these other typologies could be considered to be the most comprehensive work to date in this area. These claims are argumentative, however, because Herbert and Deresky's synthesis was not empirically derived, and their typology has only been reportedly used once for management research purposes (Herbert & Deresky, 1987b).
Summary of Models and TypologiesOne of the strengths of the adaptive typologies is their
68
Reproduced with perm ission o f the copyright owner. Further reproduction prohibited w ithout permission.

attempt to integrate and synthesize the simpler models and typologies— like the investment or competitive typologies. Additionally, research work is continually being undertaken to make these typologies better. For example, Segev (1989) attempted to synthesize the Miles and Snow's and Porter's typologies to achieve more parsimony and completeness. The main weaknesses of the adaptive, as well as the other models and typologies is that most of them are interchangeable. It appears that nothing substantially new is added to the strategy descriptions except for a new name for each of the strategies. Consequently, the generic strategies typologies literature appears to be a semantic jungle. In fact, Mintzberg (1990) identified the generic strategies literature as one that lacks an integrative focus.
Overall, the models and typologies that have been discussed (Table 11) basically suggest that organizations can pursue one of four strategies: two for strategic success (or positioning) and the other two for organizations that are experiencing strategic difficulties. The strategy typology that is used in this research study is based on a conceptual synthesis of the models and typologies that have been discussed so far. These four strategies are generically named Type I, II, III, and IV. This is done to avoid giving one typology or model more prominence over another.
Type I strategies are represented by organizations that: (1)
69
Reproduced with perm ission o f the copyright owner. Further reproduction prohibited w ithou t permission.

TABLE 11
SUMMARY OF ALL MODELS AND TYPOLOGIES
MODEL OR TYPOLOGY
TYPE BCG/CFM/GE PLC & PLC-BASED INVESTMENT COMPETITIVE ADAPTIVE
IInvest for Growth
Pre-commercialization,Introduction,Growth
Build Expansionor
ExplosionDevelop
IIHold Maturity Hold Continuous
GrowthStabilize
IIISelectiveInvestment
Regeneration Turnaround Turnaround
IVHarvest/Divest
Decline/Petrification
Harvest ConsolidateContractionSlip
Harvest
Reproduced with perm ission o f the copyright owner. Further reproduction prohibited w ithout permission.

continuously seek growth as their main objective, (2) encourage creativity and innovation, (3) are always looking for opportunities to sell their products to new groups of people, (4) are constantly monitoring the environment for new opportunities to tap into, (5) are not afraid to take risks, (6) place little emphasis on the short run, because, they are only concerned about the long term viability of their organizations, and (7) are flexible in their operations. Type I strategy has been referred to by other researchers as "develop", "growth", or "expansion".
Type II strategies are represented by organizations that:(1) like their present economic situation and seek to maintain it, (2) have identified a specific market to serve, (3) have good cost control measures, (4) are efficient in their operations, and (5) 'doing what they do best'. The main objective of organizations pursuing Type II strategies is to 'hold their own'. This strategy has been referred to by others as "stabilize", "hold", or "niche".
Types III and IV strategies are pursued by organizations with strategic difficulties. Basically, Type III strategy is typical of an organization that has been operating unprofitably for seme time (e.g. the last 5years) and desires to reverse its 'lack of fortune'. An organization pursuing a Type III strategy will usually emphasize better budgeting and controlling, cut back on operations through the sale and reduction of assets, and will very often replace its chief executive officer. Type III
71
Reproduced w ith perm ission o f the copyright owner. Further reproduction prohibited w ithout permission.

strategy is often referred to in the management literature as "turnaround" or "regeneration". Finally, Type IV strategy is pursued by an organization that seeks to terminate its existence. To achieve this goal, the organization will sell everything it owns including its building (if it owns one). Type IV strategy is often referred to in the management literature as "harvest" or "decline".
In conclusion, the descriptions that have been outlined in the preceding paragraphs for strategy types I to IV is the premise for classifying generic strategies in this study. In addition, the performance implications of strategy within environmental and leadership contexts appears to be an important area of research that is investigated in this study. Finally, the performance implications of the internally consistent or congruent relationships between strategy and leader attributes in a given environment are also explored.
Environmental uncertainty
The environment has been an important variable in organizational research studies (e.g. Duncan, 1972; Grinyer, Yasai-Ardekani, & Al-Bazzaz, 1980; Hirsch, 1975; Jauch, Osborn, & Glueck, 1980; Lenz, 1980; Pfeffer, 1976; Pfeffer & Salancik,1978; McMhinney, 1968; Miller, 1987; Organ, 1971; Osborn & Hunt, 1974; Prescott, 1986). While most of these studies have focused
72
Reproduced with perm ission o f the copyright owner. Further reproduction prohibited w ithout permission.

on for-profit organizations, a few studies have also shown that the environment is important to the performances of not-for- profit organizations (Kohl, 1984; Odom & Boxx, 1988). In general then, the environment is considered in the management literature to be important to the effectiveness and survival of organizations (e.g. Anderson & Paine, 1975; Barnard, 1938; Dess & Beard, 1984; Dill, 1958; Emery & Trist, 1965; Katz & Kahn, 1966; Prescott, 1986; Terreberry, 1968).
In the early years, strategic management researchers considered the external environment of organizations to be deterministic or given (as suggested by the works of Bums & Stalker, 1961; Duncan, 1972; Lawrence & Lorsch, 1967; and Neghandi & Reimann, 1973). Therefore, the environment was considered to be a variable that the organization had very little control over. In other words, the environment was seen as affording the organization seme opportunities that can be taken advantage of, as well as seme threats that the organization needed to be cognizant of, if it was to survive. Consequently, the effectiveness of an organization depended in part on hew well the environment was correctly perceived and interpreted. Furthermore, these early researchers claimed that the environment dictated the types of strategies, structures, and processes that would enhance organizational performance (Khandwalla, 1977; Verbrugge & Goldstein, 1978; Verbrugge & Shick, 1976; Verbrugge, Shick, & Thygerson, 1975).
73
Reproduced with perm ission o f the copyright owner. Further reproduction prohibited w ithout permission.

Recent theory and research have produced a reconceptualization of the environment (Aldrich, 1979; Bourgeois, 1980; Galbraith, 1977; Hotter, 1979; Miles & Snow, 1978; Pfeffer, 1978; Pfeffer & Salancik, 1978; Porter, 1979, 1980). Hie contemporary view of the environment in the strategic management area is more proactive and opportunistic (Bourgeois, 1980; Child, 1972; Hatten, Schendel, & Cooper, 1978; Mintzberg, 1972; Zeithaml & Zeithaml, 1984). In recent years, the extent of the relationship between environmental perception and organizational performance has been of interest to researchers (e.g. Aldrich, 1979; Prescott, 1986). Another area of important research examines environmental uncertainty issues (e.g. Anderson & Paine, 1975).
The environment is a complex variable. Mintzberg (1979) enumerated that organizational environments can be characterized as stable, complex, diversified, or hostile. This researcher focuses on the stable aspect of the environment because Duncan's (1972) static-dynamic (or a proxy for lew and high rate of change in environmental factors) dimension of environmental uncertainty has been found by researchers to account for more variance in the performance variables (e.g. Return On Investment) of organizations (Bourgeios, 1980). Generally, if environmental uncertainty is lew, such an environment could be considered to be stable and/or predictable. Conversely, an unstable or unpredictable environment is typically high in uncertainty.
74
Reproduced w ith perm ission o f the copyright owner. Further reproduction prohibited w ithout permission.

Basically, this researcher is interested in determining how important environmental uncertainty (or the rates of change in environmental factors) in conjunction with strategy and leader attributes are to organizational performance. The primary objective— which has been neglected to date in management research— is to identify the leader attributes and strategy types that are most effective in environments with different levels of uncertainty. For configuration theory-based research, the goal is to determine hew the deviation from a congruence between leader attributes and strategy in a given environment affects organizational performance.
Leadership Issues
Leadership and PerformanceIt is often assumed in the management literature that
leaders contribute substantially to the performances of their organizations. Empirical and theoretical studies have also been done to ascertain the importance of leaders to organizational performance (e.g. House & Baetz, 1979; Johns, 1983; Lieberson & O'Connor, 1972; Meindl & Ehrlich, 1987; Meindl, Ehrlich, & Dukerich, 1985; Pfeffer, 1977; Smith, Carson, & Alexander, 1984; and Weiner & Mahoney, 1981).
House and Baetz (1979), in their review of the literature on organizational leaders, concluded that leadership can account for
75
Reproduced with perm ission o f the copyright owner. Further reproduction prohibited w ithout permission.

significant variations in organizational performance. The studies by Meyer (1975), Thomas (1988), and Weiner and Mahoney (1981) seem to support House and Baetz' conclusion. Conversely, Lieberson and O'Connor (1972), Salancik”and Pfeffer (1977), and Pfeffer (1977) found that leadership does not account for much of the variances observed in the performances of the organizations that they studied. Therefore, while academicians have not always agreed on whether leaders are important determinants of organizational performance (e.g. Lieberson & O'Connor, 1972 versus Weiner & Mahoney, 1981), more recent studies support the position that effective leadership does make a difference in the performances of organizations (e.g. Thomas, 1988).
Specifically, Smith et al. (1984) investigated the importance of leadership to the performance of a not-for-profit organization. Using the salaries paid to fifty senior ministers of the Northeast Ohio (NEO) Conference of the United Methodist church over a twenty-year period, they concluded that a spectrum of effective and ineffective leadership existed within these organizations. They found support for one of their two hypotheses that effective leaders have an inpact on organizational performance. One deficiency of the Smith et al. 's study is that they failed to identify the characteristics of effective leaders. In other words, there is no way of identifying these effective leaders based on demographic, or personality variables. For example, are effective leaders more
76
Reproduced with perm ission o f the copyright owner. Further reproduction prohibited w ithout permission.

liberal in value orientation than the less effective leaders? Consequently, this researcher will build upon Smith et al. 's work by investigating attributes that delineate effective leadership.
Leader AttributesManagement theorists and researchers claim that certain
leader attributes may be used to distinguish high from lew performance organizations (e.g. Gupta & Govindarajan, 1984a). Specifically, researchers have found that the: (1) value orientation, (2) locus of control, and (3) style (i.e. people- or task-orientation) of leaders have important implications for the performance of organizations (e.g. Sturdivant et al., 1985).These leader attributes are discussed below.
Value orientation. The values held by the leaders of organizations have been found to influence the performances, as well as the types of strategies that are formulated and/or implemented by these organizations (e.g.Andrews, 1980; Peters & Waterman, 1982; Selznick, 1957; Steiner, 1969; and Sturdivant, Ginter, & Sawyer, 1985). As succinctly put by Andrews (1980, p. 105), "we must acknowledge ... that there is no way to divorce the most sensible economic strategy for a company from the personal values of those who make the choice". Learned, Christensen, Andrews, and Guth (1965), Guth and Taiguri (1965), Chamberlain (1973), and Porter (1980) also found personal values to be important not only to strategy development and
77
Reproduced with perm ission o f the copyright owner. Further reproduction prohibited w ithout permission.

implementation, but also to other organizational variables (e.g. culture or 'the way things are done around here').
To measure all the facets of the values held by the leaders of organizations— because of the complexity of this variable— is somewhat too ambitious for the present study, even though there is a need for such a study. Therefore, like Sturdivant et al.(1985), a more manageable study to deal with a narrower value orientation concept was designed. In this respect, the pervasive concept of values was narrowed down to measure the degree of conservatism or liberalism of these leaders (Thompson, 1967; Wilson, 1973). Wilson (1973, p. 260), in contrasting conservatism with liberalism stated that "a liberal attitude has the structure of preferring new things, change or innovation and the content of desiring that change be in an egalitarian and libertarian direction". At the other end of the spectrum, conservatism is defined as the preference for existing and traditional institutions, resistance to change, and the disposition toward being moderate and cautious. Furthermore, Wilson argued that because conservative leaders have a defensive stance (i.e. simplifying, controlling, and securing their environment), they inpose order and rigid and simplistic rules upon the 'world'. Thus, leaders with conservative attitudes take steps to reduce conflict and anxiety.
Sturdivant et al.'s (1985) conservatism measure included "business affairs" and "human welfare" values components.
78
Reproduced with perm ission o f the copyright owner. Further reproduction prohibited w ithout permission.

Business affairs values dealt with attitudes toward: (1) power and influence of corporation, (2) tax policies, (3) product quality standards, (4) environmental protection, and (5) deceptiveness in advertising. In addition, human welfare values focused on attitudes toward minorities, the 'welfare' program, and family and individual rights.
A continuous scale was used to capture a leader's value orientation in this study to facilitate the comparison of its results to that of earlier studies. Additionally, the use of this scale made this research study more manageable by making the leader's value orientation variable more parsimonious. It is possible that seme accuracy might be sacrificed to achieve this parsimony.
Leadership style. Leadership style is defined in this study as the extent to which a leader is people and/or task oriented. Task oriented leaders are those with strong concerns about group's goals and the means to achieve them (Bass, 1981). These leaders are similarly referred to as production-oriented, production-emphasizing, goal-achieving, work-facilitative or goal emphasizing (Blake & Mouton, 1964; Bcwers & Seashore, 1966; Cartwright & Zander, 1960; Fleishman, 1957; Katz, Maccoby, & Morse, 1950). Task oriented leaders also tend to be: (1) high in need for achievement, and (2) psychologically distant frcm their followers (e.g. Blau & Scott, 1962; McClelland, 1961; Wofford, 1970).
79
Reproduced with perm ission o f the copyright owner. Further reproduction prohibited w ithout permission.

Leaders who have strong concerns about their group members' relations with them and with each other by creating a friendly and supportive atmosphere within the organization are said to be people-oriented (Katz et al., 1950). Such leaders are also commonly referred to as interaction-oriented, interaction- facilitative and supportive, concerned for people, people- centered, and concerned for group maintenance (Anderson, 1974; Bass, 1967; Blake & Mouton, 1964; Bowers & Seashore, 1966; Cartwright & Zander, 1960; McClelland, 1961; and Wofford, 1970). In justifying the task- or people- orientation dichotomy, Bass (1981) suggested that even though people- and task-orientation are components of democratic and autocratic leadership, their inter-correlations are not high and this may indicate that different attributes of an individual is actually being measured when the task- or people-orientation scales are used.
Task- or people-orientation has been the focus of many research studies (e.g. Bryman, Bresnen, Ford, Beardsworth, & Keil, 1987; Klebanoff, 1976; Life, 1986; Likert, 1955; Roberts, Miles, & Blankenship, 1968). Originally, the focus of some of these research studies was to determine if one orientation was always better than the other. Sane researchers concluded that people-orientation led to higher levels of performance (e.g. Bryman et al., 1987; Roberts et al., 1968). Conversely, other researchers found that it was task-orientation that led to superior levels of performance (e.g. CUnteman & Bass, 1963; Mann,
80
Reproduced with perm ission o f the copyright owner. Further reproduction prohibited w ithou t permission.

Indik, & Vroom, 1963). More recently, it has been suggested that there are contingencies that determine if one orientation or the other, or both will be the most effective for different individual, contextual, and organizational variables (e.g. Bass, 1981). Therefore, the traditional contingency or interaction- based relationships of leadership style with strategy and environmental uncertainty are explored in this study.Furthermore, the performance implications of the congruence between leadership style, the other leader attributes, and strategy in an environmental uncertainty context— or configuration-based approach— are also studied.
Locus of Control. Another leader attribute that is potentially important for delineating effective leadership is locus of control. Locus of control deals with the issue of how much control an individual feels he/she has over the events that happen in his/her life. The one that believes that the events in his/her life are the result of circumstances beyond his/her control (i.e. these events are the result of fate, chance, luck, or destiny) will be classified as an 'external' or one with an external locus of control. On the other hand, an 'internal' or someone with an internal locus of control believes that the events in his/her life result from his/her behavior (Miller, Kets de Vries, & Toulouse, 1982; Rotter, 1966; and Trevino, 1986). Rotter (1966) is considered to have done the landmark work on the concept of locus of control.
81
Reproduced with perm ission o f the copyright owner. Further reproduction prohibited w ithout permission.

Locus of control is an important variable to use in this study because it has been found to be related to organizational performance, as well as to individual variables such as work alienation, intentions to quit, job stress, and ability to deal with job demands (e.g. frustration). Locus of control has also been found to be related to job satisfaction, job involvement, commitment, turnover, and leadership style (e.g. Anderson & Schneier, 1978; Fusilier, Ganster, & Mayes, 1987; Govindarajan, 1988; Govindarajan, 1989; Hollenbeck, Brief, Whitener, & Pauli, 1988; Mia, 1987; Mitchell, 1975; Organ & Green, 1974; Seeman, 1967; Spector, 1988; Storms & Spector, 1987; and Wolfe, 1972). Some researchers have found: (1) externals to be more alienated from their work setting than internals (Mitchell, 1975; Seeman, 1967; Wolfe, 1972), (2) externals to be less satisfied with their jobs than internals (Blau, 1987; Organ & Green, 1974; Pryer & Distefano, 1971; Spector, 1988), (3) that leaders with internal locus of control and groups led by them are more likely to achieve hi ier levels of performance than external leaders or groups led by them (Anderson & Schneier, 1978; Arnold, 1985;Avila & Fern, 1986; Colwill, 1987; Govindarajan, 1988; Govindarajan, 1989; Hollenbeck, Brief, Whitener, & Pauli, 1988; and Miller & Toulouse, 1986 & 1986b); and (4) that internals appear to have fewer intentions of quitting, less tendency to turnover, greater influence at the work place, and more commitment (Luthans, Baack, & Taylor, 1987; Spector, 1988).
82
Reproduced with perm ission o f the copyright owner. Further reproduction prohibited w ithout permission.

Researchers have also found that while externals are more likely to resort to the use of coercive pcwer, internals are more likely to use more persuasive forms of pcwer (e.g. Goodstadt & Hjelle, 1973; Mitchell, Smyser & Weed, 1975). Hendricks (1985), Licata, Strawser, and Welker (1986), Mitchell et al. (1975),Pryer and Distefano (1971), Runyon (1973), and Spector (1988) found that internals are more considerate supervisors and are more satisfied in a participative work environment. Locus of control has also been found to be related to entrepreneurial behavior. Begley and Boyd (1987), Bcwen and Hisrich (1986), Brockhaus (1975), Durand and Shea (1974), Miller and Toulouse(1986), Shapero (1975) and Taylor (1985) found that internals are not only more activity oriented, tut they are also more likely to possess entrepreneurial qualities (e.g. take risks). Overall, internals seem to have more favorable attitudes, less dysfunctional behaviors, and higher levels of performance on the job (Blau, 1985; Fusilier, Ganster, & Mayes, 1987; Mia, 1987; and Storms & Spector, 1987).
Contingency Theory Traditional contingency theory generally suggests that the
inpact of one variable on another can only be understood within a particular context or situation (e.g. Hofer, 1975). For exanple, Schoonhoven (1986, p. 351) stated that "When contingency theorists asserts that there is a relationship between two
83
Reproduced with perm ission o f the copyright owner. Further reproduction prohibited w ithout permission.

variables ... which predicts a third variable, ... they are stating that an interaction exists between the first two variables". Traditional contingency theory is one of the components of what has come to be known in the management literature as 'fit' theory. Recently, Venkatraman (1989) pointed out that fit or what could be considered contemporary contingency theory approaches can be tested along five dimensions (i.e. fit as moderation, fit as mediation, fit as matching, fit as gestalts, fit as profile deviation and fit as covariation).These dimensions are especially relevant when choosing the appropriate analytical technique for contemporary contingency-based research studies.
Traditionally, contingency theory-based studies have taken a univariate or bivariate orientation. Various studies have investigated the strategy-structure, strategy-environment, and structure-environment contingencies (e.g. Grinyer et al., 1980; Lawrence & Lorsch, 1967) to cite a few examples. Drazin and Van de Ven (1985) and Schoonhoven (1981) among others have pointed out the deficiencies of the traditional contingency approach. Specifically, its focus on pairwise interactions between variables— which is considered ' reductionistic'— has been suggested to raise more questions than it answers. Furthermore, pairwise interactions may be unable to uncover the overall patterns of internal consistency or congruence between variables. Therefore, some researchers have recently called for
84
Reproduced with perm ission o f the copyright owner. Further reproduction prohibited w ithout permission.

multivariate contingency-based studies, because they might have greater performance explanatory power (Miller, 1988). In addition, multivariate studies are necessary in order to identify hew the form and strength of various bivariate relationships may change in different contexts (Miller, 1978).
Hie call for multivariate contingency-based studies has led to the development of newer approaches for examining fit among variables. These approaches emphasize a more holistic understanding of fit. The most common of these newer approaches is configuration-based studies (e.g. Venkatraman & Prescott,1990). Most of the configuration studies to date have concentrated solely on strategy-structure-environment fit (e.g. Miller, 1988). This is not surprising, because these are the 'traditional' (or often focused upon) variables/constructs in strategic management research (e.g. Chandler, 1962; Child, 1972; Cummings & Berger, 1976; Grinyer et al., 1980; Hall & Saias,1980). An area of recent research activities in the strategic management literature is that of delineating effective from ineffective leaders based on their attributes (e.g. Meindl & Ehrlich, 1987; Smith et al., 1984). Therefore, a possible extension of configuration-based research could focus on the performance implications of the congruence or internally consistent relationship between leader attributes and strategy in a specific environmental context.
The importance of using multiple approaches to fit (e.g.
85
Reproduced with perm ission o f the copyright owner. Further reproduction prohibited w ithout permission.

traditional contingency and configuration-based approaches) in management research has been emphasized by certain researchers (e.g. Drazin & Van de Ven, 1985). Advocates of the multiple approaches to fit claim that the additional and complementary information that is obtained from a combination of approaches help to develop better theories. The suggestion is that the different types of information that are obtained from studies that use both the traditional contingency and configuration-based approaches are siperior to that which could be obtained from using either approach in isolation. Consequently, both the traditional contingency and the configuration-based approaches will be used in this study to examine the hypothesized relationships. In addition to studying the configuration-based relationship that was specified in the preceding paragraph, the traditional contingency approach will also be used to examine the leader attributes that cure effective performance indicators when: (1) a particular strategy is being pursued, and (2) certain environmental characteristics are identified.
Hypotheses
The discussion of the literature in the preceding section highlighted the importance of strategy, environmental uncertainty, and certain leader attributes (i.e. locus of control, value orientation, and leadership style) to
86
Reproduced w ith perm ission o f the copyright owner. Further reproduction prohibited w ithout permission.

organizational performance. In this section, three traditional contingency and one configuration-based hypotheses are developed with these variables/constructs. The traditional contingency theory-based hypotheses deal with the performance implications of the fits between: (1) leader attributes and environmental uncertainty, (2) leaders attributes and strategy, and (3) strategy and environmental uncertainty. The fourth and final configuration-based hypothesis— in explaining the performance differences between organizations— examines the overall pattern of the three traditional contingency theory-based hypotheses or the congruence or internally consistent relationships between strategy and leader attributes in an uncertain environment.
tpader Attributes and Environmental UncertaintyThe fit between leader attributes and environmental
characteristics is an area where further research gains can still be made in the management literature, especially in the not-for-profit sector, where seme theorists claim that such relationships may have more significance (e.g. Hadaway, 1989). Hambrick and Mason (1984), called upon strategic management researchers to start focusing on the importance of the top management team to the performance of their organizations. They suggested that the psychological profile of organizational leaders could be reflected in the performance of their enterprises.
87
Reproduced with perm ission o f the copyright owner. Further reproduction prohibited w ithout permission.

Ordinarily, this researcher could have focused on identifying the more effective leader attributes, but contingency theory would suggest that a more complete understanding of these attributes can be developed when explored in a particular context. Therefore, one of the traditional variables for strategic management research— environmental uncertainty, whose importance to organizational performance was discussed in the preceding section— is used as the context within which to delineate effective from less effective leaders. Specifically, the ramifications of a leader's value orientation, style, and locus of control for performance will be examined within the context of an uncertain environment.
Value Orientation and Environmental Uncertainty. England (1967) found that the values of the leaders of organizations may affect their perception of the environment, which may in turn influence the levels of their organizations' performances. Sturdivant et al. (1985) also suggested that liberal leaders may be more effective in dynamic environments, because success in changing environments significantly depends on the flexibility of organizational leaders. In other words, in an environment where uncertainty is high, there is typically a general lack of information for decision making purposes. Therefore, a leader that can tolerate and deal with the ambiguity in such an environment would appear to be more appropriate and effective.In effect, a liberal leader— who prefers new things, change, or
88
Reproduced w ith perm ission o f the copyright owner. Further reproduction prohibited w ithout permission.

innovation— would be more effective in an environment with high uncertainty. Conversely, a conservative leader would be more effective in an environment with low uncertainty.
Locus of Control and Environmental'' Uncertainty. Leaders with internal locus of control tend to engage in more active search for and more efficient processing of task-relevant information (Spector, 1982). Consequently, a changing or turbulent environment, where there is a need for constant monitoring and collection of data (about the environment) will seem to be more congruent with internal leaders than with externals. Therefore, a conceptual synthesis suggests that having an internal leader in an environment that is high in uncertainty will be associated with higher levels of organizational performance. In fact, Miller et al. (1982) found that the more effective leaders in their study were internals operating in changing environments. Conversely, in an environment with low uncertainty, leaders with external locus of control would appear to be more effective.
Leadership Style and Environmental Uncertainty. To date, there are no reported research studies that have focused on the congruence between leadership style and environmental uncertainty. Therefore, unlike the other leader attributes, there is no premise for suggesting whether task- and/or people-orientation would be effective in an environment that is high in uncertainty. A deduction could be made from Miller et
89
Reproduced with perm ission o f the copyright owner. Further reproduction prohibited w ithout permission.

al. 's (1982) study where they found that effective leaders have both internal locus of control and high task-or ientation. Consequently, in an environment that is high in uncertainty, task oriented leaders may be effective. In addition, the conclusions that were reached by the Blake and Mouton's (1984) study— that the best managers are high in both task and people— means that people oriented leaders may also be effective in an environment with a high level of uncertainty. Moreover, the instability in an uncertain environment may necessitate a leader that provides both direction and support; Hersey and Blanchard (1974) contend that a leader that is high in both task- and people-orientations would be more effective under this condition.
By using a traditional contingency theory-based approach, the performance implications of the leader attributes that have been discussed in the preceding paragraphs could be developed if these attributes are simultaneously investigated. Consequently, the following hypothesis, based on the composite of the preceding discussions can be made that:
Hypothesis 1:Organizations in environments that are high in uncertainty will achieve higher levels of performance when they have leaders that are liberals in business affairs and human welfare values, with internal locus of control, and high in both task- and people-orientations.
Strategy and Leader AttributesGupta and Govindarajan (1984a) suggested that superior
90
Reproduced with perm ission o f the copyright owner. Further reproduction prohibited w ithout permission.

performance can be achieved by selecting managers whose skills, knowledge, and behaviors are congruent with the requirements of particular strategies. In general, the management literature contends that, in order to be effective, the characteristics of organizational leaders should fit with the type of strategy that the organization is pursuing (Galbraith and Nathanson, 1978; Govindarajan, 1989; Gupta, 1984; Gupta and Govindarajan, 1984; Hambrick and Mason, 1984; Herbert and Deresky, 1987b; Hitt, Ireland, and Palia, 1982; Kerr, 1982; Leontiades, 1982; Miller, Ket de Vries, and Toulouse, 1982; Miller and Toulouse, 1986; and Miller, Toulouse, and Belanger, 1985; Szilagyi and Schweiger, 1984). Therefore, an organization that wants to grow must have the "appropriate" leader in order to successfully implement this strategy. To reiterate, the leader characteristics or attributes that are explored in this study are leadership style, value orientation, and locus of control. This researcher will investigate the relationships between individual and different combinations of these leader attributes, within the context of a particular strategy, and organizational performance.
Strategy and Value Orientation. Andrews (1980) stated that it is impossible to separate the strategic choices that are made within organizations from the personal values of the people that make those choices. Furthermore, Steiner (1969) submitted that the values of the leaders of organizations have a significant inpact on the direction that the organization moves and the way
91
Reproduced with perm ission o f the copyright owner. Further reproduction prohibited w ithout permission.

in which it functions.In general, the literature suggests that the strategy
pursued by a conservative leader is likely to be different from the strategy pursued by a liberal leader. The values of liberal leaders (e.g. preference for new things, change, and innovation) indicate that they are more likely to pursue risky, innovative strategies while conservative leaders, because of values such as resistance to change, would perhaps shew preference for risk- averse, cautious strategies. In addition, a Type I strategy, as developed and described in the literature review, requires innovative and entrepreneurial behavior— which are more likely to be found in leaders with liberal value orientation. Conversely, a Type II strategy, because of the stability and continuity of its action requirements, are more likely to be pursued by conservative leaders. If this is the case, a leader's values, within the context of a particular strategy, could have significant implications for organizational performance.
Strategy and leadership Style. Leadership style may dictate the strategy that an organization pursues. Unfortunately, there is no empirically-based premise in the literature for the congruence between leadership style and strategy. Furthermore, there is no theoretical base upon which to determine if task oriented leaders are better at pursuing Type I strategies than people oriented leaders. The characteristics of task oriented leaders (e.g. emphasis on getting the job done), and the
92
Reproduced with perm ission o f the copyright owner. Further reproduction prohibited w ithout permission.

requirements of Type I strategies (e.g. location and exploitation of new product and/or market opportunities) suggest that the successful pursuance of Type I strategy may require a task oriented leader. In addition, since the successful pursuance of Type I strategies calls for creativity and innovation, a supportive leader— facilitator and one who promotes communication in Hersey and Blanchard's (1974) model— or one who is high in people-orientation would also appear to be effective. Consequently, the leaders that are effective in pursuing Type I strategies would be both task and people oriented. Conversely, because Type II strategies primarily call for repetitive behavior (i.e. more efficiency that derives from 'continuing what we have been doing') high people and low task oriented leaders may be more effective at pursuing these strategies.
Strategy and Locus of Control. Locus of control has been found to relate to strategy making behavior (Govindarajan, 1988; Govindarajan, 1989; Miller, Kets de Vries, and Toulouse, 1982). Miller et al. (1982) investigated the importance of locus of control using correlation analysis to strategy-making behavior, structure, and environment. They hypothesized that a relationship exists between chief executive officer's locus of control and levels of product-market innovation, amount of risk taking, proactiveness, and futurity (or planning horizons). In addition, they proposed that internals will be more likely to operate in a more dynamic and heterogeneous environment, and in
93
Reproduced with perm ission o f the copyright owner. Further reproduction prohibited w ithout permission.

organizations with higher levels of technocratization and differentiation. These hypotheses were supported in their study. However, there was no discussion of the type of strategy that is most likely to be pursued by either internals or externals. Consequently, this researcher will build on the work done by Miller et al. by investigating the performance implications of a leader's locus of control within the context of a particular strategy. Therefore, the following question: "Is a leader with an internal locus of control more effective thananother leader with an external locus of control, when a Type Istrategy is pursued?" could be answered.
The preceding discussions about the fit between each of the leader attributes and strategy can be combined into a traditional contingency or interaction-based hypothesis such that:
H ypothesis 2 :Organizations which pursue Type I or growth strategies will achieve higher levels of performance when they have leaders with internal locus of control, liberal business affairs andhuman welfare values, and high task- and people-orientations.
Strategy and Environmental UncertaintyThe environment has important implications for
organizational performance. Pearson (1989) claimed that one of the important contributions that leaders make to their organizations is to identify the interrelationships between environment and strategy. The performance implications of
94
Reproduced with perm ission o f the copyright owner. Further reproduction prohibited w ithout permission.

various strategy-environment contingencies have been the focus of many theoretical and empirical studies (e.g.: Hambrick, 1983a, 1983b; Hitt, Ireland, & Stadter 1982; Jauch, Osborn, & Glueck, 1980; Kim & Lim, 1988; Miller, 1988; Miller & Friesen, 1978; Rockhart, 1979; and White, 1986). Some researchers have used data free case studies to examine the strategy-environment alignment and its effect on organizational performance (e.g. Miller and Friesen, 1978). The findings of these studies indicate that turbulent or dynamic environments require innovative strategies if the organization is to succeed.However, Jauch, Osborn, and Glueck, (1980) could not support Miller and Friesen's findings. Verikatraman (1989) attributed these conflicting results to inappropriate analytical methods.
Using Miles and Snow's (1978) generic strategy typology, Hambrick (1983b) found that organizations that use different strategies in different environments attain different levels of performance. Similarly, Zajac and Shortell (1989) using a sample of hospitals found that the strategies of the Miles and Snow's (1978) typology were differentially effective in different environments (prospector strategy in dynamic environments and defender strategy in stable environments). Basically, these researchers found that innovative and creative strategies are more effective in uncertain environments. Other researchers have suggested that Porter's (1980) low cost strategy will be more effective in stable environments while the differentiation
95
Reproduced with perm ission o f the copyright owner. Further reproduction prohibited w ithou t permission.

strategy will be more effective in dynamic environments (Kim and Lim, 1988; Miller, 1988; White, 1986). Nevertheless, Miles and Snow (1978) concluded that the characteristics of the prospector and defender strategies can be successfully pursued in changing environments. Therefore, it is hypothesized that:
Hypothesis 3Organizations in environments that are high in uncertainty will achieve higher levels of performance provided they pursue a Type I or II strategy. Organizations that pursue Type III or IV strategies in high uncertainty environments will be ineffective.
Strategy. Environmental Uncertainty, and Leader AttributesIn order to be effective, organizations need to pursue the
appropriate strategy, in the proper environment, with leaders whose characteristics or attributes are supportive of the strategy-environment fit. If hypotheses 1, 2, and 3 were to be combined to focus on the internally consistent or congruent relationships between leader attributes and strategy in an environmental context, an overall configuration hypothesis could be developed for all the variables of interest in this study such that:
Hypothesis 4:Organizations that achieve higher levels of performance in an environment with high levels of uncertainty are more likely to pursue Type I strategies with leaders that have liberal business affairs and human welfare values, high task- and people-orientations, and internal locus of control. Organizations that deviate from this pattern would have lower performance levels.
96
Reproduced with perm ission o f the copyright owner. Further reproduction prohibited w ithou t permission.

Hypothesis 4 falls into the category of what Venkatraman (1989) referred to as 'fit as profile deviation1. Profile deviation is a contemporary fit-based approach that depicts an internal coherence among a set of theoretical variables/ constructs. Miller (1981, p.5) described this type of research as follows: "Instead of looking at a few variables or at linear associations among such variables, we should be trying to find frequently recurring clusters of attributes or gestalts". Miller and Friesen (1984) further added that the development of gestalts or profiles could be used to address the problems that arise from internal inconsistencies in bivariate relationships, because it has a multitiered taxonomical approach. Finally, Miller and Mintzberg's (1983, p. 69) argument for configuration studies contended that: "... the organization may be driven toward configuration in order to achieve consistency in its internal characteristics, synergy (or mutual complementarity) in its processes, and fit with its situation." When a performance variable is the basis for determining the gestalts, Verikatraman (1989) referred to this as 'fit as profile deviation'. Profile deviation is otherwise called alignment, configuration, systems, or pattern analysis (e.g. Venkatraman & Prescott, 1990). Hypothesis 4 is different from the previous three in that it enables one to take a more holistic view of the organizations in this study by examining the importance of the overall pattern of relationships between all the research variables/constructs as a
97
Reproduced with perm ission o f the copyright owner. Further reproduction prohibited w ithout permission.

set. This holistic approach has been recommended by other researchers as a complement to traditional contingency theory-based approaches (e.g. Drazin & Van de Ven, 1985; Van de Ven & Drazin, 1985).
Summary
This chapter presented a review of the literature relative to the variables examined in this study. Three traditional contingency and one configuration-based hypotheses were developed around the explanatory variables/constructs that were identified in Chapter One and discussed in this chapter. Generally, it was hypothesized that the interactions between leader attributes with environment and strategy in addition to the interaction between strategy and environment are important to organizational performance. Finally, the performance differences between organizations were hypothesized to result from the incongruence or lack of internally consistent relationships between strategy and the leader attributes in a specific environment.
98
Reproduced with perm ission o f the copyright owner. Further reproduction prohibited w ithout permission.

CHAPTER 3
METHOD
This chapter includes a description of the type of organization from which the sample for this study was drawn, the sample selection method, the operational definitions, as well as the scales and instruments that were used to measure the variables of interest. Furthermore, there is a discussion of the results of the pilot study that was undertaken. The potential contributions that the results of the tests of the hypotheses that were developed in the previous chapter could make to the strategic management literature in general, and to the configuration research stream specifically are also discussed. Finally, the implications of the pilot study for the main study, as well as the variables, subjects, and tasks in the main study are enumerated.
The Sample
In general, organizations are designed on a for-profit or not-for-profit basis. While there are many researchers that have studied hew for-profit enterprises are managed, we knew very little about not-for-profit organizations. The preponderance of the knowledge that has been accumulated in the strategic
99
Reproduced w ith perm ission o f the copyright owner. Further reproduction prohibited w ithout permission.

management field deals with variables that enhance the profitability of organizations. It is important, for comparative purposes, to determine if the variables that enhance profitability also account for performance differences in not-for-profit organizations.
The majority of the researchers in the strategic management area have focused on for-profit organizations. While the newness of this area of academic inquiry might have been an acceptable excuse for neglecting not-for-profit organizational research during the early years, there appears to be no strong reasons for its continued neglect today. Consequently, there is a need for research studies that focus on the management of not-for-profit organizations. There are many important reasons (a few of which are discussed in the following paragraph) for focusing on these organizations as the sample unit for analysis.
The not-for-profit sector has been suggested in the management literature to be just as important as the for-profit sector to the United States' economy (e.g. Hatten, 1982; Stewart, 1989). Therefore, any gains in effectiveness that are made in the management of these organizations can translate directly to a more productive national economy. To academicians, especially those in the strategic management area, the knowledge gained through a focus on not-for-profit organizations can add to or solidify the knowledge that has been accumulated on the management of for-profit organizations. In other words,
100
Reproduced with perm ission o f the copyright owner. Further reproduction prohibited w ithout permission.

not-for-profit organizations could provide another context within which some of the knowledge that has been gained in the strategic management area can be tested. In addition, the practitioners— those involved in the management of not-for-profit organizations— could find this stream of research studies to be meaningful and useful.
Kotler (1982) identified two types of not-for-profit organizations: public (e.g. government agencies) and private (e.g. charities). Of these two categories, the private not-for-profit (or PNTP) organizations have received less attention in the management literature. In fact, the PNFP organizations are often referred to as the third sector of the economy. The first and second sectors of the economy are profit-making enterprises and government-based entities respectively. Higgins and Vincze (1989) identified eight major categories of third sector organizations. These categories are: religious (e.g. churches), social (e.g. service clubs), cultural (e.g. museums), knowledge (e.g. private schools), protective (e.g. trade unions), political (e.g. lobbyist groups), philanthropic (e.g. private foundations), and social cause (e.g. women's rights groups) organizations. The diversity in the PNFP sector— which at first glance may make research findings very difficult to generalize— may be one of the reasons why management researchers have distanced themselves from this area of academic inquiry. Hatten (1982) suggested that the PNFP's diversity
101
Reproduced with perm ission o f the copyright owner. Further reproduction prohibited w ithout permission.

should not discourage researchers from focusing on them because they can benefit from the application of the strategic management concepts originally developed for profit making enterprises.
Of the eight PNFP categories, the neglect of religious organizations seems specifically unwarranted because they generate an annual revenue of about fifty billion dollars in the United States. In addition, assets like land, buildings, and volunteer work are estimated to be worth several billions of dollars (Stewart, 1989). Given the financial and social importance of this type of not-for-profit organization to the economy, one would expect that religious organizations would have received a greater emphasis in the management literature. Unfortunately, this has not been the case. In fact, the lack of empirical studies dealing with the management of religious organizations is indicative in general of the lack of emphasis in the management literature for all PNFP organizations. While some may argue that the lack of empirical research is not surprising because religion is an emotional issue, it has been suggested that religious institutions can be properly managed or mismanaged (e.g. Kohl, 1984). Nevertheless, our goal as management researchers is to understand the factors or variables that account for success in whatever type of organization we are investigating. As succinctly put by Kohl (1984; p. 76):
"The lack of such studies, or their reports is disturbing and problematic for those of us concerned and interested in the future of the institutional church. It is even more appalling for those with
102
Reproduced with perm ission o f the copyright owner. Further reproduction prohibited w ithout permission.

knowledge of the dramatic decline of many mainstream religious organizations during the postwar era who believe ... (that) business models and practices have great applicability to assist struggling parishes in developing for growth ...".Therefore, a sample of religious organizations was used in
this study. Most researchers recommend that because religious organizations are so diverse— in their beliefs, how they define and accept members, administrative freedom of each congregation, and denominational practices and policies— it is better to sample from one denomination when one is studying them (e.g. Smith et al., 1984). In addition, it was preferable to sample from within the same state because the standards for reporting organizational variables (e.g. location) may differ (e.g. Odom & Boxx, 1988).The reporting standards need to be homogeneous if researchers are to assume that organizational records are based on similar requirements. The religious organizations that are used in research studies have well-defined reporting requirements and are therefore usually one of the established denominations like the Methodists or Baptists (e.g. Odom & Boxx, 1988; Webb, 1974). Consequently, the sample for this study was taken from the Arkansas Southern Baptist churches.
Religious organizations from within the same state and denomination— even if randomly chosen— could be considered a narrow sample; however, Miller and Mintzberg (1983) recommend a narrow sample for configuration-based research. While the use of a narrow sample obviously limits the generalizability of research
103
Reproduced with perm ission o f the copyright owner. Further reproduction prohibited w ithout permission.

findings, the nature of configuration research may necessitate such a choice. To circumvent the generalizability problem,Miller and Mintzberg recommend that configuration research be undertaken with samples from different types of organizations.The primary advantage of using a narrcw sample is that it could be used to uncover individual configurations intuitively, and to describe them in depth. To this end, Miller and Mintzberg (1983, p. 63) added that "Since multivariate relationships can vary from one configuration to another, we must first try to find these configurations in the form of dense homogeneous clusters of attributes or interrelationships that together form a predictive taxonomy."
TaskAll the operational definitions for each of the variables in
this study (except the performance measures) were designed in the form of a questionnaire that was sent to the senior ministers of selected Southern Baptist churches in Arkansas. The churches that were selected must have had the same pastor over the last four years because Hadaway (1989) found that a minister's inpact on the performance of a church will be felt within the first few years of his tenure. Furthermore, in order for location not to confound the findings of this study, the approach that was recommended by Odom and Boxx (1988) of using churches that have had at least 150 member over the four-year period was adopted for
104
Reproduced with perm ission o f the copyright owner. Further reproduction prohibited w ithout permission.

use in this study. It was estimated that about 500 to 600 churches in Arkansas would be potential subjects. Finally, the participation of all subjects was voluntary but encouraged.
VariablesIndependent Variables. Independent or predictor variables
are used to estimate the expected values of the dependent or response variables (Berenson, Levine, & Goldstein, 1983). Ihe theoretical foundation section in the previous chapter identified five independent variables that could be classified into three main categories. These independent variables/constructs are: (1) the leader's: (a) value orientation, (b) locus of control, and (c) style; (2) environmental uncertainty; and (3) strategy.
Dependent Variables. The dependent variables in this study measure organizational performance. These variables distinguish growing from stagnant organizations. These organizational performance variables specifically are: membership, Sunday School attendance, and financial receipts. The use of these measures is supported by recent studies in the religious not-for-profit sector (e.g. Odom & Boxx, 1988). Membership in Arkansas'Southern Baptist churches are categorized as 'residential' and ' nonresidential'. Residential members are those who live within the community in which the church is located while nonresidential members are those who live outside of the immediate community. Both measures of membership will be used because they represent
105
Reproduced with perm ission o f the copyright owner. Further reproduction prohibited w ithout permission.

different levels of commitment on the part of the churches as well as the members. Therefore, the relationship between the independent variables and the two membership measures should differ. The only measure of Sunday school attendance is the 'average' that is reported by these churches. Average Sunday school attendance is a performance variable that reflects internal growth in the form of increased members' participation and commitment. The average Sunday School attendance for all churches is the total Sunday School attendance divided by fifty two— the number of weeks in the year. Therefore, using an average should not distort the comparative importance of this variable between church organizations. Total financial contributions received is the monetary receipts of the church organization. Multiple dependent variable measures are used because some researchers have called for simultaneous consideration of these variables in configuration-based studies (e.g. Carper & Snizek, 1980; Drazin & Van de Ven, 1985).
MeasuresStrategy. Ministers of the sampled churches were given the
characteristics of the four generic strategies classification that was discussed in the literature review (i.e. Types I, II, III, and IV). These strategies were arranged in randan order on the questionnaire in order to minimize bias. In addition, the descriptions of these strategies were semantically modified to
106
Reproduced with perm ission o f the copyright owner. Further reproduction prohibited w ithout permission.

fit church organizations. Basically, this translates into using words such as church or congregation, ministries, gospel, or minister instead of organization, business, product, or manager, respectively. Each minister was asked to pick one of the four descriptions that was most representative of the strategy that his church has been pursuing. The description for a Type I strategy is illustrated below:
The basic strategy of our church is to:— grew by continuously expanding our ministries — use creative and innovative ministry approaches for expansion
— correctly "package" and "market" the gospel — continuously monitor our external environment — be willing to take risks— make decisions based on their long term effects on our church
— make our organizational structure more flexible.The descriptions of all four strategies is in Appendix A.
Value Orientation. Various measurement scales have been developed in the past to measure conservatism (e.g. Bahr & Chadwick, 1974; Nettler & Huffman, 1957: and Wilson & Paterson, 1968). In response to the call by Robinson, Rusk, and Head (1968) for a contenporary conservatism measurement scale, Sturdivant et al. (1985) developed one. They used a sixty five item questionnaire in their pilot study. Through factor analysis, they were able to reduce these to thirty items; sixteen items represent attitudes about 'government/business and the general welfare1, while the remaining fourteen items represent attitudes about 'human rights and responsibilities' (including
107
Reproduced with perm ission o f the copyright owner. Further reproduction prohibited w ithout permission.

items about family, individual rights, and minorities). Only twenty of these thirty items were used because items that had factor loadings of 0.50 or higher were considered by this researcher to be the ones with the stronger discriminating capabilities (Taylor, 1984). Of these twenty items, eleven and nine items represented the 'government/business and the general welfare1 and 'human rights and responsibilities' categories respectively.
These twenty items were presented in a Likert-type response scale. The subjects/ministers were asked to choose a number (from l=strongly agree to 6=strongly disagree) that is representative of their level of agreement or disagreement with each of these twenty items. The items were arranged such that seme of them required reverse scoring, to reduce mono-method bias (Cook & Campbell, 1977). The value orientation measure was the sum total of the scores on these twenty items. A conservative minister would have a lower score on this instrument than a liberal minister.
Locus of control. This variable was measured by using an instrument developed by Rotter (1966). This is an instrument that is well-kncwn and has been used in the management literature (e.g. Miller et al., 1982). It is often referred to as the Internal-External (or I-E) scale. The I-E scale consist of fifty eight items that deal with twenty nine societal issues. Twenty three of these issues make up the I-E scale while the other six
108
Reproduced w ith perm ission o f the copyright owner. Further reproduction prohibited w ithout permission.

issues are fillers designed to make the intent of the instrument less obvious to the subject (i.e. reduce hypothesis guessing). Each societal issue on the locus of control scale has one 'internal' and one 'external' statement; the ministers surveyed were required to pick one of these two statements that they believe has seme truth or more truth to it.
To determine if a minister has an external or internal locus of control, the approach used by Miller et al. 's (1982) study was emulated. Essentially, one point was assigned to each 'external' response to an item, while an 'internal' response was assigned a score of zero. The scores for all the locus of control issues were then summed up. The higher the minister's score on these issues, the more the minister is interpreted as having an external locus of control.
Leadership Style. Task- and people-orientations were measured by adapting the Leadership Style Questionnaire (LSQ) that was developed from the classic Ohio State University leadership studies. The questions were semantically modified such that they would be applicable to church organizations. Therefore, words such as minister, members, and congregation were used in the place of words like leader, enployees, and organization in the original questionnaire. The LSQ uses items that are similar to those of the Leader Behavior Description Questionnaire's (IBDQ) "Consideration" and "Initiation" scales. Hcwever, the LSQ items were intentionally designed to be more
109
Reproduced with perm ission o f the copyright owner. Further reproduction prohibited w ithout permission.

behavior specific (Sashkin & Morris, 1987). Fourteen items that described possible leader behavior were used. Respondents rated how frequently the behavior is displayed on a scale of rarely or never=l to very frequently=5. Seven items measured task- orientation, and another set of seven questions measured people- orientation. The sum total of the responses to each set of seven items were used to determine the leader's task- and people- orientations.
Environmental Uncertainty. Environmental uncertainty was measured on a high-low continuum. Using an adaptation of the Odom and Boxx (1988) scale, the frequency of change (using a Likert-type scale from l=Never to 5=Very often) of certain factors within the community in the last five years were used to determine if the environmental uncertainty is relatively high or lew. These factors were size, age distribution, educational level, socioeconomic status, presence of a new population group, needs of individuals, types of ministries being offered by other churches, type and level of assistance available from the county and/or state associations, receptiveness of individuals within the community to the church's ministries, the general economic condition of the community, and the kind of community in which the church is located (e.g. if the community has changed from a "rural" community to a "tewn"). The sum of the scores for each minister on each of the questions was used to determine if environmental uncertainty was perceived as high or low. A
110
Reproduced with perm ission o f the copyright owner. Further reproduction prohibited w ithout permission.

higher total score means higher environmental uncertainty.Organizational performance. In this study, organizational
performance was measured by using the changes reflected in a church's: (1) residential membership (2) nonresidential membership, (3) average Sunday school attendance, and (4) total financial contributions received over the past four years. Hie "Annuals of the Baptist State Convention" was the data source for these dependent variables; this is a yearly publication that provides vital statistics on each of the Southern Baptist churches in Arkansas. Table 12 is a summary of the operational definitions for all the variables/constructs in this study.
Data CollectionA prenotification letter was sent to the ministers of
selected Arkansas Southern Baptist churches to inform them about the research study and to implore them to fill out the questionnaire that would be mailed to them within the next few days. Three days later, a questionnaire and a cover letter that among other things referred to the prenotification letter was sent to each of these ministers. This researcher assumes that no undue influences or pressures were exerted upon these ministers because no incentives were offered, except the opportunity to request a summary copy of the results of this study. Finally, one week after sending the questionnaire, a follow-up post card was sent as a reminder to increase the response rate.
Ill
Reproduced with perm ission o f the copyright owner. Further reproduction prohibited w ithout permission.

TABLE 12
SUMMARY OF OPERATIONAL DEFINITIONS
VARIABLE OPERATIONAL DEFINITIONAL ISSUESStrategy Church membership, Budgeting and controlling,
Long term outlook, Creativity, Innovation, Packaging, Marketing, Environment, Risk taking propensity, Structure, Members' needs, Efficiency, Segmentation, Cost Control, Ministries, and Asset reduction.
EnvironmentalUncertainty
Community's size, age distribution, status, educational level, socioeconomic status, and new population groups; competitors' ministries,Local and State level assistance, government regulation, community tolerance and receptivity, general economic conditions, location.
ValueOrientation
Government programs, mixed marriages, discipline, homosexuality, discrimination, laziness, bigotry, change, education, organized labor, affirmative action, politics, taxes, the poor, consumer protection, advertising, medical care, environmental protection, and quality of life.
LeadershipStyle
Task assignment and clarity, source of new ideas, members' involvement and participation, role clarity, work schedules, procedures and policies, organization climate, respect, and consideration.
Locus of Control
Self determination, wars, respect, school grades, leadership effectiveness, liking, destiny, success, pcwer, planning, luck, fate, chance, friends, corruption.
Performance Memberships, Sunday school attendance, financial receipts.
112
Reproduced with perm ission o f the copyright owner. Further reproduction prohibited w ithou t permission.

Data Analysis
The method of analysis for the data that were collected depends on the hypothesis that was tested. The appropriate technique for hypotheses 1, 2, and 3 among others is subgroup analysis. The subgroup analysis requires that the sample be subdivided into categories by some variable like strategy for hypothesis 2 and environmental uncertainty for hypotheses 1 and 3. Because strategy was measured at an ordinal level in this study, the subdivision of the sample was based on its categories. Conversely, environmental uncertainty— a continuous variable— had to be converted to a categorical variable. The two categories that were used are hi$i and lew environmental uncertainty sub-samples. The cutoff score that was used for subdividing the sample into this high and lew groups was the mean score plus one standard deviation for the items that measured environmental uncertainty on the questionnaire.
Prior to undertaking subgroup analyses, Pearson correlation analysis was used to observe relationships between the variables of interest. Correlation analysis was necessary, in order to highlight any potential problems with multicollinearity. High correlation between the independent variables/constructs could indicate multicollinearity (e.g. Berenson et al., 1983).Whenever independent variables that should not be ordinarily
113
Reproduced with perm ission o f the copyright owner. Further reproduction prohibited w ithout permission.

related have high correlation, then the impact of these variables on the dependent variables could become distorted. The independent variables in this study were checked for multicollinearity.
Finally, Venkatraman (1989) suggested that the appropriate statistical technique for configuration or alignment-based hypothesis is 'profile deviation', pattern, or systems analysis. The profile deviation approach for testing hypothesis 4 involves three basic stages of analysis. In stage 1, the contextual variable (i.e. environmental uncertainty) should be used to develop a lew, medium, and high environmental uncertainty subgroups for the study. The lew subgroup could be the mean environmental uncertainty score plus one or more standard deviation from the high category. In addition, the scores for the leader attributes and strategy should be standardized to remove scale variance from the fit measure that is to be developed in the next stage. There are three necessary steps in Stage 2. During the first step, the top 5-10 percent performers in each contextual subgroup are identified— to be used later to develop the ideal profiles— while the bottom 5-10 percent performers are permanently removed from the pool of subjects— in order not to skew the distribution of the remaining scores in favor or against the test of the hypothesis. The middle 80-90 percent is the study sample. In step 2 of stage 2, the mean scores of the leader attributes and strategy of the top 5-10
114
Reproduced with perm ission o f the copyright owner. Further reproduction prohibited w ithout permission.

percent performers in each contextual subgroup are used as the ideal profiles. The differences between the mean scores of the ideal profiles and the study sample scores on each of the leader attributes and strategy are then used to develop Eucledian distance measures in step 3 of stage 2. In stage 3, the distance measures are correlated with the dependent variables. Fit or misfit in terms of configuration is supported if the correlations coefficients between the distance scores and the dependent variables are negative and significant. As suggested by Berenson et al. (1983) among others, the analysis of a hold-out sample is necessary to validate the discriminating capacity of the ideal profile that is developed from the high performers in each group. Therefore, a hold-out sanple could be used to determine the validity of the profiles that are developed within each environmental uncertainty context such that the higher the deviation of the study or hold-out sample from the profile of the high performers, the stronger the support for hypothesis 4.
Power level is the probability of rejecting the null hypothesis given that it is false, while, alpha or significance level is the probability of rejecting the null hypothesis given that it is true (e.g. Kirk, 1988). The desired power and significance or alpha levels for all the analyses in this study were set at .90 and .05 respectively. These power and alpha levels were used, along with the effect sizes observed in the pilot study, to determine the sample sizes that were needed to
115
Reproduced with perm ission o f the copyright owner. Further reproduction prohibited w ithout permission.

find significant results in the main study (e.g. Cohen, 1988). Stevens (1986) suggested that a very hic#i power level should be used for a research study that requires substantial monetary and time investments, so that the researcher will be able to "observe a difference" if one does exist. In addition, this researcher assumed that the effect sizes that were observed in the pilot study are representative of what to expect in the main study.The results of the pilot study that was undertaken follows.
Pilot Study
A pilot study investigating the hypotheses that are proposed in this study was conducted in June 1990. A pilot study was necessary in order to:
(1) determine if there are any design flaws in the surveyinstrument;
(2) uncover any ambiguous or misleading questions in thesurvey instrument,
(3) develop an estimate of the percentage of responsesto expect, and if such a response rate will be enough to find significant results in testing the hypotheses, and
(4) determine an estimate of effect sizes that can beexpected in testing the hypotheses. This effect sizes can then be used along with desirable power and significance level to determine the needed sample sizes to obtain significant results in the main study.
The pilot study led to seme changes in the main study. Thesechanges are outlined in the section of this chapter that istitled "Contributions of the Pilot Study to the Main study".
116
Reproduced with perm ission o f the copyright owner. Further reproduction prohibited w ithou t perm ission.

The variables, subjects, task, statistical analysis, and results of the pilot study are discussed next.
VariablesIndependent variables. As discussed previously, there are
five independent variables in this study. All the variables are continuous, except for strategy which is a categorical variable. Ordinarily, strategy would have been measured at four levels in the pilot study, but none of the respondents chose the Type IV or what Herbert and Deresky (1987) labeled the "harvest" strategy. The other three strategy descriptions (i.e. Types I,II, and III) were chosen by at least one respondent. The other independent variables were measured on a continuous scale. Value orientation was measured on a conservative-liberal continuum. The extremes of locus of control were internal and external. Leadership style was measured separately for task-orientation and people- orientation— each rated from high to low. Environmental uncertainty was measured on a high-low continuum. The raw data was used for analyses in all cases except where a continuous variable needed to be converted to a categorical type— as discussed in the data analysis section.
Dependent variables. The four dependent variables are the performance criteria. In the pilot study, performance was based on the percentage increases over the last four years in: (1) residential membership, (2) nonresidential membership, (3)
117
Reproduced with perm ission o f the copyright owner. Further reproduction prohibited w ithou t permission.

average Sunday School attendance, and (4) total financial contributions received.
SubjectsThe Southern Baptist convention in Arkansas has forty-two
associations. There was at least one church in forty-one of these associations that met the original criteria (i.e. minister's tenure for at least four years and average membership level of 150 for the four year period) required by this study.All the associations (except one) had at least one church that met these conditions. Forty-one ministers (one from each association) were surveyed; thirty returned the questionnaire within the allotted two-week period. Only twenty-nine responses were used in the analyses because one church did not report dependent variable measures for 1986, resulting in a usable response rate of about 70 percent.
TaskThe task was for the ministers that were surveyed to
complete and return the questionnaire. The length of time reported by some of the ministers that completed and returned the survey ranged from 30 to 45 minutes. The ministers were also asked to note any confusing or ambiguous questions. Their responses and recommendations led to some adjustments in the survey instrument. First, one of the "Background Information"
118
Reproduced with perm ission o f the copyright owner. Further reproduction prohibited w ithout permission.

items in the pilot study was not used in the main study because it did not provide usable or discriminating responses from subjects. Therefore, the item "Please describe (in one sentence) the primary objective of your church over the last four years" was excluded from the questionnaire items in the main study. The typical response to this item was "To reach the world with the gospel of Jesus Christ". Second, another item in the "Background Information" section that was designed to measure the changes in the church's membership by age grot?) was eliminated because ministers reported that their responses were rough estimates. In the main study, this question only required that the ministers indicate whether there has been an overall increase or decrease in memberships over the last four years in their churches— to corroborate the membership figures in the 'Annuals.' Finally, the instruction for responding to the locus of control items was changed to reflect feedback from the respondents to the pilot study from "Please choose the letter option for each of the following issues that comes the closest to your belief" (Appendix A) to "Please choose ONE letter option for each of the following issues that you believe either has MORE TROTH to it, or SOME TRUTH to it" (Appendix B).
Pilot Study Results
Hair (Jr.), Anderson, Tatham, and Grablcwsky (1979) suggest
119
Reproduced with perm ission o f the copyright owner. Further reproduction prohibited w ithout permission.

that whenever a researcher has a metric dependent variable, the appropriate statistical analysis is multiple regression (for metric independent variables) or multivariate analysis of variance (for nonmetric independent variables). All the dependent and independent variables in this study are metric except strategy, which is a categorical variable. Furthermore, as suggested in the 'data analysis' section, the form of hypotheses 1, 2, and 3 necessitated the use of subgroup analyses while hypothesis 4 required the use of profile deviation, pattern, or systems analysis.
HypothesesThe data collected in the pilot study were analyzed in order
to test the hypotheses developed in Chapter 2. The significant (p <.05) and marginally significant (p <.10) effects are noted and discussed in the following paragraphs. Furthermore, effect sizes were used (along with a pjcwer level of .90 and significance level of .05 in each case) to determine the sample sizes that were needed in the main study to find significant results.
The limited number of subjects that were used for the pilot study precluded the in-depth analyses of hypotheses 1 and 2. The full models could not be tested for either hypotheses because the "error degrees of freedom" was zero, making it impossible to calculate the "error sums of squares" and "error mean square" fchich are necessary to obtain meaningful results. The main
120
Reproduced with perm ission o f the copyright owner. Further reproduction prohibited w ithout permission.

effects models were analyzed for both hypotheses and a discussion of the results follows.
HI hypothesized that an organization in an environment that is high in uncertainty would achieve higher performance levels— than an organization in an environment that is lew in uncertainty— if the leader has relatively: (1) more liberal values, (2) higher task- and people-orientations, and (3) more internal locus of control. No significant results were found for any of the dependent variables for the main effects model. For the low environmental uncertainty subgroup, effect sizes ranged from a low of 0.45 for financial contributions to 0.64 for nonresidential membership. The minimum sample size that is needed in the main study to find significant results is 118.This sample size is associated with the dependent variable that has the lowest effect size (Table 13). For the high environmental uncertainty subgroup, effect sizes ranged from a low of 0.38 for average Sunday school attendance to 0.41 for residential and nonresidential membership. The minimum sample size— associated with the lowest effect size— that is needed in the main study to find significant results is 127 (Table 14).
H2 hypothesized that leaders that pursue a Type I strategy will be more effective than those who pursue Type II strategies if these leaders have relatively: (1) more liberal values, (2) higher task- and people-orientations, and (3) more internal locus of control. As stated earlier, only the main effects models
121
Reproduced with perm ission o f the copyright owner. Further reproduction prohibited w ithout permission.

Table 13
POWER ANALYSIS FOR THE TEST OF HI flow Environmental Uncertainty Subgroup)
Source___________________________ Value
Sample size 14
Minimum acceptable power level .90
Effect sizes observed:Residential membership .63Nonresidential membership .64Average Sunday School attendance .62Financial contributions .45
Minimum sample size needed 118
122
Reproduced with perm ission o f the copyright owner. Further reproduction prohibited w ithout permission.

Table 14
POWER ANALYSIS FOR THE TEST OF HI High Environmental Uncertainty Subgroup}
Source___________________________Value
Sample size 15
Minimum acceptable power level .90
Effect sizes observed:Residential membership .41Nonresidential membership .41Average Sunday School attendance .38Financial contributions .47
Minimum sample size needed 127
123
Reproduced with perm ission o f the copyright owner. Further reproduction prohibited w ithout permission.

could be tested for hypotheses 1 and 2. For organizations that pursue a Type I strategy, the effect sizes for the test of H2— for the main effects model— ranged from a high of 0.81 for residential membership to 0.40 for total financial contributions for the organizations that pursue a Type I strategy.Furthermore, the inpact of a leader's people-orientation(F = 8.46, p <.05) and locus of control (F = 9.67, p <.05) wassignificant on the residential membership dependent variable.For nonresidential membership, the leader's people-orientation (F = 3.92, p <.05) and values (F = 3.56, p <.05) were also significant. No discussion of the findings are discussed here because of the inability to test the full model upon which the hypothesis is really based. No significant relationships were found for the other dependent variables. The minimum sample size that is needed to find significant results for the other dependent variables for hypothesis 2 is 133 (Table 15).
In addition, the test of hypothesis H2 for the organizations that pursue a Type II strategy did not reveal any significant relationships between the independent and dependent variables.The effect sizes observed were from 0.31 for financial contributions to 0.51 for residential and nonresidential memberships. The minimum sanple size that is needed in the main study to find significant results is 202 (Table 16).
There were no significant relationships for the test of hypothesis 3. In the lew uncertainty environment subgroup, the
124
Reproduced with perm ission o f the copyright owner. Further reproduction prohibited w ithout permission.

Table 15
POWER ANALYSIS FOR THE TEST OF H2 (Type I Strategy Subgroup)
Source___________________________Value
Sample size 14
Minimum acceptable pcwer level .90
Effect size observed:Residential membership .51Nonresidential membership .49Average Sunday School attendance .45Financial contributions .31
Minimum sample size needed 133
125
Reproduced with perm ission o f the copyright owner. Further reproduction prohibited w ithou t permission.

Table 16
POWER ANALYSIS FOR THE TEST OF H2 (Type II Strategy Subgroup)
Source___________________________Value
Sample size 14
Minimum acceptable pcwer level .90
Effect size observed:Residential membership . 51Nonresidential membership .49Average Sunday School attendance .45Financial contributions .31
Minimum sample size needed 202
126
Reproduced with perm ission o f the copyright owner. Further reproduction prohibited w ithout permission.

inpact of strategy on average Sunday school attendance and financial contributions was negligible. Hie effect sizes that were observed for average Sunday school attendance and financial contributions are 0.021 and 0.095 respectively. If these effect sizes do not improve in the main study, the sample size that is required to find significant results for these variables (335 for financial contributions and 976 for average Sunday school attendance) may make it impossible to analyze these relationships, Hie effect sizes for residential (0.25) and nonresidential memberships (0.22) are high enough to mate in-depth analyses of these relationships possible in the main study. Hie minimum sample that is needed to find significant results for these membership variables is 187 (Table 17).
Hie test of hypothesis 3 for the hi<$i environmental uncertainty subgroup did not reveal any significant results. Hie effect sizes ranged from a lew of 0.296 for residential membership to 0.47 for financial contributions. Hie minimum sample size that is necessary to find significant results in the main study (i.e. the effect size associated with residential membership) is 108 (Table 17).
Hie test of hypothesis 4 was also limited by the sample size and the manner in which strategy was measured in the pilot study. Hie number of subjects in the pilot study was not enough to support profile deviation or systems analysis. More importantly, the ordinal measure of strategy, while facilitating
127
Reproduced with perm ission o f the copyright owner. Further reproduction prohibited w ithout permission.

Table 17
POWER ANALYSIS FOR THE TEST OF H3
LU HU Source_______________________ Value Value
Sample size 14 15
Minimum acceptable pcwer level .90 .90
Effect size observed:Residential membership .25 .296Nonresidential membership .22 .36Average Sunday School attendance .021 .41Financial contributions .095 .47
Minimum sample size needed 187* 108
where LU = low uncertainty subgroup and HU = high uncertainty subgroup
* This sample size is associated with the test of H3 for residential and nonresidential memberships.
128
Reproduced with perm ission o f the copyright owner. Further reproduction prohibited w ithout permission.

the test of hypotheses 2 made it inpossible to analyze hypothesis four. Profile deviation or systems analysis is more meaningful when interval level data is used (e.g. Gresov, 1989). Consequently, this configuration-based hypothesis could not be tested in the pilot study.
Summary. In conclusion, because the small sample size of this pilot study made it impossible to analyze the data collected in depth, the findings are at best tentative, but they suggest that there are potentially useful contributions that the main study can make to the management literature. Perhaps, the primary contribution of the pilot study is that it made it possible to determine the sample sizes that are necessary to find significant results for most of the analyses that will be undertaken in the main study. Despite the deficiencies that have been noted, the pilot study did make seme important contributions to the main study which are discussed in the following section.
Contributions of the Pilot Study to the Main Study
The pilot study led to seme changes in the main study. These changes are associated with the: (1) measures or questionnaire items for one of the independent variables, (2) sample or the conditions that qualified church organizations will need to meet in order to be used in this study, (3) data analysis, and (4) other miscellaneous information.
129
Reproduced with perm ission o f the copyright owner. Further reproduction prohibited w ithout permission.

MeasuresHie locaos of control items appeared to have presented sane
problems for most of the ministers. They reported that the two statements for each issue was seldom close to their beliefs. Therefore, the instruction for responding to these items was changed from "Please choose the letter option for each of the following that cone the closest to your believe" to "Please choose ONE letter option for each of the following issues that you belief either has MORE TRUTH to it, or SOME TRUTH to it".The ministers did not report any problems with any other questionnaire items.
The SampleOriginally, to qualify, each church organization needed to
meet two conditions; the church must have: (1) averaged at least 150 members over the last four years, and (2) had the same minister over the same time period. These conditions were imposed in order to eliminate the need for including 'location' as a variable in this study— as suggested by Odom and Boxx (1988). The number of churches that met both conditions was about 380. Assuming a 70 percent response rate, about 266 respondents could have been expected in the main study. Seme of the analyses in the main study required more respondents. Consequently, the 150 members' requirement was eliminated, and
130
Reproduced with perm ission o f the copyright owner. Further reproduction prohibited w ithout permission.

the number of qualified churches increased to about 550. Furthermore, contrary to what was originally planned, location was treated as a variable in the main study, rather than having a limited sample size.
Data analysisHypothesis 3 may not yield significant results in the main
study because of the minute effect sizes that strategy had on the criterion variables. If the effect sizes observed for the main study for the test of hypothesis 3, especially for average Sunday school attendance and financial contributions in the low environmental uncertainty subgroup, are hi ier than those of the pilot study, then this potential problem may be eliminated. Suffice it to say, that significant results are expected for the tests of all the hypotheses— for at least two dependent variables— if the effect sizes observed in the pilot study are replicated in the main study.
The approach that was used to analyze the interaction-based hypotheses was changed in the main study. The main reason for the change was the importance of being able to compare the results of this study to others in the configuration literature. Essentially, rather than using subgroup analysis, moderated regression analysis was used to test each of the interaction- based hypotheses. Moderated regression analysis enables researchers to retain more information in hypotheses 1-3 because
131
Reproduced with perm ission o f the copyright owner. Further reproduction prohibited w ithout permission.

the interactions are not artificially demarcated into subgroups. Furthermore, by using moderated regression and systems analyses, it will be possible to compare the results of this study to others like Drazin and Van de Ven's (1985) and Gresov's (1989). Using moderated regression and systems analyses provide better information than subgroup and systems analysis.
Consequently, hypothesis 1, 2,and 3 were analyzed using the approach suggested by Schoonhoven (1981) for analyzing main and interaction effects. Before proceeding with any analysis, the independent variable that modifies the impact of another on the dependent variable should be explicitly stated. For example, the main and interaction effects in an hypothesis that includes two variables can be represented by a mathematical equation of the form:
Y = a + blXl + b2X2 + b3XlX2 + e............. (1)where Y: the dependent variable
a: the slope intercept XI and X2: the independent variables bl and b2: the coefficients for XI and X2 X1X2: interaction between the independent variables e: the error term for the regression equation
If the interaction term (b3) in equation 1 is significant, it may be interpreted as altering the values of bl and b2. Equation 1 could have alternative interpretations: (1) XI modifies the inpact of X2 on Y, or (2) X2 modifies the impact of XI on Y. In
132
Reproduced with perm ission o f the copyright owner. Further reproduction prohibited w ithout permission.

the first situation, the partial of the regression equation would be analyzed such that:
Y = blXl + b3XlX2Y = XI (bl + b3X2)........."................. (3)
In the second situation, the relevant partial regression equation is:
Y = b2X2 + b3XlX2Y = X2(b2 + b3Xl).......................... (4)
While either approach is mathematically appropriate, a choice has to be made based on the formulation of the particular hypothesis. In the latter case, the researcher is interested in how the inpact of X2 on Y is modified over the range of XI.
In this study, the implicit assunption is that leader attributes and strategy can be modified more readily than environmental uncertainty. In effect, the impact of leader attributes and strategy on effectiveness measures will be assumed to vary over the range of environmental uncertainty.
Ihe analyses of the interaction terms in this study were done whether they were statistically significant or not. This was in line with Schoonhoven1 s (1981) procedure. Perhaps the most important reason for analyzing nonsignificant interactions was to determine if they were in the expected hypothesized direction. Since a lack of significance could result from various reasons such as insufficient sanple size and/or lack of statistical pcwer, it was important to investigate other
133
Reproduced with perm ission o f the copyright owner. Further reproduction prohibited w ithout permission.

important facets of these interactions even though the conclusions would be tentative at best.
The interpretation of each interaction term involved determining whether the relationships that were observed were monotonic or nonmonotonic. A nonmonotonic— as opposed to a monotonic— effect means that the impact of the modifying variable on the relationship between the independent and the dependent variables is both positive and negative over the range of the modifying variable. The range of the modifying variable is determined by solving the derivative of equation 3 or 4 for X2 or XI respectively. The other contributions that the pilot study made to the main study are discussed next.
MiscellaneousOne of the ministers in the pilot study suggested that the
questionnaire should not be sent out around a "religious" holiday (e.g. Christmas) or during the summer since ministers are likely to be very busy or otherwise engaged around these times. Therefore, the main study was not done around a 'religious' holiday to maximize the number of respondents to the survey instrument. Unfortunately, because of the time constraints on this researcher, it was necessary to send the questionnaires for the main study out during the summer; this could have affected the response rate. By sending out the questionnaires during the latter part of the summer, the possible number of non-respondents
134
Reproduced with perm ission o f the copyright owner. Further reproduction prohibited w ithou t permission.

that may result from vacationing ministers could have been minimized.
Contributions of this Study
The importance of this study depends to a significant degree on the contributions that can be made through the testing of the proposed hypotheses. The findings will add to the research studies that have empirically investigated the determinants— environmental, strategic, and leader attributes— of organizational performance. In addition, contingency and configuration-based relationships are explored, in order to keep in line with contemporary research stream (Mintzberg, 1990; Venkatraman, 1989; Venkatraman & Prescott, 1990).
Hypothesis HI provides a traditional contingency-based approach to fit between leader attributes and environmental uncertainty. The test of this hypothesis will identify the leader attributes that are effective in unoertain environments. The use of multiple performance measures makes it possible to determine the impact of leader attributes on different organizational effectiveness measures. More importantly, the combinations of leader attributes that have important implications for performance in environments with different levels of uncertainty will be identified. Support for hypothesis one indicates that in an environment with a high level of
135
Reproduced with perm ission o f the copyright owner. Further reproduction prohibited w ithout permission.

uncertainty, the organization will be more effective when the leader has attributes that fit with the requirements of such a setting. Lack of support for hypothesis 1 may suggest that a different combination of leader attributes will be effective in an environment that is high in uncertainty, or that such attributes have limited implications for performance.
Hypotheses H2, if supported, will suggest that the leaders of effective organizations have certain attributes (i.e. value orientation, leadership style, and locus of control) that if combined with a particular strategy will lead to higher organizational effectiveness. Support for hypothesis 2 may also indicate the necessity of matching leaders to strategy types because leaders with different attributes may be more successful at pursuing different strategies. Furthermore, support for this hypothesis will identify the leader attributes and the different combinations of the same that have important performance implications. As succinctly put by Govindarajan (1989, p. 252), "... superior performance can be achieved by selecting managers ... congruent with the requirements of particular strategies".He (Govindarajan, 1989; p. 266) also noted that while: "...several managerial characteristics might indicate a desired match with strategy ... one or two of these variables may be so salient to overshadow or dominate the other variables. There is both theoretical as well as practical merit in examining the presence of such 'dominance' among managerial orientations." It will be
136
Reproduced with perm ission of the copyright owner. Further reproduction prohibited w ithou t permission.

possible within the context of this research study to address the issues that were raised in the preceding quotations. Lack of support for hypothesis 2 my indicate the need to consider the importance of other leader attributes to the performance of organizations, especially if the attributes in this study prove not to have any irplications for performance. In addition, the lack of support for this hypothesis my suggest that a different combination of these leader attributes be considered within different strategy contexts. In other words, a different combination of attributes— rather than the one that was suggested by hypothesis 2— nay be more effective when combined with the pursuit of a Type I strategy.
Hypothesis H3, if supported will indicate that environmental uncertainty moderates the relationship between strategy and performance. The strategy-environment fit literature indicate that innovative strategies are best suited for environments that are high in uncertainty, while conservative strategies are appropriate for static environments (e.g. Khandwalla, 1976). Consequently, support for hypothesis H3 will indicate that innovative and risky strategies appear to be more effective in high uncertainty environments. Conversely, if hypothesis H3 is not supported, it my indicate that environmental uncertainty has not moderated the relationship between strategy and environment in this research study.
Hypothesis 4 is a configuration-based hypothesis about all
137
Reproduced with perm ission o f the copyright owner. Further reproduction prohibited w ithout permission.

the explanatory variables in this study. Support for this hypothesis promotes or justifies the performance implications of the congruence among all the variables in this study.Furthermore, the importance of using multiple approaches to fit in management research studies would be reinforced if the results of the interaction-based hypotheses are insignificant while the profile deviation or systems analysis findings are significant. Lack of support for hypothesis 4 could be attributed to various factors including sample size or measurement scales which could make it difficult to ascertain the importance of the variables/ constructs in this study to performance measures. Table 18 is a summary of the changes that were made in the main study because of the problems that were encountered in the pilot study.
Main Study
The main study for this dissertation was conducted in August, 1991, about one year after the pilot study. Several changes were made before the main study was undertaken because of the results and problems with the pilot study. Some of these changes have been discussed previously tut the remaining ones are discussed in the following section.
VariablesDependent variables. The dependent variables in the main
138
Reproduced with perm ission o f the copyright owner. Further reproduction prohibited w ithout permission.

TABLE 18
SUMMARY OF THE CHANGES NECESSITATED BY THE PILOT STUDY
(1)Instructions for completing two "background" items and for completing the locus of control measures were changed
(2)No membership requirement was used for sample selection in the main study. The only criterion for sample selection was the minister's tenure
(3)The method of data analysis for hypotheses 1, 2, and 3 was changed from subgroup to moderated regression analysis in order to retain more of the information that was collected
(4)Strategy measures were changed from ordinal to interval-level scale to make profile deviation or systems analysis possible
(5) Some other minor revisions and modifications were made to the questionnaire— compare Appendix A and B
Reproduced with perm ission o f the copyright owner. Further reproduction prohibited w ithout permission.

study were the same as in the pilot study: residential membership, nonresidential membership, average Sunday school attendance, and financial receipts.
Independent variables. The independent variables were the same as in the pilot study: strategy, environmental uncertainty, locus of control, value orientation, and leadership style (i.e. task- and people-orientations). Strategy was measured by a scale that was developed in this study through a synthesis of the relevant literature. There was a major difference in the way the strategy construct was conceptualized and measured in the pilot versus the main study. In the pilot study, organizational leaders were given four categorical descriptions of strategy from which they were expected to pick one. In the main study, the strategy descriptions were converted to a likert-type scale in order to make profile deviation or systems analysis possible. Organizational leaders were required to indicate the extent to which the characteristics of their particular strategies were represented by these descriptions. Three descriptions were used for each strategy category, resulting in a twelve-item scale.
Environmental uncertainty was measured in the same way in both the main and pilot studies. In the main study, an additional question was added in order to better understand the impact of environmental changes on organizational effectiveness. The question was "Overall, have the changes in your community been positive (+), negative (-), or had no effect (o) on your
140
Reproduced with perm ission o f the copyright owner. Further reproduction prohibited w ithout permission.

church?".The measurements of leadership style and locus of control
were the same in both studies. Instructions that were omitted in the pilot study for responding to the leadership style items were included for the main study. The instruction was "The following questions deal with how frequently you take a certain course of action when confronted with a particular situation. Please circle the number that is most representative of your choice of action under the following conditions. There are no right or wrong responses." The instruction for completing the locus of control items was changed from "The following questions deal with two ways of viewing the same issue. Please choose the letter option for each of the following that comes the closest to your belief" to "The following questions deal with two ways of viewing the same issue. Please CIRCLE THE ONE letter option for each of the following issues that you believe has MORE TRUTH to it than the other option. If you believe that neither statement has any truth to it, then choose the option that you less disagree with. There are no right or wrong options." This change was necessitated by the suggestions that were made by the subjects in the pilot study. Furthermore, the filler items were not used in the main study in order to more efficiently use the survey instrument's space. To address the issue of hypothesis guessing, seme of the respondents were interviewed. They were specifically asked if they knew what the locus of control items represented,
141
Reproduced with perm ission o f the copyright owner. Further reproduction prohibited w ithou t permission.

the answers were negative. Ihe common complaint was that they wished the items were not forced choice.
Finally, the value orientation of these leaders was measured using the same set of questions in botW'the pilot and main studies. Ihe instructions for completing the questions was changed from "Please write the number that comes closest to the level of your agreement or disagreement with the following statements if: l=strongly agree, 2=agree, 3=sli itly agree, 4=slightly disagree, 5=disagree, and 6=strongly disagree" in the pilot study to '"Ihe following items deal with how much you agree or disagree with certain statements about the government, businesses, and social issues. Again, there are no correct or incorrect responses. Please CIRCLE THE NUMBER that comes the closest to your level of agreement or disagreement with the following statements. l=strongly agree (SA), 2=agree 3=slightly agree, 4=slightly disagree, 5=disagree, 6=strongly disagree (SD)" in the main study. The differences and similarities in the pilot and main studies' questionnaires are in Appendices A and B respectively. Seme of the other changes that were made in the main study were summarized on Table 18.
SubjectsThe participants in the main study were Arkansas Southern
Baptist church leaders. A list of ministers that had a tenure of four or more years was developed through the annual publication
142
Reproduced with perm ission o f the copyright owner. Further reproduction prohibited w ithou t permission.

of the Arkansas Baptist State convention. The same publications were used for both the pilot and main studies. All subjects were volunteers to the extent that they had complete freedom as to whether to participate in the study. Five hundred and seventy three pastors were identified using the 1986 and 1989 annual publications. Forty five of these pastors were used for the pilot study, leaving five hundred and twenty eight for the main study. All of these pastors were used in the main study because the power test that was conducted using the pilot study data indicated that a sample size of approximately one hundred and fifty may be needed to find significant results for sane of the analyses in the main study.
The response rate for the pilot study was about 70 percent in comparison to the 40 percent (214 total responses) for the main study. Various plausible reasons can be given for this significant variation in response rates: (1) sane of the churches that were identified in the original list have had a change of address and/or pastors. Consequently, about ten percent of the questionnaires were returned because of wrong addresses and/or wrong names; (2) in the pilot study, the questionnaires were sent out in early summer while they were sent out later during the summer for the main study— the time when more pastors may be vacationing; (3) sane of the responses that were received could not be used because the pastors that were identified in the original list are no longer the current pastor. In most of these
143
Reproduced with perm ission o f the copyright owner. Further reproduction prohibited w ithout permission.

cases, the tenure of the responding pastor was less than the original four years— five years in 1991 or 1986-1991— that was necessary in order for them to be included in the study; (4) The reminder postcard that was used in the pilot study was handwritten. Because of the size of the main study subjects, a form letter had to be used. The suggested implication is that the handwritten postcard could have been interpreted as having more of a "personal touch" and therefore could have elicited a higher response rate than the form letter that was used in the main study. Overall, only 169 of the 214 usable responses could be appropriately used for the tests of the hypotheses because of the tenure requirement for the ministers.
TaskThe task was identical to that in the pilot study. A
prenotification letter was sent to these ministers in early August, 1991. A few days later, the questionnaires were mailed out. The reminder postcards were then mailed out about one week after the questionnaires. Each organizational leader (i.e. senior minister) had a two to three-week period within which to complete and return the questionnaire. All the instructions for completing the task— responding to and returning the measuring instrument through the mail— were specified in the survey. Each of these ministers was assured that the anonymity of their responses would be preserved.
144
Reproduced with perm ission o f the copyright owner. Further reproduction prohibited w ithout permission.

Summary
This chapter includes the method that was used to collect data in the pilot and main studies. The results of the pilot study were reported; these necessitated that some changes be made in the main study, and these were summarized and described. In addition, the results of the pilot study encouraged the continuation of this study. Finally, the variables, subjects and tasks in the main study were discussed.
145
Reproduced with perm ission o f the copyright owner. Further reproduction prohibited w ithout permission.

CHAPTER 4
DATA ANALYSIS, INTERPRETATION, AND EVALUATION
This chapter presents the results of the main study. All analyses were based on a sample of 169. The first section deals with the measurement of the reliability of the survey instrument; then the hypotheses are analyzed. Finally, the results of the test of each hypothesis are interpreted and discussed.
Reliability of Research Instrument
Measurement is an integral and central aspect of social science research. Even though Stevens' (1951; p. 22) definition of measurement has been the most popular as "... the assignment of numbers to objects or events according to rules.", Blalock's (1968) definition is more appropriate for the social sciences in that it is the process of developing a link between abstract concepts and empirical indicants. In order to determine the extent to which a set of empirical indicators represents a theoretical concept, reliability issues at least need to be addressed. Generally, before any meaningful analysis of data can be undertaken, it is usually necessary to determine the reliability of the research instrument. This was especially
146
Reproduced with perm ission o f the copyright owner. Further reproduction prohibited w ithou t permission.

important in this study because the measurement scales had not been previously used with the sample of organizational leaders in this dissertation. As succinctly put by Carmines and Zeller (1979; p. 51) "... it is often too costly in terms of time and money to try to obtain a higher reliability coefficient. But the most important thing to remember is to report the reliability of the scale and hew it was calculated." Instrument reliability could be measured through one or a combination of approaches: (1) retest method, (2) alternative form method, (3) split halves method, (4) internal consistency method, and/or (5) factor analysis.
Ihe retest and alternative form methods require multiple administrations of the same or comparable tests respectively. In both cases, reliability is measured by the intercorrelations between the multiple administrations of the test. Because of the time and financial costs involved in using the retest and alternative forms methods, it was not feasible to use either of these approaches in the main study.
Ihe split halves method requires that survey items be duplicated and the intercorrelations between the multiple responses be used to measure the reliability of the research scale. Ihe test-retest method is appropriate when the duplication of questionnaire items will not unduly affect the length of the research instrument. Ihe length of the questionnaire for the main study without any repeat items was
147
Reproduced with perm ission o f the copyright owner. Further reproduction prohibited w ithout permission.

seven pages with an average completion rate of about 35 to 38 minutes. Consequently, in order to minimize the length of the survey instrument and potentially maximize the response rate, the split halves method was considered inappropriate for this study.
The most popular form of the internal consistency method is the Cronbach's alpha (Cronbach, 1951). While the internal consistency method is based on a single test administration, it assumes that scale items are parallel and of equal strength in capturing the construct(s) that they measure. The Cronbach alpha and the factor analytic methods were used in this study.
The factor analytic method was used because all the scales in the survey had not been used extensively in previous research studies, and/or tested with the sample that was used in this study. Therefore, the need to ascertain that scale items in each case measured a single phenomenon equally— a requisite for using Cronbach alpha— necessitated the use of factor analysis in the main study. The set of items that was used to measure each independent variable was factor analyzed using principal component analysis and varimax rotation as suggested by Carmines and Zeller (1979). Correlation analyses between the factors and other "relevant" variables, whenever one was available, were used to validate the uniqueness of the factor loadings. The "inter-factor correlations" was the primary approach used in this study because the length of the original questionnaire precluded the inclusion of other variables that could be used to determine
148
Reproduced with perm ission o f the copyright owner. Further reproduction prohibited w ithout permission.

the validity of the factors. Only the factors with two or more items and loadings of 0.50 or higher were considered unique and used for further data analyses. Ihe "two-item" minimum makes it possible to calculate reliability estimates while the 0.50 factor loadings enables the "stronger" items to be used to describe the factors (Nunnally, 1978; Taylor, 1985). Moreover, the "scree" plots were used to determine the number of factors that should be included in these analyses based on the point at which the "plot" changes direction (SAS User's Guide, 1979). Cronbach alphas were also computed for each or a combination of the factors that were interpreted as unique constructs in the main study.
Environmental uncertaintyThere were twelve questions and two factor loadings for the
items that were designed to measure environmental uncertainty (EU). Factor 1 consisted of six items that dealt with changes in the demographics, needs of individuals, and general economic conditions within the community (Table 19). Factor 1 was labeled the "microenvironment" because the items dealt specifically with community-related factors. Factor 2 consisted of four items that dealt with the changes in factors such as ministry offering by other churches, assistance from county association, government regulations, and the receptiveness of the community to the church's ministries. These items dealt with the perception of changes in "significant others". Consequently, factor 2 was
149
Reproduced with perm ission o f the copyright owner. Further reproduction prohibited w ithout permission.

TABLE 19
FACTOR ANALYSIS OF ENVIRONMENTAL UNCERTAINTY SCALE ITEMS
ITEM FACTOR1 FACIOR2
Size 0.71* 0.14Demographics 0.79* 0.10New population group 0.66* 0.24Needs of individuals 0.71* 0.13Other churches' ministries 0.24 0.67*County-level assistance 0.11 0.70*Government regulation 0.07 0.70*Community's receptiveness 0.28 0.56*Economic conditions 0.69* 0.18Location 0.58* 0.27
* items included in defining the factors
Factor 1: Microenvironment Factor2: Macroenvironment
150
Reproduced with perm ission o f the copyright owner. Further reproduction prohibited w ithout permission.

labeled the "macroenvironment". Correlation (Table 20) between factors 1 and 2— micro- and macro-environment was positive and significant (p c.001). This suggests a possible relationship between these factors. Consequently, these ten questionnaire items were combined into a composite measure for environmental uncertainty with a Cronbach alpha of 0.81.
StrategyThe fundamental change in hew strategies were measured in
the pilot versus the main study was that while the latter was on a continuous scale— as a collection of different constructs— the former was ordinal— made up of categorical descriptions. There were 12 items designed to capture four possible types of strategies. The twelve continuous scale items for the main study were developed from the four descriptions of strategies that were used in the pilot study. These twelve items loaded on three factors (Table 21). The loading on three factors is not surprising because in the pilot study, only three of the four strategy descriptions were selected by the thirty respondents. None of the respondents indicated that they pursued a "harvest" or Type IV strategy in the pilot study.
Factor 1 consisted of three scale items that dealt with membership, financial receipts, and focus on meeting the needs of present members. This factor was termed a "stabilize" strategy, the equivalent of the Type II strategy in the pilot study's
151
Reproduced with perm ission o f the copyright owner. Further reproduction prohibited w ithout permission.

TABLE 20
CORRELATION BETWEEN MICRO AND
MICROENVIRONMENT
MICROENVIRONMENT 1.00
MACRQENVTRONMENT
***p <.01
152
MACRO ENVIRONMENTS
MACROENVIRONMENT
0.48***
1.00
Reproduced with perm ission o f the copyright owner. Further reproduction prohibited w ithout permission.

TABLE 21
FACTOR ANALYSIS OF GENERIC STRATEGIES SCALE ITEMS
ITEM FACIORl FACT0R2 FACT0R3 FACTOR'
Direction of membership 0.79* 0.08 0.02 0.05Number of ministries -0.00 0.70* -0.02 -0.14Focus on present members 0.62* -0.24 -0.05 -0.02Reducing ministries 0.27 -0.40 0.55* -0.26Financial contributions 0.79* 0.23 0.17 0.03Unique ministries 0.27 0.53* 0.08 -0.44Repetitiveness of actions 0.23 -0.67* 0.26 0.30Reducing operating costs 0.24 0.13 0.78* 0.19Reorganization 0.16 0.59* 0.30 0.25Longer term orientation 0.40 0.43 -0.28 0.10Ministry focus 0.10 0.11 0.11 0.83*Terminating operations -0.27 -0.04 0 .68* 0.05
* items included in defining the factors
Factorl: "Stabilize strategy" (SSTRA.T)Factor2: "Growth strategy" (GSIRAT)Factor3: "Harvest-tumaround strategy" (HTSTRAT)
153
Reproduced w ith perm ission o f the copyright owner. Further reproduction prohibited w ithout permission.

descriptions. Ihe Cronbach alpha for this strategy was 0.57. Factor 2 had items that dealt with the number and uniqueness of the ministries, and consistency and flexibility in the operations of the church organization. Ihis factor was termed "growth" strategy, and is similar to the Type I strategy description in the pilot study. The Cronbach alpha for this strategy was 0.52. Finally, factor 3 included items concerning the reduction in the number of ministries, operating costs, and the church's operations in general. This factor was identified as the "harvest-tumaround" strategy. This strategy had characteristics that were similar to those of the Types III and IV strategies in the pilot study. The Cronbach alpha for this strategy was 0.71.
Unlike the other constructs in this study, there was an additional "relevant" construct that could be used to validate the uniqueness of the three factors. This additional construct was risk propensity— the degree to which organizational leaders were likely to take risks. There were three questionnaire items that measured the risk propensity of organizational leaders. The Cronbach alpha for risk propensity was 0.78. Typically, the lower the score on the questionnaire items that were designed to measure strategy, the more that strategy is being pursued. Conversely, the higher the score on the items that measured risk propensity, the more the leader was considered a risk taker. Correlation analysis (Table 22) between each of the strategies and risk provided same support for the uniqueness of the strategy
154
Reproduced with perm ission o f the copyright owner. Further reproduction prohibited w ithou t permission.

TABLE 22
CORRELATION BETWEEN RISK PROPENSITY AND
RISK GSTRAT SSTRAT
RISK 1.00 -0.26*** 0.15*
GSTRAT 1.00 0.08
SSTRAT 1.00
HISTRAT
*p <.10***p <.01
STRATEGY TYPES
HISTRAT
- 0.01
-0.09
0.21***
1.00
Reproduced with perm ission o f the copyright owner. Further reproduction prohibited w ithout permission.

types. There was negative and significant correlation between "growth" or Type I strategy and risk— suggesting that risk takers may be more likely to pursue a growth strategy. The correlation between the "stabilize" or Type II strategy and risk was positive and marginally significant. Therefore, risk averse leaders may be more likely to pursue a "stabilize" or Type II strategy. The correlation between risk and "harvest-tumaround" or Types III and IV strategies was near zero. These findings between risk and strategy types are generally consistent with those of other researchers (e.g. Herbert & Deresky, 1987b). In addition, all the analyses in the pilot study that included strategy were more complex in the main study because three continuous types rather than three categorical descriptions were used to measure strategy.
Leadership styleA factor analysis on the set of questionnaire items that
were designed to measure the task- and people-orientations of leaders yielded three factors. The factors were easily interpreted because six of the seven items that were designed to measure task-orientation loaded on factor 1 (Table 23).Similarly, five of the seven items that were designed to measure people-orientation loaded on factor 2. In light of the factor loadings, factors 1 and 2 were called task- and people- orientations respectively. The Cronbach alpha for task-
156
Reproduced with perm ission o f the copyright owner. Further reproduction prohibited w ithout permission.

TABLE 23
FACTOR ANALYSIS OF LEADERSHIP STYLE SCALE ITEMS
ITEM FACTOR 1 FACTOR 2 FACTOR 3
Knowledge of task expectations 0.73* 0.11 0.00
Trial of leader's new ideas 0.63* -0.05 0.11
Leader decides course of action 0.27 -0.23 0.71*Specificity of task assignments 0.53* 0.21 0.33Understanding of leader's role 0 .66* 0.17 -0.14Extent of detail in work schedules 0.73* 0.09 0.07The role of policies and procedures 0.69* -0.04 -0.04Expression of gratitude 0.22 0.60* -0.08Use of congregation's ideas -0.03 0.82* 0.01
Input of members in decision-making 0.02 0.70* -0.18Information about impending changes 0.17 0.44 -0.44Concern for members' welfare 0.23 0.53* -0.32Changes based on member's input -0.04 0.80* -0.09Authoritative decision-making 0.00 -0.11 0.76*
* items included in defining the factors
Factor1: Task-orientation Factor2: People-orientation
157
Reproduced with perm ission o f the copyright owner. Further reproduction prohibited w ithout permission.

orientation was 0.76 and 0.77 for people-orientation. Even though factor 3 had three items, it was eliminated from further consideration because there was a change in the direction of the "scree" plot after the first two factors. The correlation between task-orientation and people-orientation was not significant.
Value orientationUnlike the preceding analyses, two factor analytic
procedures were performed separately on the items that measured the two types of values (i.e. human welfare and business affairs). Both types of values yielded two factors each (Tables 24 & 25). Further examination suggested that each pair of factors measured the same construct. No unique characteristics were observable for the items in the two factors for each of the business affairs and human welfare values. The correlation (Table 26) between the two factors for business affairs value was positive and significant (p <.001). Similarly, the correlation (Table 27) between the pair of factors for human welfare values was positive and significant (p c.Ol). Consequently, the two factors that were generated for each type of value resulted in one human welfare and one business affairs values. Rather than having one value orientation measure— as was the case in the pilot study— two measures were used in the main study because the correlation between the two types of values was not significant.
158
Reproduced with perm ission o f the copyright owner. Further reproduction prohibited w ithou t permission.

TABLE 24
FACTOR ANALYSIS OF BUSINESS AFFAIRS VALUES SCALE ITEMS
ITEM FACTOR 1 FACTOR
Impact of business on elections 0.67* 0.15Fairness of tax laws 0.70* 0.25Corporations and the poor 0.75* 0.11
Taxes and the wealthy 0.73* 0.15The role of regulatory agencies 0.19 0.69*Government protection of the poor 0.53* 0.53*Advertising and product demand 0.49* 0.36Medical care supply 0.35 0.51*Executives' liability for products 0.13 0.76*Companies and social responsibility 0.16 0.70*Industrialization and quality of life 0.14 0.64*
* items included in defining the factors
Factorl: Business affairs values #1 (BVALUE 1) Factor2: Business affairs values #2 (BVALUE 2)
Reproduced with perm ission o f the copyright owner. Further reproduction prohibited w ithout permission.

TABLE 25
FACTOR ANALYSIS OF HUMAN WELFARE VALUES SCALE ITEMS
ITEM FACTOR 1 FACTOR !
Government programs support laziness 0.44 0.40Children of interracial marriages 0.07 0.56*Role of protestors and radicals 0.30 -0.61*Discipline and juvenile delinquency 0.64* 0.11
Role of radical authority figures 0.55* 0.30Hiring of a suspected homosexual 0.39 0.52*labor unions and strike 0.16 0.58*Blacks and discrimination -0.58* -0.08Voluntary affirmative action programs -0 .66* 0.20
* items included in defining the factors
Factorl: Human welfare values #1 (HVALUE 1) Factor2: Human welfare values #2 (HVALUE 2)
160
Reproduced with perm ission o f the copyright owner. Further reproduction prohibited w ithou t permission.

CORRELATION
BVALUE 1
BVALUE 2
* * ★ P <
TABLE 26
BETWEEN THE TWO BUSINESS AFFAIRS VALUES
BVALUE 1 BVALUE 2
1.00 0.48***
1.00
:. 01
161
Reproduced with perm ission o f the copyright owner. Further reproduction prohibited w ithout permission.

TABLE 27
CORRELATION BETWEEN THE TWO HUMAN WELFARE VALUES
HVALUE 1 HVALUE 2
HVALUE 1 1.00 0.24***
HVALUE 2 1.00
*** p <.01
162
Reproduced with perm ission o f the copyright owner. Further reproduction prohibited w ithou t permission.

Locus of controlHie feedback that was received from the respondents to the
twenty-three item Potter's (1966) scale to measure locus of control, indicated that these questionnaire items created some problems for the subjects. As a group, these items had the most missing values such that only 133 of the 169 responses could be used. Hie 36 missing values (21 percent of the responses) is the highest for any grouping of items on the questionnaire. A factor analysis of the 23 items yielded 9 factors. Other researchers have found the Rotter's scale to yield as many as 10 factors which could perhaps make the validity of this instrument questionable (e.g. Bass, 1991; Mclnish & Lee, 1987). Hie "scree" plot indicated that the first two factors were the strongest (Table 28). Even though the second factor had two questionnaire items, it did not meet the "scree plot" criteria for inclusion in this study. Furthermore, the correlation between the first two factors was not significant. Consequently, only the four items that loaded on factor 1 were used to measure locus of control in the main study. Because of the dichotomous nature of the locus of control items, the approach suggested by Kuder and Richardson (1937)— the equivalent of Cronbach alpha for categorical data— was used to estimate the reliability coefficient for this variable. Hie reliability coefficient for locus of control was 0.62.
163
Reproduced with perm ission o f the copyright owner. Further reproduction prohibited w ithou t permission.

TABLE 28
FACTOR ANALYSIS OF LOCUS OF CONTROL SCALE ITEMS
ITEM FACT0R1 FACT0R2 FACT0R3 FACTOR!Source of misfortunes 0.21 0.00 -0.01 -0.12Reasons for wars 0.04 -0.09 0.05 0.03Respect for individuals 0.09 0.11 -0.03 0.05Students and their grades -0.11 0.09 -0.01 0.09Effective leadership -0.01 0.70* -0.08 0.21Likability 0.07 0.25 0.08 0.13Destiny -0.01 0.07 0.09 0.75*Students and examinations -0.01 -0.22 0.14 0.59*Becoming a success 0.65* -0.01 -0.02 0.16Influence of individuals 0.62* 0.00 0.29 0.11Planning and success -0.01 0.22 0.75* 0.20Hard work and success 0.35 0.03 0.61* -0.20Getting to the top 0.34 0.13 -0.23 0.63*Controlling world events 0.53* -0.05 0.25 0.21Accidental happenings 0.08 -0.03 0.04 0.11Friendships/Relationships -0.07 0.46 0.25 -0.12Equity of good and evil -0.03 0.27 0.14 0.22Politics and corruption 0.72* 0.10 -0.01 -0.17Hard work and grades -0.05 0.22 -0.67* -0.03Control over one's life -0.10 -0.13 0.12 0.09Friendliness/Likability 0.10 0.76* 0.09 -0.16Acts and consequences -0.04 0.40 -0.10 -0.13Government/Electorate 0.17 0.01 0.01 0.03
* items included in defining the factors
Reproduced with perm ission o f the copyright owner. Further reproduction prohibited w ithout permission.

TABLE 28 (CONTD.)
FACTORS FACT0R6 FACIDR7 FACIOR8 FACIOR90.14 0.17 0.70* 0.01 -0.18-0.09 0.00 -0.03 0.10 0 .88*-0.01 0.71* -0.08 0.13 -0.090.08 0.77* 0.14 0.00 0.070.00 0.11 0.02 0.06 -0.08-0.02 0.34 -0.45 0.02 -0.010.29 -0.01 -0.05 0.06 0.21-0.20 0.16 -0.11 0.14 -0.220.24 0.14 0.22 -0.11 -0.00-0.21 -0.00 0.13 0.41 -0.04-0.06 -0.18 -0.07 0.19 -0.030.05 -0.10 0.20 0.16 0.010.03 0.15 0.23 -0.07 -0.04-0.12 0.09 -0.00 0.19 -0.280.79* 0.02 0.19 0.01 -0.18-0.41 0.15 -0.09 -0.07 -0.15-0.03 -0.00 0.69* 0.14 0.150.04 -0.21 -0.16 0.04 0.24-0.01 -0.36 -0.01 0.26 -0.110.48 0.15 0.02 0.61* -0.070.06 0.06 0.12 -0.10 0.030.56* 0.09 -0.30 0.06 0.13-0.01 0.06 0.06 0.81* 0.14
* items included in defining the factors
165
Reproduced with perm ission o f the copyright owner. Further reproduction prohibited w ithout permission.

Summary
The reliability estimates for the measurement scales were calculated and reported in the preceding sections. The factor analytic and Cronbach alpha approaches were used for all the continuous variables/constructs while Kuder-Richardson's (or KR-20) coefficient was used for the locus of control scale. The reliability estimates ranged from a lew of 0.52 for 'growth' strategy to a high of 0.81 for environmental uncertainty. Once the reliability estimates have been reported, the tests of the hypotheses can be undertaken and are reported in the following section.
Hypotheses
The results pertaining to the four hypotheses in this study were based on the analyses of the relationships between the independent and dependent variables. The first three hypotheses were analyzed using moderated regression analysis. An "F" test was used to determine significant regression models in this study because it allows for non-normal or asymmetrical distributions in the scores of variables. The fourth and configuration hypothesis was based on profile deviation or pattern analysis. For all analyses, the approaches used by Schoonhoven (1981) and Drazin and Van de Ven (1985) were adopted. The dependent variables are:
166
Reproduced with perm ission o f the copyright owner. Further reproduction prohibited w ithout permission.

residential membership, nonresidential membership, average Sunday school attendance, and financial receipts. These dependent variables are measures of organizational grcwth over a four-year period. Based on the factor analytic procedures that were discussed in the preceding section, there were nine independent variables/constructs in the main study: the three types of strategy, environmental uncertainty, task- and people-orientations, human welfare and business affairs values, and locus of control.
Hypothesis 1It was predicted that in high uncertainty environments,
organizations will attain relatively superior levels of performance when the leaders are: (1) liberals in business affairs and human welfare values, (2) hi i in task- and people- orientations, and (3) internals with regard to locus of control. This hypothesis, in conjunction with hypotheses 2 and 3 are based on interactions between the variables of interest. The discussions in the previous chapter indicated that subgroup or moderated regression analysis could be used to test this hypothesis. Moderated regression analysis was used in the main study in consonance with Schoonhoven's (1981) study. In using moderated regression analysis, hypothesis 1 can be alternatively stated as suggesting that in environments with high levels of uncertainty, business affairs and human welfare values and task-
167
Reproduced with perm ission o f the copyright owner. Further reproduction prohibited w ithout permission.
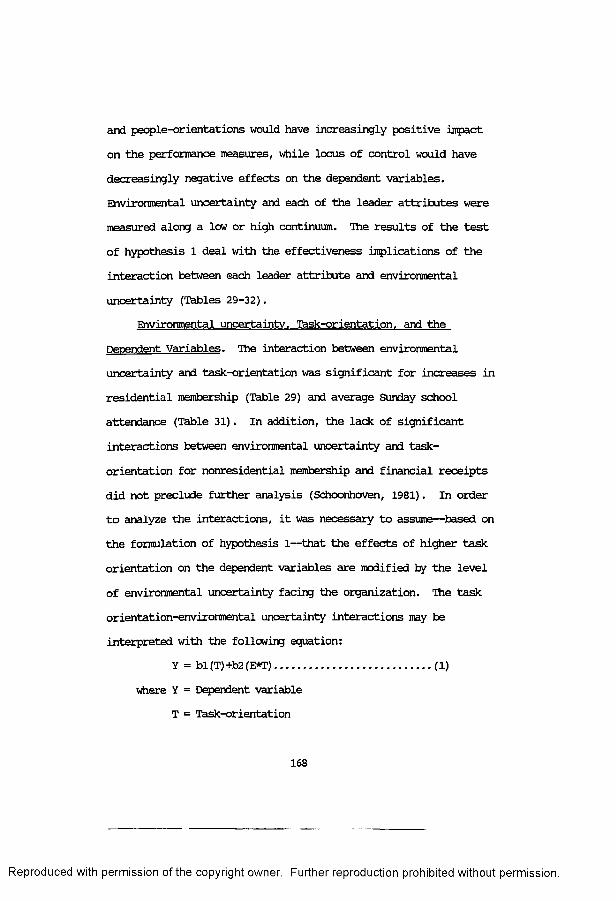
and people-orientations would have increasingly positive impact on the performance measures, while locus of control would have decreasingly negative effects on the dependent variables. Environmental uncertainty and each of the leader attributes were measured along a low or high continuum. The results of the test of hypothesis 1 deal with the effectiveness implications of the interaction between each leader attribute and environmental uncertainty (Tables 29-32).
Environmental uncertainty. Task-orientation. and the Dependent Variables. The interaction between environmental uncertainty and task-orientation was significant for increases in residential membership (Table 29) and average Sunday school attendance (Table 31). In addition, the lack of significant interactions between environmental uncertainty and task- orientation for nonresidential membership and financial receipts did not preclude further analysis (Schoonhoven, 1981). In order to analyze the interactions, it was necessary to assume— based on the formulation of hypothesis 1— that the effects of higher task orientation on the dependent variables are modified by the level of environmental uncertainty facing the organization. The task orientation-environmental uncertainty interactions may be interpreted with the following equation:
Y = bl (T) +b2 (E*T).....................(1)where Y = Dependent variable
T = Task-orientation
168
Reproduced w ith perm ission o f the copyright owner. Further reproduction prohibited w ithout permission.

TABLE 29
LEADER ATTRIBUTES, ENVIRONMENTAL UNCERTAINTY, ANDRESIDENTIAL MEMBERSHIP
DEPENDENT VARIABLE: Residential membershipSource DF Sum of squares Mean sauarp. F valueModel 11 12673.33 1152.12 2.16**Error 126 67090.83 532.47R-square: 0.16
Parameter EstimateEnvironmental Uncertainty (EU) 2.45Task-orientation (TO) 6.73***People-orientation (PO) -4.81Business affairs values (BV) -0.08Human welfare values (HV) 1.74Locus of control (LC) -10.77(EU) * (TO) -0.25**(EU) *(PO) 0.12(EU) * (BV) -0.01(EU) * (HV) -0.04(EU)*(LC) 0.43
**p <.05***p <.01
Reproduced with perm ission o f the copyright owner. Further reproduction prohibited w ithout permission.

TABLE 30
LEADER ATTRIBUTES, ENVIRONMENTAL UNCERTAINTY, ANDNONRESIDENTIAL MEMBERSHIP
DEPENDENT VARIABLE: Nonresidential membershipSource DF Sum of sauares Mean square F valueModel 11 1696.19 154.20 1.13Error 126 17186.69 136.40R-square: 0.09
Parameter EstimateEnvironmental Uncertainty (EU) 2.10Task-orientation (TO) -1.31People-orientation (PO) 4.19**Business affairs values (BV) -0.14Human welfare values (HV) 0.29Locus of control (LC) 1.22(EU)*(TO) 0.07**(EU) * (PO) -0.15(EU) * (BV) 0.01(EU) * (HV) -0.01(EU) *(LC) -0.03
**p <.05
170
Reproduced with perm ission o f the copyright owner. Further reproduction prohibited w ithout permission.

TABLE 31
LEADER ATTRIBUTES, ENVIRONMENTAL UNCERTAINTY, AND AVERAGE SUNDAY SCHOOL ATTENDANCE
DEPENDENT VARIABLE: Average Sunday school attendanceSource DF Sum of sauares Mean square F valueModel 11 15676.11 1425.10 2.30**Error 126 78105.00 619.88R-square: 0.17
Parameter EstimateEnvironmental Uncertainty (EU) 0.82Task-orientation (TO) 7 .7 4***People-orientation (PO) -4.52Business affairs values (BV) -1.52Human welfare values (HV) -0.14Locus of control (LC) -19.66**(EU)*(T0) -0.34***(EU)*(P0) 0.13(EU) * (BV) 0.04(EU)*(HV) 0.03(EU)*(LC) 0.77**
**p <.01 ***p <.05
171
Reproduced with perm ission o f the copyright owner. Further reproduction prohibited w ithout permission.

TABLE 32
LEADER ATTRIBUTES, ENVIRONMENTAL UNCERTAINTY, ANDFINANCIAL RECEIPTS
DEPENDENT VARIABLE: Financial receiptsSource DF Sum of sauares Mean square F valueModel 11 6680.32 607.30 0.90Error 126 85283.35 676.85R-square: 0.07
Parameter EstimateEnvironmental Uncertainty (EU) 1.61Task-orientation (TO) 1.97People-orientation (P0) -0.96Business affairs values (BV) -1.57Human welfare values (HV) 1.39Locus of control (LC) -11.27(EU)*(TO) -0.14(EU) *(P0) 0.04(EU)*(BV) 0.05(EU)*(HV) -0.05(EU)*(LC) 0.42
172
Reproduced with perm ission o f the copyright owner. Further reproduction prohibited w ithout permission.

E = Environmental uncertainty bl = main effect of task-orientation b2 = interaction effect of uncertainty-task orientation
To determine whether the effects of task-orientation on the dependent variables are monotonic or nonmonotonic over the range of environmental uncertainty, a derivative and the solution of equation 1 for environmental uncertainty yields:
dY/dT = bl+b2 (E)..................... (2)If equation 2 is solved for E— to determine the points at which environmental uncertainty does not modify the effect of task- orientation on the dependent variables— the result is:
E = -bl/b2.......................... (3)The values for bl and b2 from Tables 29-32 are substituted into equation 3 for each of the dependent variables. If the calculated value for environmental uncertainty is within the range observed in this study's sample, it can be concluded that task-orientation has a nonmonotonic effect on the dependent variable over the range of environmental uncertainty.Nonmonotonic (as opposed to monotonic) effect means that task- orientation has some positive and some negative effects on the dependent variable. Different values of environmental uncertainty can be substituted into equation 2 to determine the range where the positive and negative effects of task-orientation exist over the range of uncertainty. Environmental uncertainty ranged from
173
Reproduced with perm ission o f the copyright owner. Further reproduction prohibited w ithout permission.

10 to 45 in the main study, with a mean of 23.82 and a standard deviation of 6.17.
The effect, of task-orientation on residential membership was significant (p <. 05) and nonmonotonic over the range of environmental uncertainty. The impact of task-orientation on residential membership was positive (negative) for environmental uncertainty scores below (above) 26.92 (-6.73/-0.25). Therefore, the direction of the effect of task-orientation on residential membership over the range of environmental uncertainty contradicts what was expected from the formulation of hypothesis 1— task-orientation had positive effects on residential membership when environmental uncertainty was low.
The interaction of task-orientation and environmental uncertainty on nonresidential membership was similar to that observed for residential membership in that the effect of task- orientation on nonresidential membership was also nonmonotonic over the range of environmental uncertainty in this study.Unlike the case for residential membership, task-orientation had a positive (negative) impact on nonresidential membership for environmental uncertainty scores above (below) 18.71 (or 1.31/0.07). In other words, when environmental uncertainty was lew (i.e. less than 18.71), task-orientation had a negative effect on nonresidential membership. Conversely, when environmental uncertainty was high— greater than 18.71— task- orientation had a positive impact on nonresidential membership.
174
Reproduced w ith perm ission o f the copyright owner. Further reproduction prohibited w ithout permission.

In effect, the positive inpact of task-orientation on nonresidential membership increased as environmental uncertainty increased. Since the interaction term between environmental uncertainty and task-orientation was not significant for nonresidential membership, all that can be said at this junction is that the relationship was in the expected direction.
The effect of task-orientation on average Sunday school attendance was significant (p <.0l), nonmonotonic, and in the same direction as what was observed for residential membership. The inpact of task-orientation on average Sunday school attendance was positive and negative for values of environmental uncertainty that were belcw 22.76 and higher than 22.76 respectively. Therefore, in an environment with a high degree of uncertainty, task-orientation had a negative inpact on average Sunday school attendance.
The inpact of the interaction between task-orientation and environmental uncertainty on financial receipts, except for not being significant, was similar to that observed for average Sunday school attendance. The effect of task-orientation on financial receipts decreased as environmental uncertainty increased. In fact, the point at which environmental uncertainty did not modify the impact of task-orientation on financial receipts was 14.07. At values of environmental uncertainty above (belcw) 14.07, task-orientation had a negative (positive) inpact on financial receipts. Therefore, the results of the analysis of
175
Reproduced with perm ission o f the copyright owner. Further reproduction prohibited w ithout permission.

the task orientation-environmental uncertainty interaction on financial receipts were not consistent with the direction suggested by the formulation of hypothesis 1.
In summary, there is a general lack of support for the portion of hypothesis 1 regarding the interaction between task-orientation, environmental uncertainty, and effectiveness. The direction of the relationship that is suggested by the task orientation-environmental uncertainty interaction was only slightly observed, based only on direction, for one of the four dependent variables— nonresidential membership. Generally, and inconsistent with the original formulation of hypothesis 1, high task-orientation appeared to be ineffective in high uncertainty environments. In effect, high task-orientation appeared to be effective in environments with low levels of uncertainty.
Environmental uncertainty. People-orientation. and the Dependent Variables. The impact of the interaction between people-orientation and environmental uncertainty was similar to those observed for -task-orientation. The interaction between environmental uncertainty and people-orientation was only significant for nonresidential membership (Table 30). In order to analyze the interactions, it was necessary to assume— based on the formulation of hypothesis 1— that the effects of people- orientation on the dependent variables are modified by the level of environmental uncertainty facing the organization. The people orientation-environmental uncertainty interactions may be
176
Reproduced with perm ission o f the copyright owner. Further reproduction prohibited w ithout permission.

interpreted with the following equation: Y = b3(P)+b4(E*P)........ (4)
where Y = Dependent variable P = People-orientation E = Environmental uncertainty b3 = main effect of people-orientation b4 = interaction of uncertainty-people orientation
This means that the effect of people-orientation on the dependent variables is modified by the level of uncertainty in the environment. To determine whether the effects of people- orientation on the dependent variables are monotonic or nonmonotonic over the range of environmental uncertainty, a derivative and the solution of equation 4 for environmental uncertainty yields:
If equation 5 is solved for E— to determine the point at which environmental uncertainty does not modify the effect of people- orientation on the dependent variables— the result is:
The values for b3 and b4 from Tables 29-32 are substituted into equation 6 for each of the dependent variables. If the calculated value for environmental uncertainty is within the range observed in this study's sanple, it can be concluded that people-orientation has a nonmonotonic effect on the dependent variable over the range of environmental uncertainty.
dY/dP = b3+b4(E) (5)
E = -b3/b4 (6)
177
Reproduced w ith perm ission o f the copyright owner. Further reproduction prohibited w ithout permission.

Nonmonotonic (as opposed to monotonic) effect means that people- orientation has sane positive and sane negative effects on the dependent variables. Different values of environmental uncertainty can be substituted into equation 5 to determine the range where the positive and negative effects of people- orientation exist over the range of uncertainty.
The effect of people-orientation on residential membership was not significant (Table 29). The analysis of the interaction term indicated that the effect of environmental uncertainty on the relationship between people-orientation and residential membership was nonmonotonic over the range of environmental uncertainty. When environmental uncertainty scores were extremely high (40.08 and higher), the modifying effect of environmental uncertainty on the relationship between people- orientation and residential membership was positive. For environmental uncertainty scores belcw 40.08, the effect on residential membership was negative. In other words, people- orientation led to higher effectiveness as environmental uncertainty increased, or a leader's people-orientation had a positive inpact on residential membership in high uncertainty environments. This finding is consistent with what was expected— based on the formulation of hypothesis 1.
The effect of people-orientation on nonresidential membership was significant (p <.05) and nonmonotonic over the range of environmental uncertainty. The modifying effect of
178
Reproduced with perm ission o f the copyright owner. Further reproduction prohibited w ithout permission.

environmental uncertainty on the relationship between people- orientation and nonresidential membership decreased over the range of uncertainty— high people-orientation in an environment that was high in uncertainty (scores of 27.93 or higher) had a negative effect on nonresidential membership. Therefore, it appears as if the part of hypothesis 1 that dealt with the interaction between people-orientation, environmental uncertainty, and nonresidential membership was not supported because of the direction of the effect of people-orientation on nonresidential membership over the range of environmental uncertainty. Contrary to what one would expect from the formulation of hypothesis 1, people-orientation had an increasingly negative inpact on nonresidential membership as environmental uncertainty increased.
The interaction of people-orientation and environmental uncertainty on average Sunday school attendance was similar to that observed for residential membership. The effect of people- orientation on average Sunday school attendance was also nonmonotonic but not significant over the range of environmental uncertainty. This indicates that people-orientation had a positive as well as a negative effect on average Sunday school attendance, depending on the level of environmental uncertainty. When environmental uncertainty was lew (i.e. less than 34.76), people-orientation had a negative effect on average Sunday school attendance. Conversely, when environmental uncertainty was
179
Reproduced with perm ission o f the copyright owner. Further reproduction prohibited w ithout permission.

high— greater than 34.76— people-orientation had a positive inpact on average Sunday school attendance. In effect, the positive inpact of people-orientation on average Sunday school attendance increased as environmental uncertainty increased.This finding was consistent with what was expected from the test of hypothesis 1.
The effect of people-orientation on financial receipts was also nonmonotonic and not significant over the range of environmental uncertainty. The inpact of people-orientation on financial receipts was positive (negative) for values of environmental uncertainty that were above (below) 22.83. In other words, in an environment with a high degree of uncertainty, people-orientation had a positive inpact on financial receipts. Conversely, for values of environmental uncertainty below 22.83, people-orientation had a negative effect on financial receipts. Again, this finding is consistent with the formulation of hypothesis 1.
In summary, there is general but tentative support for the portion of hypothesis 1 that suggests that the interaction between people-orientation and environmental uncertainty may lead to increased effectiveness. In other words, the direction of the relationship that is suggested by the people orientation- environmental uncertainty interaction was as expected for all the dependent variables except nonresidential membership. Therefore, consistent with the original formulation of hypothesis 1, high
180
Reproduced with perm ission o f the copyright owner. Further reproduction prohibited w ithout permission.

people-orientation appeared to lsad to increased effectiveness for most of the dependent variable measures in environments with high levels of uncertainty.
Environmental uncertainty. Business affairs values, and the Dependent Variables. The impact of the interactions between business affairs values (BAV) and environmental uncertainty was not significant for any of the dependent variables even though three of the four were in the expected direction. The analyses of the interaction terms were nonmonotonic for all the dependent variables except residential membership. The lack of significant interactions between environmental uncertainty and BAV did not preclude further analysis as suggested by Schoonhoven (1981). In order to analyze the interactions, it was assumed that the effect of higher BAV on the dependent variables is modified by the level of environmental uncertainty (EU). The BAV-EU interaction may be interpreted as:
Y = b5(B)+b6(E*B).....................(7)where Y = Dependent variable
B = Business affairs values (BAV)E = Environmental uncertainty (EU) b5 = main effect of business affairs values b6 = interaction effect of BAV and EU on Y
This means that the effect of BAV on the dependent variables is modified by the level of uncertainty in the environment. To determine whether the effects of BAV on the dependent variables
181
Reproduced with perm ission o f the copyright owner. Further reproduction prohibited w ithou t permission.

are monotonic or nonmonotonic over the range of environmental uncertainty, a derivative and the solution of equation 7 for environmental uncertainty yields:
dY/dB = b5+b6(E)......... :........... (8)If equation 8 is solved for E— to determine the point at which environmental uncertainty does not modify the effect of BAV on the dependent variables— the result is:
E = -b5/b6.......................... (9)The values for b5 and b6 from Tables 29-32 are substituted into equation 9 for each of the dependent variables. If the calculated value for environmental uncertainty is within the range observed in this study's sample, it can be tentatively suggested that BAV has a nonmonotonic effect on the dependent variable over the range of environmental uncertainty. Different values of environmental uncertainty can be substituted into equation 8 to determine the range where the positive and negative effects of BAV exist over the range of uncertainty.
The effect of BAV on residential membership was not significant (Table 29). The analysis of the interaction term indicated that the effect of environmental uncertainty on the relationship between BAV and residential membership was monotonic over the range of environmental uncertainty. In fact, BAV led to lcwer levels of effectiveness as environmental uncertainty increased such that the higher the environmental uncertainty, the higher the negative impact of BAV on residential membership. The
182
Reproduced with perm ission o f the copyright owner. Further reproduction prohibited w ithout permission.

monotonic interaction means that BAV had only negative effects on residential membership over the range of uncertainty. Therefore, it appears as if the part of hypothesis 1 concerning the interaction between BAV, environmental uncertainty, and effectiveness measures did not receive statistical or directional support for residential membership.
The effects of BAV on nonresidential membership, average Sunday school attendance, and financial receipts were not significant. The effect of environmental uncertainty on the relationship between BAV and these three dependent variables increased over the range of uncertainty. The effects of BAV were increasingly positive on nonresidential membership, average Sunday school attendance, and financial receipts when environmental uncertainty scores were higher than 11.39, 34.2, and 32.13 respectively. Conversely, at values of environmental uncertainty below those specified, BAV had hi ier negative effects on these dependent variables. Therefore, the part of hypothesis 1 pertaining to the interaction between BAV, environmental uncertainty, and effectiveness appears to have received tentative directional support in this study for all the dependent variables except residential membership. In other words, and consistent with the formulation of hypothesis 1, liberal business affairs values appear to be associated with higher effectiveness in environments with high levels of uncertainty.
183
Reproduced with perm ission o f the copyright owner. Further reproduction prohibited w ithout permission.

Environmental uncertainty. Human welfare values, andDependent Variables. The interaction between environmental uncertainty and human welfare values (HWV) was not significant for any of the dependent variables (Tables 29-32). The directions and pattern of these interactions were similar to those for task-orientation and environmental uncertainty (EU) because they were mostly opposite to what was hypothesized. In order to analyze the interactions, it was assumed that the effects of HWV on the dependent variables were modified by the level of environmental uncertainty. The HWV-EU interaction may be interpreted with the following equation:
Y = b7(H)+b8(E*H).....................(10)where Y = Dependent variable
H = Human welfare values (HWV)E = Environmental uncertainty (EU) b7 = main effect of human welfare values b8 = interaction effect of HWV and EU on Y
This equation can be interpreted to mean that the effects of HWV on the dependent variables are modified by the level of uncertainty in the environment. To determine whether the effects of HWV on the dependent variables are monotonic or nonmonotonic over the range of environmental uncertainty, a derivative and the solution of equation 10 for environmental uncertainty yields:
dY/dH = b7+b8 (E)..................... (11)If equation 11 is solved for E— to determine the point at which
184
Reproduced with perm ission o f the copyright owner. Further reproduction prohibited w ithou t permission.

environmental uncertainty dees not modify the effect of HWV on the dependent variables— the result is:
E = -b7/b8.......................... (12)The values for b7 and b8 from Tables 29-32 are substituted into equation 12 for each of the dependent variables. If the calculated value for environmental uncertainty is within the range observed in this study, it can be concluded that HWV has a nonmonotonic effect on the dependent variable over the range of environmental uncertainty. Different values of environmental uncertainty can be substituted into equation 12 to determine the range where the positive and negative effects of HWV exist over the range of uncertainty.
The effects of HWV though nonmonotonic was not significant over the range of environmental uncertainty for nonresidential membership and financial receipts. The irpact of HWV was positive (negative) for environmental uncertainty scores belcw (above) 23.11 for nonresidential membership and 27.8 for financial receipts. Therefore, the direction of the effect of HWV on nonresidential membership and financial receipts over the range of environmental uncertainty contradicted what was expected from the formulation of hypothesis 1. In effect, contrary to expectations, liberal human welfare values appeared to have an increasingly negative inpact on nonresidential membership and financial receipts as environmental uncertainty increased.
The interaction of HWV and environmental uncertainty on
185
Reproduced with perm ission o f the copyright owner. Further reproduction prohibited w ithout permission.

residential membership was similar to that observed for nonresidential membership and financial receipts except that it was a monotonic effect. The interaction of HWV and environmental uncertainty only had positive effects "on residential membership over the range of the environmental uncertainty. The positive effects of HWV on residential membership decreased as environmental uncertainty increased. In short, the interaction term between environmental uncertainty and HWV was neither significant nor was it in the expected direction for residential membership.
The effect of HWV on average Sunday school attendance was monotonic over the range of environmental uncertainty. The impact of HWV on average Sunday school attendance was positive and increasing throughout. In other words, as environmental uncertainty increased, the positive impact of HWV on average Sunday school attendance also increased. The result of the analysis of the HWV-environmental uncertainty interaction on average Sunday school attendance was consistent with the direction suggested by the formulation of hypothesis 1. In other words, liberal human welfare values could be associated with increases in average Sunday school attendance as environmental uncertainty increased.
In summary, there was a general lack of support for the portion of hypothesis 1 where the interaction between human welfare values and environmental uncertainty was expected to lead
186
Reproduced with perm ission o f the copyright owner. Further reproduction prohibited w ithou t permission.

to increased effectiveness. The direction of the relationship that was suggested by the human welfare values-environmental uncertainty interaction was generally not observed for any of the dependent variables except average Sunday school attendance. Contrary to the formulation of hypothesis 1, liberal human welfare values had increasingly positive effects on most of the dependent variables as environmental uncertainty decreased. In other words, as environmental uncertainty increased, the negative impact of liberal human welfare values on most of the performance measures appeared to also increase.
Environmental uncertainty. Locus of control, and Dependent Variables. The effects of the interactions between locus of control and environmental uncertainty were not significant for any of the dependent variables except average Sunday school attendance. Again, in order to analyze the interaction, it was assumed that the effect of locus of control on the dependent variables is modified by the level of environmental uncertainty. The locus of control-environmental uncertainty interaction may be interpreted with the following equation:
Y = b9(L)+blO(E*L)..................... (13)where Y = Dependent variable
L = Locus of control (L)E = Environmental uncertainty (EU) b9 = main effect of locus of control blO = interaction of L-EU on the dependent variables
187
Reproduced with perm ission o f the copyright owner. Further reproduction prohibited w ithou t permission.

This means that the effect of locus of control on the dependent variables is modified by the level of uncertainty in the environment. To determine whether the effects of locus of control on the dependent variables are monotonic or nonmonotonic over the range of environmental uncertainty, a derivative and the solution of equation 13 for environmental uncertainty yields:
dY/dL = b9+bl0 (E)..................... (14)If equation 14 is solved for E— to determine the point at which environmental uncertainty does not modify the effect of locus of control on the dependent variables— the result is:
E = -b9/bl0.......................... (15)The values for b9 and bio from Tables 29-32 are substituted into equation 15 for each of the dependent variables. If the calculated value for environmental uncertainty is within the range observed in this study's sample, it can be concluded that locus of control has a nonmonotonic effect on the dependent variable over the range of environmental uncertainty. Different values of environmental uncertainty can be substituted into equation 14 to determine the range where the positive and negative effects of locus of control exist over the range of uncertainty.
Because of the hypothesized indirect relationships between the dependent variables and locus of control scale, the interpretation of the interaction terms had to be reversed. Consequently, the following discussions are based on the
188
Reproduced with perm ission o f the copyright owner. Further reproduction prohibited w ithout permission.

necessary adjustments that have been made in order to accurately explain the interactions. Hie effects of locus of control on residential membership, average Sunday school attendance, and financial receipts were all in the same direction (Table 29, 31,& 32). The analysis of the interaction terms indicated that the modifying effects of environmental uncertainty on the relationships between locus of control and these three dependent variables were nonmonotonic over the range of environmental uncertainty. When environmental uncertainty scores were higher than 24.84, 25.6, and 26.72 for residential membership, average Sunday school attendance, and financial receipts respectively, the effects of locus of control on these dependent variables were increasingly negative. For environmental uncertainty scores below these values, the effect of locus of control on residential membership, average Sunday school attendance, and financial receipts were increasingly positive. In other words, external locus of control led to higher effectiveness as environmental uncertainty increased— this is inconsistent with the formulation of hypothesis 1 concerning the interaction between locus of control, environmental uncertainty, and effectiveness measures. Nevertheless, the interaction between locus of control and environmental uncertainty was significant (p <.05) for average Sunday school attendance (Table 31).
The effect of locus of control on nonresidential membership was not significant but was monotonic over the range of
189
Reproduced with perm ission o f the copyright owner. Further reproduction prohibited w ithout permission.

environmental uncertainty. The modifying effect of environmental uncertainty on the relationship between locus of control and nonresidential membership increased over the range of uncertainty. The monotonic effect of the interaction between environmental uncertainty meant that as environmental uncertainty increased, the positive impact of internal locus on control on nonresidential membership also increased.
In summary, there was a general lack of support for the portion of hypothesis 1 pertaining to the performance implications of the interaction between locus of control and environmental uncertainty. The relationship that one would expect from the locus of control-environmental uncertainty interaction was not in the expected direction for all the dependent variables except nonresidential membership. In other words, external locus of control was associated with increased effectiveness for most of the dependent variables.
ConclusionOverall, hypothesis 1 did not receive strong support in this
study. Only four of twenty interactions were significant. In addition, only forty-five percent of the interactions were in the hypothesized direction. Each leader attribute had four interactions— one for each dependent variable— with environmental uncertainty. The interactions of business affairs values and people-orientation with environmental uncertainty were the most
190
Reproduced with perm ission o f the copyright owner. Further reproduction prohibited w ithout permission.

consistent with the formulation of hypothesis 1— three out of each set of four interactions were in the expected direction (Table 33). There was one interaction for each of the other dependent variables that was in the hypothesized direction.
One of the main reasons why more significant interactions were not found in testing hypothesis 1 could be a lack of statistical power that resulted from insufficient sample size and/or lew effect sizes than expected. Post-hoc power analysis (Table 34) revealed that one or a combination of the following factors could have resulted in the lack of significant results: (1) the effect sizes for all the dependent variables except residential membership were not large enough, and (2) the sample size in the main study was insufficient for nonresidential membership and financial receipts. In general, only residential membership had a power level that was at least 0.90. Consequently, there was a general lack of statistical power for the analysis of hypothesis 1 and this perhaps explains why more significant interactions were not found.
Ordinarily, based on these results, this researcher could have concluded that the leader attributes in this study did not appear to have important performance implications for the organizations in this study in environments with high levels of uncertainty. In the traditional contingency-based studies, this conclusion would not have been farfetched. Fortunately, the multiple approaches to fit that have been recommended by
191
Reproduced w ith perm ission o f the copyright owner. Further reproduction prohibited w ithout permission.

TABLE 33
PERFORMANCE SUMMARY OF THE INTERACTIONS BETWEEN LEADERATTRIBUTES AND ENVIRONMENTAL UNCERTAINTY.
MODERATING VARIABLE: Environmental uncertainty
DEPENDENT VARIABLES
INDEPENDENT VARIABLES
TO PO BAV HWV LOCResidential membership no* yes no no noNonresidential membership yes no* yes no yesAverage Sunday school attendance no** yes yes yes no*Financial receipts no yes yes no no
where: TO = Task-orientation PO = People-orientation BAV = Business affairs values HWV = Human welfare values ICC = Locus of control
andyes = interaction in the hypothesized direction no = interaction in the opposite direction of hypothesis * = interaction was significant at p <.05 ** = interaction was significant at p <.01
Reproduced with perm ission o f the copyright owner. Further reproduction prohibited w ithou t permission.

TABLE 34
POWER ANALYSIS FOR THE TEST OF HYPOTHESIS 1
Source Value
Minimum effect size in pilot study 0.38Maximum effect size in pilot study 0.64Minimum effect size needed in the main study 0.34Effect sizes in main study:
Residential membership 0.40Nonresidential membership 0.30Average Sunday school attendance 0.41Financial receipts 0.27
Minimum acceptable power level 0.90Actual power found:
Residential membership 0.99Nonresidential membership 0.35Average Sunday school attendance 0.68Financial receipts -*
Minimum sample sizes needed in the main study:Residential membership 118Nonresidential membership 157Average Sunday school attendance 115Financial receipts 175
Sample size in the main study 137Significance or alpha level 0.05
-* means pcwer could not be calculated because the "meansquare error" was greater than the "mean square model"
Reproduced with perm ission o f the copyright owner. Further reproduction prohibited w ithout permission.

contemporary contingency researchers make it possible to undertake a more meaningful analysis of the importance of these leader attributes to the performance of these organizations. Suffice it to say that other researchers have had problems with the type of interaction-based analysis that was used to test hypothesis 1 (e.g. Schoonhoven, 1981). It is the potential for not uncovering meaningful relationships through the use of traditional contingency approaches that have led sane researchers like Drazin and Van de Ven (1985) to advocate the use of multiple approaches to examining fit in the management literature. Nevertheless, the analyses of the other interaction-based hypotheses follow.
Hypothesis 2It was predicted that effectiveness would be enhanced when
leaders that are: (1) liberals in business affairs and human welfare values, (2) high in task- and people-orientations, and (3) internals with regard to locus of control pursue growth strategies. This hypothesis like hypotheses 1 was based on interactions but in this case between growth strategy and the leader attributes. Hie statistical technique that was also used to analyze this interaction-based hypothesis was moderated regression analysis. The use of this statistical approach requires that the researcher specify the moderating variable (Schoonhoven, 1981). In this study, it was assumed that the
194
Reproduced with perm ission o f the copyright owner. Further reproduction prohibited w ithout permission.

impact of each of the leader attributes on the dependent variables was moderated by the extent to which a growth strategy was pursued. In addition, hypothesis 2 could be alternatively interpreted, when a moderated regression analysis approach is used, as stating that business affairs and human welfare values, locus of control, and task- and people-orientations have increasingly positive effects on performance measures the more a growth strategy is pursued. All the variables (i.e. growth strategy and leader attributes) were measured along a low or high continuum. The results of the test of hypothesis 2 dealt with the effectiveness implications of the interactions between each leader attribute and growth strategy (Tables 35-38).
The interactions between growth strategy and the leader attributes were not significant for most of the dependent variables. Only the interaction between growth strategy and pecple-orientation was marginally significant (p c.10) for financial receipts. The lack of significant interactions between growth strategy and these leader attributes did not preclude further analysis (Schoonhoven, 1981). In order to analyze the interactions, it was necessary to assume— based on the formulation of hypothesis 2— that the effect of pursuing a growth strategy on each of the dependent variables is modified by the degree to which the leader is task and people oriented, liberal in business and human welfare values, and internal with respect to locus of control.
195
Reproduced with perm ission o f the copyright owner. Further reproduction prohibited w ithout permission.

TABLE 35
LEADER ATTRIBUTE, GROWTH STRATEGY, AND RESIDENTIAL MEMBERSHIP
DEPENDENT VARIABLE: Residential membershipSource DF Sum of sauares Mean square F valueModel 11 10012.67 910.24 1.67*Error 129 70322.57 545.14R-square: 0.12
Parameter EstimateGrowth strategy (GS) 2.85Task-orientation (TO) 3.17*People-orientation (PO) -3.21Business affairs values (BV) -1.02Human welfare values (HV) 2.18Locus of control (DC) -3.29(GS)*(TO) -0.23(GS)*(P0) 0.15(GS)*(BV) 0.04(GS) * (HV) -0.12(GS)*(IC) 0.26
*p <.10
196
Reproduced with perm ission o f the copyright owner. Further reproduction prohibited w ithout permission.

TABLE 36
LEADER ATTRIBUTES, GROWTH STRATEGY, AND NONRESIDENTIAL MEMBERSHIP
DEPENDENT VARIABLE: Nonresidential membershipSource DF Sum of souares Mean souare F valueModel 11 1693.69 153.97 1.14Error 129 17464.81 135.39R-square: 0.09
Parameter EstimateGrowth strategy (GS) -6.11Task-orientation (TO) -0.67People-orientation (PO) -1.24Business affairs values (BV) 0.38Human welfare values (HV) -0.40Locus of control (LC) -2.30(GS)*(T0) 0.08(GS) *(PO) 0.18(GS) * (BV) -0.01(GS)*(HV) 0.03(GS)*(LC) 0.28
197
Reproduced with perm ission o f the copyright owner. Further reproduction prohibited w ithout permission.

TABLE 37
LEADER ATTRIBUTES, GRCWIH STRATEGY, AND AVERAGE SUNDAY SCHOOL ATTENDANCE
DEPENDENT VARIABLE: Average Sunday School AttendanceSource DF Sum of souares Mean sauare F valueModel 11 12242.75 1112.97 1.66*Error 129 86717.35 672.23R-square: 0.12
Parameter EstimateGrowth strategy (GS) 9.43Task-orientation (TO) 1.88People-orientation (PO) 1.50Business affairs values (BV) -0.41Human welfare values (HV) 2.10Locus of control (LC) -8.12(GS) *(T0) -0.22(GS) *(PO) -0.21(GS) *(BV) 0.001(GS) * (HV) -0.11(GS) *(LC) 0.57
*p <.10
198
Reproduced with perm ission o f the copyright owner. Further reproduction prohibited w ithout permission.

TABLE 38
LEADER ATTRIBUTES, GROWTH STRATEGY, AND FINANCIAL RECEIPTS
DEPENDENT VARIABLE: Financial ReceiptsSource DF Sum of sauares Mean souare F valueModel 11 8990.02 817.27 1.07Error 129 98896.55 766.64R-square: 0.08
Parameter EstimateGrowth strategy (GS) 9.06Task-orientation (TO) -2.06People-orientation (PO) 5.63Business affairs values (BV) -0.90Human welfare values (HV) 0.81Locus of control (LC) 0.68(GS) *(T0) 0.08(GS)*(PO) -0.52*(GS)*(BV) 0.03(GS)*(HV) -0.03(GS) *(LC) -0.34
* p <.10
199
Reproduced with perm ission o f the copyright owner. Further reproduction prohibited w ithou t permission.

Each leader attribute-grcwth strategy interaction may be interpreted with the following equation:
Y = bl (L) +b2 (G*L)..................... (1)where Y = Dependent variable
L = Leader attribute G = Growth strategy bl = main effect of the leader attribute b2 = interaction of the leader attribute and growth
strategyThis means that the effects of the leader attribute on each of the dependent variables are modified by the degree to which growth strategies are pursued. To determine whether the effects of the leader attributes on the dependent variables are monotonic or nonmonotonic over the range of growth strategy scores, a derivative and the solution of equation 1 for growth strategy yields:
dY/dL = bl+b2 (G)..................... (2)If equation 2 is solved for G— to determine the point at which growth strategy does not modify the effect of each leader attribute on the dependent variables— the result is:
G = -bl/b2..........................(3)The values for bl and b2 from Tables 35-38 are substituted into equation 3 for each of the dependent variables. If the calculated value for growth strategy is within the range observed in this study's sample, it can be concluded that the leader
200
Reproduced with perm ission o f the copyright owner. Further reproduction prohibited w ithout permission.

attribute has a nonmonotonic effect on the dependent variable over the range of growth strategy scores. Nonmonotonic (as opposed to monotonic) effect means that the leader attribute has scroe positive and same negative effects on the dependent variable. Different values of growth strategy can be substituted into equation 2 to determine the range where the positive and negative effects of each leader attribute exist over the range of strategy scores. Grcwth strategy scores ranged fron 4 to 21 in the main study, with a mean of 11.56 and a standard deviation of 3.62. It is worth noting that unlike environmental uncertainty, higher scores on the growth strategy construct translated to less pursuance of the same. Therefore, the interpretation of the interactions would be mostly opposite to that for hypothesis 1. The results of the analyses of specific leader attribute-growth strategy interactions are discussed in the following sections.
Leader attributes. Grcwth strategy, and Residential membership. The effects of the interactions of grcwth strategy with each of task-orientation, human welfare values, and locus of control on residential membership were in the expected directions but not significant. The two interactions— for task-orientation and human welfare values— were nonmonotonic over the range of grcwth strategy scores. The effects of task-orientation and human welfare values on residential membership were positive (negative) for grcwth strategy scores belcw (above) 13.78 and 18.17 respectively. Therefore, the direction of the effects of
201
Reproduced with perm ission o f the copyright owner. Further reproduction prohibited w ithout perm ission.

task-orientation and human welfare values on residential membership over the range of growth strategy scores were consistent with the formulation of hypothesis 2. In other words, high task-orientation and liberal human welfare values had increasingly positive effects on residential membership the more grcwth strategies were pursued.
Similarly, the impact on residential membership of the interaction between locus of control with grcwth strategy were not significant. The nonmonotonic interaction was consistent with what one would expect from the formulation of hypothesis 2. The impact of the interaction between locus of control and grcwth strategy was positive (negative) for values of grcwth strategy below (above) 12.65. Therefore, locus of control was interpreted as having an increasingly positive impact on residential membership the more a grcwth strategy was pursued.Alternatively, this meant that a leader with an internal locus of control could achieve a larger increase in residential membership by pursuing a grcwth strategy— consistent with the formulation of hypothesis 2.
The effect of the interactions between business affairs values and people-orientation with grcwth strategy on residential membership were neither significant nor in the expected direction. These interactions were also nonmonotonic over the range of grcwth strategy scores in the main study. The negative impact of these interactions on residential membership increased
202
Reproduced with perm ission o f the copyright owner. Further reproduction prohibited w ithout permission.

at grcwth strategy scores belcw 25.5 for business affairs values and 21.4 for people-orientation. In other words, it appeared as if the more a growth strategy was pursued, higher people- orientation and liberal business affairs values had increasingly negative impact on residential membership— inconsistent with the formulation of hypothesis 2.
Leader attributes. Grcwth strategy, and Nonresidential membership. The effects on nonresidential membership of two of the five interaction terms— between each of the leader attributes and growth strategy— were in the expected direction (Tables 35-38). The hypothesis-consistent interactions were for locus of control and business affairs values with growth strategy. None of the five total interactions were significant for nonresidential membership. In addition, all the interaction terms were nonmonotonic except for the one between business affairs value and growth strategy. The effect of the business affairs values-grcwth strategy interaction was such that throughout the range of strategy scores, the more a grcwth strategy was pursued, the higher the positive impact of business affairs values on nonresidential membership. In effect, consistent with the formulation of hypothesis 2, when a grcwth strategy is pursued by a leader with liberal business affairs values, it could lead to increases in nonresidential membership.
Similarly, the interaction between locus of control with growth strategy was consistent with the formulation of hypothesis
203
Reproduced w ith perm ission o f the copyright owner. Further reproduction prohibited w ithou t perm ission.

two. The positive impact of locus of control on nonresidential membership appeared to increase the more a growth strategy was pursued. The positive effect of locus of control on nonresidential membership increased at growth strategy scores below 8.35. Conversely, the impact of the interactions between grcwth strategy with task- and people-orientations and human welfare values on nonresidential membership were increasingly negative. Consequently, the negative impact of task- and people-orientations and human welfare values on nonresidential membership increased the more grcwth strategies were pursued. Specifically, at growth strategy scores below 8.5 for task- orientation, 6.99 for people-orientation, and 15.23 for human welfare values, the interaction terms had an increasingly negative impact on nonresidential membership.
The preceding paragraphs could be alternatively interpreted as: while pursuing a growth strategy with internal locus of control appeared to lead to increases in nonresidential membership, hi i task- and people-orientations and liberal human welfare values seemed to have the opposite effect on this dependent variable. In general, the interactions between each of the leader attributes and grcwth strategy were not consistent with the direction that one would expect from the formulation of hypothesis 2. The interactions between business affairs values and locus of control with grcwth strategy were not significant but in the expected direction. The interactions between task-
204
Reproduced with perm ission o f the copyright owner. Further reproduction prohibited w ithout permission.

and people-orientations and human welfare values were neither significant nor were they in the expected direction.
Leader attributes. Grcwth strategy, and Average Sunday school attendance. The effects of the interactions between growth strategy with task- and people-orientations, locus of control, and human welfare values on average Sunday school attendance were not significant but were in the expected direction. The interactions— for task- and people-orientations, locus of control, and human welfare values--were also nonmonotonic over the range of grcwth strategy scores. The inpacts of task- and people-orientations, locus of control, and human welfare values on average Sunday school attendance were positive (negative) for strategy scores belcw (above) 8.38, 7.19, 14.35, and 19.78 respectively. Therefore, the direction of the effects of task-orientation, people-orientation, locus of control, and human welfare values on average Sunday school attendance over the range of grcwth strategy scores were consistent with the formulation of hypothesis 2. In other words, high task-orientation, high people-orientation, internal locus of control, and liberal human welfare values seemed to have increasingly positive effects on average Sunday school attendance the more grcwth strategies were pursued.
Conversely, the impact of the interaction between business affairs values with grcwth strategy on average Sunday school attendance was not consistent with what was expected. In fact,
205
Reproduced with perm ission o f the copyright owner. Further reproduction prohibited w ithou t permission.

the effect of the interaction between business affairs values with growth strategy was neither in the expected direction nor significant. In addition, this interaction was monotonic over the range of growth strategy scores in this study. Specifically, the negative inpact of the interaction between business affairs values on average Sunday school attendance increased the more a growth strategy was pursued. In effect, and contrary to hypothesis 2 , it appeared as if a leader with liberal business affairs values would have a negative impact on average Sunday school attendance the more a growth strategy was pursued.
Leader attributes. Growth strategy, and Financial receipts. Only one of the interactions between growth strategy and each of the leader attributes was marginally significant (p <.10) for financial receipts. This interaction was also in the expected direction. In fact, only two interactions— for human welfare values and people-orientation with growth strategy— was consistent with the formulation of hypothesis 2. In addition, all of the interaction terms had monotonic effects on financial receipts except for the one between people-orientation and growth strategy.
Throughout the range of growth strategy scores, the positive impact of human welfare values on financial receipts increased— a monotonic effect. Except for not being significant, the direction was as expected. Similarly, for growth strategy scores below (above) 10.82, people-orientation had an increasingly
206
Reproduced with perm ission o f the copyright owner. Further reproduction prohibited w ithout permission.

positive (negative) effect on financial receipts. Moreover, the interaction between people-orientation with grcwth strategy was marginally significant (p <.10). Nevertheless, both interactions (for human welfare values and people-orientation with grcwth strategy) were consistent with the formulation of hypothesis 2, and seemed to indicate that liberal human welfare values and high people-orientation led to increases in financial receipts the more a grcwth strategy was pursued.
Conversely, the effects of task-orientation and business affairs values on financial receipts over the range of grcwth strategy scores were monotonic and were not in the expected direction. Specifically, the more a growth strategy was pursued, the lower the positive impact of task-orientation on financial receipts. On the other hand, the more a grcwth strategy was pursued, the higher the negative impact of business affairs values on financial receipts. In both cases, the interactions were inconsistent with what one would expect from the formulation of hypothesis 2 in that high task-orientation and liberal business affairs values did not lead to increases in financial receipts the more a grcwth strategy was pursued. Similarly, the impact of locus of control on financial receipts over the range of grcwth strategy scores though monotonic was also inconsistent with expectations because the more a grcwth strategy was pursued, the higher the negative impact of locus of control on financial receipts. In other words, it appeared as if pursuing a grcwth
207
Reproduced w ith perm ission o f the copyright owner. Further reproduction prohibited w ithou t perm ission.

strategy with a leader that has an internal locus of control may not lead to increased financial receipts.
ConclusionBased on the fact that there was only one interaction term
that was marginally significant for the test of hypothesis 2 , the suggestion can be made that there was no support for it. In addition, only eleven of the twenty total interaction terms for hypothesis 2 were in the expected direction— a fifty-five percent level of consistency. Nevertheless, the following tentative conclusions— that are based primarily on the direction of the interaction terms using Schoonhoven1 s (1981) recommendations— could be made: (1) the effects of high task-orientation on residential membership and average Sunday school attendance appear to be consistent with the pursuance of a grcwth strategy, (2) high people-orientation seemed to have an increasingly positive impact on average Sunday school attendance and financial receipts, (3) liberal business affairs values may have an increasingly positive inpact on nonresidential membership the more a growth strategy was pursued, (4) liberal human welfare values could have positive effects on all the dependent variables except nonresidential membership the more a grcwth strategy was pursued, and (5) internal locus of control appeared to have increasingly positive effects on all the dependent variables except financial receipts the more a growth strategy was
208
Reproduced with perm ission o f the copyright owner. Further reproduction prohibited w ithou t permission.

pursued. Table 39 has a summary listing of these results.In order to determine why more significant interactions were
not found, a post-hoc power analysis (Table 40) revealed that one or a combination of the following factors could have resulted in the lack of significant results: (1) the effect sizes were not large enough for nonresidential membership and financial receipts, and (2) the sample size in the main study was insufficient for nonresidential membership and financial receipts. In addition, there was a general lack of statistical power for the analysis of hypothesis 2 for all the dependent variables and this could perhaps explain why more significant interactions were not found.
In summary, the results of the analyses of the interaction terms for hypothesis 2 are consistent with those for the first hypothesis. In effect, the test of hypothesis 2 again highlighted the possible deficiencies of the analysis of interaction-based hypotheses and the need for possibly adopting multiple approaches (i.e. traditional contingency and profile deviation or systems analyses) to examining fit in management research studies. When multiple approaches to fit— like combining the traditional contingency with the profile deviation or systems analysis— are used, researchers like Van de Ven and Drazin (1985) have found that complementary information that would not otherwise be available could be obtained to better understand the relationships between variables. Before
209
Reproduced with perm ission o f the copyright owner. Further reproduction prohibited w ithout permission.

TABLE 39
PERFORMANCE SUMMARY OF THE INTERACTIONS BEIWEEN LEADER ATTRIBUTES AND GROWTH STRATEGY.
MODERATING VARIABLE: Growth strategy
DEPENDENT VARIABLES
INDEPENDENT VARIABLES
TO PO BAV HWV IDCResidential membership yes no no yes yesNonresidential membership no no yes no yesAverage Sunday school attendance yes yes no yes yesFinancial receipts no yes* no yes no
where: TO = Task-orientationPO = People-orientation BAV = Business affairs values HWV = Human welfare values LOC = Locus of control
and: yes = interaction in the hypothesized directionno = interaction in the opposite direction of hypothesis * = significant interaction at p <.10
210
Reproduced with perm ission o f the copyright owner. Further reproduction prohibited w ithout permission.

TABLE 40
POWER ANALYSIS FOR THE TEST OF HYPOTHESIS 2
Source Value
Minimum effect size in pilot study 0.31Maximum effect size in pilot study 0.51Minimum effect size needed in the main study 0.34Effect sizes in main study:
Residential membership 0.35Nonresidential membership 0.30Average Sunday school attendance 0.35Financial receipts 0.29
Minimum acceptable pcwer level 0.90Actual power found:
Residential membership 0.43Nonresidential membership 0.20Average Sunday school attendance 0.43Financial receipts 0.10
Minimum sample sizes needed in the main study:Residential membership 135Nonresidential membership 157Average Sunday school attendance 135Financial receipts 163
Sample size in the main study 141Significance or alpha level 0.05
211
Reproduced with perm ission o f the copyright owner. Further reproduction prohibited w ithout permission.

proceeding with the alternative approach to fit that was used in this study, the third and final interaction-based hypothesis is tested next.
Hypothesis 3It was predicted that in high uncertainty environments,
organizations will attain relatively superior levels of performance when a grcwth strategy is pursued. This hypothesis, like hypotheses 1 and 2 was based on the interactions between the relevant variables— strategy types and environmental uncertainty. For the test of this hypothesis, environmental uncertainty was assumed to be the moderating variable, based on the assunption that research subjects have more control over strategy. As was the case for the two previous hypotheses, moderated regression analysis was used to test hypothesis 3.Both environmental uncertainty and the strategy types were measured along a lew or high continuum. The results of the test of hypothesis 3 deal with the effectiveness implications of the interaction between each strategy type and environmental uncertainty (Tables 41-44).
Environmental uncertainty and Grcwth strategy. The interaction between environmental uncertainty and growth strategy (GS) was not significant for any of the dependent variables. As suggested by Schoonhoven (1981), the lack of significant interactions between environmental uncertainty and GS may not
212
Reproduced with perm ission o f the copyright owner. Further reproduction prohibited w ithout permission.

TABLE 41
STRATEGY, ENVIRONMENTAL UNCERTAINTY, AND RESIDENTIAL MEMBERSHIP
DEPENDENT VARIABLE: Residential membershipSource DF Model 7 Error 138
Sum of sauares 5600.26 74194.68
Mean square 800.04 537.64
F value 1.49
R-square: 0.07
Parameter Environmental Uncertainty (EU) Grcwth strategy (GS)Stabilize strategy (SS) Harvest-tumaround strategy (HS) (EU) * (GS)(EU) * (SS)(EU) *(HS)
Estimate-1.44-1.43-4.363.000.030.16**-0.06
** p <-05
213
Reproduced with perm ission o f the copyright owner. Further reproduction prohibited w ithout permission.

TABLE 42
STRATEGY, ENVIRONMENTAL UNCERTAINTY, ANDNONRESIDENTIAL MEMBERSHIP
DEPENDENT VARIABLE: Nonresidential membershipSource DF Sum of snuai-Rs Mean square F valueModel 7 649.43 92.78 0.79Error 138 16309.07 118.18R-square: 0.04
Parameter EstimateEnvironmental Uncertainty (EU) 0.37Grcwth strategy (GS) -0.10Stabilize strategy (SS) 1.48Harvest-tumaround strategy (HS) -0.93(EU) *(GS) -0.002(EU)*(SS) -0.05(EU)*(HS) 0.01
214
Reproduced with perm ission o f the copyright owner. Further reproduction prohibited w ithout permission.

TABLE 43
STRATEGY, ENVIRONMENTAL UNCERTAINTY, AND AVERAGESUNDAY SCHOOL ATTENDANCE
DEPENDENT VARIABLE: Average Sunday School attendanceSource DF Sura of sauares Mean souare F valueModel 7 12179.74 1739.96 2.92***Error 138 82187.40 595.56R-square: 0.13
Parameter EstimateEnvironmental Uncertainty (EU) -1.30Grcwth strategy (GS) -1.97Stabilize strategy (SS) -4.22*Harvest-tumaround strategy (HS) 4.49(ED) * (GS) 0.03(EU)*(SS) 0.16*(EU)*(HS) -0.08
*p <.10 ***p <.01
Reproduced with perm ission o f the copyright owner. Further reproduction prohibited w ithou t permission.

TABLE 44
STRATEGY, ENVIRONMENTAL UNCERTAINTY, AND FINANCIAL RECEIPTS
DEPENDENT VARIABLE: Financial receiptsSource DF Sum of squares Mean square Model 7 7092.38 1013.20 Error 138 91165.42 660.62
F value 1.53
R-square: 0.07
Parameter Environmental Uncertainty (EU) Grcwth strategy (GS)Stabilize strategy (SS) Harvest-tumaround strategy (HS) (EU) * (GS)(EU)*(SS)(EU) *(HS)
Estimate0.35-1.68-2.004.690.020.08-0.12
216
Reproduced with perm ission o f the copyright owner. Further reproduction prohibited w ithout permission.

preclude further analysis. In order to analyze the interaction, it was necessary to assume— based on the formulation of hypothesis 3— that the impact of GS on each of the dependent variables was modified by the level of environmental uncertainty faced by the organization. Ihe growth strategy-environmental uncertainty interaction may be interpreted with the following equation:
y = bl(G)+b2 (E*G).....................(1)where Y = Dependent variable
G = Grcwth strategy E = Environmental uncertainty bl = main effect of grcwth strategy b2 = interaction effect of uncertainty-growth strategy
This means that the effect of grcwth strategy on the dependent variables was modified by the level of uncertainty in the environment. To determine whether the effects of grcwth strategy on the dependent variables were monotonic or nonmonotonic over the range of environmental uncertainty, a derivative and the solution of equation 1 for environmental uncertainty yields:
dY/dG = bl+b2 (E)......................(2)If equation 2 is solved for E— to determine the point at which environmental uncertainty does not modify the effect of grcwth strategy on the dependent variables— the result is:
E = -bl/b2.......................... (3)The values for bl and b2 from Tables 41-44 were substituted into
217
Reproduced with perm ission o f the copyright owner. Further reproduction prohibited w ithout permission.

equation 3 for each of the dependent variables. If the calculated value for environmental uncertainty was within the range observed in this study's sample, the conclusion is that growth strategy had a nonmonotonic effect on the dependent variable over the range of environmental uncertainty.Nonmonotonic (as opposed to monotonic) effect means that grcwth strategy had seme positive and scane negative effects on the dependent variable. Different values of environmental uncertainty could be substituted into equation 2 to determine the range where the positive and negative effects of grcwth strategy exist over the range of uncertainty. Environmental uncertainty ranged from 10 to 45 in the main study, with a mean of 23.82 and a standard deviation of 6.17.
Ihe effect of pursuing a grcwth strategy on residential membership was not significant, though nonmonotonic, over the range of environmental uncertainty. Ihe impact of grcwth strategy on residential membership was positive (negative) for environmental uncertainty scores above (below) 42.05 (1.43/0.034). Therefore, the direction of the effect of grcwth strategy on residential membership over the range of environmental uncertainty was consistent with the formulation of hypothesis 3.
Ihe interaction of grcwth strategy and environmental uncertainty on nonresidential membership was monotonic over the range of environmental uncertainty observed in this study. Ihe
218
Reproduced with perm ission o f the copyright owner. Further reproduction prohibited w ithout permission.

monotonic effect was of the form that the higher the environmental uncertainty, the higher the negative impact of pursuing a growth strategy on nonresidential membership. This type of monotonic relationship exists when bl and b2 are negative. Consequently, in addition to the lack of statistical significance of the interaction term between environmental uncertainty and growth strategy, the direction of the relationship was also not in the expected direction.
The effects of growth strategy on average Sunday school attendance and financial receipts were also not significant. Ihe inpacts of grcwth strategy on average Sunday school attendance and financial receipts were negative through the range of environmental uncertainty. Both monotonic effects were such that the higher the uncertainty, the lcwer the negative inpacts of pursuing a growth strategy on average Sunday school attendance and financial receipts. In other words, in an environment with a high degree of uncertainty, growth strategy had a decreasingly negative inpact on average Sunday school attendance and financial receipts. The results of the analyses of the grcwth strategy- environmental uncertainty interaction on average Sunday school attendance and financial receipts were consistent with the direction suggested by the formulation of hypothesis 3.
In summary, there is general directional support for the part of hypothesis 3 which suggests that the interaction between grcwth strategy and environmental uncertainty should lead to
219
Reproduced with perm ission o f the copyright owner. Further reproduction prohibited w ithout permission.

increased effectiveness. There were no statistically significant interactions, however. The performance implications of the interactions between the other two strategy types with environmental uncertainty were also analyzed and are reported in the following section.
Environmental uncertainty and Stabilize strategy. The inpact of the interaction between stabilize strategy and environmental uncertainty, though significant for residential membership (Table 41) and marginally significant for average Sunday school attendance (Table 43), was not significant for nonresidential membership or financial receipts (Tables 42 & 44 respectively). The stabilize strategy-environmental uncertainty interactions may be interpreted with the following equation:
Y = b3(S)+b4(E*S).....................(4)where Y = Dependent variable
S = Stabilize strategy E = Environmental uncertainty b3 = main effect of stabilize strategy b4 = interaction of uncertainty-stabilize strategy
This means that the effects of stabilize strategy on the dependent variables are modified by the level of uncertainty in the environment. To determine whether the effects of stabilize strategy on the dependent variables were monotonic or nonmonotonic over the range of environmental uncertainty, a derivative and the solution of equation 4 for environmental
220
Reproduced with perm ission o f the copyright owner. Further reproduction prohibited w ithou t permission.
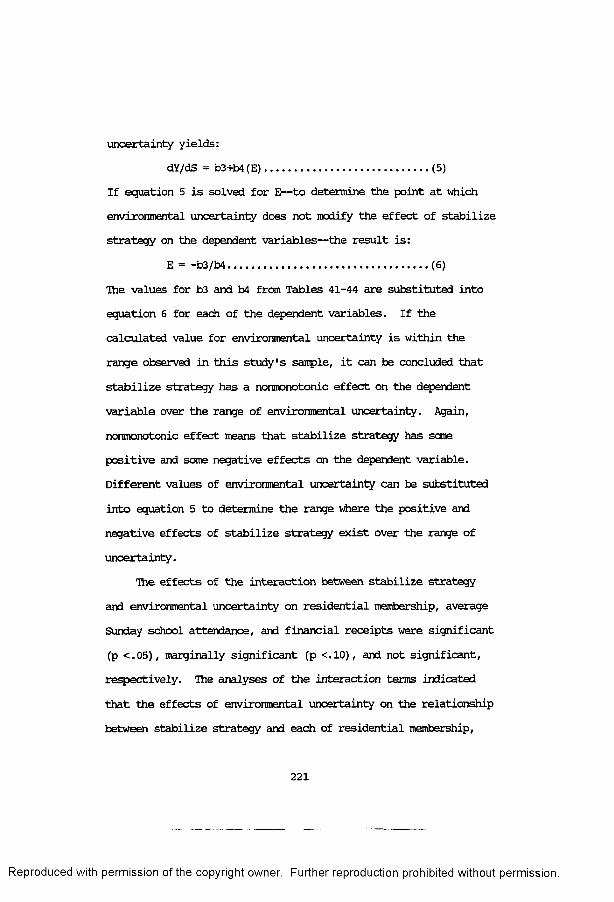
uncertainty yields:dY/dS = b3+b4(E)......................(5)
If equation 5 is solved for E— to determine the point at which environmental uncertainty does not modify the effect of stabilize strategy on the dependent variables— the result is:
E = -b3/b4.......................... (6)Ihe values for b3 and b4 from Tables 41-44 are substituted into equation 6 for each of the dependent variables. If the calculated value for environmental uncertainty is within the range observed in this study's sample, it can be concluded that stabilize strategy has a nonmonotonic effect on the dependent variable over the range of environmental uncertainty. Again, nonmonotonic effect means that stabilize strategy has seme positive and seme negative effects on the dependent variable. Different values of environmental uncertainty can be substituted into equation 5 to determine the range where the positive and negative effects of stabilize strategy exist over the range of uncertainty.
The effects of the interaction between stabilize strategy and environmental uncertainty on residential membership, average Sunday school attendance, and financial receipts were significant (p <.05), marginally significant (p <.10), and not significant, respectively. The analyses of the interaction terms indicated that the effects of environmental uncertainty on the relationship between stabilize strategy and each of residential membership,
221
Reproduced with perm ission o f the copyright owner. Further reproduction prohibited w ithout permission.

average Sunday school attendance, and financial receipts was nonmonotonic over the range of environmental uncertainty, ihe modifying effects of environmental uncertainty on the relationships between stabilize strategy and residential membership, stabilize strategy and average Sunday school attendance, and stabilize strategy and financial receipts for environmental uncertainty scores above 26.75, 26.375, and 25.64 respectively were positive. In other words, pursuing a stabilize strategy led to higher effectiveness as environmental uncertainty increased.
The effect of stabilize strategy on nonresidential membership, though not significant, was also nonmonotonic over the range of environmental uncertainty, unlike the other dependent variables that were discussed in the preceding paragraph, the nonmonotonic effect was in the opposite direction of what one would expect from the formulation of hypothesis 3 such that the higher the environmental uncertainty, the lower the positive inpact of pursuing a stabilize strategy on nonresidential membership. In summary, the direction of the interaction between stabilize strategy and environmental uncertainty was consistent with the formulation of hypothesis 3 for all the dependent variables except nonresidential membership.
Environmental uncertainty and Harvest-turnaround strategyIhe inpact of the interactions between harvest-tumaround
222
Reproduced with perm ission o f the copyright owner. Further reproduction prohibited w ithout permission.

strategy (HS) and environmental uncertainty (EU) was not significant for any of the dependent variables. Ihe analyses of the interaction terms was monotonic for all the dependent variables except financial receipts. Schoonhoven (1981) suggested that the lack of significant interactions should not preclude further analysis as the HS-EU interaction may be interpreted with the following equation:
where Y = Dependent variableH = Harvest-tumaround strategy E = Environmental uncertainty b5 = main effect of harvest-tumaround strategy b6 = interaction effect of H and E on Y
This means that the effects of HS on the dependent variables are modified by the level of uncertainty in the environment. To determine whether the effects of HS on the dependent variables are monotonic or nonmonotonic over the range of environmental uncertainty, a derivative and the solution of equation 7 for environmental uncertainty yields:
If equation 8 is solved for E— to determine the point at which environmental uncertainty does not modify the effect of pursuing a harvest-tumaround strategy on the dependent variables— the result is:
Y = b5 (H) +b6 (E*H) (7)
dY/dH = b5+b6(E) (8)
E = -b5/b6 (9)
223
Reproduced with perm ission o f the copyright owner. Further reproduction prohibited w ithout permission.

Ihe values for b5 and b6 from Tables 41-44 are substituted into equation 9 for each of the dependent variables. If the calculated value for environmental uncertainty is within the range observed in this study's sample, it can be concluded that HS has a nonmonotonic effect on the dependent variable over the range of environmental uncertainty. Different values of environmental uncertainty can be substituted into equation 8 to determine the range where the positive and negative effects of HS exist over the range of uncertainty.
Even though the effects of the interaction between HS and environmental uncertainty on residential membership and average Sunday school attendance were not significant, the directions were similar. The analyses of the interaction terms indicated that the effect of environmental uncertainty on the relationships between HS for residential membership and average Sunday school attendance were monotonic over the range of environmental uncertainty. The monotonic effect was such that the higher the uncertainty, the lower the positive impact of pursuing harvest-tumaround strategy on residential membership and average Sunday school attendance.
Similarly, the effect of the interaction between HS and environmental uncertainty on nonresidential membership, though not significant, was also monotonic. The interaction of HS and environmental uncertainty was negative throughout the range of the environmental uncertainty scores in this study. The negative
224
Reproduced w ith perm ission o f the copyright owner. Further reproduction prohibited w ithout permission.

effect of HS on nonresidential membership decreased as environmental uncertainty increased. In other words, the higher the uncertainty, the lower the negative impact of pursuing a harvest-tumaround strategy on nonresidential membership.
The inpact of pursuing a harvest-tumaround strategy was positive and negative for environmental uncertainty scores below and above 38.76 respectively for financial receipts. When environmental uncertainty was below 38.76, the higher the uncertainty, the lower the positive inpact of pursuing a harvest-tumaround strategy on financial receipts. Conversely, the hi ier the uncertainty, the higher the negative inpact of pursuing a harvest-tumaround strategy on financial receipts for scores that were higher than 38.76. In general, consistent with the formulation of hypothesis 3, ineffectiveness result from pursuing harvest-tumaround strategies in environments with high levels of uncertainty except for nonresidential membership.
ConclusionWhile none of the interactions in the preceding analyses
were marginally or otherwise significant, nine out of the twelve were in the expected direction (Table 45). In fact, the interactions between strategy and environmental uncertainty led to results that one would expect from the formulation of hypothesis 3 for most of the dependent variables except nonresidential membership. Nevertheless, the lack of significant
225
Reproduced with perm ission o f the copyright owner. Further reproduction prohibited w ithou t permission.

TABLE 45
SUMMARY FINDINGS OF IHE RELATIONSHIPS BETWEEN STRATEGY,ENVIRONMENTAL UNCERTAINTY, AND THE DEPENDENT VARIABLES.
MODERATING VARIABLE: Environmental uncertainty
DEPENDENT VARIABLES
INDEPENDENT VARIABLES
GS SS HTResidential membership yes yes yesNonresidential membership no no noAverage Sunday school attendance yes yes yesFinancial receipts yes yes yes
where: GS = Growth strategySS = Stabilize strategyHT = Harvest-tumaround strategy
andyes = interaction in the hypothesized direction no = interaction in the opposite direction of hypothesis
226
Reproduced with perm ission o f the copyright owner. Further reproduction prohibited w ithout permission.

interactions obviously limits the conclusion that could be drawn from these results. In summary, the test of hypothesis 3 seemed to suggest that when environmental uncertainty is high, pursuing strategies with "growth" and/or "stabilize" characteristics maximize effectiveness (or minimize ineffectiveness).Conversely, when harvest-tumaround strategies are pursued in environments with high levels of uncertainty, effectiveness measures may be adversely affected. These conclusions are tentative at best because they are based on the direction of the interactions rather than their statistical significance.
Post-hoc power analysis (Table 46) revealed that one or a combination of the following factors probably contributed to the lack of significant results in the test of hypothesis 3: (1) the effect sizes for all the dependent variables except average Sunday school attendance were not large enough, and (2) the sample size in the main study was insufficient for all the performance measures except average Sunday school attendance. In general, only average Sunday school attendance had a power level that was at least 0.90. Consequently, there was a general lack of statistical power for the analysis of hypothesis 3 and this perhaps explains why more significant interactions were not found.
The results of the three interaction-based hypotheses to this point has been rather disappointing. If this researcher had only adopted the traditional contingency approach to fit, the
227
Reproduced with perm ission o f the copyright owner. Further reproduction prohibited w ithout permission.

TABLE 46
POWER ANALYSIS FOR THE TEST OF HYPOTHESIS 3
Source Value
Minimum effect size in pilot study 0.30Maximum effect size in pilot study 0.47Minimum effect size needed in the main study 0.34Effect sizes in main study:
Residential membership 0.27Nonresidential membership 0.20Average Sunday school attendance 0.36Financial receipts 0.27
Minimum acceptable power level 0.90Actual power found:
Residential membership 0.40Nonresidential membership -*Average Sunday school attendance 0.99Financial receipts 0.37
Minimum sample sizes needed in the main study:Residential membership 175Nonresidential membership 235Average Sunday school attendance 131Financial receipts 175
Sample size in the main study 137Significance or alpha level 0.05
-* means power could not be calculated because the "meansquare error" was greater than the "mean square model”
Reproduced w ith perm ission o f the copyright owner. Further reproduction prohibited w ithout permission.

tentative and general conclusion would have been to suggest that important contingency relationships did not appear to exist for strategy, leader attributes, environmental uncertainty, and performance measures. Alternatively, additional analyses would have been undertaken to determine if the relationship between the explanatory and dependent variables were non-linear.Supplementary analyses for hypotheses 1, 2, and 3 revealed that the best models were linear. In addition to explaining the most variance in the dependent variables, the linear models were also more likely to be significant or marginally significant.
Ihe results of the power analyses that were done for the tests of hypotheses 1, 2, and 3 made it inappropriate to conclude that the independent variables/constructs do not have important performance ramifications for the organizations in this study. Nevertheless, it is still necessary to justify the potential importance of the variables/constructs in this study to performance measures. The multiple approaches to fit that have been advocated by researchers like Grescrv (1989) make this justification possible. The importance of using multiple approaches to fit would be reinforced in this study if the test of hypothesis 4 reveals that these variables/constructs do have important performance implications. Therefore, the results of the test of hypothesis 4— using profile deviation or pattern analysis— are reported in the following section.
229
Reproduced with perm ission o f the copyright owner. Further reproduction prohibited w ithout permission.

Hypothesis 4All the hypotheses to this point were typical of the
traditional contingency ones in the management literature. As noted in Chapters 1 and 3, this traditional approach is reductionistic because it focuses on the interactions— usually between two variables— one dimension at a time. Hypothesis 4 is more holistic in that it accounted for all the variables as a set by suggesting that organizations will achieve relatively higher levels of performance when there is a proper alignment between strategy and leader attributes within a given environmental context. The appropriate analytical technique for testing hypothesis 4 has been referred to in the management literature as systems approach, pattern analysis, or profile deviation (Drazin & Van de Ven, 1985; Gresov, 1989; Venkatraman, 1989). The basic premise of the systems approach is to develop 'ideal' or 'pattern' profiles using all the variables in this study and then examine how deviations from these profiles affect organizational performance. The three basic stages that are involved in the analysis of hypothesis 4 were based primarily on the procedure that was recommended by Drazin and Van de Ven (1985).
Stage I: Separate analysis within each environment. The environment was broken dcwn into three dimensions— low, medium, and high levels of uncertainty. The environments with lew and high levels of uncertainty were those with half a standard deviation belcw and above the mean respectively. The
230
Reproduced with perm ission o f the copyright owner. Further reproduction prohibited w ithout permission.

organizations within the one standard deviation between the high and low groups were classified as having a medium level of uncertainty. One standard deviation was used to demarcate the high from the lew uncertainty groups to assure roughly equal sample sizes in all three categories. While this approach typically would make it possible for researchers to have sufficient samples to use for further analyses within each category, the lines of demarcation between the low and medium and medium and high groups become distorted. Therefore, the most valid results could pxotentially be for the high and low uncertainty groups. Finally at this stage, the scores for the leader attributes and strategy types were standardized in order to remove scale variance from the fit measure that is to be developed.
Stage II: Measuring the degree of configuration. This stage involved 3 stepss:
Step 1: an empirical profile was developed within each environment by using the top ten percent performers— for residential and nonresidential memberships, average Sunday school attendance, and financial receipts— within each category.Because of the total saitple size in the main study, only five, seven, and five subjects were used for the low, medium, and high levels of uncertainty groups respectively to develop the enpirical profiles. The mean scores of the seventeen units on the eight variables— task- and people-orientations, human welfare
231
Reproduced with perm ission o f the copyright owner. Further reproduction prohibited w ithout permission.

and business affairs values, locus of control, growth, stabilize, and harvest-tumaround strategies— were noted. The results of the first stage of this pattern analysis are shown in Tables 47-50.
The study sample could have been the ninety percent that was left over from selecting the top ten percent for developing the profiles in each environment. In order not to skew the distribution of the dependent variables, it was deemed necessary by this researcher to also remove the bottom ten percent from the remaining ninety percent. The rationale was that if the dependent variables were normally or non-normally distributed, the use of the top ten percent performers— without removing the bottom ten percent— could conceivably bias the results of the other stages of systems analysis. Therefore, the study sample was the middle eighty percent within each environment. The argument for removing the bottom ten percent is supported by Venkatraman and Prescott's (1990) study.
Step 2: the ideal profile was determined by calculating the standardized mean scores for strategy types and leader attributes. Alternatively, separate OLS (ordinary least squares) regression could be run for each environment with performance measures as criterion and the attributes and strategy as predictors. Thereafter, only the significant strategy and leader attributes are used to determine the profile. The sample size in the main study precluded the use of this alternative approach.
232
Reproduced with perm ission o f the copyright owner. Further reproduction prohibited w ithout permission.

TABLE 47
PROFILES OF MEAN LEADER ATTRIBUTES AND STRATEGY SCORES FOR HI<2iEFFICIENT, IOW, MEDIUM, AND HIGH ENVIRONMENTAL UNCERTAINTY UNITS*
DEPENDENT VARIABLE: Residential membership
Environmental UncertaintyLeader and strategycharacteristics Low (N=5) Medium (N=7) High (N=5)Leader attributesTask-orientation -0.228 -0.144 -0.550People-orientation -0.324 -0.710 -0.006Business affairs values 0.021 -0.015 0.106Human welfare values -0.045 0.878 0.581Locus of control -0.641 -0.055 0.072StrategyGrowth 1.020 -0.274 0.066Stabilize -0.094 -0.180 0.556Harvest-tumaround 0.083 0.346 0.425
* Based on standardized scores
Reproduced with perm ission o f the copyright owner. Further reproduction prohibited w ithout permission.

TABLE 48
PROFILES OF MEAN LEADER ATTRIBUTES AND STRATEGY SCORES FOR HIGHEFFICIENT, LOW, MEDIUM, AND HIGH ENVIRONMENTAL UNCERTAINTY UNITS*
DEPENDENT VARIABLE: Nonresidential membership
Environmental UncertaintyLeader and strategycharacteristics Low (N=5) Medium (N=7) High (N=5)Leader attributesTask-orientation -0.201 0.602 -0.174People-orientation 0.947 0.312 0.073Business affairs values -0.547 0.451 0.390Human welfare values -0.006 -0.176 0.297Locus of control -0.463 -0.522 0.786StrategyGrcwth 0.813 0.042 0.066Stabilize 0.456 -0.180 -0.695Harvest-tumaround -0.345 -0.275 -0.048
* Based on standardized scores
Reproduced with perm ission o f the copyright owner. Further reproduction prohibited w ithout permission.

TABLE 49
PROFILES OF MEAN LEADER ATTRIBUTES AND STRATEGY SCOPES FOR HlOiEFFICIENT, LOW, MEDIUM, AND HIGH ENVIRONMENTAL UNCERTAINTY UNITS*
DEPENDENT VARIABLE Average Sunday school attendance
Environmental UncertaintyLeader and strategycharacteristics Low (N=5) Medium (N=7) High (N=5)Leader attributesTask-orientation -0.014 -0.450 -0.335People-orientation -0.324 -0.313 0.153Business affairs values 0.532 0.106 0.049Human welfare values -0.094 0.402 0.346Locus of control -0.596 -0.437 0.251StrategyGrowth 0.052 -0.116 -0.570Stabilize -0.094 0.535 -0.395Harvest-tumaround 0.267 0.798 0.504
* Based on standardized scores
235
Reproduced with perm ission o f the copyright owner. Further reproduction prohibited w ithout permission.

TABLE 50
PROFILES OF MEAN LEADER ATTRIBUTES AND STRATEGY SCORES FOR HIGHEFFICIENT, LOW, MEDIUM, AND HIGH ENVIRONMENTAL UNCERTAINTY UNITS*
DEPENDENT VARIABLE: Financial receipts
Environmental UncertaintyLeader and strategycharacteristics Low (N=5) Medium (N=7) High (1=5)Leader attributesTask-orientation 0.040 -0.067 -0.014People-orientation 0.153 0.425 -0.086Business affairs values -0.206 0.248 -0.064Human welfare values 0.229 0.346 0.699Locus of control -0.463 -0.310 0.072StrategyGrowth 0.177 -0.432 -1.261Stabilize -0.545 0.177 -0.094Harvest-tumaround 0.248 0.628 0.425
* Based on standardized scores
236
Reproduced with perm ission o f the copyright owner. Further reproduction prohibited w ithout permission.

Therefore, the mean standardized scores for the top ten percent performers within each environment were considered to be the derived ideal profiles.
In order to increase residential membership, the ideal profile for the most effective organizations in high uncertainty environments in this study appeared to have leaders that are: (1) lew in task-orientation, high in people-orientation, liberals in business affairs and human welfare values, with external locus of control, and (2) more likely to pursue growth strategies, and less likely to pursue stabilize and harvest-tumaround strategies. The ideal profile for the organizations that are most effective in increasing average Sunday school attendance is similar to the one for residential membership except that both growth and stabilize strategies were pursued and the leader had conservative business affairs values. Nonresidential membership could be increased when leaders pursued the characteristics of growth and stabilize strategies. Moreover, these leaders appeared to be more likely to have high task- and people- orientations, liberal business affairs and human welfare values, and external locus of control. The ideal profile for increasing financial receipts were exactly the same as for nonresidential membership except that only growth strategies were pursued and the leaders had lew task-orientation.
Step 3: differences between the ideal patterns and the standardized scores of the study sample for each of the strategy
237
Reproduced with perm ission o f the copyright owner. Further reproduction prohibited w ithou t permission.

types and leader attributes were calculated using a Eucledian distance metric. These distances were computed by focusing on the differences between each subject's and its ideal type's scores on strategy and leader attributes within the appropriate environmental uncertainty group. The distance measures were calculated using the following formula:
DISTANCE3 V2(Xis - Xjs)* where 'Xis' is the score of the ideal unit on the 's'th leader or strategy dimension while 'Xjs' is the score of the 'j'th focal unit on the 's'th dimension.
Stage III: Assessment of the performance impact of configuration. This third and final stage involved the correlation of the distance measures with the performance variables (i.e. residential membership, nonresidential membership, average Sunday school attendance, and financial receipts). Fit or misfit in terms of configuration or alignment would be supported if the distance scores are negatively correlated with the performance measures, especially for high uncertainty environments. These negative correlations would indicate that the deviation from the ideal profiles had negative effects on performance.
The correlations between distance and the dependent variables for each level of environmental uncertainty are shewn in Table 51. The lew and high environmental uncertainty groups had the greatest correlations between distance and performance
238
Reproduced with perm ission o f the copyright owner. Further reproduction prohibited w ithout permission.

TABLE 51
CORRELATIONS OF DISTANCE MEASURE WITH DEPENDENT VARIABLES, EXCLUDING HIGH-PERFORMANCE UNITS
DEPENDENT VARIABLE DISTANCECORRELATIONCOEFFICIENT
Residential membershipDISTO 0.3277DIST1 -0.1895DISK -0.3406*
Nonresidential membershipDISTO -0.3529*DIST1 0.0010
DISK 0.0387
Average Sunday school attendanceDISTO 0.4441**DISK -0.1579DISK -0.2041
Financial receiptsDISTO 0.1470DIST1 -0.0800DISK 0.2355
where DISTO = distance for lew environmental uncertainty groupDIST1 = distance for medium environmental uncertainty group DISK = distance for high environmental uncertainty group
* = p <.10 ** = p <.05
Reproduced w ith perm ission o f the copyright owner. Further reproduction prohibited w ithout permission.

measures. Generally, the correlations between distance and the dependent variables were lower for the group with medium level of environmental uncertainty. As predicted, each unit's distance from its ideal type correlated negatively with the dependent variables in high uncertainty environment for residential membership and average Sunday school attendance (-0.3406 and -0.2041). While the only marginally significant (p <.10) correlation was for residential membership, both correlations were in the expected direction. In addition, for residential membership and average Sunday school attendance, distances also correlated negatively (-0.189 and -0.1579) for the medium environmental uncertainty groups. For nonresidential membership, distance correlated negatively (-0.35) and was marginally significant (p <.1 0) for the low environmental uncertainty category. The only category that had a negative correlation between distance and financial receipts was the medium level of uncertainty. Ihis correlation was not significant.
A review of Table 51 reveals that the dependent variable that received the weakest support was financial receipts. Therefore, the alternative approach that was mentioned in step 2 of Stage 1 (i.e. using significant or marginally significant OI£ variables) was also used. In addition, two standard deviations were used to separate the low from the high uncertainty groups. The top 14 performers in each uncertainty group were used in the OLS analysis. The only dependent variable that had marginally
240
Reproduced with perm ission o f the copyright owner. Further reproduction prohibited w ithout permission.

significant or significant independent variables was financial receipts. The correlations of the distance measures with financial receipts for the low, medium, and high environmental uncertainty groups were -0.2072, -0.0165, and -0.8152 respectively. Even though all three correlations were in the expected direction, only the correlation for the high uncertainty group was significant (p <.01). The use of this alternative approach did not improve the results for any of the other dependent variables. In addition, the results of the alternative approach for financial receipts should be carefully interpreted for two reasons: (1) because there were only 27 units in the high environmental uncertainty group when two standard deviations were used to separate the lew from the high uncertainty groups, the top 14 performers represented the top half of the sample while the bottom half were used as the study sample, and (2) the inability to remove the bottom 14 performers and still have a study sample. Both of these reasons most likely biased the results for the high environmental uncertainty group.
These results show seme support for the systems approach to fit in explaining the importance of certain leader attributes and the pursuance of particular strategy typses to organizational effectiveness. Ordinarily, this researcher could have been discouraged by the results of hypotheses 1, 2 and 3, but by using an alternative approach to examine the fit or congruence between the relevant variables, there was some marginal statistical
241
Reproduced with perm ission o f the copyright owner. Further reproduction prohibited w ithou t permission.

justification for the importance of these variables to organizational performance in this study.
Profile validation. Ordinarily, the ideal profiles in this study— especially for residential membership— could have been validated by randomly splitting the original sample into two.Hie hold-out sample would have been analyzed following the same procedure as for the study sample. Hie direction of the impact of the deviations on performance and the overall consistency of the profiles in the two samples will indicate the validity of the configuration. Because of the insufficient total sample size in this study, the pilot study data was used as an alternative method to validate the profiles. In fact, a stronger case could be made for the validity of the profiles that were developed in the main study by using data that was collected separately and at a different time period. Unfortunately, because strategy was measured at an ordinal level in the pilot study, only the leader attributes profiles could be validated. Nevertheless, the results are very promising and are shown in Table 52.
Even though nine of the twelve correlation coefficients were in the expected direction, only one was significant. Consistent with the results of the previous tests of the profiles on the study samples, the correlation that was significant was for residential membership in the high environmental uncertainty group. The partial validation of this profile using leader attributes was assumed to strengthen the conclusion that when
242
Reproduced with perm ission o f the copyright owner. Further reproduction prohibited w ithou t permission.

TABLE 52
VALIDATION OF IDEAL PROFILES USING PHOT STUDY DATA
DEPENDENT VARIABLE DISTANCECORRELATIONCOEFFICIENT
Residential membershipDISTO -0.3223DIST1 0.8739***DISK -0.6354**
Nonresidential membershipDISTO -0.2859DIST1 -0.4727DISK -0.1372
Average Sunday school attendanceDISTO -0.4707DIST1 0.6350*DISK -0.5035
Financial receiptsDISTO -0.5101DIST1 0.3242DISK -0.1549
where DISTO = distance for low environmental uncertainty groupDIST1 = distance for medium environmental uncertainty group DISK = distance for high environmental uncertainty group
* = p <.10** = p <.05*** = p <.01
243
Reproduced with perm ission o f the copyright owner. Further reproduction prohibited w ithout permission.

environmental uncertainty is high, leader attributes and strategy do have important performance implications for the organizations in this study. Moreover, the ideal profiles were generally consistent with the formulation of hypothesis 4 such that the more effective organizations in uncertain environments had leaders that were low in task-orientation, high in people- orientation, liberal business affairs and human welfare values, with external locus of control. A discussion and the inconsistencies of the results of the tests of all four hypotheses are in the following chapter but first, a review of what has been accomplished in the preceding sections.
Summary
Chapter 4 presented the results of the main study. The reliability of the scales for each of the independent variables except locus of control were calculated using the Cronbach alpha. The items that loaded on unique factors were used to measure these independent variables/constructs. Furthermore, the hypotheses were tested and they produced interesting results.
Generally, the interaction-based hypotheses (HI to H3) did not receive statistical support. Of the 52 total interactions for all three hypotheses, only 5 were significant or marginally significant. For hypothesis 1, the only significant (p <.05) interaction for residential membership was between environmental uncertainty and task-orientation. This lone interaction was not
244
Reproduced with perm ission o f the copyright owner. Further reproduction prohibited w ithout permission.

in the expected direction. The interaction between people- orientation and environmental uncertainty was the only significant (p <.05) one for nonresidential membership. The direction of this interaction was not as expected. Even though there were two significant interactions for average Sunday school attendance, neither of them were in the expected direction.These significant interactions were between task-orientation and environmental uncertainty (p <.01) and locus of control and environmental uncertainty (p <.05). There were no significant interactions for financial receipts. In terms of the direction of the interaction terms for hypothesis 1, there was weak support because only forty-five percent were in the expected direction.
There was only one marginally significant (p <.10) interaction between the leader attributes and growth strategy for all the dependent variables in testing hypothesis 2. The marginally significant interaction was between peop le-or ientation and growth strategy for financial receipts. In addition, there were no significant interactions between growth strategy with environmental uncertainty for any of the dependent variables for hypothesis 3. While only about half of the interaction terms were in the expected direction for hypotheses 2 , about three-fourths were in the expected direction for hypothesis 3. Either way, because of the lack of statistically significant interactions that most likely resulted from a lack of statistical pxwer, the tentative conclusions were that marginal directional
245
Reproduced with perm ission o f the copyright owner. Further reproduction prohibited w ithout permission.

support exist for hypotheses 2 and 3.The lack of significant interactions for hypotheses 1 to 3
would have led a traditional contingency theorist to suggest that there was no fit between the independent variables/constructs in this study for explaining organizational performance. The test and results of hypothesis 4 however would make such a conclusion erroneous. Systems analysis or profile deviation revealed that these independent variables/constructs may be important for performance in environments with different levels of uncertainty, especially when the uncertainty level is high. Since one of the important questions in this research study pertains to the sufficiency of the traditional contingency (i.e. interaction- based) approach used in isolation, the results of the systems analysis in testing hypothesis 4 lends further credence to using multiple approaches to "fit" in examining the importance of strategy types and leader attributes to organizational performance. The discussion and possible implications of the results of these analyses follow.
246
Reproduced w ith perm ission o f the copyright owner. Further reproduction prohibited w ithout permission.

CHAPTER 5
DISCUSSION
Ihis chapter contains the discussion of the results of the tests of the hypotheses in Chapter 4. Especially, the consistencies and inconsistencies in the hypotheses-results are explained. Furthermore, the limitations of this study are discussed along with an explication of the potential contributions of this project to the contingency- and configuration-based studies in management research. Finally, suggestions for future research are made.
Hvootheses-Results fin)consistencies
In analyzing and presenting the results of the tests of the hypotheses in Chapter 4, seme relationships that were consistent and inconsistent with the hypotheses in Chapter 3 were discovered. There is potential importance in exploring and explaining the possible reasons— when possible— why these relationships were found. It may be informative to knew why hypothesized relationships did or did not occur. The following sections deal with the hypotheses, based primarily on the statistical significance of the hypothesized relationships and
247
Reproduced with perm ission o f the copyright owner. Further reproduction prohibited w ithou t permission.

secondarily on the direction of the interaction terms between variables/constructs for hypotheses 1, 2, and 3.
Hypothesis 1There were only four statistically significant interactions
for this hypothesis and none of them were in the expected direction. The lack of statistical power in testing this hypothesis could have accounted for the lack of more significant relationships. Two of the four significant interactions dealt with the inpact of task-orientation on attracting residential members and increasing average Sunday school attendance. The task-orientation inconsistency could be explained by the uncertainty in the environment which could perhaps make a "directive" leader ineffective. Another interaction that was significant revealed that a highly people-oriented leader may be ineffective at attracting members from outside of the church's immediate community or nonresidential membership. Generally, it appeared as if a leader with high people-orientation would be more effective in an uncertain environment. The higher effectiveness of people-orientation over task-orientation may also be due to the 1reductionistic1 nature of traditional contingency theory, the type of organization in this study, and/or the underlying measures of performance that were people-oriented.
A fourth interaction term that was significant but not in
248
Reproduced with perm ission o f the copyright owner. Further reproduction prohibited w ithout permission.

the expected direction dealt with the impact of a leader's locus of control on average Sunday school attendance in an environment with high uncertainty. The inconsistency with the management literature in general (e.g. Miller & Toulouse, 1986) and specifically with hypothesis 1 in this study was that internal locus of control had increasingly negative impact on the performance measures as uncertainty increased. Previous findings concluded that internal locus of control typically led to higher performance in uncertain environments (e.g. Anderson & Schneier, 1978). This inconsistency may be attributed to the difficulty that respondents had with the scale items that were supposed to measure the locus of control construct and/or to other reasons that are discussed later in this chapter.
The other relationships for hypothesis 1 were not statistically significant— the possible reasons are discussed after the discussions for hypotheses 2, 3, and 4. In summary, the following could be the general and tentative conclusions for each dependent variable when an organization is in an uncertain environment: (1) a leader that has low task-orientation, highpeople-orientation, conservative business affairs and human welfare values, and external locus of control could be most effective in increasing residential membership; (2) a leader could have the most impact on nonresidential membership if s/he is high in task- and low in people-orientations, liberal in business affairs and conservative in human welfare values, and
249
Reproduced with perm ission o f the copyright owner. Further reproduction prohibited w ithout permission.

has an internal locus of control; (3) the most effective leader in increasing average Sunday school attendance could be those with low task-orientation, high people-orientation, liberal business affairs and human welfare values, and external locus of control; and (4) if the goal is to achieve increases in financial contributions, the most effective leaders could be those with lew task-orientation, high people-orientation, liberal business affairs values, conservative human welfare values, and external locus of control (Table 53). The plausible theoretical base for the inconsistencies in the results of the test of hypothesis 1 could be more meaningful when done in conjunction with the findings of the other hypotheses.
Hypothesis 2There were no significant interactions for this hypothesis
except for the one between people-orientation and growth strategy which was marginally significant for financial receipts. One possible reason why more significant interactions were not found could be explained by the lack of statistical power in the test of this hypothesis. Nevertheless, the following discussion is based on the direction of the interactions between growth strategy and the leader attributes. In general, the following effective relationships were found to possibly exist when organizational leaders pursued growth strategies: (1) a leader with high task-orientation, lew people-orientation, conservative
250
Reproduced with perm ission o f the copyright owner. Further reproduction prohibited w ithou t permission.

TABLE 53
SUMMARY FINDINGS OF THE RELATIONSHIPS BETWEEN LEADER ATTRIBUTES,ENVIRONMENTAL UNCERTAINTY, AND THE DEPENDENT VARIABLES.
MODERATING VARIABLE: Environmental uncertaintyINDEPENDENT VARIABLES
DEPENDENT VARIABLES TO PO BAV HWV IOCResidential membership -* + - - -Nonresidential membership + -* + - +Average Sunday school attendance — ** + + + -*
Financial receipts - + + - -
where: TO = Task-orientationPO = People-orientation BAV = Business affairs values HWV = Human welfare values DOC = Locus of control
and+ = relationship in the hypothesized direction- = relationship in the opposite direction of hypothesis* = relationship was significant at p <.05 ** = relationship was significant at p <.01
251
Reproduced with perm ission o f the copyright owner. Further reproduction prohibited w ithout permission.

business affairs values, liberal human welfare values, and internal locus of control could be most effective in increasing residential membership; (2) the biggest increase in nonresidential membership could occur when the leader is lew in task- and people-orientations, liberal in business affairs values and conservative in human welfare values, and has internal locus of control; (3) a leader with high task- and people-orientations, conservative business affairs values, liberal human welfare values, and internal locus of control could have the most effective inpact on increasing average Sunday school attendance, (4) to increase financial receipts may require a leader that is lew in task-orientation, high in people-orientation, conservative business affairs values, liberal human welfare values, and an external locus of control (Table 54).
One possible inference that could be drawn from the tentative conclusions for hypotheses 1 and 2 , is that leaders with different attributes may be effective in environments with different levels of uncertainty and/or successful in pursuing strategies with distinctive characteristics, especially when there are multiple performance measures. Nevertheless, the inconsistencies in the test of hypothesis 2 can be more meaningfully undertaken in combination with those of the other hypotheses. Therefore, the effectiveness implications of pursuing growth strategies in uncertain environments are new discussed.
252
Reproduced with perm ission o f the copyright owner. Further reproduction prohibited w ithout permission.

TABLE 54
SUMMARY FINDINGS OF THE REIATIONSHIPS BETWEEN LEADERATTRIBUTES, GROWTH STRATEGY, AND THE DEPENDENT VARIABLES.
MODERATING VARIABLE: Growth strategy
DEPENDENT VARIABLES
INDEPENDENT VARIABLES
TO PO BAV HWV DOCResidential membership + - - + +Nonresidential membership - - + - +Average Sunday school attendance + + - + +Financial receipts - +* - + -
where: TO = Task-orientationPO = People-orientation BAV = Business affairs values HWV = Human welfare values IOC = Locus of control
and: + = relationship in the direction hypothesized- = relationship in the opposite direction of hypothesis * = relationship was significant at p <.io
Reproduced with permission of the copyright owner. Further reproduction prohibited without permission.

Hypothesis 3The hypothesized relationship between growth strategy and
environmental uncertainty was not significant for any of the dependent variables. The fit between environmental uncertainty and growth strategy types was in the expected direction for all the dependent variables except nonresidential membership. In effect, pursuing a growth strategy in an environment that was high in uncertainty appeared to lead to increases in residential membership, average Sunday school attendance, and financial receipts. This finding is generally consistent with those of previous researchers for profit-oriented organizations (e.g. Herbert & Deresky, 1987). Similarly, while pursuing stabilize strategies in environments with hi i levels of uncertainty appeared to be effective, harvest-tumaround strategies were ineffective for all the performance measures except nonresidential membership. Except for not being significant, probably because of a lack of statistical power, the test of hypothesis 3 yielded the most consistent findings. Therefore, hypothesis 4, because it is a composite of the three hypotheses that have been discussed to this point, could shed some light on the inconsistencies for hypotheses 1 and 2 .
Hypothesis 4The results of the test of hypothesis 4, though marginal,
highlights the importance of discussing the direction of the
254
Reproduced with perm ission o f the copyright owner. Further reproduction prohibited w ithout permission.

interaction terms for hypotheses 1, 2, and 3 in the preceding sections. Ordinarily, the lack of significant interactions for these three hypotheses could have led traditional contingency theorists (TCTs) to assert that "fit" theory does not apply. The reductionistic tendencies of TCTs make it difficult at times to detect the effects of significant individual interactions on effectiveness measures. Furthermore, because TCTs typically focus on pairwise relationships, they may be unable to detect overall patterns of internal consistency among context, structure, organization, and process variables. In addition, the holistic approach of systems analysis makes it possible for contingency or "fit" theorists to study the patterns of organizational performance when more sophisticated relationships exist.
The multiple approach to fit that was used in this study revealed that both congruent and contingency forms of fit could be operating to explain the performance differences between these organizations. As succinctly put by Drazin and Van de Ven (1985; p. 536), "Reporting tests of only one form of fit leaves more questions unanswered than resolved." Multiple forms of fit can also provide complementary and/or supplementary information that may be useful for developing a deeper and broader understanding of the relationship between variables. The additional information could also provide the impetus for the formulation of better and more meaningful theories.
255
Reproduced w ith perm ission o f the copyright owner. Further reproduction prohibited w ithout permission.

Hie results of the test of hypothesis 4 were more encouraging than for the interaction-based hypotheses, even though the profile deviation or systems analysis and its validation was only significant for residential membership. In general, leaders that: (1) have the following attributes: lew task-orientation, high people-orientation, liberal values, external locus of control, and (2) pursue growth strategies are more effective in uncertain environments. These findings are generally consistent with the formulation of hypothesis 4. The alternative theoretical base that could be used to explain the inconsistencies in the tests of the hypotheses are discussed in the following section.
Alternative Theoretical Explanations for InconsistenciesThe inconsistencies in hypotheses 1 and 2 can be explained
by configuration theorists assertion that the pairwise approach of traditional contingency theorists very often lead to confusing results (e.g. Van de Ven & Drazin, 1985). Consequently, because hypothesis 4 dealt with the multiple interdependencies between the variables of interest in this study, the patterns that were observed for the interaction-based hypotheses could be misleading since these relationships were based on the 'reductionistic' tendencies of the traditional contingency approach. In other words, the additional and supplementary information that was obtained through systems analysis in terms of the inconsistencies
256
Reproduced with perm ission o f the copyright owner. Further reproduction prohibited w ithout permission.

in the hypothesized relationships between the research variables/ constructs, underlies the following discussion.
When the inconsistencies in the tests of hypothesis 1 and 2 are examined along with the more comprehensive and inclusive test of hypothesis 4, there were basically two major inconsistencies: leaders with high task-orientation and internal locus of control may be ineffective in uncertain environments. Conversely, leaders with high people-orientation and external locus of control appeared to be more effective in uncertain environments. Miller, Kets de Vries, and Toulouse (1982) suggested that leaders with high task-orientation and internal locus of control would tend to be more effective. Alternatively, leaders with high people-orientation and external locus of control may also be effective under different conditions. Consequently, the effectiveness of high people-orientation and external locus of control could be a form of 'fit' that is peculiar to the organizations in uncertain environments and/or to the organizations in this study.
Furthermore, the Hersey and Blanchard (1974) situational leadership theory could be used to explain the low task- and high people-orientation effectiveness in this study. Hersey and Blanchard (HB) labeled people-orientation as "relationship" and used the high-lcw dichotomies for task and relationship centered behavior to develop four types of leadership styles. The lew task-high relationship category HB called "participating" and is
257
Reproduced with perm ission o f the copyright owner. Further reproduction prohibited w ithou t permission.

typical of situations where the leader and follower share in decision making, and the main roles of the leader are those of facilitator and communicator. Therefore, in uncertain environments, it may be necessary for the leader to create and exhibit a participative atmosphere in order to attain superior levels of performance.
There is no sound theoretical base for explaining why leaders with external locus of control would be effective in uncertain environments. The reported problems that respondents had with the questionnaire items that were designed to measure locus of control and the reliability coefficient for this construct makes this researcher hesitant to justify this inconsistency. Nevertheless, the lack of statistical power in the tests of hypotheses 1 and 2 and/or the possible "fit" between people-orientation and external locus of control as previously discussed, could possibly explain the inconsistency that were observed.
SummaryThe preceding sections dealt with the results of the
analyses of the hypotheses. In support of previous works, the systems approach to fit provided complementary information that could have been difficult or inpossible to obtain had only the traditional contingency approach been used. The limited number of significant interactions for hypotheses 1 to 3 and the
258
Reproduced with perm ission o f the copyright owner. Further reproduction prohibited w ithout permission.

marginally significant systems analysis could lead one to raise some important questions regarding the survey instrument, sample, or scsne other limitation of this study which are addressed in the following section.
T.imitations of study
The inconsistencies that were previously discussed, the lack of significant interactions, and the marginal support for systems analysis point out the need for enumerating the problems with this study. Specifically, the limitations that resulted from statistical conclusion, internal, construct, and external validity are discussed.
Statistical Conclusion ValidityCook and Campbell (1979) defined statistical conclusion
validity as that which derives frcan the conclusions that are drawn from the statistical evidence about cause and effect. Because this project was a field study, sane of the weaknesses of field studies apply. The inability of this researcher to better control the experimental situation leaves roan for the possibility of extraneous influences on the results obtained.The field setting additionally means that systematic and random noise persists. Therefore, the responses to the questionnaire may have been contaminated by uncontrollable factors like
259
Reproduced with perm ission o f the copyright owner. Further reproduction prohibited w ithou t permission.

fatigue, stress, or the different conditions under which the task was completed by each of the respondents. In addition, the following limitation could exist.
tfeak effects. The results of the fourth hypothesis is of concern in this study because the correlations were mostly marginally significant (p <.10). Ordinarily, a significance level of .05 or better is preferred (e.g. Venkatraman & Prescott, 1990). It is not unusual however for researchers to adopt a more liberal significance level of .10 in order for the effects that are observed to be considered marginally supportive of the hypothesis. The marginally significant results for hypothesis 4 could also be due to a lack of statistical power— a deficiency that systems analysis by nature cannot directly address (Drazin & Van de Ven, 1985).
Conclusion. All the steps that were necessary to enhance statistical conclusion validity could net be taken primarily because this was a field study. There were potential problems with measures partly because they had not been previously used with this type of sample. Furthermore, the inability to control the experimental setting added to the potential negative effects of extraneous variables. Therefore, the measures and the setting could have reduced the ability to detect stronger effects.
Internal ValidityThe validity of the statistical conclusions drawn with
260
Reproduced with perm ission o f the copyright owner. Further reproduction prohibited w ithou t permission.

respect to causality is referred to as internal validity (Cook & Campbell, 1976). Relevant questions are: did the measures capture what they were intended to? do the relationships infer cause and effect? and does the absence of a relationship imply the absence of cause? Potential limitations with respect to internal validity include instrumentation, inequity perceptions, rivalry, and demoralization.
Instrumentation. Ihe reliability estimates for the scale items ranged from a low of 0.52 for growth strategy to 0.81 for environmental uncertainty. Carmines and Zeller (1979) recommended reliability estimates of 0.8 or higher for well established scales. Conversely, this study represented the first time most of the scale items on the questionnaire have been used for the sample in this study. In fact, the respondents had difficulty with Rotter's (1966) locus of control scale which has been extensively used in the management literature. Ihe lew reliability coefficient (0.62) for Rotter's scale is an indication that there might have been some measurement problems in this study. This could partially account for the lack of more significant results in this dissertation because weak measures make it difficult to find hypothesized relationships.
Ineouitv perceptions. Ihe different levels of educational attainment of the respondents could have made the task of completing the survey instrument easy for seme of the subjects while making it difficult for the others. Ihe absence of any
261
Reproduced with perm ission o f the copyright owner. Further reproduction prohibited w ithout permission.

financial rewards could also have resulted in different levels of canmitment to completing the task. In addition, because only one or two churches were typically selected from the same community, the respondents may have communicated with other ministers that did not have to undertake the task of completing and returning the questionnaire. These factors may have contributed to the lower response rate— in comparison to the pilot study's— and the lack of significant results.
Demoralization. Since it was supposed to take anywhere frcmi 30 to 45 minutes to complete the questionnaire, subjects could have been demoralized toward the end of finishing the task. This could mean lower confidence in the scale items toward the end of the questionnaire. The possibility that the length of the questionnaire resulted in subjects either becoming frustrated or less attentive to the completion of the task is a threat to the findings in this study.
Conclusion. The internal validity threats to this study have been discussed in the preceding sections. Since it is the responsibility of the researcher to deduce internal validity threats to his/her study, the potential problem areas in this study (i.e. measures, inequity perceptions, and demoralization) have been highlighted. Furthermore, this study also potentially has construct and external validity problems. The construct validity problems are discussed in the following section while the external validity issues are addressed thereafter.
262
Reproduced with perm ission o f the copyright owner. Further reproduction prohibited w ithout permission.

construct ValidityProblems can arise in any research study when operations can
be construed in terms of more than one construct (Cook &Campbell, 1979). Whenever unexpected findings exist, construct validity problems became relevant. In this study, potential construct validation issues are: inadequate construct explication, mono-method bias, hypothesis guessing, evaluation apprehension, experimenter expectancies, and restricted generalizability across constructs.
Inadequate construct explication. In order for a study to have high construct validity, it must necessarily have proper and clear explication of constructs. Because there are usually multiple formal definitions of constructs available, different definitions could have been adopted by another researcher undertaking this study. Ihe unique approach that is taken by each researcher— dictated by the literature and logical assumptions— determines the chosen definition. Generally, preferred definitions should play a role in this choice but should not limit it. Ihe need to develop new definitions and expand on the more established ones are added considerations.The inadequate construct explication threat was probably more severe in this study because most of the scale items had not been previously used with this current group of subjects. Regardless, this threat is almost always present for all social science research and therefore is most likely present in this study as
263
Reproduced with perm ission o f the copyright owner. Further reproduction prohibited w ithou t permission.

well, even though the threat could have been minimized by the attempt at thoroughness in Chapters 1 to 3.
Mono-method bias. The mono-method bias threat refers to the use of a single method or procedure for task completion. This could be reflected in the way questions are structured and/or the response format for scale items. Whenever either or both of these situation(s) exist(s), there is potential for bias. In order to limit the effects of this threat, the researcher needs to vary questions and response scales from positive to negative. Even though attempts were made in this study to overcame mono-method bias, this threat could still have emerged.
Hypothesis guessing. Effects may be obscured by subjects that tried to figure out the goal(s) of this study. The increasing scrutiny that the "church" has come under in recent years could have influenced seme ministers to respond to the questionnaire in a socially acceptable manner, rather than on what their actual perceptions and beliefs were. The inability to use a random sample may have increased the existence of this threat. Even though, Cook and Campbell (1979) suggested that more knowledge about this threat and its effects on behavior are necessary, not using a random sample meant that hypothesis- guessing could have contaminated the data in this study.
Evaluation apprehension. This threat exists when subjects are apprehensive about being evaluated and therefore act in ways that they normally would not. In effect, the respondents seek to
264
Reproduced with perm ission o f the copyright owner. Further reproduction prohibited w ithout permission.

be seen in a positive light by the researcher. If there is evaluation apprehension, it could have distorted the true effects in the study. As mentioned in the preceding section, ministers have came under increasing scrutiny recently. Therefore, it is possible that this threat was present in this study.
Experimenter expectancies. This threat deals with the tendency of researchers to act in ways that direct the efforts of subjects to respond such as to confirm their hypothesis. Because this was a field study, this threat was probably minimized. The existence of this threat could be reflected, however, in the way the questions were structured and/or in the way the response formats were developed. Consequently, the existence or lack thereof of the experimenter expectancies threat could not be ruled out in this study.
Restricted aeneralizabilitv across constructs. The inability of a researcher to generalize his/her findings because of the typically narrow conceptualization of constructs is referred to as the restricted generalizability threat. Since it is usually impossible for researchers to account for all the measures that a construct may affect, the restricted generalizability threat could not be ruled out in this study.Ihe typical way to minimize this threat is to replicate this research study (Sidman, 1960). Replication is especially useful here because of the limited number of studies that have used ministers as their relevant sample.
265
Reproduced with perm ission o f the copyright owner. Further reproduction prohibited w ithout permission.

Conclusion. The threats of inadequate explication of constructs, mono-method bias, hypothesis-guessing, evaluation apprehension, experimenter expectancies, and construct generalizability most likely limited this study. Some of these threats may be overcome by future studies as more researchers focus on religious not-for-profit organizations, others may have to be accepted as part of the price that is paid for undertaking social science research. Nevertheless, another important validity issue deals with the generalizability of the findings in this study and is addressed in the following section.
External ValidityOne of the reasons for using a field experiment for this
research study was so that the effects observed could be stronger since the relevant realism attained through the experimental situation will supposedly increase the strength of the variables, contribute to external validity, and make generalizations to other situations more valid (Kerlinger, 1979). In general, external validity can be defined as the extent to which a causal association can be generalized over people, time, functional relationships, operations, or conditions (Cook & Campbell,1979). In general, the findings of this study may be limited over pieople, settings, and time.
Generalizability over people. The generalizability of the results of this study over people is somewhat limited in that the
266
Reproduced w ith perm ission o f the copyright owner. Further reproduction prohibited w ithout permission.

use of a non-random sample of leaders from one denomination, across a single state, precludes broad conclusions. Ihe results of this study cannot be generalized to the larger universe. In fact, seme of the findings may be unique to the sample of organizational leaders that were used as subjects.Encouragingly, some of the findings in this study are consistent with the previous conclusions of other studies that have dealt with religious not-for-profit organizations (e.g. Hadaway,1989). Regardless, it is important to replicate this study in some form across denominations and states to validate the instrument and the results. The only generalization that is perhaps possible would apply to organizations that have characteristics that are similar to the ones used in this study. Consequently, the results of the study may not be valid for all religious not-for-profit organizations.
Generalizability over setting. An additional problem with this study is that the results may not be applicable to the leaders of other organizations, especially managers. Moreover, these findings may not even be applicable to the leaders of other religious denominations in other states. Ihe administration of the task during the summer months— the period of time that most of these leaders are on vacation— could have also excluded seme otherwise important subjects. This could be partly responsible for the differences in the response patterns and rates for the pilot and main studies. Nevertheless, the point is that one
267
Reproduced with perm ission o f the copyright owner. Further reproduction prohibited w ithout permission.

cannot be sure that the results in this study can be generalized across organizations.
Generalizability over time, ihe generalizability of this work is further limited by the relatively few number of studies that have used samples of religious leaders. Cook and Canpbell (1979) explained the generalizability over time validity problem as the inability to extrapolate findings from the present to the future. The primary means of reducing this threat is through future replication of studies with the same or similar conclusions. As the not-for-profit sector becomes more important to strategy researchers, it could be possible to generalize the findings of this study in the future. Presently, the generalizability of this study is limited.
conclusion. Generally, external validity, unlike internal validity, must be addressed through inductive reasoning (Cook & Campbell, 1979). To overcame or minimize external validity threats mostly requires replication of studies. Unfortunately, replication, in spite of its usefulness, is not popular in academic circles. Furthermore, because this is a field study, an extensive amount of time and financial resources will be needed to replicate this study. Without this replication, the results of this study cannot be generalized. Despite the deficiencies that have been discussed in the preceding sections, this study has potentially important contributions that are discussed in the following section.
268
Reproduced with perm ission o f the copyright owner. Further reproduction prohibited w ithou t permission.

Contributions and Implications
The potential contributions of this study are twofold: (1) the need to use multiple approaches to fit for strategy research, and (2) understanding the importance of leader attributes and strategy to organizational effectiveness in an environmental uncertainty context in the not-for-profit sector. Ihese contributions along with their implications are also discussed.
Multiple approaches to fitContingency theory is one of the more dominant approaches to
studying organizations (e.g. Schoonhoven, 1981). Unfortunately, a mono-method approach has typically been adopted in analyzing the relationships between variables. Recently, researchers have suggested the need for more rigorous analyses of these relationships.
Contributions. This is the first study that has used both the systems analysis and contingency theory approaches to fit to examine the performance implications of leadership and strategy attributes in an environmental context. The works to date have dealt primarily with strategy-environment, structure-process-task uncertainty, or some other combination of these variables (e.g. Drazin & Van de Ven, 1985; Venkatraman & Prescott, 1990). The inclusion of leader attributes in this study was important to the
269
Reproduced with perm ission o f the copyright owner. Further reproduction prohibited w ithout permission.

extent that the congruence between them and strategy types could be validated for organizational effectiveness. Even though most of the interaction terms were not significant, the importance of using another approach to "fit" revealed that leader attributes and strategy may have important performance implications. As succinctly put by Drazin and Van de Ven (1985; p. 536) "We believe that the evaluation of multiple approaches to fit ... provides an example of knowledge accumulation that contingency-theory researchers should follow. Furthermore, because the forms of fit may differ across situations, multiple approaches to fit could help to minimize or eliminate what has traditionally been inconsistent contingency-theory findings." If only the traditional contingency approach had been used in this study, it would have been difficult to credibly suggest the importance of the leadership and strategy variables to performance measures. If nothing else, this dissertation may have answered the call of researchers like Venkatraman and Prescott (1990) for including leadership variables in systems analytic studies.
Implications. Ihe relevance of leadership to performance measures could be one of the important implications of this study. Ihis is especially true because support for research shewing the importance of leaders to the performance of their organizations has not always been positive. House and Baetz (1979), in their review of the literature on organizational
270
Reproduced with perm ission o f the copyright owner. Further reproduction prohibited w ithou t permission.

leaders, concluded that leadership can account for significant variations in organizational performance. The studies by Meyer (1975), Thomas (1988), and Weiner and Mahoney (1981) seem to support House and Baetz' conclusion. Conversely, Lieberson and O'Connor (1972), Salancik and Pfeffer (1977), and Pfeffer (1977) found that leadership did not account for much of the variances observed in the performances of the organizations that they studied. More recent studies that take the position that effective leadership does make a difference in the performances of organizations are partially supported by this study. Perhaps, the most important contribution of this study is that it adds to the relatively few number of studies that have used subjects from the religious not-for-profit sector; the potential importance of this is discussed in the following section.
Not-for-profit sectorWhile the focus of most management researchers on profit-
making enterprises is understandable, the apparent neglect of not-for-profit (NFP) organizations is perhaps unwarranted as they have become more important to the way of life in the United States in recent years (Stewart, 1989). Any effectiveness or efficiency gains that are made in the NFP sector could translate to higher wealth for the national economy. Consequently, more studies that increase our understanding of hew NFP organizations can be better managed are needed. This study is one such work.
271
Reproduced with perm ission o f the copyright owner. Further reproduction prohibited w ithout permission.

Contributions. This study has potentially contributed to the management field by extending contemporary approaches to fit to the NFP sector and examining the performance implications of the congruence between leader attributes and strategy in the same sector. Because there have been relatively few research studies in the NFP sector, the approaches that have been used for data collection and analysis have been rudimentary (e.g. Odom & Boxx, 1988). While data collection methods can be improved as more research works are undertaken, there is no excuse for limiting analysis of data to simple correlation procedures. Therefore, one of the potential contributions of this study is to pave the way for researchers in the NFP sector to use more comprehensive approaches for analyzing data.
Since some theorists (e.g. Hadaway, 1989) have suggested that leaders are important to the effectiveness of NFP organizations, this study provides seme empirical support for this position. Furthermore, there may be certain attributes that delineate effective from ineffective leaders depending on the goals of the organization. The tentative findings of the test for the interaction-based hypotheses indicate that different combinations of leader attributes may be effective when alternative performance measures are considered. In general, the results that are suggested by the traditional contingency approach coupled with the holistic results of systems analysis indicate that leader attributes and strategy are important for
272
Reproduced with perm ission o f the copyright owner. Further reproduction prohibited w ithout permission.

performance in the NFP sector. Since these results were not strongly supported, this study should provide the impetus for further research into the importance of leader attributes and strategy types to performance. The lack of strong support for the hyp»theses in this study should not discourage future works along the same lines. In fact, as better measures are developed, better results may emerge. Furthermore, when additional leader attributes are incorporated into these future studies, stronger and more meaningful attributes may lead to better mid-range theories. These theories could lead to a parsimonious number of leader attributes for identifying effective leaders.
Another potential contribution of this study pertains to generic strategies. This is probably the only study to capture the characteristics of generic strategies in the NFP religious sector. The three types of generic strategies that were identified in this study could serve as the foundation for developing more comprehensive and parsimonious measures of strategy for these organizations. This stream of research could lead to some valuable results. For example, the preliminary finding in this study, and the pattern observed in the pilot study seem to indicate that religious organizations may be reluctant to pursue "divest" or "harvest" strategies. If the tentative results in this study are replicated, then the performance implications of not pursuing a "divest" or "harvest" strategy could be undertaken. In addition, the ccmparison and
273
Reproduced with perm ission o f the copyright owner. Further reproduction prohibited w ithout permission.

contrast of the characteristics of generic strategies in the for-profit and not-for profit sectors could be facilitated.
An additional contribution of this study was negative but informative. It seemed that the subjects in this study had some problems with Rotter's (1966) locus of control scale. This scale has been extensively used with different subjects in the management literature. Ironically, it appears that this locus of control scale has never been used with religious leaders. Ihe problems that were encountered in this study is typical of what one would generally experience in doing research in the NFP sector. Even the instrument scales that have been well used in the for-profit sector have rarely been validated across other types of organizations, especially the religious not-for- profits. Consequently, this study again highlights the need for more meaningful research in the NFP sector.
Implications. Ihis study has implications for the management research literature, especially in the NFP sector. Research into the possible characteristics of generic strategies in the religious NFP sector have been initiated and future studies could make the literature even more complete. Ihe performance implications of leader attributes and strategy types were also highlighted. Whenever organizations have different goals, individually unique combinations of leader attributes may be necessary to delineate effectiveness. More importantly, the need for research studies that at least employ subjects from the
274
Reproduced with perm ission of the copyright owner. Further reproduction prohibited w ithout permission.

NFP religious sector are also needed.
Summary and ConclusionsIhe potential contributions and implications of this study
have been discussed in the preceding sections. Ihe necessity and importance of using multiple approaches to examining the fit between variables in management research were enumerated. Furthermore, the importance of leader attributes and strategy types to organizational performance were summarized.Specifically, the effectiveness of leader attributes and the possible exposition of the characteristics of generic strategies in the NFP religious sector were also discussed. Overall, the preceding discussion emphasized the need for more research studies along the same lines as this dissertation. Sane of the prepositions that could be addressed by these future research studies are discussed next.
Future Research
An important point that was reiterated in the preceding section was the need to replicate this study. In order to enhance and promote future research, a number of propositions will be offered. In addition, some methodological issues will be addressed.
275
Reproduced with perm ission o f the copyright owner. Further reproduction prohibited w ithout permission.

PropositionsIhe results, limitations, and implications of this study led
to seme prepositions for future research in this area. Ihe results raise seme interesting issues that future researchers should explore. Ihese prepositions are based on the relationships that were statistically significant. To date, researchers have not investigated the leadership style— task- and/or people-orientation(s)— that is most effective in an uncertain environment. Ironically, most of the significant relationships in the interaction-based hypotheses— and supported by the profile deviation or pattern analysis— were for leadership style. Consequently, three of the five propositions that are developed for future research deal with this construct.
Proposition 1. Leaders that are pecple-oriented are more effective in not-for-profit religious organizations when environmental uncertainty is high.
Proposition 2. High task-orientation may not enhance effectiveness in the religious not-for- profit sector when environmental uncertainty is high.
Proposition 3. High task-orientation may improveeffectiveness in the religious not-for- profit sector when environmental uncertainty is lew.
Proposition 4. Not-for-profit religious organizations are less likely to pursue a "harvest" or "divest" strategy even when faced with decreasing effectiveness.
276
Reproduced with perm ission o f the copyright owner. Further reproduction prohibited w ithout permission.

Proposition 5. Not-for-profit religious organizations are more likely to pursue "growth" and/or "stabilize" strategies.
In order to test these propositions in the future, several changes will need to be made to the present study. These changes include sample selection and measurement procedures.
Sample. There are several directions that could be followed with the study sample. It may be important for future studies to use random samples from within the same denomination as this may decrease scsne of the validity threats to the present study. Moreover, a more heterogeneous sample of religious organizations may be advantageous. A national sample of these organizations could also enhance the quality of the results of future studies. It is important to add that a sample that is random, across denominations, and 'national' also has its disadvantages. A randan sample from the list of qualified leaders could potentially limit the total available sample size, however, as was the case in this study. If a national pool of religious organizations is used, the sample size may not be a problem but the cost of the study could become a concern. The cost of undertaking this study at a national level could be prohibitive. In addition, the differences between denominations with respect to membership, reporting standards and the like became pertinent concerns for future studies. More importantly, future studies need to develop more reliable and valid measures for the
277
Reproduced with perm ission o f the copyright owner. Further reproduction prohibited w ithout permission.

explanatory or independent variables/constructs in this study.Measures. Ihe instrument scales for measuring constructs
have not been well developed in the not-for-profit sector. This is not unusual for situations where the literature is not well developed as is the case for this sector of the United States' economy. Future studies need to focus on developing more parsimonious measures of constructs/variables. This is necessary not only to increase the validity of these measures but also to improve their reliability. As better measures are developed, better theories can be formulated, and more meaningful research studies can be undertaken.
Summary and ConclusionsSuggestions were offered in the preceding sections regarding
the importance of leadership style to organizational effectiveness and the development of the content of generic strategies in the religious not-for-profit sector. These suggestions formed the impetus for the formulation of the prepositions that could be tested in future research studies. In addition, a general call for more research studies using subjects in other than for-profit organizations was made. Methodological issues regarding sample selection and measurement of constructs were also addressed. It was also highlighted that in the final analysis, it is only through more research studies that better theories can evolve.
278
Reproduced with perm ission o f the copyright owner. Further reproduction prohibited w ithou t permission.

Summary and Final CommentsThis chapter presented the consistencies and inconsistences
in the tests and results of the hypotheses. For the most part, the interaction-based hypotheses (i.e. 1, 2, and 3) were not statistically supported. One important result relates to the suggestion that people-oriented leaders may be more effective in uncertain environments than task-oriented leaders— a result that could be explained with the Hersey and Blanchard's situational leadership theory and/or a unique finding for the population from which the sample for this study was drawn. Nevertheless, the importance of the leader attributes and strategy types in this study to performance measures were marginally supported by the results of the systems analysis. This finding was generally consistent with the hypothesis. More importantly, this study again reiterated the need for contingency-based researchers to adept multiple approaches in the analysis of data.
This study was not without its deficiencies and they were pointed out as the potential limitations of this project. These faults included threats to statistical conclusion, construct, internal, and external validity. In spite of these real and potential problems, the contributions and implications of this study were discussed. Of special note is the additional and complementary information that researchers can obtain from using multiple approaches to fit.
279
Reproduced with perm ission o f the copyright owner. Further reproduction prohibited w ithou t permission.

Furthermore, future research suggestions were made in the form of five propositions. Ihe most interesting one was the importance of people-oriented leadership to effectiveness measures in uncertain environments. In" addition, the need for this study to be replicated was also highlighted, and the contribution that this study could make to the management literature in general and to the not-for-profit literature specifically were discussed throughout. In conclusion, because this dissertation may have contributed seme insist into the relevance and importance of the pertinent variables, it is offered as a complement and an extension to previous works and a basis for future research studies. In the final analysis, the validity and reliability of the results of this study will be upheld only by the findings of future studies.
280
Reproduced with perm ission o f the copyright owner. Further reproduction prohibited w ithou t permission.

APPENDIX A
281
Reproduced with perm ission o f the copyright owner. Further reproduction prohibited w ithout permission.

ERENOTIFIOVTION LETTER FOR PHOT STUDY'S QUESTIONNAIRE
Department of Management College of Business Administration University of Arkansas Fayetteville. AR 72701
«name»*IF company*<>company»«ENDlF»«street»«dty», «state» «zip»«lF company=“ »«EN'DIF»
Dear Reverend «sai»,
Endosed is the survey that I mentioned in my earlier correspondence with you. Again, please note that all the information that you provide will be held in the s&iciest confidence. Completing the questionnaire will only take about thirty minutes of your time. Mostly, the survey requires that you read certain statements and then indicate on a given scale how much you agree or disagree with them. The code on the business reply envelope is to prevent me from writing a reminder letter to those who have already responded to the questionnaire. Please, do not put your name or the name of your church on the questionnaire unless you want a summary of my findings. I assure you that your name and the name of your church will not be in my data set, only your responses to the questions in the survey.
I will really appredate it if you will mail the completed questionnaire back to me in the business reply envelope that is endosed within the next two weeks. Again, if you need additional information about me or my study you can call the Chairman of my Dissertation Committee (Dr. John Todd) at 573-4059, or my Pastor at 521-2S89.
Thank you very much for your help in this regard. I believe you will find the questionnaire interesting. The summary of the results will be available to you as indicated on ‘he last page of the questionnaire. My prayer is for God's blessings to be upon you, your family, and your congregation.
Sincerely,
Tope Bello
282
Reproduced with perm ission o f the copyright owner. Further reproduction prohibited w ithout permission.

OCfVER LETTER FOR PILOT STUDY'S QUESTIONNAIRE
Department of Management College or Business Administration University of Arkansas Fayetteville, AR 72701
«name~n: comoany»«company»«ENDlF»«street»«dty», «state» «zip*.tIF company=- »«ENDEF»
Dear Reverend «sal»,
I am a student at the dissertation stage of my doctoral study at the University of Arkansas. My disseradon deals with church growth and church administration. I need to collect data from the pastors of selected Baptist churches in Arkansas through a survey that I will mail to you within the next few days. I will very much appreciate your partitipation. Please be assured that the information you provide will be used for research purposes oniv and will be held in the strictest confidence. The questionnaire will only take about thirty minutes of your time to complete. A postage-paid reply envelope will also accompany the survey to make it easier for you to send your completed questionnaire back to me.
Please, help me. I have been in contact with die Associate Executive Director of the Arkansas Baptist State Convention in Little Rode, Jimmie Sheffield and he is aware of what I am doing. I am a Christian and if you need additional information about me or my study you can call collect the Chairman of my Dissertation Committee (Dr. John Todd) at 575-4059, or my Pastor at 521-2935.
Thank you very much for your help in this regard.
Sincerely,
Tope Bello
283
Reproduced with perm ission o f the copyright owner. Further reproduction prohibited w ithout permission.

QUESTIONNAIRE for pilot study
The information provided throu i this survey is coopletely CCNFIDENTIAL and will be used for rjesearo purposes only.BAOCTXH) DffDRWriCN
When was your cnuro established? .How many full-time ministers does your church have? _How many part-time ministers (if any) does your church have? _____For how long have you been in the oinisoy full-time (i.e. as youth pastor, associate pastor, pastor, etc.)? ______Kou long have you been a senior pastor? . In hew marrychurches have you served as the senior pastor? ______Please describe (in one sentence) the primary objective of your church over the last four years:
How long have you served as the senior pastor of your present daarch?What is the highest aeade&ic degree you have earned? _________________Do you have Seminary training ? ____How old are you? _____What is the accradratc age breakdown of the regular attendees at your church?:Using for increase and for decrease and "o" for no charge, please indicate for earn age group whether there has been an overall increase or ft**— **** in the last five years. Direction of change over the last_5years
under 12 \ ..
teenagers t ____young adults (20-35) \ ____older adults (36-65) \ ____senior adults (over 651 X ____TOTAL 100 \
284
Reproduced with perm ission o f the copyright owner. Further reproduction prohibited w ithou t permission.

SIRJOTE7 DESOOFnCN The following paragraphs describe four types of strategy. Please read all four descriptions before ewosing one. None of these strategies is inherently “good" or "bad". Please circle the letter that best describe the type of strategy that your church is currently pursuing:(a): the basic saategy of our church is to:-scop and reverse our declining meooership as quickly as possible-do a better job of managing, budgeting, and consolling our church organization-to cut back on the number of ministries that we have -1do some drastic things in order to ascertain the fuozre viability of our congregation.(b): the basic strategy of our church is:-to grow by continuously expanding our ministries -use creative and innovative ministry approaches -correctly "pactoge" and "market" the gospel -continuously monitor our external envirorment -be willing to take rista-rake decisions based on their long-tera effects •make our organizational smacsire flexible.(c): the fcesic strategy of cur tfaurdi is:-primarily for the spiritual and physical developmental r**An of our apwrrrs-to identify sane sepnents in our catuunity to to-to provide the best ainiscry to these specific segments •to have good cost consol measures, efficiency of operations, and doing what we do best to achieve cur ministry objectives to these people.(d): the basic strategy of our congregation is to:-vind down our operations-prune our ministries and eventually close our AurA doors -sell seme of the assets that are not essential to us -ultimately sell our building.Has there been a charge in the scategy used by your tfosth (based on the descriptions given above} firm one of these soratagy categories to another within the last four years? _.____If "Yes**, please explain.
Has your congregation been enthusiastically supportive of this Cange in strategy ? ___ If "No", please e lain.
285
Reproduced with perm ission o f the copyright owner. Further reproduction prohibited w ithout permission.

Please indicate on a scale of 1 - 5 how tudi the following factors have GiANGS) in your camurucy over the last four years:Intone (or no Ganges), 2*Alaost none (or alsest no changes), 3*Sane (or sane changes), - Significant charges, 5«Always Ovuiging
Hone Sane Always The size of your eecnunicy 1 2 3 4 5General educacicnal level, age, and socio-eccncaic status ofindividuals vithin the cmamity 1 2 3 4 5Presence of a new population grog) vithin the coRirunity to which a church ray develop a ninisrry (eaocples: college students)Heeds of individuals within the camunityThe types of rainissries being offered by other churiJ&s in the caxxmityType and level of assistance available frco the csunty association or state conventionGoverrsnent regulation of the cturcdi or its ainiscryGeneral receptiveness of individuals in the coxumty to the church's ainisdesThe general eccnaaic conditions in the caoxnityKind of ccTRumty in which the churti is looted (e.g. change free rural to town)
1 2 3 4 51 2 3 4 5
1 2 3 4 5
1 2 3 4 5
1 2 3 4 5
1 2 3 4 5
1 2 3 4 5
1 2 3 4 5
286
Reproduced with perm ission o f the copyright owner. Further reproduction prohibited w ithout permission.

If: l=Never, ;=Alrost Never, 3=Saretunes, 4=Frequently, S=V. Frequently How frequently 60 you as the minister: Never Sometimes(a) take time to explain to individual mercers of your church which tasks are expected of than
(b) ask the congregation to try out your new ideas(c) decide personally what will be doneby the church and how to do it(d) assign specific congregationalmembers to particular tasks(e) make certain that the church understands ycur role(f) prepare specific and detailed work schedules for the staff and volunteers(g) insist that the oangregaticn follow known procedures and policies(h) create a pleasant church climateby thanking a member for his/her efforts(i) ask for and use the congregation's ideas(j) treat the congregation as your equals in decision making(k) let the congregation knew well in advance of impending changes(1) demonstrate a great deal of personal concern for each renter's welfare(m) listen to the congregation and make changes based on their suggestions(n) act on your own initiative without consulting the congregation when making important decisions
V. FTeq.
5
287
Reproduced with perm ission o f the copyright owner. Further reproduction prohibited w ithout permission.

Please circle the nunber that best describe your views on thefollowinq issues:
In general, I favor a strong exchasis cn tried and crue approaches to doing things 1
We have not started any w ministries in the last four years 1
I try to avoid risky projects as ouch as possibleIn general, because of cur envircrsnent, I believe our cuimh should change very cradtally, via slow, ingpental behavior
I prefer doing 6 things in new waysWe have started a lot of new
6 ministries in the the last four yearsIn order to bring about 6 progress, I often engage in risky projectsBecause of the nature of cur envirerrent, bold, wide-ranging changes are necessary 6 to attain oojectives
When confronted with decisiorr-eaking sifcaticns involving uncertainty, I typically:Adept a cautious, wait- and-see peerage in order to minimise the probability of making costly decisions
I monitor our envircrcent occasionally to see if there are things that our church should do, not do, cr do differently 1
adopt a bold, aggressive posmre in order to maximize the probability of esq&oiting potential € opportunitiesI constantly monitor cur envirerrent so that our tiunrch will be able to identify new ministry
6 opportunities
288
Reproduced with perm ission o f the copyright owner. Further reproduction prohibited w ithou t permission.

Please answer 'Yes' cr 'No1 to the following questions:
Our Cancn has an active (at lwst cnee a rcrth): dildren's minisoy (under L2) youth ministry (12 - 19years) music minisayvisitation ainiscy to nomesCersVMJ ainisQryfirotherhoed ainisnyounisary to young adults (20 - 35yrs)niniscry to older adults (36 - 65yrs)ministry to the poorministry to the baselessvisitation ministry to aenbersministry to single mothers
Please list ether ministries that your church has (for exaaple, ainistty to college students) .
‘the following questions deal with two ways of viewing the sane issue. Please chrxwe the letter option for each of the following that ccne the closest to your belief.1. a. Qiildren get into trouble because their parents punish thentoo such.b. The trouble with most children nowadays is that their parents are too easy with them.2. a. Many of the unhappy things in people's lives are partly due tobad luck.b. People's aisforttnes result froa the mistakes they make3. a. One of the major reasons why we have wars is because people don'ttake enough interest in politics, b. There will always be wars, no ratter how hard people try to prevent thss.4. a. In the long run. people get the respect they deserve in this
world.b. unfortunately, an individual's worth often passes unrecognized no matter how hard he cries.5. a. The idea that teachers are unfair to sejdents is nonsense.b. Host sojdents don't realize the extent to which their grades are influenoed by accidental happenings.
289
Reproduced with perm ission o f the copyright owner. Further reproduction prohibited w ithout permission.

6. a. Without the riant breaks one cannot be an effective leader, b. capable people wno fall to beucug leaders have not takenadvantage of their opportunities.7. a. No ratter how hard you cry scne people just don't like you. b. People vro can't get others to like them don't understandhow to get along with others.8. a. Heredity plays the major role in determining one's persorality. b. It is one's experiences in life which determines what theyare like.9. a. I have often found that what is going to happen will happen.b. Trusting to fate has never turned out as veil for me as making a decision to take a definite coarse of action.10.a. In the case of the well prepared student, there is rarely if ever such a thing as an unfair test.b. Many times exam questions tend to be so unrelated to course work that studying is really useless.U.a. Beaming a success is a ratter of hard work, luck has little or nothing to do with it. b. Getting a good job rainly cn being in the right place atthe right tiae.12.a. The average citizen can have an influence in government decisions b. This world is r\si by the few people in power, and there is not such the little guy can do about it.U.a. When I sake plans, I aa almost certain Chat I can make then work b. It is not always vise to plan too far ahead because many things turn out to be a matter of good or bad fortune anyhow.14.a. There are certain people who are just no good, b. There is soae good in everybody.15.a. In ay case getting what I want has little or nothing to do with luck.b. Many times we night as veil decide what to do by flipping a coin.16.a. Vho gets to be boss often depends on who was lucky enough to be in the right place first.b. Getting people to do the right thing depends upon ability, luck has little or nothing to do with it.17.a. As far as world affairs are concerned, most of us are the victims of forces we can neither understand nor ccn&ol.b. By taking an active part in political and social affairs, people can control world events..18.a. Most people don't realize the extent to which their lives are concolled by accidental happenings, b. There really is no surt thing as luck.
290
Reproduced with perm ission o f the copyright owner. Further reproduction prohibited w ithout permission.

19.a. Cne should always be willing to admit one's mistakes, b. It is usually better to cover up one's mistakes.20.a. It is hard to taow whether or not a person really likes you.b. How oany friends you have depends upon how nice a person you are.21.a. In the long run the bad things that happen to us are balanced by the good ones.b. Host misfortunes are the result of lade of ability, ignorance, laziness, or all three.22.a. With enough effort we can wipe out political corruption.b. It is difficult for people to have cueh control over the things politicians do in office.23.a. Scnetimes I can't understand how teachers arrive at the grades they give.b. There is a direct connection bcc-een hew hard cne studies and the grade cne gets.24.a. A good leader ej ects people to decide for theaselves vnat they should do.b. A good leader makes it clear to everybody that their jobs are.25.a. Many tines I feel that I have little influence over the things that happen to me.b. It is iscossible for me to believe that chance or luck plays an important role in my life.26.a. People are lonely because they don't Sr/ to be friendly.b. There's not nxh use in trying too hard to please people, if they like you, they lice you.27.a. There is too nuch emphasis on athletics in college.b. Team sports are an excellent ray to build character.28.a. What happens to me is ay own doing.b. Sane tines I feel that I don't have enough ccnool ever the direction cy life is taking.29.a. Host of the time I can't understand why politicians behave the way they do.b. In the long run the people are responsible for bad goverment on a national as veil as on a local level.
291
Reproduced with perm ission o f the copyright owner. Further reproduction prohibited w ithout permission.

Please write Che number that cones closest ts the level of your agreenent or disagreement with the following statements if: l-strorqiy agree, decree, 3*sliCitly agree, 4-sligfttly disagree, S«disagree, and 6»sccngiy disagreeGOVEBfflgfT/BUSINESS WO GENERAL WELFARE ISSUES
Corporations have too sudi influence on the SA SDoutcose of the presidential elections 1 2 3 4 S 6Current tax laws allow wealthy individuals topay less than their fair share 1 2 3 4 5 6The disadvantaged in our society suffer becauseof the economic power exerted by large corporations 1 2 3 4 5 6Tax laws should be chanced to close loopholesthat allow wealthy individuals topay 1 2 3 4 5 6proportionately less taxes than low-incane individualsfcoduct quality standards should be set byregulatory agencies to protect ecnsuaers 1 2 3 4 5 6Cne of the principal purposes of goverraent shouldbe to protect the citizen firm the economic powergenerated by large corporations 1 2 3 4 5 6Advertising is often a devious aethod used by ccnpaniesto lure custanprs into purmasing their product 1 2 3 4 5 6TO ensure adequate care of the side, we need to change the present systes of privately owned andcontrolled medical care 1 2 3 4 5 6Executives of toy-producing cssariies should be subject ts jail sentences for failure to infersparents that their prceuets may be harzadous 1 2 3 4 5 6Carpanies should not have business dealings withether corpanies wtiicn ignore their responsibilityto protect the envircment 1 2 3 4 5 6The quietened pace of business and competition hastaken a heavy toll on the quality of life 1 2 3 4 5 6
292
Reproduced with perm ission o f the copyright owner. Further reproduction prohibited w ithout permission.

Please circle tbe numcer that cares the closest to the level of your agreement or dasgraeeoent with the following sttatements if: l-sacrgly agree, 2*agree, 3-slightly agree, 4*sligntly disagree S isagree, and 6-strongiy disagreeHUttN R ia n s AND RESF3tSZ31LnX£S SAGoverrvent programs to aid the poor usually support those people too lary to work
The children that are bom as a result of racially mixed marriages are detrirents to societyProtestors and radicals are good for society even though they may cause a diange in normally accepted standardsV*e wculd not have so many juvenile delinquents if parents were stricter with their childrenThere are too sany professors in our colleges and universities who are radical in their andpolitical i 2A business should not hire a person if they suspect 1 2 hin of being a hoccsexuallabor unions should not have the right to ssrike ytven the survival of the business is threatenedMany blacks would be executives of sajor corporations if they had not been discriminated against in the pastEven though the resulting cost may mean a reductionin profits, business should set and attest tomeet minority hiring quotas 1 2
4 5SO6
4 5 6
4 5 6
4 5 6
If you will Like a copy of the results of this survey, plaase put your name and address below:
thahk you vro mu® tor twoug ids out of your busy sogxxjlz to fulCUT THIS QUESTIONNAIRE. YOUR 10JOG5S IS VERY MUCK AFSTOOA23D.
293
Reproduced with perm ission o f the copyright owner. Further reproduction prohibited w ithou t permission.

REMINDER POSTCARD LETTER FOR PHOT STUDY*
[tear Rev. _____________I have prayed that the Lord will more than make up to you the time that you spend to fill out the survey that I sent to you a few days ago. You will be helping a "brother" in need by responding to my survey. Please help me.You may take till June 25 to return the survey if you need more time. Please call me collect at 521-6646 if you have misplaced the one that I sent to you. If you have filled out the survey, thank you and may God richly bless you.Sincerely,Tope Bello
* This letter was handwritten for the forty-two pastors that were selected for the pilot study.
Reproduced with perm ission o f the copyright owner. Further reproduction prohibited w ithou t permission.

APPENDIX B
295
Reproduced with perm ission o f the copyright owner. Further reproduction prohibited w ithout permission.

ERENOTIFICATION LETTER FOR MAIN STUDY'S QUESTIONNAIRE
Department or Management College or Business Administration University of Arkansas Fayetteville. AR 72701 July 26,1991
vname^tF comoany*«company»«END[r»«street»"Cty*, «state» «zip».<EF company="*«iEND[F»
Dear Reverend «sal»,
I am a student at the dissertation stage of my doctoral study at the University of Arkansas. My dissertation deals with church growth and church administration. I need to collect data from the pastots of selected Baptist churches in Arkansas through a survey that 1 will mail to you within the next few days. I will very much appredate your parncpadon. Please be assured that the information you provide will be used for research purposes onlv and will be held in die strictest confidence. The questionnaire will only take about thirty minutes of your time to complete. A postage-paid reply envelope will also accompany the survey to make it easier for you to send your completed questionnaire back to me.
Please, help me. I have been in contact with the Associate Executive Director of the Arkansas Baptist State Convention in Little Rock, Jimmie Sheffield and he is aware of what I am doing. I am a Christian and if you need additional information about me or my study you can call collect the Chairman of my Dissertation Committee (Dr. John Todd) at 573-4059, or my Pastor at 521-2989.
Thank you very much for your help in this regard.
Sincerely,
Tope Bello
296
Reproduced with perm ission o f the copyright owner. Further reproduction prohibited w ithout permission.

COVER T .HI'1'KR FOR MAIN STUDY'S QUESTIONNAIRE
Department or Management College of Business Administration University or Arkansas Fayetteville. AR 72701 August 2.1991
«name»«IF comoany»«company»«ENDIF»«street»«dty», «state» «dp»«ir company=- *«ENDIF»
Dear Reverend «sai»,
Endosed is the survey that I mentioned in my earlier correspondence with you. Again, please note that all the information that you provide will be held in the strictest confidence. Completing the questionnaire will only lake about thirty minutes of your time Mostly, the survey requites that you read certain statements and then indicate on a given scale how much you agree or disagree with them. The code on the business reply envelope is to prevent me from writing a reminder letter to those who have already responded to the questionnaire. Please, do not put your name or the name of your church on the questionnaire unless you want a summary of my findings. I assure you that your name and the name of your church will not be in my data set, only your responses to the questions in the survey.
I will really appreciate it if you will mail the completed questionnaire back to me in the business reply envelope that is endosed within the next two weeks. Again, if you need additional information about me or my study you can call the Chairman of my Dissertation Committee (Dr. John Todd) at 573-K159, or my Pastor at 521-2989.
Thank you very much for your help in this regard. I believe you will find the questionnaire interesting. The summary of the results will be available to you as indicated on the last page ot the questionnaire. My prayer is for God's blessings to be upon you, your family, and your congregation.
Sincerely,
Tope Bello
297
Reproduced w ith perm ission o f the copyright owner. Further reproduction prohibited w ithout permission.

MAIN STUDY'S QUESTIONNAIRE
The inf ora* cion provided through this survey is completely C9KrZ9CrriAL and will be OSZB TOR RESEAROl PURPOSES ONLY.BACKGROUND IHFORKATIOH How many full-time ministers does year church have? „
How seny part-time ministers does your church bava? ..How many years have you baan in tba ainistry full-time (i.e. as youtb pastor, associate pastor, pastor, ate.)? ..In bow cany churches bava you sarvad as tba senior pastor? _ _ _ _ _Ara you tba sanior pastor of this cbureb (Yes or Ho)?How many years have you servad aa the paster of your present cbureb? ____What is the highest academic degree you bava earned? _ _ _ _ _ _ _Did you graduate from a Seminary (Yes or Ho)? _____Hcv old are you? .Using for increase and ■-■ for decrease and *o* for no change, plaasa indicate whether there has baan an overall increase or decrease in your cbureb membership over the last four years: -
There are no right or vrong answers to the following statements, it is your opinion that counts. Plaasa eirele the number that best describes your views on the following issues:In general, I favor a strong emphasis on tried and true approaches to doing thingsI try to avoid risJcy projects as such as possible
I prefer doing things in sew ways
In order to bring 1 2 3 4 5 6 about progress, Ioften engage in rls)cy projectsWhen confronted with decision-safcinq situations involving uncertainty, I typically:Adopt a cautious, wait- and-see posture in order to minimize the probability of mafcing costly decisions
Adopt a bold, aggressive posture in order to saximize the probability of exploiting potential opportunitiesOverall, would you consider yourself to be a risk-taker with regard to your job as a pastor (Yes or Ho)? _ _ _
298
Reproduced with perm ission o f the copyright owner. Further reproduction prohibited w ithout permission.

Plaasa indicate on 4 seals of 1 to < hcsr sues you agree or disogreo vita tAo following stataaents regarding ta* general direction of your eaurca over tAa last four years. 2i*r* *r* do correct or incorrect responses.1-atrongly agrao (SX) *-eligAtiy disagree > * 9 T M5-disagree 3-oLightly agree -strongly disagree (SO
Trying ts reverse declining memftersalpContinuously iaeaasing tAa manor of ministriesPrimarily focusing on meeting the spiritual and pfiysical seeds of our present saaOarsReducing tAe nuuSer of our ministriesTrying ts rivers* declining financial receiptsIntroducing and developing ministries tAat are not provided ay tA* otnar cAurcaas In our cosaunityVa are doing tAa tua tilings va have always donaVo are cutting bacA on eur operating castsVa are reorganising tAa vmy va do tAisgsDecisions aapAaslsa tAa long tara or the Tatar* viability of our cAcrcA, a van at aAcrt-rsa eastsVo art aiaistaring ts a fav specific sogaosts in ecr esssunityVa are vindlng dovn ecr eparmtions because va fe«l tAst closing eur cAurcA doers vill bast sarva cur caaunity and our ranaining membersVa have cAsngad pastors vltAin tAa past two years
sx1
To vbst degree do you as tAa pastor dictate tAa general direction in v&leA your cAcrca is haadod (a.g. 30* for Aalf way)
299
Reproduced with perm ission o f the copyright owner. Further reproduction prohibited w ithout permission.

There an no right or wrong responses to the iteas in this section as long a* it is representative ot vfiat you believe to have happened In youx coBxnmity over the last four years.Please indicate 70 WHAT 0EGRET the following factors have CHANGES in your coeaunity over the last four years.1-no changes 2-elaost no changes 3»soae changes4-signiiicant changes 5-alvays changing
None SosoThe sire of your coaaunity 1 2 0General educational level, age, and socio-econoaic status ofindividuals vithin the cosaunity 1 2 2Presence of a new population group vithin the ccaaunity to which a church saydevelop a sinistry (e.g. college students) 1 2 3Heeds of individuals vithin the cosaunity 1 2 3The types of ministries being offered byother churches in the cosaunity 1 2 3Type and level of assistance availablefrom the eounty association 1 2 3Gcvemsent regulation of the church orits sinistry 1 2 3General receptiveness of individuals inthe cosaunity to the church’s ainistries 1 2 3The general econoaic conditionsin the co&aunity 1 2 3Kind of esassunity in which the churchis located (e.g. change froa rural Co town) 1 2 3
Always3
5
55
S
5
5
5
S
5Overall, have the changes in your ccaaunity bean positive (■*■). negative (~) • or had no effect (o) on your church? ___Of the ainistries that are listed, please CI2C1 the ones that your church is actively involved with. An active ministry is one that aeets at loast once a aonth.
children's sinistry (under 12), youth sinistry (12 - I9years),ausie sinistry visitation ainistry to nonaeaberswhu sinistry Brotherhood ainistryPlease list other ainistries that your church has (for exaapla, niaistry to college students) _ _ —
300
Reproduced with perm ission o f the copyright owner. Further reproduction prohibited w ithout permission.

The following questions deal with how frequently you take certain actions vnen you encounter a particular situation. Please circle the nuaner that is sost representative of your choice of action under the following conditions. There are no right or wrong responses.1-Never 2-A_Lmoat haver 3-So*eti»esi-Frequently 5-Very frequently
flov frequently do you as the sinister: Haver Some Claes 7. Preq.(a) take tine to explain to individual kcabers of your church which basts are expected of them 1 2 3 4 5
<b> ash the congregation to try out your new ideas 1 2 3 4 5(c) decide personally what will be done by the church 1 2 3 4 S(d) assign specific congregational aeabers to particular tasks 1 2 3 4 S(•> sake certain that the congregation understands your role 1 2 3 4 5(t) prepare specific and detailed work schedules for the staff and volunteers 2 3 4 5(9) insist that ehureh aeabcrs follow known procedures and policies 1 2 3 4 5Cb) create a pleasant church ataospbere by thanking a sesber for his/her efforts 1 2 3 4 5(i) use the congregation's ideas 1 2 3 4 5(3) treat the congregation as your equal in decision caking 1 2 3 4 St*) let the congregation know veil in advance of impending changes 1 2 3 4 5U) desonstrata a or»nt <4*n\ of nersowil concern for each manner's welfare 1 2 3 4 5(3) listen to the congregation by making changes based on their suggestions 1 2 3 4 S(n) act on your own initiative without consulting the congregation when ■aking laporcant decisions 1 2 3 4 5
301
Reproduced with perm ission o f the copyright owner. Further reproduction prohibited w ithou t permission.

The following questions deal with two ways of viewing the saae issue. ?lesee CIRCLE THE Q2E letter fa" or *b") that identifies the option that you believe has eob? T?-UTM to it than the other option. If you believe that NEITHER stateaenc has any truth to it, then choose the option that is MORE TOLERABLE. There are no right or wrong choices.1. a. Many ot the unhappy things in people's lives are pertly due tobad luck.b. People's aisfortunes result froa the Bistakes they sake.2. a. One of the aajor reasons vhy we have wars is because people don'ttake enough interest in politics, b. There will always be wars, no natter bow hard people try to prevent thea.3. a. In the long run, people gat the respect they deserve in thisworld.b. Unfortunately, an individual's worth often passes unrecognised no aattar how hard he tries.4. a. Tba idea that teachers are unfair to students is nonsense.b. host students don't realise the errant to which their grades areinfluenced by accidental happenings.5. a. Without the right breaks one cannot be an effective leader, b. Capable people who fail to beccae leaders have not takenadvantage of their opportunities.6. a. No setter bow hard you try soss people just don't like you. b. People who can't get others to like then don't understandbow to get along with others.7. a. I have often found that what is going to happen will happen, b. Trusting to fate has never turned out as veil for ae as saklaga decision to take a definite course of aetion.8. a. In the ca.se of the well prepared student, there is rarely if eversuch a thing as an unfair test, b. hany tires exac questions tend to be so unrelated to course work that studying is really useless.9. a. Becosing a success is a natter of bard work, luck has little ornothing to do with it.b. Getting a good job depends nainly on being in the right place atthe right tiae.10.a. The average citizen can have an influence in govemaent decisions.b. This world is run by the few people in power, and there is not such the little guy can do about it.11.a. When I aake plans, I ae alaost certain that I can aake thee work, b. It is not always wise to plan too far ahead because eany thingsturn out ts be a setter of good or bed fortune anyhow.
302
Reproduced with perm ission o f the copyright owner. Further reproduction prohibited w ithout permission.

Pleas* CIRCLE THE S£E letrer ("a* or ab") that identifies the option for aacn of tba following issues that you believe das MORE tthttw to it than the other option. If you believe that NEITHER statement has any truth to it. than ehoosa the option that is MORE TOLHUIBLE. Thera are no right cr wrong ehoicas.12.a. In ay case getting vbat X want has little or nothing to do vith luck.b. Many tines we sight as vail decide what to do by flipping a coin.12 .a. Who gets to ba boss often depends on vho vas lucky enough to be in the right placa first.b. Getting people to do the right thing depanda upon ability, luck has little or nothing ta do vith it.14.a. Xs far as world affairs are concerned, most of us are the victias of forces we can neither understand nor control.b. By taxing an active part in political and social affairs, people can control world events.12.a. Most people don't realize the extent to which their lives are controlled by accidental happenings.b. There really is no such thing as luek.12 .a. It is hard to knew whether or not a person really likes you.b. Bov aany friends you have depends upon hcv nice a person you are.17.a. In the long run the bad things that happen to us are balanced by the good ones.b. Most aisfortunes are the result of laek of ability, ignorance, laziness, or all three.15.a. With enough effort v* ean wipe out political corruption.b. Xt is difficult for people to have auch control over the things politicians do in offiee.19.a. Soaetiaes X ean't understand how teachers arrive at the grades they give.b. There is a direct connection between bov bard one studies and the grade one gets.20.a. Many tiaes X feel that X have little influence over the things that happen to ae.b. Xt is la possible for as to believe that chance or luek plays an laportant role In »y life.21.a. People are lonely beeause they don't try to be friendly.b. There's not auch use in trying too bard to please people, if they like you, they like you.22.a. What happens to ae is vy own doing.b. Soaetiaes X feel that I don't have enough control over the direction sy life is taking.
303
Reproduced w ith perm ission o f the copyright owner. Further reproduction prohibited w ithou t permission.

23.a* Host of the time I can't understand why politician* behave tbs vay they do.b. In the long run the people ere responsible for bed government on a national as veil as on a lofcal level.
The following questions deal with bow each you agree or disagree with certain statements about the government, businesses, and social issues. Again, there are no correct or incorrect responses. Please erRCLE tht KE>*3Q that represents hov you feel about the following ststeaents.l-*trongly agree (SA) 2«agree 3-slightly agree4-sligfttly disagree 5-disagree 6«strongly disagree (SO)
Corporations bave too auch influence on the SA SOouteoae of the presidential elections 1 2 3 4 5 6Current tax lavs allow wealthy individuals topay less than their fair share 1 2 3 4 5 6The disadvantaged in our society suffer becauseof the economic power exerted by large corporations 1 2 3 4 5 6Tax lavs should be changed to elose loopholes that allow wealthy individuals to payproportionately less taxes than 1 2 3 4 5 6low-incoae individualsProduct quality standards should be set byregulatory agencies to proteet consumers 1 2 3 4 5 6One of the principal purposes of government should be to protect the eitizen from the economic powergenerated by large corporations 1 2 3 4 5 6Advertising is often a devious octhod used by cspanies ts lure custoaers into purchasing theirproduet 1 2 3 4 5 6To ensure adequate care of the sick, we need to change the present system of privately owned andcontrolled oedieal care 1 2 3 4 5 6Executives of toy-producing eoapanles should be subject to jail sentences for failure to informparents that their products may be hazardous 1 2 3 4 5 6Companies should not have business dealings vith other companies which ignore their responsibilityto protect the environment 1 2 3 4 5 6The quickened pace of business and cospetltion hastaken a heavy toll on the quality of life 1 2 3 4 5 6
304
Reproduced with perm ission o f the copyright owner. Further reproduction prohibited w ithout permission.

Pleas* rT cr.y the KunagH that represents how you feel about th* following statement*. Thar* art no right or wrong response*.l»*trongly agr*« (SA) J-agree 3-slightly agr*c4-slightly disagree 5-disagr** * 4»*trongly disagree (S3)
SA SOGovernment progress to aid th« poor usually supportthose people too lary to work 1 2 3 4 5 6Th* children that ar* bom as a result of raciallymixed sarriag** ar* detriments to soeiety 1 2 3 4 5 4Protestor* and radicals are good for society even though th«y say causa a change la normallyaccepted standards 1 2 3 4 5 6v« would not have so eany juvenile delinquents ifparents were stricter with their children 1 2 3 4 5 6Thera ar* too aany professors in our collages and universities who ar* radical in th*ir social andpolitical beliefs 1 2 3 4 5 6A business should not hire a parson if they suspect 1 2 3 4 5 6his of being a homosexualLabor unions should not have the right to i&Ucawhan the survival of th* business is threatened 1 2 3 4 5 6Hany blacks would b* executives of sajor corporations if they had not been discriminatedagainst in th* past 1 2 3 4 5 6Even though th* resulting cost say naan a reduction in profits, business sbould sat and atteapt toseat minority hiring quotas 1 2 3 4 5 6
If you would like a copy of th* results of this survey, plea** put your naa* and address below:
THANK YOU VDIY MUCH FOR TAXING TXHT OUT Or YOUR BUSY SOJEDULZ TO FILL OUT THIS QUESTIONNAIRE. YOUR KINDNESS IS VERY KOCH APPRECIATES.
305
Reproduced with perm ission o f the copyright owner. Further reproduction prohibited w ithout permission.

REMINDER POSTCARD LETTER FOR MAIN SIUDY
August 12,1991Dear Rev.
I hope you have received the survey that I sent to you about a week and a half ago. I really do need vour help. I have been praying that the Lord will more than replenish the time that you take out of your busy schedule to complete and return the questionnaire. Please, help me.
You may take till August 23 to return the survey if you need more time. If you need a new copy of the survey, please call collect 501-521-6473 and leave your name and address. If yew have completed and returned the survey, thank you very much. I continue to pray that God's blessings will be upon you, your family, and your congregation.Sincerely,Tope Bello
306
Reproduced with perm ission o f the copyright owner. Further reproduction prohibited w ithou t permission.

LETTER TO THE ASSOCIATE EXECUTIVE DIRECTOR OF THE ARKANSAS BAPTIST STATE CONVENTION
July 16, 1991
Pev. Jissy Sheffield Associate Sceeutive Director Arkansas Eaptist Associationp .o . *cx ss:Little tacfc, AR 72203Dear 9ev. Sheffield:
I aa supervising a doctoral student, Ttpe Weycai-Sello, co his doctoral dissertation research. 1 believe he caiacsnd you several
ttiile cur area of scady in the C ertemt of banageaent usually deals with business leaders and Bareges, I have eecuragad Ttpe to his particular interest in daarthes. Althnryi there are obvious differences beuaen business and bastres. I believe both types of organisations have such in muirn and can gain by aroarirg their leaders* characteristics and sGetegies. Specifically, Tope will be testing a c3*digtcaticnal theory scdel by lcddng for the ccnfiguraticn(s) cf leader (Faster) tfuncceristics and esA: scaeegies '.hied'. are associated oast closely vith churbi growth.I as enclosing a dreft cf a questionnaire which Tope will be sailing out scan to selected pastors. You vill receive a scsrary cf the results when they are available. In the seantiae, let ae )cov if I can provide you additional infseaticru
Sincerely,
John Todd Professcr
Enclosure
307
Reproduced with perm ission o f the copyright owner. Further reproduction prohibited w ithout permission.

BTBUOGRATHY
308
Reproduced with perm ission o f the copyright owner. Further reproduction prohibited w ithout permission.

BIBLIOGRAPHYAbernathy, W. J. and K. Wayne. 'Limits of the Learning Curve', Har-rand Business Review. 52, 1974, pp. 109-119
Aldag, Ramon J. and Timothy M. Stearns. Management. Cincinnati, OH.: South-Western Publishing Conpany, 1987.
Aldrich, H. Organizations and Environments. Englewood Cliffs, NJ: Prentice Hall, 1979.
Aldrich, H. E. and J. Pfeffer. 'Environments of Organizations', Annual Review of Sociology. 2, 1976, pp. 79-105.
Al-Gattan, Abdul-Rahim A. 'Test of the Path-Goal Theory of Leadership in the Multinational Dcmain', Group and Organization Studies. 10, 1985, pp. 429-445.
Anderson, D. R. 'Leadership Effectiveness In Education As Related To Congruence Between Human Behavior Types And Leadership Styles', Dissertation Abstract International. 34, 1974, p. 6887.
Anderson, C. R. 'Locus of Control, Coping Behaviors and Performance in a Stress Setting: A Longitudinal Study', Journal of Applied Psychology. 62, 1977, pp. 446-451.
Anderson, C. R. and Frank T. Paine. 'PIMS: a reexamination', Acadanv of Management Review. 3, 1978, pp. 602-612.
Anderson, C. R. and C. E. Schneier. 'Locus of Control, Leader Behavior and Leader Performance Among Management Students', Acadanv of Management Journal. 21, 1978, pp. 690-698.
Anderson, C. R., D. Hellriegel, and J. W. Slocum, Jr. 'Managerial Response to Environmentally Induced Stress', Academy of Management Journal. 20, 1977, pp. 260-272.
Anderson, Carl R. and Carl P. Zeithaml. 'Stage of the Product Life Cycle, Business Strategy, and Business Performance', Academy of Management Journal. 27, 1984, pp. 5-24.
309
Reproduced with perm ission o f the copyright owner. Further reproduction prohibited w ithou t permission.

Andrews, K. R. The Concept of Corporate Strategy. Homewood, IL.: Richard D. Irwin, 1971, 1980.
Annual of the Arkansas Baptist State Convention (1986 & 1989 editions)
Arnold, Hugh J. 'Task Performance, Perceived Conpetence, and Attributed Causes of Performance as Determinants of Intrinsic Motivation', Academy of Management Journal. 28, 1985, pp. 876-888.
Avila, Ramon A. and Edward F. Fern. 'The Selling Situation as a Moderator of the Personality-Sales Performance Relationship: an empirical investigation', Journal of Personal Selling and Sales Management. 6, 1986, pp. 53-63.
Bahr, Howard M. and Bruce A. Chadwick. 'Conservatism, Racial Intolerance, and Attitudes Tcward Racial Assimilation Among Whites and American Indians', The Journal of Social Psychology. 94, 1974, pp. 45-56.
Barnard, C. Functions of the Executive. Cambridge, MA.: Harvard university Press, 1938.
Barrow, Jeffrey C. 'Ihe Variables of Leadership: a review and conceptual framework', Academy of Management Review. 2, 1977, pp. 231-251.
Bass, B. M. 'Social Behavior and the Orientation Inventory: a review', Psychological Bulletin. 68, 1967, pp. 260-292.Bass, B. M. Stodaill's Handbook of Leadership. New York, NY.: Free Press, 1981.
Bass, Kenneth C. 'Proposed Relationship of Selected Factors to Ethical Judgements and Ethical Behavioral Intentions',Unpublished Doctoral Dissertation, Louisiana Technical University, Ruston, LA., 1991.
Beard, D. W. and G. G. Dess. 'Corporate-level Strategy, Business-level Strategy, and Firm Performance', Academy of Management Journal. 24, 1981, pp. 663-688.
310
Reproduced with perm ission o f the copyright owner. Further reproduction prohibited w ithou t permission.

Begley, Thomas M. and David P. Boyd. 'Psychological Characteristics Associated with Performance in Entrepreneurial Firms and Smaller Businesses, Journal of Business Venturing. 2, Winter, 1987, pp. 79-93.
Berenson, Mark L., David M. Levine, and Matthew Goldstein. Intermediate Statistical Methods and Applications: a computer package approach. Englewood Cliffs, HJ.: Prentice Hall, Inc., 1983.
Bettis, Richard A. and William K. Hall. 'Strategic Portfolio Management in the Multibusiness Firm', California Management Review. 24, 1981, pp. 23-38.
Blake, R. R. and J. S. Mouton. The Managerial Grid. Houston, TX.: Gulf Press, 1964.
Blalock, H. M. 'The Measurement Problem', in H. M. Blalock and A. Blalock (eds.), Methodology in Social resparrh. New York, NY.: MoGraw Hill, pp. 5-27.
Blau, Gary J. 'The Measurement and Prediction of Career Ccnmitment', Journal of Occupational Psychology. 58, 1985, pp. 277-288.
Blau, Gary J. 'Locus of Control as a Potential Moderator of the Turnover Process', Journal of Occupational Psychology. 60, 1987, pp. 21-29.
Blau, P. M. and W. R. Scott. Formal Organizations. San Francisco, CA.: Chandler, 1962.
Boston Consulting Group, Inc. Perspectives on Experience. Boston, MA.: Boston Consulting Group, 1968.
Bculton, W. R., W. M. Lindsay, S. G. Franklin, and L. W. Rue. 'Strategic Planning: determining the impact of environmental characteristics and uncertainty', Academy of Management Journal. 25, 1982, pp. 500-509.
311
Reproduced with perm ission o f the copyright owner. Further reproduction prohibited w ithout permission.

Bourgeios, L. J. 'Strategy and Environment: a conceptual integration', Academy of Management Review. 5, 1980, pp. 25-39.
Bourgeios, L. J. 'Performance and Consensus', Strategic Management Journal. 1, 1980b, pp. 227-248.
Bourgeios, L. J. and W. G. Astley. 'A Strategic Model of Organizational Conduct and Performance', International Studies of Management and Organization. 9, 1979, pp. 40-66.
Bowen, Donald D. and Robert D. Hisrich. 'Hie Female Entrepreneur: a career development perspective', Academy of Management Review. 11, 1986, pp. 393-407.
Bowers, D. G. and S. E. Seashore. 'Predicting Organizational Effectiveness With A Four-Factor Theory of Leadership', Administrative Science Qnar+prly, n, 1966, pp. 238-263.
Brockhaus, R. S. 'I-E Locus of Control Scares as Predictors of Entrepreneurial Intentions', Proceedings of the Academy of Management. 1975, pp. 433-435.
Brockoff, Klaus. 'A Test for the Product Life Cycle', Econcroetrica. July/August, 1967, pp. 472-484.
Bryman, A, M. Bresnen, J. Ford, A. Beardsworth, and T. Keil. 'Leader Orientation and Organizational Transience: an investigation using Fiedler's LPC scale', Journal of Occupational Psychology. 60, 1987, pp. 13-19.
Burgelman, R. H. 'A Model of the Interaction of Strategic Behavior, Corporate Context, and the Concept of Strategy', Academy of Management Review. 8, 1983, pp. 61-70.
Burgelman, R. A. 'Corporate Entrepreneurship and Strategic Management: insights from a process study', Management Science. 27, 1984, pp. 1349-1364.
Bums, Tom and G. M. Stalker. The Management of Innovation. London, Great Britain: Tavistock Publications, 1961.
312
Reproduced with perm ission o f the copyright owner. Further reproduction prohibited w ithout permission.

Buzzell, R.D., B. T. Gale, and R. G. M. Sultan. 'Market share: a key to profitability', Harvard Business Review. Jan/Feb, 1975, pp. 97-106
Buzzell, R. D. and F. D. Wiersema. 'Successful Share Building Strategies', Harvard Business Review. 59, 1981, pp. 135-144
Carmines, Edward G. and Richard A. Zeller. Reliability and Validity Assessment■ Beverly Hills, CA.: Sage Publications, 1979.
Carper, W. and W. Snizek. 'The Nature and Type of Organizational Taxonomies: an overview', Academy of Management Review. 5, 1980, pp. 65-75.
Cartwright, D. and A. Zander. Group Dynamics: research and theory. Evanston, IL.: Rcw, Peterson, 1960.
Chakravarthy, B. S. 'Adaptation: a promising metaphor for strategic management', Academy of Management Review. 7, 1982, pp. 35-44.
Chamberlain, Neil W. The limits of corporate responsibility. New York, NY.: Basic books, 1973.
Chandler, Alfred D. Strategy and Structure: chapters in the history of the American Industrial Enterprise. Cambridge, MA.: MIT Press, 1962.
Child, J. 'Organizational structure, environment and performance: the role of strategic choice', Sociology. 6, 1972, pp. 1-22.
Christensen, H. K., A. C. Cooper, and C. A. de Kluyver. 'The Dog Business: a reexamination', Business Horizons. Nov./Dec., 1982,pp. 12-18
Clifford, D. K. Jr. 'Managing the Product Life Cycle'. In R. Mann (editor), The Arts of Top Management: a McKinsev anthology. New York, NY.: MoGraw Hill, 1971, pp. 216-226.
313
Reproduced with perm ission o f the copyright owner. Further reproduction prohibited w ithout permission.

Coate, Malcolm B. 'Pitfalls in Portfolio Planning', Long Range Planning. 1983, pp. 47-56.
Cobb, Anthony T. 'Informal Influence in the Formal Organization: psychological and situational correlates', Group and Organization Studies. 11, 1986, pp. 229-253.
Cohen, Jacob. Statistical Pcwer Analysis for the Behavioral Sciences. 2nd edition, Hillsdale, NJ.: Lawrence Erlbaum Associates Inc, 1988.
Colwill, Nina L. 'Men, Women, Pcwer, and Organizations', Business Quart^ly, 51, 1987, pp. 10-19.
Cook, T. D. and D. T. Campbell. Quasi -experimentation: design and analysis issues for field settings. Chicago, IL.: Rand McNally, 1979.
Cox, (Jr.), W. E. 'Product Life Cycles as marketing models', Journal of Business. Oct, 1967, pp. 375-384.
Cronbach, L. J. 'Test validation', in R. L. Thorndike (ed.), Educational Measurement. Washington, DC: American Council on Education, pp. 443-507.
Cummings, L. L. and C. J. Berger. 'Organization Structure: how does it influence attitudes and performance ?', Organizational Dynamics. Autumn, 1976, pp. 34-49.
Dailey, Robert C., William Ickinger, and Elizabeth Coote. 'Personality and Role Variables as Predictors of Tension Discharge Rate in Three Samples', Human Relations. 39, 1986, pp. 991-1003.
Datta, Y. 'Coipetitive Strategy and Performance of Firms in the U.S. TV Set Industry: 1950-60', Proceedings of the 42nd Annual Meeting of the Academy of Management. Atlanta, 1979, pp. 113-117.
Day, G. 'Diagnosing the Product Portfolio', Journal of Marketing. 41, 1977, pp. 29-38.
314
Reproduced with perm ission o f the copyright owner. Further reproduction prohibited w ithout permission.

Day, G. S. 'The Product Life Cycle: analysis and applications issues', Journal nf Marketing. 45, 1981, pp. 60-67.
de Kluyver, Comelis A. 'Innovation and Industrial Product Life Cycles', California Management Review. 20, 1977, pp. 21-33.
Dess, G. and D. Beard. 'Dimensions of Organizational Task Environments', Administrative SrHerra Oiar-t-p-rlv. 29, 1984, pp. 52-73.
Dess, G. G. and P. S. Davis. 'Porter's (1980) generic strategies as determinants of strategic group membership and organizational performance', Academy of Management Journal. 27, 1984, pp. 467-488.
Dill, William R. 'Environment as an influence on managerial autonomy', Administrative Scipnce nnart-m-iv- 2, 1958, pp. 409-443.
Drazin, R. and A. H. Van de Ven. 'Alternate Forms of Fit in Contingency Theory', Administrative Science Quartra-lv. 3 0, 1985, pp. 514-539.
IXincan, R. B. 'Characteristics of Organizational Environments and Perceived Environmental Uncertainty', Administrative Science Qiarterly, 17, 1972, pp. 313-327.
CWnteman, G. and B. M. Bass. 'Supervisory and Engineering Success Associated With Self, Interaction, and Task Orientation Scores', Personnel Psychology. 16, 1963, pp. 13-22.
Durand, D. E. and D. Shea. 'Entrepreneurial Activity as a Function of Achievement Motivation and Reinforcement Control', The Journal of Psychology. 88, 1974, pp. 57-63.
Emery, F. E. and E. L. Trist. 'The Causal Texture of Organizational Environments' Human Relations. 18, 1965, pp. 21-32.
England, George W. 'Personal value systems of American managers', Academy of Management Journal. 10, 1967, pp. 53-68.
315
Reproduced w ith perm ission o f the copyright owner. Further reproduction prohibited w ithout permission.

Evered, Roger. 'So What is Strategy ?', Loner Range Planning. 16, 1983, pp. 57-72.
Feather, N. T. and Gordon E. O'Brien. 'A Longitudinal Study of the Effects of Employment and Unemployment on School Leavers', Journal of Occupational Psychology. 59, 1986, pp. 121-144.
Field, G. A. 'Do Products Really Have Life Cycles ?', California Management Review. 14, 1971, pp. 92-95.
Fleishman, E. A. 'A Leader Behavior Description For Industry'. In R. M. Stodgill and A. E. Coons (editors), Leader Behavior: its description and measurement. Columbus, CH.: Ohio State University, Bureau of Business Research, 1957.
Formbrun, C. and W. G. Astley. 'Beyond Corporate Strategy', Journal of Business Strategy. 3, 1983, pp. 47-54.
Fattier, Myron D. 'Is Management Really Generic?', Academy of Management Review. 6 , 1981, pp. 1-12.
Fox, Harold W. 'A framework for functional coordination', Atlanta Economic Review. Nov/Dec, 1973, pp. 8-11
Fredrickson, James W. Perspectives on Strategic Management. New York, NY.: Harper Business, 1990.
Freedman, Sara M. and James S. Phillips. "Ihe Effects of Situational Performance Constraints on Intrinsic Motivation and Satisfaction', Organizational Behavior and Human Decision Processes. 35, 1985, pp. 397-416
Fruhan, W. 'Pyrrhic Victories in Fights for Market Share', Harvard Business Review. 50, 1972, pp.100-107.
Fumham, Adrian. 'Economic Locus of Control', Human Relations. 39, 1986, pp. 29-43.Fusilier, Marcelline R., Daniel C. Ganster, and Bronston T. Mayes. 'Effects of Social Support, Role Stress, and Locus of Control on Health', Journal of Management. 13, 1987, pp. 517-528.
316
Reproduced with perm ission o f the copyright owner. Further reproduction prohibited w ithout permission.

Galbraith, C. and D. Schendel. 'An empirical analysis of strategy types', Strategic Management Journal. 4, 1983, pp. 153-173.
Galbraith, Jay. Organization Design. Boston, MA.: Addison-Wesley, 1977.
Galbraith, J. R. and D. A. Nathansan. 'Strategy Implementation: the role of structure and process. West Publishing, St Paul, MN, 1978
Gaskell, George and Patten Smith. 'An Investigation of Youth's Attributions for Unemployment and their Political Attitudes', Journal of Economic Psychology. 6, 1985, pp. 65-80.
Gawthorp, L. C. Administrative Policies and Social Change. New York, NY.: St. Martin's Press, 1971.
Ginsberg, Ari and N. Venkatraman. 'Contingency Perspective of Organizational Strategy: a critical review of the empirical research', Academy of Management Review. 10, 1985, pp. 421-434.
Glogcw, Eli. 'Burnout and Locus of Control', Public Personnel Management. 15, 1986, pp. 79-83.
Glueck, W. G. Business Policy: strategy formation and management action. New York, NY.: MoGraw Hill, 1976.
Glueck, W. G. Business Policy and Strategic Management. New York, NY.: MoGraw Hill, 1980.
Goodstadt, B. E. and L. A. Hjelle. 'Pcwer to the Powerless: Locus of Control and the use of pcwer', Journal of Personality and Social Psychology. 27, 1973, pp. 190-196.
Gcrvindarajan, Vijay. 'Decentralization, Strategy, and Effectiveness of Strategic Business Units in Multibusiness Organizations', Academy of Management Review. 11, 1986, pp. 844-856.
317
Reproduced with perm ission o f the copyright owner. Further reproduction prohibited w ithout permission.

Govindarajan, Vijay. 'A Contingency Approach to Strategy Implementation at the Business-Unit Level', Academy of Management Journal. 31, 1988, pp. 828-853.
Govindarajan, Vijay. 'Implementing Competitive Strategy at the business unit level: implications of matching managers to strategy', Strategic Management Journal. 10, 1989, pp. 251-269.
Gresov, Christopher. ' Exploring Fit and Misfit with Multiple Contingencies', Administrative Science rxiarterlv. 34, 1989, pp. 431-453.
Grinyer, P. H., M. Yasai-Ardekani, and S. Al-Bazzaz. 'Strategy, Structure, the Environment and Financial Performance in 48 United Kingdom Companies', Academy of Management Journal. 23, 1980, pp. 193-220.
Gruber, Robert E. and Mary Mohr. 'Strategic Management for Multiprogram Nonprofit Organizations', California Management Review. 24, 1982, pp. 15-22.
Gupta, A. K. 'Contingency Linkages Between Strategy and General Manager Characteristics', Academy of Management Review. 9, 1984, pp. 399-412.
Gupta, A. K. and V. Govindarajan. 'Business unit strategy, managerial characteristics, and business unit effectiveness at strategy implementation', Academy of Management Journal. 27, 1984a, pp. 25-41
Gupta, A. K. and V. Govindarajan. 'Build, hold, and harvest: converting strategic intentions into reality', Journal of Business Strategy. 4, 1984b, pp. 34-47.
Guth, W. D. and R. Taiguri. 'Personal Values and Corporate Strategies', Harvard Business Review. 43, 1965, pp. 123-132.
Hadaway, C. Kirk. 'Growing Off Hie Plateau: a summary of the 1988 "church on the plateau" survey', Sunday School Board of the Southern Baptist Convention. Nashville, Tennessee, February 1989.
318
Reproduced with perm ission o f the copyright owner. Further reproduction prohibited w ithout permission.

Hair (Jr), Joseph F., Ralph E. Anderson, Ronald L. Tatham, and Bemie J. Grablcwsky. Multivariate Data Analysis, with readings. Tulsa, OK.: Petroleum Publishing Company, 1979, pp. 4-14.
Hall, David J. and Maurice A. Saias. 'Strategy Follows Structure', Strategic Management Journal. 1, 1980, pp. 149-163.
Hall, William K. 'Strategies in a hostile environment', Harvand Business Review. 58, 1980, pp. 73-86.
Hambrick, D. C. 'Operationalizing the concept of business-level strategy in research', Academy of Management Review. 5, 1980, pp. 567-575.
Hambrick, D. C. 'Environment, Strategy, and Power Within Top Management Teams', Administrative Science Quarter! yr 26, 1981a, pp. 253-276.
Hambrick, D. C. 'Strategic Awareness Within Top Management Teams', Strategic Management Journal. 2, 1981b, pp. 263-279.
Hambrick, D. C. 'Environmental Scanning and Organizational Scanning', Strategic Management Journal. 3, 1982, pp. 159-174.
Hambrick, Donald C. 'High Profit Strategies in Mature Capital Goods Industries: a contingency approach', Academy of Management Journal. 26, 1983a, pp. 687-707.
Hambrick, Donald C. 'Seme tests of the effectiveness and functional attributes of Miles and Snow's strategic types', Academy of Management Journal. 26, 1983b, pp. 5-26
Hambrick, Donald C. 'Taxonomic approaches to studying strategy: some conceptual and methodological issues', Journal of Management. 10, 1984, pp. 27-42.
Hambrick, Donald C. and David Lei. 'Tcward an Empirical Prioritization of Contingency Variables for Business Strategy', Academy of Management Journal. 28, 1985, pp. 763-788.
319
Reproduced with perm ission o f the copyright owner. Further reproduction prohibited w ithou t permission.

Hambrick, D. C., I. C. MacMillan, and R. R. Barbarosa. 'Business Unit Strategy and Changes in the Product R & D Budget', Management Science. 29, 1983, pp. 757-769.
Hambrick, D. C., MacMillan, I. C., and D. L. Day. 'Strategic attributes and performance in the four cells of the BCG matrix — a PIMS based analysis of industrial-product businesses', Academy of Management Journal. 25, 1982, pp. 510-531.
Hambrick, D. C. and P. A. Mason. 'Upper echelons: the organization as a reflection of its top managers', Academy of Management Review. 9, 1984, pp. 193-206.
Hammermesh, R. G., M. J. Anderson, and J. E. Harris. 'Strategies for Lew Market Share Businesses', Ha-i-va-nd Business Review. 56, 1978, pp. 95-102.
Hammermesh, R. G. and S. B. Silk. 'How to Compete in Stagnant Industries', Harvard Business Review. 57, 1979, pp. 161-168.
Hansen, Gary S. and Birger Wemerfelt. 'Determinants of Firm Performance: the relative importance of economic and organizational factors', Strategic Management Journal. 10, 1989, pp. 399-411.
Harrigan, K. R. Strategies for Declining Businesses. Unpublished Doctoral Dissertation, Harvard University, 1979. In Carl R. Anderson and Carl P. Zeithaml, 'Stage of the Product Life Cycle, Business strategy, and Business Performance', Academy of Management Journal. 27, 1984, pp. 5-24.
Harrigan, K. R. 'Research Methodologies for Contingency Approaches to Business Strategy', Academy of Management Review. 8, 1983, pp. 398-405.
Haspeslagh, P. 'A Survey of U.S. Companies Shows How Effective Portfolio Planning Could Be But Often Isn't', Harvard Business Review. 60, 1982, pp. 58-73.
Hatten, K., D. Schendel, and A. Cooper. 'A Strategic Model of the U.S. Brewing Industry: 1952-1971', Academy of Management Journal. 21, 1978, pp. 592-610.
320
Reproduced with perm ission o f the copyright owner. Further reproduction prohibited w ithout permission.

Hatten, Mary Louise. 'Strategic management in not-for-profit organizations', Strategic Management Journal. 3, 1982, pp. 89-104.
Hawes, J. M. and W. F. Crittenden. 'A Taxoncsny of Competitive Retailing Strategy', Strategic Management Journal. 5, 1984, pp. 275-287.
Hay, R. D. and P. M. Ginter. 'Strategies for Maintaining a Share of the Market', Paper presented at the Annual Meeting of the Southern Academy of Management. Atlanta, 1979.
Henderson, B. D. Henderson on Corporate Strategy. Cambridge, Mass.: Alt Books, 1979.
Hendricks, James A. 'Locus of Control: inplications for managers and accountants', Cost and Management. 59, 1985, {p. 25-29.
Herbert, Theodore T. and Deresky, Helen. 'Generic Strategies: an empirical investigation of typology validity and strategy content', Strategic Management Journal. 8, 1987, pp. 135-147.
Herbert Theodore T. and Helen Deresky. 'Should General Managers Match their Business Strategies ?', Organizational Dynamics. 15, 1987b, pp. 40-51.
Hersey, P. and K. H. Blanchard. 'So you want to know your leadership style', Training and Development Journal. Feb., 1974, pp. 1-15.
Higgins, James M. and Julian W. Vincze. Strategic Management: text and cases. 4th edition, New York, NY.: The Dryden Press, 1989.
Hirsch, Robert D. 'Organizational Effectiveness and the Institutional Environment', Administrative Science Qnart-wiy. 20, 1975, pp. 327-344.
Hitt, M. A., R. D. Ireland, and K. A. Palia. 'Industrial firms' grand strategy and functional importance: moderating effects of technology and uncertainty', Academy of Management Journal. 25, 1982, pp. 265-298.
321
Reproduced with perm ission o f the copyright owner. Further reproduction prohibited w ithout permission.

Hitt, M. A., R. D. Ireland, and G. Stadter. 'Functional Importance and Company Performance: moderating effects of grand strategy and industry types', Strategic Management Journal. 3, 1982, pp. 315-330.
Hofer, Charles W. 'Seme Preliminary Research on Patterns of Strategic Behavior', Proceedings of the Business Policy and Planning Division of the Academy of Management. 1973, pp. 46-54.
Hofer, C. W. 'Towards A Contingency Theory of Business Strategy', Academy of Management Journal. 18, 1975, pp. 784-809.
Hofer, C. W. 'Turnaround Strategies', The Journal of Business Strategy. 1, 1980, pp. 19-31.
Hofer, C. W., E. A. Murray, R. Charan, and R. A. Pitts. Strategic Management - a rasphook in business policy and planning. St. Paul, MN.: West Publishing, 1980.
Hofer, C. W. and D. E. Schendel. Strategy Formulation: analytical concepts. St. Paul, MN.: West Publishing, 1978
Hollenbeck, John R., Arthur P. Brief, Ellen M. Whitener, and Karen E. Pauli. 'An Empirical Note on the Interaction of Personality and Aptitude in Personnel Selection', Journal of Management. 14, 1988, pp. 441-451.
Horowitz, J. H. and R. A. Thietart. 'Strategy, Management Design, and Firm Performance', Strategic Management Journal. 3, 1982, pp. 67-76.
Hosmer, LaRue Tone. 'The Importance of Strategic Leadership', The Journal of Business Strategy. 3, 1982, pp. 47-57.
House, R. J. and M. L. Baetz. 'Leadership: some empirical generalizations and new research directions. In B. M. Staw (editor), Research in organizational behavior (Vol. 1). Greenwich, Conn.: JAI Press, 1979, pp. 341-423.
322
Reproduced w ith perm ission o f the copyright owner. Further reproduction prohibited w ithout permission.

House, William C. 'Environmental Analysis: key to more effective dynamic planning', Managerial Planning. 25, 1977, pp. 25-29.
Howell, Jon P., Peter W. Dorfman, and Steven Kerr. 'Moderator Variables in Leadership Research', Academy of Management Review. 11, 1986, pp. 88-102.
Hussey, D. E. 'Portfolio analysis: practical experience with the Directional Policy Matrix', Long Range Planning. 11, 1978, pp. 2-8
James, Barrie G. 'The theory of the corporate life cycle', Long Range Planning. 7, 1974, pp. 49-55.
James, W. H. 'Internal Versus External Control of Reinforcement as a Basic Variable in Learning Theory', Unpublished Doctoral Dissertation, Ohio State University, 1957. In J. B. Rotter 'Generalized Expectancies for Internal Versus External Control of Reinforcement', Psychological Monographs: General and Applied. 80, Whole No. 609, 1966, pp. 1-28.
Jauch, L. R. and R. N. Osborn. 'Tcward an Integrated Theory of Strategy', Academy of Management Review. 6, 1981, pp. 491-498.
Jauch, Lawrence R., Richard N. Osborn, and William F. Glueck. 'Success In Large Business Organizations: the environment-strategy connection', Academy of Management Proceedings. 1977, pp. 113-117
Jauch, Lawrence R., Richard N. Osborn, and William F. Glueck. 'Short Term Financial Success in large Business Organizations: The Environment-Strategy Connection', Strategic Management Journal. 1, 1980, pp. 49-63.
Jemison, D. B. 'The Importance of an Integrative Approach to Strategic Management', Academy of Management Review. 6, 1981, pp. 601-608.
Johns, G. Organizational behavior: understanding life at work. Glenview, IL.: Scott, Foresman, 1983.
323
Reproduced with perm ission o f the copyright owner. Further reproduction prohibited w ithout permission.

Jones, Gareth R. and John E. Butler. 'Costs, Revenue, and Business-Level Strategy', Academy of Management Review. 13, 1988, pp. 202-213.
Kamani, Aneel. 'Generic Competitive Strategy: an analytical approach', Strategic Management Journal. 5, 1984, pp. 367-380.
Katz, D. and R. Kahn. The Social Psychology of Organizations. New York, NY.: Wiley, 1966.
Katz, D., N. Macaby, and N. C. Morse. Productivity. Supervision, and Morale In An Office Situation. Ann Arbor, MI.: University of Michigan, Institute for Social Research, 1950.
Kerlinger, Fred N. Behavioral Research: a conceptual approach. New York, NY.: Holt, Rinehart, and Winston, 1979.
Kerr J. 'Assigning managers on the basis of life cycle', The Journal of Business Strategy. 2, Spring, 1982, pp. 58-65.
Khandwalla, P. N. 'The Techno-Econcmic Ecology Of Corporate Strategy', The Journal of Management Studies. 13, 1976, pp. 62-75.
Khandwalla, Pradip N. The Design of Organizations. New York, NY.: Harcourt, 1977.
Kiechel, Walter, III. 'Corporate Strategists Under Fire', Fortune. 106, 1982, pp. 35-39.
Kim, Linsu and Yooncheol Lim. 'Environment, Generic Strategies, and Performance In A Rapidly Developing Country: a taxonomic approach', Academy of Management Journal. 31, 1988, pp. 802-827.
Kimberly, John R. 'Issues in the Creation of Organizations', Academy of Management Journal. 22, 1979, pp. 437-457.
324
Reproduced with perm ission o f the copyright owner. Further reproduction prohibited w ithout permission.

Kimberly, John R. and Michael J. Evanisko. 'Organizational Innovation: the influence of individual, organizational, and contextual factors on hospital adoption of technological and administrative innovations', Academy of Management Journal. 24, 1981, pp. 689-713.
Kirk, Roger E. Experimental Design: procedures for the behavioral sciences, Belmont, CA.: Broaks-Cole Publishing, 1988.
Klebanoff, H. E. 'Leadership: an investigation of its distribution in task-oriented small groups', Dissertation Abstract International. 36, 1976, pp. 1143-1154.
Kohl, John P. 'Strategies for growth: intervention in a church', Long Range Planning. 17, 1984, 76-80.
Kotler, P. 'Competitive Strategies over the Product Life cycle', Management Science. December, 1965, pp. B104-B119.
Kotler, P. Marketing for Nonprofit Organizations. 2nd edition. Englewood Cliff, NJ.: Prentice Hall, 1982.
Kotter, J. 'Managing external dependence', Academy of Management Review. 4, 1979, pp. 87-92.
Kotter, J. P. The General Managers. New York, NY.: Free Press, 1982.
Kuder, G. F. and M. W. Richardson. "Ihe Theory of the Estimation of Test Reliability', Psvchcmetrika. 2, 1937, pp. 151-160.
Iamb, R. 'Is the Attack on Strategy Valid ?', Journal of Business Strategy. 3, 1983, pp. 69-69.
Lawler, E. E., III. 'For a more effective organization — match the job to the man', Organizational Dynamics. 3, 1974, pp. 19-29.
Lawrence, Paul and Jay Lorsch. Organization and its Environment. Cambridge, Mass.: Harvard University Press, 1967.
325
Reproduced with perm ission o f the copyright owner. Further reproduction prohibited w ithout permission.

Learned, E. C. Roland Christensen, Kenneth R. Andrews, and William D. Guth. Business Policy; text and cases. Hcroewood, IL.: RichardD. Irwin, Inc., 1965.
Leiberson, Stanley and James F. O'Connor. 'Leadership and Organizational Performance: a study of large corporations', American Sociological Review. 37, 1972, pp. 117-130.
Leifer, R. and A. Delbeoq. 'Organizational/Environmental Interchange:A Model of Boundary Spanning Activity', Academy of Management Review. 3, 1978, pp. 40-50.
Lenz, R. T. 'Strategic Interdependence and Organizational Performance: patterns in one industry', Unpublished Doctoral Dissertation, Indiana university, 1978.
Lenz, R. T. 'Environment, Strategy, Organization Structure and Performance: Patterns in One Industry', Strategic Management Journal. 1, 1980, pp. 209-226.
Lenz, R. T. 'Determinants of Organizational Performance: an interdisciplinary review', Strategic Management Journal. 2, 1981, pp. 131-154.
Leontiades, M. 'Choosing the Right Manager to Fit the Strategy', Journal of Business Strategy. 3, 1982, pp. 58-69.
Lesage, P. B. and J. Rice. 'Interet et Satisfaction au Travail', Working Paper, Boole des Hautes Etudes Ccnroerciales. Montreal, 1979. In D. Miller, M. F. R. Kets de Vries, and J. M. Toulouse, 'Top Executive Locus of Control and its Relationship to Strategy-making, Structure, and Environment', Academy of Management Journal. 25, 1982, pp. 237-253.
Levitt, T. 'Exploit the Product Life Cycle', Harvard Business Review. 43, 1965, pp. 81-94.
Licata, Michael P., Robert H. Strawser, and Robert B. Welker. 'A Note on Participation in Budgeting and Locus of Control', Accounting Review. 61, 1986, pp. 112-117.
326
Reproduced with perm ission o f the copyright owner. Further reproduction prohibited w ithout permission.
Lieberson, S. and J. F. O'Connor. 'Leadership and organizational performance: a study of large corporations', American Sociological Review. 37, 1972, pp. 117-130.
Life, E. Andrew. 'Strategy: corporate leadership', Journal of General Management. 12, 1986, pp. 72-91.
Likert, R. 'Developing patterns of Management', American Management Association. General Management Series. 1955, No. 178.
Likert, R. 'Management Styles And The Human Component', Management Review. 66, 1977, pp. 23-28, 43-45.
Linsay, W. M. and L. W. Rue. Environmental Complexity in Long Range Planning. Planning Executives Institute, Oxford, CXI, 1976.
Luck, David J. and Arthur E. Prell. Market Strategy. Englewood Cliffs, NJ.: Prentice Hall Inc., 1968.
Luthans, Fired, Donald Baack, and Lew Taylor. 'Organizational Commitment: analysis of antecedents', Human Relations. 40, 1987, pp. 219-235.
Mackenzie, C. F. (Part A). 'Mackenzie: on marketing's 'missing link' — the Product Life Cycle concept', Industrial Marketing. April, 1971, pp. 42-43.
Mackenzie, C. F. (Part B). 'Product Life Cycle makes ROI analysis relevant, can tell you when to run the ads', industrial Markpting, June, 1971, pp. 100-105.
MacMillan, Ian c., Donald C. Hambrick, and Diana L. Day. 'The Product Portfolio and profitability: a PIMS-based analysis of industrial-product businesses', Academy of Management Journal. 25, 1982, pp. 733-755.
Mann, F. C., B. P. Indik, and V. H. Vrocm. The Productivity of Work Groups. Ann Arbor, MI: University of Michigan, Survey Research Center, 1963.
327
Reproduced with perm ission o f the copyright owner. Further reproduction prohibited w ithout permission.

Marino, Kenneth E. and Sam E. White. 'Departmental structure, Locus of Control, and Job Stress: the effect of a moderator', Journal of Applied Psychology. 70, 1985, pp. 782-784.
McClelland, D. C. The Achieving Society. Princeton, NJ.: Van Nostrand, 1961.
Mclnish, Thomas H. and Mei Yan Lee. 'Multidimensionality of Rotter's Locus of Control Scale', Psychological Reports. 61, 1987, pp. 273-274.
MdWhinney, W. J. 'Organizational Form, Decision Modalities and the Environment', Human Relations. 21, 1968, pp. 269-282.
Meindl, James R., Sanford B. Ehrlich, and Janet M. Dukerich. 'The Romance of Leadership', Administrative Science Quarterly. 30, 1985, pp. 78-102.
Meindl, James R. and Sanford B. Ehrlich. 'The Romance of Leadership and the Evaluation of Organizational Performance', Academy of Management Journal. 30, 1987, pp. 91-109.
Meyer, M. W. 'Leadership and Organizational Structure', American Journal of Sociology. 81, 1975, pp. 514-542.
Mia, Lokman. 'Participation in Budgetary Decision Making, Task Difficulty, Locus of Control, and Employee Behavior: an empirical study', Decision Sciences. 18, 1987, pp. 547-561.
Michael, G. C. 'Product Petrification: A New Stage in the Product Life Cycle Theory', California Management Review. 14, 1971, pp. 88-91.
Miles, R. E. and C. C. Snow. Organizational Strategy. Structure, and Processes. New York: McGraw-Hill Book Co., 1978.
Miles, R. E., Sncw, C. C., Meyer, A. D., and Henry J. Coleman,(Jr.). 'Organizational Strategy, Structure, and Process', Academy of Management Review. 3, 1978, pp. 546-562.
328
Reproduced with perm ission o f the copyright owner. Further reproduction prohibited w ithout permission.

Miles, R. E., C. C. Sncw, and J. Pfeffer.'Organization-envirorarerrt: concepts and issues', Industrial Relations. 13, 1974, pp. 244-266.
Miller, D. 'lhe Role Of Multivariate Q-Techniques In The Study Of Organizations', Academy of Management Review. 3, 1978, pp. 515-531.
Miller, D. 'Tcward A New Contingency Approach: the search for organizational gestalts', Journal of Management studies. 18, 1981, pp. 1-26.
Miller, D. 'The Structural and Environmental Correlates of Business Strategy', Strategic Management Journal. 8, 1987, pp. 55-76.
Miller, D. 'Relating Porter's Business Strategies to Environment and Structure: analysis and performance implications', Academy of Management Journal. 31, 1988, pp. 280-308.
Miller, D. and P. H. Friesen. 'Strategy Making In Context: ten empirical archetypes', Journal of Management Studies. 14, 1977, pp. 259-280.
Miller, D. and P. H. Friesen. 'Archetypes of Strategy Formulation', Management Science. 24, 1978, pp. 921-933.
Miller, D. and P. H. Friesen. Organizations: a quantum view. Englewood Cliffs, NJ.: Prentice Hall, 1984.
Miller, D. and P. H. Friesen. 'Porter's Generic Strategies and Performance', Organization Studies. 7, 1986, pp. 255-263.
Miller, D. and H. Mintzberg. 'The Case For Configuration'. In G. Morgan (editor), Bevond Method. Beverly Hills, CA.: Sage Publications, 1983, pp. 57-73.
Miller, D. and J. Toulouse. 'Chief executive personality and corporate strategy and structure in small firms', Management Science. 32, 1986, pp. 1389-1409.
329
Reproduced with perm ission o f the copyright owner. Further reproduction prohibited w ithout permission.

Miller, D. and J. Toulouse. 'Strategy, Structure, CEO Personality and Performance in Small Firms', American Journal of Small Business. 10, 1986b, pp. 47-62.
Miller, D., M. F. R. Kets de Vries, and J. M. Toulouse. 'Top executive locus of control and its relationship to strategy-making, structure, and environment', Academy of Management Journal. 25, 1982, pp. 237-253.
Miller, D., J. Toulouse, and N. Belanger. 'Top executive personality and corporate strategy: three tentative types', Advances in Strategic Management. Greenwich, Conn.: JAI Press Inc., 1985, pp. 223-232.
Mintzberg, H. 'Research on Strategy Making', Academy of Management Proceedings. 1972, pp. 90-94.
Mintzberg, H. 'Strategy Making In Three Modes', California Management Review. 16, 1973, pp. 44-53.
Mintzberg, H. The Structuring of Organizations. Englewood Cliffs, NJ.: Prentice Hall, 1979.
Mintzberg, H. 'Strategy Formation: schools of thought', in Perspectives on Strategic Management. James W. Fredrickson (ed.), New York, NY.: Harper Business, 1990, pp. 105-235.
Mintzberg, H. and J. A. Waters. 'Tracking Strategy in an Entrepreneurial Firm', Academy of Management Journal. 25, 1982, pp. 465-499.
Mitchell, T. R. 'Expectancy models of job satisfaction, occupational preference and effort: a theoretical, methodological, and empirical appraisal', Psychological Bulletin. 81, 1975, pp. 623-630.
Mitchell, T. R., C. M. Smyser, and S. E. Weed. 'Locus of Control: supervision and work satisfaction', Academy of Management Journal. 18, 1975, pp. 623-630.
330
Reproduced with perm ission o f the copyright owner. Further reproduction prohibited w ithout permission.

Morriy, R. Wayne, Sharplin, Arthur, Holmes, Robert E, and Edwin B. Flippo. Management: concepts and issues. 3rd edition, Newton, MA.: Allyn and Bacon, Inc., 1986.
Murray, Alan I. 'A Contingency View of Porter's "Generic Strategies"', ftcadany of Management Review. 13, 1988, pp. 390-400.
Negandhi, A. and B. C. Reimann. 'Task Environment, Decentralization, and Organizational Effectiveness', Hunan Relations. 26, 1973, pp. 203-214.
Nettler, Gwynne and James R. Huffman. 'Political Opinion and Personal Security', Socicanetrv. 20, 1957, pp. 51-166.
Neubauer, F. Friedrich and Norman Solomon. 'A managerial approach to environmental assessment', Long Range Planning. 10 (2), 1977, pp.13-20.
Newman, W. H. and H. W. Wallender. 'Managing Not-for-Profit Enterprises', Academy of Management Review. 3, 1978, pp. 24-31.
Nightingale, D. V. and J. M. Toulouse. 'Toward A Multi-Level Congruence Theory of Organization', Administrative Science Quarterly, 22, 1977, pp. 264-280.
Norbum, David. 'Gogos, Yoyos and Dodos: company directors and industry performance' Strategic Management Journal. 7, 1986, pp. 101-117.
Norbum, David and Sue Birley. 'The Top Management Team and Corporate Performance', Strategic Management Journal. 9, 1988, pp. 225-237.
Norbum, D. and P. Miller. 'Strategy and Executive Reward: the mismatch in the strategic process', Journal of General Management. 6, 1981, pp. 7-27.
Nunnally, J. C. Psychometric Theory. New York, NY.: MoGraw Hill Book CO., 1978.
331
Reproduced with perm ission o f the copyright owner. Further reproduction prohibited w ithout permission.

Oden, Randall Y. and W. Randy Boxx. 'Environment, Planning Processes, and Organizational Performance of Churches', Strategic Management Journal. 9, 1988, pp. 197-205.
Organ, D. W. 'Linking Pins Between Organizations and Environment', Business Horizons. 14, 1971, pp. 73-80.
Organ, D. W. and C. N. Greene. 'Role ambiguity, Locus of Control and work satisfaction', Journal of Applied Psychology. 59, 1974,pp. 101-1 1 2.
Osborn, R. N. and J. A. Hunt. 'Environment and Organizational Effectiveness', Administrative Science Onar-t-p-rly. 1 9, 19 7 4, pp. 231-246.
Patton, A. 'Stretch Your Products' Earning Years', Management Review. 48, 1959, pp. 9-19.
Pavan, Robert J. 'Strategy and Structure: the Italian experience', Journal of Economics and Business. 28, 1976, pp. 254-260.
Pearson, Andrall E. "Six Basics for General Managers", Harvard Business Review. 67, July/August, 1989, pp. 94-101.
Perrcw, C. Organizational Analysis: a sociological view. Belmont, CA.: Brooks Cole, 1970.
Peters, Thomas J. and Robert H. Waterman, Jr. In Search of Excellence. New York, NY.: Harper and Rcw, 1982.
Pfeffer, Jeffrey. 'Beyond Management and the Worker: the Institutional Function of Management', Academy of Management Review. 1, 1976, pp. 36-46.
Pfeffer J. 'The ambiguity of leadership', Academy of Management Review. 2, 1977, 104-112.
Pfeffer, Jeffrey. Organizational design. Arlington Heights, IL.: AHM Publishing Corporation, 1978.
332
Reproduced w ith perm ission o f the copyright owner. Further reproduction prohibited w ithout permission.

Pfeffer, J. 'Management as symbolic action: the creation and maintenance of organizational paradigms'. In L. L. Cummings and B. M. Staw (editors), Research in organizational behavior. Greenwich, Conn.: JAI Press, 1981, pp. 1-52.
Pfeffer, J. and G. R. Salancik. The External Control of Organizations. New York, NY.: Harper and Row, 1978.
Phares, E. J. 'Expectancy Changes in Skill and Chance Situations', Journal of abnormal and Social Psychology. 54, 1957, pp. 339-342.
Phares, E. J. 'Perceptual Threshold Decrements as a Function of Skill and Chance Expectancies', Journal of Psychology. 53, 1962, pp. 399-407.
Phares, E. J. 'Internal-External Control as a Determinant of Amount of Social Influence Exerted', Journal of Personality and Social Psychology. 2, 1965, pp. 642-647.
Polli, Rolando and Victor Cook. 'Validity of the Product Life Cycle', Journal of Business. October, 1969, pp. 369-400.
Porter, M. E. 'Hew Competitive Forces Shape Strategy', Harvard Business Review. 57, 1979, pp. 137-145.
Porter, M. E. Competitive Strategy: techniques for analyzing industries and competitors. New York, NY.: Ihe Free Press, 1980.
Porter, M. E. Competitive Advantage: creating and sustaining superior performance. New York, NY.: Free Press, 1985.
Prescott, John E. 'Environments As Moderators of the Relationship Between Strategy and Performance', Academy of Management Journal. 29, 1986, pp. 329-346.
Pryer, M. W. and M. K. Distefano, Jr. 'Perception of Leadership Behavior, Job Satisfaction and Internal-External Control across three Nursing Levels', Nursing Research. 20, 1971, pp. 534-537.
333
Reproduced with perm ission o f the copyright owner. Further reproduction prohibited w ithout permission.

Reardon, Richard, Sidney Rosen, and LeAnne D. Bryant. 'Reactance in Closed Groups: the effect of belief in pcwerful others', Group and Organization Studies. 10, 1985, pp. 509-523.
Rink, D. and J. Swan. 'Product Life Cycle Research: a literature review', Journal of Business Research. 7, 1979, pp. 219-242.
Roberts, K., R. E. Miles, and L. V. Blankenship. 'Organizational Leadership, Satisfaction, and Productivity: a comparative analysis', Academy of Management Journal. 11, 1968, pp. 401-414.
Robinson, John P., Jerold G. Rusk, and Kendra B. Head. Measures of Political Attitudes. Survey Research Center, Institute for Social Research, Ann Arbor, MI., 1968
Robinson, S. J. Q., R. E. Hichens, and D. P. Wade. 'The Directional Policy Matrix— tool for Strategic Planning', Long Range Planning. 11, 1978, pp. 8-15.
Rockart, J. F. 'Chief Executives Define their cwn Data Needs', Harvard Business Review. 57, 1979, pp. 81-93.
Rotter, J. B. 'Generalized Expectancies for Internal Versus External Control of Reinforcement', Psychological Monographs: General and Applied. 80, 1966, Whole No. 609.
Rumelt, R. Strategy. Structure, and Economic Performance. Boston, MA.: Harvard University Press, 1974.
Rumelt, R. P. 'Evaluation of Strategy: theory and models'. In D.E. Schendel and C. W. Hofer (editors), Strategic Management: a new view of business policy and planning. Boston, MA.: Little, Brcwn, 1979, pp. 196-212.
Runyon, K. E. 'Seme Interaction between Personality Variables and Management Style', Journal of Applied Psychology. 57, 1973, pp. 288-294.
Reproduced w ith perm ission o f the copyright owner. Further reproduction prohibited w ithout permission.

Salancik, G. R. and J. Pfeffer. 'Constraints on administrator discretion: the limited influence of mayors on city budgets', Urban Affair-c Quart-Pi-lv. 1 2, 1977, pp. 475-498
SAS User's Guide. 1979 edition. Raleigh, NC.: SAS Institute, 1979 edition
Sashkin, Marshall and William C. Morris. Experiencing Management. Reading, MA.: Addison-Wesley Publishing Ccopany, 1987.
Schendel, D. E. and G. R. Patton. 'A Simultaneous Equation Model of Corporate Strategy', Management Science. 24, 1978, pp. 1611-1621.
Scheuing, E. E. 'The Product Life Cycle as an aid in strategy decisions', Management International Review. 9, 1969, pp. 111-124
Schoeffler, S., R. D. Buzzell, and D. F. Heany. 'Inpact of Strategic Planning on Profit Performance', Harvard Business Review. 52, 1974, pp. 137-145.
Schoonhoven, C. B. "Problems With Contingency Theory: testing assumptions hidden within the language of contingency 'theory'", Administrative Science Ouartprlv. 26, 1981, pp. 349-377.
Scott, Richard A. and Norton E. Marks. Marketing and Its Environment. Belmont, CA.: Wadsworth, 1968.
Seeman, M. 'On the Personal Consequences of Alienation in Work', American Sociological Review. 32, 1967, pp. 973-977.
Segev, Eli. 'A Systematic Comparative Analysis and Synthesis of Two Business-Level Strategic Typologies', Strategic Management Journal. 10, 1989, pp. 487-505.
Selznick, Philip. Leadership in Administration. Evanston, IL., Row, Peterson and Ccnpany, 1957.
335
Reproduced with perm ission o f the copyright owner. Further reproduction prohibited w ithout permission.

Shapero, A. 'The Displaced, Uncanfortable, Entrepreneur', Psychology Today. November, 1975, pp. 83-86.
Shaw, M. E. and J. M. Blum. 'Effects of leadership style upon group performance as a function of task structure', Journal of Personality and Social Psychology. 3, 1966, pp. 238-242.
Shell International Chemical Cctpany, The Directional Policy Matrix: a new aid to corporate planning. 1975.
Sheridan, John E., Donald J. Vredenburg, and Michael A. Abelson. 'Contextual Model of Leadership Influence in Hospital Units', Academy of Management Journal. 27, 1984, pp. 57-78.
Shrader, C. B., L. Taylor, and D. R. Dalton. 'Strategic Planning and Organizational Performance: a critical appraisal', Journal of Management. 10, 1987, pp 149-171.
Sidman, M. Scientific Rogearch: evaluating experimental data in psychology. New York, NY.: Basic Books, 1960.
Sims, Marie T., Rodney J. Graves, and Geoffrey C. Simpson. 'Mineworkers' Scores for the Rotter Internal-External Locus of Control Scale', Journal of Occupational Psychology. 57, 1984, pp. 327-329.
Smith, Jonathan E., Kenneth P. Carson, and Ralph A. Alexander. 'Leadership: it can make a difference', Academy of Management Journal. 27, 1984, pp. 765-776.
Snow, C. C. and D. C. Hambrick. 'Measuring organizational strategies: sane theoretical and methodological problems', Academy of Management Review. 5, 1980, pp. 527-538.
Snow, C. C. and Lawrence G. Hrebiniak. 'Strategy, distinctive competence, and organizational performance', Administrative science r>:ar-tpr1y. 25, 1980, pp. 317-335
336
Reproduced with perm ission o f the copyright owner. Further reproduction prohibited w ithout permission.

Southwood, K.E. 'Substantive Theory and Statistical Interaction: five models', American Journal of Sociology. 84, 1978, pp. 1154-1203.
Spector, P. E. 'Behavior In Organizations As A Function Of Employee's Locus Of Control', Psychological Bulletin. 91, 1982, pp. 482-497.
Spector, Paul E. 'Development of the Work Locus of Control Scale', Journal of Occupational Psychology. 61, 1988, pp. 335-340.
Steiner, George A., John B. Miner, and Edmund R. Gray. Management Policy and Strategy: text, readings, and cases. New York, NY.: MacMillan Publishing Company, 1982.
Steiner, George A. Tod Management Planning. New York, NY.: The MacMillan Publishing Company, 1969.
Stevens, James. Applied Multivariate Statistics for the Social Sciences, Hillsdale, NJ.: Lawrence Erlbaum Associates Inc., 1986.
Stevens, S. S. 'Mathematics, Measurement and Psychophysics', in S. S. Stevens (ed.) Handbook of Experimental Psychology. New York,NY.: John Wiley, 1951.
Stevenson, Howard H. 'Defining Corporate Strengths and Weaknesses', Sloan Management Review. Spring, 1976, pp. 51-66.
Stewart, Ihctnas A. 'Turning Around the Lord's Business', Fortune. September 25, 1989, pp. 116-128.
Storms, Philip L. and Paul E. Spector. 'Relationship of Organizational Frustration with Reported Behavioural Reactions: the moderating effect of Locus of Control', Journal of Occupational Psychology. 60, 1987, pp. 227-234.
Sturdivant, Frederick D., James L. Ginter, and Alan G. Sawyer. 'Managers' conservatism and corporate performance', Strategic Management Journal. 6, 1985, pp. 17-38.
337
Reproduced with perm ission o f the copyright owner. Further reproduction prohibited w ithou t permission.

Swanson, Neil E. and Lester A. Digman. 'Organizational Performance Measures for Strategic Decisions: a PIMS-based Investigation', HanrihhnV of Business Strategy. 1986/1987 Yearbook, William D. Guth (editor), Boston, MA.: Warren, Gorham, and Lamont, Inc., 1986, Chapter 17, pp. 1-13.
Szilagyi, Andrew D. and Schweiger, David M. 'Matching Managers to Strategy: a review and suggested framework', Academy of Management Review. 9, 1984, pp. 626-637.
Taylor, B. 'Managing the Process of Corporate Development', long Range Planning. 9, 1976, pp. 81-100.
Taylor, Charlotte. 'Do You Have What It Takes (to be an entrepreneur)?', Business and Economic Review. 31, 1985, pp. 3-5.
Taylor, Lewis A. III. 'Strategic Alternative and Goal level effects on decision quality and canmitment', Unpublished Doctoral Dissertation, Indiana University, Graduate School of Business, 1984.
Terreberry, S. 'The evolution of organizational environments', Administrative Sciennp charterlv. 1 2, 1968, pp. 590-613.
Thcmas, A. B. 'Does Leadership Make a Difference to Organizational Performance ?', Administrative Scienrp onar-terlv. 33, 1988, pp. 388-400.
Thompson, J. D. Oganizations in action. New York, NY.: MoGraw Hill, 1967.
Trevino, T.inda Klebe. 'Ethical Decision Making in Organizations: a pjerson-situation interactionist model', Academy of Management Review. 11, 1986, pp. 601-617.
Utterback, J. M. and W. J. Abernathy. 'A dynamic model of process and product innovation', OMEGA. 3, 1975, pp. 639-656.
338
Reproduced with perm ission o f the copyright owner. Further reproduction prohibited w ithout permission.

Uyterhoeven, H. E. R., R. W. Ackerman, and J. W. Rosenblum. Strategy and Organization; text and cases in general management. Hcroewood, IL.: Richard D. Irwin, 1973.
Van de Ven, A. H. and R. Drazin. 'The Concept of Fit in Contingency Theory'. In L. Cunnings and B. M. Straw (editors), Rpgparrh in Organizational Behavior. Greenwich, CT.: JAI Press, 7, 1985, pp. 330-365.
Venkatraman, N. 'The Concept Of Fit In Strategy Research: toward verbal and statistical correspondence', Academy of Management Review. 14, 1989, pp. 423-444.
Venkatraman, N. and John C. Camillus. 'Exploring the Concept of "Fit' in Strategic Management', Academy of Management Review. 9, 1984, pp. 513-525.
Venkatraman, N. and J. E. Prescott. 'Environment-strategy Coalignment: an empirical test of its performance implications', Strategic Management Journal. 11, 1990, pp. 1-23.
Verbrugge, J. and S. Goldstein. 'High performers versus lew performers: what makes the difference ?', Savings and Loan News. November, 1978, ]?p. 64-69.
Verbrugge, J. and R. Shick. 'Market structure and savings and loan profitability', The Quarterly Review of Economics and Business.16, 1976, pp. 79-90.
Verbrugge, J., R. Shick, and K. Thygerson. 'Profitability: management control or market coincidence', Savings and Loan News. July, 1975, pp. 70-75.
Vespser, K. 'Strategic mapping — a tool for corporate planners', Long Range Planning. 12, 1979, pp. 75-92
Vickers, Geoffrey. The Art of Judgment: a study of policy making. New York, NY.: Basic Books, 1965.
339
Reproduced with perm ission o f the copyright owner. Further reproduction prohibited w ithout permission.

Hard, John L. 'The Opportunity to Measure Strategic Variables: an attempt to quantify product-market diversity', Journal of Economics and Business. 28, 1976, pp. 219-226.
Webb, R. J. 'Organizational Effectiveness and the Voluntary Organization', Academy of Management Journal. 17, 1974, pp. 663-677.
Weiner, N. and T. A. Mahoney. 'A model of corporate performance as a function of environmental, organizational, and leadership influences', Academy of Management Journal. 24, 1981, pp. 453-470.
Wensley, Robin. 'PIMS and BOG: new horizons or false dawn ?', Strategic Management Journal. 3, 1982, pp. 147-158.
White, R. E. 'Generic Business Strategies, Organizational Context and Performance: an enpirical investigation', Strategic Management Journal. 7, 1986, pp. 217-231.
White, R. E. and R. G. Hanmermesh. 'Toward a Model of Business Unit Performance: an integrative approach', Academy of Management Review. 6, 1981, pp. 213-223.
Wilson, Glenn D. and John R. Patterson. 'A New Measure of Conservatism', Ri-i-Hsh Journal of Social and Clinical Psychology. 7, 1968, pp. 264-269.
Wilson, Glenn D. (editor). The Psychology of Conservatism. London, Great Britain: Academic Press, 1973.
Winer, B. J. Statistical Principles In Experimental Design. New York, NY.: McGraw-Hill Book Co., 1971.
Wissema, J. H., H. W. Van der Pol, and H. M. Messer. 'Strategic management archetypes', Strategic Management Journal. 1, 1980, pp. 37-47.
Wofford, J. C. 'Factor Analysis Of Managerial Behavior Variables', Journal of Applied Psychology. 54, 1970, pp. 169-173.
340
Reproduced with perm ission o f the copyright owner. Further reproduction prohibited w ithout permission.

Wolfe, R. N. 'Effects of Economic Threat on Autonomy and Perceived Locus of Control', The Journal of Social Psychology. 86, 1972, pp. 233-240.
Wortman, M. S. Jr., 'Strategic Management: Not-for-profit organizations'. In Strategic Management, edited by D. E. Schendel and C. W. Hofer, Little, Brcwn and Ccnpany, 1979, pp. 353-373.
Wrigley, L. 'Divisional Autonomy and Diversification', Unpublished Doctoral Dissertation, Graduate School of Business Administration, Harvard University, Boston. In L. J. Bourgeios, III. 'Strategy and Environment: a conceptual integration', Academy of Management Review. 5, 1980, pp. 25-39.
Young, R. and D. E. Hussey. 'Corporate Planning at Rolls Royce Motors Limited', Long Range Planning. 10, 1978, pp. 2-12.
Zajac, Edward J. and Stephen M. Shorten. 'Changing Generic Strategies: likelihood, direction, and performance implications', Strategic Management Journal. 10, 1989, pp. 413-430.
Zeithaml, Carl P. and Valarie A. Zeithaml. 'Environmental Management: revising the marketing perspective', Journal of Marketing. 48, 1984, pp. 46-53.
341
Reproduced with perm ission o f the copyright owner. Further reproduction prohibited w ithout permission.

GENERIC STRATEGIES, LEADER ATTRIBUTES, ENVIRONMENTAL UNCERTAINTY, AND ORGANIZATIONAL PERFORMANCE: AN EMPIRICAL INVESTIGATION OF CONTINGENCIES AND CONFIGURATIONAL OUTCOMES
Abstract of dissertation submitted in partial fulfillment of the requirements for the degree of
Doctor of Philosophy
By
TOPE ADEYEMT-BEliTO, B.S., M.B.A. Eastern Illinois University, 1983 Eastern Illinois University, 1984
May, 1992 University of Arkansas
Reproduced w ith perm ission o f the copyright owner. Further reproduction prohibited w ithout permission.

ABSTRACT APPROVAL PAGE
This abstract is approved by:
Dissertation Adviser:
&DR. JOHN
Reproduced with perm ission o f the copyright owner. Further reproduction prohibited w ithout permission.

ABSTRACT OF DISSERTATION
The implications of strategy, environmental uncertainty, and leader attributes to the performance of organizations have been the subject of many research studies. The traditional interaction-based contingency approach that has typically been used in the management literature for examining the interrelationships between these variables, may very often be inadequate to capture the overall pattern of fit among them. A contemporary approach that allows researchers to examine sophisticated relationships between variables is configuration or systems theory— which suggests that inevitable relationships exist between strategic, environmental, contextual, and organizational variables and performance. This study used both the interaction and configuration-based approaches to determine the performance implications of the contingencies and congruencies between strategy and leader attributes in an uncertain environment.
A review of the literature— the basis for the formulation of the three contingency and one configuration-based hypotheses— on generic strategies, environmental uncertainty, and the relevant leader attributes was undertaken. From the generic strategies literature review, a conceptual synthesis of previous classification schemes was used to develop a set of attributes
1
Reproduced with perm ission o f the copyright owner. Further reproduction prohibited w ithout permission.

that was then used to measure the extent to which organizational leaders pursued the characteristics of different types of strategies. The measures for strategy and all the other variables/constructs were designed in the form of a questionnaire that was sent to the senior ministers of selected Arkansas Southern Baptist churches. Sampling from a religious institution is yet another contribution of this study, in that it adds to the limited number of studies that have investigated the management of these important but scientifically unexplored organizations.
The collected data was analyzed in order to test the research hypotheses. The results indicate that the variables in this study may have important performance implications. Furthermore, the findings support the call by previous researchers for using multiple approaches to examine the fit between organizational and contextual variables. Finally, the implications of the results of this study for contingency and configuration-based research and the strategic management field in general were also discussed.
Reproduced with perm ission o f the copyright owner. Further reproduction prohibited w ithou t permission.
Copyright © 2022 FDOKUMEN