An Analysis of the Value Added by Secondary Schools In England: Is the Value Added Indicator of Any...
22
An Analysis of the Value Added by Secondary Schools in England: Is the Value Added Indicator of Any Value?* Jim Taylor and Anh Ngoc Nguyen Department of Economics, Management School, Lancaster University, Lancaster, UK (e-mail: [email protected]; [email protected]) Abstract This paper argues that the value added score published for all publicly funded secondary schools in England is an unreliable indicator of school perform- ance. A substantial proportion of the between-school variation in the value added score is accounted for by factors outside the school’s control. These factors include several pupil-related variables such as the proportion of pupils on free school meals, the authorized absence rate of pupils and the proportion of pupils from ethnic minority backgrounds. The value added score is also related to several school characteristics such as the school’s admission policy and its subject specialism. The main policy recommendation of this paper is that the value added score should not be used as a performance indicator, but should be used to gain a better understanding of why the value added score varies between schools. I. Introduction Successive UK governments since the early 1990s have introduced a series of reforms that have led to the creation of a quasi-market in education *The authors are grateful to the Department for Education and Skills for providing the data used in this paper. Anh Nguyen is grateful to the ESRC for support under its Post-doctoral Fellowship Scheme. We are also grateful for helpful comments at the staff seminar in the Department of Economics at the University of Newcastle-upon-Tyne and to John Mangan, Colin Wren, Lynne Carruthers and an anonymous referee for very helpful comments on an earlier draft. The authors alone are responsible for all errors and omissions and for the opinions expressed in this paper. JEL Classification numbers: H4, I21, I28. OXFORD BULLETIN OF ECONOMICS AND STATISTICS, 68, 2 (2006) 0305-9049 203 Ó Blackwell Publishing Ltd, 2006. Published by Blackwell Publishing Ltd, 9600 Garsington Road, Oxford OX4 2DQ, UK and 350 Main Street, Malden, MA 02148, USA.
-
Upload
independent -
Category
Documents
-
view
0 -
download
0
Transcript of An Analysis of the Value Added by Secondary Schools In England: Is the Value Added Indicator of Any...
An Analysis of the Value Added by SecondarySchools in England: Is the Value AddedIndicator of Any Value?*
Jim Taylor and Anh Ngoc Nguyen
Department of Economics, Management School, Lancaster University, Lancaster, UK(e-mail: [email protected]; [email protected])
Abstract
This paper argues that the value added score published for all publicly fundedsecondary schools in England is an unreliable indicator of school perform-ance. A substantial proportion of the between-school variation in the valueadded score is accounted for by factors outside the school’s control. Thesefactors include several pupil-related variables such as the proportion of pupilson free school meals, the authorized absence rate of pupils and the proportionof pupils from ethnic minority backgrounds. The value added score is alsorelated to several school characteristics such as the school’s admission policyand its subject specialism. The main policy recommendation of this paper isthat the value added score should not be used as a performance indicator, butshould be used to gain a better understanding of why the value added scorevaries between schools.
I. Introduction
Successive UK governments since the early 1990s have introduced a seriesof reforms that have led to the creation of a quasi-market in education
*The authors are grateful to the Department for Education and Skills for providing the data used inthis paper. Anh Nguyen is grateful to the ESRC for support under its Post-doctoral FellowshipScheme. We are also grateful for helpful comments at the staff seminar in the Department ofEconomics at the University of Newcastle-upon-Tyne and to John Mangan, Colin Wren, LynneCarruthers and an anonymous referee for very helpful comments on an earlier draft. The authorsalone are responsible for all errors and omissions and for the opinions expressed in this paper.
JEL Classification numbers: H4, I21, I28.
OXFORD BULLETIN OF ECONOMICS AND STATISTICS, 68, 2 (2006) 0305-9049
203� Blackwell Publishing Ltd, 2006. Published by Blackwell Publishing Ltd, 9600 Garsington Road, Oxford OX4 2DQ, UK
and 350 Main Street, Malden, MA 02148, USA.
(Glennerster, 1991; Le Grand, 1991). This quasi-market model has four maincharacteristics. First, parents have greater choice over which school their childattends. Secondly, schools are encouraged to compete for pupils and have anincentive to do so as funding is directly related to age-weighted pupilnumbers. Thirdly, the centralized model of educational finance based on localeducation authority control over funding has been replaced by a moredecentralized approach. Schools have acquired much greater control over theirbudgets and how the available funds are allocated between competing uses.Fourthly, schools have been encouraged to apply for specialist status, whichallows them to bend their curricula in specific directions, such as languages,technology, science or sport whilst simultaneously meeting the requirementsof the national curriculum. Recent policy statements make it clear that thesepolicies are not only here to stay, but are also to be reinforced. All secondaryschools, for example, will ultimately have specialist status and schools are togain even greater control over their budgets.1
The driving force behind this quasi-market policy is the assumption thatcompetition for pupils will lead to an improvement in educational outcomes.Good schools will be encouraged to grow while ‘the worst schools will beclosed or turned around’ unless they can improve their performance; andnew academies are to be established in the most deprived areas, such as theinner cities, in order to improve educational outcomes.2 Moreover, incentivesare to be created to encourage more private sector funding of secondaryeducation.
As parents cannot make informed choices in the absence of informationabout how each school in their area is performing, a set of performanceindicators is published annually in the School Performance Tables. Thisinformation is used not only by parents for finding an appropriate school fortheir child (supplemented by other available information such as schoolinspection reports) but is also used by the schools themselves in order tocompare their performance with their local competitors and with their ownpast performance. A further user of the School Performance Tables is theGovernment itself, which has made it clear that one of the ways by which itintends to raise the quality of education is through setting targets for test andexamination results [Schools Achieving Success, Department for Educationand Skills (DfES), 2001]. Schools that fail to meet these targets can then beidentified and appropriate action taken either by the school itself or by theschool’s local education authority, which has the responsibility for providingprimary and secondary education in its area of jurisdiction. In cases of
1The Government’s intention to reinforce the quasi-market was announced by the Secretary ofState for Education on 4 July 2004.
2See ‘Excellence and Choice for All in Every Community’, Department for Education and Skills,4 July 2004.
204 Bulletin
� Blackwell Publishing Ltd 2006

persistent failure, the DfES may intervene, which may include contracting outthe running of the school to the private sector.
The raw examination results, however, have serious weaknesses when usedto measure school performance (Goldstein and Spiegelhalter, 1996; Meyer,1997; Wilson, 2003). The most serious weakness is that they fail to takeinto account ‘prior attainment’ (Goldstein and Thomas, 1996). A new valueadded indicator was consequently published in 2002 based not on the rawexamination results but on estimates of the additional knowledge gainedduring specific periods of schooling.
This paper challenges the view that the measure of the value addedpublished for state-maintained secondary schools in England is a reliableindicator of school performance. We argue that a substantial proportion of thevariation in the value added score between schools is explained by factorsoutside the school’s control. Value added may therefore be a useful measure ofthe additional knowledge acquired by a school’s pupils but may neverthelessbe a poor indicator of the school’s performance. Even though the value addedmeasure may be unreliable as a performance indicator, we argue that it doeshave considerable secondary value as it permits investigation of the factorsthat determine the variation in value added between schools. These resultshave implications for education policy as they offer a more precise indicationof where policy measures need to be focused in order to increase the valueadded to pupils.
The rest of this paper is organized as follows. Section II discusses thevarious published measures of school performance. Section III specifies amodel of examination performance and identifies the variables likely toinfluence the educational attainment of a school’s pupils. Section IV describesthe data and variables used in the statistical analysis of value added to pupilsduring secondary schooling. The results of this analysis are discussed insection V and section VI suggests a method of calculating a performanceindicator based on benchmarking. Section VII concludes.
II. The measurement of school performance
The performance of secondary schools in England has been measured invarious ways since the School Performance Tables were first published in1992. National tests are taken by pupils in all state-maintained (publiclyfunded) schools at ages 7, 11, 14 years and at the end of compulsoryeducation at 16 years of age. (These ages refer to the age attained by pupilsbefore the end of the relevant school year.) Although the primary purpose ofthese tests is to provide information about the academic performance ofindividual pupils, they are also used to construct performance indicators at theschool level.
205Value added score and school performance
� Blackwell Publishing Ltd 2006

Since 1992, the government has published School Performance Tables forall state-maintained secondary schools in England based on the GCSE3
examinations at 16 years. The proportion of pupils obtaining five or moreGCSEs at grades A* to C is published for each school so that the examinationperformance of schools can be compared. Since 2000, this information hasbeen supplemented by the average GCSE points score of each school’s pupils.(The points allocated range from 1 for a G grade to 8 for an A* grade.) Inpractice, these two indicators of school performance in the GCSE examin-ations are very highly correlated (e.g. R ¼ 0.97 for 2003).
Although the raw examination scores may be useful for identifying thoseschools with poor examination results, they are fundamentally flawed as aperformance indicator. Themajorweakness of using raw test scores tomeasure aschool’s performance is that they fail to allow for differences in the priorattainment of pupils. Schools that have an intake of high-ability pupils can beexpected to get higher examination scores than those that have an intake oflow-ability pupils. There is a very high correlation, for example, betweenexamination scores atKeyStage 2 (at the end of primary school) andKeyStage 4(at the end of compulsory education). Figure 1 shows that 87% of the variationbetween schools in examination scores at Key Stage 4 can be ‘explained’ by theeducational attainment achieved by pupils even before they entered secondary
Figure 1. Exam score: Key Stage 4 vs. Key Stage 2
3This is the General Certificate of Secondary Education, which is a set of subject-based examstaken by the majority of pupils at the end of compulsory education in Year 11 (at age 15/16 years).Some pupils also take the General National Vocational Qualification exams.
206 Bulletin
� Blackwell Publishing Ltd 2006

school. A school’s examination score at Key Stage 4 is therefore predeterminedto a very large extent by the initial attainment of pupils.
In other words, the raw test and examination scores tell us more about theprior academic ability of a school’s pupils than about the performance ofschools per se. There is therefore no justification for publishing these rawscores in the annual Performance Tables as they provide little, if any,information about a school’s performance. Moreover, they may providemisleading information if they are used to indicate changes in a school’sperformance over time, as changes in examination performance may resultfrom changes in the characteristics of the relevant pupil cohort and may beunrelated to how a school itself is performing. If a school can attract pupilswith a higher level of prior attainment, it is very likely to improve itsexamination results but this does not mean that it has improved itsexamination performance.
The raw (unadjusted) examination score therefore measures the examin-ation performance of pupils and not the performance of the school attended.This would not be a serious problem if it did not have potentially harmfulconsequences for schools achieving poor examination results. But as Ladd(2001) points out, schools with poor examination results get labelled as‘failing’ schools even though they may be performing well given the priorattainment of their pupils. ‘Failing’ schools become unpopular, leading to adeclining school roll and a subsequent loss of staff. As the best teachers arelikely to be the most mobile, this could lead to a downward spiral forunpopular schools. One of the possible consequences is the polarization ofpupils because of ‘cream-skimming’ by the most popular schools (Bradleyand Taylor, 2002).
Recognition of the problems inherent in the raw examination score led theUK government to introduce value added indicators in 2002 for all state-maintained secondary schools in England, 10 years after the School Perform-ance Tables were first published. A value added indicator was thereforeconstructed by first calculating a pupil’s expected examination score at the end of(say) Key Stage 3. This expected score is based on the pupil’s actual score at theend of Key Stage 2. The difference between the actual score and the expectedscore is then assumed to measure the value added to each pupil’s knowledgeduring Key Stage 3. The same procedure is used to calculate each pupil’s valueadded score during Key Stage 4. Summing these calculations over all pupils inthe relevant cohort provides a measure of value added to each school’s cohort ofpupils during each of the Key Stages (see Department for Education and Skills,Value Added, Technical Annex, 2001, for further details).
A comparison of the raw GCSE score (at the end of Key Stage 4) withthe value added between Key Stages 3 and 4 clearly shows that thesetwo measures provide different information about a school’s performance
207Value added score and school performance
� Blackwell Publishing Ltd 2006

(see Figure 2). Although there is a significant positive correlation betweenthese two indicators across schools, the correlation is relatively low(R ¼ 0.46). Schools achieving a high GCSE score at Key Stage 4, forexample, do not necessarily achieve a high value added score; and schoolsachieving a low GCSE score at Key Stage 4 do not necessarily achieve a lowvalue added score. Figure 2 also shows that schools selecting their pupilsaccording to their academic ability (i.e. grammar schools) have a substantiallylower value added score than could be expected from their GCSE score.4
Although the value added score has the merit that it takes prior attainmentexplicitly into account in its measurement, this does not mean that thepublished value added score is necessarily an efficient measure of a school’sperformance. The rationale behind the value added measure is that schoolshave far more influence over the accumulation of a pupil’s knowledge overtime than on the stock of a pupil’s knowledge at any given point in time. Bytaking into account prior attainment, the value added indicator should inprinciple, be a more reliable measure of a school’s performance than the rawexamination score. Indeed, it would be surprising if this were not the casegiven the inadequacy of the raw examination score as a performance indicator.
But there is a major problem in using the value added indicator tomeasure a school’s performance. Specifically, it cannot be assumed that theknowledge gained by pupils during any of the Key Stages is due solely tothe contribution of the school (Meyer, 1997; Ladd and Walsh, 2002). The
Figure 2. Value added vs. examination score at Key Stage 4
4The correlation coefficient increases marginally to 0.53 when selective schools are omitted.
208 Bulletin
� Blackwell Publishing Ltd 2006
published value added indicator should therefore be treated with con-siderable caution and suggests the need to investigate the extent to whichfactors outside the school’s control affect the value added to its pupils.Furthermore, it may be possible to devise policies that lead to an increasein value added if the major determinants can be found. Such an exercisecould be particularly useful for improving the performance of schools withpersistently low value added scores. Section III attempts to identify thevariables that are likely to determine the value added to a school’s pupilsduring their time at school.
III. Modelling value added
Educational output is multi-dimensional. It includes not only educationalattainment but also the personal development of pupils and the inculcation ofsocial and cultural values. We focus here, however, on estimating the potentialdeterminants of the gains to knowledge as measured by the value addedindicator discussed in section II.
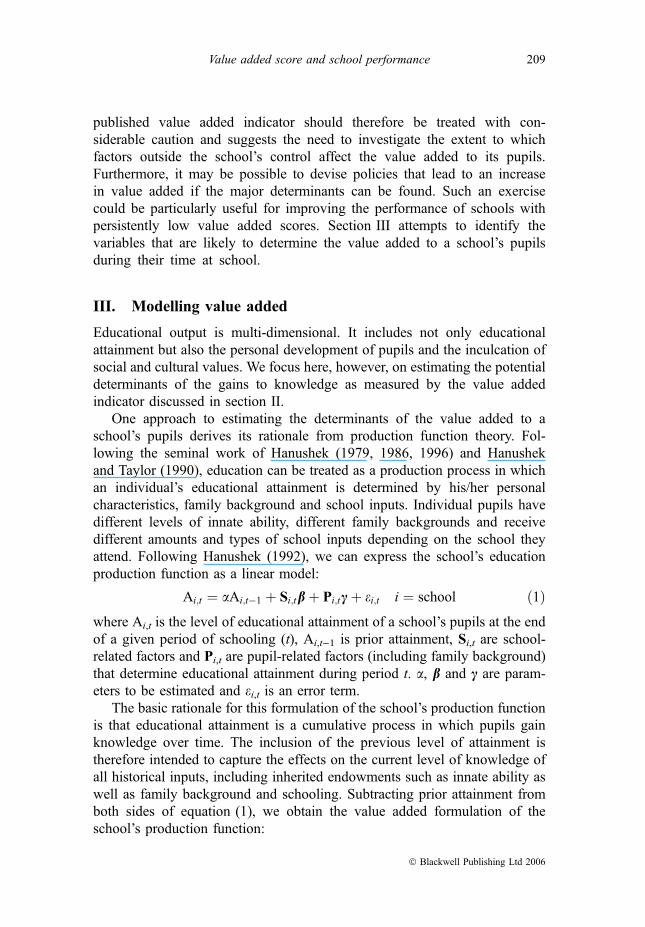
One approach to estimating the determinants of the value added to aschool’s pupils derives its rationale from production function theory. Fol-lowing the seminal work of Hanushek (1979, 1986, 1996) and Hanushekand Taylor (1990), education can be treated as a production process in whichan individual’s educational attainment is determined by his/her personalcharacteristics, family background and school inputs. Individual pupils havedifferent levels of innate ability, different family backgrounds and receivedifferent amounts and types of school inputs depending on the school theyattend. Following Hanushek (1992), we can express the school’s educationproduction function as a linear model:
Ai;t ¼ aAi;t�1 þ Si;tbþ Pi;tcþ ei;t i ¼ school ð1Þwhere Ai,t is the level of educational attainment of a school’s pupils at the endof a given period of schooling (t), Ai,t)1 is prior attainment, Si,t are school-related factors and Pi,t are pupil-related factors (including family background)that determine educational attainment during period t. a, b and c are param-eters to be estimated and ei,t is an error term.
The basic rationale for this formulation of the school’s production functionis that educational attainment is a cumulative process in which pupils gainknowledge over time. The inclusion of the previous level of attainment istherefore intended to capture the effects on the current level of knowledge ofall historical inputs, including inherited endowments such as innate ability aswell as family background and schooling. Subtracting prior attainment fromboth sides of equation (1), we obtain the value added formulation of theschool’s production function:
209Value added score and school performance
� Blackwell Publishing Ltd 2006

Ai;t � Ai;t�1 ¼ ða� 1ÞAi;t�1 þ Si;tbþ Pi;tcþ ei;t: ð2ÞThe crucial feature of this value added formulation of the educationalproduction function is that it focuses on the factors influencing the gain inknowledge during a specified time period.5
What factors are likely to influence the extent to which a school’s pupilsacquire knowledge during specific Key Stages? A large number of studies,particularly in the USA, have attempted to estimate the determinants ofeducational attainment. These studies range from analyses of longitudinal datasets based on large representative samples of individuals (e.g. High Schooland Beyond; and the National Educational Longitudinal Study) to those basedon school-level data (see Haveman and Wolfe, 1995, for a review of earlierUS studies). Following the seminal work of Coleman et al. (1966) in theUSA, the most predominant finding from this research has been that anindividual’s family background is the primary influence on educationaloutcomes. Similar findings have been obtained from analyses of UK data sets,such as the Birth Cohort Study, the National Child Development Study andthe Youth Cohort Study (Dolton and Vignoles, 1996; Dolton et al., 1999;Feinstein and Symons, 1999; Vignoles et al., 2000; Robertson and Symons,2003; Bradley and Taylor, 2004).
Estimating the influence of the schools themselves on educationaloutcomes has not proved to be an easy task, both because of methodologicalshortcomings and a lack of appropriate data (Meyer, 1997; Ladd, 2001;Hanushek, 2004). Several school-level analyses in the UK, however, showthat school-related factors have an impact on the examination performanceof schools (Bradley et al., 2000; Bradley and Taylor, 1998, 2004). Schoolscan be classified, for example, by their admissions policy, their curriculum(subject to the conditions imposed by the National Curriculum)6 and by thesocioeconomic mix of their pupils. Previous research has suggested that atleast some of these factors have a role to play in determining the performanceof a school’s pupils in national tests and examinations. However, the evi-dence that school-related factors (such as class size, pupil ‘streaming’ andexpenditure per pupil) affect educational outcomes is considerably morecontroversial (Hanushek, 1998, 2000, 2003; Krueger, 2000, 2003) and there isstill no consensus on the extent to which school inputs per pupil determineeducational outcomes.
We argued earlier that a distinction needs to be made between the totalvalue added to pupils and that part of the value added attributable to the
5Todd and Wolpin (2003) warn that the estimated coefficients from regression equations based onthis model (and similar models based on the educational attainment production function) need to beinterpreted with great caution due to estimation problems arising from missing explanatory variables.
6The National Curriculum is determined by the Department for Education and Skills followingguidance provided by the Qualification and Curriculum Authority.
210 Bulletin
� Blackwell Publishing Ltd 2006

schooling process. We therefore need to identify the determinants of the valueadded to pupils so that the influence of the school itself can be ascertained. Anadvantage of the production function approach to explaining why value addedvaries between schools is that it explicitly allows for the influence of school-and pupil-related factors on value added to be estimated separately. Inprinciple, this should provide a useful basis for estimating the specificinfluence of the school itself on its value added score. But this assumes thatthe factors identified as being school-related are under the school’s control.This may not, however, be the case.
Schools can be categorized, for example, by their admissions policy. Ifthose schools with a religious affiliation attract pupils whose parents are morecommitted to providing parental support to their child’s education, thisparticular school-related factor will reflect the influence of family backgroundrather than the influence of the school itself. Similarly, schools adopting asubject specialism may attract pupils from families with a higher level ofcommitment to their child’s education than is the case for pupils attendingschools with no subject specialism. A further example is that individualschools may have little direct influence over their pupil/teacher ratio. To theextent that these school-related factors are outside the school’s control, thisshould be taken into account in devising a performance indicator based on thevalue added score.
IV. Data and variables
The dependent variable in the following statistical analysis is the value addedscore calculated for each state-maintained secondary school in England by theDepartment for Education and Skills and published annually in the SchoolPerformance Tables. (‘Special schools’ which admit only pupils with specialeducational needs are excluded from the analysis.) The dependent variable isexpressed as a standard normal variable in order to make it easier to interpretthe estimated impact of the individual explanatory variables. The explanatoryvariables were obtained from two sources. Information relating to the schoolitself as well as information about each school’s pupils was obtained from theannual Schools’ Census (Form 7); and data on teaching quality were obtainedfrom the Office for Standards in Education (OFSTED) school inspectionreports.
The explanatory variables divide into two broad groups (see Table 1): first,those that measure the characteristics of the school (referred to henceforth asschool-related variables); and secondly, those that measure characteristics ofthe pupils and their families (pupil-related variables).
Schools can be categorized according to several characteristics. First, theyare distinguished by their admissions policy. For example, schools may select
211Value added score and school performance
� Blackwell Publishing Ltd 2006

TABLE 1
Descriptive statistics, 2003
Variables Mean Standard deviation
School governance (%)Community (LEA controlled)* 63.7Voluntary aided/voluntary controlled 19.8Foundation 16.0City Technical College 0.5Selection policy (%)Comprehensive* 89.0Modern 5.8Selective (grammar) 5.2Mixed gender* 86.9Boys-only 5.9Girls-only 7.2Non-conventional 1.0Subject specialism (%)Non-specialist* 54.2Arts 7.3Business studies 2.6Engineering 0.5Languages 6.0Maths & computing 2.5Sport 7.2Science 4.0Technology 15.7Other school characteristicsSchools teaching up to A-level 57.9 49.4Pupil/teacher ratio 17.2 1.8Teaching quality rated ‘very good’ (%) 18.2 9.6Part-time/full-time teachers (·100) 14.5 8.7Pupils on school roll 1,018 341Family background% pupils eligible for free meals 15.6 13.6% pupils Afro-Caribbean 3.6 8.9% pupils Bangladeshi 0.9 5.1% pupils Indian 2.4 6.9% pupils Pakistani 2.6 8.6% pupils other ethnic origin 2.4 4.1Pupils% pupils changing schools 2.9 10.4% pupils with special needs 2.6 1.8% authorized absence from school 7.3 1.7
Note: *A variable is included in the base group in the regression analysis. Special schools teachingonly pupils with special needs are excluded from the data provided in this table.
Sources: School Performance Tables and Schools’ Census (Form 7). The proportion of pupilschanging schools (between Key Stages 3 and 4) was obtained from the National Pupil Database,Department for Education and Skills. The teaching quality variable was obtained from the Office forStandards in Education (OFSTED). This variable was available for the years 1996–2000 inclusive for2046 secondary schools.
212 Bulletin
� Blackwell Publishing Ltd 2006

pupils according to their religious affiliation (voluntary-aided or -controlled),their gender (boys- or girls-only) and their academic ability (grammar schoolsand modern schools). A further aspect of school selection (by parents, pupilsand schools) is the rapid expansion in the number of schools specializing inparticular subject areas, a policy introduced in 1994.7 In 2003, 45% of allstate-maintained secondary schools had a subject specialism. This had risen toover 60% by 2004 and all secondary schools are expected to have a subjectspecialism by the end of the decade.
The second group of school-related variables is concerned with theiroperational characteristics (obtained from the annual Schools’ Census). First,schools are distinguished according to whether or not they teach beyond thecompulsory school-leaving age of 16 years (i.e. up to 18 years). This mayaffect a school’s value added score in so far as the school’s teaching staff willnormally have higher qualifications if they teach up to A-level. The schoolmay also have a different set of priorities and targets if they teach up toA-level. Secondly, the pupil–teacher ratio is included as a proxy for class size,which is expected to be negatively related to a school’s value added score assmaller classes should mean more teaching inputs per pupil. Thirdly, the ratioof part- to full-time staff is included as it indicates the extent to which aschool’s managers can acquire extra teaching resources if needed. Thisvariable may also indicate the extent of a school’s willingness to be flexible inits hiring policies. Fourthly, school size (and its squared value) is includedin the model as earlier studies have indicated a non-linear (inverted-U)relationship between school size and examination results at the end ofcompulsory education.8
A school input that has so far proved to be elusive in empirical analyses ofschool outcomes is the quality of teaching. Although some previous USstudies have investigated the relationship between the qualifications ofteachers and educational outcomes, data measuring the quality of the teachingrather than the academic achievements of teachers have proved to be difficultto obtain. An estimate of the quality of teaching in each secondary school inEngland can be obtained, however, from school inspections undertaken byOFSTED. One of the published quantitative variables from these inspectionsis the proportion of teaching rated as ‘very good’. As these judgments aboutteaching quality are made by independent and experienced inspectors, thisvariable can be regarded as exogenous. In addition, lagged values of the
7See Levacic and Jenkins (2004) for a detailed statistical investigation into the impact of subjectspecialism on GCSE results.
8Several additional school-related variables were found to be statistically insignificant in allequations. These included the % of pupils with English as a second language, the support staff/pupilratio and the % of pupils eligible for free school meals in the district (to reflect neighbourhoodeffects).
213Value added score and school performance
� Blackwell Publishing Ltd 2006

teaching quality variable are used as inspections normally take place onlyonce every 5 years.9
The pupil-related explanatory variables measure some potentially im-portant characteristics of each school’s pupils and their families. First, theproportion of pupils eligible for free school meals is included as anexplanatory variable as the rate at which knowledge is accumulated may bedetermined in part by the family resources devoted to a child’s education(including parental time as well as financial resources). Secondly, theproportion of a school’s pupils with special educational needs is included asspecial-needs pupils may learn at a slower rate than other pupils. Thirdly, ascultural differences between pupils from different ethnic backgrounds mayaffect attitudes towards schooling, the proportion of pupils in each of fiveethnic groups is included as an explanatory variable (Black, Bangladeshi,Indian, Pakistani and other ethnic groups). It may be the case that some ethnicminority pupils are held back by language or other difficulties at primaryschool and then catch up in later years. Their initial attainment score maytherefore underestimate their true ability relative to whites.10 Fourthly,previous research has indicated that changing school mid-stream can have adetrimental effect on pupil outcomes. The proportion of a school’s pupils whojoined a school ‘late’ is consequently included as an explanatory variable.Finally, as non-attendance at school because of illness is likely to have adetrimental effect on learning, the authorized absence rate (assumed to beexogenous as authorized absence is likely to be a consequence predominantlyof illness) is included as an explanatory variable.
V. Empirical analysis
This section presents the results of an empirical analysis of the examinationperformance of secondary schools in England during 2003 based on the valueadded model specified in equation (2) above.
The statistical analysis is divided into three parts. The first partinvestigates the determinants of value added over the entire period ofsecondary schooling. The dependent variable in this case is the value addedbetween the end of primary school (Key Stage 2) and the end ofcompulsory education at age 16 years (Key Stage 4). This part of thestatistical analysis also investigates how much of the variation in valueadded between schools can be accounted for by school-related factors alone
9We assume that teaching quality is likely to remain reasonably stable over the medium term.The length of the lag, however, is likely to result in measurement error.
10Key Stage 2 scores in 2003 in maths, for example, were considerably lower for Black Caribbeans(50.1), Other Blacks (51.6), Bangladeshis (49.7) and Pakistanis (48.2) than for Whites (58.9). Source:National Pupil Database, Department for Education and Skills.
214 Bulletin
� Blackwell Publishing Ltd 2006
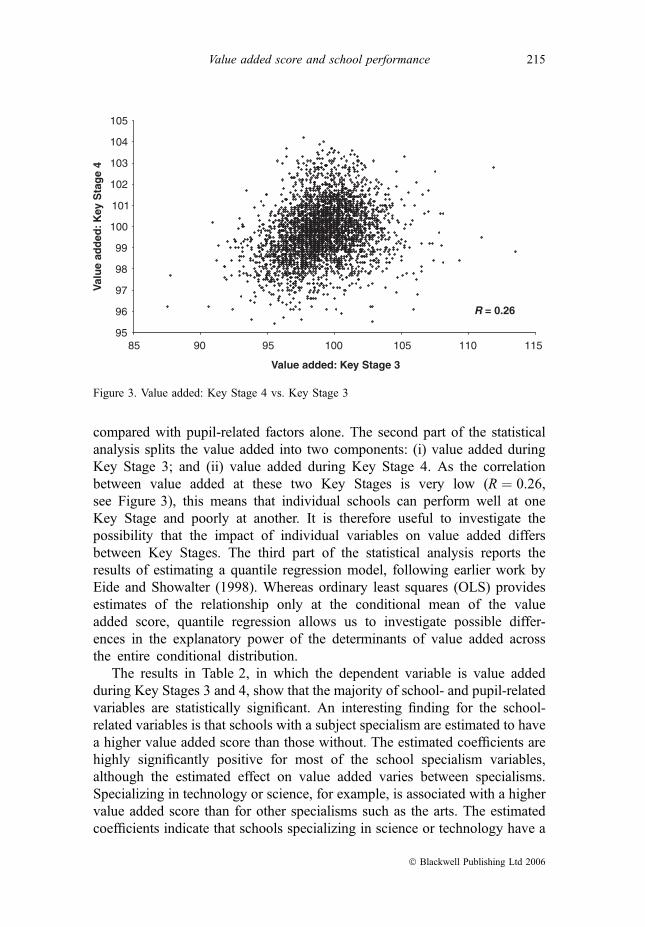
compared with pupil-related factors alone. The second part of the statisticalanalysis splits the value added into two components: (i) value added duringKey Stage 3; and (ii) value added during Key Stage 4. As the correlationbetween value added at these two Key Stages is very low (R ¼ 0.26,see Figure 3), this means that individual schools can perform well at oneKey Stage and poorly at another. It is therefore useful to investigate thepossibility that the impact of individual variables on value added differsbetween Key Stages. The third part of the statistical analysis reports theresults of estimating a quantile regression model, following earlier work byEide and Showalter (1998). Whereas ordinary least squares (OLS) providesestimates of the relationship only at the conditional mean of the valueadded score, quantile regression allows us to investigate possible differ-ences in the explanatory power of the determinants of value added acrossthe entire conditional distribution.
The results in Table 2, in which the dependent variable is value addedduring Key Stages 3 and 4, show that the majority of school- and pupil-relatedvariables are statistically significant. An interesting finding for the school-related variables is that schools with a subject specialism are estimated to havea higher value added score than those without. The estimated coefficients arehighly significantly positive for most of the school specialism variables,although the estimated effect on value added varies between specialisms.Specializing in technology or science, for example, is associated with a highervalue added score than for other specialisms such as the arts. The estimatedcoefficients indicate that schools specializing in science or technology have a
Figure 3. Value added: Key Stage 4 vs. Key Stage 3
215Value added score and school performance
� Blackwell Publishing Ltd 2006

TABLE 2
Value added regressions
Explanatory variables Dependent variable ¼ combined value added during Key Stages 3 and 4
Constant 1.285 (0.234)*** )1.105 (0.193) 1.288 (0.105)***School-related variablesVoluntary assisted/controlled 0.085 (0.042)* 0.245 (0.044)***Foundation 0.100 (0.039)** 0.182 (0.043)***City technical college 0.789 (0.179)*** 1.061 (0.181)***Modern )0.123 (0.071) )0.151 (0.074)*Selective (Grammar) 0.163 (0.093) 0.444 (0.067)***Boys-only )0.352 (0.067)*** 0.005 (0.069)Girls-only 0.562 (0.063)*** 0.754 (0.068)***Arts 0.176 (0.056)** 0.231 (0.060)***Business 0.246 (0.088)** 0.345 (0.091)***Engineering 0.138 (0.133) 0.037 (0.129)Languages 0.254 (0.058)*** 0.424 (0.062)***Maths & computing 0.277 (0.077)*** 0.386 (0.079)***Sport 0.129 (0.055)* 0.102 (0.062)Science 0.357 (0.060)*** 0.471 (0.070)***Technology 0.322 (0.042)*** 0.381 (0.047)***11–18 school )0.103 (0.036)** )0.049 (0.040)Pupil/teacher ratio )0.022 (0.010)* )0.001 (0.010)Proportion of teaching ‘very good’ 1.020 (0.189)*** 1.598 (0.197)***Missing observations dummy 0.069 (0.030)* 0.079 (0.034)*Part-time/full-time teachers 0.828 (0.199)*** 1.961 (0.206)***Pupils/100 )0.022 (0.023) 0.029 (0.025)Pupils/100-squared 0.001 (0.001) 0.000 (0.001)Pupil-related variablesInitial attainment score )0.024 (0.034) 0.086 (0.028)**Proportion joining school after KS3 )0.166 (0.289) )0.166 (0.312)Proportion eligible for free meals )2.434 (0.270)*** )2.335 (0.238)***Proportion with special needs )1.169 (1.008) )1.678 (1.039)Proportion Afro-Caribbean 1.560 (0.276)*** 1.840 (0.275)***Proportion Bangladeshi 3.534 (0.501)*** 3.583 (0.512)***Proportion Indian 0.939 (0.237)*** 0.832 (0.249)***Proportion Pakistani 2.298 (0.250)*** 2.495 (0.288)***Proportion other ethnic 1.829 (0.546)*** 1.888 (0.589)**Proportion with authorised absence )14.040 (1.298)*** )15.204 (1.377)***R2-value 0.40 0.23 0.33n 2,962 3,051 2,962
Notes: (i) The base group includes community schools, comprehensive schools, mixed genderschools, 11–16 schools and schools with no subject specialism. (ii) The initial attainment score (i.e. atthe end of Key Stage 2) was calculated from the value added during Key Stage 3 and the points scoreat the end of Key Stage 3. (iii) The proportion of pupils changing schools refers to those changingschools after Key Stage 3. (iv) Since ‘teaching quality’ is available for only two-thirds of secondaryschools, the average value of this variable has been included for the missing schools and a dummyvariable has been included in the regression equation which equals unity for the missing values. Theresults do not differ substantively from an equation estimated for those observations that do not havemissing observations for teaching quality. The results for the full sample of schools (but excludingthe teaching quality variable altogether) are also not substantively different from those in this Table(results available on request). (v) Special schools that teach only pupils with special needs areexcluded from the analysis. (vi) *Significant at 0.05; **significant at 0.01; ***significant at 0.001.Robust standard errors are in parentheses.
216 Bulletin
� Blackwell Publishing Ltd 2006

value added score that is one-third of a standard deviation greater than thevalue added score for non-specialist schools (see Table 2).
The other main findings for the school-related variables are as follows.First, the estimated coefficient on selective (grammar) schools is notsignificantly different from zero, which implies that these schools do notoffer any significant advantage over other schools as far as value added isconcerned. (We return to this below.) Secondly, girls-only schools have highervalue added scores than mixed schools. The opposite result is obtained forboys-only schools, which had substantially lower value added than mixedschools. Thirdly, the estimated impact of teaching quality is positive andstatistically significant but its estimated impact is relatively weak. An increaseof 1 standard deviation in the teaching quality variable, for example, isassociated with a 0.1 standard deviation increase in value added. Therelatively weak effect of the teaching quality indicator may be a consequenceof measurement error since teaching quality is only assessed intermittently (atapproximately 5-yearly intervals). The only other finding of note is that theratio of part-time to full-time staff is positively associated with an increase invalue added, which suggests that access to part-time staff is helpful to schools.
We now turn to pupil-related factors, several of which are highlysignificantly related to value added. Both the proportion of pupils eligiblefor free school meals and the authorized absence rate have highlysignificant negative coefficients. An increase in the percentage of pupilseligible for free school meals by 10 percentage points, for example, isassociated with a reduction of 0.24 standard deviations in the value addedscore. Value added is also positively related to the proportion of ethnicminority pupils in a school. The estimated coefficients on the ethnicminority variables are highly statistically significant and are positive in allcases.
As a primary purpose of this paper is to investigate the separate effects onvalue added of school- and pupil-related factors, two parsimonious equationshave been estimated that allow us to compare the explanatory power of theschool-related and the pupil-related variables separately. The R2-value for theequation containing only school-related variables is 0.23 compared with 0.40for the full model. By contrast, the inclusion in the model of only pupil-relatedvariables results in an R2-value of 0.34. These two equations indicate thatschool-level variables add considerably less to the explanatory power of theregression model than pupil-level variables.
Earlier in this paper, we pointed out that the correlation between valueadded during Key Stages 3 and 4 was extremely low (R ¼ 0.26), whichsuggests that the factors determining value added may have a different impactat different Key Stages. With this in mind, regression equations have beenestimated separately for Key Stages 3 and 4 in order to investigate whether the
217Value added score and school performance
� Blackwell Publishing Ltd 2006
impact of the explanatory variables does indeed vary between these two KeyStages. The results are given in Table 3.
The results in Table 3 indicate that there are several substantial differencesin the impact of individual variables on value added during Key Stage 3compared with Key Stage 4. The estimated impact of selective (i.e. grammar)schools on value added, for example, is estimated to be significantly positiveat Key Stage 3 but (surprisingly) negative at Key Stage 4. These estimatedcoefficients suggest that selective schools are able to add considerable value totheir pupils during their first 3 years of secondary schooling but consequentlyfind that they cannot repeat this success during Key Stage 4. Indeed, theopposite is the case: selective schools do worse than comprehensives duringKey Stage 4. This unexpected result is probably a consequence of the way inwhich value added is measured. Schools that achieve very high test scores atthe end of Key Stage 3 may find it impossible to achieve a high value addedscore during Key Stage 4.
A further result of interest is that value added is significantly higher ingirls-only schools than in mixed schools at both Key Stages 3 and 4, whereasvalue added in boys-only schools is significantly lower than that in mixedschools at Key Stage 4. Separating girls from boys therefore appears to helpgirls to perform better but the opposite result is obtained for boys. Apparently,boys need girls more than girls need boys.
We earlier discovered that having a subject specialism is associated with ahigher value added score. The only variation on this finding (see Table 3) isthat the estimated impact of subject specialization on value added is greaterat Key Stage 4 than at Key Stage 3. The estimated impact of subjectspecialization on value added therefore increases over the course of secondaryschooling.
The results obtained for the pupil-related variables indicate a muchstronger negative relationship between value added and the proportion ofpupils eligible for free school meals at Key Stage 3 than at Key Stage 4. Thissuggests that the negative impact of poverty on value added is much greaterduring the first period of secondary education than during the secondperiod. Table 3 also shows that ethnic minority pupils gain ground relativeto white pupils and more so during the last 2 years of secondary education.This supports the view that any earlier disadvantages suffered by ethnicminority pupils are gradually decreased as they proceed through the educationsystem.
The quantile regression estimates reported in Table 4 allow us toinvestigate the estimated relationship between value added and the explan-atory variables over the conditional distribution of value added. The aim is todiscover whether, and the extent to which, the impact of a variable varies overthe conditional distribution of the value added score. Does the estimated
218 Bulletin
� Blackwell Publishing Ltd 2006

TABLE 3
Value added regressions for Key Stages 3 and 4 separately
Explanatory variables
Dependentvariable ¼ valueadded duringKey Stage 3
Dependentvariable ¼ valueadded duringKey Stage 4
Test for differencebetween coefficients(P-value)
Constant 1.186 (0.206)*** 1.036 (0.261)***School-related variablesVoluntary assisted/controlled 0.098 (0.036)** 0.087 (0.045) 0.706Foundation 0.050 (0.036) 0.105 (0.042)* 0.278City technical college 0.508 (0.151)*** 0.816 (0.218)*** 0.119Modern )0.117 (0.055)* )0.134 (0.077) 0.524Selective (Grammar) 1.294 (0.084)*** )0.345 (0.104)*** 0.000Boys-only 0.145 (0.057)* )0.508 (0.072)*** 0.000Girls-only 0.378 (0.052)*** 0.520 (0.070)*** 0.028Arts 0.050 (0.049) 0.193 (0.058)*** 0.027Business )0.082 (0.069) 0.355 (0.095)*** 0.000Engineering 0.144 (0.151) 0.081 (0.155) 0.796Languages 0.197 (0.052)*** 0.215 (0.064)*** 0.572Maths & computing 0.188 (0.085)* 0.261 (0.079)*** 0.408Sport 0.099 (0.049)* 0.098 (0.059) 0.852Science 0.258 (0.063)*** 0.317 (0.066)*** 0.350Technology 0.144 (0.036)*** 0.322 (0.045)*** 0.00011–18 school 0.005 (0.031) )0.146 (0.039)*** 0.000Pupil/teacher ratio )0.007 (0.008) )0.023 (0.010)* 0.058Proportion of teaching‘very good’
1.071 (0.166)*** 0.793 (0.210)*** 0.463
Missing observations dummy 0.045 (0.027) 0.068 (0.032)* 0.562Part-time/full-time teachers 0.771 (0.169)*** 0.716 (0.213)*** 0.940Pupils/100 )0.027 (0.019) )0.011 (0.025) 0.400Pupils/100-squared 0.001 (0.001) 0.001 (0.001) 0.585Pupil-related variablesInitial attainment score )0.192 (0.030)*** )0.026 (0.040) 0.340Proportion joining schoolafter KS3
)0.708 (0.165)***
Proportion eligible forfree meals
)4.083 (0.207)*** )1.078 (0.303)*** 0.000
Proportion with specialneeds
)2.596 (0.897)** )0.677 (1.087) 0.240
Proportion Afro-Caribbean )0.134 (0.207) 1.900 (0.289)*** 0.000Proportion Bangladeshi 1.018 (0.319)*** 3.883 (0.552)*** 0.000Proportion Indian 0.452 (0.198)* 0.886 (0.250)*** 0.103Proportion Pakistani 1.086 (0.195)*** 2.261 (0.282)*** 0.000Proportion other ethnic 0.917 (0.419)* 1.915 (0.587)*** 0.043Proportion with authorisedabsence
)10.540 (1.065)*** )12.879 (1.439)*** 0.013
R2-value 0.51 0.32n 2,962 2,984
Note: See notes to Table 2 above. The P-values for the difference between the estimatedparameters were calculated by first running a seemingly unrelated regression on the two dependentvariables jointly. These jointly estimated equations were then used to test the hypothesis that the twoparameters estimated for each variable are equal.
219Value added score and school performance
� Blackwell Publishing Ltd 2006

impact of the explanatory variables differ, for example, between low and highvalue added schools? We focus here on just two explanatory variables:the quality of teaching and the proportion of pupils eligible for free schoolmeals.
A result of particular interest is that the estimated (negative) impact ofthe proportion of pupils on free school meals on value added decreasessubstantially as we move up the value added distribution. The differencebetween the estimated coefficients at the 10th and 90th percentiles, forexample, is highly statistically significant and indicates that the magnitude ofthe negative impact of this variable is less than half at the top end of the valueadded distribution than at the bottom end. A further result of interest is that thequality of teaching has a stronger positive impact on value added at the bottomend of the value added distribution than at the top end. This implies thatmore able pupils benefit less from high-quality teaching than do less ablepupils.
VI. Benchmarking
As a school’s value added score is correlated with variables that are outside itscontrol, this strongly suggests that the value added scores currently estimatedand published annually for schools are inadequate as performance indicators.The extent of the potential inaccuracy can be demonstrated by comparing theactual (published) value added score with a performance indicator based onthe difference between each school’s actual value added and the value addedthat a school could be expected to have after controlling for the factors that ithas no influence over in the medium term. In other words, we need to comparea school’s value added not with the mean for all schools but with a benchmark
TABLE 4
Quantile regression estimates
Explanatory variables
Estimated coefficients at each quantile (standard errors)
0.10 0.25 0.50 0.75 0.90
Proportion of teaching‘very good’
1.54(0.24)***
1.23(0.27)***
0.98(0.26)***
0.82(0.26)***
0.69(0.29)*
Proportion of pupilseligible for freeschool meals
)3.52(0.25)***
)2.96(0.26)***
)2.72(0.26)***
)2.07(0.28)***
)1.50(0.34)***
Pseudo-R2-value 0.27 0.26 0.23 0.22 0.21n 2,962 2,962 2,962 2,962 2,962
Note: The estimated equations at each quantile were estimated using all of the explanatory vari-ables shown in Table 2. Only the estimated coefficients for teaching quality and the proportion ofpupils on free schools meals are reported here.
220 Bulletin
� Blackwell Publishing Ltd 2006

constructed from knowledge of the factors influencing a school’s value addedscore but which are outside of its control.11
The benchmark for each school should take into account not only thepupil-related variables such as their ethnicity, whether they are eligible for freeschool meals and their authorized absence rate, but also those school-relatedvariables that are outside the school’s control. Once the benchmark for eachschool has been estimated, this can be used to construct a performanceindicator based on the difference between a school’s actual value added scoreand its benchmark value added score.
In order to demonstrate this method of constructing a performanceindicator and to compare the results with the actual value added score, theestimated equations in Table 3 have been used to produce a benchmark valueadded score for each school for Key Stages 3 and 4 respectively. Thebenchmark is calculated by running the same equations reported in Table 2with the exception that the teaching quality variable is omitted as this isassumed to be under the direct control of the school. In other words, we haveassumed that schools have no control over all of the other school-relatedvariables, at least in the medium term. Comparing the actual value added scorewith the performance indicator obtained from the difference between theactual value added and each school’s benchmark value added, a correlationof 0.71 (R2 ¼ 0.50) was obtained for the Key Stage 3 period and 0.83(R2 ¼ 0.68) for the Key Stage 4 period. Although these correlations are highlystatistically significant, it is clear that there can be a wide discrepancy betweena school’s actual value added and the value added that explicitly controls forfactors beyond the school’s immediate control.
This illustration suggests that the actual value added score may seriouslymisrepresent a school’s value added performance. It should, however, bepossible to construct a more reliable performance indicator based upon thecalculation of a benchmark score calculated for each school.
VII. Conclusion
The purpose of this paper has been to examine the potential usefulness ofthe value added performance indicator published annually in the SchoolPerformance Tables. To be a useful indicator of a school’s performance, thevalue added score would have to reflect the influence of the school itself onvalue added rather than the influence of factors outside of its control. Our mainconclusion is that a substantial proportion of the variation between schools intheir value added scores is accounted for by factors outside of the school’s
11A benchmarking approach to measuring performance in the higher education sector is beingdeveloped by the Higher Education Funding Councils in the UK.
221Value added score and school performance
� Blackwell Publishing Ltd 2006
control. Using regression analysis, we find that several pupil-related factors(such as the proportion of pupils on free school meals, the authorized absencerate of pupils and the proportion of pupils from ethnic minority backgrounds)contribute substantially to ‘explaining’ the observed differences in valueadded between schools. As schools have little control over many factors thatare likely to affect their value added score, this implies that value added is anunreliable indicator of a school’s performance.
Although we have argued that the value added score is not a usefulperformance indicator per se, this does not mean that it has no value.Specifically, it is important to know why value added varies between schoolsso that appropriate action can be taken to increase the value added to pupils inthose schools where it is low. In view of this, we have estimated severalregression models with the aim of identifying the factors that cause valueadded to vary between schools. Our main findings are as follows.
1 Specializing in particular subject areas such as science, technologyor languages is associated with a higher value added score. What wedo not know, however, is whether and the extent to which schoolsspecializing in specific subject areas would have achieved higher valueadded scores even if they had not opted for specialist status. Thisrequires further study.
2 The proportion of pupils eligible for free school meals is found to bestrongly negatively related to a school’s value added score, especiallyduring Key Stage 3. This implies that pupils from poorer families are ata serious disadvantage compared with their better-off peers. Furtheranalysis (using quantile regression techniques) indicates that this dis-advantage is considerably more severe at the bottom end of the valueadded distribution than at the top end. Poverty reduction programmesmay therefore be an important way of increasing value added, especiallyin schools with a large proportion of pupils from poor families.
3 A strong negative relationship is found between a school’s value addedscore and its authorized absence rate. The variation in authorizedabsence between schools is substantial and this may be a fruitful areafor policy intervention in order to increase value added. It should benoted that authorized absence (mean ¼ 7.3% in terms of half-days lost)is far more serious in terms of non-attendance than unauthorizedabsence (mean ¼ 1.2%).
4 The main policy recommendation of this paper is that the value addedscore should not be treated as a rod with which to beat ‘under-performing’ schools, but should rather be seen as an opportunity forgaining a better understanding of the determinants of educationalattainment. There is clearly a lot that can be done to improve
222 Bulletin
� Blackwell Publishing Ltd 2006

educational outcomes in schools with low (not necessarily ‘poor’) valueadded scores; and the statistical analysis of differences in value addedbetween schools will help towards finding the most appropriate policyresponses. This should be regarded, however, not as a one-offinvestigation that will ‘reveal all’, but rather as a continuous processof analysis and evaluation.
5 Finally, we have argued that if value added scores are to be used asperformance indicators, it is essential to compare like with like. Aschool’s actual value added score should not be compared with themean score for all schools but with a benchmark calculated for eachschool separately.
Final Manuscript Received: March 2005
References
Bradley, S. and Taylor, J. (1998). ‘The effect of school size on the exam performance ofsecondary schools’, Oxford Bulletin of Economics and Statistics, Vol. 60, pp. 291–324.
Bradley, S. and Taylor, J. (2002). ‘The effect of the quasi-market on the efficiency–equity trade-off in the secondary school sector’, Bulletin of Economic Research, Vol. 54, pp. 295–314.
Bradley, S. and Taylor, J. (2004). ‘Ethnicity, educational attainment and the transition fromschool’, The Manchester School, Vol. 72, pp. 317–346.
Bradley, S., Crouchley, R., Millington, J. and Taylor, J. (2000). ‘Testing for quasi-market forcesin secondary education’, Oxford Bulletin of Economics and Statistics, Vol. 62, pp. 357–390.
Coleman, J. S., Campbell, E. Q., Hobson, C. J., McPartland, J., Mood, A. M., Weinfeld, D. andYork, R. L. (1966). Equality of Educational Opportunity, U.S. Government Printing Office,Washington, D.C.
Department for Education and Skills (2001). Schools Achieving Success, Consultation on Edu-cation White Paper, Final Report, November. Department of Education and Skills, London.
Dolton, P. and Vignoles, A. (1996). The Impact of School Quality on Labour Market Success inthe United Kingdom, Discussion Paper 98-03. Department of Economics, University ofNewcastle upon Tyne.
Dolton, P., Makepeace, G., Hutton, S. and Audas, R. (1999). Making the Grade: Education, theLabour Market and Young People, Work and Opportunity Series No.15. Joseph RowntreeFoundation, York.
Eide, E. and Showalter, M. H. (1998). ‘The effect of school quality on student performance: aquantile regression approach’, Economics Letters, Vol. 58, pp. 345–350.
Feinstein, L. and Symons, J. (1999). ‘Attainment in secondary schools’, Oxford EconomicPapers, Vol. 51, pp. 300–321.
Glennerster, H. (1991). ‘Quasi-markets for education?’, Economic Journal, Vol. 101, pp. 1268–1276.
Goldstein, H. and Thomas, S. (1996). ‘Using examination results as indicators of school andcollege performance’, Journal of the Royal Statistical Society, A, Vol. 159, pp. 149–163.
Goldstein, H. and Spiegelhalter, D. J. (1996). ‘League tables and their limitations: statis-tical issues in comparisons of institutional performance’, Journal of the Royal StatisticalSociety, A, Vol. 158, pp. 385–443.
223Value added score and school performance
� Blackwell Publishing Ltd 2006
Hanushek, E. A. (1979). ‘Conceptual and empirical issues in the estimation of educationalproduction functions’, Journal of Human Resources, Vol. 14, pp. 351–388.
Hanushek, E. A. (1986). ‘The economics of schooling: production and efficiency in publicschools’, Journal of Economic Literature, Vol. 24, pp. 1141–1177.
Hanushek, E. A. (1992). ‘The trade-off between child quantity and quality’, Journal of PoliticalEconomy, Vol. 100, pp. 84–117.
Hanushek, E. A. (1996). ‘School resources and students performance’, in Burtless G. (ed.),Does Money Matter? The Effect of School Resources on Student Achievement and AdultSuccess, Brookings Institution, Washington D.C., pp. 43–73.
Hanushek, E. A. (1998). The Evidence on Class Size, Occasional Paper 98-1, University ofRochester, New York.
Hanushek, E. A. (2000). ‘Evidence, politics and the class size debate’, in Rothstein R. (ed.), TheClass Size Policy Debate, Working Paper 121, Economic Policy Institute, Washington.
Hanushek, E. A. (2003). ‘The failure of input-based schooling policies’, Economic Journal,Vol. 113, pp. F64–F98.
Hanushek, E. A. (2004). ‘What if there are no best practices?’, Scottish Journal of PoliticalEconomy, Vol. 51, pp. 156–172.
Hanushek, E. A. and Taylor, L. L. (1990). ‘Alternative assessments of the performance ofschools: measurement of state variations in achievement’, Journal of Human Resources,Vol. 25, pp. 179–201.
Haveman, R. H. and Wolfe, B. L. (1995). ‘The determinants of children’s attainments: a reviewof methods and findings’, Journal of Economic Literature, Vol. 33, pp. 1829–1878.
Krueger, A. B. (2000). ‘Understanding the magnitude and effect of class size on studentachievement’, in Rothstein R. (ed.), The Class Size Policy Debate, Working Paper 121.Economic Policy Institute, Washington.
Krueger, A. B. (2003). ‘Economic considerations and class size’, Economic Journal, Vol. 113,pp. F34–F63.
Ladd, H. F. (2001). ‘School-based educational accountability systems: the promise and thepitfalls’, National Tax Journal, Vol. 54, pp. 385–400.
Ladd, H. F. and Walsh, R. P. (2002). ‘Implementing value-added measures of school effec-tiveness: getting the incentives right’, Economics of Education Review, Vol. 21, pp. 1–17.
Le Grand, J. (1991). ‘Quasi-markets and social policy’, Economic Journal, Vol. 101, pp. 1256–1267.
Levacic, R. and Jenkins, A. (2004). Evaluating the Effectiveness of Specialist Schools, Centrefor the Economics of Education, London School of Economics and Political Science,London.
Meyer, R. H. (1997). ‘Value added indicators of school performance: a primer’, Economics ofEducation Review, Vol. 16, pp. 283–301.
Robertson, D. and Symons, J. (2003). ‘Do peer groups matter? Peer group versus schoolingeffects on academic attainment’, Economica, Vol. 70, pp. 31–54.
Todd, P. E. and Wolpin, K. I. (2003). ‘On the specification and estimation of the productionfunction for cognitive achievement’, Economic Journal, Vol. 113, pp. F3–F33.
Vignoles, A., Levacic, R., Machin, S., Reynolds, D. and Walker, J. (2000). The Relationshipbetween Resource Allocation and Pupil Attainment: A Review, DfEE Research Report 228,London.
Wilson, D. (2003). Which Ranking? The Use of Alternative Performance Indicators in theEnglish Secondary Education Market. CMPO, University of Bristol, Bristol.
224 Bulletin
� Blackwell Publishing Ltd 2006