added value to explain price formation at primary fish markets ...
38
1 Please note that this is an author-produced PDF of an article accepted for publication following peer review. The definitive publisher-authenticated version is available on the publisher Web site. Applied Economics 2016, Volume 48, Issue 22, Pages 2078-2092 http://dx.doi.org/10.1080/00036846.2015.1114576 http://archimer.ifremer.fr/doc/00301/41252/ © 2015 Taylor & Francis Achimer http://archimer.ifremer.fr Information on sellers and buyers characteristics: added value to explain price formation at primary fish markets in managed French scallop fisheries Lesur-Irichabeau Gabrielle 1, 2, * , Guyader Olivier 1 , Frésard Marjolaine 3 , Leroy C. 4 , Latouche K. 4 , Le Grel L. 5, 6 1 IFREMER, UMR AMURE, Unité d’Economie Maritime, BP 70, 29280 Plouzané, France 2 Université de Bordeaux, GREThA, UMR CNRS 5113, avenue Léon Duguit, 33608 Pessac, France 3 Université de Brest, UEB, UMR AMURE, 12 rue de Kergoat, CS 93837, 29238 Brest Cedex 3, France 4 INRA, Centre de recherche Angers-Nantes, Unité LERECO, Rue de la Géraudière, BP 71627, 44316 Nantes Cedex 3, France 5 FISH PASS, 3 rue des Grands Champs, Z.A. des 3 Prés, 35890 Laillé, France 6 ONIRIS-NANTES, LARGECIA, BP 82225, 44322 Nantes Cedex 3, France * Corresponding author : Gabrielle Lesur-Irichabeau, email address : [email protected] Abstract : The aim of this article is to explore, through a hedonic approach, the factors that might explain the price variability for the French-managed fishery of scallop at primary fish markets. In addition to factors classically identified in the current literature like intrinsic product characteristics or markets situation, the characteristics of operators are tested. The relationships of loyalty between sellers and buyers, and market assiduity are notably considered. Keywords : Buyer and seller characteristics, fisheries management, hedonic price, market behaviour, market structure, scallop, Q21, Q22, Q28, C10, L11
-
Upload
khangminh22 -
Category
Documents
-
view
0 -
download
0
Transcript of added value to explain price formation at primary fish markets ...
1
Please note that this is an author-produced PDF of an article accepted for publication following peer review. The definitive publisher-authenticated version is available on the publisher Web site.
Applied Economics 2016, Volume 48, Issue 22, Pages 2078-2092 http://dx.doi.org/10.1080/00036846.2015.1114576 http://archimer.ifremer.fr/doc/00301/41252/ © 2015 Taylor & Francis
Achimer http://archimer.ifremer.fr
Information on sellers and buyers characteristics: added value to explain price formation at primary fish markets in
managed French scallop fisheries
Lesur-Irichabeau Gabrielle 1, 2, *
, Guyader Olivier 1, Frésard Marjolaine
3, Leroy C.
4, Latouche K.
4,
Le Grel L. 5, 6
1 IFREMER, UMR AMURE, Unité d’Economie Maritime, BP 70, 29280 Plouzané, France
2 Université de Bordeaux, GREThA, UMR CNRS 5113, avenue Léon Duguit, 33608 Pessac, France
3 Université de Brest, UEB, UMR AMURE, 12 rue de Kergoat, CS 93837, 29238 Brest Cedex 3, France
4 INRA, Centre de recherche Angers-Nantes, Unité LERECO, Rue de la Géraudière, BP 71627, 44316
Nantes Cedex 3, France 5 FISH PASS, 3 rue des Grands Champs, Z.A. des 3 Prés, 35890 Laillé, France
6 ONIRIS-NANTES, LARGECIA, BP 82225, 44322 Nantes Cedex 3, France
* Corresponding author : Gabrielle Lesur-Irichabeau, email address : [email protected]
Abstract : The aim of this article is to explore, through a hedonic approach, the factors that might explain the price variability for the French-managed fishery of scallop at primary fish markets. In addition to factors classically identified in the current literature like intrinsic product characteristics or markets situation, the characteristics of operators are tested. The relationships of loyalty between sellers and buyers, and market assiduity are notably considered.
Keywords : Buyer and seller characteristics, fisheries management, hedonic price, market behaviour, market structure, scallop, Q21, Q22, Q28, C10, L11
Analysis of French scallop price formation
3
I. INTRODUCTION
French market of Scallop (Pecten maximus) is a particular market in the sense that
the supply is regulated by management systems that are designed to ensure the
sustainability of the resource and therefore associated economic activity. These
management systems have implications on market structure as much on supply as on
demand with consequences on the price formation mechanisms in both the short and
long term. (BjØrndal et al., 1992; McCay et al., 1995; Matulich et al., 1996;
Helstad et al., 2005). These management systems impose production conditions
making the products landed in a management area relatively homogeneous in
appearance. This relative product homogeneity due to a production under the same
conditions is however not translated into price homogeneity. This implies that more
attention is needed to devote to other factors than the quality attributes of fish or
market conditions in analysis of prices; in particular, it is needed to consider the
characteristics of operators, their market behaviour and interpersonal relationships.
Many studies have set out to examine price formation mechanisms for sea products.
Some have concentrated on estimating inverse demand functions (Barten and
Bettendorf, 1989; Eales and Unnevehr, 1994; Matsuda, 2007) enabling estimation of
how sensitive the relationship between price and quantities landed really is. Others
have focused on showing the influence of various brands or ecolabels (Roheim et al.,
2007; Roheim et al., 2011; Sogn-Grundvag et al., 2014), gear types (McConnell and
Strand, 2000; Asche and Guillen, 2012; Sogn-Grundvag et al., 2013, 2014),
geographical origins (Asche and Guillen, 2012; Guillen and Maynou, 2014) or other
attributes of the fish such as size, weight, presentation, or even colour (Gates 1974;
McConnell and Strand, 2000; Carroll et al., 2001; Asche and Guttormsen, 2001;
Alfnes et al., 2006; Smith and Gopalakrishnan, 2010; Zimmermann and Heino, 2013;
Analysis of French scallop price formation
4
Dey et al., 2014; Sogn-Grundvag et al., 2014). Helstad et al. (2005) have chosen an
approach that closely scrutinises the links between selling methods (auction or direct
sales) and price. Others have focused on how the relationships between buyers and
sellers have impacted prices (Kirman and Vriend, 2000; Gallegati et al., 2011;
Vignes and Etienne, 2011; Cirillo et al., 2012; Fluvià et al., 2012) but this type of
effect has never been included in hedonic models.
The scallop (Pecten maximus) fishery is one of the largest fisheries in France
(Meunier et al., 2013). Existing management systems are based mainly on regulation
of inputs, and are characterised by the granting of fishing licenses (numerus
clausus), limitations on fishing effort, and a calendar governing the duration of the
fishing season (Fifas et al., 2003; Alban and Boncoeur, 2008; OCDE, 2012). The
scallop is a sedentary species, with stocks distributed throughout the English
Channel. The fishery is made up accordingly of several sub-fisheries with differing
management practices to take into account the particular ecological, biological and
socio-economic characteristics encountered in each area (Fifas et al., 2003; Guyader
et al., 2004; Binet, 2010; Guyader et al., 2013). These characteristics favour a
relatively heterogeneous range of products landed in the various auction halls around
the English Channel, with as many sub-markets as there are management system
zones and relatively homogeneous products within the same sub-market.
The licensing system implies that fishers have very few opportunities to operate in
different management areas (Arzel et al., 2005; Alban and Boncoeur, 2008). As a
consequence most of the fishers tend to limit their fishing operation in only one
management area. Inertia does not only concern fishers but also, to a certain extent,
the buyers on primary fish markets. The latter rarely vary their sourcing and supply
sites (Lesur-Irichabeau et al., 2014) despite the opening up of opportunities to buy on
Analysis of French scallop price formation
5
the various sub-markets thanks to the computerisation of auction halls and the
introduction of remote buying systems (Guillotreau et al., 2006).
The objective of this article is to use a hedonic approach to explore those factors that
are likely to explain the variability of the price of the scallop in a same management
area, while giving equal consideration to characteristics such as the market, the
products, their substitutability as a function of their origin, modalities and
characteristics of the transactions. Particular attention is given to the influence of
characteristics of the operators and their relationships at primary markets. Because
we only study the transactions on the primary market, we assume that buyers are
intermediaries acting in accordance with their knowledge of willingness to pay for
the next buyers, whether intermediate or final consumers, given scallop
characteristics.
II. FRENCH SCALLOP FISHERIES
The scallop (Pecten maximus) is the leading species landed in France (15.8 thousand
tons) and ranks fourth in terms of value (€ 37.6 million) in 2012. The 8 main fishing
zones – referred to below as ‘management areas’ (MA) – are located in the French
territorial waters, with the Saint Brieuc Bay (MA_3) and the Bay of the Seine
(MA_6) accounting for 37% and 28% respectively of the total production in the
English Channel (Fig. 1)1. The various sub-markets considered correspond to the
different management areas. Prices differ from one management area to another, with
a minimum average annual price of 2.1 €/kg in MA_3 and a maximum of 3.9 €/kg in
MA_1.
1 The other French fishing grounds located in the Bay of Biscay represent less than 4% of the French
production figure and are not considered in this study.

Analysis of French scallop price formation
6
Source: Authors based on the map of French Scallop Fisheries (http://aquaculture-
aquablog.blogspot.fr) and IFREMER-SIH data.
Note: Data in brackets indicate the tonnage of scallops produced in each
management area (MA) in 2012.
Fig. 1. Scallop management areas and primary fish markets locations
As each zone is managed independently of the others (Fifas et al. 2003), the
structures of the fleets are heterogeneous. As the table 1 shows, the vessel length and
engine power almost consistently increase from West to East across the Channel,
with a minimum of 9.4 m (87 kW) in zone MA_1 and a maximum of 16.7 m (312
kW) in zone MA_8. As the number of authorised fishing days is also defined by the
individual management system, each sub-market differs in terms of the number of
days of activity (days with transactions) with a more sustained activity in the East
than in the West.
Cherbourg
Saint-Quay-
PortrieuxSaint-Malo
Port-en-Bessin
RoscoffLoguivy de la mer
Granville
Grandcamp
Fécamp
Erquy
Dunkerque
Dieppe
Brest
Boulogne-sur-Mer
VIIe
VIId
IVc
VIIIa
MA_1
(156 T)
MA_2
(172 T)
MA_3
(5534 T)
MA_4
(1191 T)
MA_5
(847 T)
MA_6
(4202 T)
MA_7
(2175 T)
MA_8
(691 T)
Primary fish markets
Scallop management areas

Analysis of French scallop price formation
7
The number of buyers2 in primary fish market halls is relatively homogeneous
between fishing grounds. As indicated in Table 1, the majority of fishing grounds are
characterized by a predominance of fishmongers which are intermediary operators.
They are key operators to the extent that they supply purchasing services for the
major national retailers. These central purchasing services are responsible for
centralizing purchasing operations so they can be subsequently redistributed over the
national territory. Whatever the fishing ground, part of the production figure is
bought by retail operators, mainly fish merchants, for resale to the end consumer.
Some buyers may, in certain instances, be import and/or export operators.
Table 1. Management areas characteristics in 2012
MA_1 MA_2 MA_3 MA_4 MA_5 MA_6 MA_7 MA_8
Annual production (Tons) 156 172 5534 1191 847 4200 2180 691
Average price (€/kg) 3.9 2.7 2.1 2.2 2.3 2.4 2.5 2.9
Number of sellers3 63 18 199 38 27 126 64 26
Vessels length (Average) 9 12 11 12 14 14 16 17
Vessels engine power (Average) 87 143 132 157 215 225 260 310
Nb of days with transactions 87 61 133 135 145 154 164 149
Nb of buyers 44 54 191 19 56 70 59 69
Ty
pe
of
buy
ers
Fishmongers Nb. (%) 64.1 69.2 43.5 57.9 45.3 53.0 40.7 45.6
% an. vol 76.6 66.5 54.3 45.2 46.6 68.3 74.4 62.5
Fish merchants Nb. (%) 25.6 9.6 43.5 21.1 37.7 34.8 39.0 45.6
% an. vol 6.9 12.0 5.2 16.6 27.5 10.5 7.4 20.4
Processors Nb. (%) 2.6 11.5 4.3 - 9.4 6.1 8.5 4.4
% an. vol 0.4 5.3 40.0 - 23.6 16.3 14.0 8.8
Other Nb. (%) 2.6 3.8 2.2 15.8 3.8 3.0 5.1 4.4
% an. vol 14.1 3.9 0.0 35.3 0.9 0.3 3.7 8.3
Supermarkets Nb. (%) 2.6 5.8 6.5 5.3 - - 6.8 -
% an. vol 0.7 12.3 0.4 2.9 - - 0.5 -
Non specialized
wholesalers
Nb. (%) 2.6 - - - 3.8 3.0 - -
% an. vol 1.2 - - - 1.5 4.7 - -
2 The number of buyers in the management area 3 is relatively large compared to other management
areas due to the obligation for fishers to sell their entire production at auction hall. Fishers have to buy
their own production if they want to sell it themselves. 3 We refer also to the vessel or to the fisher to designate ‘seller’.
Analysis of French scallop price formation
8
All buyers at the primary fish market are intermediaries but not in the same way.
Fish merchants are, for example, intermediaries between fisher and the end
consumer. Their marketing zone is, usually at any rate, in the vicinity of the fishing
grounds themselves, in the framework of short circuits. Fish mongers are larger scale
operators, notably with an intermediary role for central purchasing services and
supermarkets distribution networks when the latter are not themselves buyers in the
primary fish market. Processors only transform the product, mainly into for scallop
frozen meat.
III. METHOD AND DATA
Hedonic price function and marginal effects
A hedonic price function is estimated for each of the eight management areas under
consideration. The functional form selected differs depending on the fishing ground,
but the general form is the following:
εφδβα ++++= ZXXY 'lnln (1)
where X and 'X are continuous variables which, depending on the model, are in
logarithmic or normal format and Z, are the dummy variables. Each model is
estimated using the same set of explanatory variables. From estimated coefficients, it
will be possible to calculate the marginal effects that enable us to quantify the
sensitivity of the price to a variation in a component of the latter. The calculation of
these marginal effects differs according to the nature of the explanatory variables.
Table 2 below describes the rules for interpreting by type of variable.

Analysis of French scallop price formation
9
Table 2. Interpretation rules for estimated coefficients (Terra, 2005)
Type Calculation Interpretation
Log kβ̂
A 1% increase in the explanatory variable corresponds to an
increase of kβ̂ % of the sale price per kilo
Norm 100ˆ ×kβ A one-unit increase in the explanatory variable corresponds to a
variation of kβ̂100× % of the sale price per kilo
Dum ( )1100ˆ−= keg
β
The percentage impact of modality taking the value 1 of the
explanatory variable on the sale price per kilo is equal to g
Data
The database used includes 32,166 market transactions for scallops in the year 2012,
extracted from sales data. The sales data deliver information about sales of fishery
products, mainly in the fish auction halls. They are recorded by the Inter-Auction
Network (RIC)4, managed by France Agrimer for the account of the Direction des
Pêches Maritimes et de l’Aquaculture (DPMA) and are made available to Ifremer’s
Fishing Information System (SIH)5.
The flow of information from the RIC allows us to obtain a detailed description of
the sales concluded at auction: identification of the vessel, the date and the type of
sale, description by commercial species (status, presentation, commercial category,
quantity and total amount of the sale) and buyer identification. The flow of
information from the RIC is completed by the information on the vessels available in
SIH database containing details of fishing vessel activity and in the Community
4 According to Commission Regulation (EC) No 1077/2008 of 3 November 2008 laying down
detailed rules for the implementation of Council Regulation (EC) No 1966/2006 on electronic
recording and reporting of fishing activities and on means of remote sensing and repealing Regulation
(EC) No 1566/2007. 5 http://sih.ifremer.fr/
Analysis of French scallop price formation
10
fishing fleet Register6. The Register of Commerce and Companies
7 provides detailed
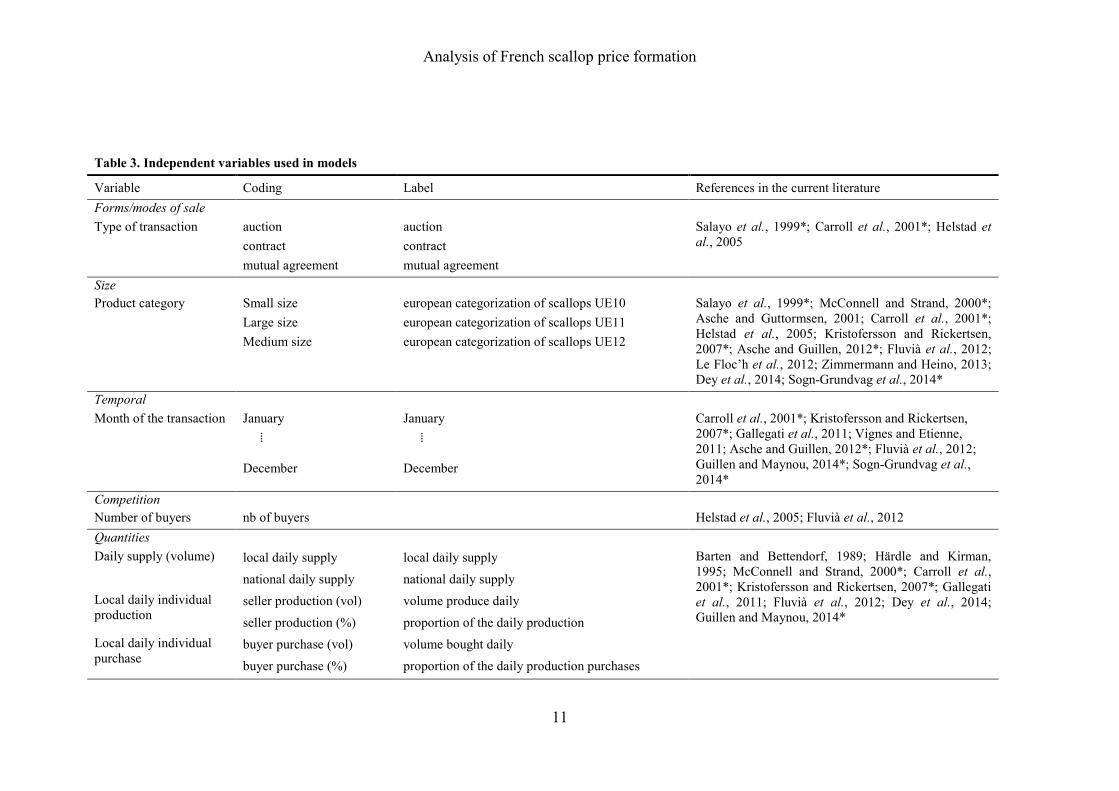
information about buyers. The variables used in the models (Table 3) are taken from
these different information sources. The descriptive statistics concerning the
variables used in each of the models featuring in the appendix. In this table are also
given references from the current literature considering the same types of variables in
the study of mechanisms of price formation in the case of seafood products.
The dependent variable (price per unit) corresponds to the price per unit of scallops
at which a batch is exchanged between a seller and a buyer at a defined date and in a
given location (Management Area)8. A batch corresponds in this way to the object of
any given transaction. To each batch corresponds one type of transaction
(auction/contract/mutual agreement) and one size of scallop (small size/medium
size/large size).
The months of the year (January to December) are tested to the extent that previous
studies mention that there exists a certain seasonality in consumption habits for this
product independently of the seasonality of production (Abso Conseil, 2010). In
order to take market conditions into account, daily production at local and national
scales (local daily supply and national daily supply) and the number of buyers (nb of
buyers) are included in the analysis. Seller production (vol/%) and buyer purchase
(vol/%) represent the scallop daily market shares of the different operators expressed
either as a quantity, or as a percentage.
6 http://ec.europa.eu/fisheries/fleet/
7 https://www.infogreffe.fr/societes/
8 A previous study (Foucher, et al., 2015) showed that there is as many markets as management areas.
This explains why we perform a model for each management area. The potential interdependence of
markets however taken into account through the variable "national daily supply". A consequence of
the existence of eight markets is that explanatory variables of price are not the same for all models.
Analysis of French scallop price formation
11
Table 3. Independent variables used in models
Variable Coding Label References in the current literature
Forms/modes of sale
Type of transaction auction auction Salayo et al., 1999*; Carroll et al., 2001*; Helstad et
al., 2005 contract contract
mutual agreement mutual agreement
Size
Product category Small size european categorization of scallops UE10 Salayo et al., 1999*; McConnell and Strand, 2000*;
Asche and Guttormsen, 2001; Carroll et al., 2001*;
Helstad et al., 2005; Kristofersson and Rickertsen,
2007*; Asche and Guillen, 2012*; Fluvià et al., 2012;
Le Floc’h et al., 2012; Zimmermann and Heino, 2013;
Dey et al., 2014; Sogn-Grundvag et al., 2014*
Large size european categorization of scallops UE11
Medium size european categorization of scallops UE12
Temporal
Month of the transaction January January Carroll et al., 2001*; Kristofersson and Rickertsen,
2007*; Gallegati et al., 2011; Vignes and Etienne,
2011; Asche and Guillen, 2012*; Fluvià et al., 2012;
Guillen and Maynou, 2014*; Sogn-Grundvag et al.,
2014*
⁞ ⁞
December December
Competition
Number of buyers nb of buyers Helstad et al., 2005; Fluvià et al., 2012
Quantities
Daily supply (volume) local daily supply local daily supply Barten and Bettendorf, 1989; Härdle and Kirman,
1995; McConnell and Strand, 2000*; Carroll et al.,
2001*; Kristofersson and Rickertsen, 2007*; Gallegati
et al., 2011; Fluvià et al., 2012; Dey et al., 2014;
Guillen and Maynou, 2014*
national daily supply national daily supply
Local daily individual
production seller production (vol) volume produce daily
seller production (%) proportion of the daily production
Local daily individual
purchase buyer purchase (vol) volume bought daily
buyer purchase (%) proportion of the daily production purchases

Analysis of French scallop price formation
12
Table 3. (Continued)
Variable Coding Label References
Size of production units
Vessels length vessel length length of vessel in meters Le Floc’h et al., 2012
Characteristics of operators
Dependence to scallop seller dependence (year) seller annual rate of dependence to scallop Salayo et al., 1999*; Carroll et al., 2001*; Asche et al.,
2002; Vignes and Etienne, 2011; Sogn-Grundvag et
al., 2013* seller dependence (month) seller monthly rate of dependence to scallop
buyer dependence (year) buyer annual rate of dependence to scallop
buyer dependence (month) buyer monthly rate of dependence to scallop
Type of buyers buyer type: other other type of buyer
buyer type: wholesaler wholesaler
buyer type: supermarket supermarket
buyer type: fish merchant fish merchant
buyer type: fisher fisher
buyer type: fishmonger fishmonger
buyer type: transformer processor
buyer importer scallop importer
buyer exporter scallop exporter
Diligence rate diligence rate (S) seller diligence rate
diligence rate (B) buyer diligence rate
Loyalty
Relationships between
operators seller loyalty rate (lot) seller loyalty rate based on number of transactions Kirman and Vriend, 2000; Gallegati et al., 2011;
Vignes and Etienne, 2011; Cirillo et al., 2012; Fluvià
et al., 2012 seller loyalty rate (vol) seller loyalty rate based on volume exchange
buyer loyalty rate (lot) buyer loyalty rate based on number of transactions
buyer loyalty rate (vol) buyer loyalty rate based on volume exchange
Note: ‘S’ or ‘B’ indicate variable concerning respectively sellers or buyers.
* Articles using a hedonic price modelling
Analysis of French scallop price formation
13
The economic dependence of operators (seller dependence (year/ month), buyer
dependence (year/month)) is here measured by the proportion of scallop in the total
turnover figure for sales (purchases) of fishing firms (buyers), considering either the
monthly or annual scale.
The variables seller loyalty rate (lot), buyer loyalty rate (lot) correspond to the
number of transactions concluded between a seller (buyer) and a buyer (seller), as
compared with the total number of transactions concluded by the seller (buyer) over
the period studied independently of the quantities exchanged. The variables seller
loyalty rate (vol), buyer loyalty rate (vol) are calculated according to the same
principle, this time integrating the quantities exchanged independently of the number
of transactions. Finally, operator assiduity is introduced via the presence rate
(diligence rate (S/B)). This rate expresses the ratio between the number of days
where the buyer (seller) has been active in the primary fish market, and the total
number of days of sale of scallops in this same primary fish market.
The position of the buyer on the international scallop market (buyer importer and
buyer exporter) and the type of activity involved (buyer type: fish merchant, buyer
type: fishmonger, etc.) are also considered as possible factors in explaining
variability in the price of scallops.
IV. RESULTS
Market conditions
Among the sources of variability of scallop prices in a given management area
explored, the sensitivity due to the relationship between prices and quantities (local
and national supply) was considered. For the markets under consideration, the
pertinent relationship is given by an inverse demand curve, the quantity of scallops
Analysis of French scallop price formation
14
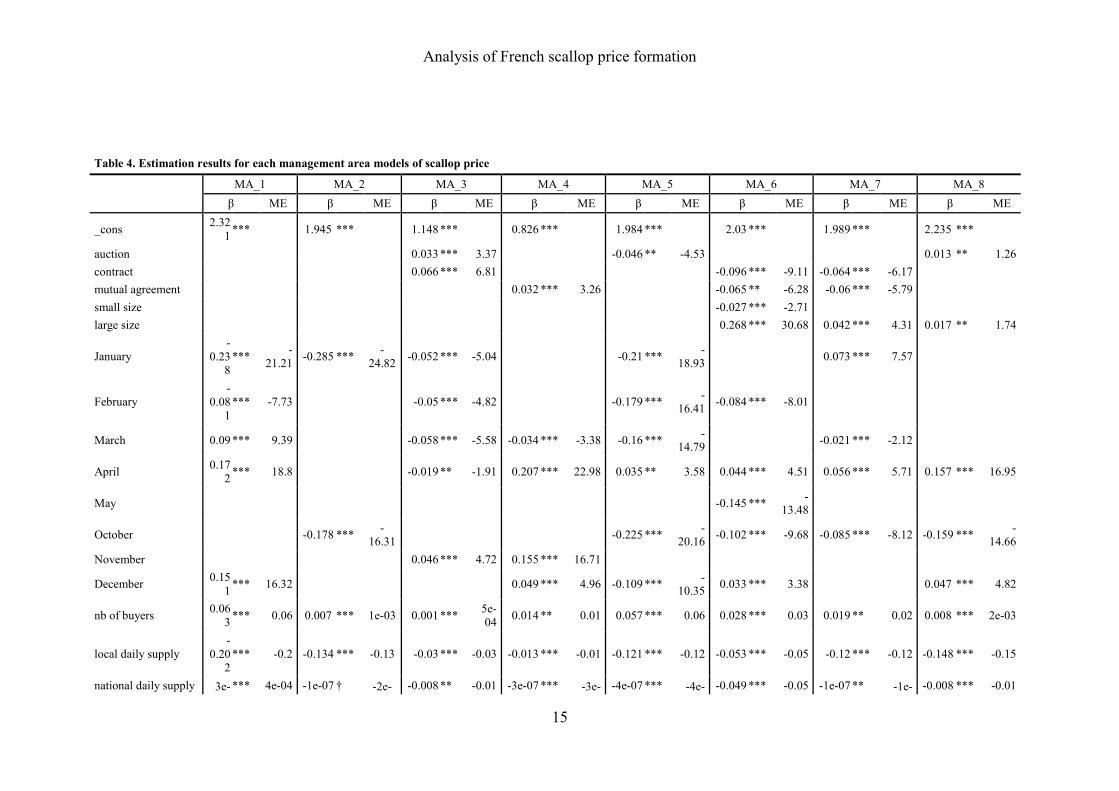
landed locally each day (local daily supply) being strongly constrained by the
specific system of regulation to each zone. The results are significant for all zones
with negative price-quantity flexibility coefficients. These coefficients are relatively
weak (-0.03 and -0.05) for the two main production zones MA_3 and MA_6 (Tables
4(a) to 4(h)). For the other zones, the higher the estimated coefficient, the lower the
production level.
Even though the products sourced by the different fishing grounds are
heterogeneous, the significance of the variable national daily supply for all
management areas indicates that there is a certain substitutability between products
sourced from different management areas. However, the degree of interaction is
relatively high for both the main production zones and in particular for zone MA_6.
This is much lower, and up to 450 times lower for the other production zones. This
leads us to believe that while a certain integration of markets does exist, it is only
partial.
The results also show that the higher the number of buyers (nb of buyers) in each
market place, the higher the prices will be. This expected effect of the number of
buyers on the conditions of competition and price formation is meanwhile specific to
each zone. This differentiated effect depending on the zone is, at this stage, difficult
to explain.
Analysis of French scallop price formation
15
Table 4. Estimation results for each management area models of scallop price
MA_1 MA_2 MA_3 MA_4 MA_5 MA_6 MA_7 MA_8
β ME β ME β ME β ME β ME β ME β ME β ME
_cons 2.32
1 ***
1.945 ***
1.148 ***
0.826 ***
1.984 ***
2.03 ***
1.989 ***
2.235 ***
auction
0.033 *** 3.37
-0.046 ** -4.53
0.013 ** 1.26
contract
0.066 *** 6.81
-0.096 *** -9.11 -0.064 *** -6.17
mutual agreement
0.032 *** 3.26
-0.065 ** -6.28 -0.06 *** -5.79
small size
-0.027 *** -2.71
large size
0.268 *** 30.68 0.042 *** 4.31 0.017 ** 1.74
January
-
0.238
*** -
21.21 -0.285 ***
-
24.82 -0.052 *** -5.04
-0.21 *** -
18.93
0.073 *** 7.57
February
-
0.081
*** -7.73
-0.05 *** -4.82
-0.179 *** -
16.41 -0.084 *** -8.01
March 0.09 *** 9.39
-0.058 *** -5.58 -0.034 *** -3.38 -0.16 *** -
14.79
-0.021 *** -2.12
April 0.17
2 *** 18.8
-0.019 ** -1.91 0.207 *** 22.98 0.035 ** 3.58 0.044 *** 4.51 0.056 *** 5.71 0.157 *** 16.95
May
-0.145 *** -
13.48
October
-0.178 *** -
16.31
-0.225 *** -
20.16 -0.102 *** -9.68 -0.085 *** -8.12 -0.159 ***
-
14.66
November
0.046 *** 4.72 0.155 *** 16.71
December 0.15
1 *** 16.32
0.049 *** 4.96 -0.109 *** -
10.35 0.033 *** 3.38
0.047 *** 4.82
nb of buyers 0.06
3 *** 0.06 0.007 *** 1e-03 0.001 ***
5e-
04 0.014 ** 0.01 0.057 *** 0.06 0.028 *** 0.03 0.019 ** 0.02 0.008 *** 2e-03
local daily supply
-
0.202
*** -0.2 -0.134 *** -0.13 -0.03 *** -0.03 -0.013 *** -0.01 -0.121 *** -0.12 -0.053 *** -0.05 -0.12 *** -0.12 -0.148 *** -0.15
national daily supply 3e- *** 4e-04 -1e-07 † -2e- -0.008 ** -0.01 -3e-07 *** -3e- -4e-07 *** -4e- -0.049 *** -0.05 -1e-07 ** -1e- -0.008 *** -0.01
Analysis of French scallop price formation
16
07 04 04 04 04
seller production
0.005 * 5e-
03
-0.027 *** -0.03
-0.023 *** -0.02 0.008 * 0.01
buyer purchase
-
0.00
4
*** -7e-
04 -0.024 ** -0.02
0.001 *** 1e-04 -0.028 *** -0.03 -0.011 *** -0.01 -0.01 ** -0.01 -0.017 *** -0.02
vessel length 0.07
9 * 0.08 0.061 * 0.06 0.011 † 0.01
0.006 ** 8e-04
0.042 * 0.04 0.058 *** 0.06
seller dependence
-3e-04 * -2e-
04 -0.024 * -0.02
-0.026 ** -0.03
buyer dependence
0.007 * 0.01 -0.009 * -0.01 2e-04 * 1e-04 0.001 *** 2e-04 0.011 *** 0.01 -0.012 ** -0.01
buyer type: other
-
0.15
4
*** -
14.25
buyer type:
wholesaler
0.028 ** 2.84
buyer type:
supermarket
-0.033 ** -3.26
buyer type: fish
merchant
-0.027 *** -2.65
-0.049 *** -4.74
-0.034 *** -3.36
buyer type: fisher 0.02
6 † 2.6
-0.035 ** -3.48
buyer type:
fishmonger
-0.03 *** -2.95
-0.011 * -1.13

Analysis of French scallop price formation
17
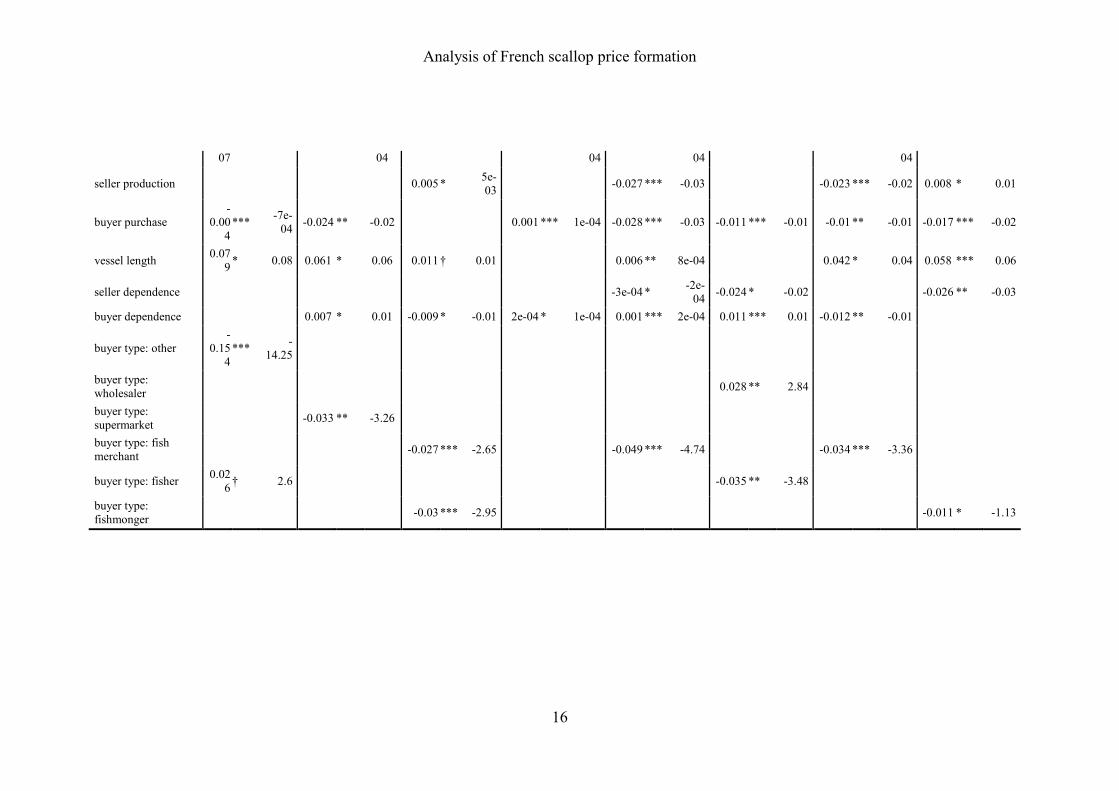
Table 4. (Continued)
MA_1 MA_2 MA_3 MA_4 MA_5 MA_6 MA_7 MA_8
β ME β ME β ME β ME β ME β ME β ME β ME
buyer type: transformer
-0.055 *** -5.36
-0.042 *** -4.15
buyer importer
-0.014 ** -1.39
-0.02 ** -1.94
-0.07 *** -6.74 -0.03 *** -2.92
buyer exporter 0.042 *** 4.28
-0.014 ** -1.39
0.034 *** 3.45
0.018 ** 1.79
diligence rate (S) 0.073 *** 0.07
4e-04 *** 2e-04 0.002 *** 6e-04 0.008 * 0.01 0.022 *** 0.02
diligence rate (B)
-2e-04 * -7e-05
0.001 *** 2e-04
seller loyalty rate 0.023 *** 0.02 0.003 ** 2e-04 -0.007 *** -0.01 0.009 *** 0.01 0.004 *** 3e-04 0.004 * 4e-03 0.025 *** 0.03 -0.002 ** -8e-05
buyer loyalty rate -0.013 ** -0.01
-0.003 ** -3e-03 -0.017 *** -0.02 -0.009 ** -0.01
-0.016 *** -0.02
Observations 2040 1200 6718 1939 4052 8415 4196 3606
R² 0.6334 0.4094 0.3501 0.4665 0.4455 0.4458 0.3808 0.5172
Notes: ME: marginal effect. In the case of all continuous variables, marginal effects are indicated for a 1% change in the level of the variable concerned.
Significance levels: † p<0.1 * p<0.05 ** p<0.01 *** p<0.001
Analysis of French scallop price formation
18
Relationships and behaviour of operators
Interpersonal relationships (the effects of loyalty) were characterised while
considering either the number of transactions concluded, or the quantities exchanged
between buyers and sellers (seller loyalty rate (lot/vol), buyer loyalty rate (lot/vol)).
The results show overall that the larger the volumes exchanged with particular
sellers, the lower the prices concluded for those transactions. The same type of effect
exists for sellers, but only in certain zones. When we consider loyalty in terms of the
frequency of transactions, the results show that the more sellers remain loyal to
particular buyers, the higher are the prices. This type of effect is almost non-existent
for buyers. When we compare the overall marginal effects of loyalty rates in the
different production grounds we observe greater sensitivity of prices to the frequency
of transactions between a seller and the same buyer for the scallop stocks in
management areas MA_1, 2, 6, 7. For the other scallop stocks, there is greater
sensitivity to the quantities exchanged between one buyer and a single seller.
To these effects of loyalty seem to be added the effects of assiduity, as defined by the
frequency with which operators are present in the different management areas
(diligence rate (S/B)). The effects concern sellers to a greater extent than buyers. For
the latter, only two zones are concerned with the different effects that do not allow us
to draw clear conclusions on the impact of this variable on prices. Conversely, in the
case of sellers, the effect is positive for two thirds of the zones concerned, which
highlights the existence of a clear ‘assiduity gain’, or advantage. The more specific
the product range considered (scallop with coral or larger size), the higher this effect
seems to be.

Analysis of French scallop price formation
19
The results show also that there exists a negative relationship between the market
share of a buyer (buyer purchase (%)) in the management area and the transaction
price. This effect has a tendency to cancel itself out for the two main management
areas where production and the number of buyers are high. Finally, when several
types of transaction exist within each management area, we note that sale by auction
will give more added value to scallops than to other types of transaction (over the
counter sales, or contract). This is particularly true in the East of the Channel.
Characteristics of operators
Besides relationships between operators, different individual characteristics of
operators were tested. The economic dependence of sellers and buyers (seller
dependence rate (year/month), buyer dependence rate (year/month)) vis-à-vis
scallops is a variable of considerable interest since it allows us to take into account
the opportunities and constraints of operators. The dependence of fishers influences
prices negatively only in the management areas furthest to the East, where in other
respects, over the counter sales concluded between buyers and sellers are the most
frequent. We can observe the opposite effect as regards buyers who, the more
dependent they are, appear globally more willing to buy the more expensive scallops.
Meanwhile, we may note certain exceptions in management areas MA_3 and 7. This
result may notably be explained by the presence of processing operators specialising
in scallops, and for whom the purchasing behaviours are different from other buyers.
Where these are significant, the effects of buyers status on prices are those as
expected. Globally, willingness to pay will be higher when the buyer is a direct
intermediary between the fisher and the end consumer. So, on average, and for a
same management area, the consent of the fish merchants is higher than that of the
Analysis of French scallop price formation
20
fishmongers, or that of the transformers, the fish merchants selling directly to the end
consumer. Conversely, among fishmongers who are just intermediaries for
wholesalers and central purchasing unit of supermarket chains, there is less
willingness to pay.
The integration of buyers in international trade, as measured by the fact of being an
importer (buyer importer) or exporter of scallops (buyer exporter), also has a
negative and positive influence on the purchase price respectively. This means that
willingness to pay of importer buyers (exporters) is relatively lower (relatively
higher) than it would be for non-importers (non-exporters). The negative effect is
explained quite easily since fresh scallops are imported at lower prices than market
prices in France (Abso Conseil, 2010). When it is significant, this effect tends to
strengthen in the East of the zone to the extent that a major proportion of imports
take place in these areas.
Consumers preferences
While systems of management influence the structure of demand, the latter is also
linked to consumer preferences. So parameter estimates concerning monthly effects
(January to December) confirm previous qualitative studies (Abso Conseil, 2010),
that note the existence of a degree of seasonality in consumption habits for this
product independent of the seasonality of production. The scallop has always been
considered a festive item, with consumption increasing during Catholic feast periods
(December and April for Christmas and Easter respectively) with positive effects on
prices. Other effects linked to the preferences of consumers are identified. In areas
where scallops are sorted into different classes based on size (Eastern Channel), there
Analysis of French scallop price formation
21
is a positive relationship between scallop size (small size/medium size/large size) and
the price.
This type of result is consistent with other studies, the larger-sized products being
often preferred by end consumers (Gates, 1974). Even while the effects linked to the
quality of the products9 are not significant, there can be a differentiation of products
within each management zone. In the case of the scallop, and biological marine
resources generally, the dynamic of the species relies on the nature of the exploited
habitats (Engel et al., 1999; Knudby et al., 2010). Even while it is not possible to
differentiate the various fishing zones within each management zone in detail, the
size of vessels (vessel length) can be used as a good proxy of the gradient of
exploitation (distance to the coast) to the extent that there is a good correlation
between this and the vessel size (Guyader et al., 2013). The significant and positive
(0.06-0.08) influence of vessel length on price for most of the management areas
seems to confirm the existence of scallops of different quality, better valorised on the
market and non-accessible to smaller fishing units.
V. DISCUSSION
The results obtained in our estimations are consistent with those of studies on price
formation mechanisms for fish at the primary fish market. So the intrinsic
characteristics of scallops such as size or quality, and consumer preferences explain
the variability of prices.
Price-quantity relationships (local daily supply, national daily supply) reveal the
existence of two value chain models. On the one hand, we find production zones
9 The product quality here refers to the appreciation criteria as defined by European regulation
(Council Regulation (EC) No 2406/96 of 26 November 1996 laying down common marketing
standards for certain fishery products).
Analysis of French scallop price formation
22
oriented towards local markets or niche markets with capacities for absorption that
are relatively limited; and on the other hand, there are two production zones more
destined to the national market, with a purchasing structure characterised by the
presence of transformers and fishmongers capable of absorbing variations in
production (MA_3 et MA_6).
Price-quantity relationships that are revealed also translate the differences of
perception on the part of buyers, depending on the position they occupy in the supply
side of the value chain relatively to the end consumer. As fish products from the two
main scallop stocks studied (mainly in the case of MA_3) are destined to supply the
sea food transformation sector, the inherent quality of the scallops are less a criterion
for purchasing on the primary fish market. For buyers in these zones, scallops are
perceived as being relatively homogeneous, and this makes them more sensitive to
variations in national production.
The different levels of price sensitivity with regard to the ‘loyalty effects’ we
considered, depending on the type of operator and the type of relationship, do not
seem to be linked to the size of the management areas, nor to the structure of the
market. However, as indicated earlier, as far as buyers are concerned, it is possible to
link loyalty effects with assiduity effects. These assiduity effects would then reflect
any effects of reputation that are always exacerbated in the case of products that are
more specific (scallop with coral, larger size, or scallop destined for the
transformation sector). In scallop stocks where buyers are looking for a particular
level of product quality, only the more assiduous sellers will be identifiably able to
guarantee buyers the quality they are seeking.
Operator characteristics are also be quite instructive to understand price formation
mechanisms for scallops. As the results show, the constraints borne by operators
Analysis of French scallop price formation
23
linked to their dependence, have a direct effect on price. So we conclude that the
more dependent sellers will agree to lower prices, and the more dependent buyers to
higher prices. Nonetheless, we should draw a distinction between this latter result in
the case of transformers. Because of their specialisation, they exhibit a dependence
on the scallop that is relatively high because their purchases of sea food concern
almost exclusively this species. The willingness to pay of this type of operator is
therefore not linked to their dependence vis-à-vis the scallop, but is linked to the
power of negotiation they have by dint of the volumes purchased.
This can be seen to be the more justifiable in proportion to the degree of
transformation the scallops are subject to before resale, engendering additional costs
in relation to buyers direct linked with the end consumer. This is confirmed,
moreover, by our results concerning buyer types. The latter show that prices can vary
depending on the level at which the buyer is situated in relation to the end consumer
(as a direct intermediary between fisher and end consumer, or as an intermediary
between fisher and another intermediary). As indicated earlier, for the transformers
that must shell and freeze the scallops before they are sold on to supermarket chains
or specialised distribution networks, the pressure exerted by downstream operators
can be very strong, explaining their relative lack of willingness to pay for the
scallops as compared with fish merchants. Following through, we have shown that
for all types of buyers who do not sell directly to the end consumer, the pressure
likely to be exerted downstream of the supply chain will ultimately translate into the
pressure on fishers that yields lower prices.
The low substitutability of scallops on the French markets, linked partly to scallop
quality that varies according to the characteristics of the scallop stocks, is also due in
fact to the scallop being a niche product outside the national territory. Generally
Analysis of French scallop price formation
24
speaking, the positive link established between the exporter status of the buyer, and
the price, could be interpreted as a kind of market tension on the offering expressed
as a certain buyer overbidding. This is not the case as regards the scallop. As regards
the latter, the effect can be explained above all by the fact that exported products
target specific markets where the prices negotiated are relatively high. Demand for
these market segments corresponds to niche products available only in certain zones
(MA_1, MA5 and MA_8).
VI. CONCLUSION
The various scallop fisheries in the Channel are managed differently to take into
account their ecological, biological or socio-economic characteristics. This
engenders a relatively heterogeneous range of products landed and sold on in the
different auction halls in the Channel, with as many sub-markets as there are
management zone-systems. However, the products landed are relatively
homogeneous within each management zone because they are produced under quite
similar conditions. Notwithstanding, there is no corresponding homogeneity among
the prices set for products that have the same identified characteristics.
These differences in price could be explained by the presence of characteristics that
are different from those usually highlighted in current literature on price
determinants for fish on primary markets. We have notably shown that operator
loyalty and assiduity effects also contribute to price formation mechanisms. Are
these effects specific to particular instances ? Can one show the existence of similar
effects in other fisheries that are regulated differently, or that have a less segmented
market ? In other respects, it is a question of knowing whether the relationships that
become established between two particular operators are linked to the characteristics

Analysis of French scallop price formation
25
of the fishery, or more to those of the operators. To answer these questions, we
would need to conduct a comparative study of different fisheries that included
analysis of both characteristics and behaviours of operators.
Analysis of French scallop price formation
26
REFERENCES
Abso Conseil (2010) Etude économique sur le marché de la coquille Saint Jacques et
des pectinidés en France et dans l’Union Européenne, FranceAgriMer, Paris.
Alban, F. and Boncoeur, J. (2008) Sea Ranching and Self‐Management in the Bay of
Brest (France): Technical Change and Institutional Adaptation of a Scallop
Fishery, in Case Studies in Fisheries Self-Governance, R. Townsend and R.
Shotton, (Eds.), FAO Fisheries Technical papers n°504, Rome, pp.41–52.
Alfnes, F., Guttormsen, A. G., Steine, G. and Kolstad K. (2006) Consumers’
willingness to pay for the color of salmon: a choice experiment with real
economic incentives, American Journal of Agricultural Economics, 88, 1050–61.
Arzel, P., Guyader, O. and Kervarec, F. (2005) Sea Ranching and Self‐Management
in the Bay of Brest (France): Technical Change and Institutional Adaptation of a
Scallop Fishery, Publications électroniques Amure, Working Papers Series D-04-
2005, 18 p.
Asche, F., Flaaten, O., Isaksen, J. R. and Vassdal, T. (2002) Derived demand and
relationships between prices at different levels in the value chain: a note, Journal
of Agricultural Economics, 53, 101–107.
Asche, F. and Guillen, J. (2012) The importance of fishing method, gear and origin:
the Spanish hake market, Marine Policy, 36, 365–369.
Asche, F. and Guttormsen, A. G. (2001) Patterns in the relative price for different
sizes of farmed fish, Marine Resource Economics, 16, 235–247.
Barten, A. P. and Bettendorf, L. J. (1989) Price formation of fish: an application of
an inverse demand system, European Economic Review, 33, 1506–25.

Analysis of French scallop price formation
27
Binet, T. (2010) Rebuilding the scallop fishery in St. Brieuc Bay, France, Rebuilding
Fisheries: The Way Forward, Background Report, OECD Publishing.
BjØrndal, T., Salvanes, K. G. and Andreassen, J. H. (1992) The demand for salmon
in France: the effects of marketing and structural change, Applied Economics, 24,
1027–34
Carroll, M., Anderson, J. L. and Martinez-Garmendia, J. (2001) Pricing U.S. North
Atlantic bluefin tuna and implications for management, Agribusiness, 17, 243–
254.
Cirillo, P., Tedeschi, G. and Gallegati, M. (2012) The Boulogne fish market: the
social structure and the role of loyalty, Applied Economics Letters, 19, 1075–79.
Dey, M. M., Rabbani, A. G., Singh, K. and Engle, C. R. (2014) Determinants of
retail price and sales volume of catfish products in the United States: an
application of retail scanner data, Aquaculture Economics & Management, 18,
120–148.
Eales, J. S and Unnevehr, L. J. (1994) The inverse almost ideal demand system,
European Economic Review, 38, 101–115.
Engel, D. W., Thayer, G. W. and Evans, D. W. (1999) Linkages between fishery
habitat quality, stressors, and fishery populations, Environmental Science and
Policy, 2, 465–475.
Fifas, S., Guyader, O. and Boucher, J. (2003) The Pecten fishery in the Bay of Saint-
Brieuc. Productivity and management, Rapp. Sci. Technol., Acad. Sci. Paris, No
17.
Fluvià, M., Garriga, A., Rigall-I-Torrent, R., Rodríguez-Carámbula, E. and Saló, A.
(2012) Buyer and seller behavior in fish markets organized as Dutch auctions:
Analysis of French scallop price formation
28
Evidence from a wholesale fish market in Southern Europe, Fisheries Research,
127–128, 18–25.
Foucher, E., Blanchard, M., Cugier, P., Desroy, N., Dreanno, C., Fauchot, J, Fifas,
S., Guyader, O., Jean, F., Le Gallic, B., Riou, P., Schapira, M. et Thiebaut, E.
(2015). Le projet ANR-COMANCHE 2010-STRA-010. Interactions
écosystémiques et impacts anthropiques dans les populations de COquilles Saint-
Jacques (Pecten maximus) de la MANCHE. Rapport scientifique final, 38 p.
Gallegati, M., Giulioni, G., Kirman, A. and Palestrini, A. (2011) What’s that got to
do with the price of fish? Buyers behavior on the Ancona fish market, Journal of
Economic Behavior and Organization, 80, 20–33.
Gates, J. M. (1974) Demand price, fish size and the price of fish, Canadian Journal
of Agricultural Economics/Revue Canadienne d’Agroéconomie, 22, 1–12.
Guillen, J. and Maynou, F. (2014) Importance of temporal and spatial factors in the
ex-vessel price formation for red shrimp and management implications, Marine
Policy, 47, 66–70.
Guillotreau, P. and Jiménez-Toribio, R. (2006) The impact of electronic clock
auction systems on shellfish prices: econometric evidence from a structural
change model, Journal of Agricultural Economics, 57, 523–546.
Gujarati, D. N. (2004). Econométrie. De Boeck, Ouvertures économiques, 1009 p.
Guyader, O., Berthou, P., Koutsikopoulos, C., Alban, F., Demaneche, S., Gaspar, M.
B., Eschbaum, R., Fahy, E., Tully, O., Reynal, L., Curtil, O., Frangoudes, K. and
Maynou, F. (2013) Small scale fisheries in Europe: A comparative analysis based
on a selection of case studies, Fisheries Research, 140, 1–13.

Analysis of French scallop price formation
29
Guyader, O., Daurès, F. and Fifas, S. (2004) A Bioeconomic analysis of the impact
of decommissioning programs: Application to a limited-entry French scallop
fishery, Marine Resource Economics, 19, 225–242.
Härdle, W. and Kirman, A. (1995) Nonclassical demand: A model-free examination
of price-quantity relations in the Marseille fish market, Journal of Econometrics,
67, 227–257.
Helstad, K., Vassdal, T., Trondsen, T. and Young, J. (2005) Price Links between
Auction and Direct Sales of Fresh and Frozen Fish in North Norway (1997–2003),
Marine Resource Economics, 20, 305–322.
Kirman, A. P. and Vriend, N. J. (2001) Evolving market structure: An ACE model of
price dispersion and loyalty, Journal of Economic Dynamics & Control, 25, 459–
502.
Knudby, A., Brenning, A. and LeDrew, E. (2010) New approaches to modelling fish-
habitat relationships, Ecological Modelling, 221, 503–511.
Kristofersson, D. and Rickertsen, K. (2004) Efficient estimation of hedonic inverse
input demand systems, American Journal of Agricultural Economics, 86, 1127–
37.
Le Floc’h, P., Matei, I. and Tuncel, M. (2012) Commercial sizes and prices on the
French monkfish fishery: a time-series analysis, Brussels Economic
Review/Cahiers Economiques de Bruxelles, 55, 97–115.
Lesur-Irichabeau, G., Guyader, O. and Frésard, M. (2014) Analyses des relations
entre pêcheurs et acheteurs de coquilles Saint-Jacques en criée : quelles
conséquences sur la structure du marché ?, Publications électroniques Amure,
Working Papers Series, Université de Bretagne Occidentale, in prep.
Analysis of French scallop price formation
30
Matsuda, T. (2007) Linearizing the inverse quadratic almost ideal demand system,
Applied Economics, 39, 391–396.
Matulich, S. C, Mittelhammer, R. C. and Reberte, C. (1996) Toward a more
complete model of individual transferable fishing quotas; implications of
incorporating the Process sector, Journal of Environmental Economics and
Management, 31, 112–128.
McCay, B. J, Creed, C. F., Finlayson, A. C., Apostle, R. and Mikalsen, K. (1995)
Individual transferable quotas (ITQs) in Canadian and Us Fisheries, Ocean and
Coastal Management, 28, 85–115.
McConnell, K. and Strand, I. E. (2000) Hedonic prices for fish: tuna prices in
Hawaii, American Journal of Agricultural Economics, 82, 133–144.
Meunier, M., Daurès, F. and Girard, S. (2013) Etat des lieux des secteurs pêche et
aquaculture et de la consommation des produits aquatiques. Approche nationale
(France) et régionale (Bretagne), Publications électroniques Amure, Série
Rapports R-32-2013, 41p.
OCDE (2012), Rebuilding Fisheries: The Way Forward, Editions OCDE, Paris.
Roheim, C. A., Asche, F. and Santos, J. I. (2011) The elusive price premium for
ecolabelled products: evidence from seafood in the UK market, Journal of
Agricultural Economics, 62, 655–668.
Roheim, C. A., Gardiner and L., Asche, F. (2007) Value of brands and other
attributes: hedonic analyses of retail frozen fish in the UK, Marine Resource
Economics, 22, 239–254.

Analysis of French scallop price formation
31
Salayo, N. D., Voon, T. J. P. and Selvanthan, S. (1999) Implicit price of Prawn and
Shrimp attributes in the Philippine domestic market, Marine Resource Economics,
14, 65–78.
Smith, M. D. and Gopalakrishnan, S. (2010) Combining property rights and landings
taxes to mitigate the ecological impact of fishing, in Proceedings of the Fifteenth
Biennial Conference of the International Institute of Fisheries Economics &
Trade, International Institute of Fisheries Economics & Trade, Corvallis, Oregon.
Sogn-Grundvag, G., Larsen, T. A. and Young, J. A. (2013) The value of line-caught
and other attributes: an exploration of price premiums for chilled fish in UK
supermarkets, Marine Policy, 38, 41–44.
Sogn-Grundvag, G., Larsen, T. A. and Young, J. A. (2014) Product differentiation
with credence attributes and private labels: the case of whitefish in UK
supermarkets, Journal of Agricultural Economics, 65, 368–382.
Terra, S. (2005) Guide des bonnes pratiques pour la mise en oeuvre de la méthode
des prix hédoniques, Ministère de l'Ecologie et du Développement Durable,
Direction des Etudes Economiques et de l'Evaluation Environnementale, Paris.
Vignes, A. and Etienne, J. M. (2011) Price formation on the Marseille fish market :
evidence from a network analysis, Journal of Economic Behavior and
Organization, 80, 50–67.
Zimmermann, F. and Heino, M. (2013) Is size-dependent pricing prevalent in
fisheries? The case of Norwegian demersal and pelagic fisheries, ICES J. Mar.
Sci. first published online August 24, 2013 doi:10.1093/icesjms/fst121.
Analysis of French scallop price formation
32
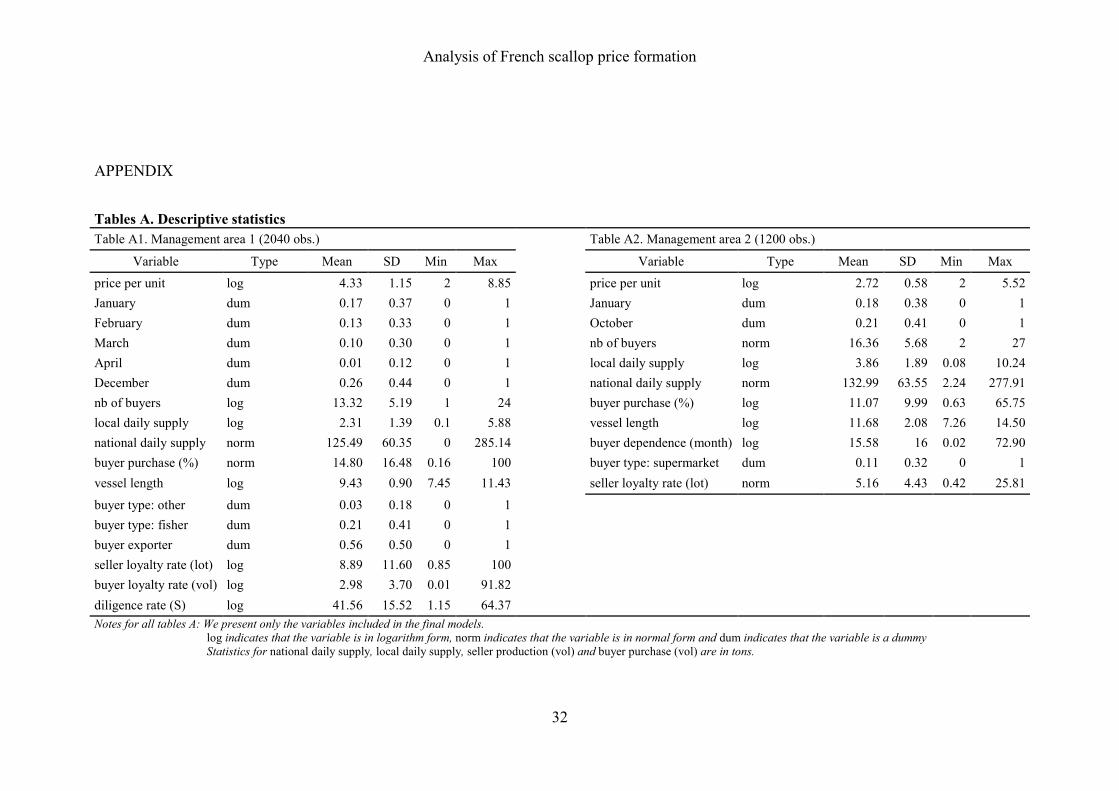
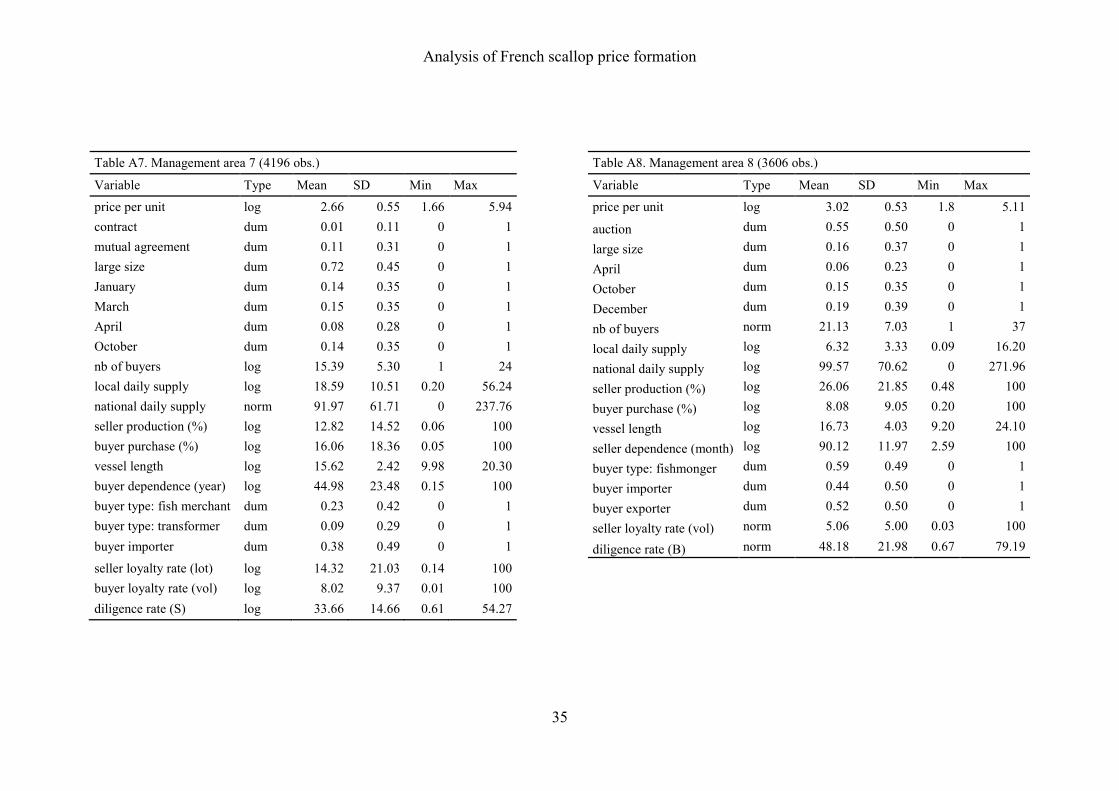
APPENDIX
Tables A. Descriptive statistics
Table A1. Management area 1 (2040 obs.)
Table A2. Management area 2 (1200 obs.)
Variable Type Mean SD Min Max
Variable Type Mean SD Min Max
price per unit log 4.33 1.15 2 8.85 price per unit log 2.72 0.58 2 5.52
January dum 0.17 0.37 0 1 January dum 0.18 0.38 0 1
February dum 0.13 0.33 0 1 October dum 0.21 0.41 0 1
March dum 0.10 0.30 0 1 nb of buyers norm 16.36 5.68 2 27
April dum 0.01 0.12 0 1 local daily supply log 3.86 1.89 0.08 10.24
December dum 0.26 0.44 0 1 national daily supply norm 132.99 63.55 2.24 277.91
nb of buyers log 13.32 5.19 1 24 buyer purchase (%) log 11.07 9.99 0.63 65.75
local daily supply log 2.31 1.39 0.1 5.88 vessel length log 11.68 2.08 7.26 14.50
national daily supply norm 125.49 60.35 0 285.14 buyer dependence (month) log 15.58 16 0.02 72.90
buyer purchase (%) norm 14.80 16.48 0.16 100 buyer type: supermarket dum 0.11 0.32 0 1
vessel length log 9.43 0.90 7.45 11.43 seller loyalty rate (lot) norm 5.16 4.43 0.42 25.81
buyer type: other dum 0.03 0.18 0 1
buyer type: fisher dum 0.21 0.41 0 1
buyer exporter dum 0.56 0.50 0 1
seller loyalty rate (lot) log 8.89 11.60 0.85 100
buyer loyalty rate (vol) log 2.98 3.70 0.01 91.82
diligence rate (S) log 41.56 15.52 1.15 64.37
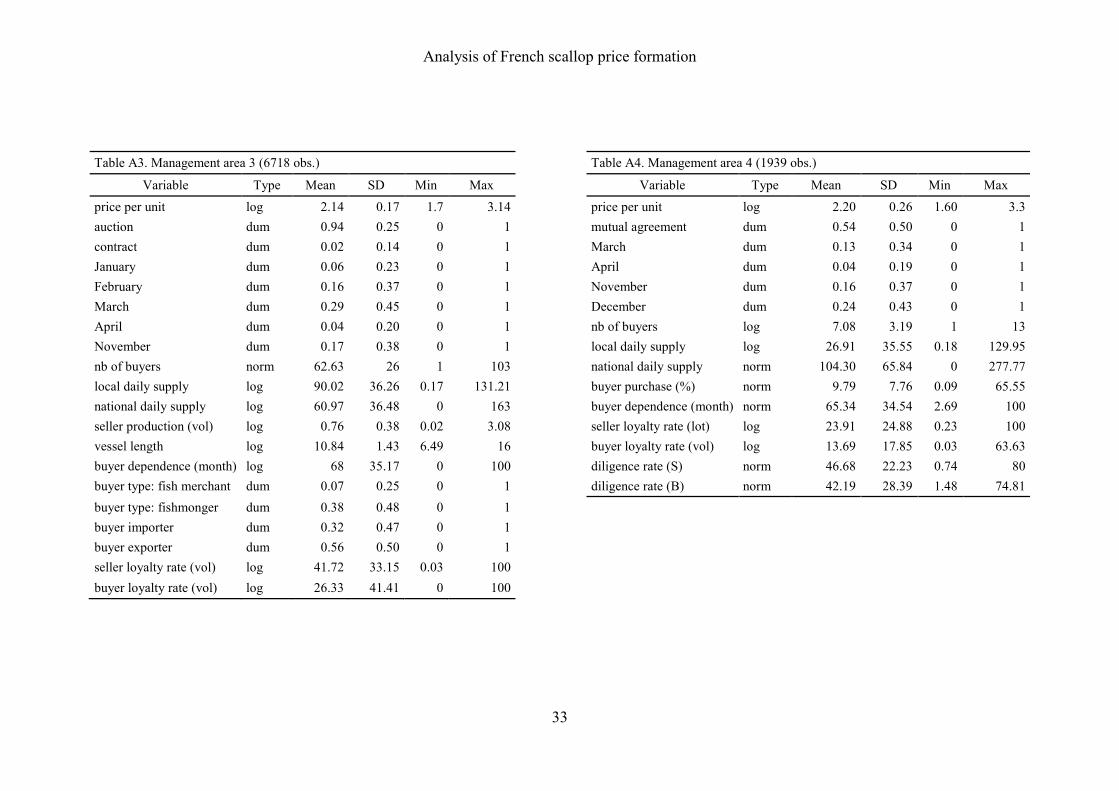
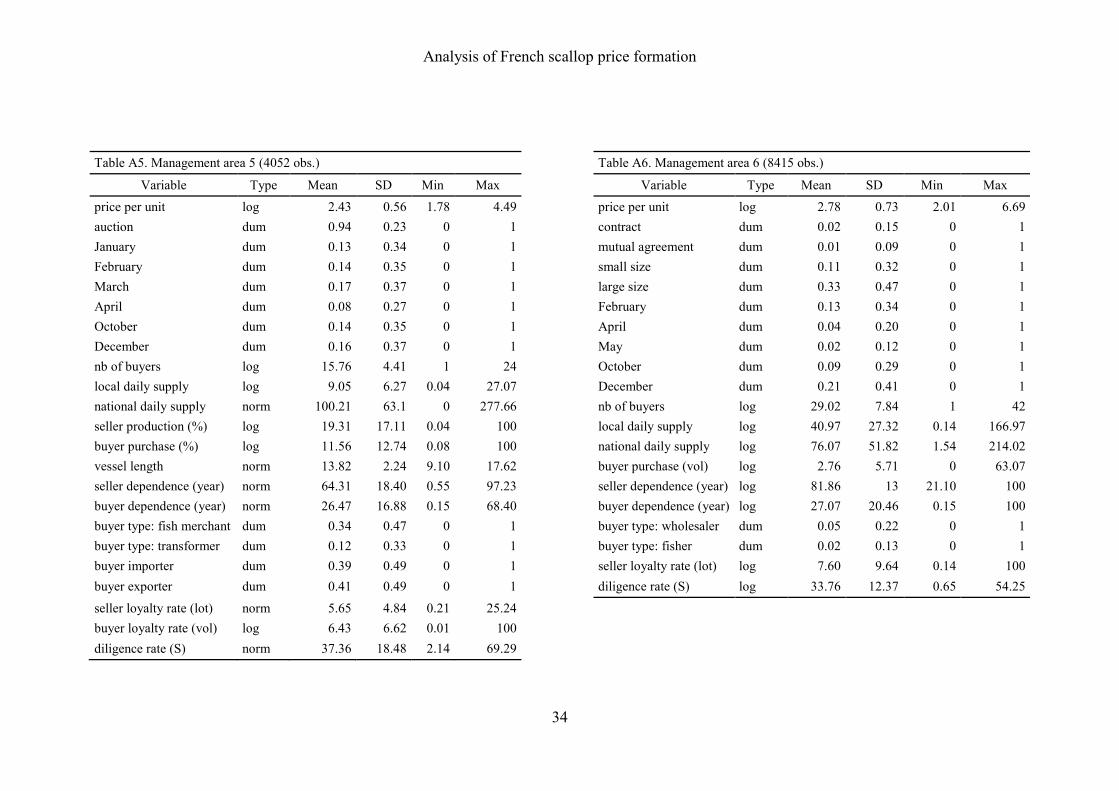
Notes for all tables A: We present only the variables included in the final models.
log indicates that the variable is in logarithm form, norm indicates that the variable is in normal form and dum indicates that the variable is a dummy
Statistics for national daily supply, local daily supply, seller production (vol) and buyer purchase (vol) are in tons.
Analysis of French scallop price formation
33
Table A3. Management area 3 (6718 obs.)
Table A4. Management area 4 (1939 obs.)
Variable Type Mean SD Min Max
Variable Type Mean SD Min Max
price per unit log 2.14 0.17 1.7 3.14 price per unit log 2.20 0.26 1.60 3.3
auction dum 0.94 0.25 0 1 mutual agreement dum 0.54 0.50 0 1
contract dum 0.02 0.14 0 1 March dum 0.13 0.34 0 1
January dum 0.06 0.23 0 1 April dum 0.04 0.19 0 1
February dum 0.16 0.37 0 1 November dum 0.16 0.37 0 1
March dum 0.29 0.45 0 1 December dum 0.24 0.43 0 1
April dum 0.04 0.20 0 1 nb of buyers log 7.08 3.19 1 13
November dum 0.17 0.38 0 1 local daily supply log 26.91 35.55 0.18 129.95
nb of buyers norm 62.63 26 1 103 national daily supply norm 104.30 65.84 0 277.77
local daily supply log 90.02 36.26 0.17 131.21 buyer purchase (%) norm 9.79 7.76 0.09 65.55
national daily supply log 60.97 36.48 0 163 buyer dependence (month) norm 65.34 34.54 2.69 100
seller production (vol) log 0.76 0.38 0.02 3.08 seller loyalty rate (lot) log 23.91 24.88 0.23 100
vessel length log 10.84 1.43 6.49 16 buyer loyalty rate (vol) log 13.69 17.85 0.03 63.63
buyer dependence (month) log 68 35.17 0 100 diligence rate (S) norm 46.68 22.23 0.74 80
buyer type: fish merchant dum 0.07 0.25 0 1 diligence rate (B) norm 42.19 28.39 1.48 74.81
buyer type: fishmonger dum 0.38 0.48 0 1
buyer importer dum 0.32 0.47 0 1
buyer exporter dum 0.56 0.50 0 1
seller loyalty rate (vol) log 41.72 33.15 0.03 100
buyer loyalty rate (vol) log 26.33 41.41 0 100
Analysis of French scallop price formation
34
Table A5. Management area 5 (4052 obs.)
Table A6. Management area 6 (8415 obs.)
Variable Type Mean SD Min Max
Variable Type Mean SD Min Max
price per unit log 2.43 0.56 1.78 4.49 price per unit log 2.78 0.73 2.01 6.69
auction dum 0.94 0.23 0 1 contract dum 0.02 0.15 0 1
January dum 0.13 0.34 0 1 mutual agreement dum 0.01 0.09 0 1
February dum 0.14 0.35 0 1 small size dum 0.11 0.32 0 1
March dum 0.17 0.37 0 1 large size dum 0.33 0.47 0 1
April dum 0.08 0.27 0 1 February dum 0.13 0.34 0 1
October dum 0.14 0.35 0 1 April dum 0.04 0.20 0 1
December dum 0.16 0.37 0 1 May dum 0.02 0.12 0 1
nb of buyers log 15.76 4.41 1 24 October dum 0.09 0.29 0 1
local daily supply log 9.05 6.27 0.04 27.07 December dum 0.21 0.41 0 1
national daily supply norm 100.21 63.1 0 277.66 nb of buyers log 29.02 7.84 1 42
seller production (%) log 19.31 17.11 0.04 100 local daily supply log 40.97 27.32 0.14 166.97
buyer purchase (%) log 11.56 12.74 0.08 100 national daily supply log 76.07 51.82 1.54 214.02
vessel length norm 13.82 2.24 9.10 17.62 buyer purchase (vol) log 2.76 5.71 0 63.07
seller dependence (year) norm 64.31 18.40 0.55 97.23 seller dependence (year) log 81.86 13 21.10 100
buyer dependence (year) norm 26.47 16.88 0.15 68.40 buyer dependence (year) log 27.07 20.46 0.15 100
buyer type: fish merchant dum 0.34 0.47 0 1 buyer type: wholesaler dum 0.05 0.22 0 1
buyer type: transformer dum 0.12 0.33 0 1 buyer type: fisher dum 0.02 0.13 0 1
buyer importer dum 0.39 0.49 0 1 seller loyalty rate (lot) log 7.60 9.64 0.14 100
buyer exporter dum 0.41 0.49 0 1 diligence rate (S) log 33.76 12.37 0.65 54.25
seller loyalty rate (lot) norm 5.65 4.84 0.21 25.24
buyer loyalty rate (vol) log 6.43 6.62 0.01 100
diligence rate (S) norm 37.36 18.48 2.14 69.29
Analysis of French scallop price formation
35
Table A7. Management area 7 (4196 obs.)
Table A8. Management area 8 (3606 obs.)
Variable Type Mean SD Min Max
Variable Type Mean SD Min Max
price per unit log 2.66 0.55 1.66 5.94 price per unit log 3.02 0.53 1.8 5.11
contract dum 0.01 0.11 0 1 auction dum 0.55 0.50 0 1
mutual agreement dum 0.11 0.31 0 1 large size dum 0.16 0.37 0 1
large size dum 0.72 0.45 0 1 April dum 0.06 0.23 0 1
January dum 0.14 0.35 0 1 October dum 0.15 0.35 0 1
March dum 0.15 0.35 0 1 December dum 0.19 0.39 0 1
April dum 0.08 0.28 0 1 nb of buyers norm 21.13 7.03 1 37
October dum 0.14 0.35 0 1 local daily supply log 6.32 3.33 0.09 16.20
nb of buyers log 15.39 5.30 1 24 national daily supply log 99.57 70.62 0 271.96
local daily supply log 18.59 10.51 0.20 56.24 seller production (%) log 26.06 21.85 0.48 100
national daily supply norm 91.97 61.71 0 237.76 buyer purchase (%) log 8.08 9.05 0.20 100
seller production (%) log 12.82 14.52 0.06 100 vessel length log 16.73 4.03 9.20 24.10
buyer purchase (%) log 16.06 18.36 0.05 100 seller dependence (month) log 90.12 11.97 2.59 100
vessel length log 15.62 2.42 9.98 20.30 buyer type: fishmonger dum 0.59 0.49 0 1
buyer dependence (year) log 44.98 23.48 0.15 100 buyer importer dum 0.44 0.50 0 1
buyer type: fish merchant dum 0.23 0.42 0 1 buyer exporter dum 0.52 0.50 0 1
buyer type: transformer dum 0.09 0.29 0 1 seller loyalty rate (vol) norm 5.06 5.00 0.03 100
buyer importer dum 0.38 0.49 0 1 diligence rate (B) norm 48.18 21.98 0.67 79.19
seller loyalty rate (lot) log 14.32 21.03 0.14 100
buyer loyalty rate (vol) log 8.02 9.37 0.01 100
diligence rate (S) log 33.66 14.66 0.61 54.27
Analysis of French scallop price formation
36
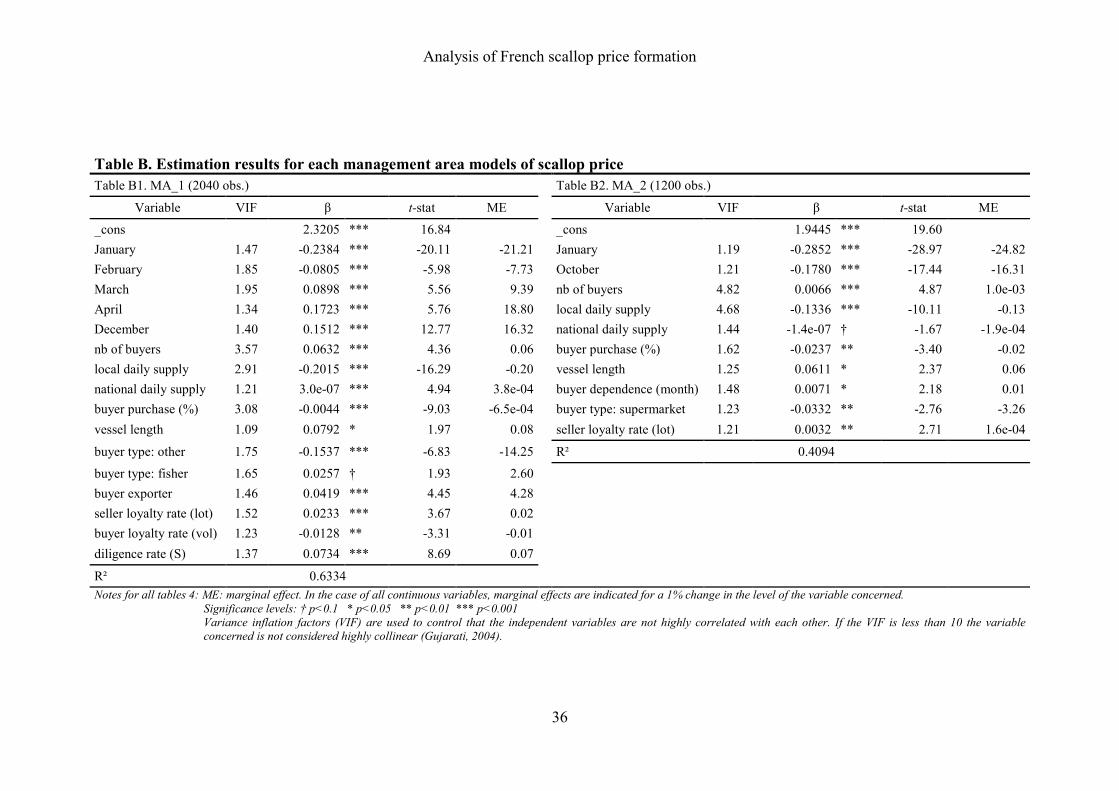
Table B. Estimation results for each management area models of scallop price
Table B1. MA_1 (2040 obs.)
Table B2. MA_2 (1200 obs.)
Variable VIF β t-stat ME
Variable VIF β t-stat ME
_cons 2.3205 *** 16.84
_cons
1.9445 *** 19.60
January 1.47 -0.2384 *** -20.11 -21.21 January 1.19 -0.2852 *** -28.97 -24.82
February 1.85 -0.0805 *** -5.98 -7.73 October 1.21 -0.1780 *** -17.44 -16.31
March 1.95 0.0898 *** 5.56 9.39 nb of buyers 4.82 0.0066 *** 4.87 1.0e-03
April 1.34 0.1723 *** 5.76 18.80 local daily supply 4.68 -0.1336 *** -10.11 -0.13
December 1.40 0.1512 *** 12.77 16.32 national daily supply 1.44 -1.4e-07 † -1.67 -1.9e-04
nb of buyers 3.57 0.0632 *** 4.36 0.06 buyer purchase (%) 1.62 -0.0237 ** -3.40 -0.02
local daily supply 2.91 -0.2015 *** -16.29 -0.20 vessel length 1.25 0.0611 * 2.37 0.06
national daily supply 1.21 3.0e-07 *** 4.94 3.8e-04 buyer dependence (month) 1.48 0.0071 * 2.18 0.01
buyer purchase (%) 3.08 -0.0044 *** -9.03 -6.5e-04 buyer type: supermarket 1.23 -0.0332 ** -2.76 -3.26
vessel length 1.09 0.0792 * 1.97 0.08 seller loyalty rate (lot) 1.21 0.0032 ** 2.71 1.6e-04
buyer type: other 1.75 -0.1537 *** -6.83 -14.25 R²
0.4094
buyer type: fisher 1.65 0.0257 † 1.93 2.60
buyer exporter 1.46 0.0419 *** 4.45 4.28
seller loyalty rate (lot) 1.52 0.0233 *** 3.67 0.02
buyer loyalty rate (vol) 1.23 -0.0128 ** -3.31 -0.01
diligence rate (S) 1.37 0.0734 *** 8.69 0.07
R² 0.6334
Notes for all tables 4: ME: marginal effect. In the case of all continuous variables, marginal effects are indicated for a 1% change in the level of the variable concerned.
Significance levels: † p<0.1 * p<0.05 ** p<0.01 *** p<0.001
Variance inflation factors (VIF) are used to control that the independent variables are not highly correlated with each other. If the VIF is less than 10 the variable
concerned is not considered highly collinear (Gujarati, 2004).
Analysis of French scallop price formation
37
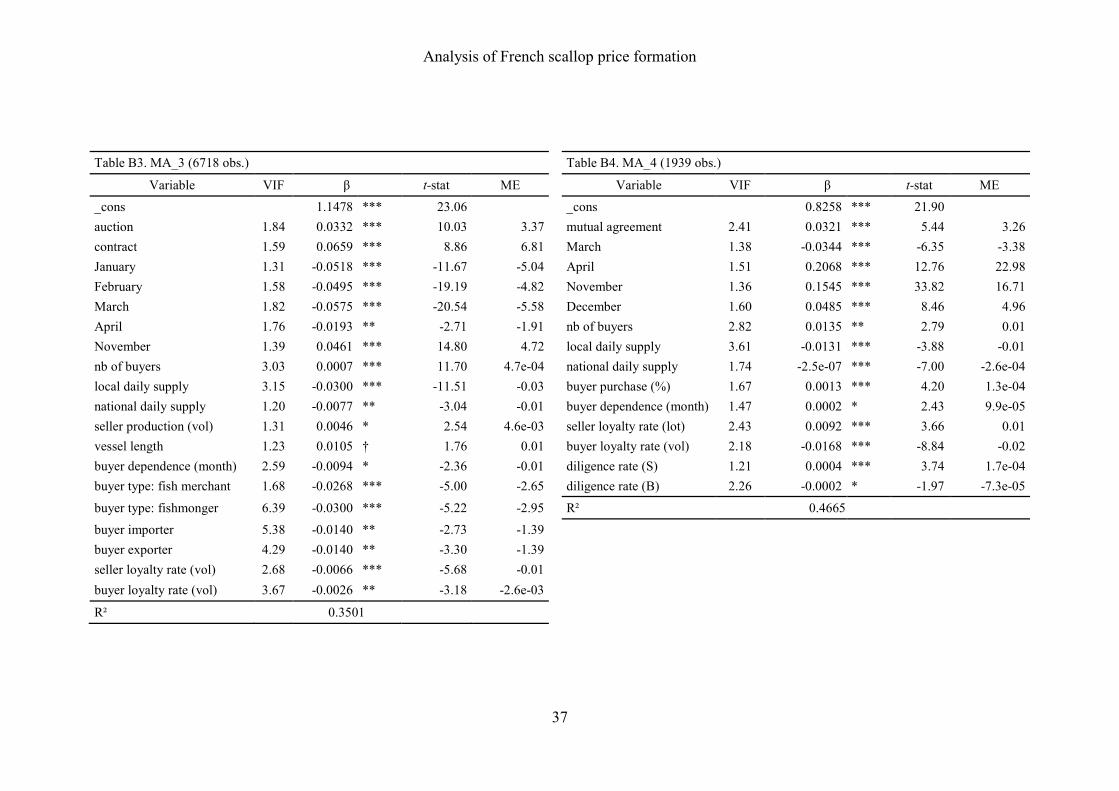
Table B3. MA_3 (6718 obs.)
Table B4. MA_4 (1939 obs.)
Variable VIF β t-stat ME
Variable VIF β t-stat ME
_cons
1.1478 *** 23.06
_cons
0.8258 *** 21.90
auction 1.84 0.0332 *** 10.03 3.37 mutual agreement 2.41 0.0321 *** 5.44 3.26
contract 1.59 0.0659 *** 8.86 6.81 March 1.38 -0.0344 *** -6.35 -3.38
January 1.31 -0.0518 *** -11.67 -5.04 April 1.51 0.2068 *** 12.76 22.98
February 1.58 -0.0495 *** -19.19 -4.82 November 1.36 0.1545 *** 33.82 16.71
March 1.82 -0.0575 *** -20.54 -5.58 December 1.60 0.0485 *** 8.46 4.96
April 1.76 -0.0193 ** -2.71 -1.91 nb of buyers 2.82 0.0135 ** 2.79 0.01
November 1.39 0.0461 *** 14.80 4.72 local daily supply 3.61 -0.0131 *** -3.88 -0.01
nb of buyers 3.03 0.0007 *** 11.70 4.7e-04 national daily supply 1.74 -2.5e-07 *** -7.00 -2.6e-04
local daily supply 3.15 -0.0300 *** -11.51 -0.03 buyer purchase (%) 1.67 0.0013 *** 4.20 1.3e-04
national daily supply 1.20 -0.0077 ** -3.04 -0.01 buyer dependence (month) 1.47 0.0002 * 2.43 9.9e-05
seller production (vol) 1.31 0.0046 * 2.54 4.6e-03 seller loyalty rate (lot) 2.43 0.0092 *** 3.66 0.01
vessel length 1.23 0.0105 † 1.76 0.01 buyer loyalty rate (vol) 2.18 -0.0168 *** -8.84 -0.02
buyer dependence (month) 2.59 -0.0094 * -2.36 -0.01 diligence rate (S) 1.21 0.0004 *** 3.74 1.7e-04
buyer type: fish merchant 1.68 -0.0268 *** -5.00 -2.65 diligence rate (B) 2.26 -0.0002 * -1.97 -7.3e-05
buyer type: fishmonger 6.39 -0.0300 *** -5.22 -2.95 R² 0.4665
buyer importer 5.38 -0.0140 ** -2.73 -1.39
buyer exporter 4.29 -0.0140 ** -3.30 -1.39
seller loyalty rate (vol) 2.68 -0.0066 *** -5.68 -0.01
buyer loyalty rate (vol) 3.67 -0.0026 ** -3.18 -2.6e-03
R²
0.3501

Analysis of French scallop price formation
38
Table B5. MA_5 (4052 obs.)
Table B6. MA_6 (8415 obs.)
Variable VIF β t-stat ME
Variable VIF β t-stat ME
_cons
1.9840 *** 38.65
_cons
2.0299 *** 34.6
auction 1.11 -0.0463 ** -3.27 -4.53 contract 1.28 -0.0956 *** -8.10 -9.11
January 1.75 -0.2099 *** -22.32 -18.93 mutual agreement 1.03 -0.0648 ** -3.28 -6.28
February 2.02 -0.1792 *** -19.99 -16.41 small size 1.36 -0.0274 *** -5.56 -2.71
March 1.93 -0.1600 *** -17.78 -14.79 large size 1.13 0.2676 *** 51.73 30.68
April 1.67 0.0352 ** 2.76 3.58 February 1.18 -0.0835 *** -17.77 -8.01
October 1.74 -0.2251 *** -24.94 -20.16 April 1.34 0.0441 *** 4.44 4.51
December 1.71 -0.1093 *** -10.49 -10.35 May 1.26 -0.1448 *** -11.13 -13.48
nb of buyers 3.08 0.0570 *** 4.35 0.06 October 1.20 -0.1019 *** -17.22 -9.68
local daily supply 3.57 -0.1213 *** -19.82 -0.12 December 1.22 0.0332 *** 5.37 3.38
national daily supply 1.37 -4.1e-07 *** -9.06 -4.1e-04 nb of buyers 2.17 0.0279 *** 4.01 0.03
seller production (%) 1.62 -0.0265 *** -6.77 -0.03 local daily supply 2.60 -0.0528 *** -14.11 -0.05
buyer purchase (%) 1.77 -0.0284 *** -10.05 -0.03 national daily supply 1.38 -0.0491 *** -19.83 -0.05
vessel length 1.75 0.0055 ** 3.34 7.6e-04 buyer purchase (vol) 1.69 -0.0108 *** -8.05 -0.01
seller dependence (year) 1.34 -0.0003 * -2.13 -2.1e-04 seller dependence (year) 1.10 -0.0238 * -2.35 -0.02
buyer dependence (year) 1.55 0.0008 *** 4.56 2.1e-04 buyer dependence (year) 1.47 0.0107 *** 4.59 0.01
buyer type: fish merchant 1.80 -0.0486 *** -6.88 -4.74 buyer type: wholesaler 1.07 0.0280 ** 3.06 2.84
buyer type: transformer 1.78 -0.0551 *** -5.59 -5.36 buyer type: fisher 1.05 -0.0354 ** -3.25 -3.48
buyer importer 2.02 -0.0196 ** -2.84 -1.94 seller loyalty rate (lot) 1.28 0.0043 * 2.08 4.3e-03
buyer exporter 2.43 0.0339 *** 4.18 3.45 diligence rate (S) 1.16 0.0081 * 2.40 0.01
seller loyalty rate (lot) 2.08 0.0044 *** 5.56 2.5e-04 R² 0.4458
buyer loyalty rate (vol) 1.67 -0.0089 ** -3.47 -0.01
diligence rate (S) 2.05 0.0016 *** 8.25 6.0e-04
R² 0.4455

Analysis of French scallop price formation
39
Table B7. MA_7 (4196 obs.)
Table B8. MA_8 (3606 obs.)
Variable VIF β t-stat ME
Variable VIF β t-stat ME
_cons 1.9888 *** 28.73
_cons
2.2348 *** 28.68
contract 1.13 -0.0637 *** -3.82 -6.17 auction 1.08 0.0125 ** 3.02 1.26
mutual agreement 1.37 -0.0597 *** -8.09 -5.79 large size 1.02 0.0173 ** 3.12 1.74
large size 1.78 0.0422 *** 6.90 4.31 April 1.09 0.1566 *** 20.03 16.95
January 1.17 0.0730 *** 10.86 7.57 October 1.17 -0.1586 *** -22.28 -14.66
March 1.23 -0.0214 *** -3.78 -2.12 December 1.36 0.0471 *** 6.87 4.82
April 1.38 0.0555 *** 6.20 5.71 nb of buyers 2.94 0.0075 *** 14.86 1.6e-03
October 1.23 -0.0846 *** -13.52 -8.12 local daily supply 3.76 -0.1478 *** -17.67 -0.15
nb of buyers 2.24 0.0193 ** 2.70 0.02 national daily supply 1.08 -0.0081 *** -14.30 -0.01
local daily supply 2.79 -0.1204 *** -20.61 -0.12 seller production (%) 2.32 0.0080 * 2.11 0.01
national daily supply 1.38 -1.2e-07 ** -3.10 -1.1e-04 buyer purchase (%) 1.74 -0.0171 *** -6.80 -0.02
seller production (%) 2.46 -0.0226 *** -5.28 -0.02 vessel length 1.58 0.0582 *** 5.19 0.06
buyer purchase (%) 3.20 -0.0099 ** -3.86 -0.01 seller dependence (month) 1.07 -0.0257 ** -2.89 -0.03
vessel length 1.55 0.0423 * 2.20 0.04 buyer type: fishmonger 1.49 -0.0114 * -2.34 -1.13
buyer dependence (year) 1.58 -0.0116 ** -2.99 -0.01 buyer importer 1.86 -0.0296 *** -5.19 -2.92
buyer type: fish merchant 1.85 -0.0342 *** -4.73 -3.36 buyer exporter 1.66 0.0178 ** 3.46 1.79
buyer type: transformer 1.20 -0.0424 *** -5.48 -4.15 seller loyalty rate (vol) 1.63 -0.0016 ** -3.24 -8.3e-05
buyer importer 1.99 -0.0698 *** -9.90 -6.74 diligence rate (B) 1.65 0.0005 *** 4.13 2.4e-04
seller loyalty rate (lot) 3.04 0.0252 *** 7.73 0.03 R² 0.5172
buyer loyalty rate (vol) 2.89 -0.0163 *** -5.67 -0.02
diligence rate (S) 1.82 0.0221 *** 5.04 0.02
R² 0.3808