Do CEO Demographics Explain Cash Holdings in SMEs
28
Do CEO Demographics Explain Cash Holdings in SMEs? Raf Orens Anne-Mie Reheul HUB RESEARCH PAPERS 2011/35 ECONOMICS & MANAGEMENT DECEMBER 2011
-
Upload
independent -
Category
Documents
-
view
0 -
download
0
Transcript of Do CEO Demographics Explain Cash Holdings in SMEs
Do CEO Demographics Explain Cash Holdings in
SMEs?
Raf Orens Anne-Mie Reheul
HUB RESEARCH PAPERS 2011/35 ECONOMICS & MANAGEMENT
DECEMBER 2011

1
Do CEO Demographics Explain Cash Holdings in SMEs?
Raf Orensa
Anne-Mie Reheulb
aLessius (K.U.Leuven) - Department of Business Studies
Korte Nieuwstraat 33, 2000 Antwerpen, Belgium
Phone: + 32 (0)3 201 18 60
bAnne-Mie Reheul,
Hogeschool-Universiteit Brussel
Warmoesberg 26, 1000 Brussels, Belgium.
Phone: + 32 (0)2 609 88 68
Fax: + 32 (0)2 210 12 22

2
Do CEO Demographics Explain Cash Holdings in SMEs?
Abstract
This study examines the idiosyncratic manager-specific influence on a corporate cash policy.
Although traditional economic theories such as trade-off theory and agency theory have already
contributed to a deeper understanding of corporate cash policy, we examine whether the integration
of Hambrick and Mason’s (1984) upper echelons theory (UET) into these traditional theories provides
additional power in explaining corporate cash holdings. We contend that social, psychological and
cognitive characteristics of CEOs, proxied by a number of CEO demographics, affect the level of
importance that CEOs (and shareholders) attach to the economic arguments provided by the
traditional theories, in turn affecting cash policy. We test our hypotheses using a sample of Belgian
privately held SMEs. Controlling for a number of operational and financial variables, our results
illustrate that CEOs have a considerable influence on corporate cash holdings. In line with most of
the hypotheses our principal findings suggest that longer tenured CEOs, older CEOs and CEOs with
experience in a single industry are more concerned with the precautionary motive of cash and less
concerned with the opportunity cost of cash, giving rise to higher cash levels compared to shorter
tenured CEOs, younger CEOs and CEOs with experiences outside the current industry. We thus
reveal that cash policy in Belgian privately held SMEs reflects the natural tendencies of CEOs. Since
cash policy affects shareholder value, it is important for shareholders to consider the demographics of
present or new CEOs, and to understand their associated inclinations concerning cash policy.
Keywords: agency theory; cash policy; SME; trade-off theory; upper echelons theory
1. Introduction
Prior literature documents that firms hold a reasonable proportion of their assets as cash and cash
equivalents, but shareholders have to be concerned that CEOs retaining excess levels of cash might
distort overall shareholder value (Harford, 1999). Prior research attributes cross-sectional differences
in corporate cash holdings to traditional economic theories, such as the trade-off theory (Opler et al.,
1999), the financial hierarchy theory (Myers & Majluf, 1984) and the agency (free cash flow) theory,
which all assume rational behaviour (Jensen 1986). Empirical studies using these theories reveal that
firm, industry and institutional characteristics such as for example a firm‟s corporate governance
structure (e.g. Chen & Chuang, 2009; Huan et al., 2011; Kusnadi, 2011), growth opportunities (Opler
et al., 1999; García-Teruel & Martinez-Solano, 2008), firm diversification (Subramaniam et al., 2011)
or legal system (e.g. Dittmar et al., 2003; Fereira & Vilela, 2004) determine cross-sectional differences
in cash reserves. Next to this traditional approach, an emerging body of finance literature considers
3
bounded rationality and associated behaviours/perceptions of decision-makers as attributes of financial
phenomena like stock returns, trading activity and corporate finance (Subrahmanyam, 2007). This
stream of literature investigates managerial attributes (cognitive ability), behaviours (overconfidence)
and perceptions (with regard to valuation) and link them to corporate financial decisions related to
capital structures and corporate investments (Baker & Wurgler, 2002, Malmendier & Tate, 2005).
With regard to cash holdings, Chang & Noorbakhsh (2009) and Ramirez & Tadesse (2009) reveal that
cultural values, perceptions and inclinations influence the level of corporate cash holdings in different
countries.
We contribute to this recent stream of finance literature by examining whether the integration of Upper
Echelons Theory (UET) into the traditional economic theories improves the explanation of cross-
sectional differences in corporate cash holdings. UET argues that decision makers are characterized
by bounded rationality and therefore also make decisions on the basis of their cognitive, social and
psychological characteristics. Organizational processes and decisions thus include a behavioural
component that reflects the idiosyncrasies of decision makers (Hambrick & Mason, 1984). According
to UET the cognitive, social and psychological characteristics of CEOs can be proxied by
demographics like tenure, education, background, age and gender (Hambrick, 2007). The extant UET
literature relates CEO demographics to various organizational processes and outcomes, such as
innovation (Kitchell, 1997), R&D spending (Barker & Mueller, 2002), internationalization (Herrmann,
2002), corporate financial disclosure (Bamber et al., 2010), strategy formation (Gibbons & O‟Connor,
2005) and firm performance (Weinzimmer, 1997). However, Carpenter et al. (2004) made a call in the
UET literature to focus on understudied corporate processes. We respond to this call by examining
whether a CEO can place his distinctive marks on his firm‟s cash policy. Our study relates to Bertrand
& Schoar (2003) who, in a sample of large listed firms, observe an idiosyncratic manager-specific
influence of individual managers on corporate decisions such as cash holdings.
Based on the combined insights from UET and the traditional economic theories, we investigate
whether CEO demographics (i.e. tenure, age, experience in other industries and education) are
reflected in corporate cash holdings in a sample of small and medium-sized enterprises (SMEs). We
conduct this study on a sample of 203 Belgian manufacturing SMEs. The CEO specific data are
collected using the survey approach. We opt for a setting of SMEs since CEOs from these firms have
more discretion in their decision to hold cash compared to CEOs from large listed firms (García-
Teruel & Martínez-Solano, 2008).
The paper proceeds as follows. Section 2 presents our theoretical framework and develops our
hypotheses. Section 3 elaborates on our research design. Section 4 presents the results of the
empirical analyses, and finally, section 5 comprises a discussion and conclusion of this study.
4
2. Theoretical framework and hypothesis development
We examine whether the integration of UET into the traditional economic theories provides additional
power in explaining corporate cash holdings. Traditional economic theories provide rational
economic arguments in (dis)favour of both low and high cash levels. We propose that cash policy also
depends on decision-makers‟ perceived or subjective importance attached to these alternative
economic arguments. This argumentation is based on the principle of bounded rationality, in which
UET is grounded. As our theoretical framework builds further on the traditional economic theories,
we review these theories in section 2.1. This section also motivates why the trade-off theory has a
stronger impact on a firm‟s cash policy for our sample firms compared to the agency theory. In
section 2.2 we develop our hypotheses by integrating insights from the UET with the traditional
economic theories. We also elaborate on the presence of CEO discretion in our dataset.
2.1 Traditional theories of cash holdings
The extant literature relies on a number of traditional economic theories to explain variations in cash
holdings, primarily the trade-off theory and the agency theory.
The trade-off theory states that the amount of cash retained in a firm is based on the trade-off between
the benefits and the costs of holding cash. According to Opler et al. (1999), firms are able to receive
two major benefits of holding cash. First, firms are able to reduce transaction costs related to raising
external funds. The liquid assets can be used to finance operating activities and investments
decreasing the costs of external financing. Second, cash holdings are also considered as a buffer
against unexpected events (Opler et al., 1999). In addition, having certain cash levels reduces the
likelihood of financial distress, especially for those firms with more volatile cash flows. On the other
hand, investing in cash also reveals some costs. Holding cash has an opportunity cost since lower
returns are obtained compared to productive investments.
The agency literature contends that large free cash flows increase the power of CEOs. When the firm
has sufficient funds to finance its projects internally, CEOs avoid the monitoring when applying for
new funds from the financial markets. This may result in projects that suit managerial interest, but not
shareholder interest. Excessive amounts of cash, especially in profitable firms with low investment
opportunities, can be detrimental to the shareholders if these resources are invested in value decreasing
projects (Jensen, 1986; Opler et al., 1999; Chang & Noorbakhsh, 2009). Consequently, cash levels are
found to be lower in situations of important agency conflicts between managers and shareholders.
First, shareholders prevent the risk of managers making value decreasing acquisitions by requiring
dividend pay, subsequently decreasing cash positions. Second, managers avoid the accumulation of
5
excess cash in this circumstance since it attracts the attention of shareholders resulting in proxy
contents and leading to the increased probability of executive turnover and cash distributions to
shareholders (Faleye, 2004). Good governance on the other hand, implying low agency conflicts, is
able to mitigate the managerial self interest in holding excess cash, in which circumstance higher cash
levels are revealed (Harford et al., 2008). The objective of corporate governance is hence to ensure
that firms maintain appropriate levels of cash and to find a balance between the agency costs of
overinvestment and the expected return of holding cash for profitable investments. Another important
type of agency conflict in privately held SMEs is the agency conflict associated with debt (Berger &
Udell, 2003). The financial hierarchy theory (or pecking order theory) considers the agency idea of
information asymmetry to posit that firms prefer to finance investments with resources internally
generated before resorting to debt providers, since in the presence of information asymmetry firms
have more difficulties to obtain funds and/or have to pay more interests (Myers & Majluf, 1984). In
situations of large agency conflicts (high information asymmetry) with debt providers, managers hold
higher levels of cash for flexibility reasons (Opler et al., 1999).
In the hypothesis development section we integrate UET into the traditional economic theories in
order to derive hypotheses. Since our dataset consists of privately held SMEs active in manufacturing
industries of the old economy, we primarily focus on the trade-off theory to set hypotheses. Chen
(2008) contends that trade-off theory plays a more important role for firms that belong to the old
economy. The agency theory is of lower importance in our dataset for the following reasons. The
large majority of the SMEs in our dataset are family firms where management and ownership
coincide, implying that the conflicts between managers and shareholders are less strong than in large,
listed firms, which was the main focus of prior research. Even in the case of minority shareholders,
the latter group demonstrate trust and perceive fewer agency problems as it is often assumed that
founders/owners act in the firm‟s best interest, given their painstaking efforts invested in the firm and
given their concern with the family legacy (Kuan et al., 2011). Our dataset also consists of a smaller
number of non-owner managed SMEs, but their ownership structure is concentrated. Belgium is
characterized by very strong ownership concentration (Peeters & Bogaert, 2005); demonstrating levels
that are much higher than the US case for example (Anderson & Hammadi, 2009). In Belgium, SMEs
are typically owned by one or a few major shareholders: families (in the case of family firms as
mentioned before), corporate owners or banks. The control by majority shareholders is thus likely to
be very effective, lowering agency conflict. The second largest declared shareholder in Belgian firms
only owns a small percentage of a firm‟s shares (Anderson & Hammadi, 2009). Consequently,
minority shareholders will probably be less concerned with potential agency conflicts because of their
higher wealth diversification. In addition, agency conflicts with debtholders are of lower importance
as the SMEs in our dataset belong to the old - rather stable - economy and are less likely to make very
risky investments compared to new tech firms (Chen, 2008). Furthermore, Anderson et al. (2003)
6
observe that family firms, constituting the bulk of our dataset, cope with lower agency costs of debt.
The undiversified portfolio of private family firm owners implies a long term view of the owners
through which valuable trust can be built between firm and lenders, leading to lower agency costs of
debt and more favourable lending conditions (Ang, 1992)
As agency theory is of lesser importance than trade-off theory in our dataset, we integrate UET
primarily with the trade-off theory to set hypotheses, and only secondary with the agency theory,
principally only where UET makes a very explicit link with this theory.
2.2 Hypothesis development
According to UET managerial decision making is to a large extent the outcome of top managers‟
cognitive, psychological and social frames due to bounded rationality, to multiple and conflicting
goals, to differing preferences and to varying aspiration levels (Hambrick & Mason, 1984).
Organizations are a reflection of their top managers (Carpenter et al., 2004). An important concept
within UET is CEO discretion or latitude of freedom. CEO discretion is the degree to which CEOs
can put their distinctive cognitive, social and psychological marks on organizational processes and
decisions (Hambrick & Finkelstein, 1987). If CEO discretion is lacking, contextual factors rather than
executive characteristics will be reflected in organizational processes/outcomes and no association will
be found between CEO characteristics and organizational processes/outcomes. If discretion is present,
a CEO is able to affect organizational processes and to contribute to a firm‟s outcome. CEO discretion
is influenced by amongst other environmental conditions (e.g. hostility versus munificence) and
organizational factors (e.g. board, ownership) (Hambrick, 2007).
An important prerequisite for conducting this study is that the CEOs in our dataset have sufficient
levels of discretion and are able to put their distinctive marks into cash policy. The following
paragraph demonstrate that our research population consisting of privately held SMEs, primarily
family firms, enables a lot of CEO discretion.
First, in SMEs CEOs are found to have wider discretion than in large firms. In SMEs CEOs are often
the sole decision makers concerning corporate policies (Miller et al., 1982). Other members of the top
management team (TMT) and boards of directors only have a secondary role in decision-making in
SMEs, especially in mature SMEs, which is the case in our study, where TMTs and active boards are
often absent (Van Gils, 2005). Second, agency conflicts between managers and owners are likely to
be low in family firms, which allow CEOs to use high levels of cash to their own discretion (Harford
et al., 2008). Third, the firms in our sample operate in the old economy. Old economy firms are less
likely to experience large cash flow volatility compared to new economy firms, are characterized by
less risky investments compared to new tech firms, and face fewer challenges to obtain external

7
finance (Chen, 2008). Based on these arguments, which indicate munificence or at least a low degree
of hostility (Hambrick, 2007), CEOs from old economy firms might have more discretion to hold a
certain level of cash.
As CEOs in our dataset have a substantial amount of discretion concerning the level of cash retained,
we propose in line with UET that their cognitive, social and psychological characteristics affect their
decision on the level of cash they retain. The UET stipulates that CEO demographic characteristics
are adequate proxies to measure the CEO‟s underlying cognitive, psychological and social
characteristics (Hambrick, 2007). For the purpose of our study, we consider following CEO
demographics: CEO tenure, CEO age, CEO experience in other industries and CEO education. Based
on UET, we posit that CEO cognitive, social and psychological characteristics, proxied by the CEO
demographics, influence corporate cash policy by affecting the extent to which CEOs (and
shareholders) are concerned with the arguments proposed by primarily the trade-off theory and
secondary the agency theory.
We develop hypotheses concerning CEO tenure and CEO age simultaneously as these constructs are
strongly correlated with each other (Damanpour & Schneider, 2006). Using arguments grounded in
UET we expect longer tenured and older CEOs to attach more value to the precautionary and
flexibility role of cash, to grant less value to the opportunity cost of cash and to be associated with
lower agency conflicts as perceived by shareholders.
First, the UET reveals that longer tenured and older CEOs are more risk averse than shorter tenured
and younger CEOs (Barker & Mueller, 2002; Kor 2006). Consequently, longer tenured and older
CEOs tend to hold larger levels of cash in order to hedge against future, undesirable events. In
addition, risk averse CEOs tend to have a higher preference for (safe) internal funding over (more
risky) external funding. Hence, we assume that longer tenured and older CEOs are more conservative
and more concerned with the precautionary motive of cash, resulting in higher cash levels compared to
shorter tenured and younger CEOs. This expectation is in line with Bertrand & Schoar (2003) who
already evidenced a positive association between CEO age and cash holdings for a sample of large
firms.
Second, based on UET we presume that longer tenured CEOs pay less attention to the opportunity cost
of holding excess levels of cash, which may lead them to hold more cash than shorter tenured CEOs.
This presumption is grounded in studies documenting the presence of regular patterns in the life cycle
of CEOs (Hambrick & Fukutomi, 1991; Miller, 1991). New CEOs have to gain knowledge about the
organisation and the environment in which the firm operates (Richard et al., 2009), are more likely to
consider several alternatives, have a more external focus, and are more open to fresh ideas, change and
8
experimentation (Hambrick et al., 1993) than long tenured CEOs. As short tenured CEOs identify
more investment opportunities we suggest that they will be more aware of the opportunity cost of not
investing cash in profitable projects and expect lower cash levels with shorter tenured CEOs. As
tenure increases, CEOs become more confident that they will not be replaced and commit to their
earlier strategies hereby refusing to collect and analyse external information and refusing to pursue
change (Finkelstein & Hambrick, 1996; Miller & Shamsie, 2001). Due to their risk aversion, inertia
and lack of external focus we posit that long tenured CEOs will be less concerned with the opportunity
cost of cash.
Third, longer tenured and older CEOs have more power to influence the selection of board members
and to constitute personal relationships with directors compared to shorter tenured and younger CEOs
(Westphal & Zajac, 1995; Finkelstein & Hambrick, 1996). Longer tenured and older CEOs also
demonstrate more legitimacy in the eyes of internal and external stakeholders1 (Miller, 1991) which
mitigates agency conflicts as perceived by directors and shareholders. Consequently, such CEOs are
allowed to use higher cash levels to their own discretion.
Based on these arguments, we posit the following hypotheses:
H1a: Cash holdings are positively associated with a CEO’s tenure
H1b: Cash holdings are positively associated with a CEO’s age
CEO experience is another UET variable. The UET contends that managerial decision making is also
affected by the extent to which executives have other experiences. As both CEO experience in the
same industry and CEO executive tenure cause similar psychological, social and cognitive tendencies
(Finkelstein & Hambrick, 1996), we focus on CEO experience in other industries. On the basis of
UET we expect that CEOs with more years of experience from outside industries reckon more with the
opportunity cost of cash. CEOs who have more experience from outside industries possess broader
knowledge bases and broader modes of thinking and operating compared to CEOs who have spent
their career in the same industry (Raskas & Hambrick, 1992). Consequently, this experience should
help the CEOs to identify emerging opportunities. Executives with a higher diversity in experience
have a more positive underlying attitude towards change and innovation (Dearborn & Simon, 1958),
whereas executives who have spent their career in the same industry are more committed to industry
conventions, “recipes” and established ways of operating (Hambrick et al., 1993). Industry experience
also expands CEOs‟ professional networks (Richard et al., 2009), which might increase CEOs‟
1This reasoning may seem contradictory with UET‟s proposition that performance of CEOs reduces with their
tenure (Finkelstein & Hambrick, 1990, Miller, 1991, Walters et al., 2007). However, Norburn & Birley (1988)
and Thomas et al. (1991) reveal that the predispositions of long tenured CEOs, such as well-developed
repertoires, stability and internal experience can be beneficial in more stable industries like the ones included in
this study.
9
awareness of opportunities to invest in productive investments instead of keeping large amounts of
cash. Following these arguments, we contend that CEOs with experience in other industries view
more opportunities to invest cash resources.
According to UET, CEO experience is unrelated with CEO power and hence we do not make a
proposition combining UET with agency theory. We hypothesize that:
H2: Cash holdings are negatively associated with a CEO’s experience in other industries
Besides CEO tenure, age and experience, the level of CEO education is also an important UET
variable. It may seem unlikely that educational experiences would affect managerial decisions since
top executives typically are many years beyond their formal education. Yet a significant body of
research suggests that CEO education is reflected in the characteristics of their organizations, through
the association of education with a wide array of cognitive, psychological and social characteristics.
CEO education is associated with a higher capacity for information processing (Schroder et al., 1967),
a higher level of open-mindedness, higher receptivity to innovation (Becker, 1970), higher boundary
spanning, higher tolerance for ambiguity and higher integrative complexity (Dollinger, 1984). These
observed associations have been found robust and stable, also after controlling for CEO age and
industrial setting (Wiersema & Bantel, 1992). We expect higher educated CEOs to be associated with
lower cash levels for the following reasons.
First, as higher educated CEOs are less risk averse and better informed about the external environment
(Dollinger, 1984; Schroder et al., 1967), we posit that they will be less concerned with the
precautionary motive of cash. Second, as higher educated CEOs are more open to new ideas, changes
and investment opportunities (Wiersema & Bantel, 1992; Wally & Baum, 1994; Barker & Mueller,
2002), we posit that these CEOs are aware of the opportunity cost of cash. Hence, higher educated
CEOs are more likely to spend their cash resources in profitable investments compared to lower
educated CEOs as their external focus identifies more investment opportunities and as they better
realize that productive investments provide higher returns compared to cash.
According to UET, CEO experience is unrelated with CEO power and hence we do not make a
proposition combining UET with agency theory. We posit that:
H3: Cash holdings are negatively associated with a CEO’s educational level.
3. Research method
10
In order to test our hypotheses, we collect data from a sample of Belgian manufacturing SMEs. The
following sections detail the sample selection procedure, the survey instrument employed, the
measurement of the variables and the research method.
3.1 Sample selection
The research population consists of Belgian (Flemish) SMEs with between 15 and 250 full time
equivalent employees, belonging to four industry-codes within manufacturing and in business for at
least five years. The four selected industries (manufacture of furniture, of synthetic products, of
metal constructions, and of machinery for general use) are the largest ones within the SME sector.
By selecting firms from specific industry codes and regions, we are able to control for the influence
of industry, technology, and culture on cash policy. Applying these selection criteria yields a
population of 948 firms.
These firms received a questionnaire in order to collect information about the CEO demographics
and the control variable Environmental Uncertainty (EU). The questionnaires were addressed to each
firm‟s CEO. Following Dillman (2000), we implement following three steps during our survey: (i)
initial mailing, (ii) first follow-up, and (iii) second follow-up. We received 138 usable responses
immediately. The two follow-ups resulted in an additional 82 usable responses. In total, we obtained
220 usable responses, representing a response rate of 23.21%. This response rate is satisfactory and
comparable to the response rates reported in other mail-survey studies of small firms (Dennis, 2003).
After excluding missing answers and corresponding financial variables, we withhold 203
observations.
In order to detect non-response bias, a two-step analysis is conducted. First, we compare respondents
with non-respondents in terms of firm size, leverage, profitability, liquidity and cash holdings. Chi-
square tests reveal no significant differences between respondents and non-respondents with respect
to these variables. We control the main construct measures (i.e. the variables relating to the CEO) for
dissimilarity between the immediate respondents and the respondents to the follow-up surveys.
Independent sample t-tests and chi square tests reveal no differences between both groups. These
analyses allow us to conclude that non-response bias is not a major concern in this sample.
.
3.2 Measurement instruments
Cash holdings as dependent variable is measured as the ratio between cash and cash equivalents to
total assets less cash and cash equivalents (Opler et al., 1999; Harford et al., 2007)2. Since the survey
is conducted in 2006, we compute the level of cash holdings at year-end 2006. In addition, we
compute the average level of cash holdings at year-ends 2005 and 2006 which proxy for the average
2 We also scale with total assets instead of net assets, and get similar research findings.
11
level of cash holdings during the year 2006. Since industry might be a significant factor in the level of
cash holdings (Harford et al., 2007), we compute an industry adjusted measure of a firm‟s cash
holdings. We compute the median cash holdings within each of the four industries included in our
study and subtract the corresponding industry median cash holdings from each firm‟s level of cash
holdings. A higher industry-adjusted cash holding indicates how much excess (if positive) or less (if
negative) cash a firm holds compared to the industry‟s median value.
The research variables include the CEO demographics collected from the survey. In the questionnaire,
CEO age is measured as a categorical variable including three classes: younger than 35 year, between
35 and 50 year, and more than 50 year. These classes correspond with the classes used in Damanpour
and Schneider (2006). We create dummy variables for each class and include in the regression
equation the dummy variable indicating whether the CEO is between 35 and 50 year and whether the
CEO is older than 50 years. We expect a positive sign for both indicator variables suggesting that
younger CEOs (less than 35 years) are less likely to hold excess cash levels compared to the older
CEOs. CEO Tenure is the natural logarithm of one plus the number of years that the CEO holds its
current position in the firm. CEO Other Experience is measured as the natural logarithm of one plus
the number of years that the CEO has been appointed in companies from other industries. CEO
Education is a dummy variable with the value of one when a CEO obtained at least a degree in higher
education and zero otherwise.
Firm‟s level of cash holdings is regressed on the research variables together with some control
variables (i.e. firm size, cash flow generation, liquidity, financial leverage, environmental uncertainty
and industry membership). Firm Size is the natural logarithm of the total assets. We expect a negative
association between cash holdings and firm size since larger firms benefit from economies of scale of
holding cash that is used for their normal activities (Mulligan, 1997). In addition, larger firms have
lower financial constraints (Whited, 1992; Fazzari & Petersen, 1993), have lower levels of information
asymmetry (Jordan et al., 1998; Berger et al., 2001) and are to lower extent vulnerable to financial
distress (Rajan & Zingales, 1995; Titman & Wessels, 1998). Cash Flow Generation is computed as
the ratio between cash flows to total assets. In case of information asymmetry, firms prefer to fund
themselves with internally generated resources instead of borrowing these funds (Myers & Majluf,
1984). Hence, we assume a positive association between cash levels and cash flows, consistent with
Opler et al. (1999) and García-Teruel & Martínez-Solano (2008). Liquidity is defined as the difference
between current assets (less cash and cash equivalents) and current liabilities scaled by total assets.
We expect a negative association between liquidity and cash holdings (Chen, 2008). Financial
leverage is measured as the ratio between long and short bank debts and total assets. Prior literature
finds a negative association between cash holdings and leverage since the costs of funds used to invest
in liquid assets rise as leverage increases (Baskin, 1987; García-Teruel & Martínez-Solano, 2008).
12
Environmental uncertainty tends to be an important attribute of a corporate cash policy (Ramirez &
Tadesse 2009). Environmental uncertainty implies the inability to accurately assess the external
environment of the organization or the future changes that might occur in that environment. Higher
levels of environmental uncertainty make it difficult for managers to make accurate predictions about
the market (Milliken, 1987). Consequently, a high level of environmental uncertainty is more likely to
result in fear3 for potential financial distress caused by unexpected losses. Potential cash shortage
could force managers to raise funds on unfavourable terms or to liquidate other assets at large
discount. To overcome this situation, CEOs operating under a high level of environmental uncertainty
may decide to hold larger levels of cash at their disposal. Environmental uncertainty is measured on
the basis of the CEOs‟ responses on factors that capture this concept4. Finally, we control for industry
influence by inserting industry dummies in the regression equation.
Due to collinearity between CEO tenure and CEO age, we opt to include each variable separately in
the regression equations. Cash holding is either the level of cash at year 2006 or the average level of
cash from year-ends 2005 and 2006. The dependent and control variables are winsorized at 1% and
99% level to mitigate the influence of outliers.
4. Results
Table 1 exhibits descriptive statistics of the research variables and reports that, on average, CEO
tenure is 13 years and the average years of experience in another industry is about 4 years. We
further note that 80% of the respondents have a degree in higher education. With respect to industry
membership, 33% of respondents operate in the metal structures manufacturing industry. The
remaining three industries each represent about 22% of respondents. The average deviation of a
firm‟s cash holdings from industry mean is about 7%. Untabulated findings illustrate that on average
cash and cash equivalents represent 16% of a firm‟s total assets. We also notice that the large
3 To a higher or lower extent, depending on a CEO‟s tolerance for ambiguity for example.
4 To capture environmental uncertainty, we use an instrument based on Gordon & Narayanan (1984) still
widely used in the recent literature (Abdel-Kader & Luther, 2008). Respondents rate on a 5 point Likert scale
ranging from 1 (=“completely predictable”) to 5 (=“completely unpredictable”) the extent to which each of the
following eight environmental elements are unpredictable: market activities of competitors, needs and tastes
of customers, actions of suppliers, production technologies, government regulation and policy, economic
environment, industrial relations, and deregulation/globalization. Based on a factor analysis, the ratings on
only six items (excluding the two factors relating to the unpredictability of customers and suppliers) are
averaged to arrive at an overall EU index. Internal consistency is assessed with the Cronbach’s α coefficient and
corresponds with a value of 0.66. This meets the cutoff value of 0.6 (Hair et al., 1998).

13
majority of responding SMEs are small (67% count less than 50 FTE employees) and mature (90%
have been in business for more than 10 years).
Insert Table 1 here
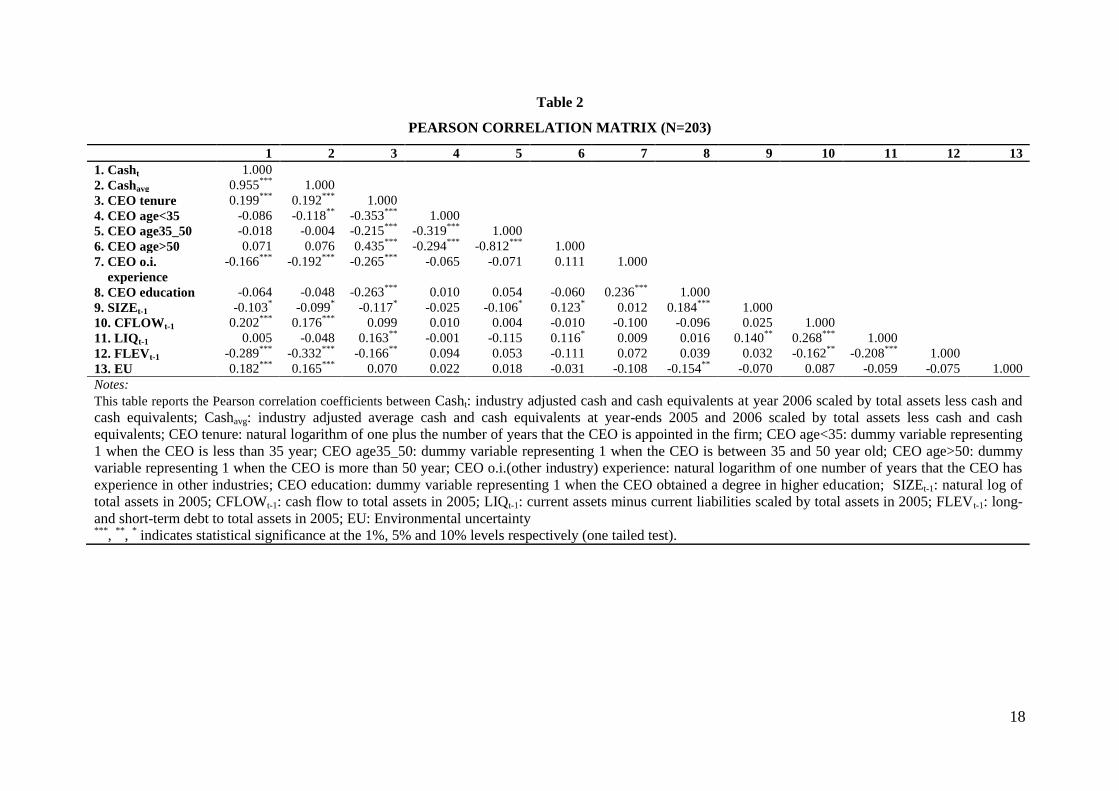
Table 2 presents the correlation matrix. This matrix allows us to observe univariate associations
between our research variables. We find that firms with a longer CEO tenure and with an older CEO
(more than 35 years) are more likely to hold more cash reserves. Cash holding is negatively
associated with firms employing CEOs having experiences in other industries. These results are in
line with predictions. The level of education is unrelated with cash holdings. With respect to the
control variables, Table 3 exhibits that firms with higher cash flows and with lower bank debts have
higher levels of cash. A strong positive correlation exists between cash levels and environmental
uncertainty. The association between cash holdings and firm size is only marginally significant, but is
probably inherent to the sample selection consisting of a homogenous group of small entities that do
not differ very much in size (García-Teruel & Martínez-Solano, 2008).
Insert Table 2 here
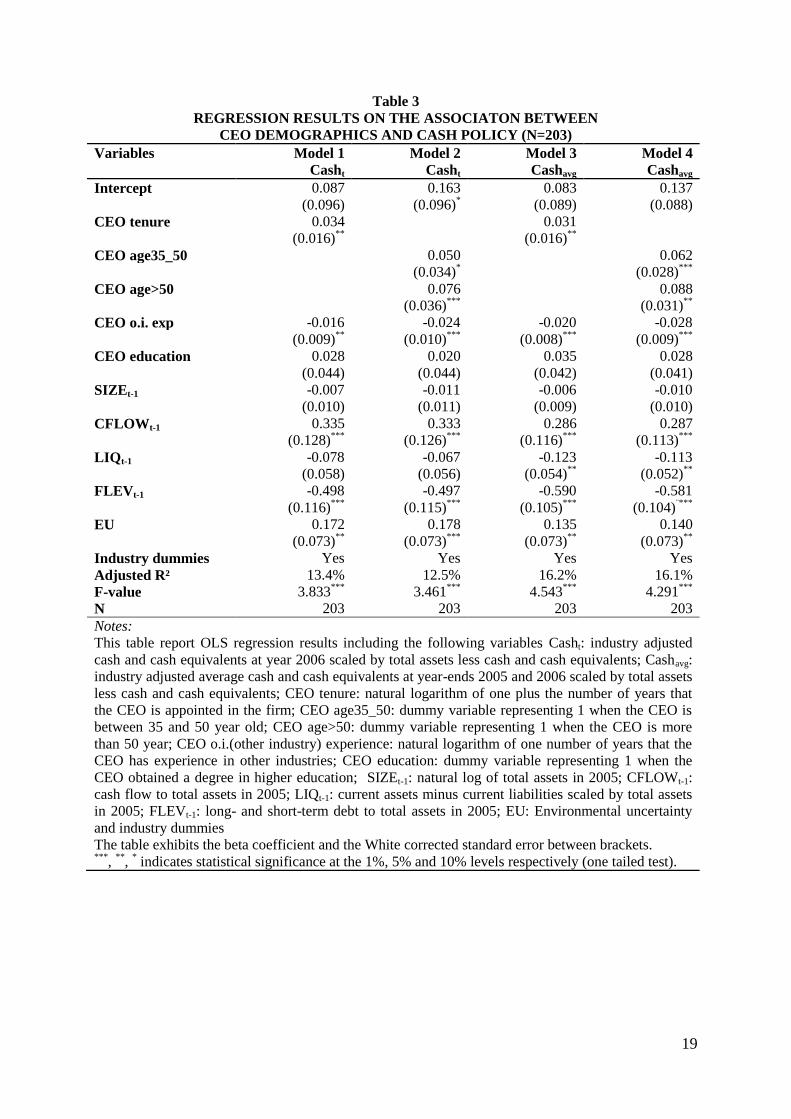
In order to examine the association between cash holdings and a set of research and control variables,
we run OLS regressions. Table 4 reports several models. Model 1 and Model 2 incorporate CEO
tenure, CEO experience in other industries and CEO education and associate these variables with the
two proxies for firm‟s cash holdings. Model 3 and Model 4 are similar to the previous models, except
that CEO tenure is replaced with CEO age. In order to control for heteroscedasticity, significance
levels are adjusted to reflect White‟s correction of the standard errors.
Insert Table 3 here
The OLS regression results correspond with the univariate statistics and are also consistent across the
proxy used as the dependent variable. Findings illustrate a positive coefficient for CEO tenure
indicating that firms tend to keep more cash when the CEO‟s tenure is longer (Model 1 and 3). Both
dummy variables related with CEO age have a positive association with the level of cash holdings
(Model 2 and 4), revealing that older CEOs tend to hold higher levels of cash. These results confirm
H1a and H1b. Concerning CEO experience, our findings reveal that CEOs with more experience in
other industries are less likely to hold excess levels of cash compared to CEOs who are only familiar
with a single industry. Hence, these results allow us to confirm H2. Finally, cash holdings are found
to be unrelated with the level of education, which is not in line with H3. The coefficients of the
control variables are in line with prior literature, except for firm size. Firms with more cash flows,

14
lower debt levels and lower levels of working capital hold higher levels of cash. Firm size is unrelated
with the level of cash holdings. We also observe a positive coefficient for the variable EU, indicating
that firms are more likely to retain cash when their CEOs have less confidence in future economic
development.
5. Robustness checks
We modify our regression equations to investigate whether we obtain the same results. Table 4
reports regression results of these sensitivity analyses, but only with the average cash holdings as
dependent variable. We obtain similar results when cash levels of 2006 are included as a dependent
variable.
Insert Table 4 here
First, we estimate our regression equations for a sample of CEOs having sufficient years of CEO
tenure. At the start of their tenure, CEOs typically gain a lot of knowledge by means of
experimentation and change (Miller & Shamsie, 2001). Only after a certain period, typically three
years (Finkelstein & Hambrick 1996, p. 83), CEOs increasingly commit themselves to earlier
strategies, refuse to collect and analyse external information and refuse to pursue change (Miller &
Shamsie, 2001). Since the UET focus is on the negative side of CEO tenure, this theory is better
captured by focusing on those CEOs that are appointed for at least three years. Taking into account
this consideration, we regress the CEO demographics and control variables on cash holdings for a set
of firms where the CEO is appointed for at least 3 years. The results in Table 4 (Model 1 and 2)
exhibit a positive and significant association between CEO tenure and cash holdings, and between
CEO age and cash holdings. CEO education is unrelated with cash holdings. The coefficient for CEO
experience in other industries is negative and significant. These results are similar to prior results.
Second, we examine whether the CEO variables present the same results controlling for the impact of
corporate governance on cash holdings (Harford et al., 2008; Kuan et al., 2011). To capture board
structure we include the following three variables that were collected from the financial statements and
from Graydon, a company providing business information: board size (number of directors),
percentage of outside directors5 (ratio of outside director to total directors) and CEO duality (dummy
variable that equals 1 when the chairman of the board is also the CEO). Prior studies document that
board structure impacts cash holdings. For instance, outside directors increase firm‟s network to raise
funds, which lowers the need to retain excess cash (Ozkan & Ozkan, 2004). Kuan et al. (2011)
document a positive association between CEO duality and cash holding. If CEO and chairman are the
5 A director is classified as outsider if he/she does not belong to the firm‟s management or the latter‟s relatives.
15
same person, the CEO may hold more cash in order to pursue private interests at the expense of
shareholders (Shakir, 2009; Kuan et al., 2011). Model 3 and 4 in Table 46 illustrate that none of the
governance variables has a significant effect on cash holdings7. Consistent with our prior results,
longer tenured CEOs tend to hold larger cash reserves and CEOs with experience in other industries
tend to keep lower levels of cash. CEO age shows a positive association with cash holding.
6. Discussion and conclusion
Traditional finance theories like the trade-off theory and the agency theory provide economic
arguments to explain cash holdings and adopt a rational economic view. The contribution of our study
is to consider the (subjective) importance attached to these alternative economic arguments to explain
cash levels. The latter is captured by means of the CEOs‟ cognitive, social and psychological
characteristics, which is grounded in the Upper Echelons Theory (UET) (Hambrick & Mason, 1984).
This theory attributes well defined behaviours and inclinations to CEOs with certain cognitive, social
and psychological characteristics, and posits that the latter characteristics can be validly proxied by
CEO demographics (e.g. tenure, education,...). Our study builds further on the recent stream of
behavioural finance studies that depart from decision-makers‟ bounded rationality in explaining
financial decisions (Subrahmanyam, 2007). In particular, we integrate insights of UET into the
traditional finance theories; primarily the trade-off theory given the old economy- and family-oriented
setting of our study.
We conduct our study using a sample of 203 CEOs of Flemish SMEs as it is generally acknowledged
that CEOs in SMEs are often sole decision-makers and thus have high discretion in determining cash
policy (Van Gils, 2005). Our study reveals that in addition to the most prominent financial and
operational variables explaining cash policy, CEO demographics add power in models explaining cash
holdings. In line with the expectations, we reveal that longer tenured and older CEOs retain higher
cash levels compared to shorter tenured and younger CEOs. Combining UET with trade-off theory,
our findings suggest that longer tenured and older CEOs demonstrate a higher aversion towards risk
and change, giving rise to a higher importance attached to the precautionary role of cash and a lower
importance to the opportunity cost of cash, resulting in higher cash levels. Our results confirm
Bertrand and Schoar (2008) observing that older CEOs prefer to hold more cash compared with
younger CEOs. Our findings can also be clarified by combining UET with agency theory. UET posits
that longer tenured and older CEOs demonstrate more legitimacy in the eyes of internal and external
stakeholders (Miller 1991), which mitigates agency conflicts as perceived by directors and
6 As private limited liability companies in Belgium are not legally required to have boards of directors, the
sample is parsed of the 42 SMEs concerned for the analyses in Table 4. 7 A potential explanation for these insignificant findings is the high prevalence of „paper‟ boards among mature
SMEs (Van Gils, 2005).

16
shareholders, in turn allowing longer tenured and older CEOs to use higher cash levels to their own
discretion. Consistent with our hypothesis, we find that CEOs with experience in only a single
industry hold more cash than CEOs with experience in different industries. In harmony with UET and
the trade-off theory, a higher diversity in experience is associated with a more positive underlying
attitude towards change and innovation (Dearborn and Simon 1958), which increases CEOs‟
awareness of opportunities to invest and leads them to be more concerned with the opportunity cost of
cash, resulting in lower cash levels. Similar to Bertrand and Schoar (2008), but inconsistent with our
expectations, we observe an insignificant association between CEO education and cash holdings. A
potential explanation for the insignificant finding is that more educated managers tend to pursue long-
term development and do not invest in current projects which can generate lower returns than long-
term projects. This strategy accumulates free cash flows and increases cash holdings.
The findings of our study are of practical importance for shareholders since CEOs tend to hold excess
cash levels, causing opportunity costs, which is detrimental to shareholder value. Therefore, it is
useful to shareholders to know the cash practices associated with current or potential new leaders‟
demographics. Shareholders should for example be aware that longer tenured and older CEOs and
CEOs with experience in only a single industry tend to hold higher levels of cash, increasing the risk
to miss opportunities and lowering shareholder value. Shareholders should judge whether these
tendencies are acceptable, given the broader organizational context, and should try to modify these
tendencies if necessary.
The present study is subject to a number of limitations, which provide avenues for future research. A
first set of limitations relates to the measurement of the CEO demographics. With regard to CEO
education we consider the level of education, not the type of education. Future research could
examine whether type of education, e.g. more business-oriented or more technical-oriented, is
significant in explaining cash policy. With regard to CEO experience we only consider the years of
experience in outside industries, and do not focus on functional experience (marketing, sales, general
management,…). Future studies could explore whether different kinds of functional experiences
affect CEO behaviour with regard to cash policy in a different way. Second, our research population
is restricted to industrial SMEs in the old economy. We are unable to generalize our results to SMEs
in other industries. Future research can examine whether a CEO‟s impact on cash policy is similar in
commercial SMEs and service SMEs or in high tech firms.

17
7. Tables
Table 1
DESCRIPTIVE STATISTICS (N=203)
Min Max Mean Std. dev.
Dependent variables
Casht -0.11 0.87 0.07 0.20
Cashavg -0.11 0.88 0.07 0.19
Independent variables
CEO demographics
CEO tenure 0.50 45.00 13.37 10.36
CEO age<35 0 1 0.10 0.30
CEO age35_50 0 1 0.47 0.50
CEO age>50 0 1 0.43 0.50
CEO other industry experience 0.00 30.00 3.99 6.83
CEO education 0 1 0.80 0.40
Control variables
SIZEt-1 5.72 12.78 8.47 1.09
CFLOWt-1 -0.37 0.31 0.10 0.10
LIQt-1 -0.61 0.67 0.13 0.24
FLEVt-1 0.00 0.40 0.07 0.10
EU 1.17 4.50 3.09 0.50
Ind_281 0 1 0.33 0.47
Ind_252 0 1 0.22 0.41
Ind_292 0 1 0.23 0.42
Ind_361 0 1 0.22 0.43
Notes:
This table provides descriptive statistics for the variables Casht: industry adjusted cash and cash
equivalents at year 2006 scaled by total assets less cash and cash equivalents; Cashavg: industry
adjusted average cash and cash equivalents at year-ends 2005 and 2006 scaled by total assets less
cash and cash equivalents; CEO tenure: number of years that the CEO is appointed in the firm;
CEO age<35: dummy variable representing 1 when the CEO is less than 35 year; CEO
age35_50: dummy variable representing 1 when the CEO is between 35 and 50 year old; CEO
age>50: dummy variable representing 1 when the CEO is more than 50 year; CEO other industry
experience: number of years that the CEO has experience in other industries; CEO education:
dummy variable representing 1 when the CEO obtained a degree in higher education; SIZEt-1:
natural log of total assets in 2005; CFLOWt-1: cash flow to total assets in 2005; LIQt-1: current
assets minus current liabilities scaled by total assets in 2005; FLEVt-1: long- and short-term debt
to total assets in 2005; EU: Environmental uncertainty; Ind_281: manufacture of metal
construction (nacebel industry code 281); Ind_252: manufacture of synthetic products (nacebel
industry code 252), Ind_292: manufacture of machinery for general use (nacebel industry code
292); Ind_361: manufacture of furniture (nacebel industry code 361).
18
Table 2
PEARSON CORRELATION MATRIX (N=203)
1 2 3 4 5 6 7 8 9 10 11 12 13
1. Casht 1.000
2. Cashavg 0.955***
1.000
3. CEO tenure 0.199***
0.192***
1.000
4. CEO age<35 -0.086 -0.118**
-0.353***
1.000
5. CEO age35_50 -0.018 -0.004 -0.215***
-0.319***
1.000
6. CEO age>50 0.071 0.076 0.435***
-0.294***
-0.812***
1.000
7. CEO o.i.
experience
-0.166***
-0.192***
-0.265***
-0.065 -0.071 0.111 1.000
8. CEO education -0.064 -0.048 -0.263***
0.010 0.054 -0.060 0.236***
1.000
9. SIZEt-1 -0.103*
-0.099*
-0.117*
-0.025 -0.106*
0.123*
0.012 0.184***
1.000
10. CFLOWt-1 0.202***
0.176***
0.099
0.010 0.004 -0.010 -0.100 -0.096 0.025 1.000
11. LIQt-1 0.005 -0.048 0.163**
-0.001 -0.115 0.116*
0.009 0.016 0.140**
0.268***
1.000
12. FLEVt-1 -0.289***
-0.332***
-0.166**
0.094 0.053 -0.111 0.072 0.039 0.032 -0.162**
-0.208***
1.000
13. EU 0.182***
0.165***
0.070 0.022 0.018 -0.031 -0.108 -0.154**
-0.070 0.087 -0.059 -0.075 1.000
Notes:
This table reports the Pearson correlation coefficients between Casht: industry adjusted cash and cash equivalents at year 2006 scaled by total assets less cash and
cash equivalents; Cashavg: industry adjusted average cash and cash equivalents at year-ends 2005 and 2006 scaled by total assets less cash and cash
equivalents; CEO tenure: natural logarithm of one plus the number of years that the CEO is appointed in the firm; CEO age<35: dummy variable representing
1 when the CEO is less than 35 year; CEO age35_50: dummy variable representing 1 when the CEO is between 35 and 50 year old; CEO age>50: dummy
variable representing 1 when the CEO is more than 50 year; CEO o.i.(other industry) experience: natural logarithm of one number of years that the CEO has
experience in other industries; CEO education: dummy variable representing 1 when the CEO obtained a degree in higher education; SIZEt-1: natural log of
total assets in 2005; CFLOWt-1: cash flow to total assets in 2005; LIQt-1: current assets minus current liabilities scaled by total assets in 2005; FLEVt-1: long-
and short-term debt to total assets in 2005; EU: Environmental uncertainty ***
, **
, * indicates statistical significance at the 1%, 5% and 10% levels respectively (one tailed test).
19
Table 3
REGRESSION RESULTS ON THE ASSOCIATON BETWEEN
CEO DEMOGRAPHICS AND CASH POLICY (N=203)
Variables Model 1
Casht
Model 2
Casht
Model 3
Cashavg
Model 4
Cashavg
Intercept 0.087 0.163 0.083 0.137
(0.096) (0.096)*
(0.089)
(0.088)
CEO tenure 0.034 0.031
(0.016)**
(0.016)**
CEO age35_50 0.050 0.062
(0.034)*
(0.028)***
CEO age>50 0.076 0.088
(0.036)***
(0.031)**
CEO o.i. exp -0.016 -0.024 -0.020 -0.028
(0.009)**
(0.010)***
(0.008)***
(0.009)***
CEO education 0.028 0.020 0.035 0.028
(0.044) (0.044) (0.042) (0.041)
SIZEt-1 -0.007 -0.011 -0.006 -0.010
(0.010) (0.011) (0.009) (0.010)
CFLOWt-1 0.335 0.333 0.286 0.287
(0.128)***
(0.126)***
(0.116)***
(0.113)***
LIQt-1 -0.078 -0.067 -0.123 -0.113
(0.058)
(0.056) (0.054)**
(0.052)**
FLEVt-1 -0.498 -0.497 -0.590 -0.581
(0.116)***
(0.115)***
(0.105)***
(0.104)¨***
EU 0.172 0.178 0.135 0.140
(0.073)**
(0.073)***
(0.073)**
(0.073)**
Industry dummies Yes Yes Yes Yes
Adjusted R² 13.4% 12.5% 16.2% 16.1%
F-value 3.833***
3.461***
4.543***
4.291***
N 203 203 203 203
Notes:
This table report OLS regression results including the following variables Casht: industry adjusted
cash and cash equivalents at year 2006 scaled by total assets less cash and cash equivalents; Cashavg:
industry adjusted average cash and cash equivalents at year-ends 2005 and 2006 scaled by total assets
less cash and cash equivalents; CEO tenure: natural logarithm of one plus the number of years that
the CEO is appointed in the firm; CEO age35_50: dummy variable representing 1 when the CEO is
between 35 and 50 year old; CEO age>50: dummy variable representing 1 when the CEO is more
than 50 year; CEO o.i.(other industry) experience: natural logarithm of one number of years that the
CEO has experience in other industries; CEO education: dummy variable representing 1 when the
CEO obtained a degree in higher education; SIZEt-1: natural log of total assets in 2005; CFLOWt-1:
cash flow to total assets in 2005; LIQt-1: current assets minus current liabilities scaled by total assets
in 2005; FLEVt-1: long- and short-term debt to total assets in 2005; EU: Environmental uncertainty
and industry dummies
The table exhibits the beta coefficient and the White corrected standard error between brackets. ***
, **
, * indicates statistical significance at the 1%, 5% and 10% levels respectively (one tailed test).

20
Table 4
SENSITIVITY ANALYSES ON THE ASSOCIATON BETWEEN
CEO DEMOGRAPHICS AND CASH POLICY (N=203)
Variables Model 1
Cashavg
Model 2
Cashavg
Model 3
Cashavg
Model 4
Cashavg
Intercept 0.026 0.107 0.114 0.161
(0.103) (0.101) (0.117) (0.119)
CEO tenure 0.051 0.032
(0.025)**
(0.020)**
CEO age35_50 0.095 0.059
(0.036)***
(0.036)**
CEO age>50 0.120 0.086
(0.038)***
(0.038)**
CEO o.i. exp -0.022 -0.031 -0.024 -0.031
(0.009)***
(0.010)***
(0.010)***
(0.011)***
CEO education 0.042 0.033 0.011 0.006
(0.045)
(0.043) (0.050) (0.049)
SIZEt-1 -0.006 -0.010 -0.006 -0.009
(0.010) (0.011) (0.012) (0.013)
CFLOWt-1 0.324 0.300 0.310 0.303
(0.135)***
(0.134)**
(0.138)**
(0.136)**
LIQt-1 -0.135 -0.111 -0.166 -0.161
(0.061)**
(0.059)**
(0.068)***
(0.067)***
FLEVt-1 -0.581 -0.602 -0.656 -0.660
(0.127)***
(0.128)***
(0.139)***
(0.139)***
EU 0.160 0.157 0.044 0.057
(0.077)**
(0.076)**
(0.076) (0.073)
B_SIZE 0.001 0.001
(0.011) (0.011)
P_OUTDIR 0.009 -0.011
(0.040) (0.042)
DUALITY 0.007 0.010
(0.028) (0.029)
Industry dummies Yes Yes Yes Yes
Adjusted R² 15.6% 14.9% 14.5% 14.4%
F-value 4.018***
3.609***
2.939***
2.825***
N 180 180 161 161
Notes:
This table reports OLS regression results on the sensitivity analyses. Model 1 and 2 investigate the
impact of CEO demographics on cash holding in the assumption that the CEO is appointed for at least
3 years. Model 3 and 4 include additional controls for the quality of corporate governance in the
sample firms, i.e. B_SIZE: the number of directors on the board; P_OUTDIR: proportion of outside
directors on the Board and DUALITY: dummy variable representing the value of 1 when the CEO is
also chairman of the Board. The remaining variables are Cashavg: industry adjusted average cash and
cash equivalents at year-ends 2005 and 2006 scaled by total assets less cash and cash equivalents;
CEO tenure: natural logarithm of one plus the number of years that the CEO is appointed in the firm;
CEO age35_50: dummy variable representing 1 when the CEO is between 35 and 50 year old;
CEO>50: dummy variable representing 1 when the CEO is more than 50 year; CEO o.i.(other
industry) experience: natural logarithm of one number of years that the CEO has experience in other
industries; CEO education: dummy variable representing 1 when the CEO obtained a degree in higher
education; SIZEt-1: natural log of total assets in 2005; CFLOWt-1: cash flow to total assets in 2005;
LIQt-1: current assets minus current liabilities scaled by total assets in 2005; FLEVt-1: long- and short-
term debt to total assets in 2005; EU: Environmental uncertainty and industry dummies.
The table exhibits the beta coefficient and the White corrected standard error between brackets. ***
, **
, * indicates statistical significance at the 1%, 5% and 10% levels respectively (one tailed test).
21
8. References
Abdel-Kader, M. and Luther, R. (2008) The impact of firm characteristics on management accounting
practices: a UK-based empirical analysis. The British Accounting Review 40(1), 2-27.
Anderson, R.W. and Hamadi, M. (2009) Large powerful shareholders and cash holding. LSF
Research Working Paper Series, N°. 09-04, available online:
http://www.lsf.lu/eng/Research/Working-Papers/2009.
Anderson, R.., Mansi, S. & Reeb, D. (2003) Founding family ownership and the agency cost of debt.
Journal of Financial Economics 68, 263-285.
Ang, J.S. (1992). On the theory of finance for privately held firms. Journal of Small Business Finance
1(3), 185-203.
Baker, M. and Wurgler, J. (2002) Market timing and capital structure. Journal of Finance 57(1), 1-32.
Bamber, L.S., Jiang J. and Wang, I.Y. (2010) What‟s my style? The influence of top managers on
voluntary corporate financial disclosure. The Accounting Review 85(4), 1131-1162.
Barker III, V.L. and Mueller, G. (2002) CEO Characteristics and firm R&D spending. Management
Science 48(6), 782-801.
Baskin J. (1987) Corporate liquidity in games of monopoly power. Review of Economics and
Statistics 69, 312-319.
Becker, M.H. (1970) Sociometric location and innovativeness: Reformulation and extension of the
diffusion model. American Sociological Review 35, 367-304.
Berger, A., Klapper, F. and Udell, G. (2001) The ability of banks to lend informationally opaque small
business. Journal of Banking and Finance 25, 2127-2167.
Berger, A. N. and Udell, G. F. (2003) The institutional memory hypothesis and the procyclicality of
bank lending behaviour. Finance and Economics Discussion Series 2003-02, Board of Governors of
the Federal Reserve System (U.S), 1-38.

22
Bertrand, M. and Schoar, A. (2003) Managing with style: the effect of managers on firm policies. The
Quarterly Journal of Economics 118(4), 1169-1208.
Carpenter, M.A., Geletkanycz, M.A. and Sanders, W.G. (2004) Upper echelons research revisited:
Antecedents, elements, and consequences of top management team composition. Journal of
Management 30(6), 749-778.
Chang, K. and Noorbakhsh, A. (2009) Does national culture affect international corporate cash
holdings? Journal of Multinational Financial Management 19, 323-342.
Chen, Y-R and Chuang, W-T. (2009). Alignment or entrenchment? Corporate governance and cash
holdings in growing firms. Journal of Business Research 62, 1200-1206.
Chen, Y-R. (2008) Corporate governance and cash holdings: listed new economy versus old economy
firms. Corporate Governance 16(5), 430-442.
Damanpour, F. and Schneider, M. (2006) Phases of adoption of innovation in organizations: effects of
environment, organization and top managers. British Journal of Management 17(3), 215-236.
Dearborn, D. C. and Simon, H. A. (1958) Selective perceptions: A note on the departmental
identification of executives. Sociometry 21, 140-144.
Dennis, Jr., W.J. (2003) Raising response rates in mail surveys of small business owners: results of an
experiment. Journal of Small Business Management 41(3), 278-295.
Dillman, D.A. (2000). Mail and Internet surveys: The tailored design method. 2nd Edition. John Wiley
& Sons, New York.
Dittmar, A., Mahrt-Smith, J. and Servaes, H. (2003) International corporate governance and corporate
cash holdings. Journal of Financial and Quantitative Analysis 36(1), 111-133.
Dollinger, M.J. (1984). Environmental boundary spanning and information processing effects on
organizational performance. Academy of Management Journal, 27(2), 351-368.
Faleye, O. (2004) Cash and corporate control. Journal of Finance 59, 2041-2060.
23
Fazzari, S.M. and Petersen, B. (1993) Working capital and fixed investment: new evidence on
financing constraints. Rand Journal of Economics 24, 328-342.
Ferreira, M.A. and Vilela, A. (2004) Why do firms hold cash? Evidence from EMU countries.
European Finance Management 10, 295-319.
Finkelstein, S., and Hambrick, D.C. (1996) Strategic leadership: top executives and their effects on
organizations. St Paul: West Publishing Company, Minneapolis.
García-Teruel, P.J. and Martínez-Solano, P. (2008) On the determinants of SME cash holdings:
evidence from Spain. Journal of Business Finance & Accounting 35(1-2), 127-149.
Gibbons, P.T. and O‟Connor, T. (2005) Influences on strategic planning processes among Irish SMEs.
Journal of Small Business Management 43(2), 170-186.
Gordon, L.A. and Narayanan, V.K. (1984) Management accounting systems, perceived environmental
uncertainty and organization structure: an empirical investigation. Accounting, Organizations and
Society 9(1), 33-47.
Hair, J.F., Anderson, R.E., Tatham, R.L. and Black, W.C. (1998). Multivariate Data Analysis. 5th
Edition. Prentice Hall International (UK) Ltd, London.
Hambrick, D.C. (2007) Upper echelons theory: an update. Academy of Management Review 32(2),
334-343.
Hambrick D.C. and Finkelstein, S. (1987) Managerial discretion: a bridge between polar views of
organizations. Organizational Behavior 9, 369-406.
Hambrick D.C. and Fukutomi, G.D.S. (1991) The seasons of a CEO's tenure. Academy of
Management Review 16(4), 719-742.
Hambrick, D.C. and Mason, P. (1984) Upper echelons: The organization as a reflection of its top
managers. Academy of Management Review 9, 193-206.
Hambrick, D.C., Geletkancyz, M. and Fredrickson, J.W. (1993) Top executive commitment to the
status quo: some tests of its determinants. Strategic Management Journal 14, 401-418.

24
Harford, J. (1999) Corporate cash reserves and acquisitions. Journal of Finance 54, 1969-97.
Harford, J., Mansi, S.A. and Maxwell, W.F. (2008) Corporate governance and firm cash holdings in
the US. Journal of Financial Economics 87, 535-555.
Herrmann, P. (2002) The influence of CEO characteristics on the international diversification of
manufacturing firms: an empirical study in the United States. International Journal of Management
19(2), 279-292.
Jensen, M.C. (1986) Agency costs of free cash flow, corporate finance, and takeovers. American
Economic Review 76(2), 323-329.
Jordan, J., Lowe, J. and Taylor, P. (1998) Strategy and financial policy in UK small firms. Journal of
Business Finance and Accounting 25, 1-27.
Kitchell, S. (1997) CEO characteristics and technological innovativeness: a Canadian perspective.
Canadian Journal of Administrative Sciences 14(2), 111-125.
Kor, Y. Y. (2006) Direct and interaction effects of top management team and board compositions on
R&D investment strategy. Strategic Management Journal 27(11), 1081-1099.
Kuan, T-H, Li, C-S. and Chu, S-H. (2011) Cash holdings and corporate governance in family-
controlled firms. Journal of Business Research 64, 757-764.
Kusnadi, Y. (2011) Do corporate governance mechanisms matter for cash holdings and firm value.
Pacific-Basin Finance Journal, doi: 10.1016/j.pacfin.2011.04.002.
Malmendier, U. and Tate, G. (2005) Does overconfidence affect corporate investment? CEO
overconfidence measures revisited. European Financial Management 11(5), 649-659.
Miller, D. (1991) Stale in the saddle: CEO tenure and the match between organization and
environment. Management Science 37, 34-52.
Miller, D. and Shamsie, I. (2001) Learning across the life cycle: experimentation and performance
among the Hollywood studio heads. Strategic Management Journal 22, 725-745.

25
Miller, D., Kets de Vries, M.F.R. and Toulouse, J.M. (1982) Top executive locus of control and its
relationship to strategy making, structure and environment. Academy of Management Journal 25(2),
237-253.
Milliken, F.J. (1987) Three types of perceived uncertainty about the environment: state, effect and
response uncertainty. Academy of Management Review 12, 133–143.
Mulligan, C.B. (1997) Scale economies, the value of time, and the demand for money: longitudinal
evidence for firms. Journal of Political Economy 105, 1061-1079.
Myers, S.C. and Majluf, N.S. (1984) Corporate financing and investment decisions when firms have
information that investors do not have. Journal of Financial Economics 20, 293-315.
Norburn, D. and Birley, S. (1988) The top management team and corporate performance. Strategic
Management Journal 9(3), 225-237.
Opler, T., Pinkowitz, L., Stulz, R. and Williamson, R. (1999) The determinants and implications of
cash holdings. Journal of Financial Economics 52(1), 3-46.
Ozkan, A. and Ozkan, N. (2004) Corporate cash holdings: an empirical investigation of UK
companies. Journal of Banking and Finance 28, 2103-2134.
Peeters, J. and Bogaert, J. (2005) Belgium in The practical guide to international corporate
governance, FIR publications, 59-82
Rajan, R.G. and Zingales, L. (1995) What do we know about capital structure? Some evidence from
international data. Journal of Finance 50, 1421-1460.
Ramirez, A. and Tadesse, S. (2009) Corporate cash holdings, uncertainty avoidance, and the
multinationality of firms. International Business Review 18, 387-403.
Raskas, D.F., Hambrick, D.C. (1992) Multifunctional managerial development: A framework for
evaluating the options. Organizational Dynamics 21(2), 4-17.
Richard, O.C., Wu, P. and Chadwick, K. (2009) The impact of entrepreneurial orientation on firm
performance: the role of CEO position tenure and industry tenure. The International Journal of Human
Resource Management 20(5), 1078-1095.
26
Schroder, H.M., Driver, M.J. and Struefert, S. (1967) Human information processing. Holt, Rinehart &
Winston, New York.
Shakir, R. (2009) Examining the effect of leadership structure and CEO tenure on Malaysian property
firm performance. Journal of Real Estate Literature 17(1), 47-62.
Subrahmanyam, A. (2007) Behavioural Finance: A review and synthesis. European Financial
Management 14(1), 12-29.
Subramaniam, V., Tang, T.T., Yue, H. and Zhou, X. (2010) Firm structure and corporate cash
holdings. Journal of Corporate Finance 17(3), 759-773.
Thomas, A. S, Litschert, R. J., Ramaswamy, K. (1991) The performance impact of strategy-manager
coalignment: an empirical examination. Strategic Management Journal 12(7), 509-522.
Titman, S. and Wessels, R. (1988) The determinants of capital structure choice. Journal of Finance 43,
1-19.
Van Gils, A. (2005) Management and governance in Dutch SMEs. European Management Journal
23(5), 583-589.
Wally, S., and Baum, J.R. (1994) Personal and structural determinants of strategic decision making.
Academy of Management Journal 37, 932-956.
Walters, B.A., Kroll, M.J. and Wright, P. (2007) CEO tenure, board of directors, and acquisition
performance. Journal of Business Research 60, 331-338.
Weinzimmer, L.G. (1997) Top management team correlates of organizational growth in a small
business context: a comparative study. Journal of Small Business Management 35(3), 1-10.
Westphal, J.D. and Zajac, E.J. (1995) Who shall govern? CEO/board power, demographic similarity,
and new director selection. Administrative Science Quarterly 40, 60-83.
Wiersema, M.G. and Bantel, K.A. (1992) Top management team demography and corporate strategic
change. Academy of Management Journal 35, 91-121.

27
Whited, T.M. (1992) Debt, liquidity constraints, and corporate investment: evidence from panel data.
Journal of Finance 47, 1425-1460.