Planning & Demographics: Is There a Connection
27
1 1 Planning & Demographics: Is There a Connection? Paul Allred, Director Community Development City of Holladay
-
Upload
independent -
Category
Documents
-
view
5 -
download
0
Transcript of Planning & Demographics: Is There a Connection

1
1
Planning & Demographics:Is There a Connection?
Paul Allred, DirectorCommunity Development
City of Holladay

2
2
"There are three kinds of lies: lies, damned lies and statistics."
--Autobiography of Mark Twain

3
3
DEMOGRAPHICS IN PLANNING
Role of Urban Planners…?
THE BIG PICTURE!(Which is made up of lots of snapshots)
4
4
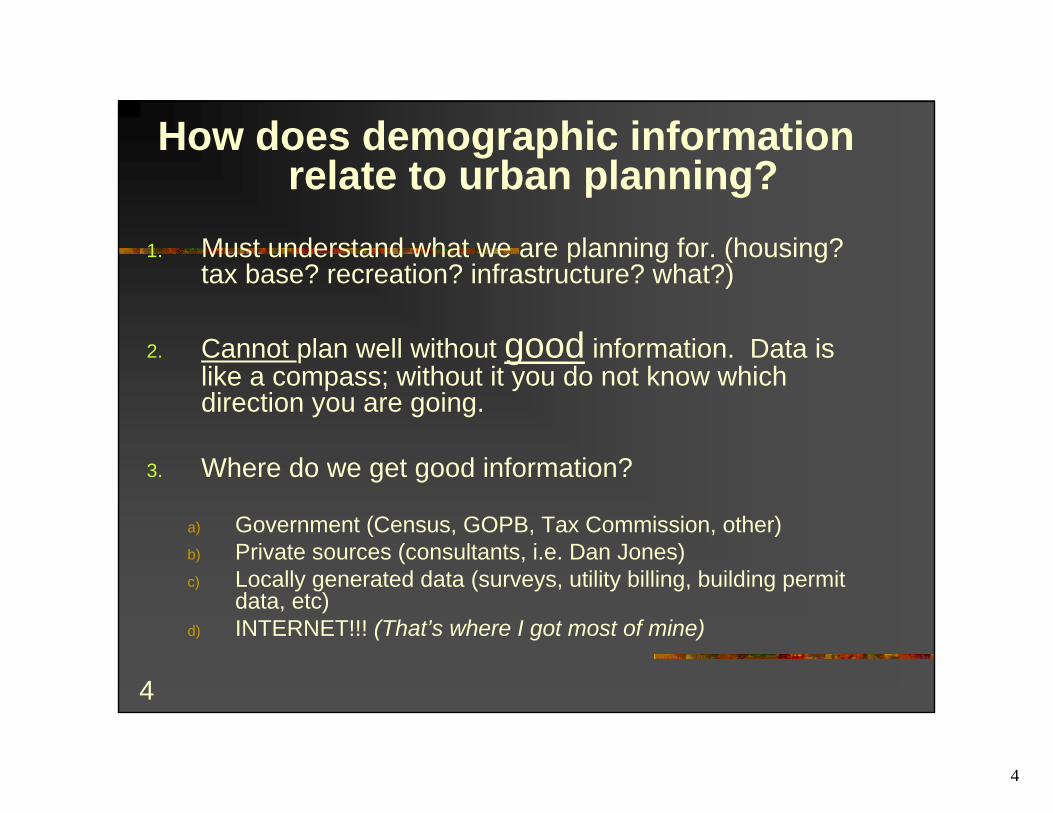
How does demographic information relate to urban planning?
1. Must understand what we are planning for. (housing? tax base? recreation? infrastructure? what?)
2. Cannot plan well without good information. Data is like a compass; without it you do not know which direction you are going.
3. Where do we get good information?
a) Government (Census, GOPB, Tax Commission, other)b) Private sources (consultants, i.e. Dan Jones)c) Locally generated data (surveys, utility billing, building permit
data, etc)d) INTERNET!!! (That’s where I got most of mine)

5
5
SO WHAT DO WE DO WITH THE DATA?
Decide what is important and what is not. (Be careful, the data may completely change your focus!!!)
Allow the data to mature in order to see how it all relates. (Don’t jump to conclusions)
Analyze it to see how it pertains to what you are trying accomplish. (Slowwww downnnn)
Using comparative data such as city v. county v. state v. nation, to make general or specific inferences is not only very useful but critical to success. (Tell your story using the data)
The results/report must be written and presented in an effective way. If not, don’t bother. (Don’t be a drone – get people excited about demographics—get them thinking)
Advocate policy based on solid facts.
6
6
CASESTUDY
(PAY ATTENTION!!!)

7
7
DAVIS COUNTYPOPULATION AND DEMOGRAPHICS
REPORT FOR 2005 AND BEYOND
Prepared by Paul Allred, Staff Planner, Davis County Department of Community &
Economic Development
May 2005

8
8
EXECUTIVE SUMMARYUtah is the ninth most urban state in the nation with more than 88% of Utahns living in urban areas
Davis County is the smallest in land area and third most populous.
Davis has 11% of Utah’s population.
Davis County current population is approximately 283,000.
Projected build out Davis County population is approximately 440,000 people. This is more than recent projections by other organizations and morethan in past studies.

9
9
EXECUTIVE SUMMARYA snapshot of Davis County v. State of Utah :
Is growing fasterIs more white Higher home ownership rateLess multiple family housing More persons per household More household income Greater educational attainment (U.S. Census, Quickfacts)
By 2035 Davis County household size will shrink about 25% and growth will slow. (U.S. Census)
After 2014, the County will keep growing but there will begin a long trend of out migration. (U.S. Census)

10
10
CURRENT POPULATION NUMBERS2005 DAVIS POPULATION ESTIMATES
282,726 – Davis County jurisdictions along with GOPB/Census (5/19/05)
276,374 – Governor’s Office of Planning and Budget Report 2005, p.23 (as of July 1, 2005)
269,061 – Staff estimate based on 2.6% annually added to 7/1/2003 estimate of 255,597.
268,916 (Utah Data Guide, Winter 2005, p. 3 and 2005 Governor’s Economic Report as reported in 2/1/05 Davis County Clipper)
11
11
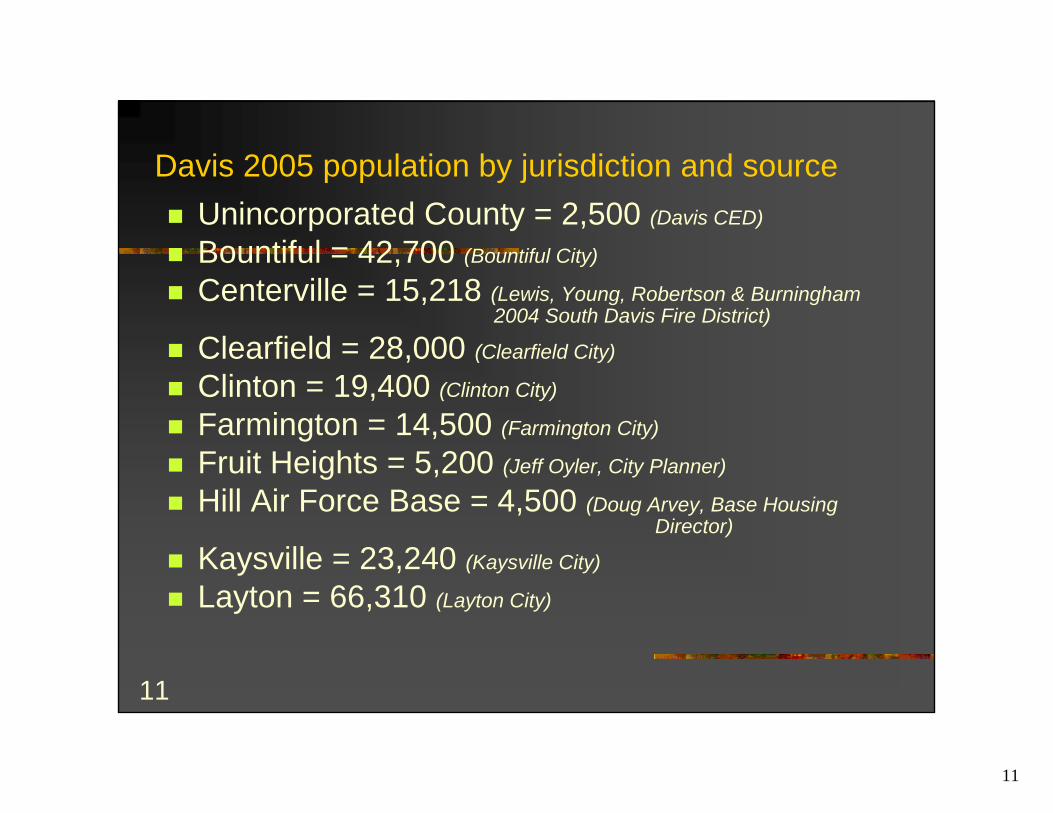
Davis 2005 population by jurisdiction and sourceUnincorporated County = 2,500 (Davis CED)
Bountiful = 42,700 (Bountiful City)
Centerville = 15,218 (Lewis, Young, Robertson & Burningham 2004 South Davis Fire District)
Clearfield = 28,000 (Clearfield City)
Clinton = 19,400 (Clinton City)
Farmington = 14,500 (Farmington City)
Fruit Heights = 5,200 (Jeff Oyler, City Planner)
Hill Air Force Base = 4,500 (Doug Arvey, Base Housing Director)
Kaysville = 23,240 (Kaysville City)
Layton = 66,310 (Layton City)

12
12
2005 population by jurisdiction and sourceNorth Salt Lake = 9,800 (LYRB 2004 South Davis Fire District Study)
South Weber = 5,945 (Barry Burton, City Planner)
Sunset = 5,200 (Sunset City)
Syracuse = 20,000 (Syracuse City)
West Point = 7,800 (LYRB 2004 South Davis Fire District Study)
West Bountiful 5,013 (LYRB 2004 South Davis Fire District Study)
Woods Cross = 7,400 (LYRB 2004 South Davis Fire District Study)
------------------------------------------------------------------Grand Total = 282,726

13
13
BUILD OUT ESTIMATE DAVIS COUNTY (2050)
439,386 – Davis County CED, May 2005
424,177 -- Source: 2005 GOPB Baseline Projections
382,289 -- Source: Davis County Vacant Land & Population Study 1990
352,431 -- Source: Davis County Vacant Lands Update June 1995

14
14
BUILD OUT ESTIMATE BY JURISDICTION & SOURCE (2050):
Unincorporated County = 2,500 (Davis CED)
Bountiful = 46,000 (Bountiful City)
Centerville = 17,877(LYRB 2004 South Davis Fire District)
Clearfield = 32,840 (Clearfield City)
Clinton = 25,043 (Clinton City)
Farmington = 25,621 (WFRC)
Fruit Heights = 8,482 (Jeff Oyler, City Planner)
HAFB = 4,500 (Doug Arvey, Base Housing Director)
Kaysville = 40,377 (Kaysville City)
Layton = 119,397 (Layton City)

15
15
BUILD OUT ESTIMATE BY JURISDICTION & SOURCE (2050)
North Salt Lake =15,000 (LYRB 2004 South Davis Fire District Study)
South Weber = 11,631 (Barry Burton, City Planner)
Sunset = 5,200 (Sunset City)
Syracuse = 38,715 (Syracuse City)
West Point = 26,099 (LYRB 2004 South Davis Fire District Study)
West Bountiful 8,122 (LYRB 2004 South Davis Fire District Study)
Woods Cross = 12,038 (LYRB 2004 South Davis Fire District Study)
---------------------------------------------------------------------GRAND TOTAL = 439,386

16
16
SELECTED CURRENT DAVIS TRENDS
Higher than state average for percentage of persons under age of 18. (35.1% v. 32.2%,) U.S. Census as quoted in Davis Clipper.
Lower than state average for persons over the age of 65. (7.3% v. 8.5%) Ibid
Higher than state average for number of “white persons”. 92.3% v. 89.2) Ibid
Davis household size is decreasing. (3.31 persons in 2000 v. 3.2 in 2003) Ibid

17
17
DAVIS CURRENT TRENDS CONT.Davis schools spend $200 less per child on education than the state average. (Mark Peterson, State Office of Education)
Increasing population density. 933 people per square mile in 2000 to 1015 people per square mile in 2004. Effective 2005 population density is 1844 persons per square mile when using only buildable lands. This increases to about 3000 when land is all used up. Tony Thompson, Davis CED
Three of the top ten fastest growing cities in Utah; Syracuse, Clinton and Woods Cross. GOPB 2005, p.34

18
18
INTERESTING UTAH FACTS & TRENDSIt is estimated that Utah will double in population by 2027 and triple by 2050.
Utah has the youngest median in the nation age at 27.5 years of age. No other state is under 30.
Utah has the largest homes (total square feet) in the nation. Utah has the largest household size at 3.06 persons compared to 2.61 nationally.
Utah has the highest car ownership (number of cars per dwelling) in the nation.
The divorce rate for Utah is higher that the national average 5.2 v. 4.7.

19
19
INTERESTING UTAH FACTS & TRENDSUtah has the highest student per teacher ratio but lowest expenditures per child in the nation.
Utah has the highest birthrate in the nation. Average number of births per woman, 2.56 children, is 27 percent higher than the national average.
Utah has the 3rd highest life expectancy at 78.6 years.

20
20
SIGNIFICANT CURRENT UTAH TRENDSUtah Income & Employment
Per capita income in Utah is only 76.6% of the national average placing it 45th out of 50 states.
Utah has the 4th highest teen labor participation
4th highest in part-time employment for men.
3rd highest for part-time employment for women and wages are only 88.2% of the national average.

21
21
Utah Income & Employment Cont.Utah has a higher than average number of women in the workforce with 62% v. 59% nationally. However, Utah women are more likely to work part-time than the national average.
Pay disparity for Utah women is the greatest in the nation with women earning only 62% of men’s wages.
Utah has the highest bankruptcy and home foreclosure rate in the nation.

22
22
FUTURE DAVIS COUNTY & UTAH TRENDS
In the future, much of Utah’s growth will occur away from the Wasatch Front.
Davis household size will drop by about 23%, or nearly one quarter, from 3.58 persons to 2.76 persons, between 1980 and 2030. Household size has dropped significantly in the last 20 years. (U.S. Census)
Utah birth rates will remain higher than the national average but will more closely resemble the overall national rate starting in the year 2010. (U.S. Census)
Davis County, along with the rest of the State of Utah will become gradually older with the median age in the State expected to rise from 27.2 to 34 by 2050. (U.S. Census)
Davis County will become much more urbanized and may eventually reach an overall population density of perhaps over 3000 personsper square mile. (449,000 people on 149 square miles of buildable land)

23
23
FUTURE DAVIS COUNTY & UTAH TRENDS
By 2050 Davis residents are projected to increase their life expectancy by about 7 years from what it is today; 82.5 for men and 88.6 for women.
Utahns will live about one year longer than the U.S. average. Utah currently ranks third nationally in this category. (U.S. Census)
By 2050 the number of person of retirement age will more than double from 8.5% to 17.8%. (U.S. Census)
Utah currently has the highest dependency ratio (59.8%) in the nation. This means that Utah has the smallest share of its population in the work force. This trend will continue is projected to get even worse in the future. (2005 Economic Report to the Governor, Census)

24
24
NOW WHAT?How are we planning for an adequate and affordable housing supply for the elderly (65+) in the future?
A decreasing household size and continued high dependency rate may result in a huge impact on schools with declining enrollment county-wide as well as a high degree of financial stress for Davis households. What will the impact be on our school system, tax base and on our families of these two trends?
As the County becomes more densely urbanized, where will we recreate? And what are we doing now and long range to preserve passive open space, trails, farms and other valuable lands in our County?

25
25
NOW WHAT? cont.Many Davis women work outside the home with the
greatest pay disparity in the nation. What are we doing to provide more higher paying jobs, especially for women? Is there anything we can do?
Presently, Davis County experiences about a 25% net loss of its workforce outside the County each day. (45% leave and about 20% come in from other counties) What, if any, plans do we have or should we have to reverse this trend and create more jobs here at home?

26
26
NOW WHAT? Cont.Are there plans to coordinate on a regional/county-wide basis, economic development and land use planning as recommended by Kent Sulser, Davis County Economic Development Director?
What are we doing now to assure that energy, transportation and water needs will be met when build out occurs?

27
27
CONCLUSION
ARE YOU GETTING THE “BIG PICTURE”?Understanding demographic information is essential to understanding the world around you.
The business world and government sector make most of their plans based on sound understanding of demographic trends. (Try to think of major decisions that would not include careful consideration of demographics.)
How will you incorporate concepts regarding demographics you have learned today into your future career plans?