PEOPLE, HOUSING AND JOBS Demographics Chapter of the ...
14
PEOPLE, HOUSING AND JOBS Demographics Chapter of the City’s Comprehensive Plan DRAFT
-
Upload
khangminh22 -
Category
Documents
-
view
1 -
download
0
Transcript of PEOPLE, HOUSING AND JOBS Demographics Chapter of the ...
PEOPLE, HOUSING AND JOBS
Demographics Chapter of the
City’s Comprehensive Plan
DRAFT
sschaffer
Text Box
Attachment 1
Attachment 1 - Demographics Chapter - DRAFT v6.docx Page 1 of 14
People, Housing and Jobs: Why
Demographics Matter for the City of Falls
Church’s Comprehensive Plan The City of Falls Church is a community of nearly 14,000 residents
and 12,000 jobs occupying 2.1 square miles in the heart of
Northern Virginia. Understanding how the population and
employment base in the City has evolved and will continue to
change is necessary so that the community can effectively plan for
the future and achieve its vision as a “welcoming and inclusive
community” and a “leader in education, environmental
sustainability, multi-modal transportation, and vibrant economic
development.”
Demographics involves more than just data. Analyzing demographic
trends and forecasts helps form the framework for understanding
how different parts of the community are interrelated. For
example, knowing how the demographic characteristics of
residents have changed is important for knowing the types of
services and amenities that are needed in the City. Assessing the
relationship between new residential development and new retail
and commercial development is critical for meeting economic
development goals. And evaluating changing housing needs is an
important consideration for ensuring that the City of Falls Church
pursues inclusive housing policies.
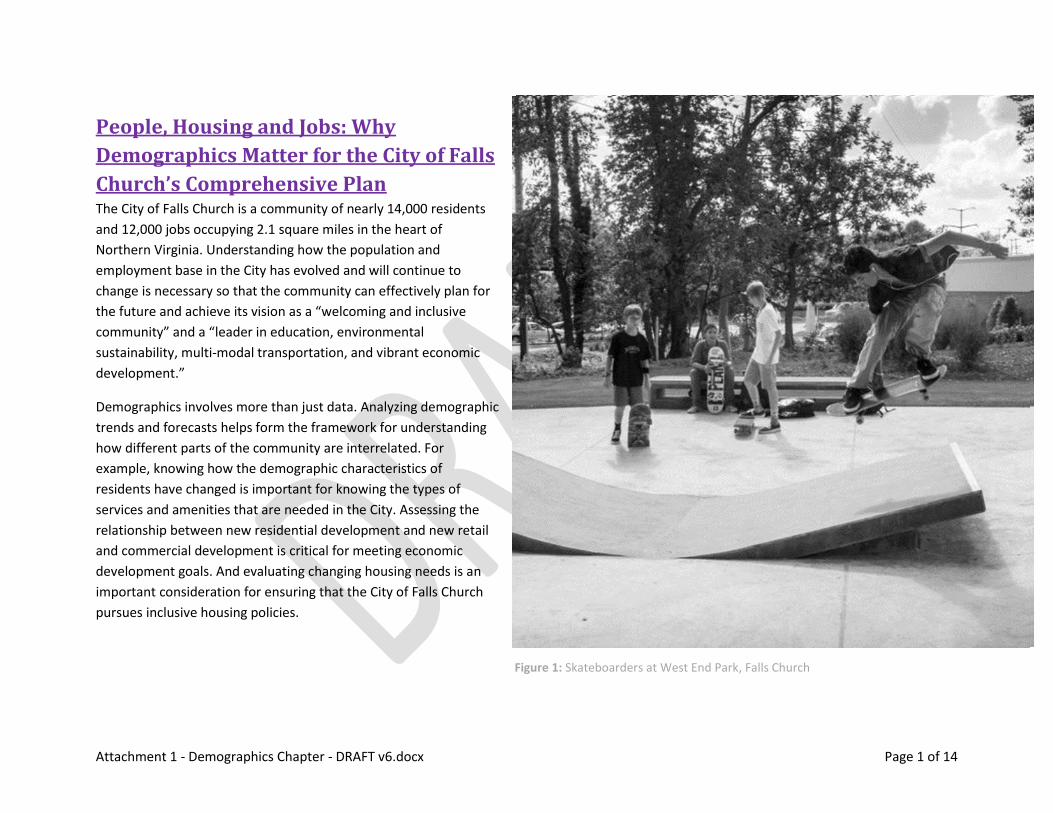
Figure 1: Skateboarders at West End Park, Falls Church
c
Attachment 1 - Demographics Chapter - DRAFT v6.docx Page 2 of 14
Demographic Trends The demographic landscape of the City of Falls Church is changing.
Part of these demographic changes reflect broader macro
demographic trends in the country and the rest of the Northern
Virginia region. There are also trends that distinguish the Little City
from its neighbors. Demographic changes in the City will have
important implications for future population growth, as well as for
local policies related to housing, public services and facilities, and
economic development.
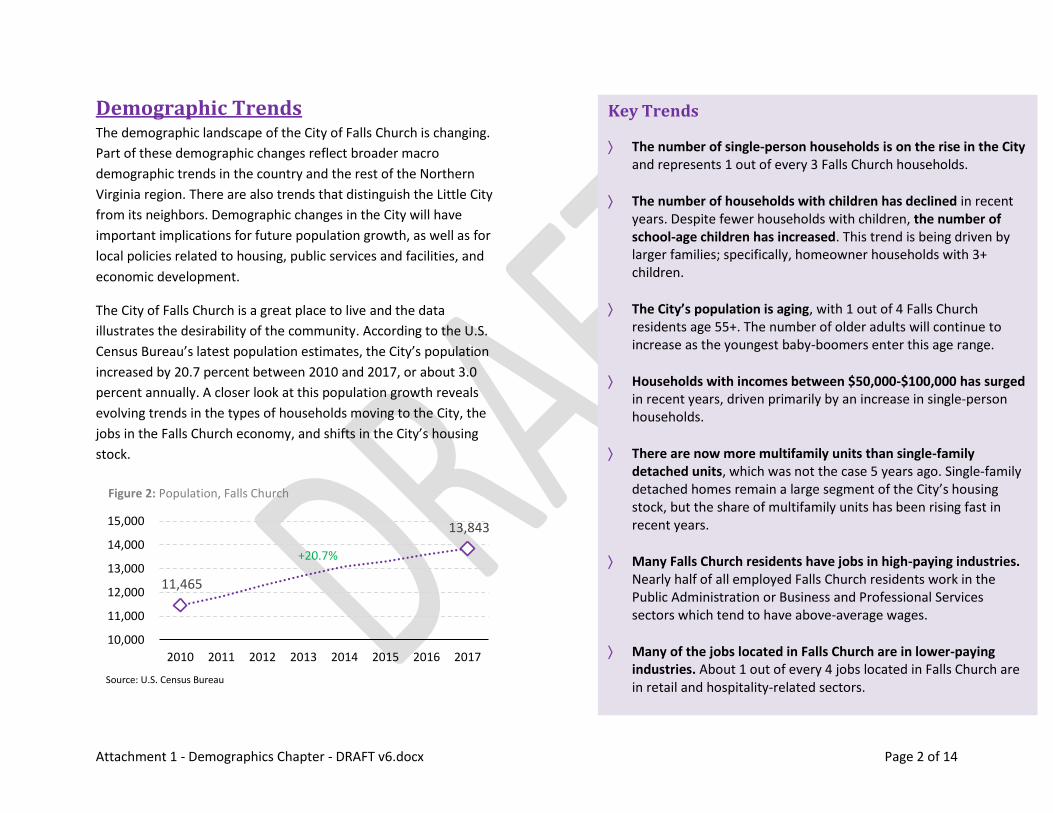
The City of Falls Church is a great place to live and the data
illustrates the desirability of the community. According to the U.S.
Census Bureau’s latest population estimates, the City’s population
increased by 20.7 percent between 2010 and 2017, or about 3.0
percent annually. A closer look at this population growth reveals
evolving trends in the types of households moving to the City, the
jobs in the Falls Church economy, and shifts in the City’s housing
stock.
11,465
13,843
10,000
11,000
12,000
13,000
14,000
15,000
2010 2011 2012 2013 2014 2015 2016 2017
Key Trends
The number of single-person households is on the rise in the City and represents 1 out of every 3 Falls Church households.
The number of households with children has declined in recent years. Despite fewer households with children, the number of school-age children has increased. This trend is being driven by larger families; specifically, homeowner households with 3+ children.
The City’s population is aging, with 1 out of 4 Falls Church residents age 55+. The number of older adults will continue to increase as the youngest baby-boomers enter this age range.
Households with incomes between $50,000-$100,000 has surged in recent years, driven primarily by an increase in single-person households.
There are now more multifamily units than single-family detached units, which was not the case 5 years ago. Single-family detached homes remain a large segment of the City’s housing stock, but the share of multifamily units has been rising fast in recent years.
Many Falls Church residents have jobs in high-paying industries. Nearly half of all employed Falls Church residents work in the Public Administration or Business and Professional Services sectors which tend to have above-average wages.
Many of the jobs located in Falls Church are in lower-paying industries. About 1 out of every 4 jobs located in Falls Church are in retail and hospitality-related sectors.
+20.7%
Figure 2: Population, Falls Church
Source: U.S. Census Bureau
Attachment 1 - Demographics Chapter - DRAFT v6.docx Page 3 of 14
Population Trends This section examines three key population segments of City
residents: Millennials (age 25 to 34), school-age children (age 5 to
17) and older adults (age 55+).
Millennials (age 25 to 34): The young adult population is a growing
share of the City’s population. There were approximately 1,740
people between the ages of 25 and 34 living in Falls Church in 2016.
The number of Falls Church residents in this age group has
increased by about 9.7% over 5 years. The growth rate of the young
adult population in Falls Church is similar to other inside-the-
Beltway communities such as Arlington and West Falls Church,
which had increases in the young adult population of 10.1% and
9.2%, respectively, during the same 5-year time period. Overall, the
Northern Virginia region* experienced a 6.2% increase in this age
segment between 2011 and 2016.
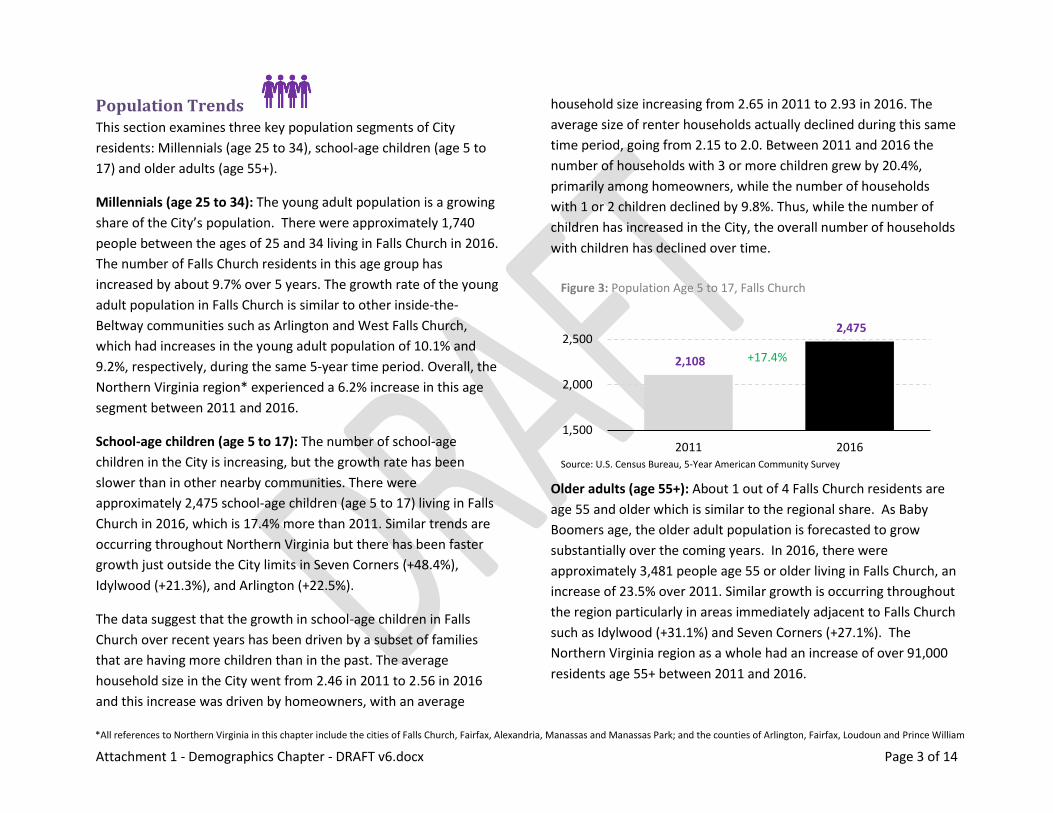
School-age children (age 5 to 17): The number of school-age
children in the City is increasing, but the growth rate has been
slower than in other nearby communities. There were
approximately 2,475 school-age children (age 5 to 17) living in Falls
Church in 2016, which is 17.4% more than 2011. Similar trends are
occurring throughout Northern Virginia but there has been faster
growth just outside the City limits in Seven Corners (+48.4%),
Idylwood (+21.3%), and Arlington (+22.5%).
The data suggest that the growth in school-age children in Falls
Church over recent years has been driven by a subset of families
that are having more children than in the past. The average
household size in the City went from 2.46 in 2011 to 2.56 in 2016
and this increase was driven by homeowners, with an average
household size increasing from 2.65 in 2011 to 2.93 in 2016. The
average size of renter households actually declined during this same
time period, going from 2.15 to 2.0. Between 2011 and 2016 the
number of households with 3 or more children grew by 20.4%,
primarily among homeowners, while the number of households
with 1 or 2 children declined by 9.8%. Thus, while the number of
children has increased in the City, the overall number of households
with children has declined over time.
Older adults (age 55+): About 1 out of 4 Falls Church residents are
age 55 and older which is similar to the regional share. As Baby
Boomers age, the older adult population is forecasted to grow
substantially over the coming years. In 2016, there were
approximately 3,481 people age 55 or older living in Falls Church, an
increase of 23.5% over 2011. Similar growth is occurring throughout
the region particularly in areas immediately adjacent to Falls Church
such as Idylwood (+31.1%) and Seven Corners (+27.1%). The
Northern Virginia region as a whole had an increase of over 91,000
residents age 55+ between 2011 and 2016.
2,108
2,475
1,500
2,000
2,500
2011 2016
+17.4%
Figure 3: Population Age 5 to 17, Falls Church
Source: U.S. Census Bureau, 5-Year American Community Survey
*All references to Northern Virginia in this chapter include the cities of Falls Church, Fairfax, Alexandria, Manassas and Manassas Park; and the counties of Arlington, Fairfax, Loudoun and Prince William
Attachment 1 - Demographics Chapter - DRAFT v6.docx Page 4 of 14
Household Trends This section assesses how the household composition in the City of
Falls Church has changed and evaluates the types of households
that have primarily driven growth in the City in recent years. This
section concludes with a review of the mix of housing units in the
City.
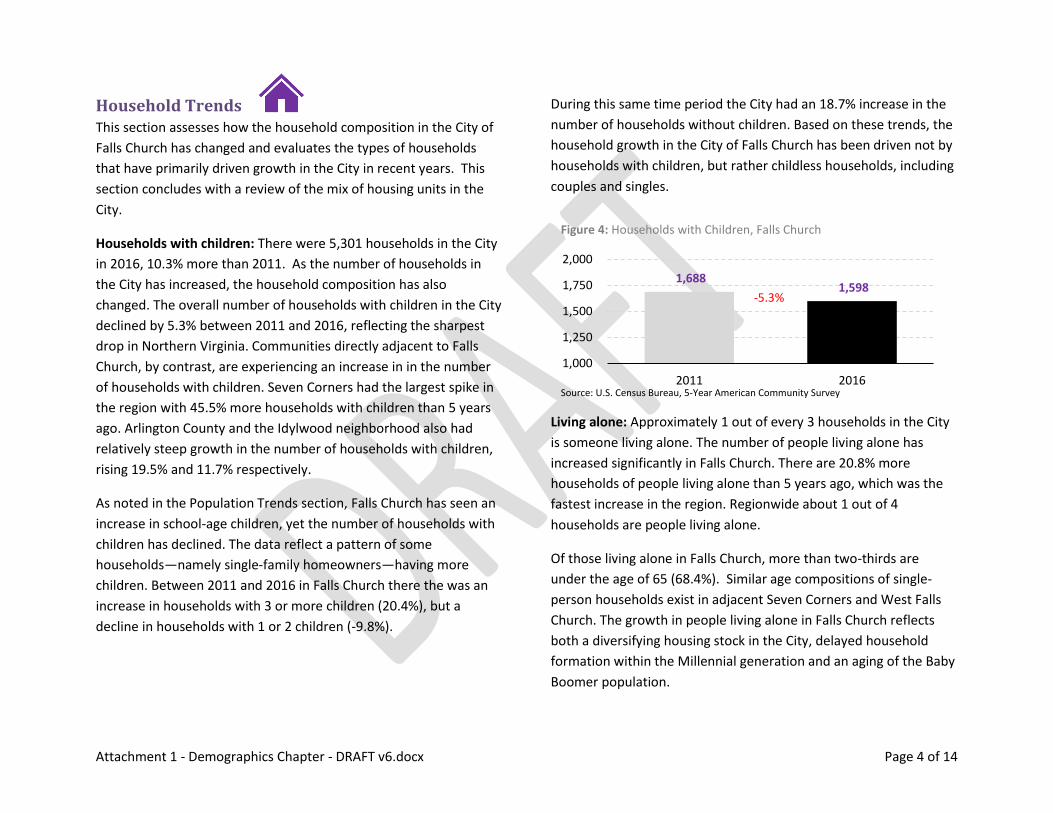
Households with children: There were 5,301 households in the City
in 2016, 10.3% more than 2011. As the number of households in
the City has increased, the household composition has also
changed. The overall number of households with children in the City
declined by 5.3% between 2011 and 2016, reflecting the sharpest
drop in Northern Virginia. Communities directly adjacent to Falls
Church, by contrast, are experiencing an increase in in the number
of households with children. Seven Corners had the largest spike in
the region with 45.5% more households with children than 5 years
ago. Arlington County and the Idylwood neighborhood also had
relatively steep growth in the number of households with children,
rising 19.5% and 11.7% respectively.
As noted in the Population Trends section, Falls Church has seen an
increase in school-age children, yet the number of households with
children has declined. The data reflect a pattern of some
households—namely single-family homeowners—having more
children. Between 2011 and 2016 in Falls Church there the was an
increase in households with 3 or more children (20.4%), but a
decline in households with 1 or 2 children (-9.8%).
During this same time period the City had an 18.7% increase in the
number of households without children. Based on these trends, the
household growth in the City of Falls Church has been driven not by
households with children, but rather childless households, including
couples and singles.
Living alone: Approximately 1 out of every 3 households in the City
is someone living alone. The number of people living alone has
increased significantly in Falls Church. There are 20.8% more
households of people living alone than 5 years ago, which was the
fastest increase in the region. Regionwide about 1 out of 4
households are people living alone.
Of those living alone in Falls Church, more than two-thirds are
under the age of 65 (68.4%). Similar age compositions of single-
person households exist in adjacent Seven Corners and West Falls
Church. The growth in people living alone in Falls Church reflects
both a diversifying housing stock in the City, delayed household
formation within the Millennial generation and an aging of the Baby
Boomer population.
1,688 1,598
1,000
1,250
1,500
1,750
2,000
2011 2016
-5.3%
Figure 4: Households with Children, Falls Church
Source: U.S. Census Bureau, 5-Year American Community Survey
Attachment 1 - Demographics Chapter - DRAFT v6.docx Page 5 of 14
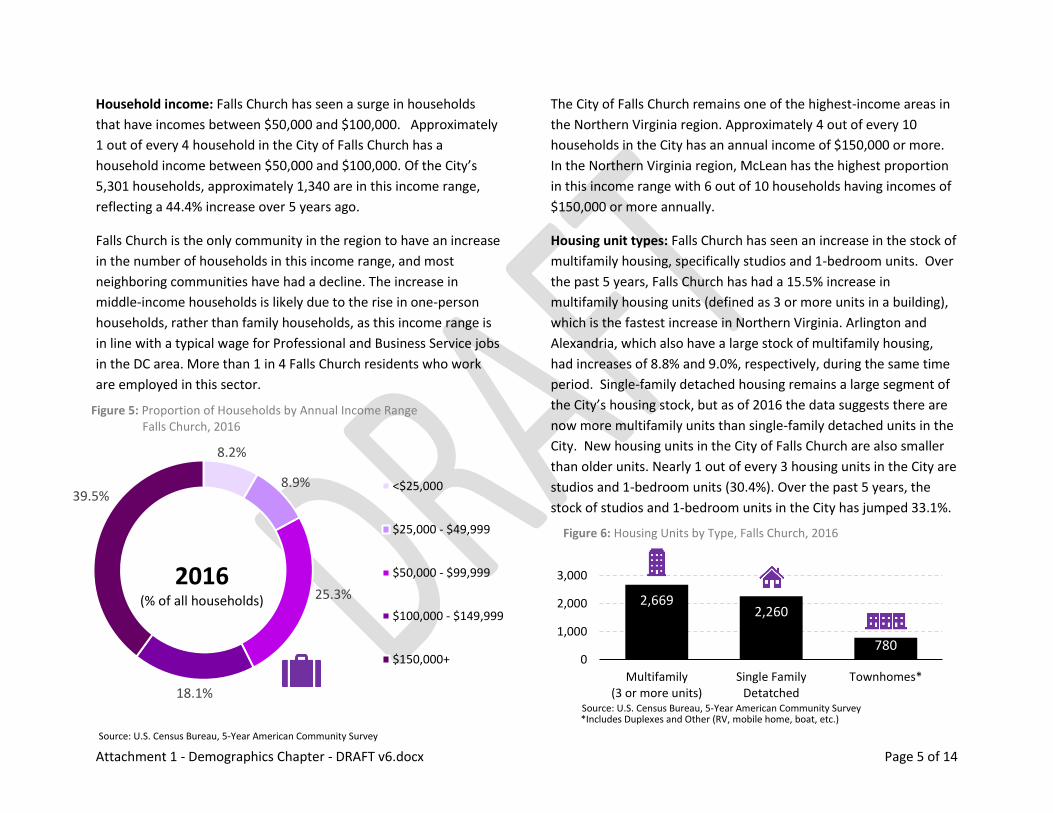
Household income: Falls Church has seen a surge in households
that have incomes between $50,000 and $100,000. Approximately
1 out of every 4 household in the City of Falls Church has a
household income between $50,000 and $100,000. Of the City’s
5,301 households, approximately 1,340 are in this income range,
reflecting a 44.4% increase over 5 years ago.
Falls Church is the only community in the region to have an increase
in the number of households in this income range, and most
neighboring communities have had a decline. The increase in
middle-income households is likely due to the rise in one-person
households, rather than family households, as this income range is
in line with a typical wage for Professional and Business Service jobs
in the DC area. More than 1 in 4 Falls Church residents who work
are employed in this sector.
The City of Falls Church remains one of the highest-income areas in
the Northern Virginia region. Approximately 4 out of every 10
households in the City has an annual income of $150,000 or more.
In the Northern Virginia region, McLean has the highest proportion
in this income range with 6 out of 10 households having incomes of
$150,000 or more annually.
Housing unit types: Falls Church has seen an increase in the stock of
multifamily housing, specifically studios and 1-bedroom units. Over
the past 5 years, Falls Church has had a 15.5% increase in
multifamily housing units (defined as 3 or more units in a building),
which is the fastest increase in Northern Virginia. Arlington and
Alexandria, which also have a large stock of multifamily housing,
had increases of 8.8% and 9.0%, respectively, during the same time
period. Single-family detached housing remains a large segment of
the City’s housing stock, but as of 2016 the data suggests there are
now more multifamily units than single-family detached units in the
City. New housing units in the City of Falls Church are also smaller
than older units. Nearly 1 out of every 3 housing units in the City are
studios and 1-bedroom units (30.4%). Over the past 5 years, the
stock of studios and 1-bedroom units in the City has jumped 33.1%.
8.2%
8.9%
25.3%
18.1%
39.5% <$25,000
$25,000 - $49,999
$50,000 - $99,999
$100,000 - $149,999
$150,000+
2,669 2,260
780 0
1,000
2,000
3,000
Multifamily(3 or more units)
Single FamilyDetatched
Townhomes*
Figure 5: Proportion of Households by Annual Income Range Falls Church, 2016
Source: U.S. Census Bureau, 5-Year American Community Survey
Source: U.S. Census Bureau, 5-Year American Community Survey
*Includes Duplexes and Other (RV, mobile home, boat, etc.)
Figure 6: Housing Units by Type, Falls Church, 2016
2016 (% of all households)
Attachment 1 - Demographics Chapter - DRAFT v6.docx Page 6 of 14
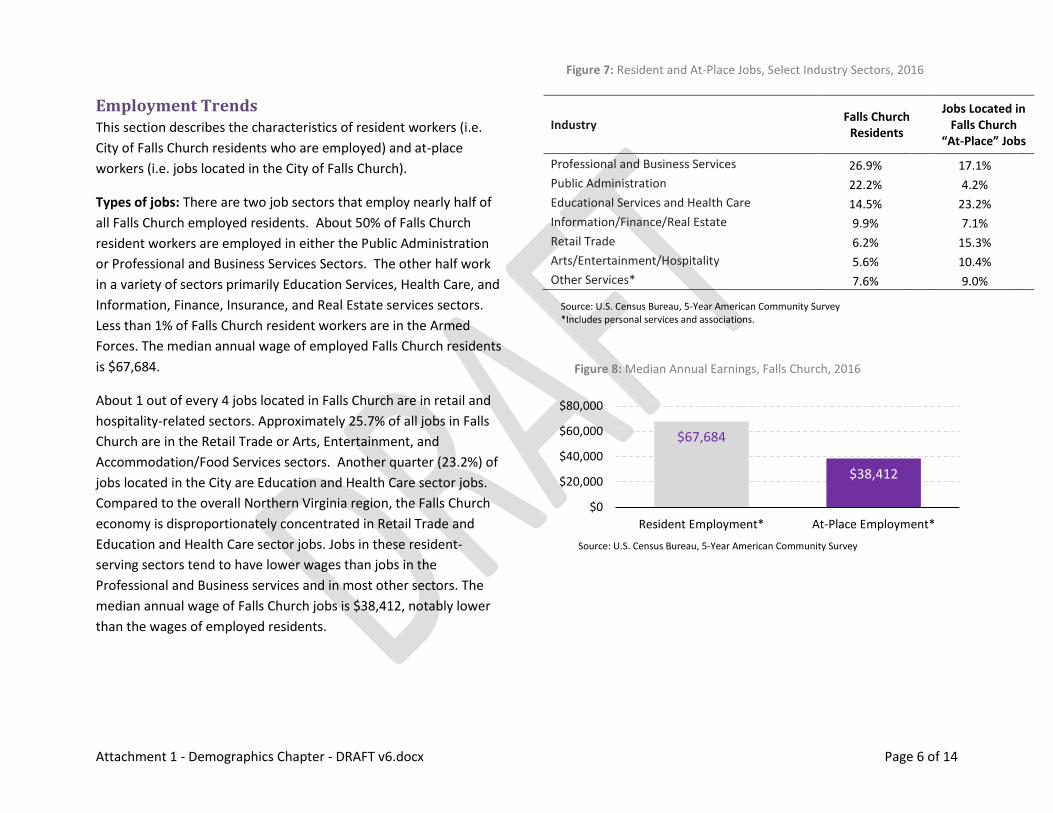
Employment Trends This section describes the characteristics of resident workers (i.e.
City of Falls Church residents who are employed) and at-place
workers (i.e. jobs located in the City of Falls Church).
Types of jobs: There are two job sectors that employ nearly half of
all Falls Church employed residents. About 50% of Falls Church
resident workers are employed in either the Public Administration
or Professional and Business Services Sectors. The other half work
in a variety of sectors primarily Education Services, Health Care, and
Information, Finance, Insurance, and Real Estate services sectors.
Less than 1% of Falls Church resident workers are in the Armed
Forces. The median annual wage of employed Falls Church residents
is $67,684.
About 1 out of every 4 jobs located in Falls Church are in retail and
hospitality-related sectors. Approximately 25.7% of all jobs in Falls
Church are in the Retail Trade or Arts, Entertainment, and
Accommodation/Food Services sectors. Another quarter (23.2%) of
jobs located in the City are Education and Health Care sector jobs.
Compared to the overall Northern Virginia region, the Falls Church
economy is disproportionately concentrated in Retail Trade and
Education and Health Care sector jobs. Jobs in these resident-
serving sectors tend to have lower wages than jobs in the
Professional and Business services and in most other sectors. The
median annual wage of Falls Church jobs is $38,412, notably lower
than the wages of employed residents.
Industry Falls Church
Residents
Jobs Located in Falls Church
“At-Place” Jobs
Professional and Business Services 26.9%
17.1%
Public Administration 22.2%
4.2%
Educational Services and Health Care 14.5%
23.2%
Information/Finance/Real Estate 9.9%
7.1%
Retail Trade 6.2%
15.3%
Arts/Entertainment/Hospitality 5.6%
10.4%
Other Services* 7.6% 9.0%
$67,684
$38,412
$0
$20,000
$40,000
$60,000
$80,000
Resident Employment* At-Place Employment*
Figure 8: Median Annual Earnings, Falls Church, 2016
Source: U.S. Census Bureau, 5-Year American Community Survey
Figure 7: Resident and At-Place Jobs, Select Industry Sectors, 2016
Source: U.S. Census Bureau, 5-Year American Community Survey *Includes personal services and associations.
Attachment 1 - Demographics Chapter - DRAFT v6.docx Page 7 of 14
Forecasts Forecasts of housing units, households, population and employment
for in the City were prepared for the 2015 through 2045 time
period. The purpose of developing these forecasts is to provide
information to help City staff, elected officials and citizens plan for
future growth in the City. In particular, these forecasts will help
guide community conversations around the implications of growth
on key issues for the City.
Methodology Forecasts were developed based on projections of net new
development in the City and assumptions about trends in vacancy
rates, average household sizes and commercial space per employee
(i.e. “development-based projections”.) This development-based
method historically has been used by the City of Falls Church to
produce forecasts for the Metropolitan Washington Council of
Governments (MWCOG) cooperative forecasting process. There are
other methods for forecasting population, household and job
growth in the City, and results from alternative methods are
compared with the development-based approach.
The City’s growth and change is happening in the context of broader
economic and demographic change in Northern Virginia and the
Washington DC region. As a relatively small community in a large
regional economy and housing market, the City will be impacted by
changes in job growth, transportation investments and housing
demand which are outside of local control. These macro trends,
along with the factors unique to the City, will be key drivers of
future population, household and job growth. Planning efforts will
reflect these trends in order to best ensure that the City meets its
vision.
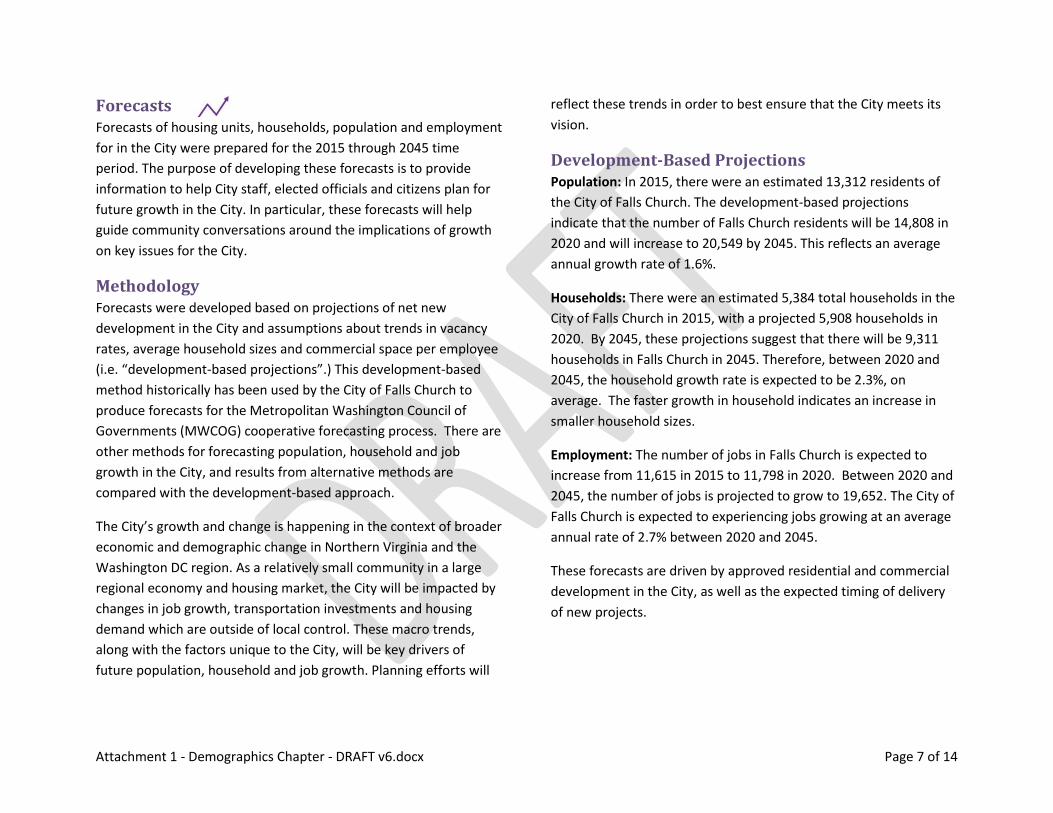
Development-Based Projections Population: In 2015, there were an estimated 13,312 residents of
the City of Falls Church. The development-based projections
indicate that the number of Falls Church residents will be 14,808 in
2020 and will increase to 20,549 by 2045. This reflects an average
annual growth rate of 1.6%.
Households: There were an estimated 5,384 total households in the
City of Falls Church in 2015, with a projected 5,908 households in
2020. By 2045, these projections suggest that there will be 9,311
households in Falls Church in 2045. Therefore, between 2020 and
2045, the household growth rate is expected to be 2.3%, on
average. The faster growth in household indicates an increase in
smaller household sizes.
Employment: The number of jobs in Falls Church is expected to
increase from 11,615 in 2015 to 11,798 in 2020. Between 2020 and
2045, the number of jobs is projected to grow to 19,652. The City of
Falls Church is expected to experiencing jobs growing at an average
annual rate of 2.7% between 2020 and 2045.
These forecasts are driven by approved residential and commercial
development in the City, as well as the expected timing of delivery
of new projects.
Attachment 1 - Demographics Chapter - DRAFT v6.docx Page 8 of 14
Comparisons with Other Forecasts The Weldon Cooper Center at the University of Virginia produces
population forecasts for all local jurisdictions in the Commonwealth
of Virginia. In addition, the Weldon Cooper Center prepares school
enrollment projections for the City of Falls Church Public Schools.
These population projections are based on the Hamilton-Perry
method which looks at long-term demographic trends and
benchmarks local growth to state-level growth.
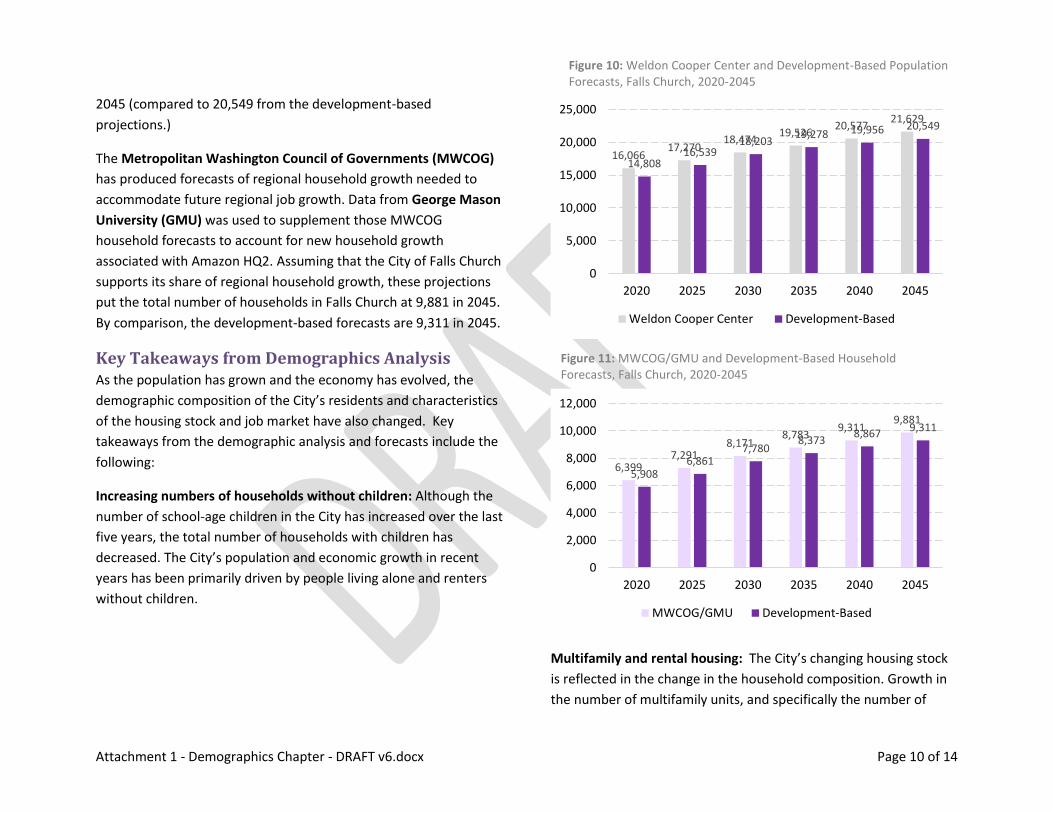
The forecasts from the Weldon Cooper Center are similar to the
development-based forecasts. The Weldon Cooper Center forecasts
that the population of the City of Falls Church will reach 21,629 by
Figure 9: Development-Based Forecasts, Falls Church 2015 - 2045
Attachment 1 - Demographics Chapter - DRAFT v6.docx Page 10 of 14
2045 (compared to 20,549 from the development-based
projections.)
The Metropolitan Washington Council of Governments (MWCOG)
has produced forecasts of regional household growth needed to
accommodate future regional job growth. Data from George Mason
University (GMU) was used to supplement those MWCOG
household forecasts to account for new household growth
associated with Amazon HQ2. Assuming that the City of Falls Church
supports its share of regional household growth, these projections
put the total number of households in Falls Church at 9,881 in 2045.
By comparison, the development-based forecasts are 9,311 in 2045.
Key Takeaways from Demographics Analysis As the population has grown and the economy has evolved, the
demographic composition of the City’s residents and characteristics
of the housing stock and job market have also changed. Key
takeaways from the demographic analysis and forecasts include the
following:
Increasing numbers of households without children: Although the
number of school-age children in the City has increased over the last
five years, the total number of households with children has
decreased. The City’s population and economic growth in recent
years has been primarily driven by people living alone and renters
without children.
Multifamily and rental housing: The City’s changing housing stock
is reflected in the change in the household composition. Growth in
the number of multifamily units, and specifically the number of
16,066 17,270
18,474 19,526
20,577 21,629
14,808 16,539
18,203 19,278 19,956 20,549
0
5,000
10,000
15,000
20,000
25,000
2020 2025 2030 2035 2040 2045
Weldon Cooper Center Development-Based
6,399 7,291
8,171 8,783
9,311 9,881
5,908 6,861
7,780 8,373
8,867 9,311
0
2,000
4,000
6,000
8,000
10,000
12,000
2020 2025 2030 2035 2040 2045
MWCOG/GMU Development-Based
Figure 11: MWCOG/GMU and Development-Based Household Forecasts, Falls Church, 2020-2045
Figure 10: Weldon Cooper Center and Development-Based Population Forecasts, Falls Church, 2020-2045
Attachment 1 - Demographics Chapter - DRAFT v6.docx Page 11 of 14
studio and one-bedroom units, is the reason that childless
households have been a key driver of growth in the City. New
multifamily and rental housing has helped shaped the development
of the City.
Aging population: The 55 and older age cohort is the largest in the
City and it continues to grow rapidly. As Baby Boomers continue to
age into this range, this trend is likely to continue in the years to
come, both locally and beyond. This has implications for the types
of housing and types of jobs that will be needed in the future to
support Falls Church residents who are interested in aging in place.
Jobs and workforce: The City has a disproportionately high share of
jobs in resident-serving industries including Retail Trade and
Education and Health Services. City residents, however, are much
more likely to be employed in Public Administration or
Professional/Technical Services jobs.
Future growth: The City of Falls Church is projected to experience
steady population and job growth over the next 25 years. The
number of households is expected to grow at a faster rate than the
population, reflecting smaller household sizes. By 2045, the number
of jobs in the City of Falls Church will approximately equal the
number of residents, a balance not seen in other communities of
Falls Church’s size. This balance between residents and jobs
presents the City will opportunities to diversify its tax base, expand
services and sustain the high-quality of life enjoyed by residents and
workers.
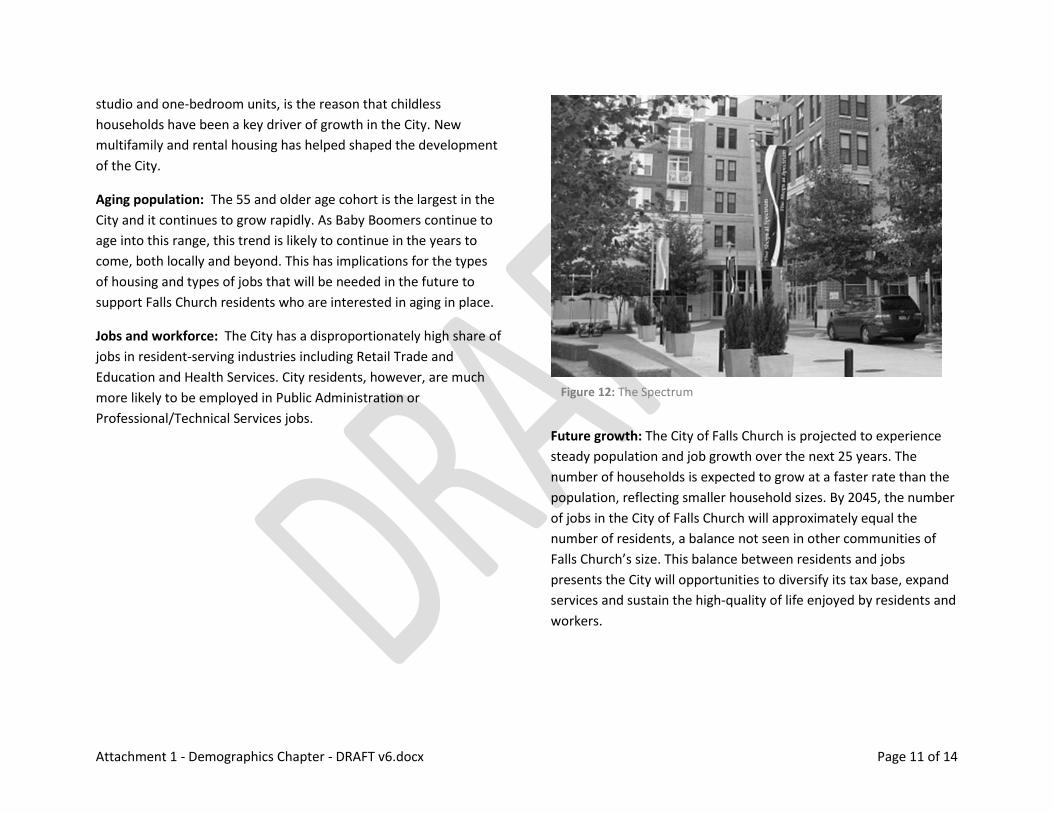
Figure 12: The Spectrum
Attachment 1 - Demographics Chapter - DRAFT v6.docx Page 12 of 14
Connections & Strategies Demographics should not be thought of simply as data, but rather
as information for planning and decision-making. The demographic
characteristics, trends and forecasts presented in this chapter are
designed to inform future planning efforts for the City of Falls
Church.
The Vision for the City of Falls Church includes a commitment to
building an inclusive and sustainable community. The following
paragraphs explore topics of general community interest and
suggest ways to inform those conversations with demographic
projections.
Housing Supply and Growth Management As described in the trends and forecasts earlier, demand for housing
in the city is influenced by regional economic trends. Based on a
regional assessment of housing needs, which includes added
housing demand as a result of Amazon HQ2 locating in Crystal City,
it is expected that the City of Falls Church would need to add 3,482
net new households between 2020 and 2045 to meet its share of
expected housing demand. According to the development-based
forecasts, the City of Falls Church is expected to add 3,403 new net
households between 2020 and 2045.
Strategy: Continue to utilize the Comprehensive Plan and Zoning
Ordinance as growth management tools, guiding development to
the most appropriate areas of the City.
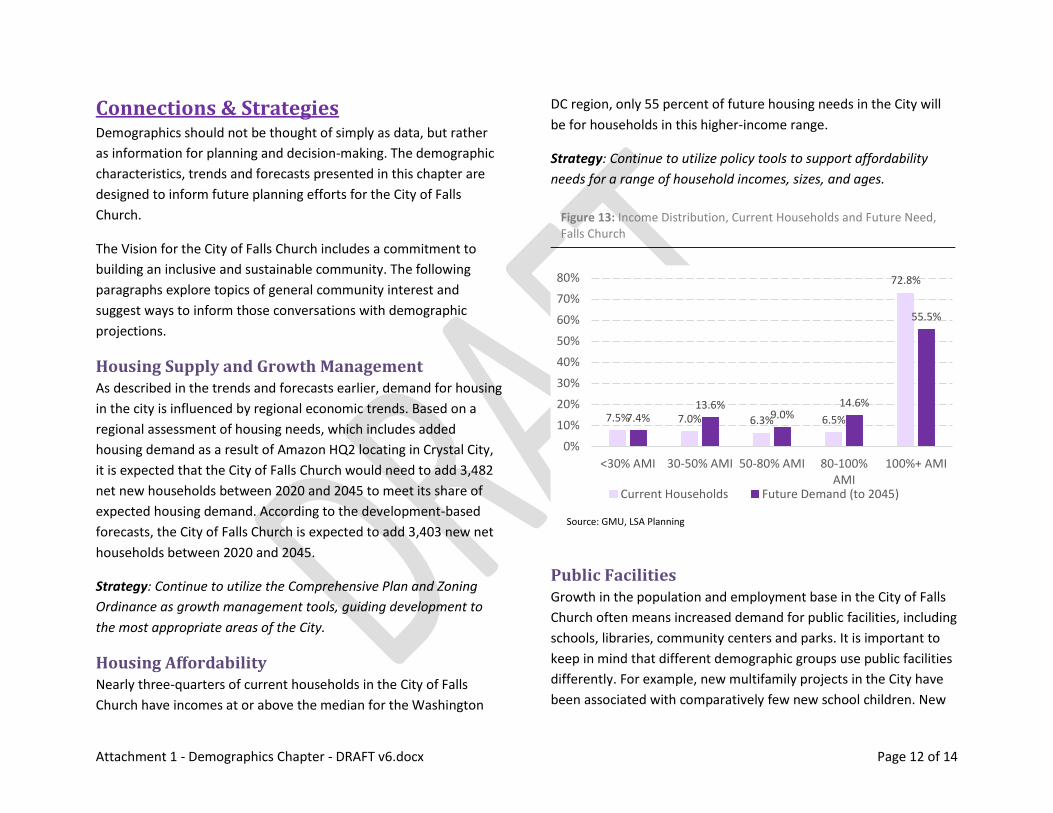
Housing Affordability Nearly three-quarters of current households in the City of Falls
Church have incomes at or above the median for the Washington
DC region, only 55 percent of future housing needs in the City will
be for households in this higher-income range.
Strategy: Continue to utilize policy tools to support affordability
needs for a range of household incomes, sizes, and ages.
Public Facilities Growth in the population and employment base in the City of Falls
Church often means increased demand for public facilities, including
schools, libraries, community centers and parks. It is important to
keep in mind that different demographic groups use public facilities
differently. For example, new multifamily projects in the City have
been associated with comparatively few new school children. New
7.5% 7.0% 6.3% 6.5%
72.8%
7.4% 13.6%
9.0% 14.6%
55.5%
0%
10%
20%
30%
40%
50%
60%
70%
80%
<30% AMI 30-50% AMI 50-80% AMI 80-100%AMI
100%+ AMI
Current Households Future Demand (to 2045)
Figure 13: Income Distribution, Current Households and Future Need, Falls Church
Source: GMU, LSA Planning
Attachment 1 - Demographics Chapter - DRAFT v6.docx Page 13 of 14
(i.e. post-2014) mixed-use apartment buildings have a “pupil
attraction rate” of between 0.104 and 0.190 students per new unit.
By comparison, older low-rise apartments tended to have higher
pupil attraction rates (between 0.30 and 0.458 children per unit).
Existing single-family homes generate more school children on a
per-unit basis. Between 2014 and 2018, the number of school
children in single-family homes increased by 77 while the number of
single-family homes increased by just 15.
Strategy: Continue to assess projected public facility impacts and
needs based using segmented household characteristics (e.g.
housing tenure, number of bedrooms, etc.)
Strategy: When designing public facilities, plan for both the needs of
the current population and the anticipated needs of future
populations throughout the useful life of the investment.
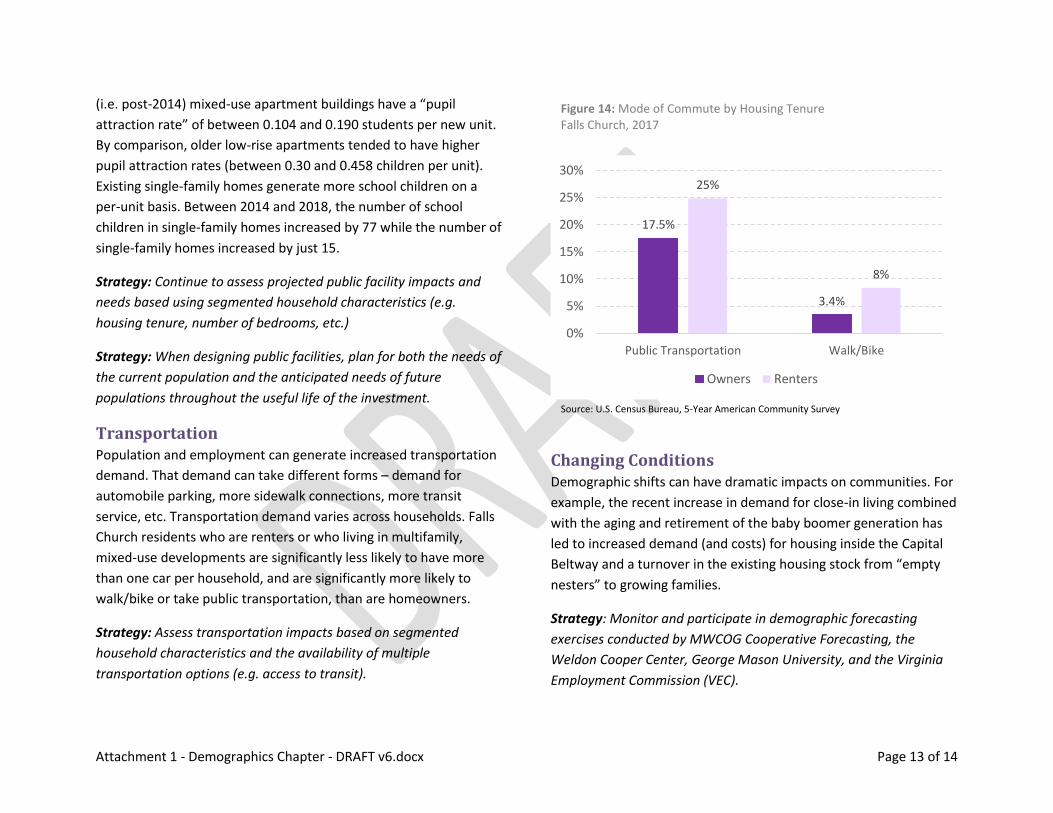
Transportation Population and employment can generate increased transportation
demand. That demand can take different forms – demand for
automobile parking, more sidewalk connections, more transit
service, etc. Transportation demand varies across households. Falls
Church residents who are renters or who living in multifamily,
mixed-use developments are significantly less likely to have more
than one car per household, and are significantly more likely to
walk/bike or take public transportation, than are homeowners.
Strategy: Assess transportation impacts based on segmented
household characteristics and the availability of multiple
transportation options (e.g. access to transit).
Changing Conditions Demographic shifts can have dramatic impacts on communities. For
example, the recent increase in demand for close-in living combined
with the aging and retirement of the baby boomer generation has
led to increased demand (and costs) for housing inside the Capital
Beltway and a turnover in the existing housing stock from “empty
nesters” to growing families.
Strategy: Monitor and participate in demographic forecasting
exercises conducted by MWCOG Cooperative Forecasting, the
Weldon Cooper Center, George Mason University, and the Virginia
Employment Commission (VEC).
17.5%
3.4%
25%
8%
0%
5%
10%
15%
20%
25%
30%
Public Transportation Walk/Bike
Owners Renters
Figure 14: Mode of Commute by Housing Tenure Falls Church, 2017
Source: U.S. Census Bureau, 5-Year American Community Survey
Attachment 1 - Demographics Chapter - DRAFT v6.docx Page 14 of 14
Strategy: Update the City’s demographic projections at least once
every five years to maintain up-to-date baseline data to inform
development decisions and initiatives.