
Global Integration in Primary Equity Markets: The Role of U.S. Banks and U.S. Investors

.
972
ASSOCIATION BETWEEN ASIAN EQUITY MARKETS AND WESTERN
MARKETS: EVIDENCE FROM THE INDEXES OF EQUITY MARKETS
Jeffrey E. JARRETT 1
Alina F. KLEIN 2
Eric KYPER 3
ABSTRACT
This research examined the time series characteristics of stock price indices for Hong Kong,
Tokyo, New York (NYSE) and London (FTSE) equity markets or stock exchanges during the period
of 1991 to 2012. Specifically, we calculate the rate of return and the volatility of return for all the
markets and estimate the serial correlation and co-movement of the four markets. We find that the
average rate of return varies dramatically for the four equity markets and across time. Further, we
find that stock prices are positively serially correlated in general. In the multivariate regressions,
we find that there is little evidence to show that either the rate of return in certain markets
universally affects the rate of return in other equity markets. It suggests that the four markets are
co-integrated but not universally across time and with each other in pairwise dimensions. Lastly,
we studied and made conclusions concerning the mean and variation in the volatility of the rates of
return in the four equity markets studied.
Keywords: Volatility, Correlation, Equity markets
INTRODUCTION
Our purpose is to study three sets of weekly price indices: Tokyo Composite Index, NYSE
Composite Index, London Composite Index and the Hang Seng (Hong Kong, heretofore, Hang
Seng) Composite Index provided by common data collected during the period of 1991-2012.
Studies of these indices are important because of the rapid growth and influence of the Asian and
especially the Chinese economies on the world, balance of trade and growth of Asian and other
economies throughout the world (Chow et al., hereafter CMP, 1999; Jarrett and Sun, 2009).
Previous studies (Chen, 1991; Cheung and Ng, 1998; Liaw, 2007) described China as an economic
1 University of Rhode Island Kingston, RI, USA. Email: [email protected]
2, 3 Lynchburg University Lynchburg VA, USA.
Asian Journal of Empirical Research
journal homepage: http://aessweb.com/journal-detail.php?id=5004

Asian Journal of Empirical Research, 3(8)2013: 972-989
973
power offering tremendous opportunities for investment and growing business returns. Their
financial markets for the earlier years in their development were thought not to be fully developed
when analyzed by the criteria developed by financial economists using criteria for analyzing
Western equity markets (Fama, 1990, 1991; Wei and Wong, 1992; and Zhong et al., 1999). Chow
and Lawler (2003, data up and till 2002), and later, Jarrett and Sun (2012), analyzed the price index
for the Shanghai Stock Exchange in comparison with the New York Stock Exchange Index in
terms of its rate of return, volatility and structural changes in the movement of the index. In this
study, we propose to analyze the entire period from January 1991 to December 2012 dividing the
period into sub periods (sub samples) to analyze change associated with time and especially
significant economic events. The comparisons have the purpose of revealing the behavior of stock
movements in an emerging market in comparison with an established Western market. Previous
studies by Bailey et al. (2009), Jarrett and Sun (2009A, B), Jarrett and Kyper (2010) focused on
other issues in Chinese equity markets. We will now focus on two of the largest Asian equity
markets because they are central areas of trade and economic activities not expressed only in the
Shanghai equity market of China. Although previous studies show that Asian markets became and
continue to integrate themselves with other and small Asian equity exchanges (Jarrett and Sun,
2012).
Another question relates to whether there is some integration between the New York and Shanghai
markets as seen by studying the co-movement of stock prices in these exchanges. This will enable
one to assess the degree of integration of the Chinese economy with the rest of the world as
represented by the movement of prices in the New York Stock Exchange (NYSE). We will also
look at the correlations among the Shanghai, NYSE and Hong Kong markets (Hang Seng Index) to
examine their integration as well. Lastly, one notes that the Chinese financial markets are not open
in the Western sense of the term but our study should yield some observations about the relative
openness of the Chinese financial markets. We examine both the rate of return and the volatility of
the price indexes. The rate of return is the change in the natural logarithm of the price index for a
given time period. We follow Chow and Lawler (2003, hereafter CL) and Jarrett and Sun (2012,
hereafter, JS) in measuring the volatility by the absolute value of the change rather than by its
variance. The absolute value is less sensitive to extreme value as compared with ARCH-type
models to study the residual variance of a time series model. Stated differently, we study the
volatility of the rate of return itself and not the residual in the time series model of the rate of
return. Following CL and JS, (1) the volatility in the rate of return and not the time series
regression model residual is the subject of interest in financial research and (2), “since log stock
price behaves approximately like a random walk, the rate of return itself and the residual of an auto
regression of this rate are almost the same” (CL, p. 18). The data for this study include four sets of
weekly price indices: Tokyo Composite Index, London Composite Index, NYSE Composite Index,
and Hang Seng Composite Index provided during the period of 1991-2012. The rate of return is
calculated as the change in the natural logarithm of the price index in a given period. The volatility

Asian Journal of Empirical Research, 3(8)2013: 972-989
974
of returns is calculated as the absolute value of the change in the natural logarithm of the price
index in a given period. We further divide our sample into three subsamples: before 1997, after
1997 and before 2007, and after 2007. The entire sample period is from October 1987 to October
2012. Both 1997 and 2007 are years in which the economic environment changed. In turn this
affected the world‟s equity markets. Hence, we separated the data into three sub-time-periods.
Lastly, we follow CL and JS in choosing the weekly data as the best choice among daily, weekly
and monthly data.
To begin, we examine the characteristics of the equity markets. We calculate the mean and variance
of the rate of return and the mean and variance of the measure of volatility. If both these measures
reflect uncertainty, the volatility in Asian stock prices should be more volatile than those in New
York. To study the co-movements of the price in the two markets, we calculate simple correlations
and multiple regressions. The multiple regressions include auto regressions as well as ordinary
multiple regressions. There was no rational reason to examine curvilinear models since the study of
residuals did not indicate nonlinearity in relationships. The remainder of this paper is organized as
follows: (1) the characteristics of the rate of return and the volatility of return; (2) correlation
coefficients; (3) regressions of the rate of return; (4) regressions of the volatility of return; and (5)
conclusions.
Rate of return and volatility of shanghai and New York price indices
Table 1 shows the information for the Hong Kong, Tokyo, London and New York stock price
indices including the market capitalization and the number of listed stocks. The sizes of the four
financial markets indicate that the New York equity market is much larger than the other three
equity markets in terms of market capitalization but not the number of listings. London is largest in
terms of number of listings indicating that the market capitalization per listing is much smaller.
Tokyo and Hong Kong are smaller than New York in terms of market capitalization and especially
market capitalization per listing. There is a rich literature on the relationship between market
listings and the size of the economy Levine and Zervos (1998). For a summary of current
discussion on this topic see Levine (2005).
Table 1: Size and number of stocks
Stock Exchange Market capitalization
(US$ trillion)
Number of Listings
Hang Seng (Hong Kong) 2922 1554
London (FTSE) 3704 2753
New York (NYSE) 16528 2303
Tokyo 3715 2306
Table 2 shows the means and standard deviations (variation) of the rates of return for the four
equity markets, while Table 3 presents the means and standard deviations of the volatility of returns

Asian Journal of Empirical Research, 3(8)2013: 972-989
975
in the same four markets. For Table 2, the means are highest for Hang Seng followed by New
York, London and Tokyo which is negative for the time period analyzed. The standard deviation is
highest for Hang Seng followed by Tokyo, with New York and London being very close. As
expected, we observe that the variations in the Asian markets are greater the Western markets.
Observe the differences in the volatility in the rates of return for the same four equity markets. The
Asian equity markets have higher volatility in the rates of return for the Western equity markets.
The variation (standard deviation) in volatility is again much higher in the Hang Seng market than
the others. The Tokyo market‟s standard deviation is again larger than the two Western markets.
Table 2: Means and variations (standard deviations) in rates of returns
Stock Exchange Hang Seng London New York Tokyo
Mean .00154 .000904 .00127 -.00058
Standard deviation .036744 .024216 .024149 .029756
Table 3: Means and variations (standard deviations) in volatility of returns
Stock Exchange Hang Seng London New York Tokyo
Mean .026157 .017257 .016769 .022186
Standard deviation .025842 .017006 .017418 .019828
The mean rate of return for Hang Seng (0.00154) is about twenty-five percent larger than the mean
rates of return for New York (0.00127), more than 50 percent larger than London (0.00090) and the
mean rate of return for Tokyo is negative (-0.00058). Thus, mean rate of return for Hang Seng is
growing at a rate much larger than for the other equity markets. All three of them represent
developed economies whereas Hang Seng, while not underdeveloped, is greatly influenced by the
dynamics of the Chinese equity market and economy (Pan et al., 2012) due to shares being cross-
listed with the Shanghai stock exchanges. If we were to consider change in price levels for the two
nations by examining data onthe consumer price indexes for the four nations (although not a perfect
comparison), the changes in prices would not account for the major portion of the differences in the
average rates of return. This leads to a conclusion that the greater mean rate of return for the Hang
Seng Index is not attributable to factors other than the investment opportunities in its market and
the influence of dual-listed equities with those of China.
Volatility (as noted before) as measured by both the standard deviation of the rate of return and by
the mean volatility in the rate of return is again larger for the Hang Seng stock market than for the
three alternative stock markets. Table 2 shows a much larger variation for the Hang Seng stock
index than for the others. Table 3 concurs by showing a much large mean volatility of return for
Hang Seng as well. This suggests a great deal of uncertainty in the Hang Seng market in
comparison to the other markets. Furthermore, the standard deviation of the measure in Table 3 is
also much greater for Hang Seng than it is for New York, London and Tokyo. These results are not
a revelation and are similar as those of CL ad JS. This would lead one to observe that the volatility

Asian Journal of Empirical Research, 3(8)2013: 972-989
976
is subject to a greater degree of variation, that is the spread in the distribution in Hang Seng is
greater than the distribution for the other three markets. Again, this is consistent with the previous
findings by CL and JS. This is not to say that volatility does not exist or is even small in the other
markets, but only to say that a risk-averse investor is better served by the developed markets of
New York and London, whereas Tokyo appears not to serve well to any type of investor. To test
how the two equity markets behave during extreme events, we sort sample period to three
economic sub-periods and examine the mean and volatility of the rate of return during these
periods: (1) 1987 through the last week of 1996; (2) 1997 to the end of 2007; and (3) after 2007
until the end of the sample data period. By studying these three periods, one may determine if
severe economic changes occurring in 1997 and 2007 affect the two markets and whether the
changes are different.
We find that a minuscule change in the mean rate of return for Hang Seng from period 1 to period 2
and the negative mean rate of return in period 3 reported in Table 4, Panel A. The mean rate of
return for London remained similar in periods 1 and 2 but became negative in period 3. For New
York, the mean rate increased from period 1 to period 2 but became negative slightly in period 3.
The Tokyo index was positive slightly in period 1 but declined to a negative value in period 2 and
more negative in period 3. After 2007 the declines are very evident in all markets. In studying
variation, we observe the standard deviations of the rate of return are largest in all three periods for
the Hang Seng Index. In all three time periods the Tokyo exchange had the second largest variation
in rates of return but not nearly as large as that for the Hang Seng market. The two Western
markets provided very similar results as those of the entire time period. The standard deviations
were significantly smaller than Hang Seng and Tokyo, but the variation did increase largely in
period 3. In Table 4, Panel B, we observe the changes in the mean and variation in the volatility of
the rates of return for the four equity markets across the three time periods. The mean volatility in
the rates of return did not change significantly in the three time periods. The order in terms of size
of mean did not change. Hang Seng has the largest mean, followed by Tokyo with London and
New York being small but very similar. For volatility variation, the standard deviation across all
time periods indicated the greatest variation in Hang Seng followed by Tokyo with the London and
New York markets varying for third and fourth place depending on the time period. The results
demonstrate that mean rate fell in period 3 and variation and volatility increased in period 3 relative
to the other periods. Tokyo appeared to have the smallest positive gains and was general in the
negative for the mean rate of return. Although Hang Seng may have performed better than the two
Western markets and Tokyo according to the mean rates, there is no doubt that the variation is
much larger across the time periods in Hang Seng than in the more developed markets of the
Western nations and Tokyo. Our results vary from CL and TS due to a lengthier time periods and
the notion that we have three more developed markets, i.e. New York, London and Tokyo in
comparison to the lesser developed market of Hoang Seng.

Asian Journal of Empirical Research, 3(8)2013: 972-989
977
Table 4: Rate of return and volatility in three subsamples of time
Panel-A: Rate of return
Before 1997 Hang Seng London New York Tokyo
Mean .002211 .00139 .001782 .000739
Standard deviation .034593 .023234 .023377 .028932
1997-2007 Hang Seng London New York Tokyo
Mean .002375 .001343 .002007 -.0007
Standard deviation .035467 .023152 .022162 .028911
After 2007 Hang Seng London New York Tokyo
Mean -.001 -.00053 -.0000536 -.00292
Standard deviation .04304 .028973 .027447 .033904
Panel-B: Volatility of return
Before 1997 Hang Seng London New York Tokyo
Mean .025867 .016402 .016929 .021376
Standard deviation .024536 .015325 .015986 .017019
1997-2007 Hang Seng London New York Tokyo
Mean .026117 .017385 .016929 .021269
Standard deviation .027727 .016204 .016744 .018854
After 2007 Hang Seng London New York Tokyo
Mean .026143 .015731 .015945 .021745
Standard deviation .031060 .015707 .014756 .019406
The economic change occurring in the world during the three time periods kept the Hang Seng
market more volatile and more profitable than the ones in New York, London and Tokyo. Risk-
averse investors were better off in New York and London after 2007 because of the smaller level of
volatility but they are giving up the possibility of higher return. The Tokyo market appeared to be
the least wise choice for all three time period and also tended to be more risky than markets of New
York and London. The differences in the sample statistics for the three time periods suggest that
the rates of return and volatility in stock prices in nominal terms for the entire time period studied
were not covariate stationary time series. This is the same conclusion for a much larger time period
than observed by CL and TS. Their conclusions at this point are not disputed but only enhance by
the study of the new and expanded analysis of the four markets. The previous studies only observe
one Western and one Asian market (Shanghai, which is less developed and not much larger than
Hang Seng).
The correlation in price movements
Following CL and JS, we arrive at a preliminary view of the level of integration among the Han
Seng, London, New York and Tokyo Exchanges by examining the simple (Pearson) correlation
coefficients. Table 5 contains the Person Product Moment correlation coefficients of the four
exchanges. All data came from known public sources. Note that the New York and London
markets for the rate of return (Panel A) have a correlation of 0.710, indicating that almost 50% of
variation in the two markets is associated with each other. The same Pearson Product Moment
Correlation coefficients for all other two-by-two combination have coefficients between 0.437 and
0.5500. Although smaller, these coefficients are all significant at the .01 level of significance and

Asian Journal of Empirical Research, 3(8)2013: 972-989
978
indicate some relationship between the rates of return in each market. For volatility (Panel B, Table
5) in the rates of return, again the London-New York combination indicates far greater correlation
than for the other possible combination. However, the other combinations taken two at a time and
Shanghai-Kong Kong are 0.022 and 0.096. Hence, the association between volatility in the rates of
return are statistically different (at 1% level of significance), therefore, the association between the
volatility in the rates of return among these four markets taken two at a time are differ in the
statistical sense. Unlike TS and to some extent CL, we observe that these markets influence each
other. Table 5 indicates that at first glance that the four exchanges covariate or are related to each
other over the time period studied. Whereas the London and New York markets do show more co-
variation, therefore they are often influenced by the same economic factors. The smaller but non
insignificant correlation coefficients for the rate of return and volatility of return for the other
combinations of exchanges suggest that these equity markets operate with each other and pairwise
independence does not exist. These differ from the earlier studies of CL and JS and therefore lead
us to different conclusion. However, the CL and JS study followed the relation of Shanghai and
New York in a small time environment. These results would never be the same but our conclusions
suggest a different pattern of behavior.
Table 5: Rates of return and volatility in three subsample time periods
Panel-A: Rates of return
Hang Seng London New York Tokyo
Hank Seng 1
London .550034 1
New York .43722 .71018 1
Tokyo 449219 .449219 .471573 1
Panel-B: Volatility of return
Hang Seng London New York Tokyo
Hank Seng 1
London .443104 1
New York .391989 .649569 1
Tokyo .319339 .385721 .353906 1
Previous research on the relations between large and small stock returns in six Asian (Pacific-
Basin) nations and the association among the same six Asian financial markets is exemplified by
Jarrett and Sun (2009A). Their purpose was to provide evidence of the cross-autocorrelation of
stock returns in a lengthy time period. Evidence was brought to bear as to the theoretical
explanations for stock market behavior of Pacific-Basin nations including those with large financial
markets, i.e. Japan and Hong Kong, and those with small financial markets, i.e. Thailand and
Malaysia. This study though different than ours indicates clearly the relationship of large and small
equity markets and give us further desire to learn more about the cointegration of equity markets
throughout the world. We can now still learn more about the level of integration in these four
markets by analyzing multiple regressions, and in doing so we exclude the influence of the delayed
effects of lagged explanatory variables.

Asian Journal of Empirical Research, 3(8)2013: 972-989
979
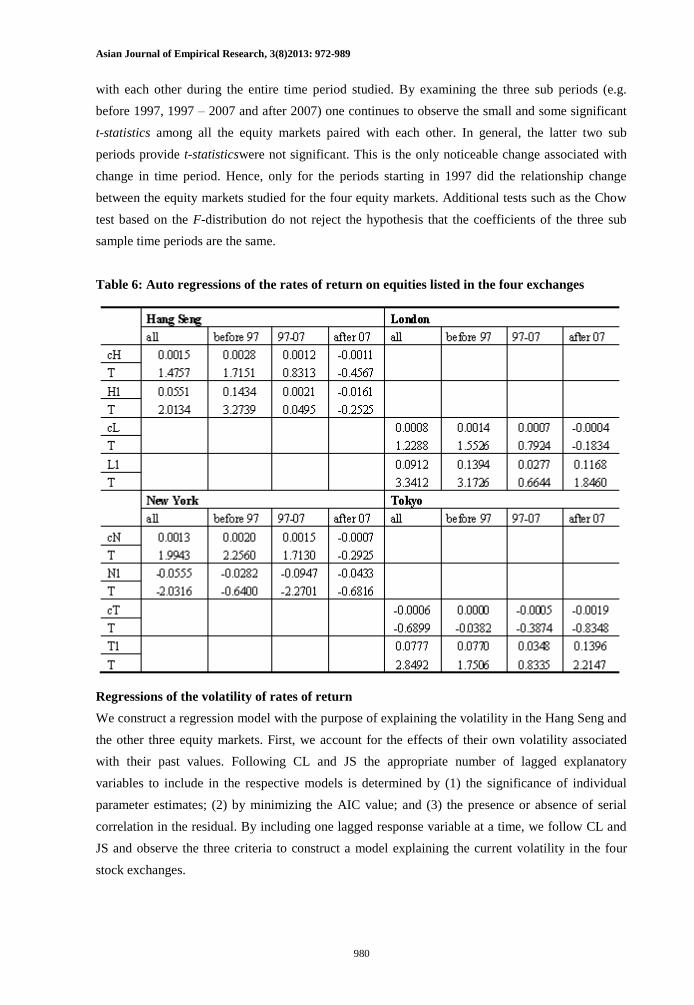
Regressions of the rate of return
We define the rate of return to be the change in the natural logarithm of the stock price from period
t-1. According to the efficient markets hypothesis (EMH), the rate of return is difficult to predict
with any reasonable level of accuracy. Hence, we wish to determine if there is validity in this
hypothesis and whether rates of return in the four markets are correlated after excluding the
influence of their own lagged values. We construct a model to explain the Hang Seng rate of return
by its own past values. By constructing a model with many lagged values of the rate of return and
calculate the Akaike Information Criterion (AIC), we find that AIC is minimized at a lag of one. In
turn, we find the first-order auto regression which appears in column (2) of Table 6. The coefficient
(H1) is 0.0551 with a t-statistic of 1.48 for all data which is not significant at the reasonable level of
α ≤ 0.05 (the p-value being large). According to this result the weak form of the efficient markets
hypothesis does hold for this time period. For London, L1 is 0.0912 (t-statistic =3.34), for New
York, N1 is -0.0555 (t-statistic = -2.03), and for Tokyo, T1 is 0.0777 (t-statistic = 2.85). The results
are mixed but all have t-statistics that are significant at α ≤ .05. Next, we will further investigate
this phenomenon by dividing the time series data into the same three sub-periods analyzed
previously. For all four equity markets, we subdivide the data into the three time periods noted
previously. In all three time periods the lagged variable of one resulted in coefficients of 0.143,
0.0021 and -0.0161 for Hang Seng, but only the first had a sufficiently large enough t-statistic to
reject the null hypothesis of the parameter equaling zero. Thus, the results are mixed for the Hang
Seng market. For the auto regression of London, we find the L1 coefficients to be 0.1394, 0.0277
and 0.1168. However, only the coefficient for period (before 1997) is significant at α ≤ 0.05. Again
the London market yields mixed results. For New York, N1 = -0.0282, -0.0947 and -0.0433. Only
the period 1997-2007 had a significant t-statistic. Lastly, for Tokyo, the coefficients for T1 are
0.0770, 0.0348 and 0.1396. Only the period after 2007 has a significant t-statistic. These results are
not entirely the same as those of CL or JS, but do indicate that change occurred among the three
sample sub-periods studied. The results are mixed in all four equity markets indicating different
effects during the entire time period and differential effect in each of the sub periods. CL and JS
observed that lack of strong correlation between the equity markets of New York and Shanghai
which corroborate an earlier and similar study of Bekaret and Harvey (1995). With the continued
and dynamic development of the of the Asian equity markets, we should now observe the more
recent analysis of their cointegration exhibited in Table 7 (panels A and B). In column 2, Table 7,
we note the value of L2 and its related t-statistic of 0.5910 and 12.13.
The values indicate that the current Hang Seng rate of return (the response variable) associated with
the current London rate of return (the explanatory variable) is both small and significant. Further,
with a t-statistic of 2.17 (for N0), we find that the coefficient of the contemporaneous New York
rate has association with the Hang Seng rate of return for the entire time period studied. For NO,
N1 and T0, with T2 in column 2 in Panel B (All Data), one observes small and significant t-
statistics. This supports the notion that the two markets are integrated and have some association
Asian Journal of Empirical Research, 3(8)2013: 972-989
980
with each other during the entire time period studied. By examining the three sub periods (e.g.
before 1997, 1997 – 2007 and after 2007) one continues to observe the small and some significant
t-statistics among all the equity markets paired with each other. In general, the latter two sub
periods provide t-statisticswere not significant. This is the only noticeable change associated with
change in time period. Hence, only for the periods starting in 1997 did the relationship change
between the equity markets studied for the four equity markets. Additional tests such as the Chow
test based on the F-distribution do not reject the hypothesis that the coefficients of the three sub
sample time periods are the same.
Table 6: Auto regressions of the rates of return on equities listed in the four exchanges
Regressions of the volatility of rates of return
We construct a regression model with the purpose of explaining the volatility in the Hang Seng and
the other three equity markets. First, we account for the effects of their own volatility associated
with their past values. Following CL and JS the appropriate number of lagged explanatory
variables to include in the respective models is determined by (1) the significance of individual
parameter estimates; (2) by minimizing the AIC value; and (3) the presence or absence of serial
correlation in the residual. By including one lagged response variable at a time, we follow CL and
JS and observe the three criteria to construct a model explaining the current volatility in the four
stock exchanges.

Asian Journal of Empirical Research, 3(8)2013: 972-989
981
Table 7: Regressions of rate of return in all four markets
Table 7: Regressions of rate of return in all four markets
In Table 8, we find for Hang Seng (All Data) that all lagged variables have significant t-statistics
(12.23, 4.19, 1.98, and 3.59). Tests for serial correlation applied to the model having four lagged
values yield a small and significant t-statistics. Column 2 (All Data) and Column (5) of Table 8

Asian Journal of Empirical Research, 3(8)2013: 972-989
982
Panel A, and columns (2) and (5) of Panel B show the results for all four stock exchanges. London
(All Data) has large significant coefficients for lags 1, 2 and 3 but small and non-significant
marginal coefficients for lag 4. For New York, significant lags were found at 1, 2 and 3 but not 4.
Table 8: Auto regressions of volatility of equity prices in four exchanges
Lastly, for Tokyo, significant coefficients were found at lags 1, 2 and 3 but not 4. Hence, in all four
markets, there tended to be significant autocorrelation up to lag 3. Similar results were found also
when we observe the results of studying the individual three sub periods noting that the sample

Asian Journal of Empirical Research, 3(8)2013: 972-989
983
sizes for sub periods are smaller than for the entire time period. Table 8 shows that significant auto
regressive coefficients in equity markets indicate an association with its own lagged variables. It is
a well-known that observations from previous studies including CL and JS resulted in a similar
analysis and conclusion. As before, we test for structural change in each equity market by dividing
our time period into three sub periods. Columns 3, 4, 5, 6, 7, and 8 of Table 8, Panels A and B.
Although the results are universally similar, for the most part, the auto regressions for all four
equity markets exhibit outcomes that are very similar to each other. Tests for equality among the
three sub periods for each market would show the same results. In conclusion, all four markets
suggest that each market has some parameter stability during the lengthy period studied and the
effect of changes in time as expressed by the three sub periods indicate that this is true for each
market but with some disparities.
At this point, we introduce lagged values of the other markets to ascertain whether the volatility in
the former market indicates Granger causality (Granger, 1969). To determine Granger causality in
Hang Seng volatility, we choose the number of lagged values of New York, London and Tokyo
volatility according to the criteria noted before (e.g. AIC and the absence of serial correlation in the
residuals). Our results for the whole sample period (All Data), reported in column 2 of Table 9, we
have only lag 1 for New York, lag 1 for London, and lag 1 for Tokyo. The t-statistic for New York
is 7.1744, and therefore is significant at a very small probability, (significance level of α ≤ 0.01).
This indicates that the volatility in the Hang Seng equity market is associated with the lagged value
in New York. Since the t-statistics are not significant for London and Tokyo, we cannot draw the
same conclusion. CL and the JS comparisons were not for Hang Seng but for Shanghai, thus these
results differ. Hence, we conclude that only the New York volatility at one lag was associated with
Hang Seng for the entire time period. Thus, Granger causality exists between Hang Seng and New
York but not for the others. Hence, this indicates that the volatility in the markets for the entire time
period were likely independent of each other. Unlike CL, we did not observe negative coefficients
for N1 and N2 in the entire time period studied.
To be consistent with the findings of CL, we observed only the H1 (lag of 1) and this time the
coefficient is not significant (at α = 0.05 or less). The AIC value suggests not including any lagged
values of the Hang Seng variables. In addition, the Breusch-Godfrey test revealed the absence of
serial correlation in the autoregressive model. The model with one Shanghai lagged variable (S1) is
contained in column 7 of Table 9. The negative coefficient corroborates the results of CL but in this
study this coefficient is not significant. Hence, by Granger causality, the Shanghai volatility and
New York volatility do not have a Granger cause relationship. Lastly, when we compare the Root
MSE of the Shanghai and New York models, we not that the small residual variation in the New
York regression and hence, it is more predictable than Shanghai volatility. An additional question
relates to whether or not there is significant co-variation of volatility in a multivariate setting. To
incorporate instantaneous causality in explaining Hang Seng volatility, one adds the current value

Asian Journal of Empirical Research, 3(8)2013: 972-989
984
of the variable in the other markets in the auto regression. One observes the result for Hang Seng in
column 2 of Table 9, Panel A and the results for New York in column 6 of Table 9, Panel A. The
coefficients for the New York variables (All Data) show some positive coefficients but only N1 is
significant. This would indicate that extended time period in this study resulted in some Hang Seng
volatility being related to New York volatility in a lagged time period. A wholly different
interpretation results when we observe the t-statistics for N1 in the sub periods. The coefficient is
significant only before 1997. The latter two time periods yield no significant coefficient. If we go
line by line and column by column through all the data in Table 9, we do not find consistency from
period to period in pairwise combinations. Thus, we could conclude that the relationships among
the markets change during the sub periods indicating the dynamic aspects of the four equity
markets studied. Volatility is present and changes the relationships of markets due to economic
conditions, law affecting these markets the growth of emerging markets versus more established
markets. There is little doubt that market volatility is ever changing and the prediction of this
volatility is not easily accomplished.
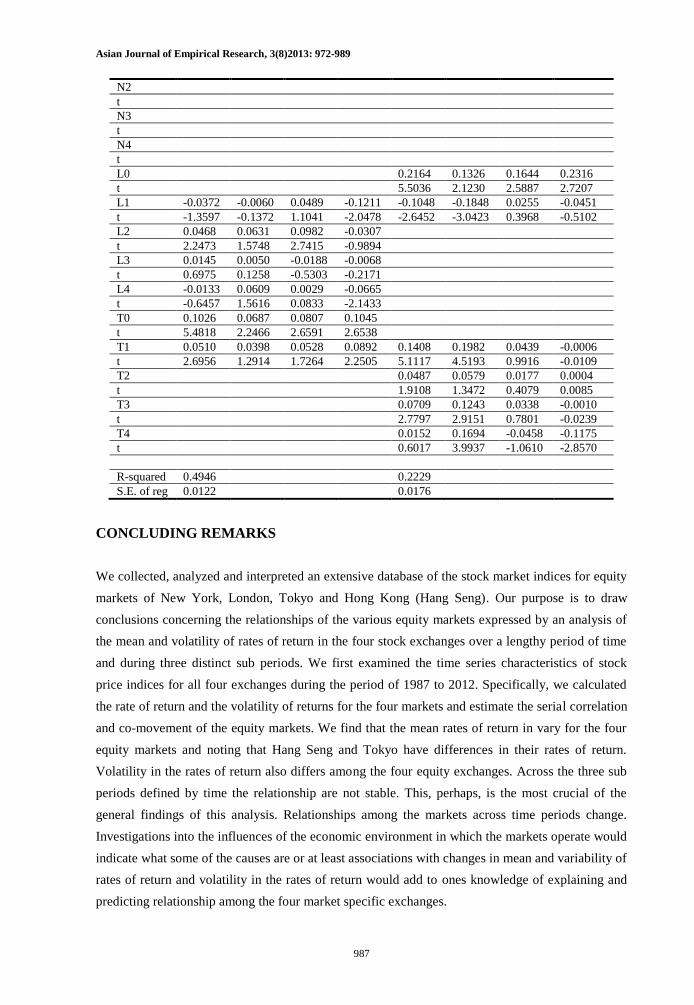
Table 9, Panel B, contains the analysis for London and Tokyo. Note, for London and Hang Seng
only H0 and H1 have significant t-statistics for all data and pre-1997. The coefficients then do not
have significant t-statistics for the „97 to „07 and the post „07 sub periods. The same is true for the
relationship of Tokyo and Hang Seng. Tokyo, although a Pan-Pacific exchange is not an emerging
market and often reacts more like the Western markets studied here than the Hang Seng market.
Without going through the analysis to compare individual coefficients, we observe the different
effects of change in time and the pairwise relationship of markets. As long as economic conditions
change, the results include temporal instabilities in markets. Our study is lengthy and exhaustive
but much of its results are not unnerving since we already know that markets vary in prices and
volatility, but these factors have components that are predictable when using modern time series
analysis. For example, see Ray, Chen and Jarrett (1997) where the authors show that firms listed
on the Tokyo exchange contain components (permanent and temporary) which may in turn, lead to
better predictions. Lastly, the results for the models for the volatility in equity returns for all the
equity markets, we find the effect of the Asian equities leading to the same for of temporal
instability of the parameters of the Western equity markets. Simply stated the inclusion of the Hang
Seng or Tokyo variables do not result in stable relationships throughout the three sub periods
studied. There are observed structural changes related to each time period. Hence, we conclude that
the concept of temporal stability is not present.
Table 9: Regressions of volatility of equity returns (Panel-A) Hang Seng (Hong Kong) New York
Lag all data pre
1997
1997 -
2007
post
2007
all data pre
1997
1997 -
2007
post
2007
constant 0.0067 0.0040 0.0043 0.0081 0.0016 0.0062 0.0035 -0.0009
t 4.6933 1.5682 1.6954 3.6023 2.1719 5.0352 2.4732 -0.6762
H0 0.0626 0.0181 0.0820 0.1252

Asian Journal of Empirical Research, 3(8)2013: 972-989
985
t 4.1032 0.7816 3.5951 3.1320
H1 0.0367 -
0.0022
0.0363 -0.0192 -0.0606 -
0.0810
-0.0174 -0.0111
t 1.3350 -
0.0497
0.8348 -0.3316 -3.9419 -
3.5288
-0.7534 -0.2770
H2 0.0579 0.1038 0.0035 0.0634
t 2.3569 2.5838 0.0882 1.5126
H3 0.0175 0.0018 0.0603 0.0168
t 0.7159 0.0442 1.5171 0.3983
H4 0.0706 0.0251 0.1688 0.0563
t 2.8910 0.6263 4.2549 1.3289
N0 0.1872 0.0905 0.2525 0.2694
t 3.8715 1.0520 3.0637 3.2627
N1 0.1498 0.5880 0.0390 -0.1122 0.1378 0.2721 0.0568 0.0895
t 3.0287 6.3924 0.4711 -1.2774 4.9332 5.5828 1.2885 1.4580
N2 0.0384 -
0.0086
0.0324 0.0352
t 1.7116 -
0.1738
0.8943 1.0850
N3 0.0753 0.0302 0.0649 0.0806
t 3.3684 0.6562 1.7885 2.5036
N4 0.0287 -
0.0701
0.0393 0.0330
t 1.3237 -
1.6226
1.0867 1.0462
L0 0.4059 0.3856 0.4499 0.0881 0.5317 0.2503 0.4692 0.7194
t 8.2119 4.2872 5.7096 1.0350 21.7637 5.3655 12.4378 17.4484
L1 -0.0294 0.0431 0.1281 -0.0797 0.0429 0.1629 0.0387 0.0243
t -0.5805 0.4795 1.5739 -0.9163 1.5139 3.4054 0.8976 0.4019
L2
t
L3
t
L4
t
T0 0.1979 0.2145 0.0810 0.4361 0.0862 0.0538 0.0258 0.0742
t 5.7443 3.4252 1.4350 8.3078 4.4295 1.6570 0.8596 1.8575
T1 -0.0807 -
0.1282
-0.0500 0.1020 -0.0642 -
0.0903
-0.0490 -0.0860
t -2.3109 -
2.0419
-0.8811 1.7423 -3.2810 -
2.7869
-1.6379 -2.1385
R-squared 0.2562 0.4841
S.E. of
reg
0.0224 0.0126
Table 9: Regressions of volatility of equity returns
Panel B. London and Tokyo London Tokyo
Lag all data pre
1997
1997 -
2007
post
2007
all data pre
1997
1997 -
2007
post
2007
constant 0.0006 0.0020 0.0008 0.0018 0.0072 0.0054 0.0152 0.0013
t 0.7497 1.5375 0.5430 1.2907 6.3991 3.0480 6.8879 0.6632
H0 0.1172 0.0918 0.1278 0.0507 0.1234 0.1060 0.0560 0.4345
t 8.0873 4.2819 5.6012 1.2682 5.8244 3.5039 1.6488 8.1495
H1 0.0413 0.0509 0.0163 -0.0198 0.0067 0.0045 0.0234 0.0607
t 2.7839 2.3904 0.6943 -0.4978 0.3123 0.1497 0.6922 1.0449
H2
t
H3
t

Asian Journal of Empirical Research, 3(8)2013: 972-989
986
H4
t
N0 0.5008 0.2231 0.5014 0.7094 0.1644 0.1150 0.0584 0.1863
t 22.1211 5.4647 12.7519 17.4139 4.3452 1.9392 0.8976 2.2223
N1 0.0320 0.2150 -0.0820 0.0926 0.0514 0.0255 0.0285 0.1386
t 1.1845 4.7276 -1.8273 1.5363 1.3212 0.3881 0.4386 1.5838
N2
t
N3
t
N4
t
L0 0.2164 0.1326 0.1644 0.2316
t 5.5036 2.1230 2.5887 2.7207
L1 -0.0372 -
0.0060
0.0489 -0.1211 -0.1048 -
0.1848
0.0255 -0.0451
t -1.3597 -
0.1372
1.1041 -2.0478 -2.6452 -
3.0423
0.3968 -0.5102
L2 0.0468 0.0631 0.0982 -0.0307
t 2.2473 1.5748 2.7415 -0.9894
L3 0.0145 0.0050 -0.0188 -0.0068
t 0.6975 0.1258 -0.5303 -0.2171
L4 -0.0133 0.0609 0.0029 -0.0665
t -0.6457 1.5616 0.0833 -2.1433
T0 0.1026 0.0687 0.0807 0.1045
t 5.4818 2.2466 2.6591 2.6538
T1 0.0510 0.0398 0.0528 0.0892 0.1408 0.1982 0.0439 -0.0006
t 2.6956 1.2914 1.7264 2.2505 5.1117 4.5193 0.9916 -0.0109
T2 0.0487 0.0579 0.0177 0.0004
t 1.9108 1.3472 0.4079 0.0085
T3 0.0709 0.1243 0.0338 -0.0010
t 2.7797 2.9151 0.7801 -0.0239
T4 0.0152 0.1694 -0.0458 -0.1175
t 0.6017 3.9937 -1.0610 -2.8570
R-squared 0.4946 0.2229
S.E. of reg 0.0122 0.0176
Table 9: Regressions of volatility of equity returns (Panel-B) London Tokyo
Lag all data pre
1997
1997 -
2007
post
2007
all data pre
1997
1997 -
2007
post
2007
constant 0.0006 0.0020 0.0008 0.0018 0.0072 0.0054 0.0152 0.0013
t 0.7497 1.5375 0.5430 1.2907 6.3991 3.0480 6.8879 0.6632
H0 0.1172 0.0918 0.1278 0.0507 0.1234 0.1060 0.0560 0.4345
t 8.0873 4.2819 5.6012 1.2682 5.8244 3.5039 1.6488 8.1495
H1 0.0413 0.0509 0.0163 -0.0198 0.0067 0.0045 0.0234 0.0607
t 2.7839 2.3904 0.6943 -0.4978 0.3123 0.1497 0.6922 1.0449
H2
t
H3
t
H4
t
N0 0.5008 0.2231 0.5014 0.7094 0.1644 0.1150 0.0584 0.1863
t 22.1211 5.4647 12.7519 17.4139 4.3452 1.9392 0.8976 2.2223
N1 0.0320 0.2150 -0.0820 0.0926 0.0514 0.0255 0.0285 0.1386
t 1.1845 4.7276 -1.8273 1.5363 1.3212 0.3881 0.4386 1.5838
Asian Journal of Empirical Research, 3(8)2013: 972-989
987
N2
t
N3
t
N4
t
L0 0.2164 0.1326 0.1644 0.2316
t 5.5036 2.1230 2.5887 2.7207
L1 -0.0372 -0.0060 0.0489 -0.1211 -0.1048 -0.1848 0.0255 -0.0451
t -1.3597 -0.1372 1.1041 -2.0478 -2.6452 -3.0423 0.3968 -0.5102
L2 0.0468 0.0631 0.0982 -0.0307
t 2.2473 1.5748 2.7415 -0.9894
L3 0.0145 0.0050 -0.0188 -0.0068
t 0.6975 0.1258 -0.5303 -0.2171
L4 -0.0133 0.0609 0.0029 -0.0665
t -0.6457 1.5616 0.0833 -2.1433
T0 0.1026 0.0687 0.0807 0.1045
t 5.4818 2.2466 2.6591 2.6538
T1 0.0510 0.0398 0.0528 0.0892 0.1408 0.1982 0.0439 -0.0006
t 2.6956 1.2914 1.7264 2.2505 5.1117 4.5193 0.9916 -0.0109
T2 0.0487 0.0579 0.0177 0.0004
t 1.9108 1.3472 0.4079 0.0085
T3 0.0709 0.1243 0.0338 -0.0010
t 2.7797 2.9151 0.7801 -0.0239
T4 0.0152 0.1694 -0.0458 -0.1175
t 0.6017 3.9937 -1.0610 -2.8570
R-squared 0.4946 0.2229
S.E. of reg 0.0122 0.0176
CONCLUDING REMARKS
We collected, analyzed and interpreted an extensive database of the stock market indices for equity
markets of New York, London, Tokyo and Hong Kong (Hang Seng). Our purpose is to draw
conclusions concerning the relationships of the various equity markets expressed by an analysis of
the mean and volatility of rates of return in the four stock exchanges over a lengthy period of time
and during three distinct sub periods. We first examined the time series characteristics of stock
price indices for all four exchanges during the period of 1987 to 2012. Specifically, we calculated
the rate of return and the volatility of returns for the four markets and estimate the serial correlation
and co-movement of the equity markets. We find that the mean rates of return in vary for the four
equity markets and noting that Hang Seng and Tokyo have differences in their rates of return.
Volatility in the rates of return also differs among the four equity exchanges. Across the three sub
periods defined by time the relationship are not stable. This, perhaps, is the most crucial of the
general findings of this analysis. Relationships among the markets across time periods change.
Investigations into the influences of the economic environment in which the markets operate would
indicate what some of the causes are or at least associations with changes in mean and variability of
rates of return and volatility in the rates of return would add to ones knowledge of explaining and
predicting relationship among the four market specific exchanges.
Asian Journal of Empirical Research, 3(8)2013: 972-989
988
Furthermore, we find that serial correlation also differs in the four equity markets. The use of
multivariate time series analysis (see Kuvita, 2010; Chen, Minary and Lai, 2005; and Juselius,
2006) may provide further evidence for the lack of co-integration in these stock exchanges. One
last suggestion is to examine each individual index to access where there are temporary and
permanent components in these indices in the manner of Ray et al. (1997) for the Japanese market.
This would answer questions concerning temporal stability in the indices of Chinese equity
markets. In the future, we expect studies to continue in areas of the so-called emerging markets of
Asia (and South America as well) to relate in a similar context to show correlations among
emerging markets, i.e. India, China and so forth, and the developed nations of Europe, North
America and Japan. These studies may also use highly regarded multivariate time series analysis
including Transformation and Intervention analyses.
REFERENCES
Bailey, W., Cai, J., Cheung and F. Wang, (2009). Stock returns, order imbalances and
commonality: Evidence on individual, institutional and proprietary investors in China,
Journal of Finance, Vol. 45, pp. 1109-1128.
Bekaert, Geert and Harvey, Campbell R. (1997). Emerging equity market volatility, Journal of
Financial Economics, Vol. 43, pp. 29-77.
Cheung, Y. W. and L. Ng. (1998). International evidence on the stock market and aggregate
economic activity. Journal of Empirical Finance, Vol. 5, pp. 281-296.
Chen, N. (1991). Financial investment opportunities and the macro economy, The Journal of
Finance, Vol. 46, No. 2, pp. 529-554.
Chen, L., Finney, M. and K. S. Lai, (2005). A Threshold Cointegration of Asymmetric Price Transmission
from Crude Oil to Gasoline Prices. Econometrica Letters, Vol. 89, pp. 233-239.
Chow, G. C., Fan, Z. and J. Hu, (1999). Shanghai stock prices as determined by the present value
model, Journal of Comparative Economics, Vol. 27, pp. 553-561.
Chow, G. C. and C. C. Lawler, (2003). A time series analysis of the Shanghai and New York stock
price indices, Annals of Economics and Finance, Vol. 4, pp. 17-35.
Eun, C. S. and W. Huang, (2007). Asset Pricing in China‟s Domestic Stock Markets: Is there
Logic. Pacific-Basin Finance Journal, Vol. 15, pp. 452-480.
Fama, E. (1990). Stock returns, expected returns, and real activity, Journal of Finance, Vol. 45, pp.
1089-1109.
Fama, E. (1991). Efficient capital markets: II. Journal of Finance, Vol. 46, pp. 1575-1617.
Granger, C. W. J. (1969). Investigating causal relation by econometric and cross-sectional method,
Econometrica, Vol. 37, pp. 424–438.
Jarrett, J. E., Pan, X and S. Chen, (2009). Do the Chinese bourses (stock markets) predict economic
growth? International Journal of Business and Economics, Vol. 8, pp. 201-211.

Asian Journal of Empirical Research, 3(8)2013: 972-989
989
Jarrett, J. E. and J. Schilling, (2008). Daily Variation and Predicting Stock Market Returns For the
Frankfurter Börse (Stock Market). Journal of Business Economics and Management, Vol. 9,
pp. 289-198.
Jarrett, J. E. and Sun, Z. (2009A). Evidence and Explanations for the Association among Six Asian
(Pacific-Basin) Financial Markets, Applied Economics, Vol. 41, No. 25, pp. 1-12.
Jarrett, J. E. and Sun, Z. (2009B). Explaining Pacific-Basin Financial Market Returns by Size of
Firm, International Review of Applied Financial Issues and Economics, Vol. 1, pp. 33-42.
Jarrett, J. E. and E. Kyper, (2010). Seasonality in Outliers of Stock Returns for the Chinese Equities
Markets, International Review of Applied Financial Issues and Economics, Vol. 2, pp. 823-
847.
Jarrett, J. E. and T. Sun, (2012). Association between the New York and Shanghai Markets:
Evidence from the Stock Price Indices, Journal of Business Economics and Management,
Vol. 13, No. 1, pp. 132-147.
Juselius, K. (2006). The Cointegrated VAR Model: Methodology and Applications, Oxford
University Press.
Kuvita, T. (2010). Time Series Analysis of Transatlantic Market Interactions: Evidence from Crude
Oil and Gasoline Prices, International Journal of Business and Economics, Vol. 9, pp. 157-
73.
Levine, R. and S. Zervos (1998). Stock Markets, Banks, and Economic Growth, The American
Economic Review, Vol. 88, No. 3, pp. 537-558.
Levine, R. (2005). Finance and Growth: Theory and Evidence in Handbook of Economic Growth,
Volume 1A, Philippe Aghion and Steven N. Durlauf, Eds., Elsevier, B. V., pp. 865-934.
Liaw, K. T. (2007). Investment Banking and Investment Opportunities in China: A Comprehensive
Guide for Finance Professionals John Wiley & Co.: New York
Pan, X. Li, K. and J. E. Jarrett (2012). The relationship of high frequency interactions between
Chines A-shares and Hong Kong H-shares of dual-listed companies, Journal of Research in
Economics and International Finance (JREIF)(ISSN: 2315-5671), Vol. 1, No. 4, pp. 103-
123.
Ray, B., Chen S. and J. E. Jarrett (1997). Identifying permanent and temporary components in
Japanese stock prices, Financial Engineering and the Japanese Markets, Vol. 4, No. 3, pp.
233-256.
Wei, K. and K. Wong, (1992). Test of inflation and industry portfolio stock returns. Journal of
Economics & Business, Vol. 44, pp. 77-94.
Zhong, R. S., L. Gu and C.B. Lui, (1999). The Empirical Statistical Analysis of Chinese Stock
Markets, China Financial and Political Economics Press, Beijing.
Copyright © 2022 FDOKUMEN