Introduction to query optimization, explain and access plans
51
Understanding DB2 LUW Query Access Plans Using the Explain Facility John Hornibrook IBM Canada Session Code: D15 Thursday 17 November 08:30-09:30 | Platform: DB2 for Linux, UNIX and Windows Abstract: The DB2 query optimizer and the access plans it generates are key to good data server performance. This presentation will guide the attendee through the analysis of a typical query access plan, providing them with details of plan operators and insight into the inner workings of the query optimizer. It will also cover the various methods to collect an access plan using the explain facility, including new DB2 9.7 features to explain based on an access section and explaining with actual (runtime) cardinalities. 1
-
Upload
khangminh22 -
Category
Documents
-
view
0 -
download
0
Transcript of Introduction to query optimization, explain and access plans
Understanding DB2 LUW Query Access Plans Using the Explain Facility
John HornibrookIBM CanadaSession Code: D15Thursday 17 November 08:30-09:30 | Platform: DB2 for Linux, UNIX and Windows
Abstract:
The DB2 query optimizer and the access plans it generates are key to good data server performance. This presentation will guide the attendee through the analysis of a typical query access plan, providing them with details of plan operators and insight into the inner workings of the query optimizer. It will also cover the various methods to collect an access plan using the explain facility, including new DB2 9.7 features to explain based on an access section and explaining with actual (runtime) cardinalities.
1
Click to edit Master title style
2
Objectives
• Understand what the query optimizer does• Learn how to use the explain facility to format and view
an access plan• Understand what is represented by the optimized SQL• Understand the details of access plans and how they
control query execution
Click to edit Master title style
3
AgendaAgenda
Optimizer Overview
The Explain Facility
The Query Access Plan

Click to edit Master title style
4
Phases of SQL Compilation
Parsing
Catch syntax errorsGenerate internal representation of query
Semantic checking
Determine if query makes senseIncorporate view definitionsAdd logic for constraint checking and triggers
Query optimization
Modify query to improve performance (Query Rewrite)Choose the most efficient "access plan" (Query Optimization)
Threaded code generation
Generate efficient "executable" code
QGM
QEP
Click to edit Master title style
5
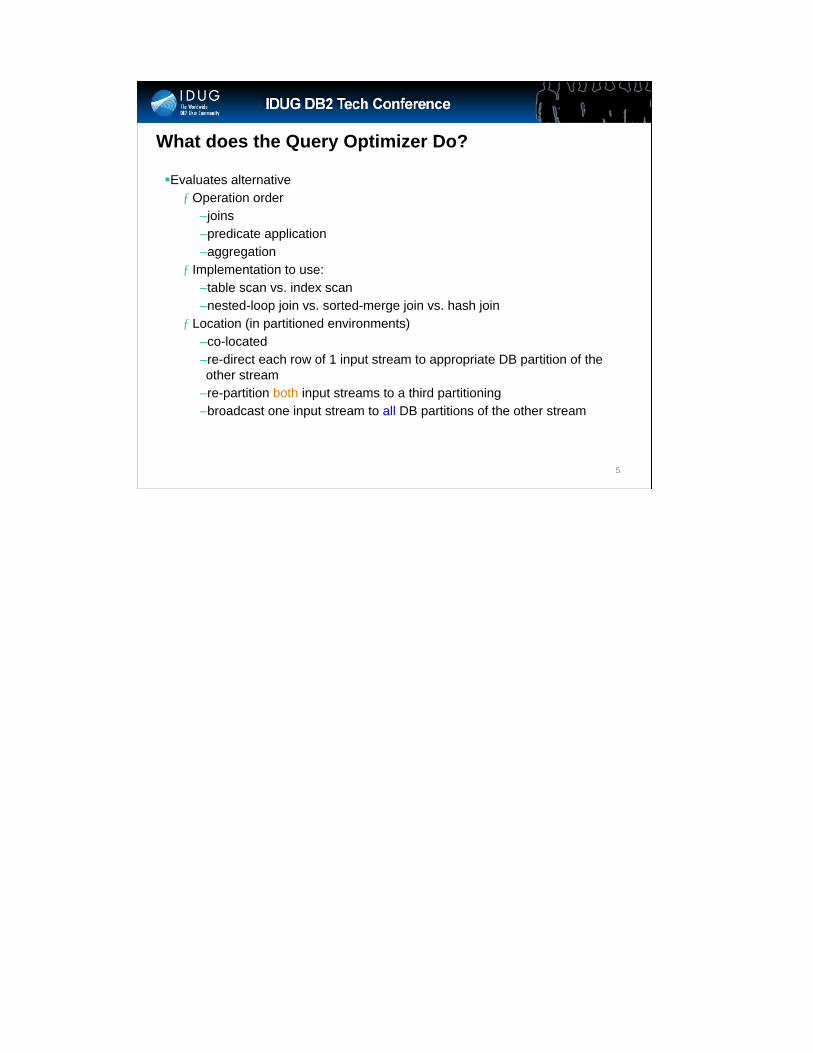
What does the Query Optimizer Do?
Evaluates alternativeƒ Operation order
–joins–predicate application–aggregation
ƒ Implementation to use:–table scan vs. index scan–nested-loop join vs. sorted-merge join vs. hash join
ƒ Location (in partitioned environments)–co-located–re-direct each row of 1 input stream to appropriate DB partition of the other stream
–re-partition both input streams to a third partitioning –broadcast one input stream to all DB partitions of the other stream
Click to edit Master title style
6
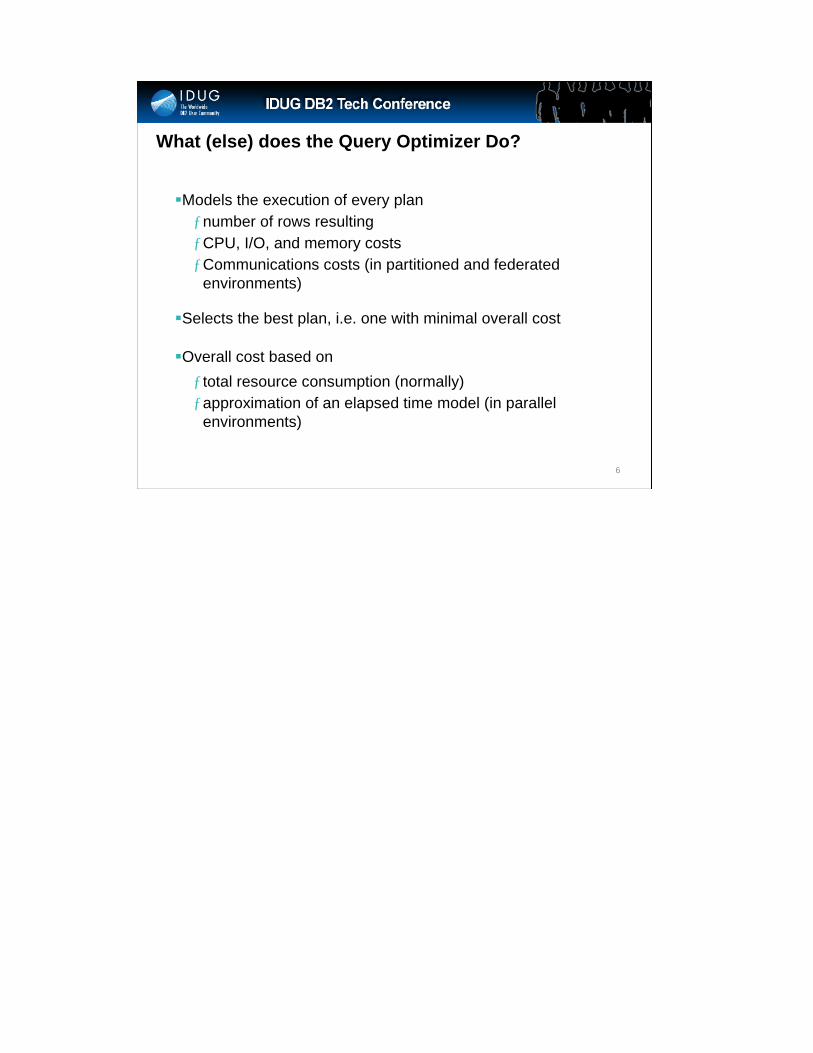
Models the execution of every planƒnumber of rows resulting ƒCPU, I/O, and memory costs ƒCommunications costs (in partitioned and federated
environments)
Selects the best plan, i.e. one with minimal overall cost
Overall cost based onƒ total resource consumption (normally)ƒapproximation of an elapsed time model (in parallel
environments)
What (else) does the Query Optimizer Do?
Click to edit Master title style
7
AgendaAgenda
Optimizer Overview
The Explain Facilityƒ What is it?ƒ How to invoke itƒ Viewing options: Visual Explain and db2exfmtƒ What about db2expln and dynexpln?
The Query Access Plan
Click to edit Master title style
8
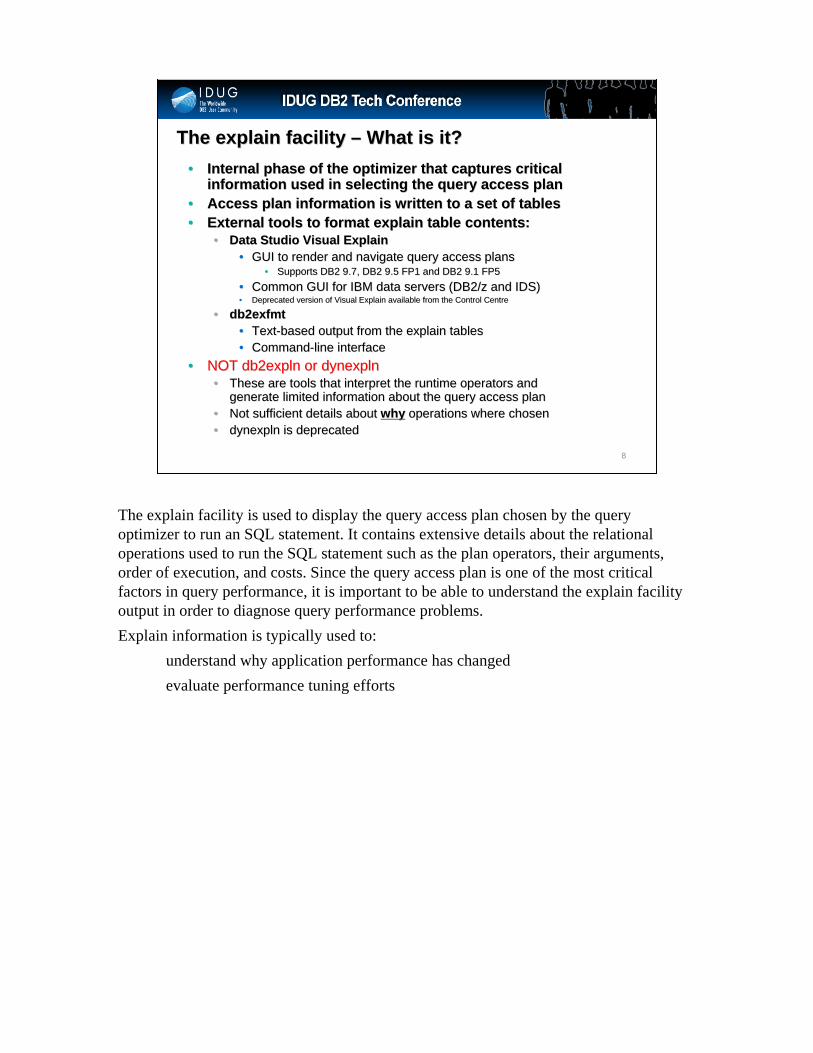
•• Internal phase of the optimizer that captures critical Internal phase of the optimizer that captures critical information used in selecting the query access planinformation used in selecting the query access plan
•• Access plan information is written to a set of tablesAccess plan information is written to a set of tables•• External tools to format explain table contents:External tools to format explain table contents:
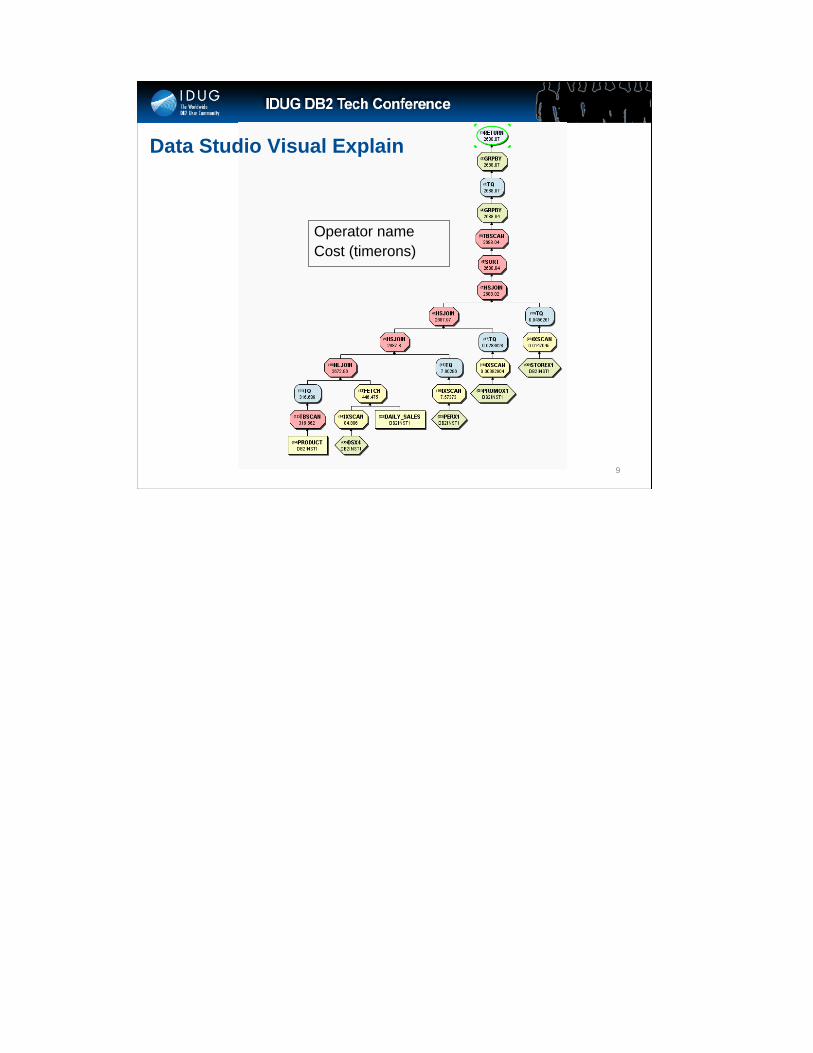
•• Data Studio Visual ExplainData Studio Visual Explain•• GUI to render and navigate query access plansGUI to render and navigate query access plans
•• Supports DB2 9.7, DB2 9.5 FP1 and DB2 9.1 FP5Supports DB2 9.7, DB2 9.5 FP1 and DB2 9.1 FP5•• Common GUI for IBM data servers (DB2/z and IDS)Common GUI for IBM data servers (DB2/z and IDS)•• Deprecated version of Visual Explain available from the Control Deprecated version of Visual Explain available from the Control CentreCentre
•• db2exfmtdb2exfmt•• TextText--based output from the explain tablesbased output from the explain tables•• CommandCommand--line interfaceline interface
•• NOT db2expln or NOT db2expln or dynexplndynexpln•• These are tools that interpret the runtime operators and These are tools that interpret the runtime operators and
generate limited information about the query access plangenerate limited information about the query access plan•• Not sufficient details about Not sufficient details about whywhy operations where chosenoperations where chosen•• dynexplndynexpln is deprecatedis deprecated
The explain facility The explain facility –– What is it?What is it?
The explain facility is used to display the query access plan chosen by the query optimizer to run an SQL statement. It contains extensive details about the relational operations used to run the SQL statement such as the plan operators, their arguments, order of execution, and costs. Since the query access plan is one of the most critical factors in query performance, it is important to be able to understand the explain facility output in order to diagnose query performance problems.Explain information is typically used to:
understand why application performance has changed evaluate performance tuning efforts
Click to edit Master title style
9
Data Studio Visual Explain
Operator nameCost (timerons)
Click to edit Master title style
10
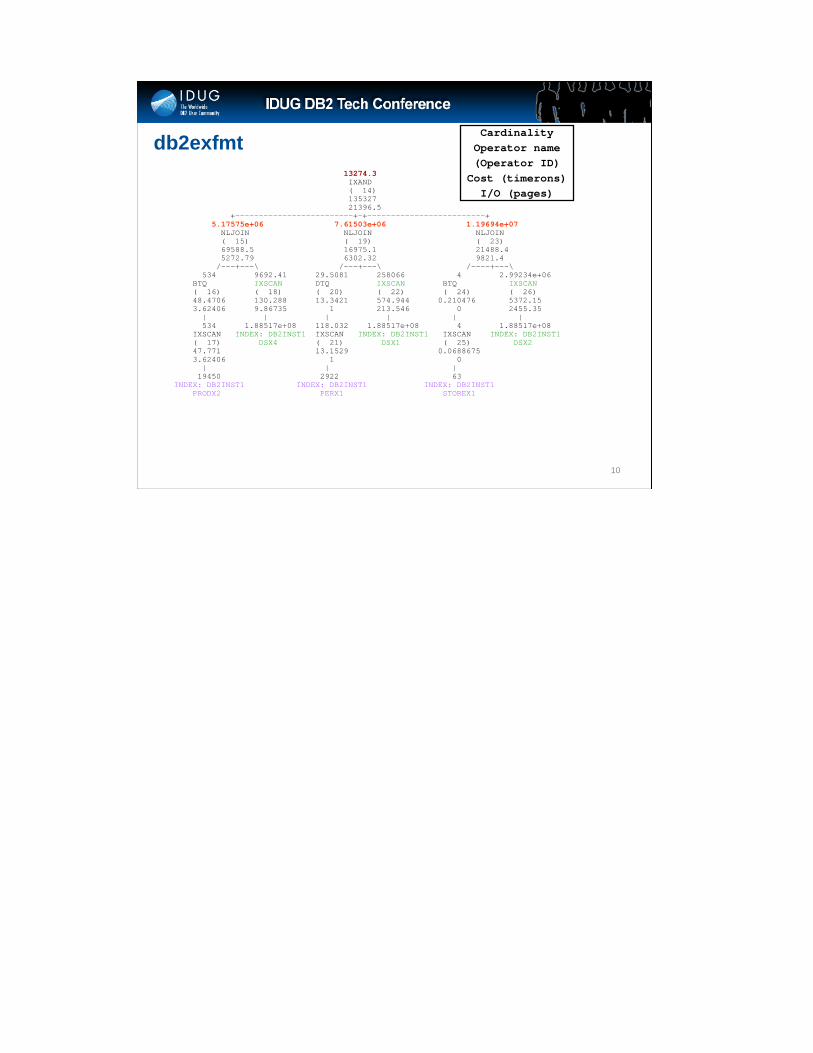
db2exfmt13274.3IXAND ( 14) 135327 21396.5
+-------------------------+-+-------------------------+5.17575e+06 7.61503e+06 1.19694e+07
NLJOIN NLJOIN NLJOIN( 15) ( 19) ( 23) 69588.5 16975.1 21488.4 5272.79 6302.32 9821.4
/---+---\ /---+---\ /----+---\534 9692.41 29.5081 258066 4 2.99234e+06
BTQ IXSCAN DTQ IXSCAN BTQ IXSCAN ( 16) ( 18) ( 20) ( 22) ( 24) ( 26) 48.4706 130.288 13.3421 574.944 0.210476 5372.15 3.62406 9.86735 1 213.546 0 2455.35
| | | | | |534 1.88517e+08 118.032 1.88517e+08 4 1.88517e+08
IXSCAN INDEX: DB2INST1 IXSCAN INDEX: DB2INST1 IXSCAN INDEX: DB2INST1( 17) DSX4 ( 21) DSX1 ( 25) DSX247.771 13.1529 0.0688675 3.62406 1 0
| | |19450 2922 63
INDEX: DB2INST1 INDEX: DB2INST1 INDEX: DB2INST1 PRODX2 PERX1 STOREX1
CardinalityOperator name(Operator ID)
Cost (timerons)I/O (pages)
Click to edit Master title style
11
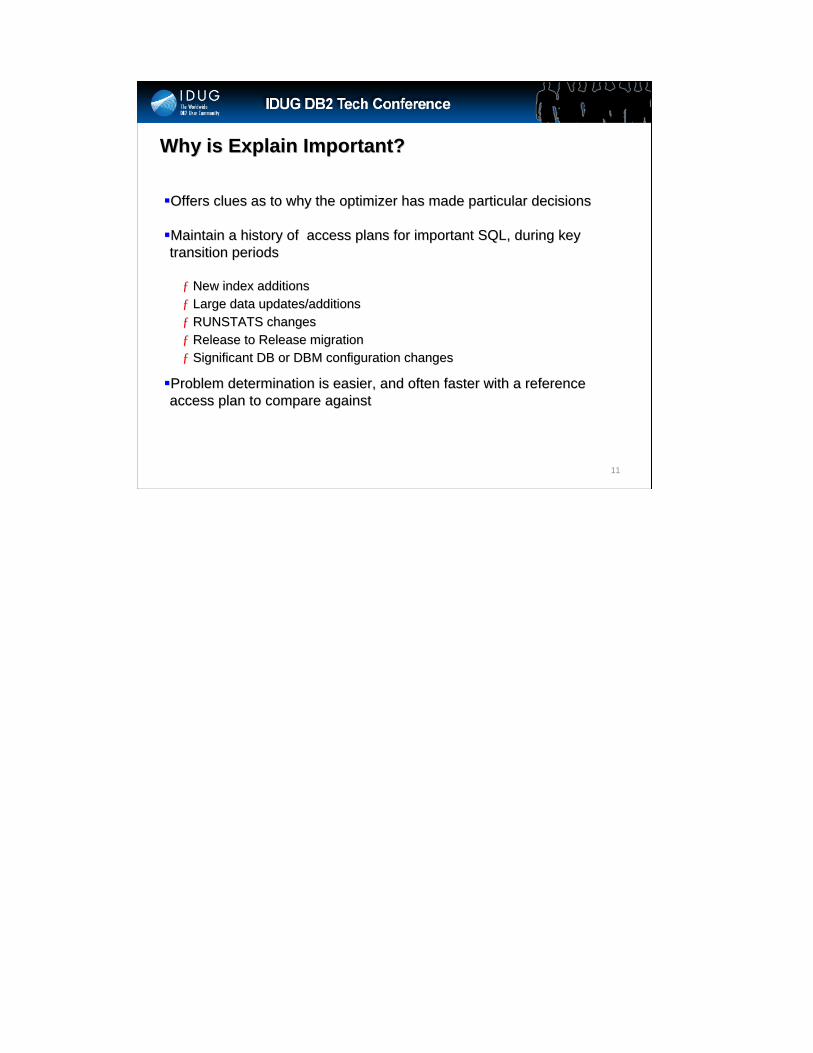
Why is Explain Important?Why is Explain Important?
Offers clues as to why the optimizer has made particular decisioOffers clues as to why the optimizer has made particular decisionsns
Maintain a history of access plans for important SQL, during keMaintain a history of access plans for important SQL, during key y transition periodstransition periods
ƒƒ New index additionsNew index additionsƒƒ Large data updates/additionsLarge data updates/additionsƒƒ RUNSTATS changesRUNSTATS changesƒƒ Release to Release migrationRelease to Release migrationƒƒ Significant DB or DBM configuration changesSignificant DB or DBM configuration changes
Problem determination is easier, and often faster with a referenProblem determination is easier, and often faster with a reference ce access plan to compare againstaccess plan to compare against
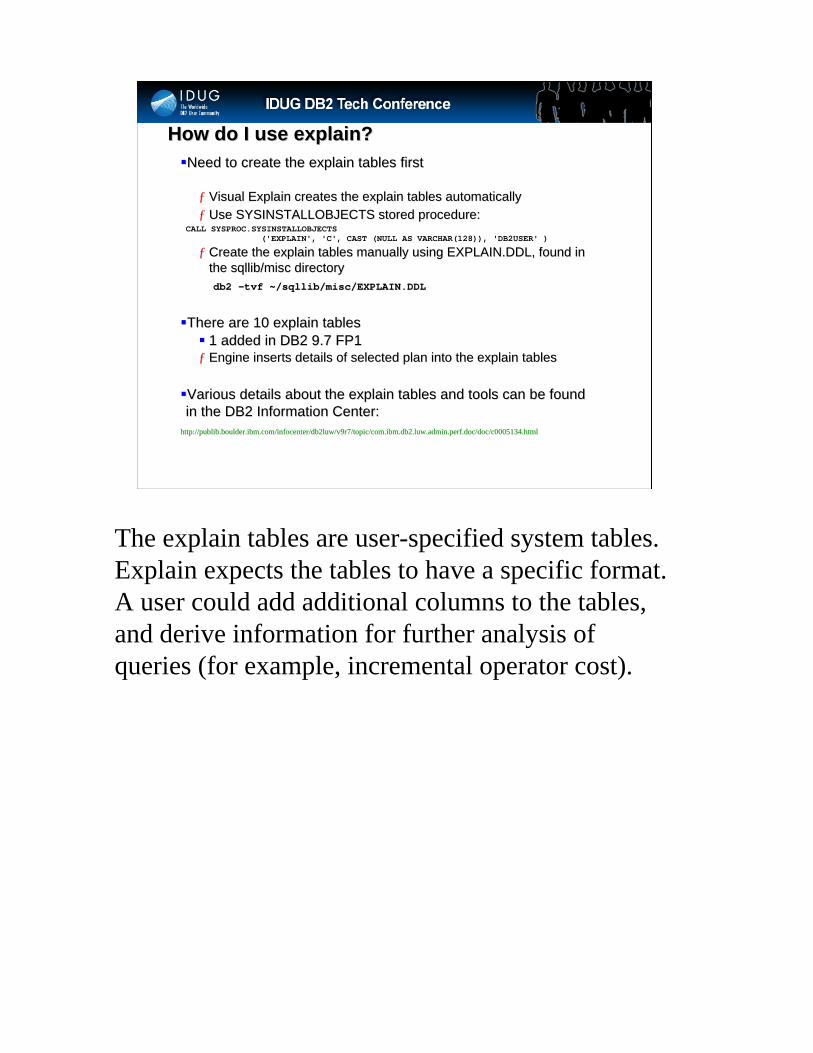
Click to edit Master title styleHow do I use explain?How do I use explain?
Need to create the explain tables firstNeed to create the explain tables first
ƒƒ Visual Explain creates the explain tables automaticallyVisual Explain creates the explain tables automaticallyƒƒ Use SYSINSTALLOBJECTS stored procedure:Use SYSINSTALLOBJECTS stored procedure:
CALL SYSPROC.SYSINSTALLOBJECTS('EXPLAIN', 'C', CAST (NULL AS VARCHAR(128)), 'DB2USER' )
ƒƒ Create the explain tables manually using EXPLAIN.DDL, found in Create the explain tables manually using EXPLAIN.DDL, found in the sqllib/misc directorythe sqllib/misc directorydb2 db2 ––tvf ~/sqllib/misc/EXPLAIN.DDLtvf ~/sqllib/misc/EXPLAIN.DDL
There are 10 explain tables There are 10 explain tables 1 added in DB2 9.7 FP11 added in DB2 9.7 FP1
ƒƒ Engine inserts details of selected plan into the explain tablesEngine inserts details of selected plan into the explain tables
Various details about the explain tables and tools can be found Various details about the explain tables and tools can be found in the DB2 Information in the DB2 Information CenterCenter::
http://publib.boulder.ibm.com/infocenter/db2luw/v9r7/topic/com.ihttp://publib.boulder.ibm.com/infocenter/db2luw/v9r7/topic/com.ibm.db2.luw.admin.perf.doc/doc/c0005134.htmlbm.db2.luw.admin.perf.doc/doc/c0005134.html
The explain tables are user-specified system tables. Explain expects the tables to have a specific format. A user could add additional columns to the tables, and derive information for further analysis of queries (for example, incremental operator cost).

Click to edit Master title style
13
Explain Argument TableExplain Stream TableExplain Predicate Table
Explain Object Table
Explain Operator Table
Explain Statement Table
Explain Instance Table
Explain Table RelationshipsExplain Table RelationshipsThese tablesalways populated
These tables arenot populatedwhen only thesnapshot isrequested
Explain Diagnostic Data
Explain Diagnostic
Explain Actuals(DB2 9.7 FP1)
Used with explain-from-section
There are 10 explain tables, and 2 index advisor tables. This talk will not touch upon the index advisor tables. The Explain Instance table contains information about a grouping of explain statements. This grouping is usually for static SQL statements that are part of the same source file.The Explain Statement table contains information about a specific statement. There are 2 entries in this table for each SQL statement explain: the original statement, and the planned statement. Associated with the planned statement, is the rest of the Query Access Plan.The Explain Operator table contains information about each of the operations in the Query Access Plan. The Explain Stream table describes how each of the operators are linked together, and link to Explain Objects. The Explain Objects tables describes all of the objects (indexes, tables, table functions) used by the Query Access PlanThe Explain Predicate tables describes all of the predicates applied by a particular Explain Operator.The Explain Argument table describes additional arguments for the operator.The Explain Diagnostic table contains diagnostic information about the statement such as tables or indexes that are missing statistics or why an MQT or statistical view wasn’t used.The Explain Diagnostic Data table contains multiple rows for each diagnostic message. These rows contain message tokens associated with the message.The Explain Actuals table contains runtime actuals information. Currently, it contains the actual number of rows processed by each operator in the EXPLAIN_OPERATOR table.
Click to edit Master title style
14
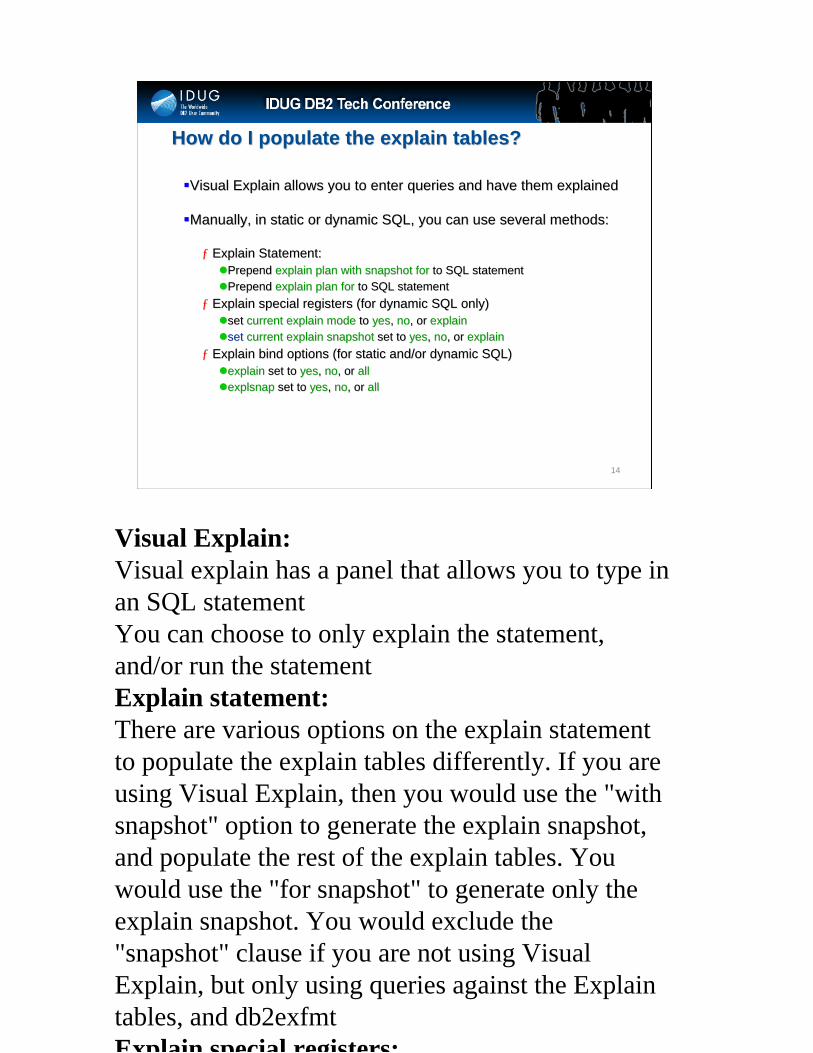
Visual Explain allows you to enter queries and have them explainVisual Explain allows you to enter queries and have them explaineded
Manually, in static or dynamic SQL, you can use several methods:Manually, in static or dynamic SQL, you can use several methods:
ƒƒ Explain Statement:Explain Statement:Prepend Prepend explain plan with snapshot forexplain plan with snapshot for to SQL statementto SQL statementPrepend Prepend explain plan forexplain plan for to SQL statementto SQL statement
ƒƒ Explain special registers (for dynamic SQL only)Explain special registers (for dynamic SQL only)set set current explain modecurrent explain mode to to yesyes, , nono, or , or explainexplainsetset current explain snapshotcurrent explain snapshot set to set to yesyes, , nono, or , or explainexplain
ƒƒ Explain bind options (for static and/or dynamic SQL)Explain bind options (for static and/or dynamic SQL)explainexplain set to set to yesyes, , nono, or , or allallexplsnapexplsnap set to set to yesyes, , nono, or , or allall
How do I populate the explain tables?How do I populate the explain tables?
Visual Explain:Visual explain has a panel that allows you to type in an SQL statementYou can choose to only explain the statement, and/or run the statementExplain statement:There are various options on the explain statement to populate the explain tables differently. If you are using Visual Explain, then you would use the "with snapshot" option to generate the explain snapshot, and populate the rest of the explain tables. You would use the "for snapshot" to generate only the explain snapshot. You would exclude the "snapshot" clause if you are not using Visual Explain, but only using queries against the Explain tables, and db2exfmtExplain special registers:

Click to edit Master title style
15
Explain from Access Section• Capture explain information for previously
compiled or executed SQL statements• Compiled form of an SQL statement is called an access
section• Why is this useful?
• Because explaining an SQL statement in the present, may not produce the same access plan that was used in the past.
• 2 step process:1. Use stored procedure to write explain information for an
access section to the explain tables• 4 stored procedures, for different purposes
2. Use an explain table formatting tool to view the explain• db2exfmt• Optim Query Tuner Visual Explain
• Requires DB2 9.7 FP1

Click to edit Master title style
16
Explain from Access Section• EXPLAIN_FROM_ACTIVITY
• Access section resides in an activity event monitor table• Must specify COLLECT ACTIVITY DATA WITH SECTION when enabling activity event monitor (workload,
service class, threshold, work action)
• Identify by application ID, activity ID, uow ID, and activity event monitor name• EXPLAIN_FROM_CATALOG
• Access sections for static SQL• Identify by package name, package schema, unique ID, and section number
• EXPLAIN_FROM_SECTION • Access section resides in:
• In-memory package cache • Package cache event monitor
• Identify by executable ID and location• EXPLAIN_FROM_DATA
• Pass access section directly to procedure• Point at access section in any arbitrary location
• All procedures:• Accept explain schema as input• Return explain table key as output
Click to edit Master title style
17
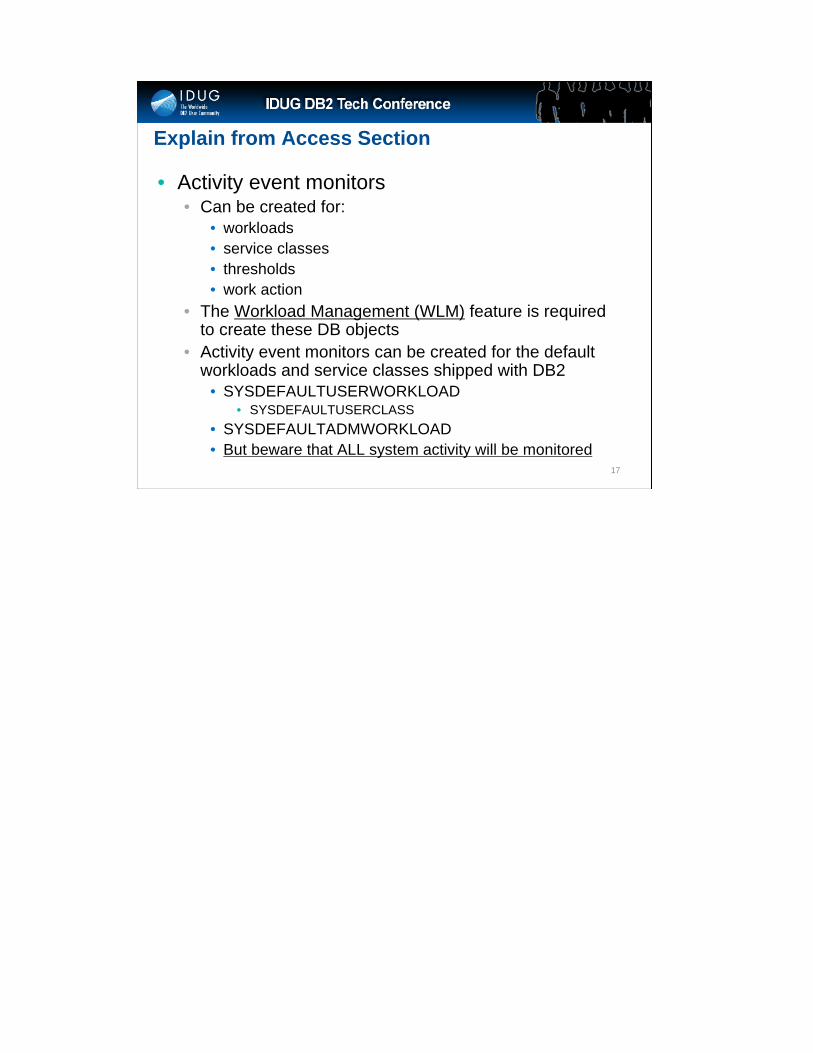
Explain from Access Section
• Activity event monitors• Can be created for:
• workloads • service classes • thresholds• work action
• The Workload Management (WLM) feature is required to create these DB objects
• Activity event monitors can be created for the default workloads and service classes shipped with DB2
• SYSDEFAULTUSERWORKLOAD• SYSDEFAULTUSERCLASS
• SYSDEFAULTADMWORKLOAD• But beware that ALL system activity will be monitored

Click to edit Master title style
18
Explain from Access Section• Explain information is a subset of full explain• The most important information is included
• All operators, predicate text, estimated cardinality, most operator arguments
• What is missing:• Only TOTAL_COST and FIRST_ROW_COST included• Stream column names• DB partition class columns• Many statistics• Implicitly (compiler) referenced objects
Click to edit Master title style
19
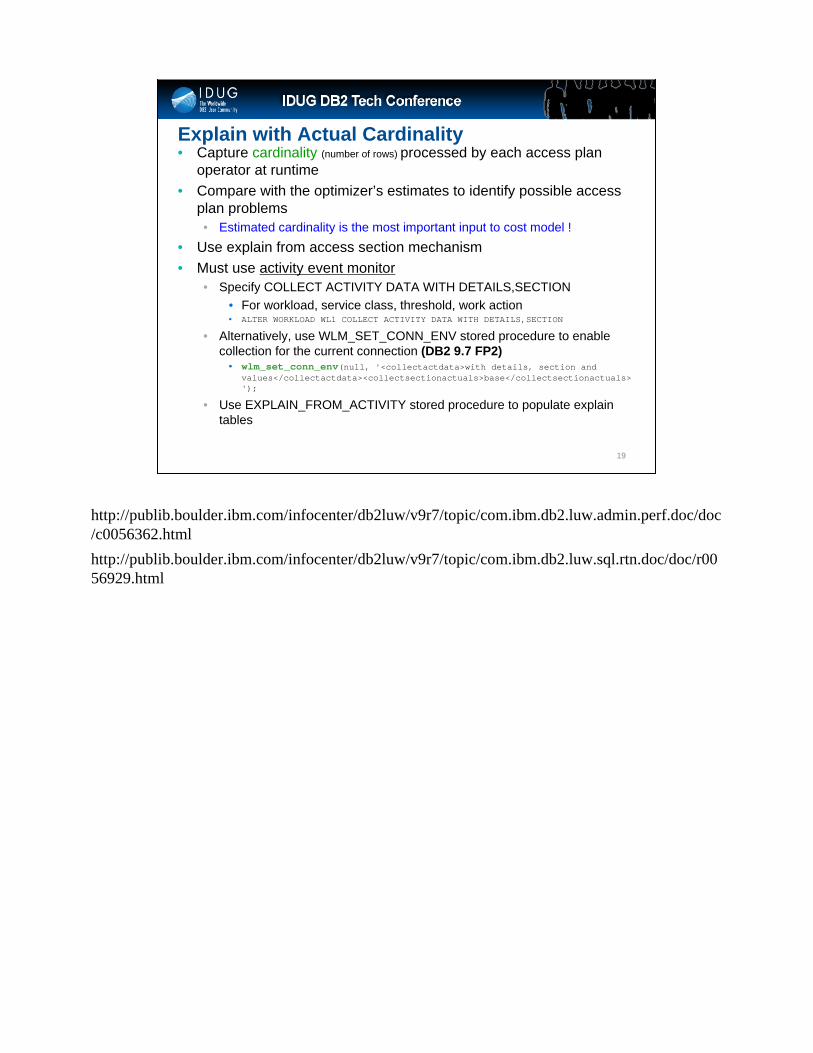
Explain with Actual Cardinality• Capture cardinality (number of rows) processed by each access plan
operator at runtime• Compare with the optimizer’s estimates to identify possible access
plan problems• Estimated cardinality is the most important input to cost model !
• Use explain from access section mechanism• Must use activity event monitor
• Specify COLLECT ACTIVITY DATA WITH DETAILS,SECTION • For workload, service class, threshold, work action• ALTER WORKLOAD WL1 COLLECT ACTIVITY DATA WITH DETAILS,SECTION
• Alternatively, use WLM_SET_CONN_ENV stored procedure to enable collection for the current connection (DB2 9.7 FP2)
• wlm_set_conn_env(null, '<collectactdata>with details, section and values</collectactdata><collectsectionactuals>base</collectsectionactuals>');
• Use EXPLAIN_FROM_ACTIVITY stored procedure to populate explain tables
http://publib.boulder.ibm.com/infocenter/db2luw/v9r7/topic/com.ibm.db2.luw.admin.perf.doc/doc/c0056362.html http://publib.boulder.ibm.com/infocenter/db2luw/v9r7/topic/com.ibm.db2.luw.sql.rtn.doc/doc/r0056929.html
Click to edit Master title style
20
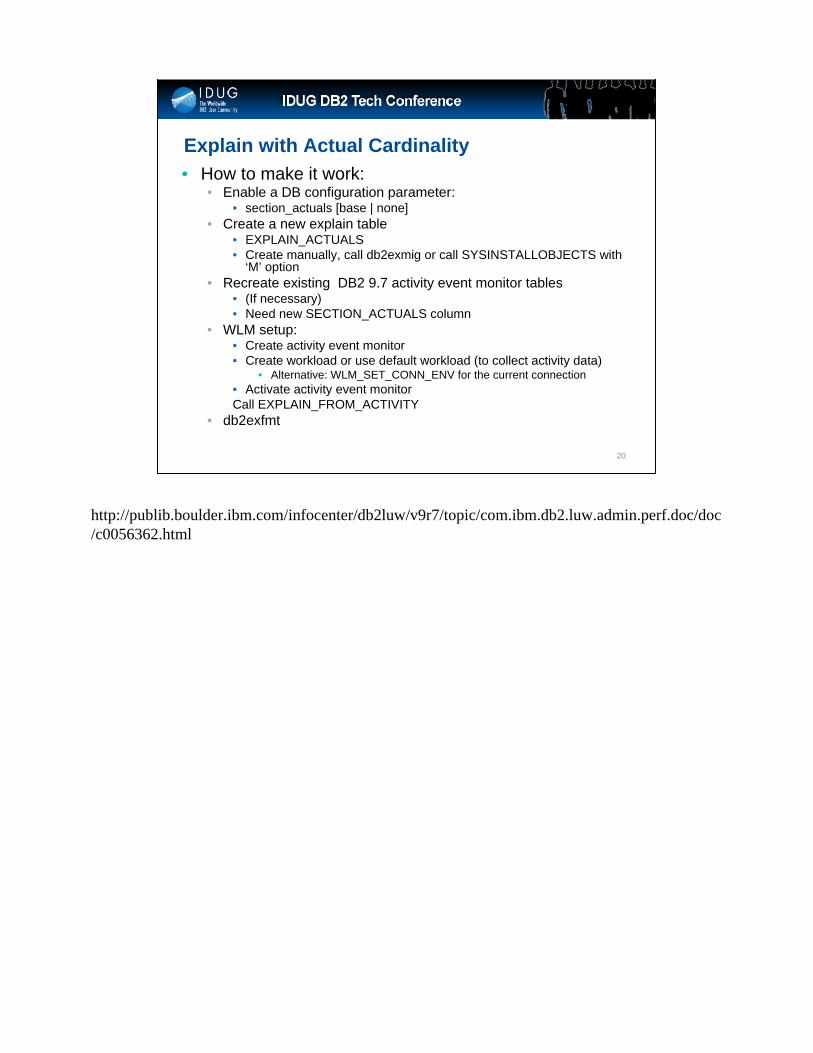
Explain with Actual Cardinality• How to make it work:
• Enable a DB configuration parameter:• section_actuals [base | none]
• Create a new explain table• EXPLAIN_ACTUALS• Create manually, call db2exmig or call SYSINSTALLOBJECTS with
‘M’ option• Recreate existing DB2 9.7 activity event monitor tables
• (If necessary)• Need new SECTION_ACTUALS column
• WLM setup:• Create activity event monitor• Create workload or use default workload (to collect activity data)
• Alternative: WLM_SET_CONN_ENV for the current connection• Activate activity event monitorCall EXPLAIN_FROM_ACTIVITY
• db2exfmt
http://publib.boulder.ibm.com/infocenter/db2luw/v9r7/topic/com.ibm.db2.luw.admin.perf.doc/doc/c0056362.html
Click to edit Master title style
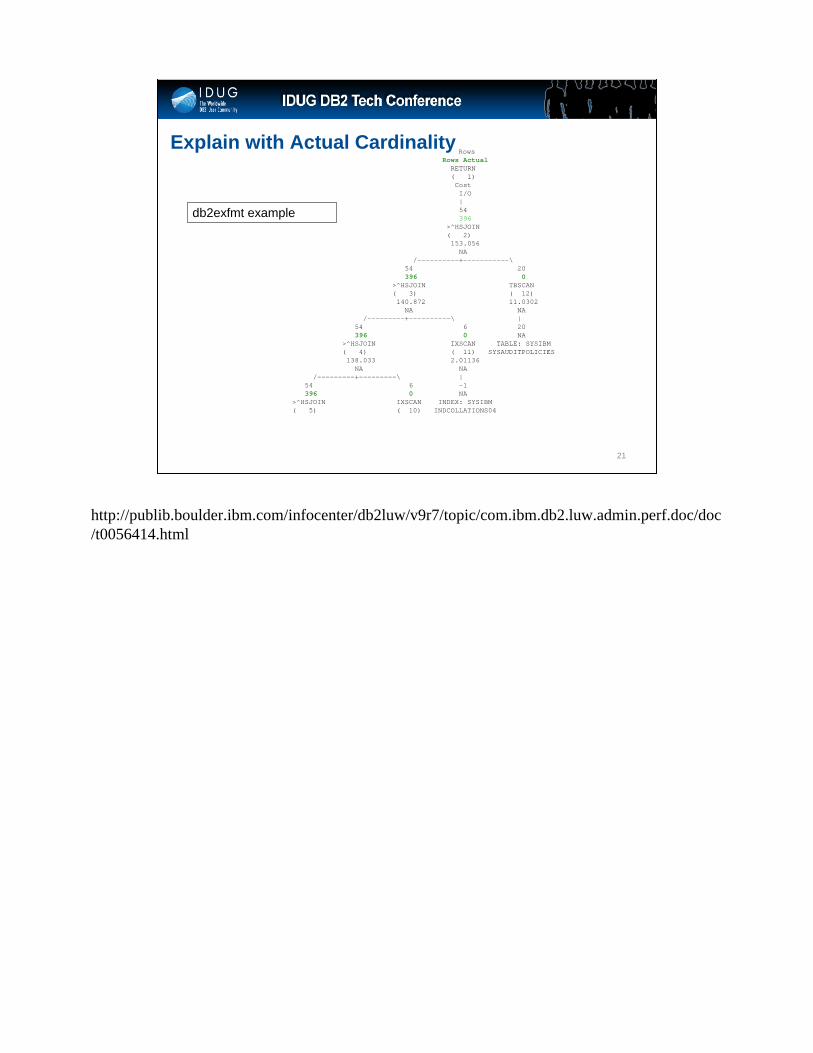
21
Explain with Actual CardinalityRows
Rows ActualRETURN( 1)CostI/O|54 396
>^HSJOIN( 2)153.056 NA
/----------+-----------\54 20 396 0
>^HSJOIN TBSCAN( 3) ( 12)140.872 11.0302
NA NA/---------+----------\ |
54 6 20 396 0 NA
>^HSJOIN IXSCAN TABLE: SYSIBM( 4) ( 11) SYSAUDITPOLICIES138.033 2.01136
NA NA/---------+---------\ |
54 6 -1 396 0 NA
>^HSJOIN IXSCAN INDEX: SYSIBM( 5) ( 10) INDCOLLATIONS04
db2exfmt example
http://publib.boulder.ibm.com/infocenter/db2luw/v9r7/topic/com.ibm.db2.luw.admin.perf.doc/doc/t0056414.html
Click to edit Master title style
22
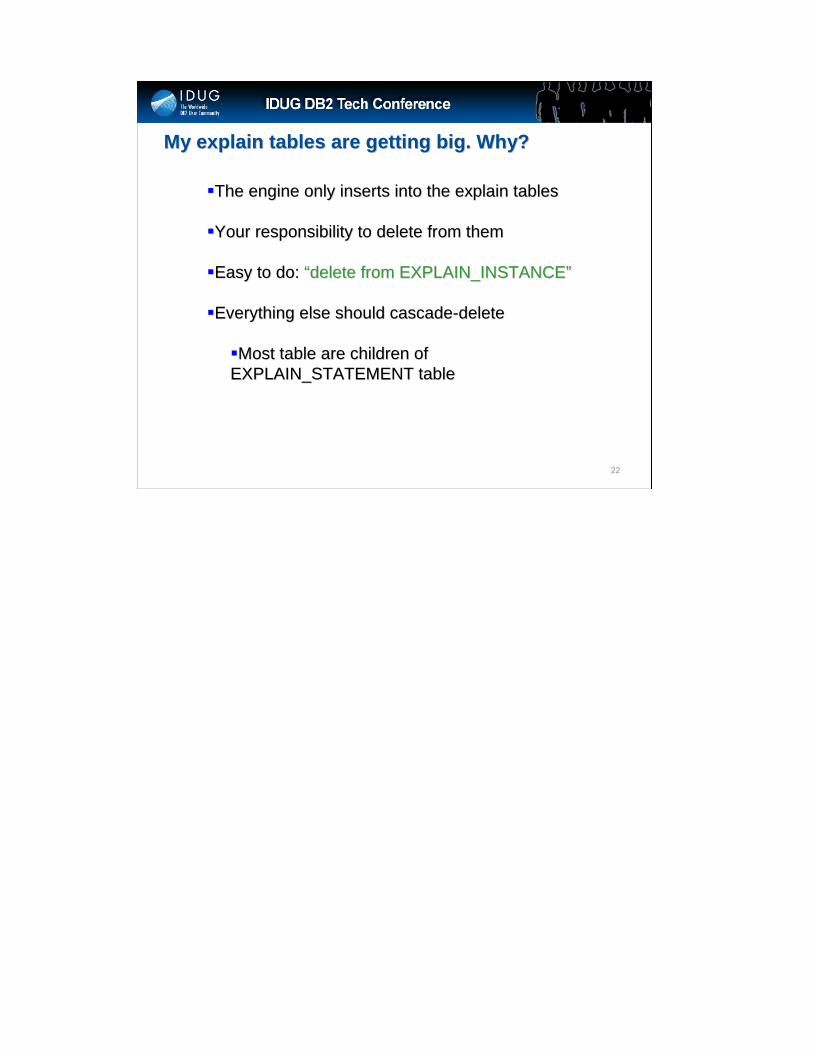
My explain tables are getting big. Why?My explain tables are getting big. Why?
The engine only inserts into the explain tablesThe engine only inserts into the explain tables
Your responsibility to delete from themYour responsibility to delete from them
Easy to do: Easy to do: ““delete from EXPLAIN_INSTANCEdelete from EXPLAIN_INSTANCE””
Everything else should cascadeEverything else should cascade--deletedelete
Most table are children of Most table are children of EXPLAIN_STATEMENT tableEXPLAIN_STATEMENT table

Click to edit Master title style
23
What else can I do with the explain information?What else can I do with the explain information?
Run custom queries to mine information about your explain plansRun custom queries to mine information about your explain plans
ƒƒ Search for sorts, or group bys on sets of columns and base tableSearch for sorts, or group bys on sets of columns and base tables that s that occur frequently, and could be beneficial as an index or MQToccur frequently, and could be beneficial as an index or MQT
ƒƒ Search for expensive operations, large or spilling sorts, high bSearch for expensive operations, large or spilling sorts, high buffer usage, uffer usage, high TQ usage, etc...high TQ usage, etc...
ƒƒ Search for expensive plans to further examine for database optimSearch for expensive plans to further examine for database optimizationsizationsƒƒ Search for common predicates that could form potential start/stoSearch for common predicates that could form potential start/stop keys for p keys for
an indexan indexƒƒ Your imagination and SQL skills are your only limits!Your imagination and SQL skills are your only limits!
Click to edit Master title style
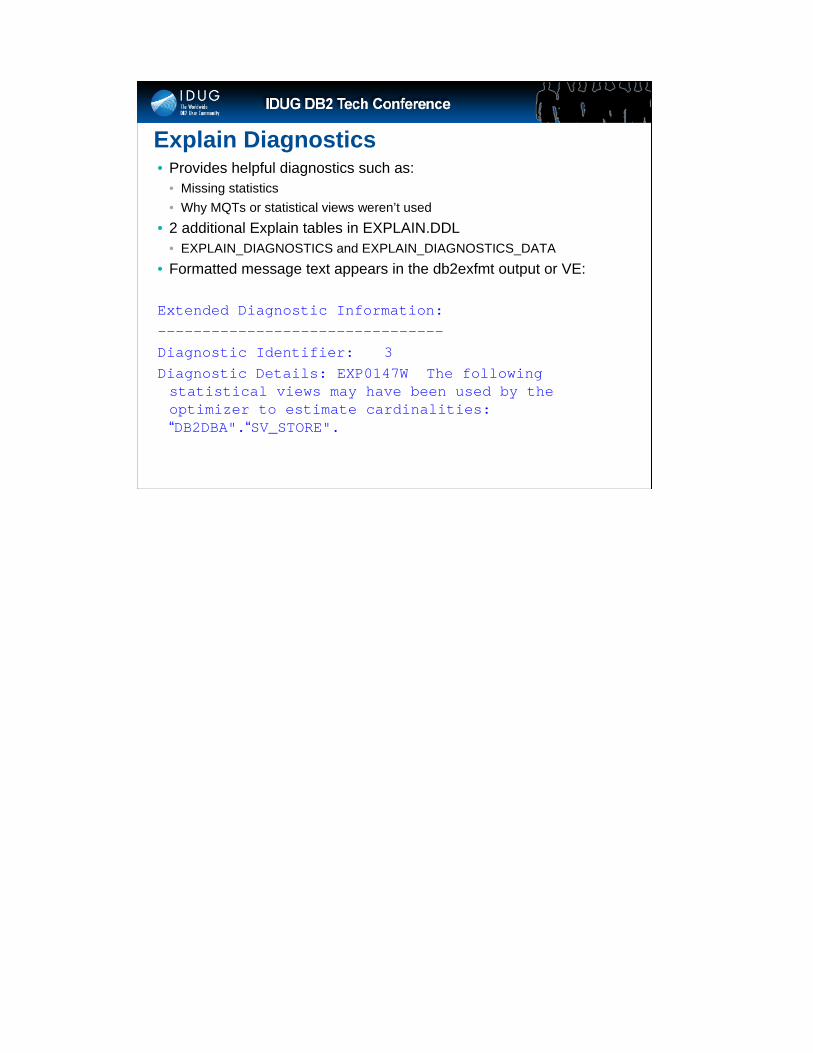
Explain Diagnostics• Provides helpful diagnostics such as:
• Missing statistics• Why MQTs or statistical views weren’t used
• 2 additional Explain tables in EXPLAIN.DDL• EXPLAIN_DIAGNOSTICS and EXPLAIN_DIAGNOSTICS_DATA
• Formatted message text appears in the db2exfmt output or VE:
Extended Diagnostic Information:--------------------------------Diagnostic Identifier: 3Diagnostic Details: EXP0147W The following statistical views may have been used by the optimizer to estimate cardinalities: “DB2DBA".“SV_STORE".
Click to edit Master title style
Comparing access plans using explain• See db2perf_plandiff in:
• ftp://ftp.software.ibm.com/ps/products/db2/tools/db2perf-1.0.1.zip

Click to edit Master title style
26
AgendaAgenda
Optimizer Overview
The Explain Facility
The Query Access PlanOptimized SQLPlan operators, arguments and propertiesPredicate applicationExecution flow (serial and parallel)
Click to edit Master title style
27
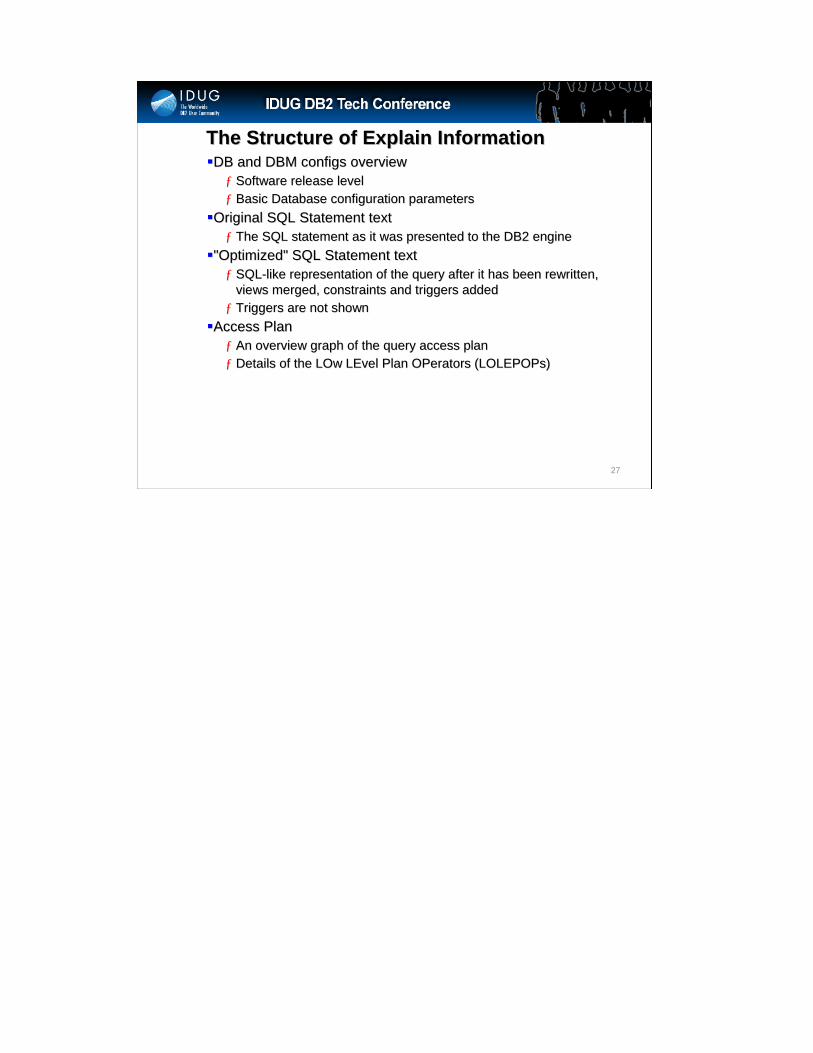
The Structure of Explain InformationThe Structure of Explain InformationDB and DBM configs overviewDB and DBM configs overview
ƒƒ Software release levelSoftware release levelƒƒ Basic Database configuration parametersBasic Database configuration parameters
Original SQL Statement textOriginal SQL Statement textƒƒ The SQL statement as it was presented to the DB2 engineThe SQL statement as it was presented to the DB2 engine
"Optimized" SQL Statement text"Optimized" SQL Statement textƒƒ SQLSQL--like representation of the query after it has been rewritten, like representation of the query after it has been rewritten,
views merged, constraints and triggers addedviews merged, constraints and triggers addedƒƒ Triggers are not shown Triggers are not shown
Access PlanAccess Planƒƒ An overview graph of the query access planAn overview graph of the query access planƒƒ Details of the LOw LEvel Plan OPerators (LOLEPOPs)Details of the LOw LEvel Plan OPerators (LOLEPOPs)
Click to edit Master title style
28
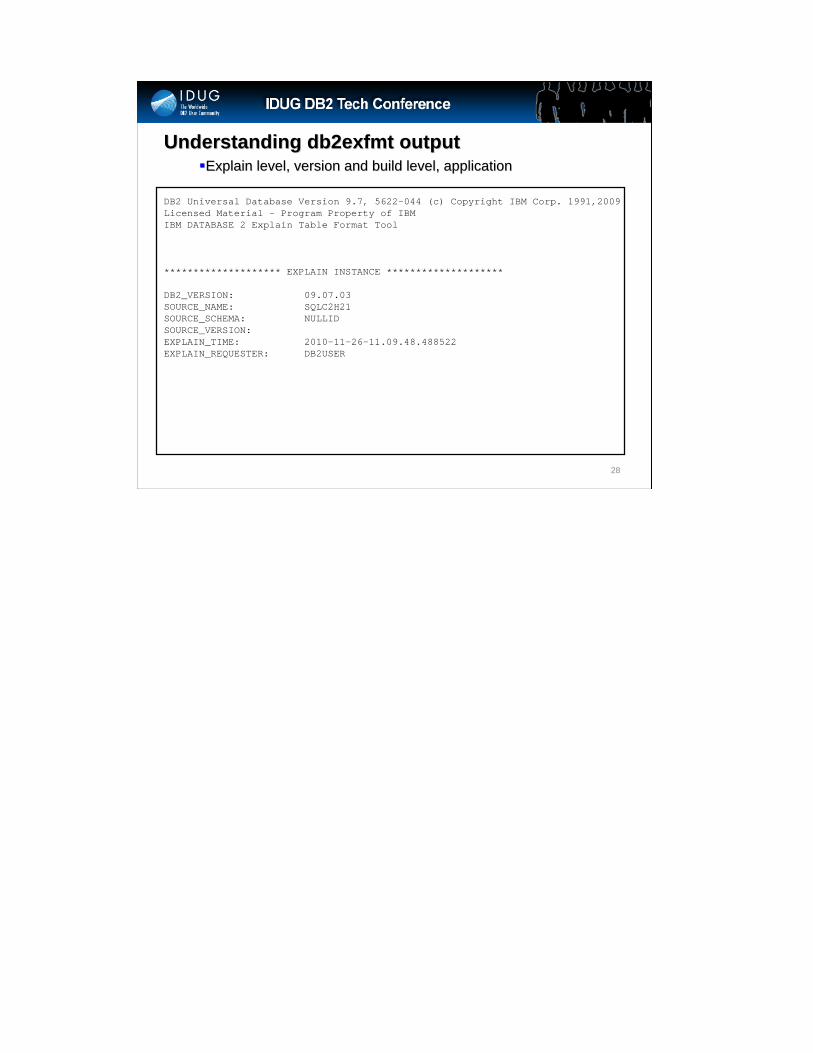
Understanding db2exfmt outputUnderstanding db2exfmt outputExplain level, version and build level, applicationExplain level, version and build level, application
DB2 Universal Database Version 9.7, 5622-044 (c) Copyright IBM Corp. 1991,2009Licensed Material - Program Property of IBMIBM DATABASE 2 Explain Table Format Tool
******************** EXPLAIN INSTANCE ********************
DB2_VERSION: 09.07.03SOURCE_NAME: SQLC2H21SOURCE_SCHEMA: NULLIDSOURCE_VERSION:EXPLAIN_TIME: 2010-11-26-11.09.48.488522EXPLAIN_REQUESTER: DB2USER
Click to edit Master title style
29
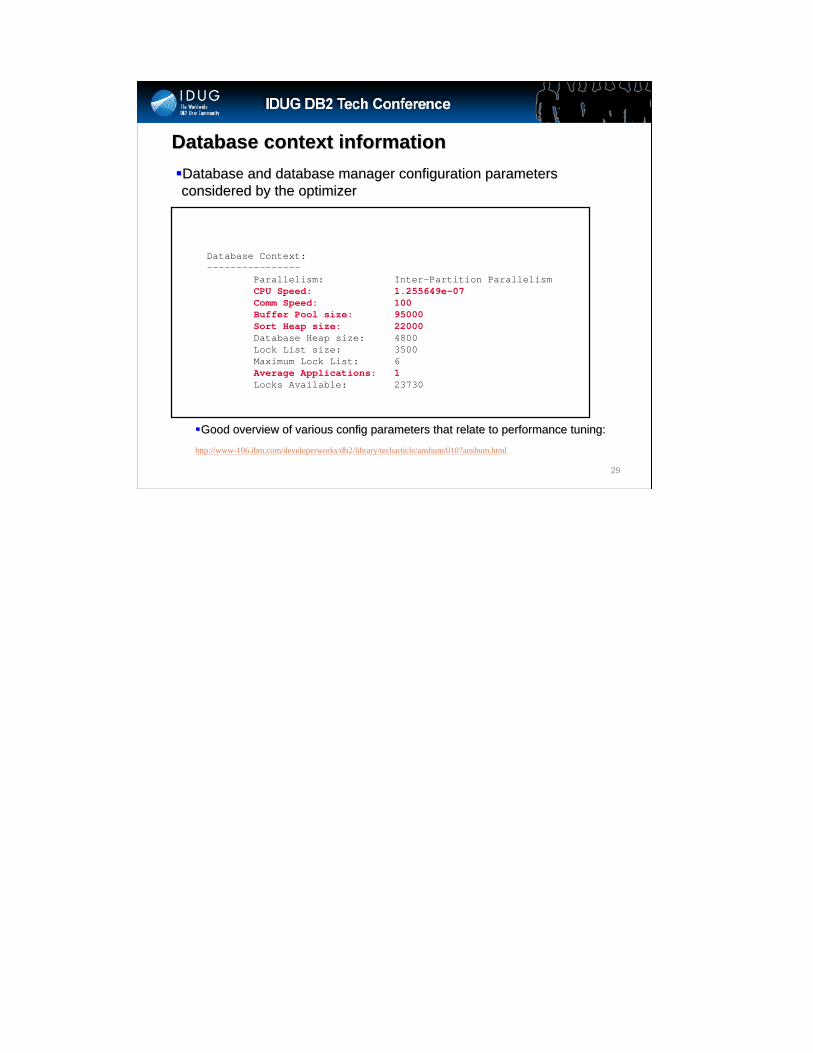
Database context informationDatabase context informationDatabase and database manager configuration parameters Database and database manager configuration parameters considered by the optimizerconsidered by the optimizer
Database Context:----------------
Parallelism: Inter-Partition ParallelismCPU Speed: 1.255649e-07Comm Speed: 100Buffer Pool size: 95000Sort Heap size: 22000Database Heap size: 4800Lock List size: 3500Maximum Lock List: 6Average Applications: 1Locks Available: 23730
Good overview of various config parameters that relate to perforGood overview of various config parameters that relate to performance tuning:mance tuning:
http://www-106.ibm.com/developerworks/db2/library/techarticle/anshum/0107anshum.html
Click to edit Master title style
30
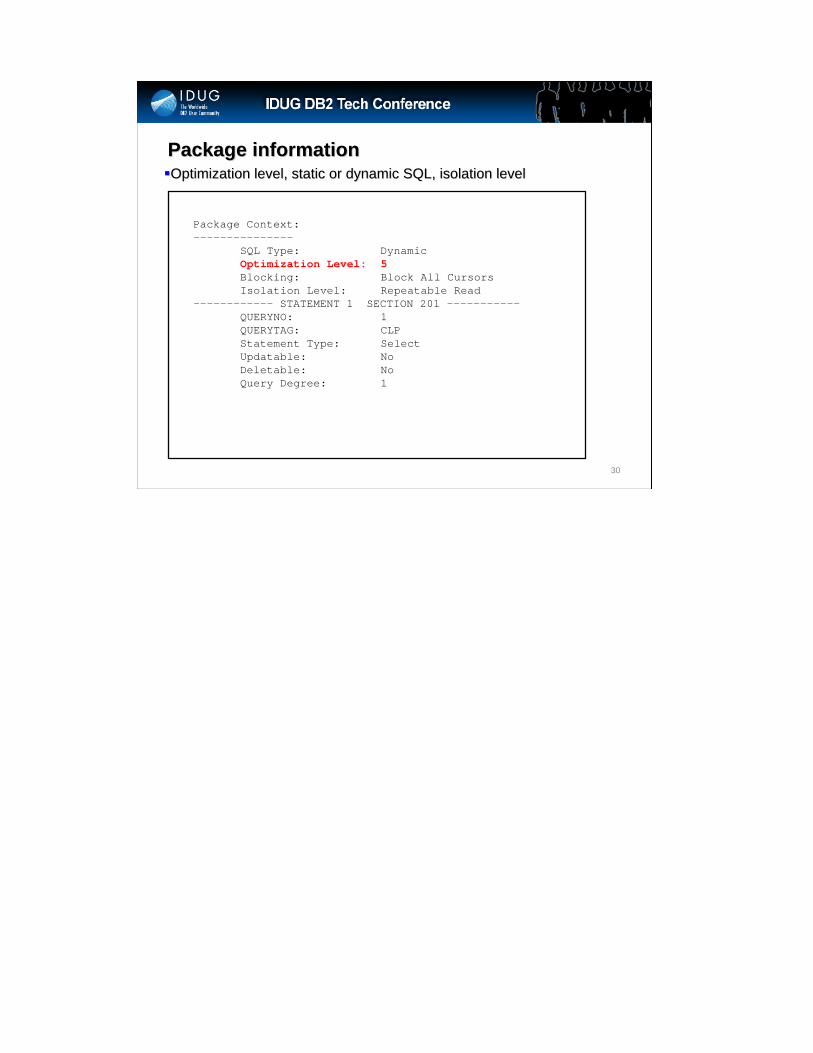
Package informationPackage informationOptimization level, static or dynamic SQL, isolation levelOptimization level, static or dynamic SQL, isolation level
Package Context:---------------
SQL Type: DynamicOptimization Level: 5Blocking: Block All CursorsIsolation Level: Repeatable Read
------------ STATEMENT 1 SECTION 201 -----------QUERYNO: 1QUERYTAG: CLP Statement Type: SelectUpdatable: NoDeletable: NoQuery Degree: 1
Click to edit Master title style
31
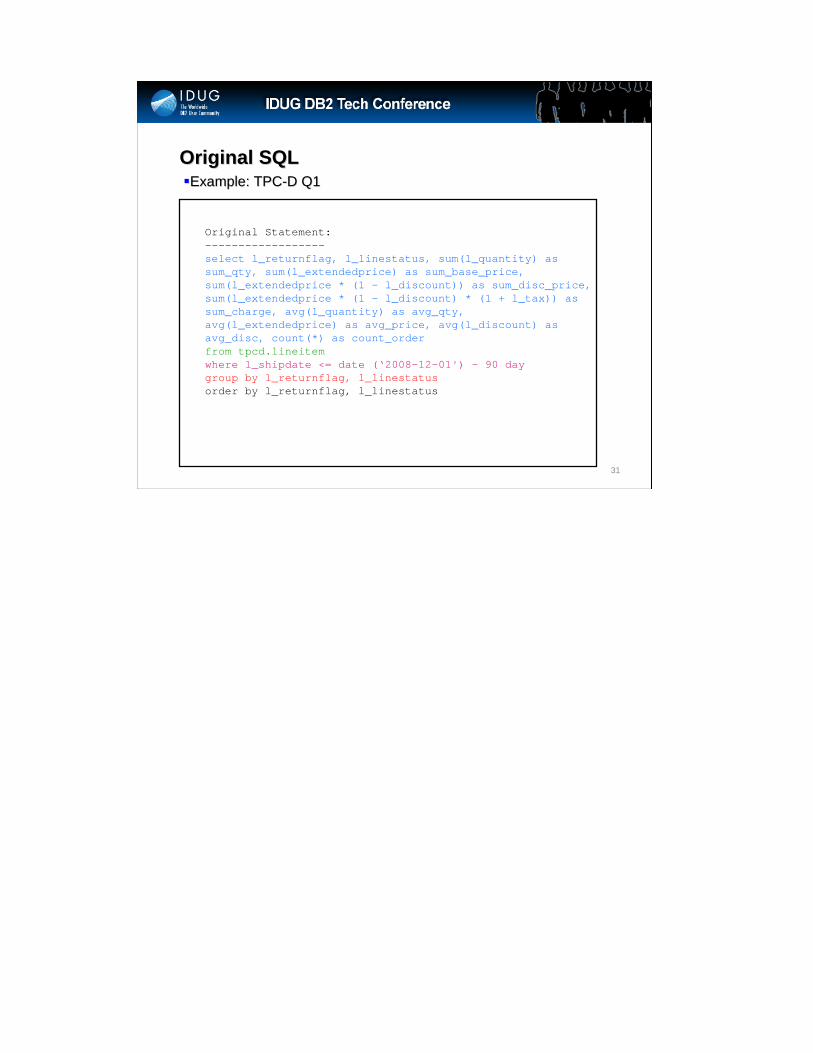
Original SQLOriginal SQLExample: TPCExample: TPC--D Q1D Q1
Original Statement:------------------select l_returnflag, l_linestatus, sum(l_quantity) as sum_qty, sum(l_extendedprice) as sum_base_price, sum(l_extendedprice * (1 - l_discount)) as sum_disc_price, sum(l_extendedprice * (1 - l_discount) * (1 + l_tax)) as sum_charge, avg(l_quantity) as avg_qty, avg(l_extendedprice) as avg_price, avg(l_discount) as avg_disc, count(*) as count_orderfrom tpcd.lineitemwhere l_shipdate <= date (‘2008-12-01') - 90 day group by l_returnflag, l_linestatusorder by l_returnflag, l_linestatus
Click to edit Master title style
32
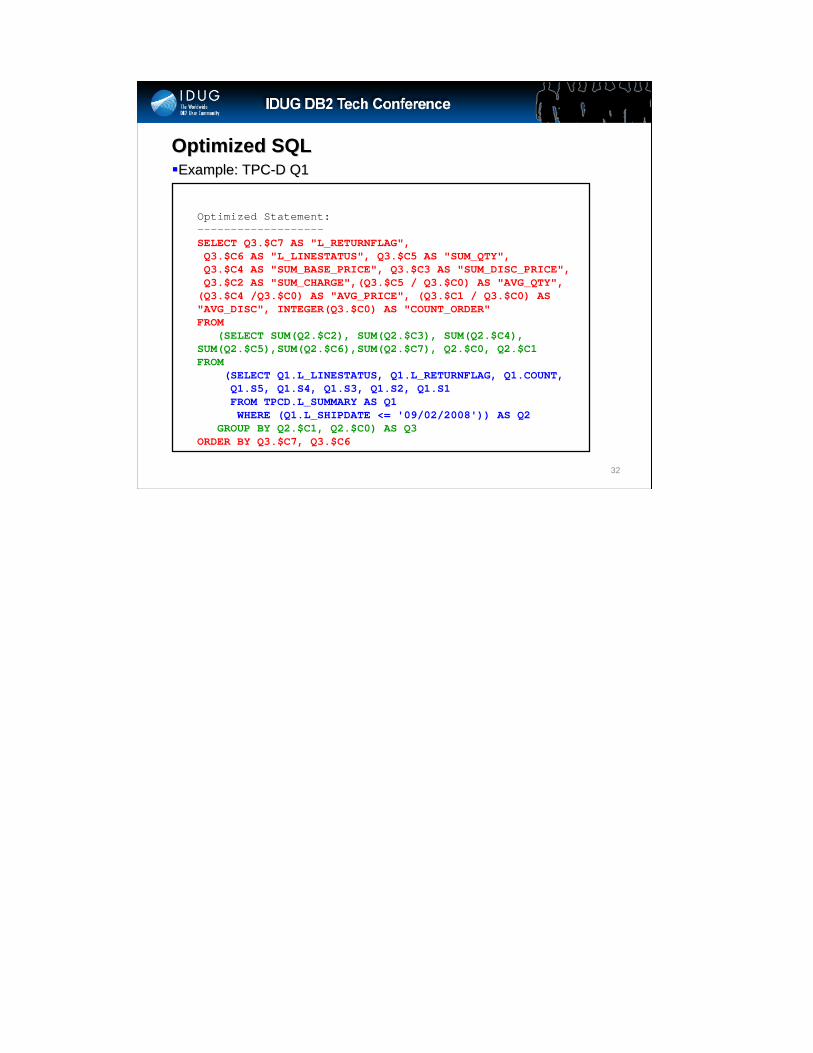
Optimized SQLOptimized SQL
Optimized Statement:-------------------SELECT Q3.$C7 AS "L_RETURNFLAG",Q3.$C6 AS "L_LINESTATUS", Q3.$C5 AS "SUM_QTY",Q3.$C4 AS "SUM_BASE_PRICE", Q3.$C3 AS "SUM_DISC_PRICE",Q3.$C2 AS "SUM_CHARGE",(Q3.$C5 / Q3.$C0) AS "AVG_QTY",
(Q3.$C4 /Q3.$C0) AS "AVG_PRICE", (Q3.$C1 / Q3.$C0) AS "AVG_DISC", INTEGER(Q3.$C0) AS "COUNT_ORDER" FROM
(SELECT SUM(Q2.$C2), SUM(Q2.$C3), SUM(Q2.$C4), SUM(Q2.$C5),SUM(Q2.$C6),SUM(Q2.$C7), Q2.$C0, Q2.$C1 FROM
(SELECT Q1.L_LINESTATUS, Q1.L_RETURNFLAG, Q1.COUNT,Q1.S5, Q1.S4, Q1.S3, Q1.S2, Q1.S1FROM TPCD.L_SUMMARY AS Q1 WHERE (Q1.L_SHIPDATE <= '09/02/2008')) AS Q2
GROUP BY Q2.$C1, Q2.$C0) AS Q3 ORDER BY Q3.$C7, Q3.$C6
Example: TPCExample: TPC--D Q1D Q1

Click to edit Master title style
33
Internal column naming conventionInternal column naming conventionInternal name represents position in select listInternal name represents position in select list
Optimized Statement:-------------------SELECT Q3.$C7 AS "L_RETURNFLAG", ...FROM
(SELECT SUM(Q2.$C2), SUM(Q2.$C3), SUM(Q2.$C4), SUM(Q2.$C5),SUM(Q2.$C6),SUM(Q2.$C7), Q2.$C0, Q2.$C1FROM
(SELECT Q1.L_LINESTATUS, Q1.L_RETURNFLAG, Q1.COUNT, Q1.S5, Q1.S4, Q1.S3, Q1.S2, Q1.S1
FROM TPCD.L_SUMMARY AS Q1WHERE (Q1.L_SHIPDATE <= '09/02/2008')) AS Q2
GROUP BY Q2.$C1, Q2.$C0) AS Q3ORDER BY Q3.$C7, Q3.$C6

Click to edit Master title style
34
Query Rewrite OptimizationsQuery Rewrite OptimizationsAutomatic redirection to materialized query tables (MQTs)Automatic redirection to materialized query tables (MQTs)
Original Statement:------------------select ...from tpcd.lineitem
Optimized Statement:-------------------SELECT ...FROM
(SELECT ...FROM (SELECT ...FROM TPCD.L_SUMMARY AS Q1
) AS Q2 ) AS Q3

Click to edit Master title style
35
Query Rewrite OptimizationsQuery Rewrite OptimizationsPrePre--computation of constant expressionscomputation of constant expressions
Original Statement:------------------select ...from tpcd.lineitem where l_shipdate <= date (‘2008-12-01') - 90 day
Optimized Statement:-------------------SELECT ...FROM
(SELECT ...FROM (SELECT ...FROM TPCD.L_SUMMARY AS Q1 WHERE (Q1.L_SHIPDATE <= '09/02/2008')
) AS Q2 ) AS Q3
Click to edit Master title style
36
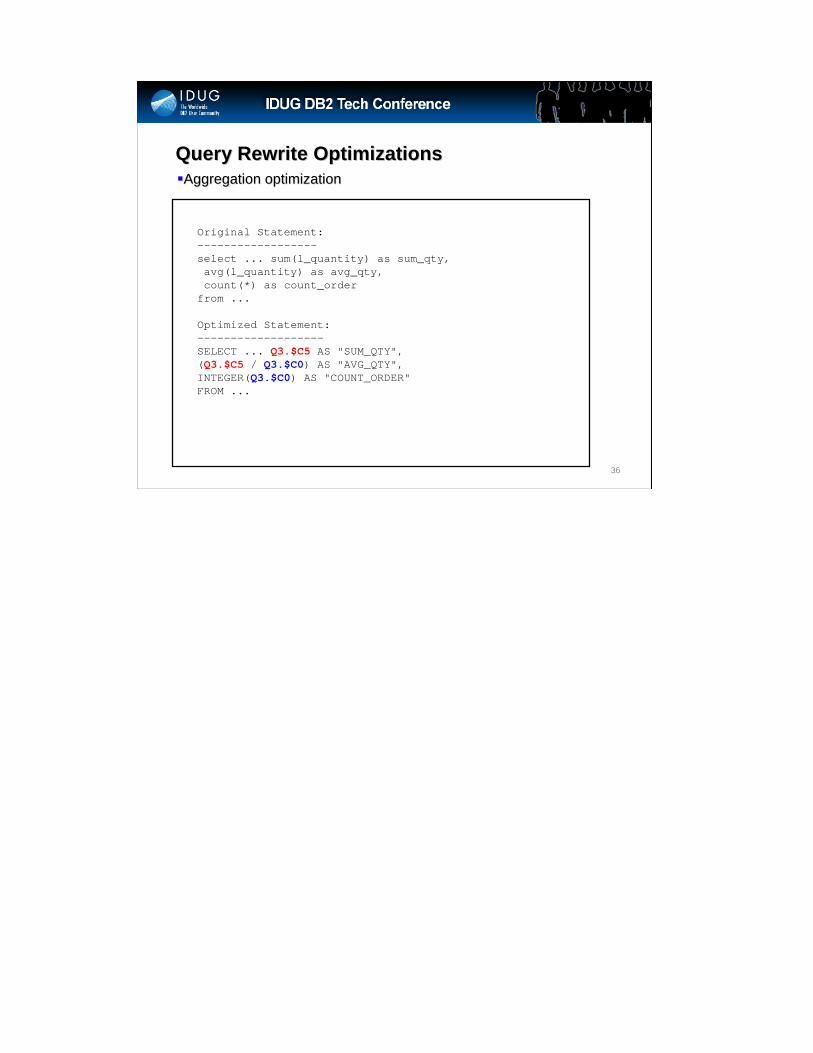
Query Rewrite OptimizationsQuery Rewrite OptimizationsAggregation optimizationAggregation optimization
Original Statement:------------------select ... sum(l_quantity) as sum_qty, avg(l_quantity) as avg_qty, count(*) as count_order
from ...
Optimized Statement:-------------------SELECT ... Q3.$C5 AS "SUM_QTY", (Q3.$C5 / Q3.$C0) AS "AVG_QTY", INTEGER(Q3.$C0) AS "COUNT_ORDER" FROM ...

Click to edit Master title style
37
Access plan graphAccess plan graphRows
RETURN ( 1) Cost I/O|
3.87404NLJOIN( 13)125.206
5/-------+------\
0.968511 4 IXSCAN FETCH ( 14) ( 15) 75.0966 100.118
3 4 | /----+---\
4.99966e+06 4 1.99987e+07 INDEX: TPCD IXSCAN TABLE: TPCD UXP_NMPK ( 16) PARTSUPP
75.1018 3 |
1.99987e+07 INDEX: TPCD.UXPS_PK2KSC
Cardinality (rows)Operator name(Operator ID)
Cost (timerons)I/O (pages)
Data flow diagram comprised of Data flow diagram comprised of access plan operatorsaccess plan operators
Base table cardinality
1
2
3
4
Click to edit Master title style
38
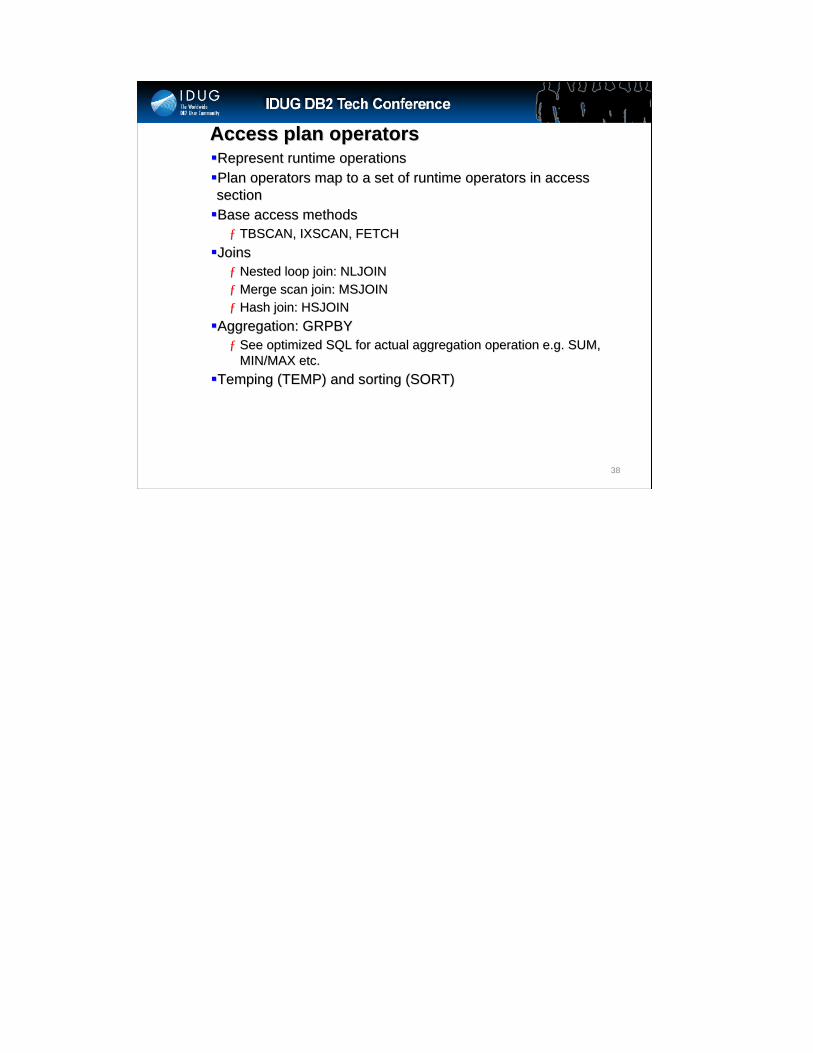
Represent runtime operationsRepresent runtime operationsPlan operators map to a set of runtime operators in access Plan operators map to a set of runtime operators in access sectionsectionBase access methodsBase access methods
ƒƒ TBSCAN, IXSCAN, FETCHTBSCAN, IXSCAN, FETCHJoinsJoins
ƒƒ Nested loop join: NLJOINNested loop join: NLJOINƒƒ Merge scan join: MSJOINMerge scan join: MSJOINƒƒ Hash join: HSJOINHash join: HSJOIN
Aggregation: GRPBYAggregation: GRPBYƒƒ See optimized SQL for actual aggregation operation e.g. SUM, See optimized SQL for actual aggregation operation e.g. SUM,
MIN/MAX etc.MIN/MAX etc.Temping (TEMP) and sorting (SORT)Temping (TEMP) and sorting (SORT)
Access plan operators Access plan operators
Click to edit Master title style
39
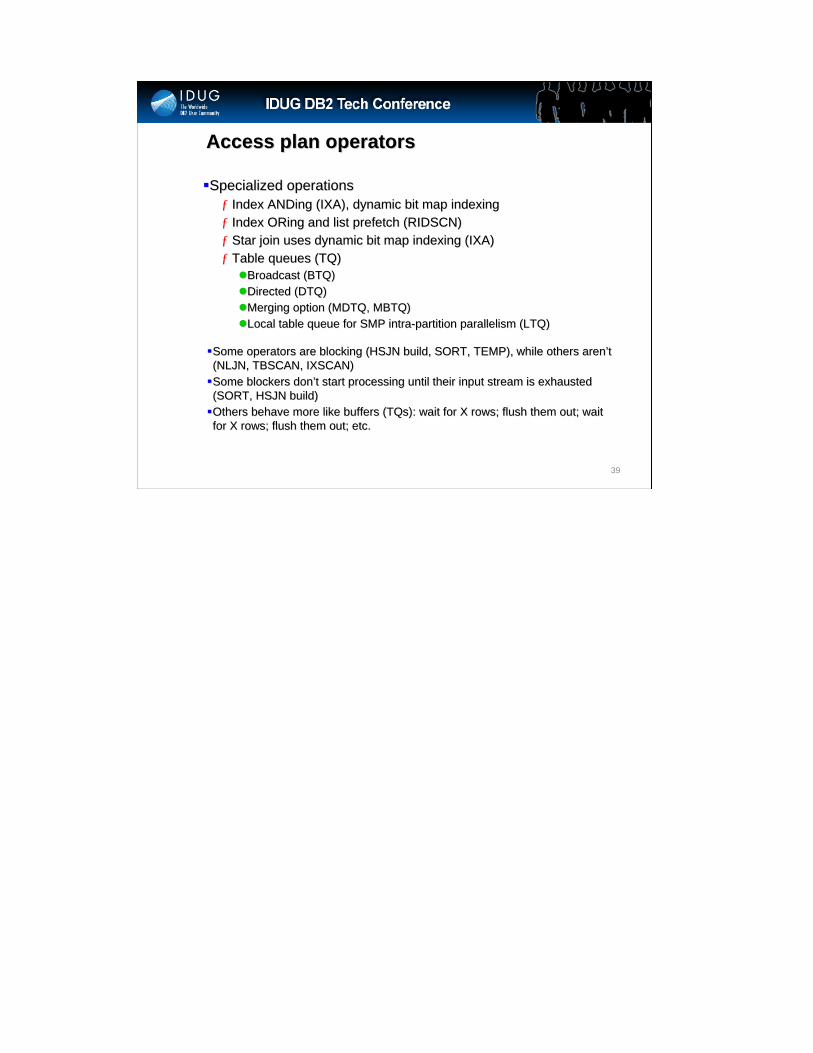
Specialized operationsSpecialized operationsƒƒ Index ANDing (IXA), dynamic bit map indexingIndex ANDing (IXA), dynamic bit map indexingƒƒ Index ORing and list prefetch (RIDSCN)Index ORing and list prefetch (RIDSCN)ƒƒ Star join uses dynamic bit map indexing (IXA)Star join uses dynamic bit map indexing (IXA)ƒƒ Table queues (TQ)Table queues (TQ)
Broadcast (BTQ)Broadcast (BTQ)Directed (DTQ)Directed (DTQ)Merging option (MDTQ, MBTQ)Merging option (MDTQ, MBTQ)Local table queue for SMP intraLocal table queue for SMP intra--partition parallelism (LTQ)partition parallelism (LTQ)
Access plan operators Access plan operators
Some operators are blocking (HSJN build, SORT, TEMP), while otheSome operators are blocking (HSJN build, SORT, TEMP), while others arenrs aren’’t t (NLJN, TBSCAN, IXSCAN)(NLJN, TBSCAN, IXSCAN)Some blockers donSome blockers don’’t start processing until their input stream is exhausted t start processing until their input stream is exhausted (SORT, HSJN build)(SORT, HSJN build)Others behave more like buffers (Others behave more like buffers (TQsTQs): wait for X rows; flush them out; wait ): wait for X rows; flush them out; wait for X rows; flush them out; etc.for X rows; flush them out; etc.
Click to edit Master title style
40
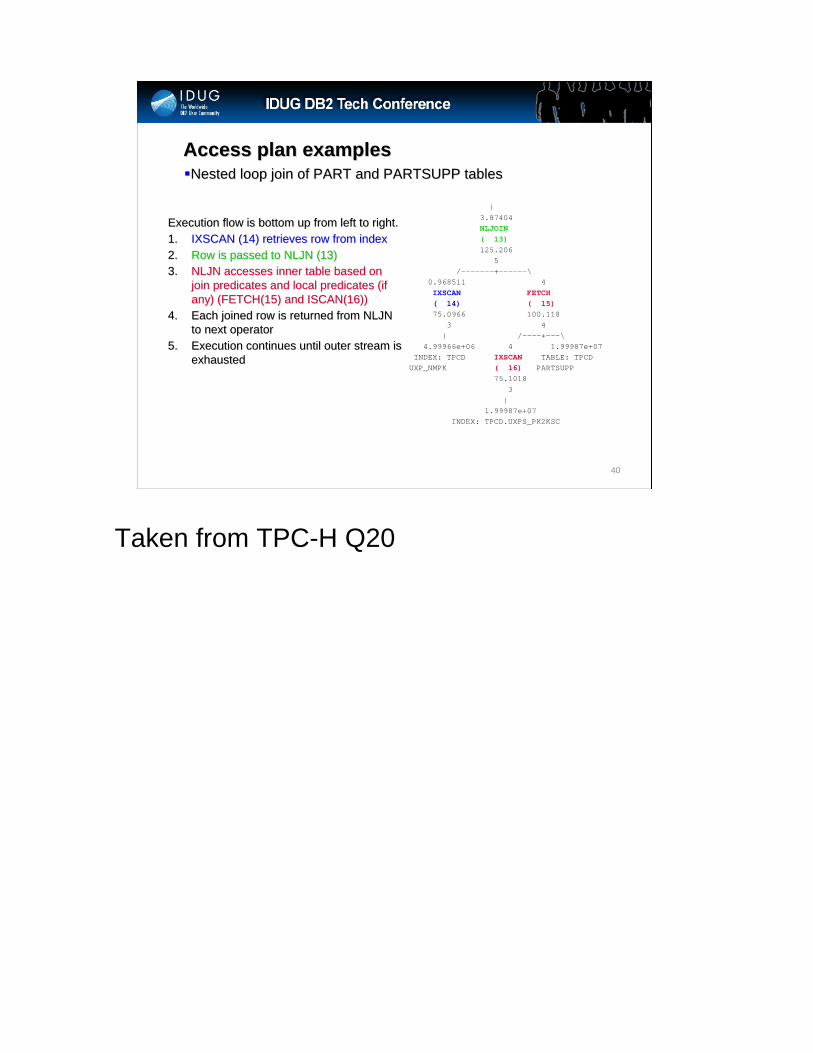
Nested loop join of PART and PARTSUPP tablesNested loop join of PART and PARTSUPP tablesAccess plan examplesAccess plan examples
| 3.87404 NLJOIN( 13)125.206
5 /-------+------\
0.968511 4 IXSCAN FETCH ( 14) ( 15)75.0966 100.118
3 4 | /----+---\
4.99966e+06 4 1.99987e+07 INDEX: TPCD IXSCAN TABLE: TPCD
UXP_NMPK ( 16) PARTSUPP 75.1018
3 |
1.99987e+07 INDEX: TPCD.UXPS_PK2KSC
Execution flow is bottom up from left to right.Execution flow is bottom up from left to right.1.1. IXSCAN (14) retrieves row from indexIXSCAN (14) retrieves row from index2.2. Row is passed to NLJN (13)Row is passed to NLJN (13)3.3. NLJN accesses inner table based on NLJN accesses inner table based on
join predicates and local predicates (if join predicates and local predicates (if any) (FETCH(15) and ISCAN(16))any) (FETCH(15) and ISCAN(16))
4.4. Each joined row is returned from NLJN Each joined row is returned from NLJN to next operatorto next operator
5.5. Execution continues until outer stream is Execution continues until outer stream is exhaustedexhausted
Taken from TPC-H Q20

Click to edit Master title style
41
Nested loop join of PART and PARTSUPP tablesNested loop join of PART and PARTSUPP tablesAccess plan examplesAccess plan examples
| 3.87404 NLJOIN ( 13) 125.206
5 /-------+------\
0.968511 4 IXSCAN FETCH( 14) ( 15) 75.0966 100.118
3 4 | /----+---\
4.99966e+06 4 1.99987e+07 INDEX: TPCD IXSCAN TABLE: TPCD
UXP_NMPK ( 16) PARTSUPP 75.1018
3 |
1.99987e+07 INDEX: TPCD.UXPS_PK2KSC
Data page FETCH required on innerWhy?
Index only access on outer
On which columns are thetables being joined?
Why is answered on the page 'Insight From Operator Details', slide 41
Click to edit Master title style
42
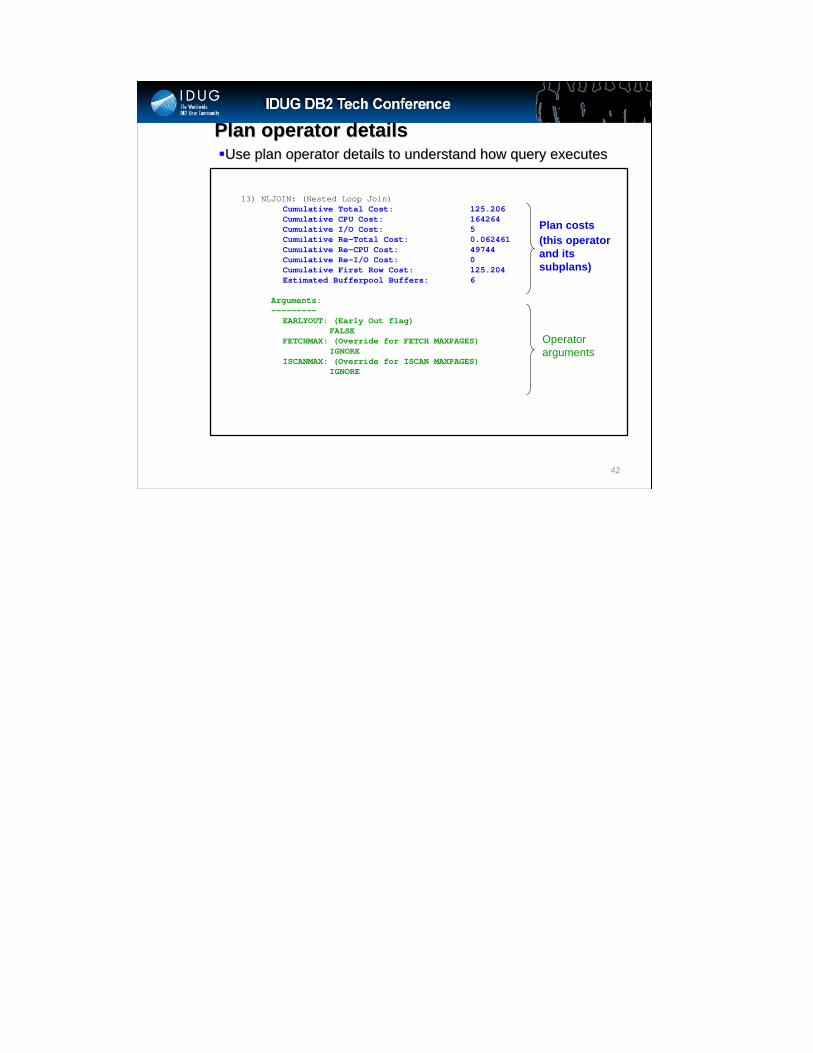
Use plan operator details to understand how query executesUse plan operator details to understand how query executesPlan operator detailsPlan operator details
13) NLJOIN: (Nested Loop Join)Cumulative Total Cost: 125.206Cumulative CPU Cost: 164264Cumulative I/O Cost: 5Cumulative Re-Total Cost: 0.062461Cumulative Re-CPU Cost: 49744Cumulative Re-I/O Cost: 0Cumulative First Row Cost: 125.204Estimated Bufferpool Buffers: 6
Arguments:---------
EARLYOUT: (Early Out flag)FALSE
FETCHMAX: (Override for FETCH MAXPAGES)IGNORE
ISCANMAX: (Override for ISCAN MAXPAGES)IGNORE
Plan costs(this operator and its subplans)
Operator arguments

Click to edit Master title style
43
Total cost in units of timerons Total cost in units of timerons ƒƒ Based on milliseconds Based on milliseconds
Not elapsed time in serial environmentNot elapsed time in serial environmentElapsed timeElapsed time--based in parallel environmentbased in parallel environment
Cost model is based on Cost model is based on resource consumptionresource consumptionƒƒ Total CPU and I/O resources consumedTotal CPU and I/O resources consumed
Communication costs are considered in parallel environmentCommunication costs are considered in parallel environmentElapsed time could be different because of parallel I/O and Elapsed time could be different because of parallel I/O and overlap between CPU and I/O operations in a serial overlap between CPU and I/O operations in a serial environmentenvironmentPlan costs arePlan costs are cumulativecumulative
ƒƒ In general, each plan operator adds cost to the planIn general, each plan operator adds cost to the plan
Plan operator costsPlan operator costs
Click to edit Master title style
44
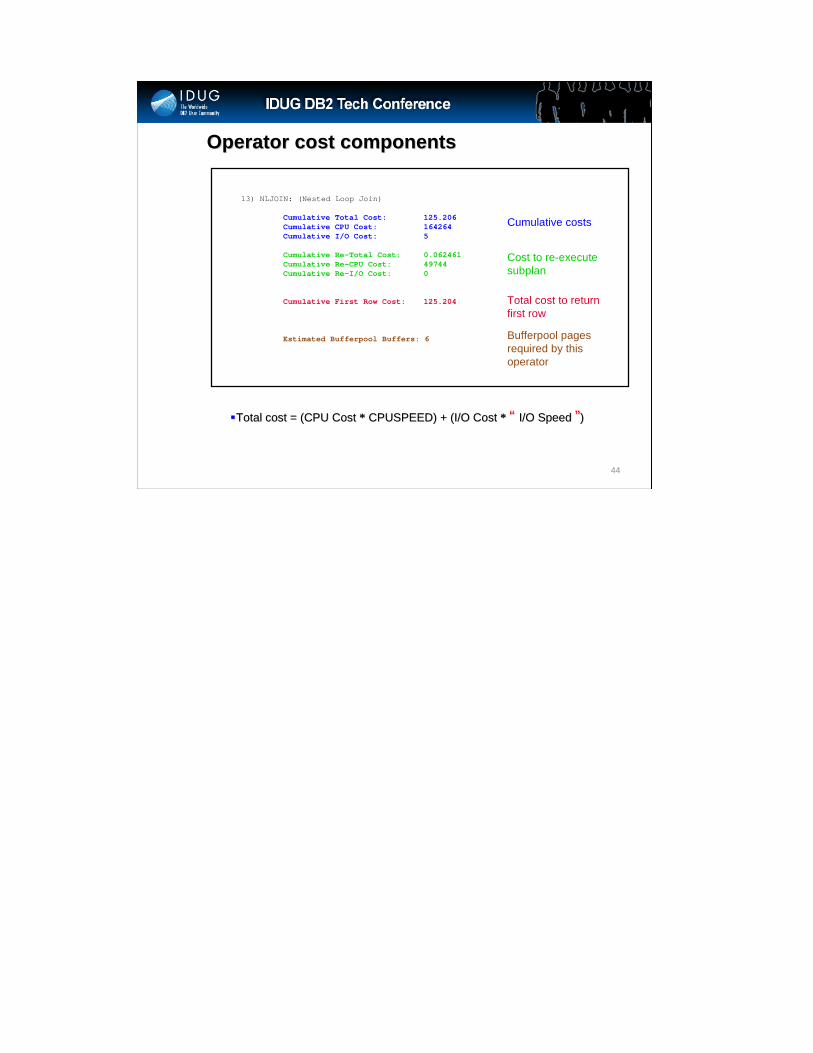
Operator cost componentsOperator cost components
13) NLJOIN: (Nested Loop Join)
Cumulative Total Cost: 125.206Cumulative CPU Cost: 164264Cumulative I/O Cost: 5
Cumulative Re-Total Cost: 0.062461Cumulative Re-CPU Cost: 49744Cumulative Re-I/O Cost: 0
Cumulative First Row Cost: 125.204
Estimated Bufferpool Buffers: 6
Cumulative costs
Cost to re-execute subplan
Total cost to return first row
Bufferpool pages required by this operator
Total cost = (CPU Cost Total cost = (CPU Cost ** CPUSPEED) + (I/O Cost CPUSPEED) + (I/O Cost ** ““ I/O Speed I/O Speed ””))

Click to edit Master title style
45
Operator argumentsOperator arguments
13) NLJOIN: (Nested Loop Join)Arguments:---------EARLYOUT: (Early Out flag)
FALSE
FETCHMAX: (Override for FETCH MAXPAGES)IGNORE
ISCANMAX: (Override for ISCAN MAXPAGES)IGNORE
Provide details on how operator executesProvide details on how operator executesSee the DB2 Information Center, Explain Tables and See the DB2 Information Center, Explain Tables and Definitions, for complete descriptionDefinitions, for complete descriptionhttp://publib.boulder.ibm.com/infocenter/db2luw/v9r7/topic/com.ihttp://publib.boulder.ibm.com/infocenter/db2luw/v9r7/topic/com.ibm.db2.luw.sql.ref.doc/doc/r0008441.htmlbm.db2.luw.sql.ref.doc/doc/r0008441.html
Get next outer after finding first match on inner. Guaranteed one match on inner.
Maximum pages to prefetch for FETCH and IXSCAN.
NLJOIN can override original settings if an 'ordered' NLJOIN.
Click to edit Master title style
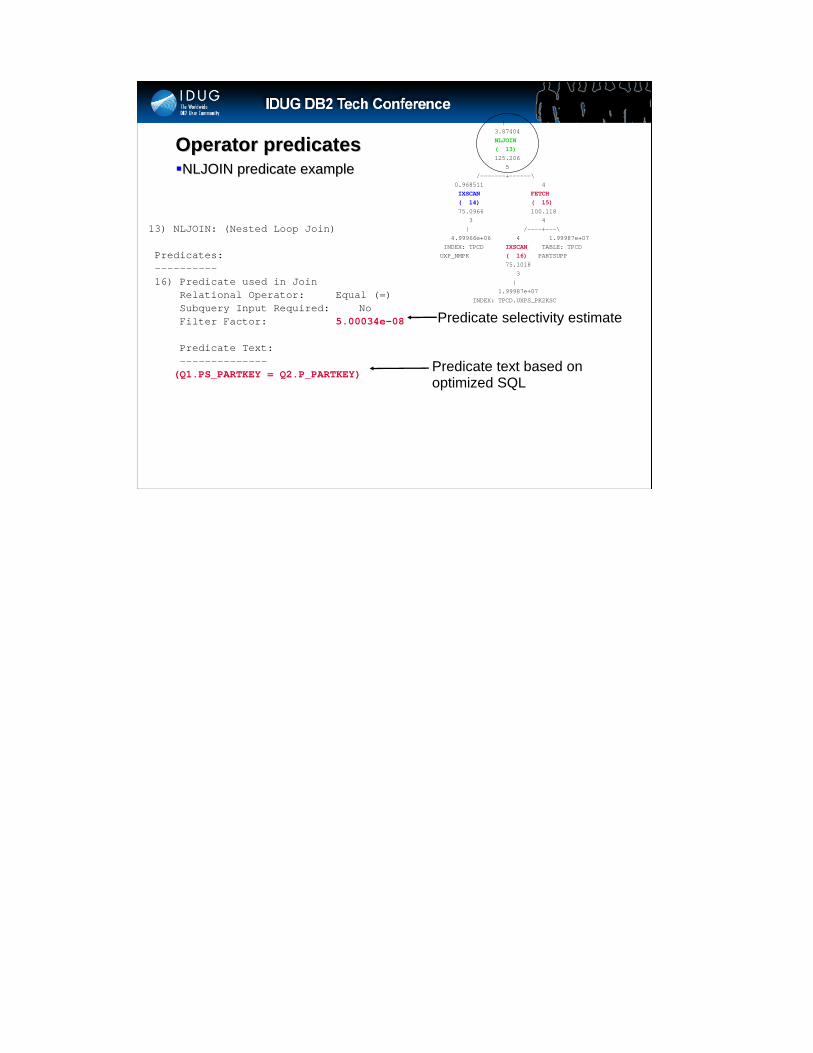
Operator predicatesOperator predicates
13) NLJOIN: (Nested Loop Join)
Predicates:----------16) Predicate used in Join
Relational Operator: Equal (=)Subquery Input Required: NoFilter Factor: 5.00034e-08
Predicate Text:--------------
(Q1.PS_PARTKEY = Q2.P_PARTKEY)
Predicate selectivity estimate
Predicate text based on optimized SQL
NLJOIN predicate exampleNLJOIN predicate example
| 3.87404 NLJOIN( 13)125.206
5 /-------+------\
0.968511 4 IXSCAN FETCH ( 14) ( 15)75.0966 100.118
3 4 | /----+---\
4.99966e+06 4 1.99987e+07 INDEX: TPCD IXSCAN TABLE: TPCD UXP_NMPK ( 16) PARTSUPP
75.1018 3 |
1.99987e+07 INDEX: TPCD.UXPS_PK2KSC
Click to edit Master title style
47
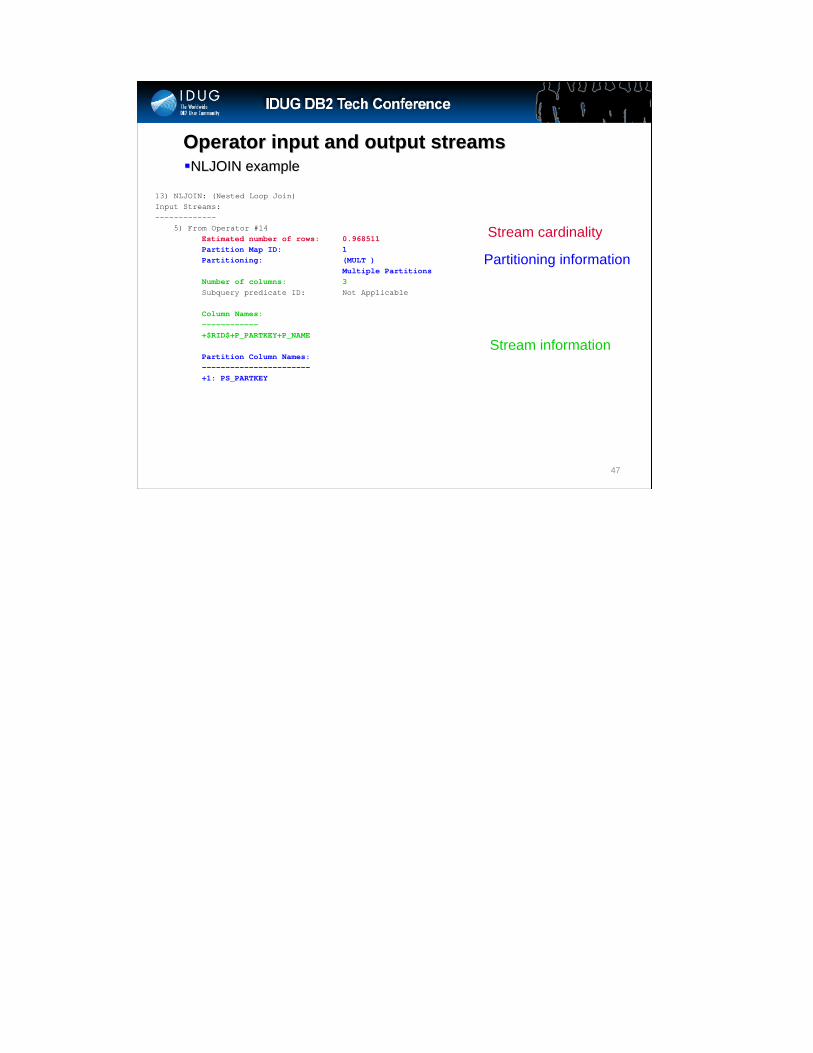
Operator input and output streamsOperator input and output streams
13) NLJOIN: (Nested Loop Join)Input Streams:-------------
5) From Operator #14Estimated number of rows: 0.968511Partition Map ID: 1Partitioning: (MULT )
Multiple PartitionsNumber of columns: 3Subquery predicate ID: Not Applicable
Column Names:------------+$RID$+P_PARTKEY+P_NAME
Partition Column Names:-----------------------+1: PS_PARTKEY
NLJOIN exampleNLJOIN example
Stream cardinality
Partitioning information
Stream information
Click to edit Master title style
48
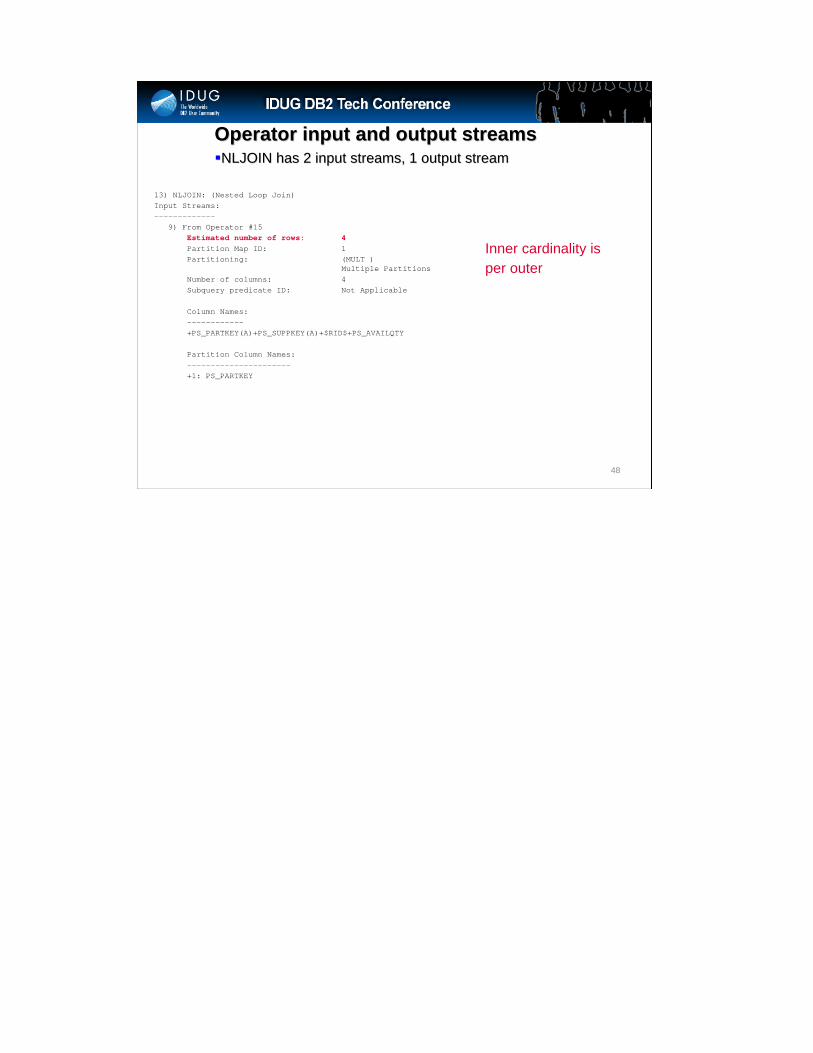
Operator input and output streamsOperator input and output streams
13) NLJOIN: (Nested Loop Join)Input Streams:-------------
9) From Operator #15Estimated number of rows: 4Partition Map ID: 1Partitioning: (MULT )
Multiple PartitionsNumber of columns: 4Subquery predicate ID: Not Applicable
Column Names:------------+PS_PARTKEY(A)+PS_SUPPKEY(A)+$RID$+PS_AVAILQTY
Partition Column Names:----------------------+1: PS_PARTKEY
NLJOIN has 2 input streams, 1 output streamNLJOIN has 2 input streams, 1 output stream
Inner cardinality isper outer

Click to edit Master title styleInsight from operator details Insight from operator details
15) FETCH : (Fetch)Arguments:---------...Input Streams:-------------
7) From Operator #16Column Names:------------+PS_PARTKEY(A)+PS_SUPPKEY(A)+$RID$
8) From Object TPCD.PARTSUPPColumn Names:------------+PS_AVAILQTY
Why was FETCH necessary on inner of NLJOIN(13) ?Why was FETCH necessary on inner of NLJOIN(13) ?
Column in stream isnot in index
| 3.87404 NLJOIN( 13)125.206
5 /-------+------\
0.968511 4 IXSCAN FETCH ( 14) ( 15)75.0966 100.118
3 4 | /----+---\
4.99966e+06 4 1.99987e+07 INDEX: TPCD IXSCAN TABLE: TPCD UXP_NMPK ( 16) PARTSUPP
75.1018 3 |
1.99987e+07 INDEX: TPCD.UXPS_PK2KSC
Click to edit Master title style
50
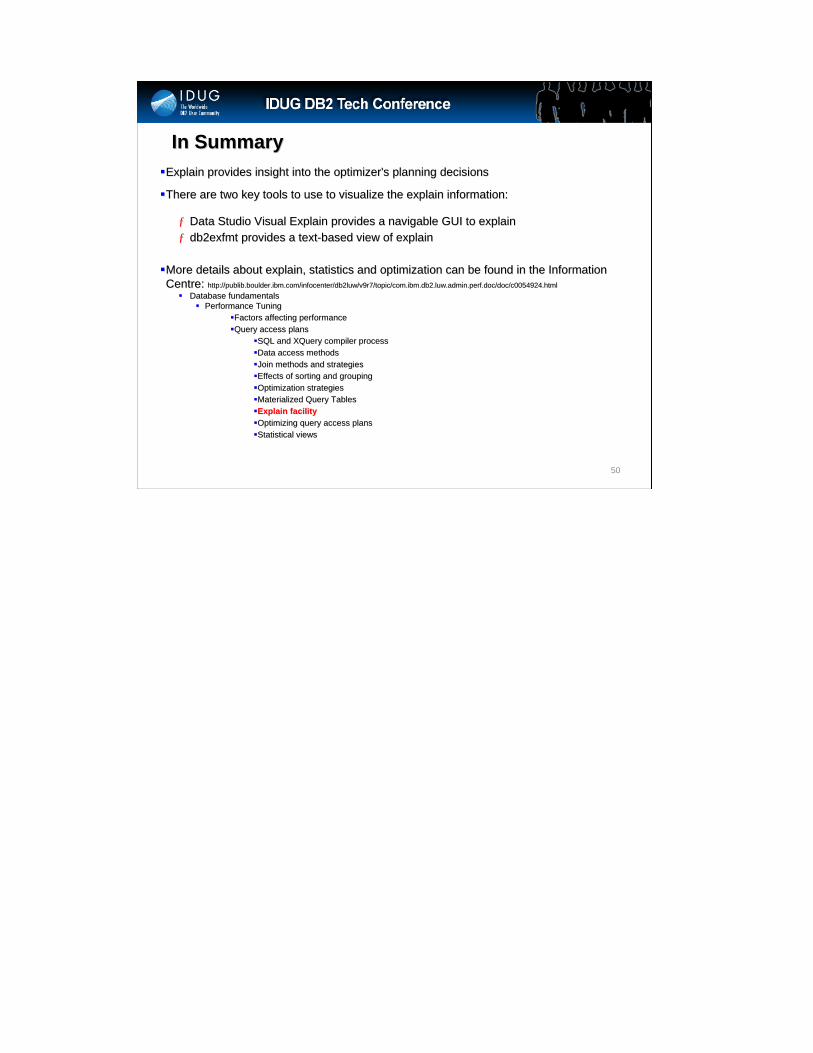
In SummaryIn SummaryExplain provides insight into the optimizer's planning decisionsExplain provides insight into the optimizer's planning decisions
There are two key tools to use to visualize the explain informatThere are two key tools to use to visualize the explain information:ion:
ƒƒ Data Studio Visual Explain provides a navigable GUI to explain Data Studio Visual Explain provides a navigable GUI to explain ƒƒ db2exfmt provides a textdb2exfmt provides a text--based view of explainbased view of explain
More details about explain, statistics and optimization can be fMore details about explain, statistics and optimization can be found in the Information ound in the Information Centre: Centre: http://publib.boulder.ibm.com/infocenter/db2luw/v9r7/topic/com.ihttp://publib.boulder.ibm.com/infocenter/db2luw/v9r7/topic/com.ibm.db2.luw.admin.perf.doc/doc/c0054924.html bm.db2.luw.admin.perf.doc/doc/c0054924.html
Database fundamentalsDatabase fundamentalsPerformance TuningPerformance Tuning
Factors affecting performanceFactors affecting performanceQuery access plansQuery access plans
SQL and SQL and XQueryXQuery compiler processcompiler processData access methodsData access methodsJoin methods and strategiesJoin methods and strategiesEffects of sorting and groupingEffects of sorting and groupingOptimization strategiesOptimization strategiesMaterialized Query TablesMaterialized Query TablesExplain facilityExplain facilityOptimizing query access plansOptimizing query access plansStatistical viewsStatistical views
John HornibrookIBM [email protected]
Session Code: D15Understanding DB2 LUW Query Access Plans Using the Explain Facility
Speaker Bio:John is a Senior Technical Staff Member and development manager for DB2 for Linux, UNIX and Windows query optimization,which includes statistics collection, the explain facility, and the design advisor. He has been a DB2 developerfor 20 years, focusing on the SQL compiler and relational data services components.
51