Blue cathodoluminescence from thulium implanted AlxGa1−xN and InxAl1−xN
8
This article was originally published in a journal published by Elsevier, and the attached copy is provided by Elsevier for the author’s benefit and for the benefit of the author’s institution, for non-commercial research and educational use including without limitation use in instruction at your institution, sending it to specific colleagues that you know, and providing a copy to your institution’s administrator. All other uses, reproduction and distribution, including without limitation commercial reprints, selling or licensing copies or access, or posting on open internet sites, your personal or institution’s website or repository, are prohibited. For exceptions, permission may be sought for such use through Elsevier’s permissions site at: http://www.elsevier.com/locate/permissionusematerial
-
Upload
independent -
Category
Documents
-
view
3 -
download
0
Transcript of Blue cathodoluminescence from thulium implanted AlxGa1−xN and InxAl1−xN

This article was originally published in a journal published byElsevier, and the attached copy is provided by Elsevier for the
author’s benefit and for the benefit of the author’s institution, fornon-commercial research and educational use including without
limitation use in instruction at your institution, sending it to specificcolleagues that you know, and providing a copy to your institution’s
administrator.
All other uses, reproduction and distribution, including withoutlimitation commercial reprints, selling or licensing copies or access,
or posting on open internet sites, your personal or institution’swebsite or repository, are prohibited. For exceptions, permission
may be sought for such use through Elsevier’s permissions site at:
http://www.elsevier.com/locate/permissionusematerial

Autho
r's
pers
onal
co
py
Superlattices and Microstructures 40 (2006) 445–451www.elsevier.com/locate/superlattices
Blue cathodoluminescence from thulium implantedAlxGa1−xN and InxAl1−xN
I.S. Roqana,∗, K. Lorenzb, K.P. O’Donnella, C. Trager-Cowana,R.W. Martina, I.M. Watsonc, E. Alvesb
a Department of Physics, SUPA, University of Strathclyde, Glasgow, G4 0NG, United Kingdomb Departamento de Fısica, Instituto Tecnologico e Nuclear, 2686-953 Sacavem, Portugal
c Institute of Photonics, SUPA, University of Strathclyde, Glasgow, G4 0NW, United Kingdom
Received 27 July 2006; accepted 28 July 2006Available online 15 September 2006
Abstract
Room temperature cathodoluminescence (RTCL) was obtained from Tm implanted AlxGa1−xN withdifferent AlN contents (in the range 0 ≤ x ≤ 0.2) and from implanted InxAl1−xN with different InNcontents (x = 0.13 and 0.19) close to the lattice match with GaN. The Tm3+ emission spectrum dependscritically on the host material. The blue emission from AlxGa1−xN:Tm peaks in intensity for an AlNcontent of x ∼ 0.11. The emission is enhanced by up to a factor of 50 times with an increase of annealingtemperature from 1000 to 1300 ◦C. The blue emission from In0.13Al0.87N:Tm, annealed at 1200 ◦C, ismore than ten times stronger than that from AlxGa1−xN:Tm, x ≤ 0.2. However, the intensity decreasessignificantly as the InN fraction increases from 0.13 to 0.19.c© 2006 Elsevier Ltd. All rights reserved.
Keywords: Rare earth; GaAlN; InAlN; Implantation; Cathodoluminescence
1. Introduction
Obtaining a blue light emitter from Tm-doped III-nitrides is of great interest because the sharpemission, expected to be temperature-independent, promises to be useful for device operation.The practical use of GaN in this context is problematic because: (i) the output efficiency ofGaN:Tm devices is low, compared to GaN:Eu and GaN:Er, as reported in [1]. (ii) there is
∗ Corresponding author. Tel.: +44 141 548 4369.E-mail address: [email protected] (I.S. Roqan).
0749-6036/$ - see front matter c© 2006 Elsevier Ltd. All rights reserved.doi:10.1016/j.spmi.2006.07.029

Autho
r's
pers
onal
co
py
446 I.S. Roqan et al. / Superlattices and Microstructures 40 (2006) 445–451
severe thermal quenching of the blue emission in GaN:Tm films, as reported in [2]. The blueemission lines, centred at ∼465 nm and ascribed to 1D2 →
3F4 transitions [3], are in factcompletely quenched at room temperature [2]. Recently, Lee and Steckl obtained enhanced blueelectroluminescence at ∼465 nm from AlxGa1−xN doped with Tm during growth by MolecularBeam Epitaxy: this success was attributed to the larger band gap of AlxGa1−xN compared to thatof GaN [4].
In this work we investigate the influence of AlN content (in the range 0.09 ≤ x ≤ 0.21) onthe intensity of the blue emission from Tm-implanted AlxGa1−xN and the optimization of totalblue intensity by high temperature annealing. Strong enhancement of the Tm3+ emission occursat higher annealing temperature (up to 1300 ◦C, which is excessive for GaN:Tm). The secondpart of this paper reports a preliminary comparative spectral study of the blue emission fromTm-implanted InxAl1−xN (x = 0.13 and 0.19) and its significant and surprising dependence onthe InN content of the sample.
2. Samples and experimental techniques
700 nm thick AlGaN layers and 130 nm thick InAlN layers were grown by metalorganicvapour phase epitaxy (MOVPE) on ∼1 µm GaN buffer layers using sapphire (0001) substrates.AlN and InN fractions, in AlGaN and AlInN samples, respectively, were estimated byWavelength Dispersive X-ray (WDX) and Rutherford Backscattering Spectrometry (RBS). Tmwas implanted into AlGaN (using 300 keV ion beams) and into AlInN samples (at 120 keV)to a nominal fluence of 1 × 1015 cm−2 with the ion beam tilted 10◦ away from the surfacenormal in order to minimize ion channelling into the substrate. SRIM (Stopping Range of Ionsin Matter) simulations predict that the maximum ion concentrations (close to 1% substitution)occur for AlGaN samples at a depth of ∼55 nm (∼35 nm for InAlN samples). Afterwards,all samples were annealed for 20 min at 1000, 1100 or 1200 ◦C under 3.8 × 10⁵ Pa of N2.One Al0.21Ga0.79N sample was annealed at 1300 ◦C. The growth and implantation details ofa GaN:Tm sample (used here for purposes of comparison) have been reported in Ref. [2].Cathodoluminescence (CL) and Wavelength Dispersive X-ray (WDX) analysis in an ElectronProbe Microanalyser (EPMA) were carried out at room temperature. The RTCL spectra wereacquired using an electron energy of 3 keV with a current of 30 nA, whereas a 5 keV beamat 50 nA was used for WDX measurements. Selective Photoluminescence (PL) was carried outusing a Xe lamp (1000 W) plus monochromator to address the band edges of different AlGaNand AlInN hosts.
3. Results
3.1. AlxGa1−xN:Tm
Fig. 1 compares the approximate energy levels of Tm3+ ions with the bandgaps of GaN,AlGaN and AlInN, estimated from PL excitation spectra (not shown here).
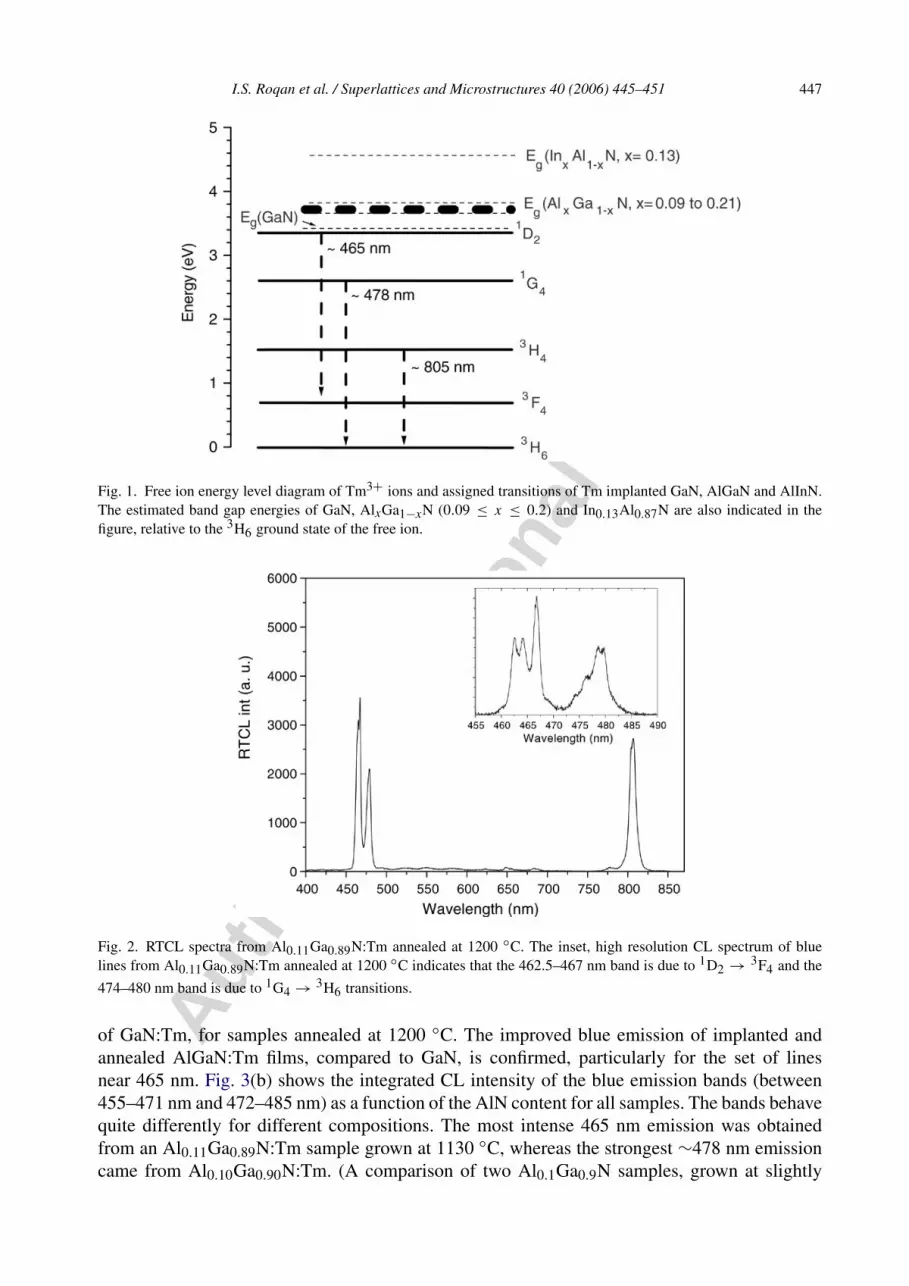
The RTCL spectrum of Al0.11Ga0.89N:Tm, annealed at 1200 ◦C is shown in Fig. 2. Theinset of Fig. 2 shows high resolution CL spectra of the blue spectral region. One group oflines, centred at 478 nm, is attributed to 1G4 →
3H6 transitions of Tm3+ ions [3], while theother group of lines, centred at 465 nm, is attributed to 1D2 →
3F4 transitions [3]. The nearinfrared (NIR) line at 805 nm is attributed to 3H4 →
3H6 transitions [3]. See Fig. 1. Fig. 3(a)compares representative RTCL spectra of AlxGa1−xN:Tm, with various AlN fractions, to that
Autho
r's
pers
onal
co
py
I.S. Roqan et al. / Superlattices and Microstructures 40 (2006) 445–451 447
Fig. 1. Free ion energy level diagram of Tm3+ ions and assigned transitions of Tm implanted GaN, AlGaN and AlInN.The estimated band gap energies of GaN, AlxGa1−xN (0.09 ≤ x ≤ 0.2) and In0.13Al0.87N are also indicated in thefigure, relative to the 3H6 ground state of the free ion.
Fig. 2. RTCL spectra from Al0.11Ga0.89N:Tm annealed at 1200 ◦C. The inset, high resolution CL spectrum of bluelines from Al0.11Ga0.89N:Tm annealed at 1200 ◦C indicates that the 462.5–467 nm band is due to 1D2 →
3F4 and the
474–480 nm band is due to 1G4 →3H6 transitions.
of GaN:Tm, for samples annealed at 1200 ◦C. The improved blue emission of implanted andannealed AlGaN:Tm films, compared to GaN, is confirmed, particularly for the set of linesnear 465 nm. Fig. 3(b) shows the integrated CL intensity of the blue emission bands (between455–471 nm and 472–485 nm) as a function of the AlN content for all samples. The bands behavequite differently for different compositions. The most intense 465 nm emission was obtainedfrom an Al0.11Ga0.89N:Tm sample grown at 1130 ◦C, whereas the strongest ∼478 nm emissioncame from Al0.10Ga0.90N:Tm. (A comparison of two Al0.1Ga0.9N samples, grown at slightly

Autho
r's
pers
onal
co
py
448 I.S. Roqan et al. / Superlattices and Microstructures 40 (2006) 445–451
Fig. 3. (a) RTCL spectra from AlxGa1−xN:Tm at RT with different Al content, with all samples annealed at 1200 ◦C.(b) Integrated CL intensity of blue lines, due to 1D2 →
3F4 (centred at 465 nm) and 1G4 →3H6 (centred at 478 nm)
transitions, as a function of AlN molar fraction.
different temperatures of 1130 and 1100 ◦C, shows somewhat stronger Tm3+ emission for thesample grown at higher temperature.) Moreover, the line at ∼465 nm grows faster than that at 478nm as the AlN content increases towards the optimal value, as shown in Fig. 3(b). Fig. 4 showsthe influence of annealing temperature on the integrated CL intensities of the two blue bands(455–471 nm and 472–485 nm) for representative samples (note log. scale of intensity). Theblue emission intensity increases monotonically with annealing temperature up to 1300 ◦C forthe AlGaN samples. In contrast, blue emission from GaN:Tm decreases with 1300 ◦C annealing.The factors responsible for this decrease will be discussed later.
3.2. InxAl1−xN:Tm
The RTCL spectrum of In0.13Al0.87N:Tm annealed at 1200 ◦C is dominated by a CL peakat ∼465 nm as shown in Fig. 5(a). (This emission may be observed even in implanted, butun-annealed, samples.) The 478 nm peak also appears, but it is much weaker than in AlGaN

Autho
r's
pers
onal
co
py
I.S. Roqan et al. / Superlattices and Microstructures 40 (2006) 445–451 449
Fig. 4. Integrated CL intensity of the blue emission from AlGaN:Tm and GaN:Tm as a function of annealingtemperature.
Fig. 5. (a) RTCL spectra from In0.13Al0.87N:Tm annealed at 1200 ◦C. (b) RTCL spectra from In0.13Al0.87N andIn0.19Al0.81N implanted with Tm and annealed at 1100 and 1200 ◦C.
samples. The NIR emission of In0.13Al0.87N:Tm at 805 nm is about 35 times weaker than that ofGaN:Tm. The RTCL intensity at ∼465 nm depends strongly on the InN molar fraction as shown
Autho
r's
pers
onal
co
py
450 I.S. Roqan et al. / Superlattices and Microstructures 40 (2006) 445–451
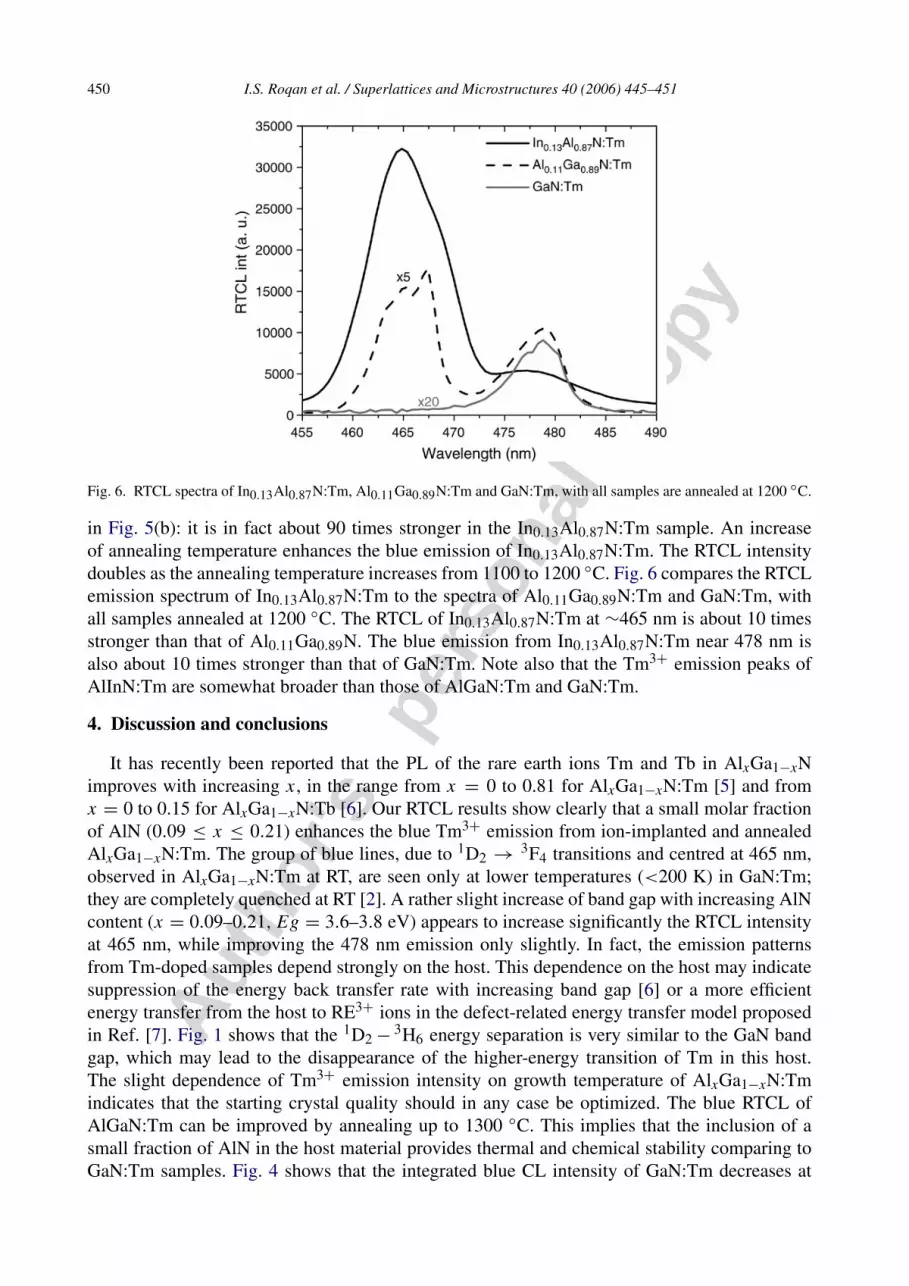
Fig. 6. RTCL spectra of In0.13Al0.87N:Tm, Al0.11Ga0.89N:Tm and GaN:Tm, with all samples are annealed at 1200 ◦C.
in Fig. 5(b): it is in fact about 90 times stronger in the In0.13Al0.87N:Tm sample. An increaseof annealing temperature enhances the blue emission of In0.13Al0.87N:Tm. The RTCL intensitydoubles as the annealing temperature increases from 1100 to 1200 ◦C. Fig. 6 compares the RTCLemission spectrum of In0.13Al0.87N:Tm to the spectra of Al0.11Ga0.89N:Tm and GaN:Tm, withall samples annealed at 1200 ◦C. The RTCL of In0.13Al0.87N:Tm at ∼465 nm is about 10 timesstronger than that of Al0.11Ga0.89N. The blue emission from In0.13Al0.87N:Tm near 478 nm isalso about 10 times stronger than that of GaN:Tm. Note also that the Tm3+ emission peaks ofAlInN:Tm are somewhat broader than those of AlGaN:Tm and GaN:Tm.
4. Discussion and conclusions
It has recently been reported that the PL of the rare earth ions Tm and Tb in AlxGa1−xNimproves with increasing x , in the range from x = 0 to 0.81 for AlxGa1−xN:Tm [5] and fromx = 0 to 0.15 for AlxGa1−xN:Tb [6]. Our RTCL results show clearly that a small molar fractionof AlN (0.09 ≤ x ≤ 0.21) enhances the blue Tm3+ emission from ion-implanted and annealedAlxGa1−xN:Tm. The group of blue lines, due to 1D2 →
3F4 transitions and centred at 465 nm,observed in AlxGa1−xN:Tm at RT, are seen only at lower temperatures (<200 K) in GaN:Tm;they are completely quenched at RT [2]. A rather slight increase of band gap with increasing AlNcontent (x = 0.09–0.21, Eg = 3.6–3.8 eV) appears to increase significantly the RTCL intensityat 465 nm, while improving the 478 nm emission only slightly. In fact, the emission patternsfrom Tm-doped samples depend strongly on the host. This dependence on the host may indicatesuppression of the energy back transfer rate with increasing band gap [6] or a more efficientenergy transfer from the host to RE3+ ions in the defect-related energy transfer model proposedin Ref. [7]. Fig. 1 shows that the 1D2 −
3H6 energy separation is very similar to the GaN bandgap, which may lead to the disappearance of the higher-energy transition of Tm in this host.The slight dependence of Tm3+ emission intensity on growth temperature of AlxGa1−xN:Tmindicates that the starting crystal quality should in any case be optimized. The blue RTCL ofAlGaN:Tm can be improved by annealing up to 1300 ◦C. This implies that the inclusion of asmall fraction of AlN in the host material provides thermal and chemical stability comparing toGaN:Tm samples. Fig. 4 shows that the integrated blue CL intensity of GaN:Tm decreases at

Autho
r's
pers
onal
co
py
I.S. Roqan et al. / Superlattices and Microstructures 40 (2006) 445–451 451
1300 ◦C; annealing to this temperature is known to induce severe dissociation of the surface ofGaN:Tm film [8,9].
The blue emission from In0.13Al0.87N:Tm (Eg ∼ 4.57 eV) also differs from that obtainedfrom GaN:Tm (Eg ∼ 3.4 eV) and AlGaN:Tm (Eg ∼ 3.6–3.8 eV) as follows: (i) it is broader; (ii)for samples annealed at 1200 ◦C, it is significantly stronger. The blue emission in fact dominatesthe RTCL of AlInN:Tm, while in AlGaN:Tm and GaN:Tm, the two are comparable in intensity(Fig. 2). RE3+ ions prefer to replace group-III site in III-nitrides hosts [10]. RE3+ ions in alloysgenerally encounter more mixed environments than they do in binary hosts. This will tend tobroaden the spectral lines. However, additional broadening is also a feature of poor crystallinity.Therefore, a combination of factors may explain the excess broadening of InAlN:Tm transitionsobserved in Fig. 6.
A slight increase in InN content (from x = 0.13 to 0.19) dramatically reduces the Tm3+
blue emission intensity. This could relate to the decrease of the band gap from ∼4.57 eVin In0.13Al0.87N to ∼3.6 eV in In0.19Al0.81N. The other critical factor that affects the Tm3+
emission in AlInN:Tm host is the crystallinity of the film. SEM shows a poorer surface qualityof InN-richer InAlN films [11].
In conclusion, we observe significant enhancement of blue Tm3+ emission from AlxGa1−xNand InxAl1−xN compared to GaN:Tm, especially for the part of the emission due to 1D2 →
3F4
transitions near 465 nm. The reason for this enhancement may be that the 1D2 −3H6 separation
is no longer resonant with the band gap of the host in the alloy samples. The CL results ofthe Tm implanted AlGaN show that a small fraction of Al content in GaN not only improvesthe blue emission intensity but also the thermal stability at the highest annealing temperatures.The intensity of the blue emission from In0.13Al0.87N:Tm, reported here for the first time, is tentimes larger than that obtained from similarly-prepared AlxGa1−xN:Tm and GaN:Tm samples,but appears to be strongly dependent on the crystallinity of the starting material.
References
[1] A.J. Steckl, M. Garter, D.S. Lee, J. Heikenfeld, R. Birkhahn, Appl. Phys. Lett. 75 (1999) 1189.[2] I.S. Roqan, C. Trager-Cowan, B. Hourahine, K. Lorenz, E. Nogales, K.P. O’Donnell, R.W. Martin, E. Alves,
S. Ruffenach, O. Briot, Mater. Res. Soc. Symp. Proc. Series 0892 (2005) FF23-13. (Symposium on GaN, AlN,InN and related materials, held at the 2005 MRS Fall meeting).
[3] J.B. Gruber, U. Vetter, H. Hofsass, B. Zandi, M.F. Reid, Phys. Rev. B 70 (2004) 245108.[4] D.S. Lee, A.J. Steckl, Appl. Phys. Lett. 83 (2003) 2094.[5] U. Hommerich, Ei Ei Nyein, D.S. Lee, A.J. Steckl, J.M. Zavada, Appl. Phys. Lett. 83 (2003) 22.[6] Y. Nakanishi, A. Wakahara, H. Okada, A. Yashida, T. Ohshima, H. Itoh, Phys. Status Solidi b 240 (2003) 372.[7] K. Takahei, A. Taguchi, H. Nakagome, K. Uwai, P.S. Whitney, J. Appl. Phys. 66 (1989) 4941.[8] K. Lorenz, U. Wahl, E. Alves, E. Nogales, S. Dalmasso, R.W. Martin, K.P. O’Donnell, M. Wojdak, A. Braud,
T. Monteiro, T. Wojtowicz, P. Ruterana, S. Ruffenach, O. Briot, Opt. Mater. 28 (2006) 750.[9] E. Nogales, R.W. Martin, K.P. O’Donnell, K. Lorenz, E. Alves, S. Ruffenach, O. Briot, Appl. Phys. Lett. 88 (2006)
031902.[10] K.P. O’Donnell, V. Katchkanov, K. Wang, R.W. Martin, P.R. Edwards, B. Hourahine, E. Nogales,
J.F.W. Mosselmans, B. De Vries, RENiBEl Consortium, Mater. Res. Soc. Symp. Proc. 831 (2004) E9.6.[11] S. Hernandez, K. Wang, D. Amabile, E. Nogales, D. Pastor, R. Cusco, L. Artus, R.W. Martin, K.P. O’Donnell,
I.M. Watson, Mater. Res. Soc. Symp. Proc. 892 (2005) FF23-04.