Reliability of signals from a chronically implanted, silicon-based electrode array in non-human...
18
524 IEEE TRANSACTIONS ON NEURAL SYSTEMS AND REHABILITATION ENGINEERING, VOL. 13, NO. 4, DECEMBER 2005 Reliability of Signals From a Chronically Implanted, Silicon-Based Electrode Array in Non-Human Primate Primary Motor Cortex Selim Suner, Matthew R. Fellows, Carlos Vargas-Irwin, Gordon Kenji Nakata, and John P. Donoghue, Member, IEEE Abstract—Multiple-electrode arrays are valuable both as a research tool and as a sensor for neuromotor prosthetic devices, which could potentially restore voluntary motion and functional independence to paralyzed humans. Long-term array reliability is an important requirement for these applications. Here, we demonstrate the reliability of a regular array of 100 microelec- trodes to obtain neural recordings from primary motor cortex (MI) of monkeys for at least three months and up to 1.5 years. We implanted Bionic (Cyberkinetics, Inc., Foxboro, MA) silicon probe arrays in MI of three Macaque monkeys. Neural signals were recorded during performance of an eight-direction, push-button task. Recording reliability was evaluated for 18, 35, or 51 sessions distributed over 83, 179, and 569 days after implantation, respec- tively, using qualitative and quantitative measures. A four-point signal quality scale was defined based on the waveform amplitude relative to noise. A single observer applied this scale to score signal quality for each electrode. A mean of 120 ( SD), 146 , and 119 neural-like waveforms were observed from 65–85 electrodes across subjects for all recording sessions of which over 80% were of high quality. Quantitative measures demonstrated that waveforms had signal-to-noise ratio (SNR) up to 20 with maximum peak-to-peak amplitude of over 1200 with a mean SNR of 4.8 for signals ranked as high quality. Mean signal quality did not change over the duration of the evaluation period (slope 0.001, 0.0068 and 0.03; NS). By contrast, neural waveform shape varied between, but not within days in all ani- mals, suggesting a shifting population of recorded neurons over time. Arm-movement related modulation was common and 66% of all recorded neurons were tuned to reach direction. The ability for the array to record neural signals from parietal cortex was also established. These results demonstrate that neural recordings that can provide movement related signals for neural prostheses, as well as for fundamental research applications, can be reliably obtained for long time periods using a monolithic microelectrode array in primate MI and potentially from other cortical areas as well. Index Terms—Brain–machine interface, chronically implanted, long-term reliability, silicon electrode arrays. Manuscript received July 29, 2004; accepted July 22, 2005. This work was supported in part by the Society for Academic Emergency Medicine (SAEM), in part by a Neuroscience Research Fellowship Grant, in part by the Keck Foundation, in part by the National Institute of Neurological Disorders and Stroke (NINDS) Neural Prosthesis Program, NINDS Grant NS25074, and in part by the Defense Advanced Research Projects Agency (DARPA) BioInfoMicro Program. S. Suner is with the Department of Emergency Medicine and Surgery, Brown University, Providence, RI 02912 USA (e-mail: [email protected]). M. R. Fellows, C. Vargas-Irwin, and J. P. Donoghue are with the De- partment of Neuroscience, Brown University, Providence, RI, 02912 USA (e-mail: [email protected]; [email protected]; [email protected]). G. K. Nakata was with Brown University, Providence, RI 02906 USA. He is now at 2700 Dolbeer Street, Eureka, CA 95501 USA. Digital Object Identifier 10.1109/TNSRE.2005.857687 I. INTRODUCTION M ANY neurological disorders disrupt the connection be- tween a normal brain and the spinal cord or muscles, pre- venting voluntary movement. Neuromotor prostheses (NMPs), also termed brain–machine interfaces (BMIs), are promising new devices for paralyzed humans that may provide a route from the brain to external assistive technologies or to the par- alyzed muscles themselves. Any NMP will require a sensor to detect neural commands and a means to convert neural signals into a meaningful control output. Recently, proof of concept of such devices was obtained in nonhuman primates. Monkeys achieved immediate and rapid control of a computer cursor in real time by using the neural activity of multiple neurons in the motor cortex (MI) arm area [1]–[3]. Translation of animal- based systems to humans will require a reliable, long-lasting sensor. Although a variety of signal sensors may provide useful neural signals, accurate replication of intended hand motion in external devices appears to require a sensor capable of recording the spiking of neural ensembles. At present, the only means to record such signals is a sensor that is placed very close to the neurons. Acutely placed microelectrodes capable of recording neuron spiking have been available for decades. Such electrodes are ideally fine diameter, pointed-tip conductors that are insu- lated along their shaft, except at the tip. The fine diameter min- imizes tissue damage, while the conical tip shape appears to provide high-quality recordings for reasons that are not fully understood. Adapting single electrodes typically used in exper- imental neurophysiology to a safe and effective, chronically im- plantable array has been a formidable task: multiple, chronically implanted electrodes can be damaging to tissue, they can move, and materials can degrade. Challenges in producing such elec- trodes include control over the array’s features, ability to im- plant using human compatible surgical methods, and adequate insertion methods, as well as their fundamental design. Normann and collaborators developed a novel 100-electrode array that successfully addresses many of these design features [4]. The array is machined from silicon and etched into 100 identical tapered, platinum-tipped electrodes, each of which is insulated along its length. These electrodes approximate the “ideal” design of standard acute recording microelectrodes. Each is isolated from others at its base by a layer of glass and is fixed within a 10 10 array, with each electrode separated by 400 m [Fig. 1(b)]. The electrodes are continuous with a planar base which in their aggregate provides a support platform that rests on surface structures. The array is low-profile and made of 1534-4320/$20.00 © 2005 IEEE
Transcript of Reliability of signals from a chronically implanted, silicon-based electrode array in non-human...
524 IEEE TRANSACTIONS ON NEURAL SYSTEMS AND REHABILITATION ENGINEERING, VOL. 13, NO. 4, DECEMBER 2005
Reliability of Signals From a Chronically Implanted,Silicon-Based Electrode Array in Non-Human
Primate Primary Motor CortexSelim Suner, Matthew R. Fellows, Carlos Vargas-Irwin, Gordon Kenji Nakata, and John P. Donoghue, Member, IEEE
Abstract—Multiple-electrode arrays are valuable both as aresearch tool and as a sensor for neuromotor prosthetic devices,which could potentially restore voluntary motion and functionalindependence to paralyzed humans. Long-term array reliabilityis an important requirement for these applications. Here, wedemonstrate the reliability of a regular array of 100 microelec-trodes to obtain neural recordings from primary motor cortex(MI) of monkeys for at least three months and up to 1.5 years. Weimplanted Bionic (Cyberkinetics, Inc., Foxboro, MA) silicon probearrays in MI of three Macaque monkeys. Neural signals wererecorded during performance of an eight-direction, push-buttontask. Recording reliability was evaluated for 18, 35, or 51 sessionsdistributed over 83, 179, and 569 days after implantation, respec-tively, using qualitative and quantitative measures. A four-pointsignal quality scale was defined based on the waveform amplituderelative to noise. A single observer applied this scale to scoresignal quality for each electrode. A mean of 120 ( 17 6 SD), 146( 7 3), and 119 ( 16 9) neural-like waveforms were observedfrom 65–85 electrodes across subjects for all recording sessionsof which over 80% were of high quality. Quantitative measuresdemonstrated that waveforms had signal-to-noise ratio (SNR) upto 20 with maximum peak-to-peak amplitude of over 1200 vwith a mean SNR of 4.8 for signals ranked as high quality. Meansignal quality did not change over the duration of the evaluationperiod (slope 0.001, 0.0068 and 0.03; NS). By contrast, neuralwaveform shape varied between, but not within days in all ani-mals, suggesting a shifting population of recorded neurons overtime. Arm-movement related modulation was common and 66%of all recorded neurons were tuned to reach direction. The abilityfor the array to record neural signals from parietal cortex wasalso established. These results demonstrate that neural recordingsthat can provide movement related signals for neural prostheses,as well as for fundamental research applications, can be reliablyobtained for long time periods using a monolithic microelectrodearray in primate MI and potentially from other cortical areas aswell.
Index Terms—Brain–machine interface, chronically implanted,long-term reliability, silicon electrode arrays.
Manuscript received July 29, 2004; accepted July 22, 2005. This workwas supported in part by the Society for Academic Emergency Medicine(SAEM), in part by a Neuroscience Research Fellowship Grant, in part by theKeck Foundation, in part by the National Institute of Neurological Disordersand Stroke (NINDS) Neural Prosthesis Program, NINDS Grant NS25074,and in part by the Defense Advanced Research Projects Agency (DARPA)BioInfoMicro Program.
S. Suner is with the Department of Emergency Medicine and Surgery, BrownUniversity, Providence, RI 02912 USA (e-mail: [email protected]).
M. R. Fellows, C. Vargas-Irwin, and J. P. Donoghue are with the De-partment of Neuroscience, Brown University, Providence, RI, 02912 USA(e-mail: [email protected]; [email protected];[email protected]).
G. K. Nakata was with Brown University, Providence, RI 02906 USA. He isnow at 2700 Dolbeer Street, Eureka, CA 95501 USA.
Digital Object Identifier 10.1109/TNSRE.2005.857687
I. INTRODUCTION
MANY neurological disorders disrupt the connection be-tween a normal brain and the spinal cord or muscles, pre-
venting voluntary movement. Neuromotor prostheses (NMPs),also termed brain–machine interfaces (BMIs), are promisingnew devices for paralyzed humans that may provide a routefrom the brain to external assistive technologies or to the par-alyzed muscles themselves. Any NMP will require a sensor todetect neural commands and a means to convert neural signalsinto a meaningful control output. Recently, proof of conceptof such devices was obtained in nonhuman primates. Monkeysachieved immediate and rapid control of a computer cursor inreal time by using the neural activity of multiple neurons inthe motor cortex (MI) arm area [1]–[3]. Translation of animal-based systems to humans will require a reliable, long-lastingsensor. Although a variety of signal sensors may provide usefulneural signals, accurate replication of intended hand motion inexternal devices appears to require a sensor capable of recordingthe spiking of neural ensembles. At present, the only means torecord such signals is a sensor that is placed very close to theneurons. Acutely placed microelectrodes capable of recordingneuron spiking have been available for decades. Such electrodesare ideally fine diameter, pointed-tip conductors that are insu-lated along their shaft, except at the tip. The fine diameter min-imizes tissue damage, while the conical tip shape appears toprovide high-quality recordings for reasons that are not fullyunderstood. Adapting single electrodes typically used in exper-imental neurophysiology to a safe and effective, chronically im-plantable array has been a formidable task: multiple, chronicallyimplanted electrodes can be damaging to tissue, they can move,and materials can degrade. Challenges in producing such elec-trodes include control over the array’s features, ability to im-plant using human compatible surgical methods, and adequateinsertion methods, as well as their fundamental design.
Normann and collaborators developed a novel 100-electrodearray that successfully addresses many of these design features[4]. The array is machined from silicon and etched into 100identical tapered, platinum-tipped electrodes, each of which isinsulated along its length. These electrodes approximate the“ideal” design of standard acute recording microelectrodes.Each is isolated from others at its base by a layer of glass and isfixed within a 10 10 array, with each electrode separated by400 m [Fig. 1(b)]. The electrodes are continuous with a planarbase which in their aggregate provides a support platform thatrests on surface structures. The array is low-profile and made of
1534-4320/$20.00 © 2005 IEEE
SUNER et al.: RELIABILITY OF SIGNALS FROM A CHRONICALLY IMPLANTED, SILICON-BASED ELECTRODE ARRAY 525
Fig. 1. Array and percutaneous connector assembly. (A) Array, cable andconnector. Insets show a higher magnification picture of the array (shown inthe black square box magnified by a factor of 25) and a scanning electronmicrograph (at 1500 magnification) of one electrode tip. Cut parylene insulationand exposed platinum coated conical tip are clearly visualized in this image.(B) Higher magnification (factor of 200) showing the taper of a single electrodeand the base platform that supports the array of electrodes.
biocompatible materials to enhance its stability. This array hasbeen used as a chronically implanted electrode for a number ofexperimental studies. While recordings have been successfullymade for long durations with this array, the recording propertiesover long times have not been systematically evaluated. In thepresent study, we report the results of long term recordingreliability of the Bionic array in three consecutive monkeysprospectively selected and implanted using human-compatiblesurgical methods. These three arrays incorporate final designsfrom a longitudinal development series that has included 39array implants in 18 monkeys. We demonstrate the ability toobtain extracellular neural signals for at least three months afterimplantation from arrays in MI and present a set of reliabilitymeasures to evaluate the utility of these electrodes for neuralprosthesis and research applications.
II. METHODS
A. The Array
The Bionic array (as commercially produced by Cyberki-netics, Inc., Foxboro, MA) consists of a 4.4 4.2-mm platformwith 100 electrodes, of which 96 are available for electricalrecording. Electrode spacing is 400 m and is suitable forrecording from surface structures (e.g., cortex) in the centraland peripheral nervous system [5], [6]. The electrodes areparylene C coated, boron-doped silicon shanks with Pt-coatedconical tips; m of the tip is exposed (1600 m surfacearea; 4180 m volume) [Fig. 1(a) and (b)], each electrode iselectrically isolated from its neighbor by a layer of glass. Awire bundle connects the electrode array to a titanium pedestalthat forms a percutaneous connector. The bundle consists of 96,25- m gold alloy, polyester-insulated wires, which are collec-tively coated with silicone elastomer [Fig. 1(a)]. The electrodelength used in these experiments was 1 mm. Two Teflon-coated,75- m platinum–iridium wires, implanted in the subdural spacenear the array after stripping approximately 5 mm of the in-sulation from the tip, serve as reference electrodes. Recordingelectrodes typically have preinsertion impedances in the rangeof 100–750 (measured in 0.9% normal saline solution,1-nA, 1-kHz sine wave). The preinsertion impedances for theelectrodes in the three arrays used in these experiments were
, and(mean standard deviation) for monkeys DE, RN, and CL,respectively. The 128 pin percutaneous connector is mountedin a cylindrical titanium case with a flange that is used to attach
to the skull via titanium bone screws [Fig. 1(a)]. The connectoris coupled to the recording amplifiers with a pressure-fittedscrewing mechanism, which utilizes spring-loaded pins toestablish electrical contact without insertion forces.
B. Surgical Procedures
Two female (RN and CL) and one male (DE), prospectivelyselected, Macaca mulatta monkeys weighing 4.5–6.0 kg wereused for these experiments. Animals were maintained in anAssociation for Assessment and Accreditation of LaboratoryAnimal Care, National Institutes of Health (AAALAC, NIH)approved animal care facility. All surgery was performed usingstandard sterile procedures in an approved animal surgicalfacility. On the day of surgery, the animal was sedated withketamine HCl (15 mg/kg), intubated orotracheally, and pre-pared by shaving the head, and one leg (for an intravenouscatheter). Antibiotic (Claforan 50 mg/kg), steroid (dexametha-sone 0.5 mg/kg) and analgesic (buprenorphine 0.01 mg/kg)were administered intravenously. The skin was disinfectedwith a surgical scrub. A stable plane of deep anesthesia wasmaintained with 1%–2.5% isoflurane through an anesthesiacircuit for the duration of the surgical procedure. During thesurgical procedure, lactated Ringer’s solution was administeredat a rate of 5–10 cc/kg/h. Body temperature was maintained at37 C–38 C with a heating pad controlled by a rectal probe.Continuous three-lead electrocardiogram, heart rate, respiratoryrate, blood pressure, oxygen saturation (by pulse oximetry),core temperature, expired end tidal carbon dioxide ,
waveform and expired isoflurane concentration weremonitored and recorded on a standardized form in regularintervals. After surgery, the monkey was maintained in therecovery area under direct observation until it was observedto be spontaneously moving and able to hold its head upright.Buprenorphine (0.01 mg/kg) for analgesia was administeredintramuscularly 8–12 h after the procedure and on subsequentdays if there was evidence of discomfort. Antibiotic therapy(Claforan 50 mg/kg) was continued for 5 days. The animal wasallowed free access to food and water for one week after theprocedure. Experimental trials utilizing behavioral tasks werestarted only after full recovery from the effects of surgery. Inone animal, neural signals were recorded 23 h following arrayimplantation. At this time, the animal exhibited no signs ofdiscomfort, was allowed free access to food and water, and wasnot required to perform any behavioral tasks during this earlypostoperative recording session.
1) Array Implantation: After induction of deep anesthesiaand prior to surgical preparation and draping, the animal’s headwas fixed in a standard stereotaxic frame. The skin was incisedalong the midline or along the occipital scalp with a semi-ellip-tical incision. The skull was exposed by retracting skin, fascia(the galea aponeurotica), and muscles; the periosteum was thenscraped. The percutaneous connector was attached to the skullusing eight small pan-head titanium screws. A craniotomy wasperformed over the motor cortex with approximate coordinatesof the rectangular cranial opening 10–18-mm posterior and8–23-mm lateral, with reference to bregma. The dura wasincised and reflected. The array was placed above the cortex inthe precentral gyrus at the level of the genu of the arcuate sulcus
526 IEEE TRANSACTIONS ON NEURAL SYSTEMS AND REHABILITATION ENGINEERING, VOL. 13, NO. 4, DECEMBER 2005
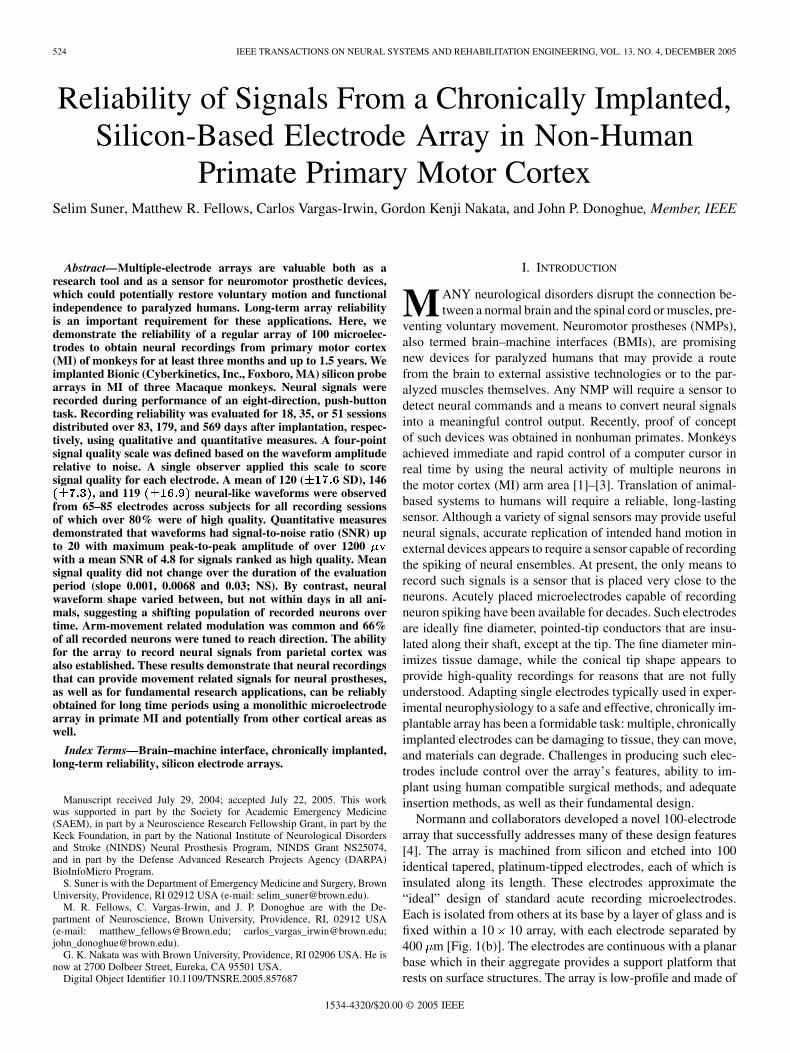
Fig. 2. Craniotomy and location of motor cortex arm area. This representativepicture shows the craniotomy site and landmarks used to locate the arm area ofprimary motor cortex (M1). Dural flap is reflected to expose the cortical surface.Arrows indicate the location of the central sulcus and genu of the arcuate sulcus.Black filled square depicts the location and orientation on the precentral gyruswhere the array is positioned for insertion. Animal depicted in this picture wasnot used in the analysis of data presented in this paper.
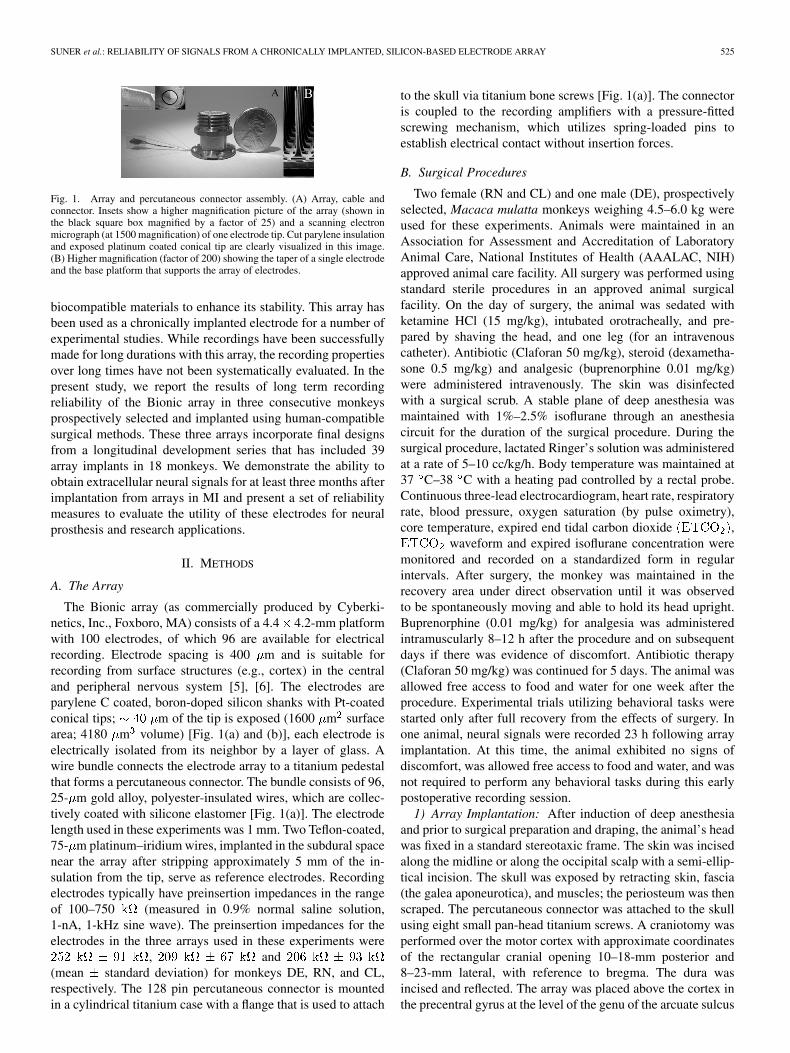
Fig. 3. Craniotomy and an array after insertion. This representativephotograph shows an array after insertion into parietal cortex. Anteriordirection, central sulcus, and Bregma are depicted in the photograph. Wiresseen over the inserted array are the reference wires. This array was placed inparietal cortex and data obtained from this subject is not presented in this paper.
(Fig. 2). An “s” shaped kink was placed in the wire bundle tominimize tethering forces. When positioned at the desired site,the electrodes were rapidly inserted into motor cortex using apneumatic insertion device (Pneumatic Impulse Inserter, Cy-berkinetics Inc., Foxboro MA) (Fig. 3) [7]. The cortical surfaceand array were then covered with a sheet of sterile Gore-Tex[8]. The dura was reapproximated above the array and suturedin place after the reference wires were inserted in the subduralspace. An additional sheet of Gore-Tex was placed over thedura. The bone flap was replaced over the cranial defect andfixed in place with titanium plates screwed to the skull. Inmonkey CL, the edges of the defect were sealed with sterilemedical grade silicon elastomer. In other cases, the defect wasfilled with silicon elastomer and covered with titanium meshaffixed to the skull with low-profile titanium screws (animalsDE and RN). The fascia and skin were reapproximated aroundthe connector in two layers. Three head restraint posts wereplaced in each animal during a separate earlier surgical proce-dure, using similar intraoperative methods.
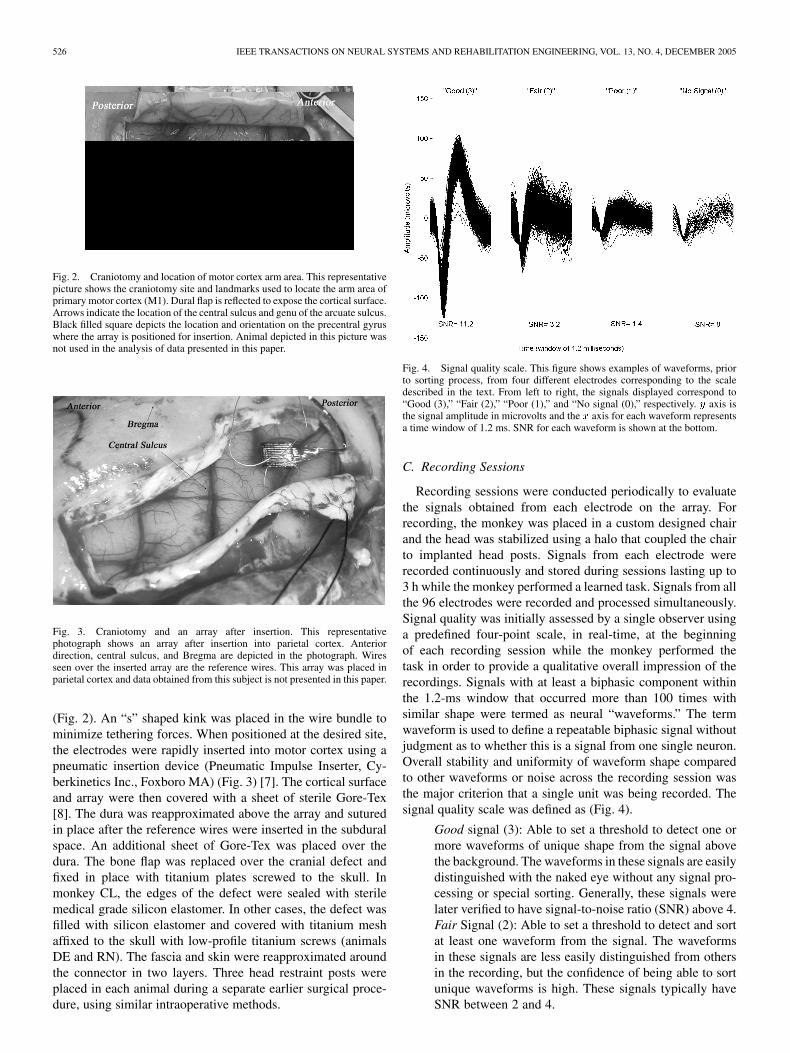
Fig. 4. Signal quality scale. This figure shows examples of waveforms, priorto sorting process, from four different electrodes corresponding to the scaledescribed in the text. From left to right, the signals displayed correspond to“Good (3),” “Fair (2),” “Poor (1),” and “No signal (0),” respectively. y axis isthe signal amplitude in microvolts and the x axis for each waveform representsa time window of 1.2 ms. SNR for each waveform is shown at the bottom.
C. Recording Sessions
Recording sessions were conducted periodically to evaluatethe signals obtained from each electrode on the array. Forrecording, the monkey was placed in a custom designed chairand the head was stabilized using a halo that coupled the chairto implanted head posts. Signals from each electrode wererecorded continuously and stored during sessions lasting up to3 h while the monkey performed a learned task. Signals from allthe 96 electrodes were recorded and processed simultaneously.Signal quality was initially assessed by a single observer usinga predefined four-point scale, in real-time, at the beginningof each recording session while the monkey performed thetask in order to provide a qualitative overall impression of therecordings. Signals with at least a biphasic component withinthe 1.2-ms window that occurred more than 100 times withsimilar shape were termed as neural “waveforms.” The termwaveform is used to define a repeatable biphasic signal withoutjudgment as to whether this is a signal from one single neuron.Overall stability and uniformity of waveform shape comparedto other waveforms or noise across the recording session wasthe major criterion that a single unit was being recorded. Thesignal quality scale was defined as (Fig. 4).
Good signal (3): Able to set a threshold to detect one ormore waveforms of unique shape from the signal abovethe background. The waveforms in these signals are easilydistinguished with the naked eye without any signal pro-cessing or special sorting. Generally, these signals werelater verified to have signal-to-noise ratio (SNR) above 4.Fair Signal (2): Able to set a threshold to detect and sortat least one waveform from the signal. The waveformsin these signals are less easily distinguished from othersin the recording, but the confidence of being able to sortunique waveforms is high. These signals typically haveSNR between 2 and 4.
SUNER et al.: RELIABILITY OF SIGNALS FROM A CHRONICALLY IMPLANTED, SILICON-BASED ELECTRODE ARRAY 527
Poor signal (1): Able to identify mixed waveforms con-tained in the signal. It is not possible to identify uniquewaveforms in these signals with the naked eye and theconfidence of being able to sort units is low. These sig-nals generally have SNR less than 2.No signal (0): Unable to distinguish signal from back-ground noise or a faulty electrode. SNR for these signalsis less than 1 or the signal consists of waveforms identifiedas originating from a nonbiological source such as 60-Hzinterference.
D. Data Acquisition
Signal processing was performed using commercial hard-ware and software (Multichannel Acquisition Processor, PlexonInc., Dallas, TX). The signals were processed by a head stagewith unity gain for impedance matching then amplified in twostages up to 36 000 times (user-defined range 1000–36 000).Final gain was controlled by software. Signals were furtherprocessed with 80-Hz two-pole low-cut and 8-kHz six-polehigh-cut filters. Data were recorded from 96 channels si-multaneously with 40-kHz analog-to-digital conversion and12-bit resolution on each channel. Behavioral event codes wererecorded on a digital input as a strobed word with time-stampaccuracy of s. Data were stored on a personal computerand archived using a DVD system.
E. Impedance Measurements
In vivo impedance was measured periodically in the alertmonkeys using a commercial impedance meter designed formicroelectrodes (Electrode Impedance Tester, Model IMP-1,BAK Technologies Inc., Germantown, MD), for each electrodein two monkeys. The device applies a 1000-Hz, 1-nA sine waveto measure impedance.
F. Operant Conditioning
To evaluate movement-related signals from recorded neu-rons, three monkeys were trained to perform an eight-direction(0 –315 in the frontal plane; 0 to the right) instructed-delay,reaching task using a button-box. The button-box, placed
cm in front of the monkey’s eyes, consisted of a centerbutton surrounded by eight identical buttons equally spacedaround the center in a circle with a diameter of 143.7 mm. Each19.6-mm-diameter button contained a red light-emitting diode(LED) that illuminated the button. Monkeys were trained topress and hold the center button using the digits of their righthand (contralateral to the implanted array). When this was ac-complished, one of the surrounding buttons was lit for 150 ms.The monkey learned to hold the center button, remember whichbutton was lit. When a “go” cue was given (by lighting allthe buttons simultaneously), the monkey was required to pressthe target button to receive a juice reinforcer. Timing of thelight signals and button activations were directed to the signalprocessing system, which logged the time of these events withrespect to the recorded neural activity. The custom design of thebutton-box control software allowed manipulation of rewardvariables and task parameters to minimize training time.
G. Data Analysis
Data were recorded, digitized, and stored on personal com-puters as spike timestamps and waveforms (during 1.2 ms)along with synchronized behavioral information. Any wave-form which crossed a predetermined threshold was saved andused for offline analysis. The threshold was set individuallyby the investigator, low enough to maximize the capture ofall likely waveforms. Action potentials from each electrodewere then classified using offline spike-sorting software, whichutilizes template sorting algorithms (Offline Sorter, PlexonInc., Dallas, TX). Classified signals were analyzed by con-struction of average waveforms, calculation of SNR, peri-eventrasters, histograms, and reach-direction tuning. The globalreliability of the array was assessed by calculating the yieldafter each recording session (yield number of electrodeswith identifiable waveform/total number of electrodes on thearray). In addition, various characteristics of the signal, such asprinciple component dispersion and inter-spike interval, fromeach electrode were evaluated as a function of intervening timeas additional measures of reliability.
1) Offline Sorting: Stored signals were sorted into similarwaveform shapes using commercial software (Offline Sorter,Plexon Inc., Dallas, TX) by the same single investigator, inan attempt to identify and isolate those waveforms that repre-sented single units. The sorting techniques were similar to thosedetailed in prior studies [9]. Sorted data were then analyzedusing waveform shape and unit firing characteristics. Rasters,histograms, preferred directions, SNRs, and inter-spike intervalcurves were calculated using a combination of commercial(NeuroExplorer, NEX Technologies, Littleton, MA) and customsoftware (developed utilizing MATLAB, Mathworks, MA).
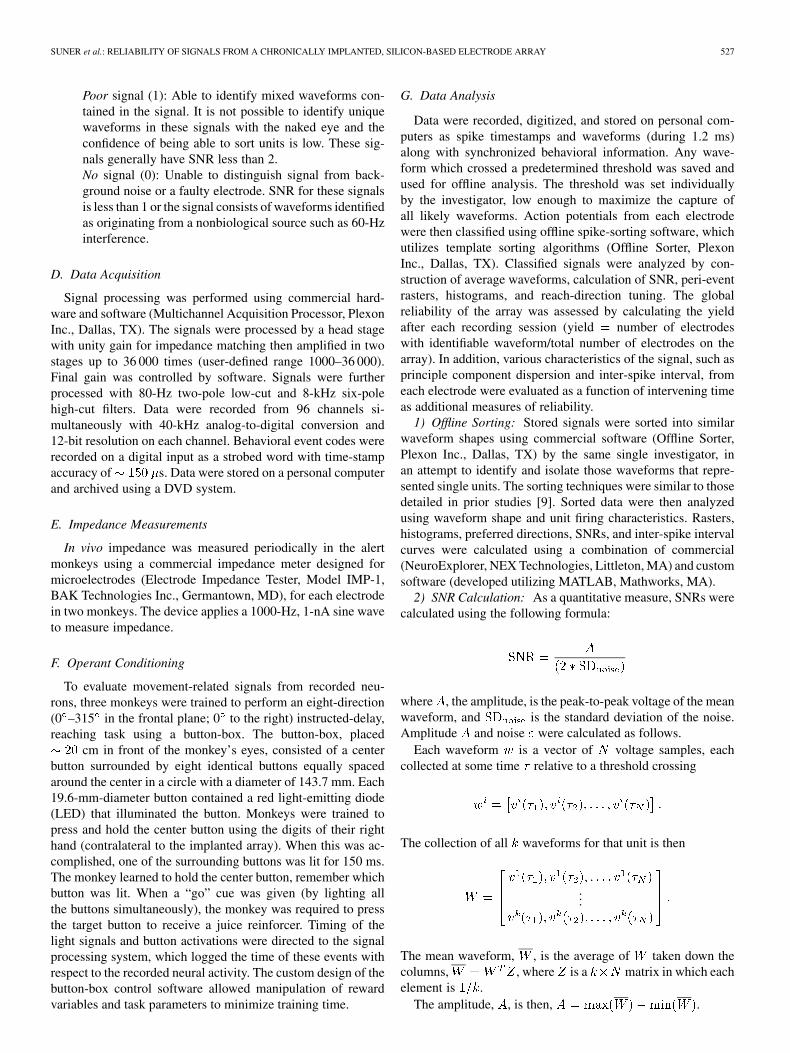
2) SNR Calculation: As a quantitative measure, SNRs werecalculated using the following formula:
where , the amplitude, is the peak-to-peak voltage of the meanwaveform, and is the standard deviation of the noise.Amplitude and noise were calculated as follows.
Each waveform is a vector of voltage samples, eachcollected at some time relative to a threshold crossing
The collection of all waveforms for that unit is then
...
The mean waveform, , is the average of taken down thecolumns, , where is a matrix in which eachelement is .
The amplitude, , is then, .
528 IEEE TRANSACTIONS ON NEURAL SYSTEMS AND REHABILITATION ENGINEERING, VOL. 13, NO. 4, DECEMBER 2005
The noise, , is obtained by subtracting the mean, , fromeach individual waveform
...
where is element-wise subtraction and represents thetranspose operator.
, then, is the standard deviation taken over all valuesin , irrespective of their position in the matrix. In other words,for a given cell, is just the collection of residuals when themean waveform is subtracted from each individual waveform;and is the standard deviation over this collection.
3) Waveform Reliability: Changes in the unit compositionfor each electrode over time were quantified using two differentrelative measures. One involves the distance between centers ofprincipal component (PC) clusters, the other, distances betweenISI distributions (Fig. 15). For each electrode, a reference unitwas chosen. Both the PC and ISI measures are in terms of dis-tances to the reference unit. Each “reference” unit was chosenas the unit with the highest SNR on the day closest, on average,to all the other recording days for which there was at least oneunit on that electrode.
PC distance. For each electrode, the standardized distance be-tween the center of the principal component cluster for the refer-ence unit and the center of the PC cluster for each other unit wascalculated as a function of intervening days for all electrodeswith waveforms and . Standardized distanceis defined in terms of the standard deviation in each of four di-mensions (the first four PCs were used) of the reference cluster.Formally, this produces a four-dimensional (4-D) vector of stan-dardized distances. It is the magnitude of this vector which wereport. Therefore, a cluster one unit of distance from the ref-erence cluster is one standard deviation away its center. Thissimultaneously provides a statistical measure of distance (dis-tance in terms of dispersion) and allows for comparison acrosschannels and units through normalization.
ISI distance. Distances between ISI distribution curves foreach unit on given electrodes was calculated as a function ofintervening days between recording sessions. The distance re-ported is the maximum distance between the cumulative distri-bution function of the reference ISI distribution and the ISI dis-tribution of the unit to which it is being compared. This measureis identical to the Kolmogorov–Smirnov statistic for comparingtwo distributions. The ISI was displayed as a cumulative prob-ability function (Fig. 15).
4) Preferred Direction Calculation: Preferred direction wascalculated to measure the reliability of target directed movementrelationships of recorded waveforms. The preferred direction ofa sorted unit was calculated using a 500-ms window centeredon the initiation of movement to a peripheral target. Only suc-cessfully rewarded (completed) trials were used. A least squarederror cosine fit was utilized to establish directional tuning. Onlythe units which did not have statistically similar firing rates forall directions (one-way analysis of variance, )were used in the analysis.
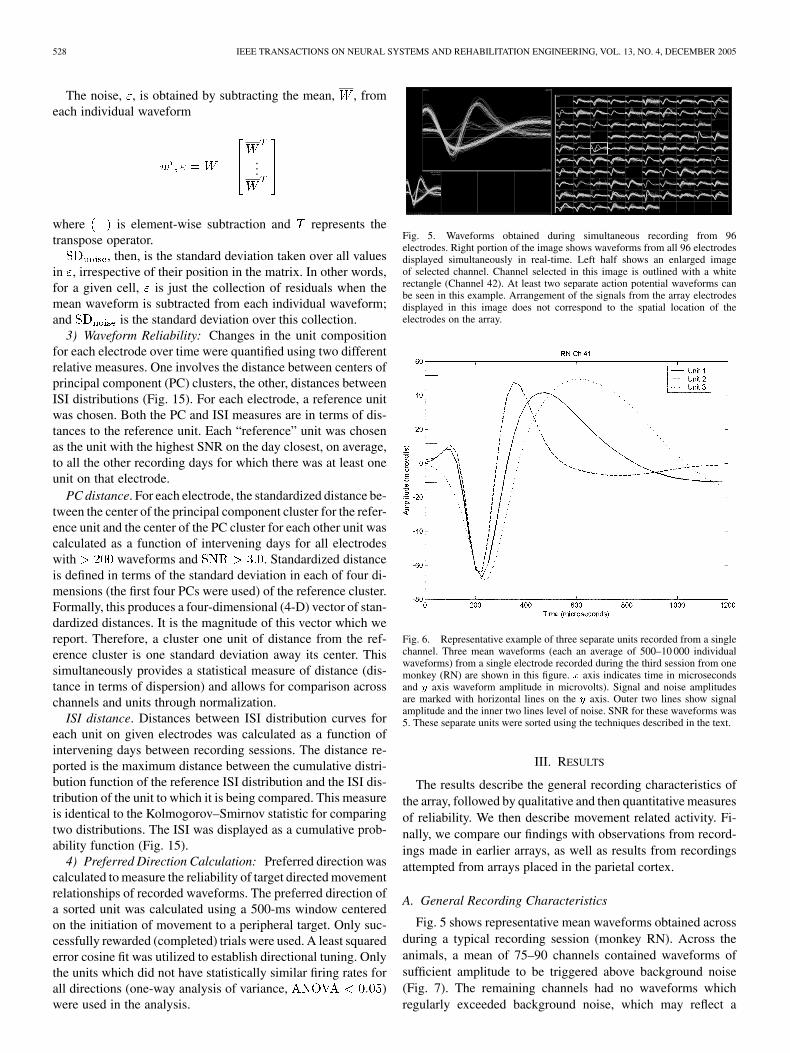
Fig. 5. Waveforms obtained during simultaneous recording from 96electrodes. Right portion of the image shows waveforms from all 96 electrodesdisplayed simultaneously in real-time. Left half shows an enlarged imageof selected channel. Channel selected in this image is outlined with a whiterectangle (Channel 42). At least two separate action potential waveforms canbe seen in this example. Arrangement of the signals from the array electrodesdisplayed in this image does not correspond to the spatial location of theelectrodes on the array.
Fig. 6. Representative example of three separate units recorded from a singlechannel. Three mean waveforms (each an average of 500–10 000 individualwaveforms) from a single electrode recorded during the third session from onemonkey (RN) are shown in this figure. x axis indicates time in microsecondsand y axis waveform amplitude in microvolts). Signal and noise amplitudesare marked with horizontal lines on the y axis. Outer two lines show signalamplitude and the inner two lines level of noise. SNR for these waveforms was5. These separate units were sorted using the techniques described in the text.
III. RESULTS
The results describe the general recording characteristics ofthe array, followed by qualitative and then quantitative measuresof reliability. We then describe movement related activity. Fi-nally, we compare our findings with observations from record-ings made in earlier arrays, as well as results from recordingsattempted from arrays placed in the parietal cortex.
A. General Recording Characteristics
Fig. 5 shows representative mean waveforms obtained acrossduring a typical recording session (monkey RN). Across theanimals, a mean of 75–90 channels contained waveforms ofsufficient amplitude to be triggered above background noise(Fig. 7). The remaining channels had no waveforms whichregularly exceeded background noise, which may reflect a
SUNER et al.: RELIABILITY OF SIGNALS FROM A CHRONICALLY IMPLANTED, SILICON-BASED ELECTRODE ARRAY 529
Fig. 7. Mean number of channels with signals from three monkeys. They axis denotes the number of electrodes on an array with signal (max 96).Different shades of grey represent different study animals (black: DE, grey: RNand white: CL). Three separate groupings on the x axis represent all signals(All), electrodes with fair plus good signal (2 and 3), and electrodes with nosignal plus poor signal (0 and 1) from left to right. Error bars denote standarddeviation.
remote location of the recording tip from a cell. Several chan-nels often had multiple waveforms of different shapes andamplitudes; rarely there were up to four separable waveformson a single channel. Examples of waveform characteristicsfor multiple different waveforms obtained from a single elec-trode are displayed in Fig. 6. The maximum action potentialpeak-to-peak amplitude observed was 1.2 mV and the best SNRon an electrode was greater than 20. The majority of electrodesprovided “good” signal quality, as defined in the methodssection. From 68%–89% of channels contained signals whichwere categorized as good or fair (Fig. 7). Across the threemonkeys, using spike sorting methods, , ,
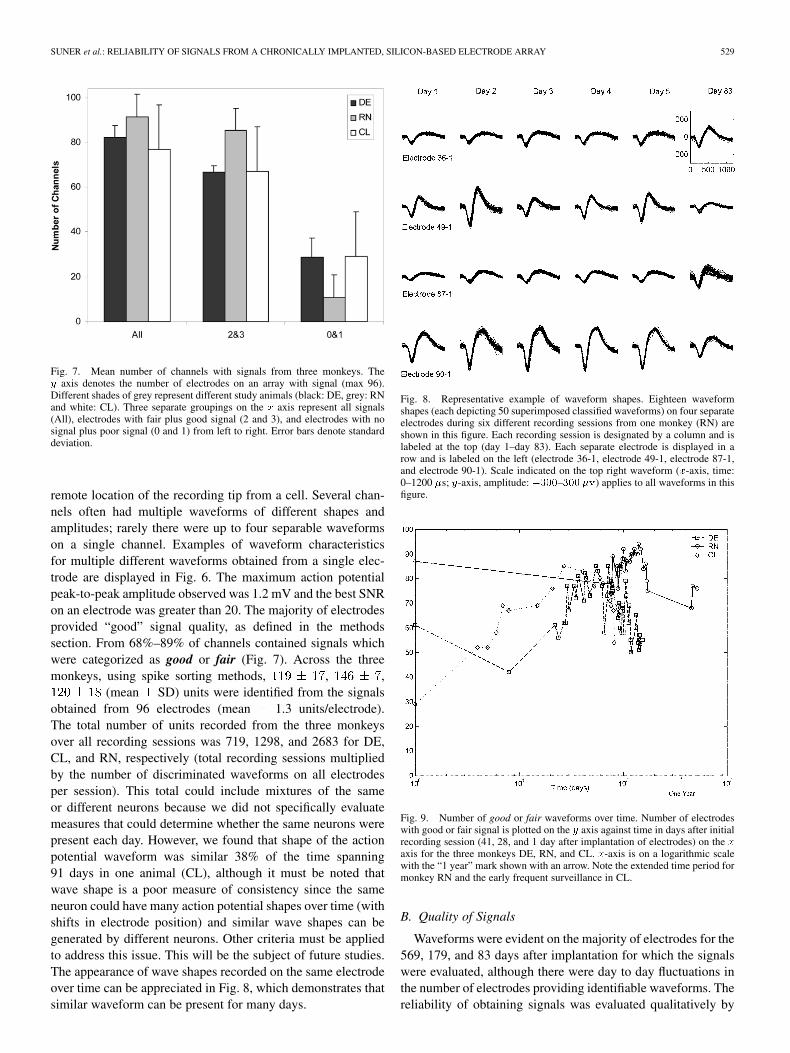
(mean SD) units were identified from the signalsobtained from 96 electrodes (mean 1.3 units/electrode).The total number of units recorded from the three monkeysover all recording sessions was 719, 1298, and 2683 for DE,CL, and RN, respectively (total recording sessions multipliedby the number of discriminated waveforms on all electrodesper session). This total could include mixtures of the sameor different neurons because we did not specifically evaluatemeasures that could determine whether the same neurons werepresent each day. However, we found that shape of the actionpotential waveform was similar 38% of the time spanning91 days in one animal (CL), although it must be noted thatwave shape is a poor measure of consistency since the sameneuron could have many action potential shapes over time (withshifts in electrode position) and similar wave shapes can begenerated by different neurons. Other criteria must be appliedto address this issue. This will be the subject of future studies.The appearance of wave shapes recorded on the same electrodeover time can be appreciated in Fig. 8, which demonstrates thatsimilar waveform can be present for many days.
Fig. 8. Representative example of waveform shapes. Eighteen waveformshapes (each depicting 50 superimposed classified waveforms) on four separateelectrodes during six different recording sessions from one monkey (RN) areshown in this figure. Each recording session is designated by a column and islabeled at the top (day 1–day 83). Each separate electrode is displayed in arow and is labeled on the left (electrode 36-1, electrode 49-1, electrode 87-1,and electrode 90-1). Scale indicated on the top right waveform (x-axis, time:0–1200 �s; y-axis, amplitude: �300–300 �v) applies to all waveforms in thisfigure.
Fig. 9. Number of good or fair waveforms over time. Number of electrodeswith good or fair signal is plotted on the y axis against time in days after initialrecording session (41, 28, and 1 day after implantation of electrodes) on the xaxis for the three monkeys DE, RN, and CL. x-axis is on a logarithmic scalewith the “1 year” mark shown with an arrow. Note the extended time period formonkey RN and the early frequent surveillance in CL.
B. Quality of Signals
Waveforms were evident on the majority of electrodes for the569, 179, and 83 days after implantation for which the signalswere evaluated, although there were day to day fluctuations inthe number of electrodes providing identifiable waveforms. Thereliability of obtaining signals was evaluated qualitatively by
530 IEEE TRANSACTIONS ON NEURAL SYSTEMS AND REHABILITATION ENGINEERING, VOL. 13, NO. 4, DECEMBER 2005
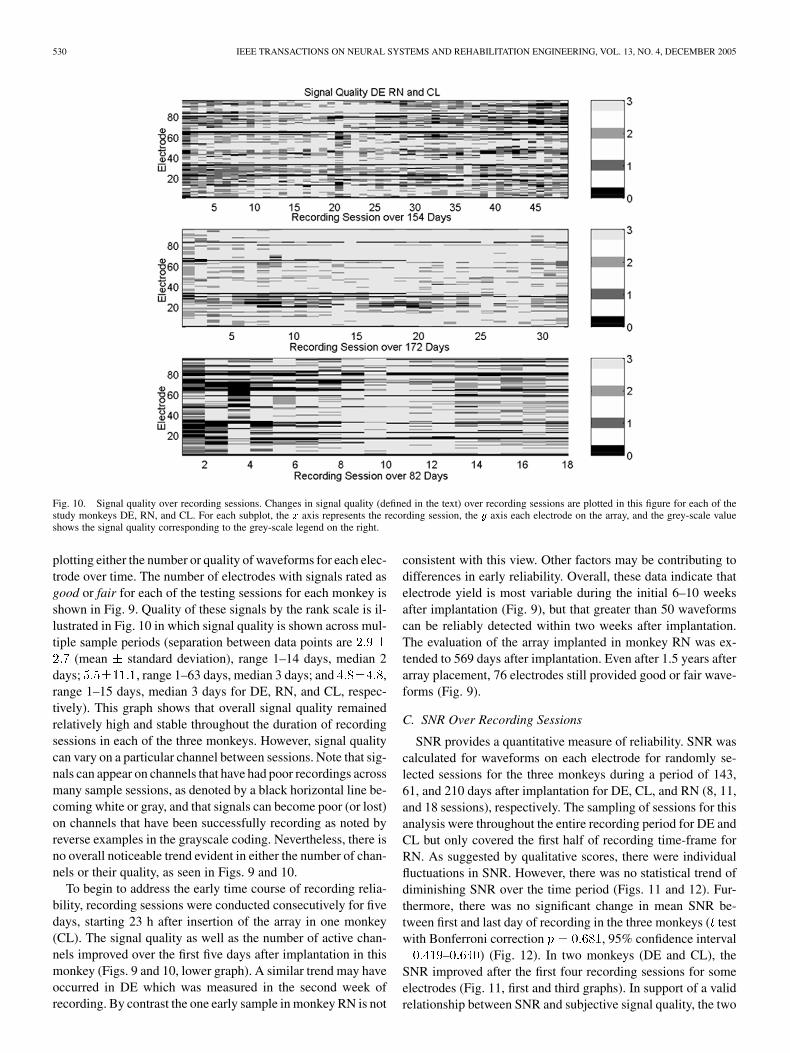
Fig. 10. Signal quality over recording sessions. Changes in signal quality (defined in the text) over recording sessions are plotted in this figure for each of thestudy monkeys DE, RN, and CL. For each subplot, the x axis represents the recording session, the y axis each electrode on the array, and the grey-scale valueshows the signal quality corresponding to the grey-scale legend on the right.
plotting either the number or quality of waveforms for each elec-trode over time. The number of electrodes with signals rated asgood or fair for each of the testing sessions for each monkey isshown in Fig. 9. Quality of these signals by the rank scale is il-lustrated in Fig. 10 in which signal quality is shown across mul-tiple sample periods (separation between data points are
(mean standard deviation), range 1–14 days, median 2days; , range 1–63 days, median 3 days; and ,range 1–15 days, median 3 days for DE, RN, and CL, respec-tively). This graph shows that overall signal quality remainedrelatively high and stable throughout the duration of recordingsessions in each of the three monkeys. However, signal qualitycan vary on a particular channel between sessions. Note that sig-nals can appear on channels that have had poor recordings acrossmany sample sessions, as denoted by a black horizontal line be-coming white or gray, and that signals can become poor (or lost)on channels that have been successfully recording as noted byreverse examples in the grayscale coding. Nevertheless, there isno overall noticeable trend evident in either the number of chan-nels or their quality, as seen in Figs. 9 and 10.
To begin to address the early time course of recording relia-bility, recording sessions were conducted consecutively for fivedays, starting 23 h after insertion of the array in one monkey(CL). The signal quality as well as the number of active chan-nels improved over the first five days after implantation in thismonkey (Figs. 9 and 10, lower graph). A similar trend may haveoccurred in DE which was measured in the second week ofrecording. By contrast the one early sample in monkey RN is not
consistent with this view. Other factors may be contributing todifferences in early reliability. Overall, these data indicate thatelectrode yield is most variable during the initial 6–10 weeksafter implantation (Fig. 9), but that greater than 50 waveformscan be reliably detected within two weeks after implantation.The evaluation of the array implanted in monkey RN was ex-tended to 569 days after implantation. Even after 1.5 years afterarray placement, 76 electrodes still provided good or fair wave-forms (Fig. 9).
C. SNR Over Recording Sessions
SNR provides a quantitative measure of reliability. SNR wascalculated for waveforms on each electrode for randomly se-lected sessions for the three monkeys during a period of 143,61, and 210 days after implantation for DE, CL, and RN (8, 11,and 18 sessions), respectively. The sampling of sessions for thisanalysis were throughout the entire recording period for DE andCL but only covered the first half of recording time-frame forRN. As suggested by qualitative scores, there were individualfluctuations in SNR. However, there was no statistical trend ofdiminishing SNR over the time period (Figs. 11 and 12). Fur-thermore, there was no significant change in mean SNR be-tween first and last day of recording in the three monkeys ( testwith Bonferroni correction , 95% confidence interval
– ) (Fig. 12). In two monkeys (DE and CL), theSNR improved after the first four recording sessions for someelectrodes (Fig. 11, first and third graphs). In support of a validrelationship between SNR and subjective signal quality, the two
SUNER et al.: RELIABILITY OF SIGNALS FROM A CHRONICALLY IMPLANTED, SILICON-BASED ELECTRODE ARRAY 531
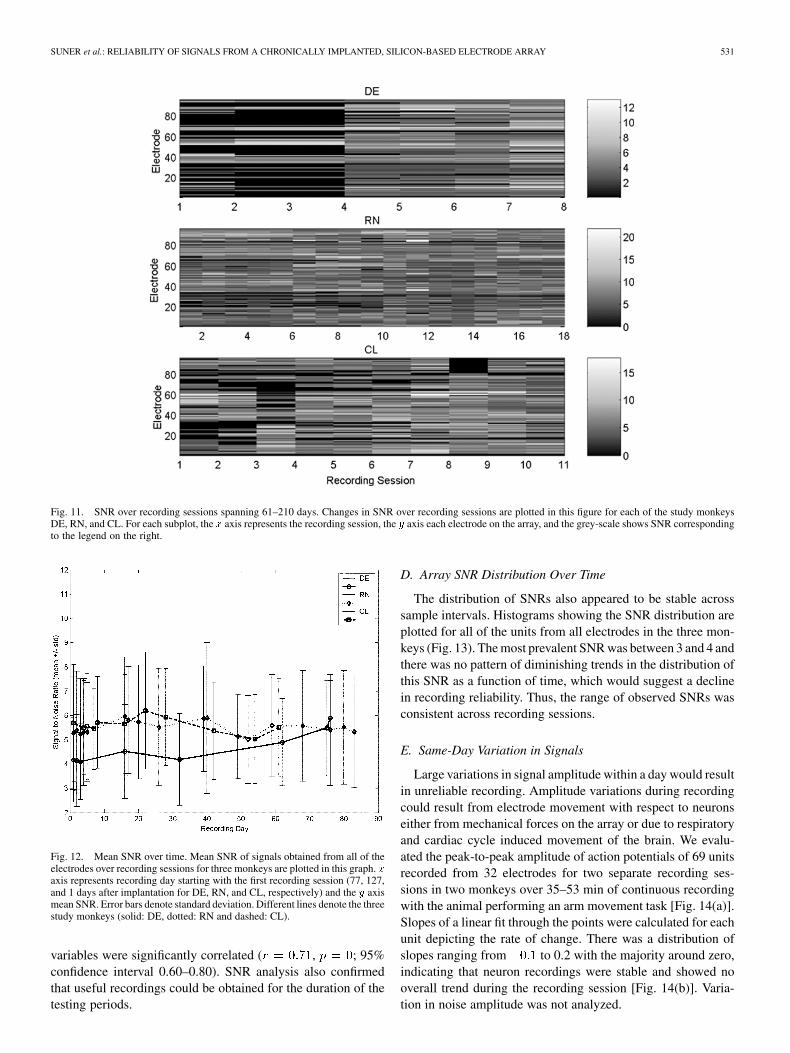
Fig. 11. SNR over recording sessions spanning 61–210 days. Changes in SNR over recording sessions are plotted in this figure for each of the study monkeysDE, RN, and CL. For each subplot, the x axis represents the recording session, the y axis each electrode on the array, and the grey-scale shows SNR correspondingto the legend on the right.
Fig. 12. Mean SNR over time. Mean SNR of signals obtained from all of theelectrodes over recording sessions for three monkeys are plotted in this graph. xaxis represents recording day starting with the first recording session (77, 127,and 1 days after implantation for DE, RN, and CL, respectively) and the y axismean SNR. Error bars denote standard deviation. Different lines denote the threestudy monkeys (solid: DE, dotted: RN and dashed: CL).
variables were significantly correlated ( , ; 95%confidence interval 0.60–0.80). SNR analysis also confirmedthat useful recordings could be obtained for the duration of thetesting periods.
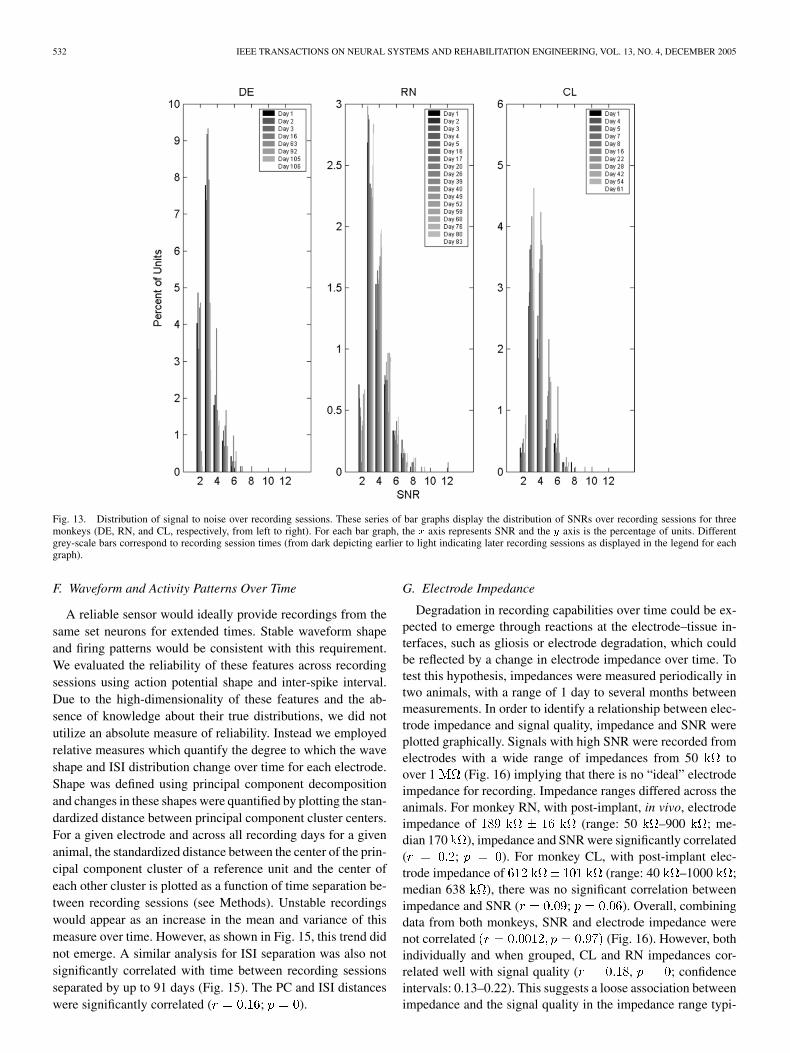
D. Array SNR Distribution Over Time
The distribution of SNRs also appeared to be stable acrosssample intervals. Histograms showing the SNR distribution areplotted for all of the units from all electrodes in the three mon-keys (Fig. 13). The most prevalent SNR was between 3 and 4 andthere was no pattern of diminishing trends in the distribution ofthis SNR as a function of time, which would suggest a declinein recording reliability. Thus, the range of observed SNRs wasconsistent across recording sessions.
E. Same-Day Variation in Signals
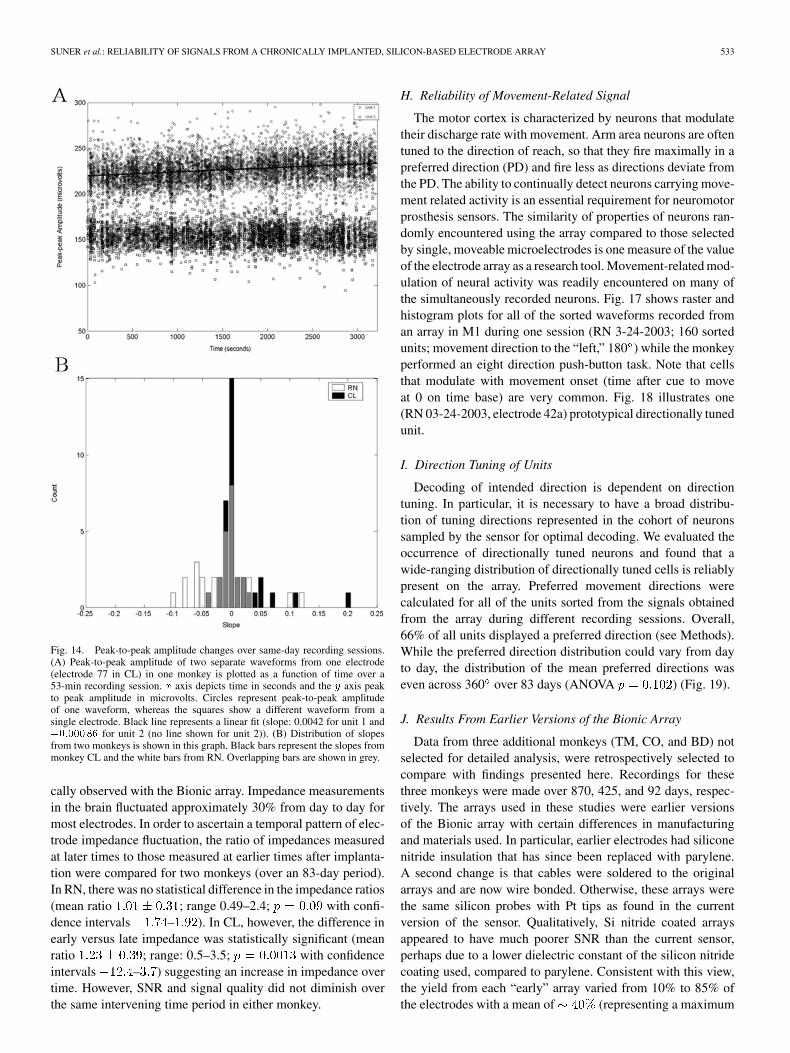
Large variations in signal amplitude within a day would resultin unreliable recording. Amplitude variations during recordingcould result from electrode movement with respect to neuronseither from mechanical forces on the array or due to respiratoryand cardiac cycle induced movement of the brain. We evalu-ated the peak-to-peak amplitude of action potentials of 69 unitsrecorded from 32 electrodes for two separate recording ses-sions in two monkeys over 35–53 min of continuous recordingwith the animal performing an arm movement task [Fig. 14(a)].Slopes of a linear fit through the points were calculated for eachunit depicting the rate of change. There was a distribution ofslopes ranging from to 0.2 with the majority around zero,indicating that neuron recordings were stable and showed nooverall trend during the recording session [Fig. 14(b)]. Varia-tion in noise amplitude was not analyzed.
532 IEEE TRANSACTIONS ON NEURAL SYSTEMS AND REHABILITATION ENGINEERING, VOL. 13, NO. 4, DECEMBER 2005
Fig. 13. Distribution of signal to noise over recording sessions. These series of bar graphs display the distribution of SNRs over recording sessions for threemonkeys (DE, RN, and CL, respectively, from left to right). For each bar graph, the x axis represents SNR and the y axis is the percentage of units. Differentgrey-scale bars correspond to recording session times (from dark depicting earlier to light indicating later recording sessions as displayed in the legend for eachgraph).
F. Waveform and Activity Patterns Over Time
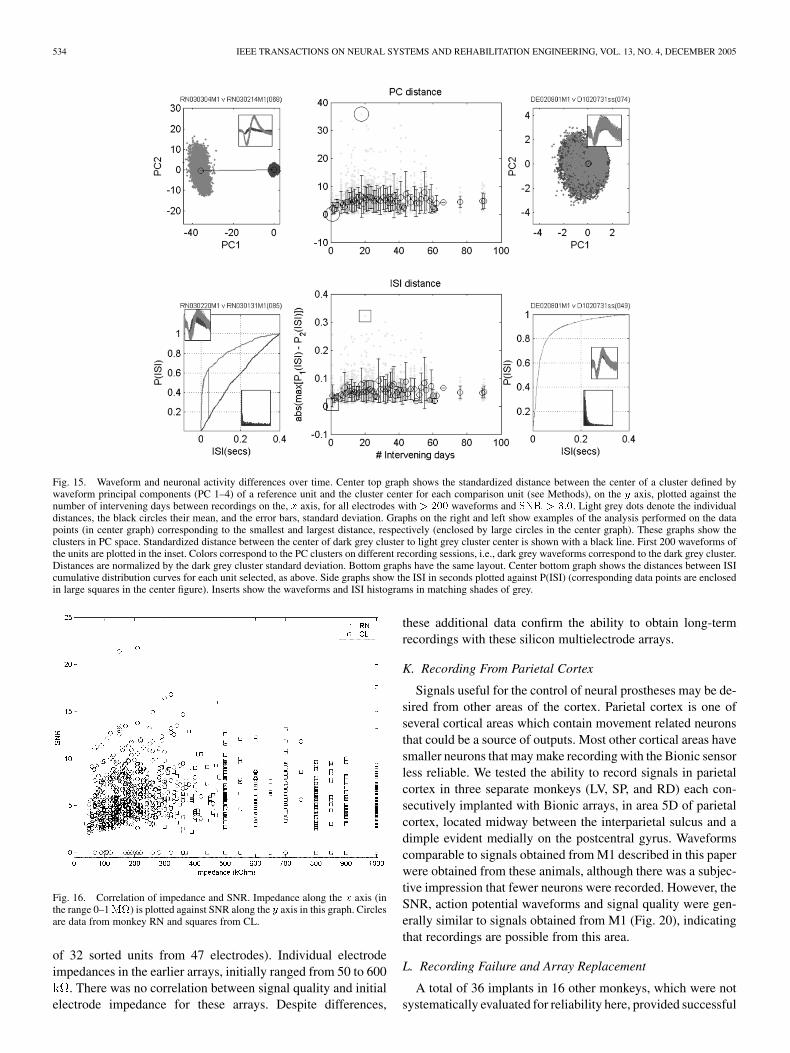
A reliable sensor would ideally provide recordings from thesame set neurons for extended times. Stable waveform shapeand firing patterns would be consistent with this requirement.We evaluated the reliability of these features across recordingsessions using action potential shape and inter-spike interval.Due to the high-dimensionality of these features and the ab-sence of knowledge about their true distributions, we did notutilize an absolute measure of reliability. Instead we employedrelative measures which quantify the degree to which the waveshape and ISI distribution change over time for each electrode.Shape was defined using principal component decompositionand changes in these shapes were quantified by plotting the stan-dardized distance between principal component cluster centers.For a given electrode and across all recording days for a givenanimal, the standardized distance between the center of the prin-cipal component cluster of a reference unit and the center ofeach other cluster is plotted as a function of time separation be-tween recording sessions (see Methods). Unstable recordingswould appear as an increase in the mean and variance of thismeasure over time. However, as shown in Fig. 15, this trend didnot emerge. A similar analysis for ISI separation was also notsignificantly correlated with time between recording sessionsseparated by up to 91 days (Fig. 15). The PC and ISI distanceswere significantly correlated ( ; ).
G. Electrode Impedance
Degradation in recording capabilities over time could be ex-pected to emerge through reactions at the electrode–tissue in-terfaces, such as gliosis or electrode degradation, which couldbe reflected by a change in electrode impedance over time. Totest this hypothesis, impedances were measured periodically intwo animals, with a range of 1 day to several months betweenmeasurements. In order to identify a relationship between elec-trode impedance and signal quality, impedance and SNR wereplotted graphically. Signals with high SNR were recorded fromelectrodes with a wide range of impedances from 50 toover 1 (Fig. 16) implying that there is no “ideal” electrodeimpedance for recording. Impedance ranges differed across theanimals. For monkey RN, with post-implant, in vivo, electrodeimpedance of (range: 50 –900 ; me-dian 170 ), impedance and SNR were significantly correlated( ; ). For monkey CL, with post-implant elec-trode impedance of (range: 40 –1000 ;median 638 ), there was no significant correlation betweenimpedance and SNR ( ; ). Overall, combiningdata from both monkeys, SNR and electrode impedance werenot correlated (Fig. 16). However, bothindividually and when grouped, CL and RN impedances cor-related well with signal quality ( , ; confidenceintervals: 0.13–0.22). This suggests a loose association betweenimpedance and the signal quality in the impedance range typi-
SUNER et al.: RELIABILITY OF SIGNALS FROM A CHRONICALLY IMPLANTED, SILICON-BASED ELECTRODE ARRAY 533
Fig. 14. Peak-to-peak amplitude changes over same-day recording sessions.(A) Peak-to-peak amplitude of two separate waveforms from one electrode(electrode 77 in CL) in one monkey is plotted as a function of time over a53-min recording session. x axis depicts time in seconds and the y axis peakto peak amplitude in microvolts. Circles represent peak-to-peak amplitudeof one waveform, whereas the squares show a different waveform from asingle electrode. Black line represents a linear fit (slope: 0.0042 for unit 1 and�0:00086 for unit 2 (no line shown for unit 2)). (B) Distribution of slopesfrom two monkeys is shown in this graph. Black bars represent the slopes frommonkey CL and the white bars from RN. Overlapping bars are shown in grey.
cally observed with the Bionic array. Impedance measurementsin the brain fluctuated approximately 30% from day to day formost electrodes. In order to ascertain a temporal pattern of elec-trode impedance fluctuation, the ratio of impedances measuredat later times to those measured at earlier times after implanta-tion were compared for two monkeys (over an 83-day period).In RN, there was no statistical difference in the impedance ratios(mean ratio ; range 0.49–2.4; with confi-dence intervals – ). In CL, however, the difference inearly versus late impedance was statistically significant (meanratio ; range: 0.5–3.5; with confidenceintervals – ) suggesting an increase in impedance overtime. However, SNR and signal quality did not diminish overthe same intervening time period in either monkey.
H. Reliability of Movement-Related Signal
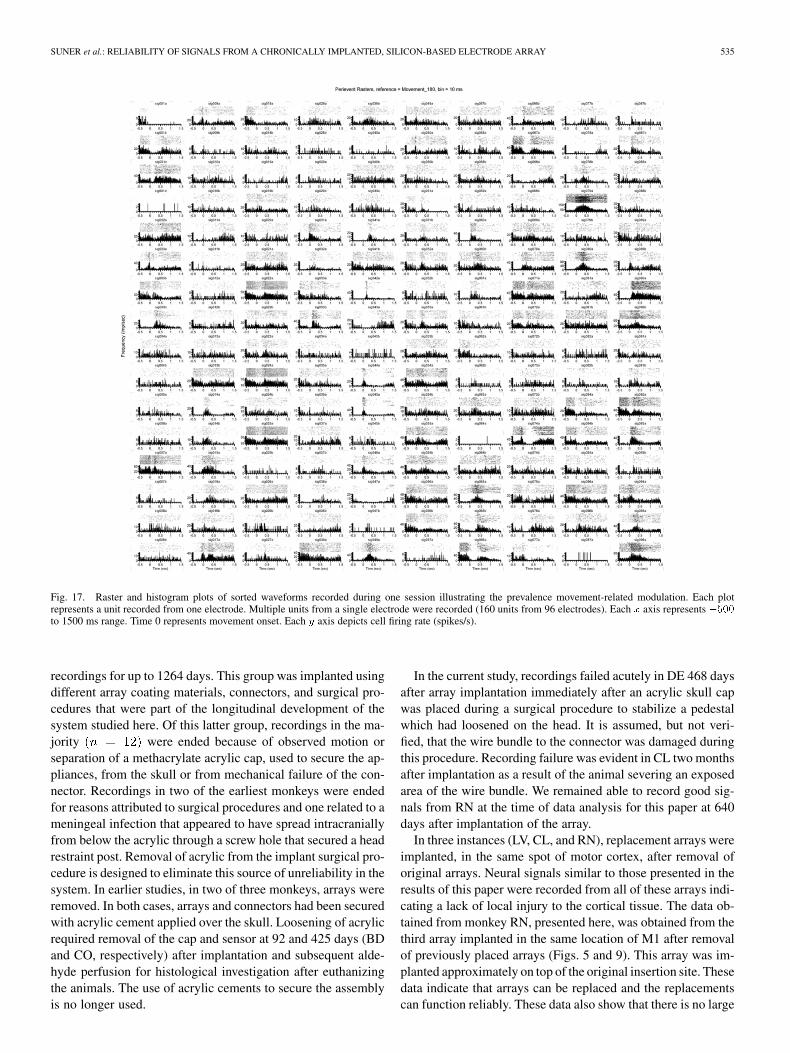
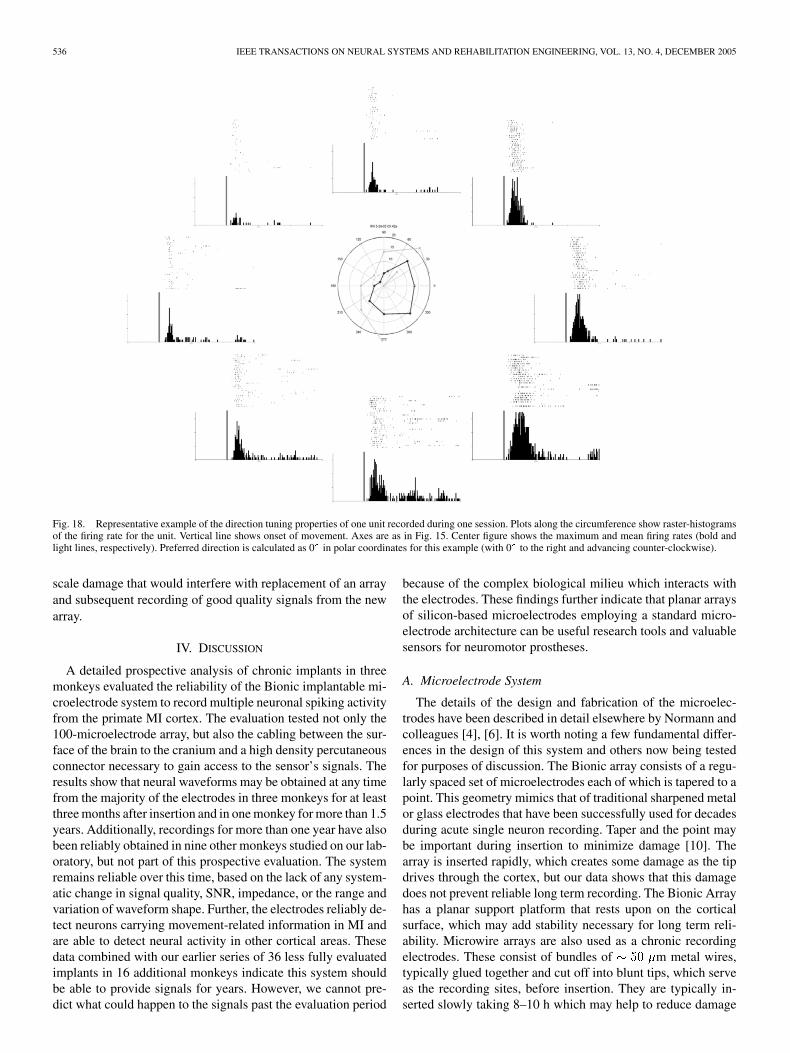
The motor cortex is characterized by neurons that modulatetheir discharge rate with movement. Arm area neurons are oftentuned to the direction of reach, so that they fire maximally in apreferred direction (PD) and fire less as directions deviate fromthe PD. The ability to continually detect neurons carrying move-ment related activity is an essential requirement for neuromotorprosthesis sensors. The similarity of properties of neurons ran-domly encountered using the array compared to those selectedby single, moveable microelectrodes is one measure of the valueof the electrode array as a research tool. Movement-related mod-ulation of neural activity was readily encountered on many ofthe simultaneously recorded neurons. Fig. 17 shows raster andhistogram plots for all of the sorted waveforms recorded froman array in M1 during one session (RN 3-24-2003; 160 sortedunits; movement direction to the “left,” 180 ) while the monkeyperformed an eight direction push-button task. Note that cellsthat modulate with movement onset (time after cue to moveat 0 on time base) are very common. Fig. 18 illustrates one(RN 03-24-2003, electrode 42a) prototypical directionally tunedunit.
I. Direction Tuning of Units
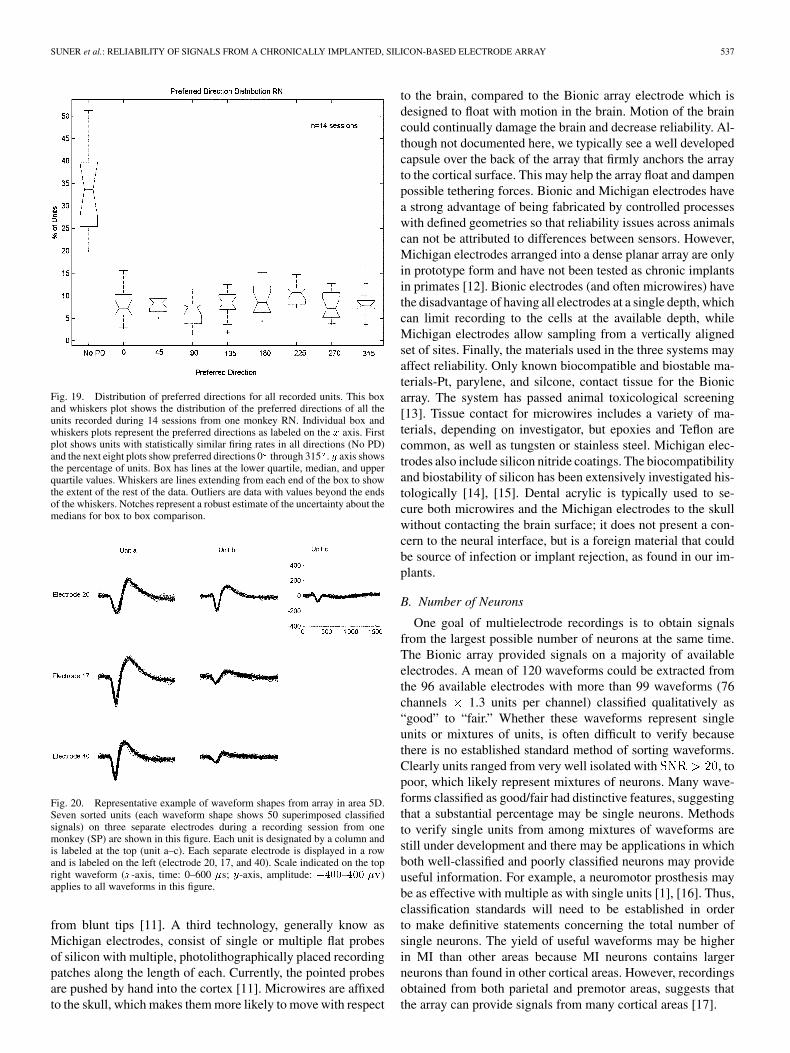
Decoding of intended direction is dependent on directiontuning. In particular, it is necessary to have a broad distribu-tion of tuning directions represented in the cohort of neuronssampled by the sensor for optimal decoding. We evaluated theoccurrence of directionally tuned neurons and found that awide-ranging distribution of directionally tuned cells is reliablypresent on the array. Preferred movement directions werecalculated for all of the units sorted from the signals obtainedfrom the array during different recording sessions. Overall,66% of all units displayed a preferred direction (see Methods).While the preferred direction distribution could vary from dayto day, the distribution of the mean preferred directions waseven across 360 over 83 days (ANOVA ) (Fig. 19).
J. Results From Earlier Versions of the Bionic Array
Data from three additional monkeys (TM, CO, and BD) notselected for detailed analysis, were retrospectively selected tocompare with findings presented here. Recordings for thesethree monkeys were made over 870, 425, and 92 days, respec-tively. The arrays used in these studies were earlier versionsof the Bionic array with certain differences in manufacturingand materials used. In particular, earlier electrodes had siliconenitride insulation that has since been replaced with parylene.A second change is that cables were soldered to the originalarrays and are now wire bonded. Otherwise, these arrays werethe same silicon probes with Pt tips as found in the currentversion of the sensor. Qualitatively, Si nitride coated arraysappeared to have much poorer SNR than the current sensor,perhaps due to a lower dielectric constant of the silicon nitridecoating used, compared to parylene. Consistent with this view,the yield from each “early” array varied from 10% to 85% ofthe electrodes with a mean of (representing a maximum
534 IEEE TRANSACTIONS ON NEURAL SYSTEMS AND REHABILITATION ENGINEERING, VOL. 13, NO. 4, DECEMBER 2005
Fig. 15. Waveform and neuronal activity differences over time. Center top graph shows the standardized distance between the center of a cluster defined bywaveform principal components (PC 1–4) of a reference unit and the cluster center for each comparison unit (see Methods), on the y axis, plotted against thenumber of intervening days between recordings on the, x axis, for all electrodes with > 200 waveforms and SNR > 3:0. Light grey dots denote the individualdistances, the black circles their mean, and the error bars, standard deviation. Graphs on the right and left show examples of the analysis performed on the datapoints (in center graph) corresponding to the smallest and largest distance, respectively (enclosed by large circles in the center graph). These graphs show theclusters in PC space. Standardized distance between the center of dark grey cluster to light grey cluster center is shown with a black line. First 200 waveforms ofthe units are plotted in the inset. Colors correspond to the PC clusters on different recording sessions, i.e., dark grey waveforms correspond to the dark grey cluster.Distances are normalized by the dark grey cluster standard deviation. Bottom graphs have the same layout. Center bottom graph shows the distances between ISIcumulative distribution curves for each unit selected, as above. Side graphs show the ISI in seconds plotted against P(ISI) (corresponding data points are enclosedin large squares in the center figure). Inserts show the waveforms and ISI histograms in matching shades of grey.
Fig. 16. Correlation of impedance and SNR. Impedance along the x axis (inthe range 0–1M) is plotted against SNR along the y axis in this graph. Circlesare data from monkey RN and squares from CL.
of 32 sorted units from 47 electrodes). Individual electrodeimpedances in the earlier arrays, initially ranged from 50 to 600
. There was no correlation between signal quality and initialelectrode impedance for these arrays. Despite differences,
these additional data confirm the ability to obtain long-termrecordings with these silicon multielectrode arrays.
K. Recording From Parietal Cortex
Signals useful for the control of neural prostheses may be de-sired from other areas of the cortex. Parietal cortex is one ofseveral cortical areas which contain movement related neuronsthat could be a source of outputs. Most other cortical areas havesmaller neurons that may make recording with the Bionic sensorless reliable. We tested the ability to record signals in parietalcortex in three separate monkeys (LV, SP, and RD) each con-secutively implanted with Bionic arrays, in area 5D of parietalcortex, located midway between the interparietal sulcus and adimple evident medially on the postcentral gyrus. Waveformscomparable to signals obtained from M1 described in this paperwere obtained from these animals, although there was a subjec-tive impression that fewer neurons were recorded. However, theSNR, action potential waveforms and signal quality were gen-erally similar to signals obtained from M1 (Fig. 20), indicatingthat recordings are possible from this area.
L. Recording Failure and Array Replacement
A total of 36 implants in 16 other monkeys, which were notsystematically evaluated for reliability here, provided successful
SUNER et al.: RELIABILITY OF SIGNALS FROM A CHRONICALLY IMPLANTED, SILICON-BASED ELECTRODE ARRAY 535
Fig. 17. Raster and histogram plots of sorted waveforms recorded during one session illustrating the prevalence movement-related modulation. Each plotrepresents a unit recorded from one electrode. Multiple units from a single electrode were recorded (160 units from 96 electrodes). Each x axis represents �500to 1500 ms range. Time 0 represents movement onset. Each y axis depicts cell firing rate (spikes/s).
recordings for up to 1264 days. This group was implanted usingdifferent array coating materials, connectors, and surgical pro-cedures that were part of the longitudinal development of thesystem studied here. Of this latter group, recordings in the ma-jority were ended because of observed motion orseparation of a methacrylate acrylic cap, used to secure the ap-pliances, from the skull or from mechanical failure of the con-nector. Recordings in two of the earliest monkeys were endedfor reasons attributed to surgical procedures and one related to ameningeal infection that appeared to have spread intracraniallyfrom below the acrylic through a screw hole that secured a headrestraint post. Removal of acrylic from the implant surgical pro-cedure is designed to eliminate this source of unreliability in thesystem. In earlier studies, in two of three monkeys, arrays wereremoved. In both cases, arrays and connectors had been securedwith acrylic cement applied over the skull. Loosening of acrylicrequired removal of the cap and sensor at 92 and 425 days (BDand CO, respectively) after implantation and subsequent alde-hyde perfusion for histological investigation after euthanizingthe animals. The use of acrylic cements to secure the assemblyis no longer used.
In the current study, recordings failed acutely in DE 468 daysafter array implantation immediately after an acrylic skull capwas placed during a surgical procedure to stabilize a pedestalwhich had loosened on the head. It is assumed, but not veri-fied, that the wire bundle to the connector was damaged duringthis procedure. Recording failure was evident in CL two monthsafter implantation as a result of the animal severing an exposedarea of the wire bundle. We remained able to record good sig-nals from RN at the time of data analysis for this paper at 640days after implantation of the array.
In three instances (LV, CL, and RN), replacement arrays wereimplanted, in the same spot of motor cortex, after removal oforiginal arrays. Neural signals similar to those presented in theresults of this paper were recorded from all of these arrays indi-cating a lack of local injury to the cortical tissue. The data ob-tained from monkey RN, presented here, was obtained from thethird array implanted in the same location of M1 after removalof previously placed arrays (Figs. 5 and 9). This array was im-planted approximately on top of the original insertion site. Thesedata indicate that arrays can be replaced and the replacementscan function reliably. These data also show that there is no large
536 IEEE TRANSACTIONS ON NEURAL SYSTEMS AND REHABILITATION ENGINEERING, VOL. 13, NO. 4, DECEMBER 2005
Fig. 18. Representative example of the direction tuning properties of one unit recorded during one session. Plots along the circumference show raster-histogramsof the firing rate for the unit. Vertical line shows onset of movement. Axes are as in Fig. 15. Center figure shows the maximum and mean firing rates (bold andlight lines, respectively). Preferred direction is calculated as 0 in polar coordinates for this example (with 0 to the right and advancing counter-clockwise).
scale damage that would interfere with replacement of an arrayand subsequent recording of good quality signals from the newarray.
IV. DISCUSSION
A detailed prospective analysis of chronic implants in threemonkeys evaluated the reliability of the Bionic implantable mi-croelectrode system to record multiple neuronal spiking activityfrom the primate MI cortex. The evaluation tested not only the100-microelectrode array, but also the cabling between the sur-face of the brain to the cranium and a high density percutaneousconnector necessary to gain access to the sensor’s signals. Theresults show that neural waveforms may be obtained at any timefrom the majority of the electrodes in three monkeys for at leastthree months after insertion and in one monkey for more than 1.5years. Additionally, recordings for more than one year have alsobeen reliably obtained in nine other monkeys studied on our lab-oratory, but not part of this prospective evaluation. The systemremains reliable over this time, based on the lack of any system-atic change in signal quality, SNR, impedance, or the range andvariation of waveform shape. Further, the electrodes reliably de-tect neurons carrying movement-related information in MI andare able to detect neural activity in other cortical areas. Thesedata combined with our earlier series of 36 less fully evaluatedimplants in 16 additional monkeys indicate this system shouldbe able to provide signals for years. However, we cannot pre-dict what could happen to the signals past the evaluation period
because of the complex biological milieu which interacts withthe electrodes. These findings further indicate that planar arraysof silicon-based microelectrodes employing a standard micro-electrode architecture can be useful research tools and valuablesensors for neuromotor prostheses.
A. Microelectrode System
The details of the design and fabrication of the microelec-trodes have been described in detail elsewhere by Normann andcolleagues [4], [6]. It is worth noting a few fundamental differ-ences in the design of this system and others now being testedfor purposes of discussion. The Bionic array consists of a regu-larly spaced set of microelectrodes each of which is tapered to apoint. This geometry mimics that of traditional sharpened metalor glass electrodes that have been successfully used for decadesduring acute single neuron recording. Taper and the point maybe important during insertion to minimize damage [10]. Thearray is inserted rapidly, which creates some damage as the tipdrives through the cortex, but our data shows that this damagedoes not prevent reliable long term recording. The Bionic Arrayhas a planar support platform that rests upon on the corticalsurface, which may add stability necessary for long term reli-ability. Microwire arrays are also used as a chronic recordingelectrodes. These consist of bundles of m metal wires,typically glued together and cut off into blunt tips, which serveas the recording sites, before insertion. They are typically in-serted slowly taking 8–10 h which may help to reduce damage
SUNER et al.: RELIABILITY OF SIGNALS FROM A CHRONICALLY IMPLANTED, SILICON-BASED ELECTRODE ARRAY 537
Fig. 19. Distribution of preferred directions for all recorded units. This boxand whiskers plot shows the distribution of the preferred directions of all theunits recorded during 14 sessions from one monkey RN. Individual box andwhiskers plots represent the preferred directions as labeled on the x axis. Firstplot shows units with statistically similar firing rates in all directions (No PD)and the next eight plots show preferred directions 0 through 315 . y axis showsthe percentage of units. Box has lines at the lower quartile, median, and upperquartile values. Whiskers are lines extending from each end of the box to showthe extent of the rest of the data. Outliers are data with values beyond the endsof the whiskers. Notches represent a robust estimate of the uncertainty about themedians for box to box comparison.
Fig. 20. Representative example of waveform shapes from array in area 5D.Seven sorted units (each waveform shape shows 50 superimposed classifiedsignals) on three separate electrodes during a recording session from onemonkey (SP) are shown in this figure. Each unit is designated by a column andis labeled at the top (unit a–c). Each separate electrode is displayed in a rowand is labeled on the left (electrode 20, 17, and 40). Scale indicated on the topright waveform (x-axis, time: 0–600 �s; y-axis, amplitude: �400–400 �v)applies to all waveforms in this figure.
from blunt tips [11]. A third technology, generally know asMichigan electrodes, consist of single or multiple flat probesof silicon with multiple, photolithographically placed recordingpatches along the length of each. Currently, the pointed probesare pushed by hand into the cortex [11]. Microwires are affixedto the skull, which makes them more likely to move with respect
to the brain, compared to the Bionic array electrode which isdesigned to float with motion in the brain. Motion of the braincould continually damage the brain and decrease reliability. Al-though not documented here, we typically see a well developedcapsule over the back of the array that firmly anchors the arrayto the cortical surface. This may help the array float and dampenpossible tethering forces. Bionic and Michigan electrodes havea strong advantage of being fabricated by controlled processeswith defined geometries so that reliability issues across animalscan not be attributed to differences between sensors. However,Michigan electrodes arranged into a dense planar array are onlyin prototype form and have not been tested as chronic implantsin primates [12]. Bionic electrodes (and often microwires) havethe disadvantage of having all electrodes at a single depth, whichcan limit recording to the cells at the available depth, whileMichigan electrodes allow sampling from a vertically alignedset of sites. Finally, the materials used in the three systems mayaffect reliability. Only known biocompatible and biostable ma-terials-Pt, parylene, and silcone, contact tissue for the Bionicarray. The system has passed animal toxicological screening[13]. Tissue contact for microwires includes a variety of ma-terials, depending on investigator, but epoxies and Teflon arecommon, as well as tungsten or stainless steel. Michigan elec-trodes also include silicon nitride coatings. The biocompatibilityand biostability of silicon has been extensively investigated his-tologically [14], [15]. Dental acrylic is typically used to se-cure both microwires and the Michigan electrodes to the skullwithout contacting the brain surface; it does not present a con-cern to the neural interface, but is a foreign material that couldbe source of infection or implant rejection, as found in our im-plants.
B. Number of Neurons
One goal of multielectrode recordings is to obtain signalsfrom the largest possible number of neurons at the same time.The Bionic array provided signals on a majority of availableelectrodes. A mean of 120 waveforms could be extracted fromthe 96 available electrodes with more than 99 waveforms (76channels 1.3 units per channel) classified qualitatively as“good” to “fair.” Whether these waveforms represent singleunits or mixtures of units, is often difficult to verify becausethere is no established standard method of sorting waveforms.Clearly units ranged from very well isolated with , topoor, which likely represent mixtures of neurons. Many wave-forms classified as good/fair had distinctive features, suggestingthat a substantial percentage may be single neurons. Methodsto verify single units from among mixtures of waveforms arestill under development and there may be applications in whichboth well-classified and poorly classified neurons may provideuseful information. For example, a neuromotor prosthesis maybe as effective with multiple as with single units [1], [16]. Thus,classification standards will need to be established in orderto make definitive statements concerning the total number ofsingle neurons. The yield of useful waveforms may be higherin MI than other areas because MI neurons contains largerneurons than found in other cortical areas. However, recordingsobtained from both parietal and premotor areas, suggests thatthe array can provide signals from many cortical areas [17].
538 IEEE TRANSACTIONS ON NEURAL SYSTEMS AND REHABILITATION ENGINEERING, VOL. 13, NO. 4, DECEMBER 2005
Another factor that may affect the number of waveforms de-tected is electrode impedance, although this remains a complexmeasure of recording efficacy. Detecting waveforms is a func-tion of the geometry and surface area of the exposed recordingsurface, as well as the materials used to record. Impedance isrelated to these features, but not in a clearly established manner-impedance is a function of the electrode material, tip plating,and insulating materials used. The electrodes tested here haverelatively low impedances, in the range of 50–800 comparedto those typically used in single microelectrode recordings,which are often in the low megaohm range. Tip impedancesin the present study did not show a systematic relationship torecording quality; we had just as many recorded waveformson the array that had systematically higher impedances as forthe lower impedance arrays (612 versus 189 ). Relatingtip impedance to waveform isolation may be confounded bythe proximity of the electrode to a cell, cell packing density,glial response at each electrode, and other factors. We canonly conclude that the range of impedances used in this studyreliably provides signals. In this study, simple impedance mea-surements were recorded. Other investigators have used moresophisticated methods including impedance spectroscopy todetermine electrode impedance which may reveal correlationswith recording variability that are consistant with encapsulation[18]. Glial reaction is a known consequence of inserting foreignmaterial into the nervous system [10], [19]–[25]. However, wefind that glial response does not materially affect the recordingswe are making, at least for the 1.5 years measured here. Thebiological environment is dynamic, so we cannot predict whatresponses might occur with longer implant times so that gliosis,infection, material degradation, or mechanical wear may causethe implant to fail. Other investigators believe that, of theseresponses, gliosis is the most likely to affect the long-termviability of the recorded signals and are devising techniquesto minimize reactive cell and tissue responses to chronicallyimplanted electrodes [20], [22].
C. Stability and Longevity of Signals
An ideal array would record high quality signals from thesame set of cells indefinitely. In our study, recordings were re-liably obtained across the duration of our analysis (up to 569days) on the basis of both the number waveforms and qualityof the signal obtained. The observations here were limited to61–569 days. However, earlier arrays not evaluated systemati-cally in the present study recorded signals for more than threeyears. Three measures showed that the overall system remainedstable across this period: SNR, impedance, and the range andvariation of waveforms.
SNR was measured for a randomly selected sub-sample ofrecording times. There was no change in SNR across these timeperiods in three monkeys. Early variations were seen in signalquality and SNR. These findings are consistent with otherstudies [26]. Our data revealed that time between recordingsessions and waveform characteristics were not correlated.An association would be expected if signals were adverselyinfluenced by biological factors such as gliosis at the electrode
tip or neuronal death from disruption of vasculature duringelectrode insertion. Investigators in other studies have docu-mented vascular damage using Perl’s Prussian Blue reactionand local inflammatory responses with glial fibrillary acidicprotein (GFAP) staining, after array insertion and following aperiod of stabilization over several weeks [14], [15]. However,these factors are unlikely to influence signal characteristicsover the long term unless they continue, which remains a strongpossibility in dynamic biological environments like the brain.It is nearly certain that the insertion of the electrode array inour experiments, as would any object inserted into the brain,resulted in disruption of at least capillary sized blood vessels.The cortical capillary bed is densely packed, with spacing onthe order of 40 m in primate cortical tissue [27]. Fluctuationsin the signal quality seen shortly after array implantation maybe due to this initial direct damage and tissue reaction. Further,functional suppression of neurons and alteration of neuronalexcitability from bioactive products released due to bleedingcaused by the insertion process may contribute to variationsin signal quality and SNR. Improvement of the signal qualityand increased yield, for which there was no clear trend in thethree animals, may result from recovery produced by variationsin the intial insertion injury. The data presented demonstratelong-term good quality signals as well as directionally selectiveneuronal responses from the majority of electrodes, which isstrong evidence for the lack of long-term neuronal injury frominsertion effects.
A second measure of stability in the array is impedance. Arationale for measuring impedance is to detect overgrowth oftissue that isolates the electrode, which should be reflected asan increase in impedance and a correlated decrease in signalquality. Impedance changes over time were variable in two mon-keys; however, the signal quality and SNR of the populationrecorded by the Bionic array did not degraded over time, in sup-port of this measure. In a separate study, flat silicon probes ofthe “Michigan” design in rats showed a doubling of impedanceover a 45-week period, but recording yield remained at 90%[28]. Further, Schmidt et al. reported that impedance could varythreefold over a five month period, but this did not seem to af-fect recording quality [29]. This suggests that impedance is apoor measure of reliability except in cases of gross failure ofthe device where impedance may approach zero (shorting) orinfinity (broken connection). The use of improved techniquesfor assessing impedance, such as impedance spectroscopy, mayprovide additional information related to glial encapsulation ofelectrode tips, but the value of this measure, in light of recordingreliability is uncertain.
Waveform appearance is a third measure of reliability. Thismeasure also remained stable across time. We found no corre-lation of the time between recording sessions and overall wave-form characteristics (Fig. 15). On a shorter time scale, there wasno systematic change in waveform amplitudes within sessions,suggesting high reliability of the population recorded at any onetime (Fig. 14). These data indicated that, as a population, there isno systematic degradation in signal recording at least within thetime frames examined here. While we found that signals werereliably recorded on the majority of electrodes for any session,we did not determine whether these were the same signals from
SUNER et al.: RELIABILITY OF SIGNALS FROM A CHRONICALLY IMPLANTED, SILICON-BASED ELECTRODE ARRAY 539
day to day. Marked changes in waveform were observed be-tween days, but it is very difficult to evaluate what these changesmean. Waveforms for different neurons may be very similarand waveforms for the same neuron may vary dramatically inshape and polarity with changes in the relationship between therecording surface and the spike initiation zone. Prior studiesof longevity of multielectrode systems have been performedin other species. Implanted microwire electrodes in monkeyscan record for many months. Microwire arrays appear to havegood yields initially, but reportedly diminish substantially inthe number of recordable waveforms within 5–18 months orless, suggesting that they are less reliable as a long term de-vice in primates [9]. Interestingly, recording longevity appearsto be greater on smaller brained species such as rodents, wheremore than 80% of electrodes yielded signals starting at 2 weeksand up to 55 weeks after implantation, using either microwiresor silicon probes [26], [28]. The reason for this species differ-ence is not clear. However, a major concern has been the loss ofsignal over time due to glial scarring that isolates implanted sen-sors from neurons [10], [15]. Thus, it is possible that the greaterlongevity of arrays in rodents may be related to relatively lessmotion of smaller brains or to a species difference in glial re-sponses. Our results favor the former interpretation: some of theother implanted technologies are fixed with respect to the skullallowing relative motion of the array with respect to the brain.By contrast, the planar substrate of the Bionic array sits on thecortical surface where it can move with the surface. The abilityafter more than one year to record signals similar to those seenweeks after implantation further suggests that glial responsesare minimal, and, at least, inconsequential to recording for elec-trodes arrays of this design in primates.
D. Type of Information Available
Arrays implanted in MI readily recorded neurons that carriedmovement related information similar to those characterizedusing single, moveable microelectrodes. Neurons contained in-formation about the onset of movement and its direction andthese were cosine tuned to direction, as previously described[30]. These findings demonstrate that the neurons detected bythe array are typical of motor cortex neurons and their char-acteristics suggest that they are functioning normally, at leastby these measures. The results also demonstrate that neuronscarrying directional information are reliably encountered in themajority (66%) of motor cortex neurons. Such information iscritical for the design and operation of a neuromotor prosthesisand validates the use of these electrodes for study of movementencoding in motor cortex.
E. Failures
Failures can be beneficial in that they provide information forimproved sensor systems. Failures can be classified as acute, dueto abrupt changes (e.g., broken cabling) or evolving, potentiallydue to biological responses to the implant. In the present group,one failed following placement of an acrylic cap. No failurescould be attributed to a biological response around the sensor, inthat recording quality did not slowly degrade over time. This ob-servation was similar in the group of 18 other monkeys studiedduring the development of the system. The main cause of failure
was linked to the use of acrylic cement which often loosened, re-quiring the removal of the array. The acrylic skull cap often leadsto bone remodeling causing softening of the platform where theconnector is attached leading to mechanical instability of theconnector and in some cases extra or (in one case) intracranialinfection. In addition, failures across all of our animals studiedresulted from ineffective connector prototypes, mechanical dis-ruption of the cabling. These data will be systematically pre-sented in a future publication. The elimination of dental cementsand the creation of a high density, low insertion force connec-tion mechanism helped to eliminate these issues.
The insertion of any material into the brain, including mi-croelectrodes, is virtually certain to produce vascular damage,bleeding, and local inflammatory responses [14], [15]. Charac-terizing the form of this response and the amount of damageresulting is complex, and related to the nature of the materialsused, the method of insertion, and the geometry of the array; ef-fects may change over time as materials interact with a changingenvironment. We did not see failures that could be attributed toany of these features, suggesting that the form of these responsesis acceptable for a chronic implant, although it will be valuableto continue to determine the nature of these effects at longer in-tervals. Interestingly there appeared to be the greatest variabilityin recording at the earliest times (Figs. 9–11), suggesting that ei-ther details of the insertion or individual differences in animalsmay influence recording.
F. Applications for Multielectrode Arrays
Reliable multielectrode arrays have a variety of scientificand biomedical applications. Simultaneous recordings of mul-tiple neurons make it possible to evaluate the relationship ofpopulation activity patterns to behavior, cognition, perception,and sensory processing. Importantly, each neuron is recordedunder identical experimental conditions providing a level ofcontrol for attention, motivation, and performance not possiblewith serial recordings. Multielectrode arrays will also allow forevaluation of neuronal timing relationships which have beenthought to be related to certain higher level functions, suchas visual “binding” [31]. Finally, chronic implants allow thestudy of changes in neuronal firing over time, as might occurwith learning. However, reliable means to ascertain that thesame neuron is recorded each day will have to be developed.Our work indicates that the population of recorded cells mayshift from day to day. Multineuron recording systems are alsopotentially valuable to serve as sensors for new neurotech-nologies. The recent demonstration that monkeys can use thedecoded output of multiple neurons, including those recordedwith the array tested here, as a control signal for goal directedbehavior is a critical proof of concept toward the developmentof a neuromotor prosthesis (NMP) [1]–[3]. A NMP may beable to provide a new output source for paralyzed humans. TheBionic array has been approved by the FDA and now testedin one patient in a pilot study in quadriplegic humans; thisstudy should provide valuable data concerning the ultimatedesign of a practical human NMP. Multielectrode arrays mayalso be valuable as a sensor in devices that detect abnormalneural firing patterns, alert patients to changes in brain state(as in epilepsy), or to control the delivery of therapeutic agents
540 IEEE TRANSACTIONS ON NEURAL SYSTEMS AND REHABILITATION ENGINEERING, VOL. 13, NO. 4, DECEMBER 2005
including both drugs and electrical stimulation. The widespreadneed for ways to treat neurological and psychiatric diseases inhumans is a strong motivation to continue to develop reliableneural activity sensors.
G. Limitations of the Bionic Array
The Bionic array has limitations that influence where it canbe reliably used. The planar design of the Bionic array restrictsits application to surface structures of the cortex and the cur-rent length availability of 1 or 1.5 mm further constrains whatis accessible for recordings. However, it may be possible todesign ways to insert the array in sulci and it is feasible tolengthen or shorten the electrodes. Microwires can be placed atany depth, although they require a tube to guide their trajectoryinto deep structures, which could produce greater damage thanlong, thin probes. Electrodes for the Bionic array are a singlelength, within a plane, so that they can not be targeted to multiplecortical layers and they are not adjustable once placed. Siliconprobe electrodes allow for multiple recording sites on each elec-trode which can increase sample size and sampling across cor-tical layers; such multisite configurations are not currently avail-able on the Bionic array. The reliability of recording a over longtime and the steady proportion of movement related cells, sug-gests that the ability to continually reposition electrodes is notnecessary for neural prosthesis applications. This may be veryvaluable for research applications. The array is also limited byhaving only 96 electrodes. Higher numbers may be desirable fora variety of reasons. However, there is no reason why multiplesimultaneous arrays may not be implanted to increase yield. Pre-liminary data from four monkeys in our laboratory have demon-strated that multiple array implants are feasible.
V. CONCLUSION
We have demonstrated that it is feasible to record high quality,reliable signals from multiple electrodes, for periods of yearsafter implantation using a silicon-based microelectrode array inmotor cortex. This technology may be used to obtain controlsignals for prosthetic devices and for new research applications.The Bionic array has recently received investigational deviceexemption from the Food and Drug Administration (FDA) per-mitting investigators to explore human applications. Also, highquality, reliable, simultaneous recordings from multiple elec-trodes in M1of awake, behaving animals will facilitate improvedunderstanding of the role and function of neuronal ensemblesduring the execution of movement. Finally, by using multiplearrays in different regions of the brain, investigators will havea useful additional tool to explore interactions between corticalneurons and cortical regions.
REFERENCES
[1] M. D. Serruya et al., “Instant neural control of a movement signal,” Na-ture, vol. 416, pp. 141–142, 2002.
[2] D. M. Taylor, S. I. Tillary, and A. B. Schwartz, “Direct cortical control of3-D neuroprosthetic devices,” Science, vol. 296, pp. 1828–1832, 2002.
[3] J. M. Carmena, M. A. Lebedev, R. E. Crist, J. E. O’Doherty, D. M. San-tucci, D. Dimitrov, P. G. Patil, C. S. Henriquez, and M. A. Nicolelis,“Learning to control a brain-machine interface for reaching and graspingby primates,” PLoS Biol., vol. 1, no. 2, pp. E42–E42, Nov. 2003.
[4] C. T. Nordhausen, E. M. Maynard, and R. A. Normann, “Single unitrecording capabilities of a 100 microelectrode array,” Brain Res., vol.726, pp. 129–140, 1996.
[5] A. Branner and R. A. Normann, “A multielectrode array for intrafascic-ular recording and stimulation in sciatic nerve of cats,” Brain Res. Bull.,vol. 54, no. 4, pp. 293–306, Mar. 2000.
[6] E. M. Maynard, C. T. Nordhausen, and R. A. Normann, “The Utah intra-cortical electrode array: A recording structure for potential brain-com-puter interfaces,” Electroencephalogr. Clin. Neurophysiol., vol. 102, pp.228–239, 1997.
[7] P. J. Rousche and R. A. Normann, “A method for pneumatically insertingan array of penetrating electrodes into cortical tissue,” Ann. Biomed.Eng., vol. 20, pp. 413–422, 1992.
[8] E. M. Maynard, E. Fernandez, and R. A. Normann, “A technique toprevent dural adhesions to chronically implanted microelectrode arrays,”J. Neurosci. Methods, vol. 97, pp. 93–101, 2000.
[9] M. A. Nicolelis et al., “Chronic, multisite, multielectrode recordingsin macaque monkeys,” Proc. Nat. Acad. Sci., vol. 100, no. 19, pp.11 041–11 046, 2003.
[10] D. J. Edell, V. V. Toi, V. M. McNeil, and L. D. Clark, “Factors influencingthe biocompatibility of insertable silicon microshafts in cerebral cortex,”IEEE Trans. Biomed. Eng., vol. 39, no. 6, pp. 635–643, Jun. 1992.
[11] A. B. Schwartz, “Cortical neural prosthetics,” Annu. Rev. Neurosci., vol.27, pp. 487–507, Jul. 2004.
[12] J. F. Hetke and D. J. Anderson, “Silicon microelectrodes for extracellularrecording,” in Handbook of Neuroprosthetic Methods, W. E. Finn and P.G. LoPresti, Eds. Boca Raton, FL: CRC, 2002, pp. 163–91.
[13] M. Serruya, private communication, May 2004.[14] J. N. Turner, W. Shain, D. H. Szarowski, M. Andersen, S. Martins, M.
Isaacson, and H. Craighead, “Cerebral astrocyte response to microma-chined silicon implants,” Exp. Neurol., vol. 156, pp. 33–49, 1999.
[15] D. H. Szarowski, M. D. Andersen, S. Retterer, A. J. Spence, M. Isaacson,H. G. Craighead, J. N. Turner, and W. Shain, “Brain responses to micro-machined silicon devices,” Brain Res., vol. 983, pp. 23–35, 2003.
[16] K. W. Horch and G. Dhillon, Eds., Neuroprosthetics: Theory to Practice(Bioengineering and Biomedical Engineering S.), Singapore: World Sci-entific, 2002.
[17] N. G. Hatsapoulos, private communication, May 2004.[18] J. C. Williams and D. R. Kipke, “Methods for modeling the relationship
between extracellular recording variability and impedance properties ofchronic neural implanys,” in Proc. 1st Joint BMES/EMBS Conf., vol. 1,1999, pp. 486–486.
[19] P. M. George, A. W. Lyckman, D. A. La Van, A. Hegde, Y. Leung, R.Avasare, C. Testa, P. M. Alexander, R. Langer, and M. Sur, “Fabricationand biocompatibility of polypyrrole implants suitable for neural pros-thetics,” Biomaterials, vol. 26, no. 17, pp. 3511–9, Jun. 2005.
[20] S. T. Retterer, K. L. Smith, C. S. Bjornsson, K. B. Neeves, A. J. Spence, J.N. Turner, W. Shain, and M. S. Isaacson, “Model neural prostheses withintegrated microfluidics: A potential intervention strategy for controllingreactive cell and tissue responses,” IEEE Trans. Biomed. Eng., vol. 51,no. 11, pp. 2063–73, Nov. 2004.
[21] J. Moss, T. Ryder, T. Z. Aziz, M. B. Graeber, and P. G. Bain, “Elec-tron microscopy of tissue adherent to explanted electrodes in dys-tonia and Parkinson’s disease,” Brain, pt. 12, vol. 127, pp. 2755–63,Dec. 2004.
[22] W. Shain, L. Spataro, J. Dilgen, K. Haverstick, S. Retterer, M. Isaacson,M. Saltzman, and J. N. Turner, “Controlling cellular reactive responsesaround neural prosthetic devices using peripheral and local interventionstrategies,” IEEE Trans. Neural Syst. Rehabil. Eng., vol. 11, no. 2, pp.186–8, Jun. 2003.
[23] X. Cui, J. Wiler, M. Dzaman, R. A. Altschuler, and D. C. Martin, “Invivo studies of polypyrrole/peptide coated neural probes,” Biomaterials,vol. 24, no. 5, pp. 777–87, Feb. 2003.
[24] X. Liu, D. B. McCreery, R. R. Carter, L. A. Bullara, T. G. Yuen, and W.F. Agnew, “Stability of the interface between neural tissue and chron-ically implanted intracortical microelectrodes,” IEEE Trans. Rehabil.Eng., vol. 7, no. 3, pp. 315–26, Sep. 1999.
[25] S. Schmidt, K. Horch, and R. Normann, “Biocompatibility of silicon-based electrode arrays implanted in feline cortical tissue,” J Biomed.Mater. Res., vol. 27, no. 11, pp. 1393–9, Nov. 1993.
[26] J. C. Williams, R. L. Rennaker, and D. R. Kipke, “Long-term neuralrecording characteristics of wire microelectrode arrays implanted incerebral cortex,” Brain Res. Protocols, vol. 4, pp. 303–313, 1999.
[27] F. Reina-De La Torre, A. Rodriguez-Baeza, and J. Sahuquillo-Barris,“Morphological characteristics and distribution pattern of the arterialvessels in human cerebral cortex: A scanning electron microscopestudy,” Anat. Rec., vol. 251, pp. 87–96, 1998.

SUNER et al.: RELIABILITY OF SIGNALS FROM A CHRONICALLY IMPLANTED, SILICON-BASED ELECTRODE ARRAY 541
[28] D. R. Kipke, R. J. Vetter, J. C. Williams, and J. F. Hetke, “Silicon-sub-strate intracortical microelectrode arrays for long-term recording of neu-ronal spike activity in cerebral cortex,” IEEE Trans. Neural Syst. Re-habil. Eng., vol. 11, no. 2, pp. 151–155, Jun. 2003.
[29] E. M. Schmidt, M. J. Bak, and J. S. McIntosh, “Long-term chronicrecording from cortical neurons,” Exp. Neurol., vol. 52, pp. 496–506,1976.
[30] A. P. Georgopoulos, J. F. Kalaska, R. Kaminiti, and J. T. Massey, “Onthe relations between the direction of two-dimensional arm movementsand cell discharge in primate motor cortex,” J. Neurosci., vol. 2, pp.1527–1537, Nov. 1982.
[31] W. Singer and C. M. Grey, “Visual feature integration and the temporalcorrelation hypothesis,” Annu. Rev. Neurosci., vol. 19, pp. 349–374,1995.
Selim Suner received the Sc.B. degree with honorsin biomedical engineering and artificial organs, theM.S. degree in biomedical engineering, and the M.D.degree, all from Brown University, Providence, RI, in1986, 1987, and 1992, respectively.
He is an Attending Physician in the Department ofEmergency Medicine, Rhode Island Hospital and anAssistant Professor in the Departments of EmergencyMedicine and Surgery, Brown Medical School, Prov-idence, RI. He also has expertise in disaster medicine.Since 1998, he has been serving as the Team Leader
for the Rhode Island Disaster Medical Assistance Team which is a Depart-ment of Homeland Security (DHS) asset under the Federal Emergency Man-agement Agency (FEMA) and the National Disaster Medical System (NDMS).He was awarded the Neuroscience Research Fellowship by the Society for Aca-demic Emergency Medicine in 2003. He is currently editing a textbook, DisasterMedicine (St. Louis, MO: Mosby, 2005). His recent research interests includeneuromotor prosthesis, local mechanisms of stroke, and management strategiesfor large disasters involving weapons of mass destruction.
Dr. Suner is a Member of the Society for Neuroscience, Society for AcademicEmergency Medicine and has been a Fellow of the American College of Emer-gency Physicians since 1999.
Matthew R. Fellows received the B.A. degree inmicrobiology from the University of California,Santa Barbara, in 1994. He is currently workingtoward the Ph.D. degree in the Neuroscience De-partment, Brown University, Providence, RI, andis involved in the study of simultaneously recordedneural populations in primate motor cortex.
He was a Research Assistant with the Universityof California, San Francisco, in a laboratory studyingtransgenic mouse models of cancer. While there, hedeveloped an interest in systems neuroscience, which
led him to the laboratory of John Donoghue at Brown University.
Carlos Vargas-Irwin was born in Cali, Colombia,on September 24, 1979. He received the B.S. degreein neuroscience and the B.A. degree in computerscience from Brown University, Providence, RI, in2002. In 2003, he was granted a Divisional Fellow-ship and he is currently working toward the Ph.D.degree in the Neuroscience Department, Brown Uni-versity, conducting research on the representation ofmovement in the brain since.
.
Gordon Kenji Nakata received the B.A. degreein biochemistry from the University of California,Berkeley, in 1992 and the M.D. degree from theState University of New York Health Science Center,Brooklyn, in 1996. He completed the residency inneurological surgery at Brown University, Provi-dence, RI, in 2003.
He is currently an Attending Neurosurgeon in pri-vate practice in Eureka, CA.
John P. Donoghue (M’03) was born in Cambridge,MA, on March 22, 1949. He received the Ph.D. de-gree from Brown University, Providence, RI, in 1979.
He is Professor and Chair of the Department ofNeuroscience, Brown University, Providence, RI. Hehas helped develop Brown University’s undergrad-uate neuroscience concentration and the Brain Sci-ence Program, which brings together ten departmentsand more than 100 faculty into a unique interdiscipli-nary research and education program at Brown Uni-versity. His personal research program is aimed at un-
derstanding how the brain turns thought into movement and the development ofneuromotor prosthetic devices. In addition, he is a co-founder of Cyberkinetics,Inc., Foxborough, MA, a biotech startup that is developing brain implants to re-store movements to paralyzed individuals.


![Diffusion of 18 elements implanted into thermally grown SiO[sub 2]](https://static.fdokumen.com/doc/165x107/6335afedcd4bf2402c0b3112/diffusion-of-18-elements-implanted-into-thermally-grown-siosub-2.jpg)