Examining upper extremity and trunk muscle activation in ...
www.elsevier.com/locate/ynimg
NeuroImage 26 (2005) 184–194
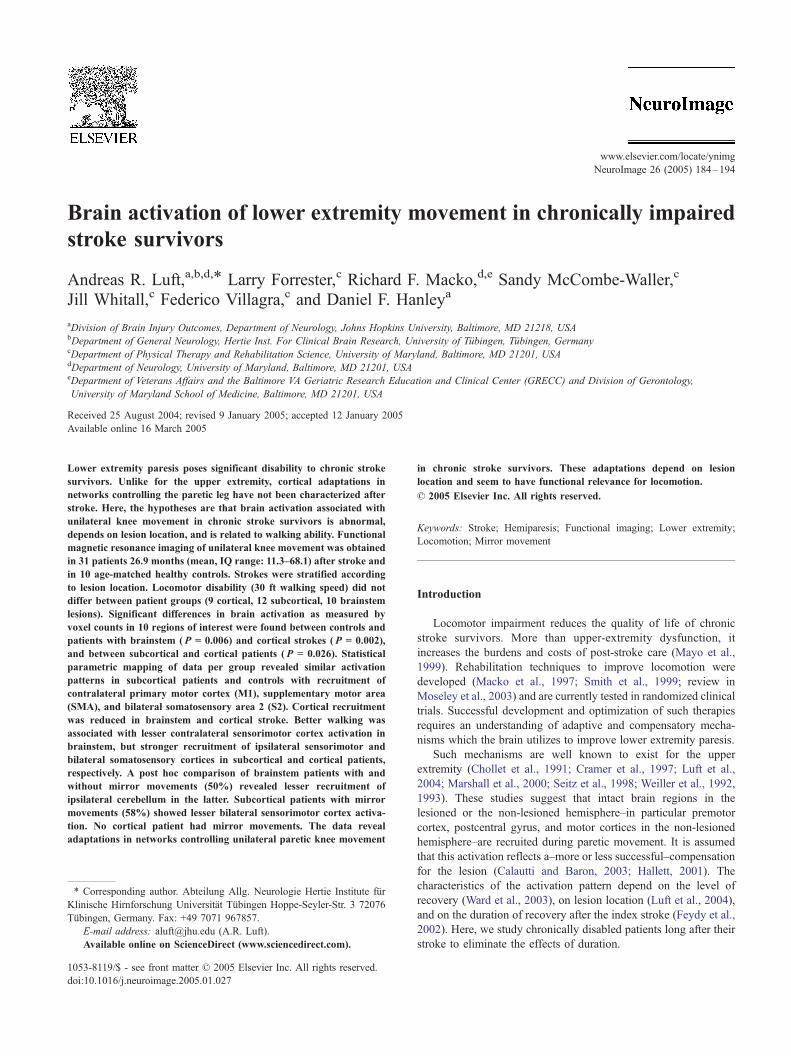
Brain activation of lower extremity movement in chronically impaired
stroke survivors
Andreas R. Luft,a,b,d,T Larry Forrester,c Richard F. Macko,d,e Sandy McCombe-Waller,c
Jill Whitall,c Federico Villagra,c and Daniel F. Hanleya
aDivision of Brain Injury Outcomes, Department of Neurology, Johns Hopkins University, Baltimore, MD 21218, USAbDepartment of General Neurology, Hertie Inst. For Clinical Brain Research, University of Tubingen, Tubingen, GermanycDepartment of Physical Therapy and Rehabilitation Science, University of Maryland, Baltimore, MD 21201, USAdDepartment of Neurology, University of Maryland, Baltimore, MD 21201, USAeDepartment of Veterans Affairs and the Baltimore VA Geriatric Research Education and Clinical Center (GRECC) and Division of Gerontology,
University of Maryland School of Medicine, Baltimore, MD 21201, USA
Received 25 August 2004; revised 9 January 2005; accepted 12 January 2005
Available online 16 March 2005
Lower extremity paresis poses significant disability to chronic stroke
survivors. Unlike for the upper extremity, cortical adaptations in
networks controlling the paretic leg have not been characterized after
stroke. Here, the hypotheses are that brain activation associated with
unilateral knee movement in chronic stroke survivors is abnormal,
depends on lesion location, and is related to walking ability. Functional
magnetic resonance imaging of unilateral knee movement was obtained
in 31 patients 26.9 months (mean, IQ range: 11.3–68.1) after stroke and
in 10 age-matched healthy controls. Strokes were stratified according
to lesion location. Locomotor disability (30 ft walking speed) did not
differ between patient groups (9 cortical, 12 subcortical, 10 brainstem
lesions). Significant differences in brain activation as measured by
voxel counts in 10 regions of interest were found between controls and
patients with brainstem ( P = 0.006) and cortical strokes ( P = 0.002),
and between subcortical and cortical patients ( P = 0.026). Statistical
parametric mapping of data per group revealed similar activation
patterns in subcortical patients and controls with recruitment of
contralateral primary motor cortex (M1), supplementary motor area
(SMA), and bilateral somatosensory area 2 (S2). Cortical recruitment
was reduced in brainstem and cortical stroke. Better walking was
associated with lesser contralateral sensorimotor cortex activation in
brainstem, but stronger recruitment of ipsilateral sensorimotor and
bilateral somatosensory cortices in subcortical and cortical patients,
respectively. A post hoc comparison of brainstem patients with and
without mirror movements (50%) revealed lesser recruitment of
ipsilateral cerebellum in the latter. Subcortical patients with mirror
movements (58%) showed lesser bilateral sensorimotor cortex activa-
tion. No cortical patient had mirror movements. The data reveal
adaptations in networks controlling unilateral paretic knee movement
1053-8119/$ - see front matter D 2005 Elsevier Inc. All rights reserved.
doi:10.1016/j.neuroimage.2005.01.027
* Corresponding author. Abteilung Allg. Neurologie Hertie Institute fqrKlinische Hirnforschung Universit7t Tqbingen Hoppe-Seyler-Str. 3 72076
Tqbingen, Germany. Fax: +49 7071 967857.
E-mail address: [email protected] (A.R. Luft).
Available online on ScienceDirect (www.sciencedirect.com).
in chronic stroke survivors. These adaptations depend on lesion
location and seem to have functional relevance for locomotion.
D 2005 Elsevier Inc. All rights reserved.
Keywords: Stroke; Hemiparesis; Functional imaging; Lower extremity;
Locomotion; Mirror movement
Introduction
Locomotor impairment reduces the quality of life of chronic
stroke survivors. More than upper-extremity dysfunction, it
increases the burdens and costs of post-stroke care (Mayo et al.,
1999). Rehabilitation techniques to improve locomotion were
developed (Macko et al., 1997; Smith et al., 1999; review in
Moseley et al., 2003) and are currently tested in randomized clinical
trials. Successful development and optimization of such therapies
requires an understanding of adaptive and compensatory mecha-
nisms which the brain utilizes to improve lower extremity paresis.
Such mechanisms are well known to exist for the upper
extremity (Chollet et al., 1991; Cramer et al., 1997; Luft et al.,
2004; Marshall et al., 2000; Seitz et al., 1998; Weiller et al., 1992,
1993). These studies suggest that intact brain regions in the
lesioned or the non-lesioned hemisphere–in particular premotor
cortex, postcentral gyrus, and motor cortices in the non-lesioned
hemisphere–are recruited during paretic movement. It is assumed
that this activation reflects a–more or less successful–compensation
for the lesion (Calautti and Baron, 2003; Hallett, 2001). The
characteristics of the activation pattern depend on the level of
recovery (Ward et al., 2003), on lesion location (Luft et al., 2004),
and on the duration of recovery after the index stroke (Feydy et al.,
2002). Here, we study chronically disabled patients long after their
stroke to eliminate the effects of duration.
A.R. Luft et al. / NeuroImage 26 (2005) 184–194 185
For the lower extremity, comparable data are not available.
Considering the differences in use patterns of upper (mainly
unilateral, e.g., reaching) and lower extremities (mainly bilateral,
e.g., walking) and the differences in brain activation associated
with healthy arm and leg movement (Luft et al., 2002), a transfer of
findings from arm to leg seems unjustified. Few studies have
investigated brain activation during lower extremity movements.
Miyai et al. (2001, 2002, 2003) used near infrared spectroscopy to
map brain activation during walking in healthy subjects and stroke
patients before and after a rehabilitation program. Functional
magnetic resonance imaging (fMRI) of the lower extremity,
however, poses technical difficulties due to head motion artifacts.
We developed and tested a paradigm that allows for functional
magnetic resonance imaging of unilateral knee movement in
patients with limited range of motion (Luft et al., 2002).
The objective of this study was to identify and characterize
adaptation in neural networks controlling lower extremity move-
ment in chronically impaired stroke survivors. Specifically, brain
activation patterns of paretic and non-paretic knee movement are
compared to healthy controls, the relationship between activation
pattern and lesion location is characterized, and correlations
between activation and walking ability are investigated.
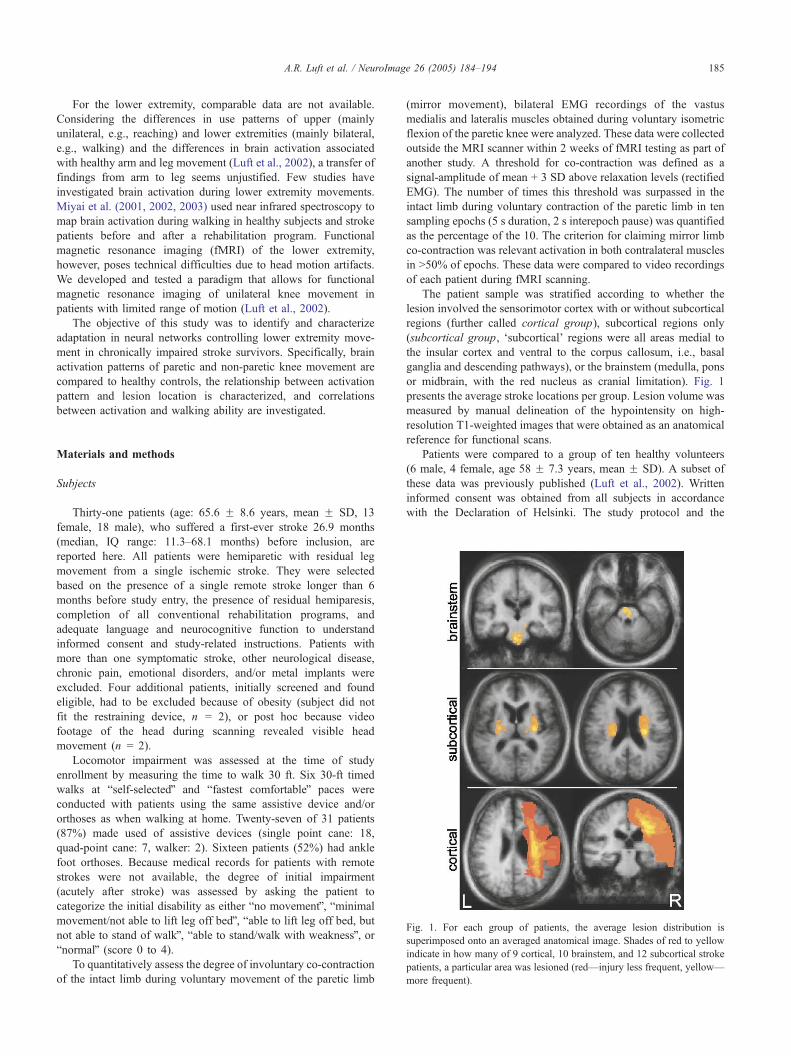
Fig. 1. For each group of patients, the average lesion distribution is
superimposed onto an averaged anatomical image. Shades of red to yellow
indicate in how many of 9 cortical, 10 brainstem, and 12 subcortical stroke
patients, a particular area was lesioned (red—injury less frequent, yellow—
more frequent).
Materials and methods
Subjects
Thirty-one patients (age: 65.6 F 8.6 years, mean F SD, 13
female, 18 male), who suffered a first-ever stroke 26.9 months
(median, IQ range: 11.3–68.1 months) before inclusion, are
reported here. All patients were hemiparetic with residual leg
movement from a single ischemic stroke. They were selected
based on the presence of a single remote stroke longer than 6
months before study entry, the presence of residual hemiparesis,
completion of all conventional rehabilitation programs, and
adequate language and neurocognitive function to understand
informed consent and study-related instructions. Patients with
more than one symptomatic stroke, other neurological disease,
chronic pain, emotional disorders, and/or metal implants were
excluded. Four additional patients, initially screened and found
eligible, had to be excluded because of obesity (subject did not
fit the restraining device, n = 2), or post hoc because video
footage of the head during scanning revealed visible head
movement (n = 2).
Locomotor impairment was assessed at the time of study
enrollment by measuring the time to walk 30 ft. Six 30-ft timed
walks at bself-selectedQ and bfastest comfortableQ paces were
conducted with patients using the same assistive device and/or
orthoses as when walking at home. Twenty-seven of 31 patients
(87%) made used of assistive devices (single point cane: 18,
quad-point cane: 7, walker: 2). Sixteen patients (52%) had ankle
foot orthoses. Because medical records for patients with remote
strokes were not available, the degree of initial impairment
(acutely after stroke) was assessed by asking the patient to
categorize the initial disability as either bno movementQ, bminimal
movement/not able to lift leg off bedQ, bable to lift leg off bed, but
not able to stand of walkQ, bable to stand/walk with weaknessQ, orbnormalQ (score 0 to 4).
To quantitatively assess the degree of involuntary co-contraction
of the intact limb during voluntary movement of the paretic limb
(mirror movement), bilateral EMG recordings of the vastus
medialis and lateralis muscles obtained during voluntary isometric
flexion of the paretic knee were analyzed. These data were collected
outside the MRI scanner within 2 weeks of fMRI testing as part of
another study. A threshold for co-contraction was defined as a
signal-amplitude of mean + 3 SD above relaxation levels (rectified
EMG). The number of times this threshold was surpassed in the
intact limb during voluntary contraction of the paretic limb in ten
sampling epochs (5 s duration, 2 s interepoch pause) was quantified
as the percentage of the 10. The criterion for claiming mirror limb
co-contraction was relevant activation in both contralateral muscles
in N50% of epochs. These data were compared to video recordings
of each patient during fMRI scanning.
The patient sample was stratified according to whether the
lesion involved the sensorimotor cortex with or without subcortical
regions (further called cortical group), subcortical regions only
(subcortical group, dsubcorticalT regions were all areas medial to
the insular cortex and ventral to the corpus callosum, i.e., basal
ganglia and descending pathways), or the brainstem (medulla, pons
or midbrain, with the red nucleus as cranial limitation). Fig. 1
presents the average stroke locations per group. Lesion volume was
measured by manual delineation of the hypointensity on high-
resolution T1-weighted images that were obtained as an anatomical
reference for functional scans.
Patients were compared to a group of ten healthy volunteers
(6 male, 4 female, age 58 F 7.3 years, mean F SD). A subset of
these data was previously published (Luft et al., 2002). Written
informed consent was obtained from all subjects in accordance
with the Declaration of Helsinki. The study protocol and the

A.R. Luft et al. / NeuroImage 26 (2005) 184–194186
consent forms were approved by the participating institutions
(Johns Hopkins University and University of Maryland).
fMRI technique and paradigms
fMRI technique and paradigms were described before (Luft et
al., 2002). In brief, a custom-made Plexiglas scaffold was used to
ensure constant movement range and plane of motion and to limit
concomitant head motion by fixation of pelvis, thigh, and trunk.
fMRI scanning was performed using a 1.5-T scanner (Gyroscan,
Philips, Eindhoven, The Netherlands) at the F.M. Kirby Center for
Functional Brain Imaging, Kennedy Krieger Institute, Baltimore. A
T1-weighted 3D-MPRAGE sequence (TR 8.2 ms, TE 3.7 ms, flip
angle 88, NEX 1, matrix 256 � 256, voxel-resolution: 1 � 1 � 1
mm3) was obtained as anatomical reference. BOLD-weighted EPI
sequences (TR 3 s, TE 40 ms, matrix: 64 � 64, slice thickness 5
mm, pixel resolution 3.75 � 3.75, 30–36 slices to obtain whole
brain coverage, interleaved slice timing) were scanned in axial
orientation while the subject moved either the paretic or the non-
paretic knee (right vs. left in controls). For each functional
measurement, sixty scans were acquired over a period of 3 min
without interscan delay; during this time, three cycles of rest and
knee movements were completed. Knee movements were acous-
tically cued by computer-generated beeps (one every 3 s, beep
duration 0.1 s) triggering 10 movements per cycle. The low pace
allowed all patients to perform the movement without fatiguing (as
tested before scanning).
The movement consisted of unilateral knee extension starting at
308 of flexion and ending at 10 to 158 of flexion. The non-pareticand the paretic limb movement were scanned in sequence. The
movement range was adjusted before scanning to match the
patient’s ability with the paretic limb (measured at the toe: 18 F3.2 cm mean F SD, range: 11.5–23.5 cm), again, with the goal of
avoiding fatigue, and to homogenize the effort required for
movement among patients. The same range of motion was used
for the non-paretic limb. Knee movements were videotaped to
monitor for mirror movements. A second camera positioned above
the subject’s face (built into the scanner) recorded head motion. If
head motion was visible in these recordings, the subject was
excluded from further analysis (this was the case for 2 who are not
included in the 31 patients reported here). Subjects kept their eyes
closed during scanning.
Statistical analysis of fMRI data
BrainVoyager (Brain Innovation B.V., Maastricht, The Nether-
lands) was used to analyze functional imaging data. Image sets
were first corrected for head motion and slice timing and were
temporally smoothed (high pass filter, linear trend removal). Mean
head motion as determined by the correction algorithm was 2.5 F0.1 mm (mean F SEM). In all subjects, maximum movement was
smaller than 3 mm. The efficacy of motion correction was assessed
by viewing the corrected functional image series of every subject
as a movie; residual motion was not observed. Image series were
warped to Talairach space, first, by applying rigid body trans-
formations (translation, rotation), followed by manual definition of
Talairach landmarks, and third, by scaling of 12 landmark-defined
subvolumes into Talairach space.
The predicted time course of voxel intensities was that of a
box-car function with hemodynamic response modification. To
identify activated voxels, linear regression models including data
of single or of all subjects were computed. For single-subject
region of interest (ROI) analysis, the data were spatially
smoothed (4 mm FWHM) and probability thresholds of 0.0001
(uncorrected for multiple comparisons) were employed. Activated
voxels were counted in ten ROIs using software we developed
based on Matlab (Mathworks Inc, Natick, MA, USA). The ten
ROIs were defined in each patient by manually identifying the
following anatomical landmarks in T1 images: The precentral
gyrus was delineated medially from the fundus of the central
sulcus (in the axial plane) to the lateral surface. To include the leg
area, it extended into the interhemispheric fissure. While the
posterior border of the leg area was usually identified by the
medial extension of the central sulcus, the anterior border
separating it from SMA proper, was defined arbitrarily according
to Brodmann’s map. The inferior border of the leg area was the
cingulate sulcus; the inferior boundary of the precentral ROI
laterally was defined as the first axial slice (browsing in dorso-
ventral direction) not showing the hand notch configuration
(inverted omega). SMA proper was anterior to the leg area,
extending to a vertical plane through the anterior commissure
(Zilles et al., 1995). The postcentral ROI was defined as the
postcentral gyrus excluding the area corresponding to the
posterior parietal cortex (Grefkes et al., 2001). The cerebellum
was divided into three ROIs, vermis (medial to the cerebellar
tonsils), left, and right cerebellar hemisphere. The supramarginal
ROI was defined according to Brodmann’s area 40 posterior to
the postcentral gyrus, superior to the Sylvian fissure, anterior of
the angular gyrus, and inferior of the intraparietal fissure.
Superior, middle, and inferior frontal gyri ROIs included the
respective gyri with the following boundaries: medial—medial
hemispheric margin, posterior—precentral ROI, inferior—Sylvian
fissure with horizontal (axial) anterior extension, anterior—
coronal plane through the anterior margin of the genu of the corpus
callosum. To avoid ROI-overlap, previously defined ROIs were
subtracted from original image sets before tracing subsequent ROIs.
Based on the number of activated voxels per ROI, a lateralization
index (LI) was computed as (countcontralateral � countipsilateral)/
(countcontralateral + countipsilateral).
For multi-subject regression models, the data were smoothed
using a kernel of 8 mm FWHM. Data of patients with left
hemisphere stroke were flipped about the mid-sagittal plane.
Hence, the paretic leg was always considered to be the left and
vice versa for the non-paretic. In controls, right- and left-sided
movement data were averaged after appropriate flipping so that the
orientation corresponded with that of patients. Multi-subject
regression models were computed for paretic or non-paretic limbs
with and without inclusion of the mean of self-selected and
maximum walking speeds as covariate. The inclusion of the
covariate allowed for an assessment of correlations between
functional measures of gait and brain activation. Fixed effects
analysis was used with a uniform probability threshold of 0.05
(corrected for multiple comparisons across the entire brain). To
compare activation maps of patients with mirror movements to
those without, difference maps (orthogonal contrasts) were
computed; significance of the difference was then tested by
computing t tests for a set of voxels that were manually selected
in the difference statistical maps. All functional maps were
superimposed onto averaged T1-weighted image sets derived from
all subjects per group.
To localize foci of activation in multi-subject maps, the
Talairach Daemon (Lancaster et al., 1997) with a query range of
A.R. Luft et al. / NeuroImage 26 (2005) 184–194 187
5 mm was used. In the following, the term bprecentral gyrusQ refersto the ROI, whereas bM1Q indicates that activation was mapped to
the posterior rim of the precentral gyrus, i.e., to Brodmann’s area 4
according the Talairach Daemon.
Statistical analysis of numerical data
Baseline characteristics of the subject sample were compared
between groups of patients using ANOVA. Normal distribution and
homogeneity of variances was tested using Schapiro–Wilk and
Levene’s tests. Regional voxel counts were analyzed using a full
factorial ANOVA model including group (three patient groups and
healthy controls), side (ipsilesional versus contralesional), ROI (ten
ROIs), leg (paretic vs. non-paretic), and mirror (presence/absence
of mirror movements) as independent variables. Tukey’s honestly
significant difference (HSD) tests were applied in post hoc analysis
to test for differences between groups. Hemispheric dominance
was assessed by testing whether the LI was different from zero
(one sample t test). Significance was assumed on the 5% level.
Data are reported as mean F SEM unless noted otherwise.
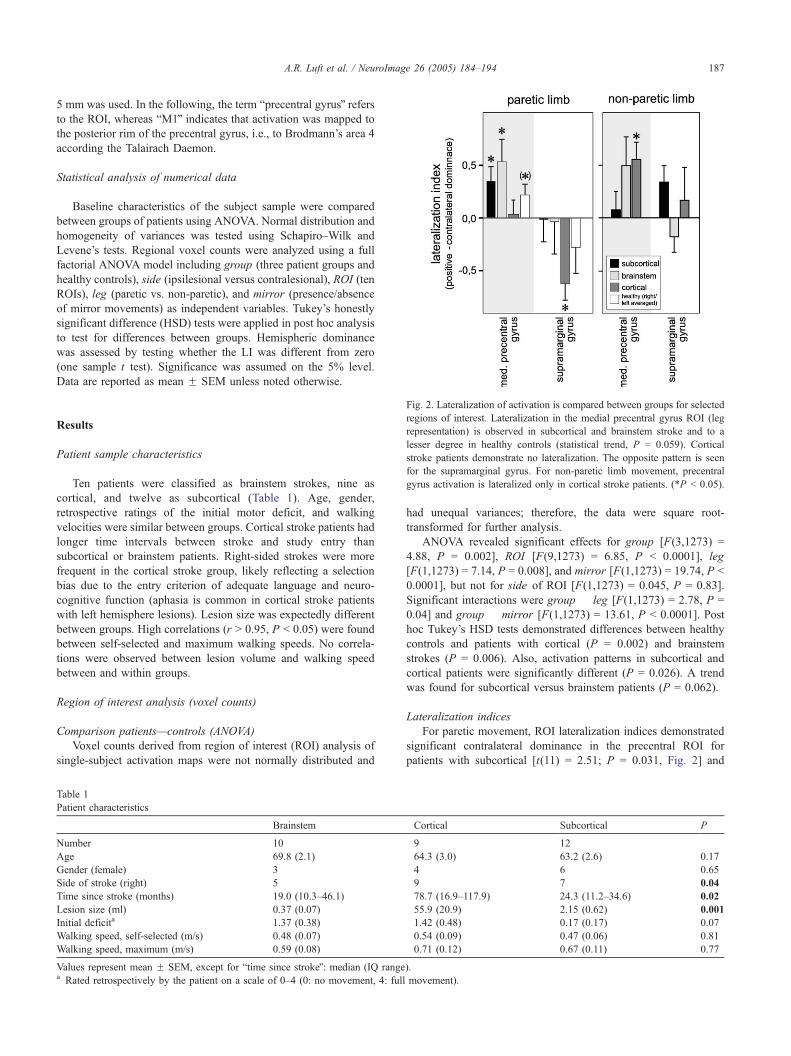
Fig. 2. Lateralization of activation is compared between groups for selected
regions of interest. Lateralization in the medial precentral gyrus ROI (leg
representation) is observed in subcortical and brainstem stroke and to a
lesser degree in healthy controls (statistical trend, P = 0.059). Cortical
stroke patients demonstrate no lateralization. The opposite pattern is seen
for the supramarginal gyrus. For non-paretic limb movement, precentral
gyrus activation is lateralized only in cortical stroke patients. (*P b 0.05).
Results
Patient sample characteristics
Ten patients were classified as brainstem strokes, nine as
cortical, and twelve as subcortical (Table 1). Age, gender,
retrospective ratings of the initial motor deficit, and walking
velocities were similar between groups. Cortical stroke patients had
longer time intervals between stroke and study entry than
subcortical or brainstem patients. Right-sided strokes were more
frequent in the cortical stroke group, likely reflecting a selection
bias due to the entry criterion of adequate language and neuro-
cognitive function (aphasia is common in cortical stroke patients
with left hemisphere lesions). Lesion size was expectedly different
between groups. High correlations (r N 0.95, P b 0.05) were found
between self-selected and maximum walking speeds. No correla-
tions were observed between lesion volume and walking speed
between and within groups.
Region of interest analysis (voxel counts)
Comparison patients—controls (ANOVA)
Voxel counts derived from region of interest (ROI) analysis of
single-subject activation maps were not normally distributed and
Table 1
Patient characteristics
Brainstem
Number 10
Age 69.8 (2.1)
Gender (female) 3
Side of stroke (right) 5
Time since stroke (months) 19.0 (10.3–46.1)
Lesion size (ml) 0.37 (0.07)
Initial deficita 1.37 (0.38)
Walking speed, self-selected (m/s) 0.48 (0.07)
Walking speed, maximum (m/s) 0.59 (0.08)
Values represent mean F SEM, except for btime since strokeQ: median (IQ rangea Rated retrospectively by the patient on a scale of 0–4 (0: no movement, 4: full
had unequal variances; therefore, the data were square root-
transformed for further analysis.
ANOVA revealed significant effects for group [F(3,1273) =
4.88, P = 0.002], ROI [F(9,1273) = 6.85, P b 0.0001], leg
[F(1,1273) = 7.14, P = 0.008], and mirror [F(1,1273) = 19.74, P b
0.0001], but not for side of ROI [F(1,1273) = 0.045, P = 0.83].
Significant interactions were group � leg [F(1,1273) = 2.78, P =
0.04] and group � mirror [F(1,1273) = 13.61, P b 0.0001]. Post
hoc Tukey’s HSD tests demonstrated differences between healthy
controls and patients with cortical (P = 0.002) and brainstem
strokes (P = 0.006). Also, activation patterns in subcortical and
cortical patients were significantly different (P = 0.026). A trend
was found for subcortical versus brainstem patients (P = 0.062).
Lateralization indices
For paretic movement, ROI lateralization indices demonstrated
significant contralateral dominance in the precentral ROI for
patients with subcortical [t(11) = 2.51; P = 0.031, Fig. 2] and
Cortical Subcortical P
9 12
64.3 (3.0) 63.2 (2.6) 0.17
4 6 0.65
9 7 0.04
78.7 (16.9–117.9) 24.3 (11.2–34.6) 0.02
55.9 (20.9) 2.15 (0.62) 0.001
1.42 (0.48) 0.17 (0.17) 0.07
0.54 (0.09) 0.47 (0.06) 0.81
0.71 (0.12) 0.67 (0.11) 0.77
).
movement).

A.R. Luft et al. / NeuroImage 26 (2005) 184–194188
brainstem strokes (t(9) = 2.43; P = 0.041). A trend for
contralateral dominance was found in healthy controls [t(9) =
2.16, P = 0.059]. No dominance was seen in cortical stroke
patients—neither in the entire group nor in a subgroup of four
patients who showed bilateral precentral gyrus activation. Instead,
significant lateralization was found for the supramarginal ROI
(BA 40, t(8) = 3.91, P = 0.004, Fig. 2). For non-paretic
movement, contralateral dominance in the precentral gyri was
observed in the cortical stroke group (t(8) = 3.55, P = 0.0094,
Fig. 2).
Correlation between voxel counts and lesion volume
Correlations between voxel counts and lesion volume were
found for the paretic limb in brainstem stroke: Ipsilateral
(contralesional) superior frontal gyrus activation (premotor
cortex) was positively related to lesion volume (r = 0.80,
P = 0.01); the lateralization index showed a negative
correlation (r = �0.76, P = 0.018). In subcortical stroke
patients, activation in the inferior frontal gyrus associated with
non-paretic movement was positively correlated with lesion
volume (r = 0.86, P = 0.001).
Fig. 3. Activation patterns of paretic (red–yellow), non-paretic (blue), and healthy
templates. Image data of patients with left-sided stroke are flipped about the mid-s
control subjects, activation patterns of left- and right-sided knee movement were
Whereas during paretic limb movement, subcortical stroke patients and, to a lesser
almost no cortical activation is observed in patients with cortical stroke. For n
activation is seen in all groups, but is also markedly different from control.
Activation maps associated with paretic movement
Multi-subject statistical mapping revealed more widespread
activation in subcortical than in cortical or brainstem patients
(Fig. 3, see Table 2 for Talairach coordinates). In subcortical
stroke, strong recruitment of the leg representation of the primary
motor cortex (M1) contralateral to the paretic limb and–to a
lesser extent–the corresponding region in the ipsilateral hemi-
sphere was observed. Recruitment was also found in bilateral
SMA, in the supramarginal gyrus corresponding to Brodmann’s
area (BA) 40 (secondary somatosensory area, S2), and in the
anterior cingulate gyrus (BA 24). Further activation was observed
in contralateral thalamus and in ipsilateral cerebellum (vermis and
anterior lobe).
Patients with brainstem stroke recruited the M1 leg representa-
tion (Fig. 3). Activation was also seen in contralateral SMA and
premotor cortex (BA 6), ipsilateral S2, and contralateral thalamus.
Cerebellar activation was found in the ipsilateral hemisphere
(declive).
Cortical stroke patients as a group revealed little overall brain
activation and no recruitment of M1. In 4 patients, bilateral motor
control knee movement (green) are superimposed onto averaged anatomical
agittal plane so that the lesioned hemisphere is always the right. For healthy
averaged (after appropriate flipping so that the moving limb is the left).
degree, brainstem patients recruit sensorimotor cortex and SMA bilaterally,
on-paretic limb movement, consistent contralateral primary motor cortex

Table 2
Talairach coordinates of activation foci per group and limb
Group Arm Region BA Side x y z
Brainstem Paretic Medial M1 4 Contra 4 �29 59
SMA 6 Contra 4 �18 59
Anterior cingulate 24 Contra 4 �14 59
Posterior cingulate 30 Contra 4 �47 15
Precuneus 7 Contra 13 �47 50
Precentral gyrus 6 Ipsi �48 �2 40
Parietal lobule 40 Ipsi �49 �46 24
Posterior cingulate 30 Ipsi �4 �47 15
Thalamus Contra 20 �20 12
Cerebellum (declive) Ipsi �30 �60 �19
Non-paretic Medial M1 4 Contra �3 �34 60
SMA 6 Contra �4 �24 50
Anterior cingulate 24 Ipsi 5 �13 39
Postcentral 3 Contra �31 �20 45
Parietal lobule 40 Ipsi 56 �29 27
Parietal lobule 40 Contra �44 �39 28
Posterior cingulate 30 Ipsi 4 �49 13
Thalamus Ipsi 14 �16 12
Cerebellum (declive) Contra �25 �75 �28
Subcortical Paretic Medial M1 4 Contra 9 �35 58
Medial M1 4 Ipsi �8 �37 57
SMA 6 Contra 1 �16 56
SMA 6 Ipsi �10 �13 53
Anterior cingulate 24 Bilateral F10 �11 42
Lateral M1 4 Contra 33 �18 42
Precentral gyrus 6 Contra 43 �5 24
Precentral gyrus 6 Ipsi �43 �15 33
Parietal lobule 40 Contra 48 �34 27
Parietal lobule 40 Ipsi �52 �34 27
Superior temporal gyrus 41 Contra 52 �23 8
Superior temporal gyrus 41 Bilateral F57 0 1
Thalamus Contra F13 �16 1
Caudatum Ipsi �27 �10 6
Anterior vermis 0 �45 �15
Cerebellum (ant. lobe) Ipsi �22 �45 �24
Non-paretic Medial M1 4 Contra �4 �44 55
SMA 6 Contra �4 �34 61
Anterior cingulate 24 Contra �8 �12 37
Anterior cingulate 24 Ipsi 9 �12 36
Precentral gyrus 6 Ipsi 44 �13 33
Parietal lobule 40 Contra �53 �35 34
Parietal lobule 40 Ipsi 50 �32 34
Superior temporal gyrus 22 Contra �51 �23 5
Superior temporal gyrus 22 Ipsi 50 �18 5
Thalamus Contra �16 �18 6
Anterior vermis 4 �45 �17
Cerebellum (ant. lobe) Contra �27 �53 �20
Cerebellum (ant. lobe) Ipsi 31 �56 �18
Dentate nucleus Contra �22 �58 �30
Dentate nucleus Ipsi 12 �56 �30
Cortical Paretic Anterior cingulate 31 Ipsi �2 �34 32
Parietal lobule 40 Ipsi �52 �43 24
Posterior cingulate 30 Bilateral F4 �47 16
Thalamus Bilateral F17 �13 2
Putamen Ipsi �28 �15 2
Vermis 0 �79 �20
Cerebellum (ant. lobe) Contra 23 �52 �28
Non-paretic Medial M1 4 Contra �10 �48 55
SMA 6 Contra �7 �31 57
Anterior cingulate 24 Ipsi 6 �19 39
Parietal lobule 40 Contra 48 �40 28
Parietal lobule 40 Ipsi �50 �40 29
Posterior cingulate 30 Bilateral F4 �42 12
(continued on next page)
A.R. Luft et al. / NeuroImage 26 (2005) 184–194 189

Fig. 4. Multi-subject activation maps of subcortical stroke patients stratified
according to the presence of mirror movements. Larger ipsi- and
contralateral motor cortex recruitment is found for patients without mirror
movements (orange). Patients with such movements (green) have stronger
recruitment of contralateral SMA.
Table 2 (continued)
Group Arm Region BA Side x y z
Volunteer Right/Left Medial M1 4 Contra 8 �39 59
SMA 6 Contra 6 �25 57
Anterior cingulate 24 Contra 12 �10 40
Anterior cingulate 24 Ipsi �9 �9 41
Precentral gyrus 6 Contra 46 �3 33
Precentral gyrus 6 Ipsi �42 �5 35
Parietal lobule 40 Contra 45 �25 22
Parietal lobule 40 Ipsi �46 �29 22
Thalamus Contra 21 �19 1
Thalamus Ipsi �10 �17 �3
Cerebellum (ant. lobe) Ipsi �21 �29 �21
Abbreviations: Contra—contralateral to darmT, Ipsi—ipsilateral to darmT, BA—Brodmann’s area, x/y/z—Talairach coordinates.
A.R. Luft et al. / NeuroImage 26 (2005) 184–194190
cortex activation was seen in single-subject analysis (data not
shown). Apart from M1, activation was found in ipsilateral
thalamus, BA 40, and cingulate gyrus (Fig. 3).
Activation maps associated with non-paretic movement
Recruitment of M1 contralateral to the non-paretic limb was
observed in all groups of patients (Fig. 3). Further activation was
identified in SMA, cerebellum, cingulum, and in postcentral,
supramarginal, and angular gyri (Table 2).
Influence of mirror movements on the activation pattern
Presence or absence of mirror limb co-contraction in EMG
recordings outside the scanner correlated well with video footage
during fMRI scanning (Spearman correlation coefficient: 0.85, P b
0.0001). One patient with subcortical stroke had no visible
movement on video despite relevant co-contraction of the
unimpaired vastus medialis (100% of epochs) and vastus lateralis
muscles (60% of epochs); another patient with subcortical stroke
had some mirror movement in the foot, but EMG analysis did not
reveal co-contraction.
Among ten patients with brainstem stroke, five (50%; one
patient had visible movement during fMRI, but EMG was
unavailable) were classified as having mirror movements. These
were compared to the five patients without such movements: The
difference GLM revealed significantly stronger activation in the
ipsilateral anterior lobe of the cerebellum in patients with mirror
movements (Talairach coordinates:�26/�41/�28; t = 8.37, P b
0.0001). No differences were found in the cerebral hemispheres.
Walking speed was not different in brainstem patients with mirror
movements versus those without.
In twelve subcortical patients, mirror movements were identi-
fied in seven (58%). These were compared to five patients without
such movements (Fig. 4). Patients with mirror movements showed
significantly higher activation in contralateral SMA (Talairach
coordinates: 3/�10/68; t = 2.97, P b 0.003) and in the ipsilateral
posterior lobe of the cerebellum (�18/�81/�24; t = 4.75; P b
0.0001). Lower activation was found in the contralateral post-
central gyrus (45/�27/39; t = 3.78; P = 0.0002), and in bilateral
primary motor cortex (contralateral: 26/�25/56; t = 3.02; P =
0.003; ipsilateral:�16/�24/52; t = 4.36; P b 0.0001) and anterior
cerebellar lobes (contralateral: 40/�44/�25; t = 2.66; P = 0.008;
ipsilateral:�36/�39/�26; t = 4.340; P b 0.0001). Walking speed
was not different in subcortical patients with mirror movements
versus those without.
None of the patients with cortical stroke met the criteria for co-
contraction in EMG or showed mirror movements on video
footage. The frequency of mirror movement differed significantly
between patient groups as revealed by logistic regression analysis
[stroke location as a predictor for the presence of mirror
movements: v2(2) = 9.03, P = 0.011]. The power of this test was
0.89.
Brain activation related to walking ability
Activation foci determined by a linear model with mean
walking speed as covariate are listed for each group of patients
in Table 3. Interestingly, walking ability was not only related to
brain activation observed during paretic but also to activation
associated with non-paretic knee movement. For paretic move-
ment, less contralateral M1 activation was associated with better
walking in patients with brainstem strokes. In contrast, stronger
ipsilateral M1 and S1 activation was related to better walking in
subcortical stroke. In cortical stroke, the same was found for
bilateral S1. Covariate analysis after patient stratification according
to the presence of mirror movements (subcortical and brainstem
patients) did not reveal significant results, likely because sample
sizes were too small.
Discussion
These findings demonstrate that brain activation associated with
paretic as well as with non-paretic lower extremity movement in

Table 3
Talairach coordinates of activation foci correlated with walking ability per group and limb
Group Arm r Region BA Side x y z
Brainstem Paretic � M1 4 Contra 46 �8 47
� Precuneus 7 Bilateral F3 �49 63
� Insula 13 Ipsi �32 �21 6
� Middle temporal gyrus 21 Ipsi �63 �36 �7
� Cingulum 24 Contra 17 �12 43
� Posterior cingulum 30 Ipsi �4 �44 21
� S2 40 Contra 47 �35 43
� Cerebellum (post. lobe) Bilateral F11 �69 �24
Non-paretic � Paracentral lobule 5 Ipsi 25 �39 45
� Precentral gyrus 6 Ipsi 49 �13 35a
� Cingulum 31 Ipsi 9 �39 36
� Middle temporal gyrus 39 Ipsi 48 �59 8
� Cerebellum (post. lobe) Contra �33 �68 �26
� Cerebellum (nodulus) Ipsi 10 �53 �26
+ Middle frontal gyrus 8 Ipsi 33 21 47
+ Cingulum 32 Contra �13 12 38
Subcortical Paretic � S1 3 Contra 26 �28 67
� M1 4 Contra 21 �23 67
� Precentral gyrus 6 Contra 28 �13 67
� Superior fronal gyrus 6 Contra 30 39 33
� Superior parietal lobule 7 Bilateral F26 �58 57
� Middle frontal gyrus 8 Contra 41 17 43
+ S1 3 Ipsi �20 �30 62
+ M1 4 Ipsi �20 �25 62
+ Pallidum Bilateral F16 �9 �5
Non-paretic � M1 4 Ipsi 38 �19 62
� Middle frontal gyrus 6 Ipsi 30 1 51
� Precentral gyrus 6 Ipsi 39 �3 28
� Precuneus 7 Ipsi 4 �67 49
� Cuneus 18 Bilateral F15 �68 16
� S2 40 Ipsi 47 �45 51
� Cerebellum (post. lobe) Contra �30 �78 �30
+ Precuneus 7 Contra �20 �70 43
+ Medial frontal gyrus 8 Ipsi 15 24 46
+ Middle frontal gyrus 9 Contra �34 21 33
+ Cuenus 18 Ipsi 22 �85 23
+ Temporal lobe 21 Contra �46 �30 �3
+ Anterior cingulate 24 Contra �7 5 39
+ S2 40 Ipsi 55 �28 26
+ Inferior frontal gyrus 45 Ipsi 55 18 14
+ Cerebellum (ant. lobe) Ipsi 19 �34 �16
Cortical Paretic + S1 3 Contra 13 �39 72b
+ S1 3 Ipsi �21 �37 72
+ Superior parietal lobule 7 Ipsi �32 �47 62
+ Precuneus 7 Bilateral F5 �71 39
+ Putamen Contra 23 �1 11
+ Cerebellum (post. lobe) Ipsi �28 �80 �30
Non-paretic � Precentral gyrus 6 Ipsi 41 �7 53c
� S2 40 Ipsi 44 �32 52
+ Precentral gyrus 6 Contra �35 �3 41c
+ Precuneus 7 Contra �4 �57 39
+ Middle frontal gyrus 9 Contra �27 18 32
+ Insula 13 Contra �36 �37 17
+ Superior temporal gyrus 22 Contra �41 �57 17
+ S2 40 Contra �38 �34 41
+ Superior temporal gyrus 41 Ipsi 48 �23 8
+ Putamen Ipsi 21 �3 9
+ Cerebellum (post. lobe) Bilateral F16 �73 �26
Results of region of interest analysis (voxel counts) support ANCOVA map findings: anegative correlation between precentral ROI and mean walking speed
(r = �0.92, P = 0.001); bpositive correlation between lateralization index of postcentral ROI and mean walking speed (r = 0.75, P = 0.032); cpositive
correlation between lateralization index of precentral ROI and mean walking speed (r = 0.70, P = 0.035).
Abbreviations: r—correlation (positive/negative), Contra—contralateral to darmT, Ipsi—ipsilateral to darmT, BA—Brodmann’s area, x/y/z—Talairach
coordinates.
A.R. Luft et al. / NeuroImage 26 (2005) 184–194 191

A.R. Luft et al. / NeuroImage 26 (2005) 184–194192
chronically hemiparetic stroke patients differs substantially from
activation in healthy controls. The differences depend on stroke
location: in patients with cortical lesions, recruitment of sensor-
imotor cortices occurs variably and, if present, is bilateral; stronger
S1 activation is associated with better walking ability. In brainstem
stroke, activation is reduced as compared to controls and lesser
activation (of contralateral M1) predicts better walking. Patients
with subcortical lesions have recruitment of sensorimotor cortices
that is very similar to healthy control. Higher ipsilateral sensor-
imotor cortex activation in these patients relates to better walking.
The presence of mirror movements in this group has an influence
on the cortical activation pattern. Other areas differentially
activated by unilateral knee movement in all patients groups and
normals were SMA, cingulum, cerebellar hemispheres, and S2
(Brodmann’s area 40).
That paretic knee movement is associated with brain activation
patterns that differ from healthy control seems expected given the
number of studies reporting similar findings for hand and elbow
movement (Calautti and Baron, 2003). We have shown previously
that the activation pattern of paretic elbow movement depends on
lesion location (Luft et al., 2004). This is confirmed here for knee
movement. In our previous study, patients with brainstem strokes
were included in the subcortical group due to limited sample size.
The current sample was large enough to separate these groups: a
marginal difference in the activation pattern is found between them
(P = 0.062). The activation pattern in brainstem patients is closer
to that of cortical lesions (group difference: P = 0.84); the latter
was significantly different from subcortical stroke. Both brainstem
and cortical lesions affect descending motor pathways. Brainstem
strokes may destroy a larger percentage of descending fibers as
they occupy smaller space when traversing the brainstem. Possibly,
differences exist between bsubcorticalQ lesions affecting fiber
systems and basal ganglia as opposed to fiber systems alone, but
no study has so far managed to collect a sufficient number of
patients with well-circumscribed lesions to demonstrate such
differences. The observation that in cortical stroke sensorimotor
cortex recruitment is low seems an expected consequence of
cortical damage. Compensatory activation of areas adjacent to the
lesion is often observed (Calautti and Baron, 2003; Cramer et al.,
1997; Luft et al., 2004). The heterogeneity of cortical lesions and
hence, the variability of the geometry of intact cortex surrounding
these lesions, has likely prevented us from detecting the activation
adjacent to the stroke cavity in multi-subject analysis here. Single-
subject analysis, however, demonstrates cortical recruitment in a
subset of patients.
In healthy subjects, brain activation patterns observed during
unilateral knee movement are similar to the patterns associated
with walking as measured by near infrared spectrocscopy (NIRS,
Miyai et al., 2001). Therefore, we assume that knee movement is
an acceptable paradigm to study lower extremity function in
fMRI where walking cannot be performed (Luft et al., 2002). In a
group of six stroke patients (4 with cortical, 2 with subcortical
lesions), Miyai et al. (2002) observed walking-associated recruit-
ment of bilateral premotor cortex and SMA with lateralization
towards the affected hemisphere. Recruitment of primary motor
cortex showed opposite lateralization. Activation in these areas is
found here for subcortical stroke. Cortical stroke, however, shows
significantly less activation in these regions and no evidence for
lateralization. This may explain why Miyai et al. found intact
hemisphere dominance when a group, consisting mainly of
cortical strokes, moved both legs at the same time and unaffected
leg movement was responsible for most of cortical recruitment.
The contribution of the sensorimotor cortex in the intact
hemisphere to paretic movement in patients with cortical stroke
is disputed (Johansen-Berg et al., 2002; Werhahn et al., 2003).
Our data speak for functional relevance of bilateral S1 in these
patients. Interestingly, higher activation of intact hemisphere S1
was also related to better arm function in cortical stroke patients
in a prior study (Luft et al., 2004). Sensorimotor cortex
recruitment in the intact hemisphere may also be a consequence
of mirror movement. Here, this is unlikely, as such movements
were not observed in cortical stroke patients.
The absence of mirror movements in cortical stroke patients
contrasts a study reporting such movements in the upper
extremities in 2 of 4 cortical stroke patients (Kim et al., 2003).
Although our observation has to be considered with caution given
low sample sizes, statistical significance with adequate power
suggests that mirror movements in the legs are at least infrequent
in patients with cortical stroke. Also unexpected is reduced
contralesional activation in subcortical patients with mirror
movements as compared to those without. This contrasts several
studies documenting activation in contralesional (ipsilateral)
motor areas in conjunction with upper extremity mirror move-
ments (Cohen et al., 1991; Kim et al., 2003; Weiller et al., 1993).
Together, our observations may suggest that the mechanisms for
mirror movements in lower and upper extremities are different.
However, this study was not designed to investigate brain
activation associated with mirror movements. Thus, the post
hoc nature of the assessment, the influence of a number of
uncontrolled confounders such as severity of impairment and
exact lesion site, and the lack of EMG monitoring during fMRI
render the results difficult to interpret and further study is
certainly needed. Given the present analysis, we do, however,
think that the presence of mirror movements does not influence
the main conclusions of the study.
Abnormal activation patterns were found not only for paretic
but also for non-paretic limb movement. Several functional
imaging studies have described alterations in non-paretic move-
ment-associated activation patterns for the upper extremity
(Cramer et al., 1997; Luft et al., 2004). Post-stroke modifications
in neuronal networks controlling the paretic limb, especially
compensatory recruitment of the non-lesioned hemisphere, may
affect cortical areas in control of the non-paretic limb. Also, non-
use of both lower extremities due to impaired walking or altered
limb kinematics and body posture due to hemiparesis may induce
neural adaptations in networks controlling the intact limb.
Higher walking speed as a measure of locomotor ability was
associated with higher or lower activation of several brain regions.
In brainstem stroke, lesser recruitment of contralateral motor
cortices in the ipsilesional hemisphere was associated with better
walking. For subcortical stroke, we did find evidence that higher
activation in contralesional and lower activation in ipsilesional
sensorimotor cortex was linked to faster walking. At first, these
findings seem to challenge the hypothesis that the recovery of
perilesional activation is an indicator of functional improvement
(Calautti and Baron, 2003). However, studies leading to this
hypothesis did not investigate lower extremity movement, the
recovery of which may be substantially different as compared with
the arm. In cortical stroke patients, who presented little activation
overall, stronger recruitment of several areas in both hemispheres
was associated with faster walking. This may be consistent with the
idea that compensatory recruitment of bilateral cortical regions is

A.R. Luft et al. / NeuroImage 26 (2005) 184–194 193
required when cortex itself is damaged; the better this compensa-
tion evolves, the better motor abilities can be attained. These
conclusions remain speculative and await further testing in larger
patient samples with levels of impairment more widely distributed
than the sample investigated here.
A limitation of the study is that contractions of the resting limb
resulting from the attempt to stabilize the trunk during knee
movements were not controlled. We designed the Plexiglas
scaffold and the movement task to provide a high degree of
stabilization. Stabilization by contraction of contralateral proximal
muscles is more likely in patients with higher impairment. Because
the degree of impairment was similar between patient groups,
stabilization is not expected to affect the comparison between
patient groups. The comparison between patients and controls may
be affected. But, we think that this error is minimal. If it were not,
patients should show higher contralesional motor cortex recruit-
ment reflecting intact limb activation as compared with controls—
this was not observed.
Conclusion
This study demonstrates that central adaptations occur in
networks controlling the paretic as well as the non-paretic lower
limb after stroke. The nature of these changes depends on lesion
location. Such adaptations may indicate cortical reorganization that
may be specifically accessed by neurorehabilitative interventions
to improve locomotor function in chronically impaired stroke
survivors.
Acknowledgments
We thank Andrew Goldberg, Jim Boyd, Christina Stephenson,
Jill England, and Justin Rajendra for their support. We thank the
F.M. Kirby Center for Functional Brain Imaging, Kennedy Krieger
Institute (Baltimore, MD, USA), and its staff, especially Terry
Brawner, Dr. James Pekar, and Dr. Peter van Zijl. Dr. Luft is
supported by grants from Deutsche Forschungsgemeinschaft (Lu
748/3). Funding for this study was obtained from the National
Institutes of Health (P60AG 12583 NIA University of Maryland
Claude D. Pepper Older Americans Independence Center) the
Baltimore Department of Veterans Affairs Medical Center Geriatrics
Research, Education and Clinical Center (GRECC), Dr. Hanley is
supported by 1RO1 NS 24282-08 and the France-Merrick Founda-
tion, the Johns Hopkins GCRC (grant NCRR #MO1-00052), the
National Center for Research Resources, MO1 RR-00052, and the
Eleanor Naylor Dana Charitable Trust.
References
Calautti, C., Baron, J.C., 2003. Functional neuroimaging studies of motor
recovery after stroke in adults: a review. Stroke 34, 1553–1566.
Chollet, F., DiPiero, V., Wise, R.J., Brooks, D.J., Dolan, R.J., Frackowiak,
R.S., 1991. The functional anatomy of motor recovery after stroke in
humans: a study with positron emission tomography. Ann 29, 63–71.
Cohen, L.G., Meer, J., Tarkka, I., Bierner, S., Leiderman, D.B., Dubinsky,
R.M., Sanes, J.N., Jabbari, B., Branscum, B., Hallett, M., 1991.
Congenital mirror movements. Abnormal organization of motor path-
ways in two patients. Brain 114 (Pt. 1B), 381–403.
Cramer, S.C., Nelles, G., Benson, R.R., Kaplan, J.D., Parker, R.A., Kwong,
K.K., Kennedy, D.N., Finklestein, S.P., Rosen, B.R., 1997. A functional
MRI study of subjects recovered from hemiparetic stroke. Stroke 28,
2518–2527.
Feydy, A., Carlier, R., Roby-Brami, A., Bussel, B., Cazalis, F., Pierot, L.,
Burnod, Y., Maier, M.A., 2002. Longitudinal study of motor recovery
after stroke: recruitment and focusing of brain activation. Stroke 33,
1610–1617.
Grefkes, C., Geyer, S., Schormann, T., Roland, P., Zilles, K., 2001.
Human somatosensory area 2: observer-independent cytoarchitectonic
mapping, interindividual variability, and population map. NeuroImage
14, 617–631.
Hallett, M., 2001. Plasticity of the human motor cortex and recovery from
stroke. Brain Res., Brain Res. Rev. 36, 169–174.
Johansen-Berg, H., Rushworth, M.F., Bogdanovic, M.D., Kischka, U.,
Wimalaratna, S., Matthews, P.M., 2002. The role of ipsilateral premotor
cortex in hand movement after stroke. Proc. Natl. Acad. Sci. U. S. A.
99, 14518–14523.
Kim, Y.H., Jang, S.H., Chang, Y., Byun, W.M., Son, S., Ahn, S.H., 2003.
Bilateral primary sensori-motor cortex activation of post-stroke mirror
movements: an fMRI study. NeuroReport 14, 1329–1332.
Lancaster, J.L., Summerln, J.L., Rainey, L., Freitas, C.S., Fox, P.T., Evans,
A.E., Toga, A.W., Mazziotta, J.C., 1997. The Talairach Daemon, a
database server for Talairach atlas labels. Neuroimage. NeuroImage 5,
S633.
Luft, A.R., Smith, G.V., Forrester, L., Whitall, J., Macko, R.F., Hauser,
T.K., Goldberg, A.P., Hanley, D.F., 2002. Comparing brain activation
associated with isolated upper and lower limb movement across
corresponding joints. Hum. Brain Mapp. 17, 131–140.
Luft, A.R., Waller, S., Forrester, L., Smith, G.V., Whitall, J., Macko, R.F.,
Schulz, J.B., Hanley, D.F., 2004. Lesion location alters brain
activation in chronically impaired stroke survivors. NeuroImage 21,
924–935.
Macko, R.F., DeSouza, C.A., Tretter, L.D., Silver, K.H., Smith, G.V.,
Anderson, P.A., Tomoyasu, N., Gorman, P., Dengel, D.R., 1997.
Treadmill aerobic exercise training reduces the energy expenditure and
cardiovascular demands of hemiparetic gait in chronic stroke patients. A
preliminary report. Stroke 28, 326–330.
Marshall, R.S., Perera, G.M., Lazar, R.M., Krakauer, J.W., Constantine,
R.C., DeLaPaz, R.L., 2000. Evolution of cortical activation during
recovery from corticospinal tract infarction. Stroke 31, 656–661.
Mayo, N.E., Dauphinee, S., Ahmed, S., Gordon, C., Higgins, J., McEwen,
S., Salbach, N., 1999. Disablement following stroke. Disabil. Rehabil.
21, 258–268.
Miyai, I., Tanabe, H.C., Sase, I., Eda, H., Oda, I., Konishi, I., Tsunazawa,
Y., Suzuki, T., Yanagida, T., Kubota, K., 2001. Cortical mapping of gait
in humans: a near-infrared spectroscopic topography study. NeuroImage
14, 1186–1192.
Miyai, I., Yagura, H., Oda, I., Konishi, I., Eda, H., Suzuki, T., Kubota, K.,
2002. Premotor cortex is involved in restoration of gait in stroke. Ann.
Neurol. 52, 188–194.
Miyai, I., Yagura, H., Hatakenaka, M., Oda, I., Konishi, I., Kubota, K.,
2003. Longitudinal optical imaging study for locomotor recovery after
stroke. Stroke 34, 2866–2870.
Moseley, A.M., Stark, A., Cameron, I.D., Pollock, A., 2003. Treadmill
training and body weight support for walking after stroke. Cochrane
Database Syst. Rev. (CD002840). DOI:10.1002/14651858.CD002840.
Seitz, R.J., Hfflich, P., Binkofski, F., Tellmann, L., Herzog, H., Freund,
H.J., 1998. Role of the premotor cortex in recovery from middle
cerebral artery infarction. Arch 55, 1081–1088.
Smith, G.V., Silver, K.H., Goldberg, A.P., Macko, R.F., 1999. bTask-orientedQ exercise improves hamstring strength and spastic reflexes in
chronic stroke patients. Stroke 30, 2112–2118.
Ward, N.S., Brown, M.M., Thompson, A.J., Frackowiak, R.S., 2003.
Neural correlates of outcome after stroke: a cross-sectional fMRI study.
Brain 126, 1430–1448.
Weiller, C., Chollet, F., Friston, K.J., Wise, R.J., Frackowiak, R.S., 1992.

A.R. Luft et al. / NeuroImage 26 (2005) 184–194194
Functional reorganization of the brain in recovery from striatocapsular
infarction in man. Ann. Neurol. 31, 463–472.
Weiller, C., Ramsay, S.C., Wise, R.J., Friston, K.J., Frackowiak, R.S., 1993.
Individual patterns of functional reorganization in the human cerebral
cortex after capsular infarction. Ann. Neurol. 33, 181–189.
Werhahn, K.J., Conforto, A.B., Kadom, N., Hallett, M., Cohen, L.G., 2003.
Contribution of the ipsilateral motor cortex to recovery after chronic
stroke. Ann. Neurol. 54, 464–472.
Zilles, K., Schlaug, G., Matelli, M., Luppino, G., Schleicher, A., Qu, M.,
Dabringhaus, A., Seitz, R., Roland, P.E., 1995. Mapping of human and
macaque sensorimotor areas by integrating architectonic, transmitter
receptor, MRI and PET data. J Anat 187 (Pt. 3), 515–537.
Copyright © 2022 FDOKUMEN