Investigation of hand muscle atrophy in stroke survivors
14
Investigation of hand muscle atrophy in stroke survivors Kristen M. Triandafilou 1 and Derek G. Kamper 1,2 1 Sensory Motor Performance Program, Rehabilitation Institute of Chicago, Chicago, Illinois 2 Department of Biomedical Engineering, Illinois Institute of Technology, Chicago, Illinois Abstract Background—Weakness is often profound in the contralesional hand after stroke. Relative contributions of various neural and mechanical mechanisms to this impairment, however, have not been quantified. In this study, the extent of one potential contributor, muscle atrophy, was noninvasively assessed in index finger musculature using ultrasonographic techniques. Methods—Twenty-five stroke survivors (45–65 years old) with severe hand impairment resulting from a stroke occurring 2–4 years prior participated, along with 10 age-matched control subjects. Muscle cross sectional area and thickness were geometrically measured from ultrasound images on both limbs of participants. Findings—Muscle size on the paretic limb of stroke survivors was smaller for all 7 hand muscles investigated. An average difference of 15% (SD 4) was seen for muscle cross sectional area and 11% (SD 2) for muscle thickness, while the difference between the dominant and non-dominant limbs for control subjects (6% (SD 2) and 1% (SD 4) for the muscle cross sectional area and muscle thickness, respectively) was not significant. Interpretation—Although muscle atrophy was detected in the paretic limb following stroke, it is not explanatory of the marked impairment in strength seen in this stroke population. However, other alterations in muscle morphology, such as fatty infiltrations and changes in fiber structure, may contribute to the emergent muscle weakness post-stroke. Keywords hand; stroke; muscle; atrophy; ultrasound Introduction Weakness in the contralesional limb is a common finding in stroke survivors. Strength deficits in the hands can be especially profound, as evidenced by studies of finger, grip and pinch strength. In fact, studies investigating the index finger indicate losses of greater than 75% (Cruz et al., 2005). While excessive coactivation and an inability to fully activate these muscles contribute to this weakness, muscle atrophy may also play a role. © 2011 Elsevier Ltd. All rights reserved. Corresponding author: Kristen Triandafilou, M.S., Research Engineer, Rehabilitation Institute of Chicago, Suite 1406, 345 E. Superior Street, Chicago, IL 60611, (312) 238 – 2777 – phone, (312) 238 – 2208 – fax, [email protected]. Publisher's Disclaimer: This is a PDF file of an unedited manuscript that has been accepted for publication. As a service to our customers we are providing this early version of the manuscript. The manuscript will undergo copyediting, typesetting, and review of the resulting proof before it is published in its final citable form. Please note that during the production process errors may be discovered which could affect the content, and all legal disclaimers that apply to the journal pertain. NIH Public Access Author Manuscript Clin Biomech (Bristol, Avon). Author manuscript; available in PMC 2013 March 1. Published in final edited form as: Clin Biomech (Bristol, Avon). 2012 March ; 27(3): 268–272. doi:10.1016/j.clinbiomech.2011.10.002. NIH-PA Author Manuscript NIH-PA Author Manuscript NIH-PA Author Manuscript
-
Upload
independent -
Category
Documents
-
view
2 -
download
0
Transcript of Investigation of hand muscle atrophy in stroke survivors

Investigation of hand muscle atrophy in stroke survivors
Kristen M. Triandafilou1 and Derek G. Kamper1,2
1Sensory Motor Performance Program, Rehabilitation Institute of Chicago, Chicago, Illinois2Department of Biomedical Engineering, Illinois Institute of Technology, Chicago, Illinois
AbstractBackground—Weakness is often profound in the contralesional hand after stroke. Relativecontributions of various neural and mechanical mechanisms to this impairment, however, have notbeen quantified. In this study, the extent of one potential contributor, muscle atrophy, wasnoninvasively assessed in index finger musculature using ultrasonographic techniques.
Methods—Twenty-five stroke survivors (45–65 years old) with severe hand impairmentresulting from a stroke occurring 2–4 years prior participated, along with 10 age-matched controlsubjects. Muscle cross sectional area and thickness were geometrically measured from ultrasoundimages on both limbs of participants.
Findings—Muscle size on the paretic limb of stroke survivors was smaller for all 7 hand musclesinvestigated. An average difference of 15% (SD 4) was seen for muscle cross sectional area and11% (SD 2) for muscle thickness, while the difference between the dominant and non-dominantlimbs for control subjects (6% (SD 2) and 1% (SD 4) for the muscle cross sectional area andmuscle thickness, respectively) was not significant.
Interpretation—Although muscle atrophy was detected in the paretic limb following stroke, it isnot explanatory of the marked impairment in strength seen in this stroke population. However,other alterations in muscle morphology, such as fatty infiltrations and changes in fiber structure,may contribute to the emergent muscle weakness post-stroke.
Keywordshand; stroke; muscle; atrophy; ultrasound
IntroductionWeakness in the contralesional limb is a common finding in stroke survivors. Strengthdeficits in the hands can be especially profound, as evidenced by studies of finger, grip andpinch strength. In fact, studies investigating the index finger indicate losses of greater than75% (Cruz et al., 2005). While excessive coactivation and an inability to fully activate thesemuscles contribute to this weakness, muscle atrophy may also play a role.
© 2011 Elsevier Ltd. All rights reserved.Corresponding author: Kristen Triandafilou, M.S., Research Engineer, Rehabilitation Institute of Chicago, Suite 1406, 345 E.Superior Street, Chicago, IL 60611, (312) 238 – 2777 – phone, (312) 238 – 2208 – fax, [email protected]'s Disclaimer: This is a PDF file of an unedited manuscript that has been accepted for publication. As a service to ourcustomers we are providing this early version of the manuscript. The manuscript will undergo copyediting, typesetting, and review ofthe resulting proof before it is published in its final citable form. Please note that during the production process errors may bediscovered which could affect the content, and all legal disclaimers that apply to the journal pertain.
NIH Public AccessAuthor ManuscriptClin Biomech (Bristol, Avon). Author manuscript; available in PMC 2013 March 1.
Published in final edited form as:Clin Biomech (Bristol, Avon). 2012 March ; 27(3): 268–272. doi:10.1016/j.clinbiomech.2011.10.002.
NIH
-PA Author Manuscript
NIH
-PA Author Manuscript
NIH
-PA Author Manuscript

The primary characteristic of muscle disuse atrophy is a reduction in muscle fiber size(Evans and Campbell, 1993). It has been well established that muscle physiological crosssectional area is directly proportional to the corresponding muscle’s force generating ability(Zajac, 1989). It is therefore a logical inference that as muscle CSA is reduced (such as thecase with muscle atrophy) this condition will result in a lowered force production.
The reduction in muscle mass of older adults, or sarcopenia, is very common consequenceof the aging process. Strength losses as a result of sarcopenia have been shown to affect thelower extremity muscles to a much greater extent than the upper extremity muscles(Frontera et al., 1991, Lynch et al., 1999) and this phenomenon is believed to result from theselective disuse or modified postural/locomotive duties of these muscle groups with age(Macaluso and De Vito, 2004). For example, as the muscles of the lower extremity weaken,individuals may employ the use of the upper extremity to assist rising from or lowering intoa seated position. Additionally, the extent of this atrophy varies with the structure andfunction of a muscle. While both Type I and Type II muscle fibers can be affected, thestronger fast-twitch Type II muscle fibers appear to be preferentially prone to atrophy inolder adults (Jones and Round, 1990).
Muscle atrophy has also been shown to be a consequence of stroke. Indeed, atrophy in thehemiparetic leg has been observed, both in needle biopsy (Dattola et al., 1993) and imagingstudies (Klein et al., 2010, Slager et al., 1985). Likewise, similar findings have been reportedfor paretic muscles of the upper extremity controlling gross movements, such as the bicepsbrachi (Blijham et al., 2006, Hu et al., 2007, Ploutz-Snyder et al., 2006) and the triceps(Ploutz-Snyder et al., 2006). However, more distal muscles, particularly those controllingthe hand, have not been studied in detail. These muscles may be particularly susceptible tochanges following stroke due to the heavy cortical innervation of their motoneurons.Additionally, strength deficits in the fingers appear to be non-uniform, with greater loss inextension than in flexion (Cruz et al., 2005, Kamper et al., 2006).
Thus the goal of this study was to quantify the extent of gross muscle atrophy in the handfollowing stroke. In particular, index finger muscle size was measured in vivo by means ofultrasonography and geometrical measurements in the sagittal and transverse planes. Theindex finger was highlighted due to its functional importance and the prior characterizationof its strength deficits after stroke (Cruz et al., 2005). We hypothesized that atrophy of indexfinger musculature would be substantially greater in stroke survivors than in neurologicallyintact control subjects. We further hypothesized that within the paretic hand, the intrinsicand long extensor muscles would be atrophied to a greater extent than the long flexormuscles in stroke survivors, in accordance with reported findings of weakness anddiminished movement.
Materials and MethodsSubjects
Index finger muscle geometry was measured to assess the extent of muscle atrophy insubjects with chronic hemiparesis subsequent to stroke. Twenty-five subjects with severehand impairment, classified as Stage 2 or Stage 3 on the Stage of Hand component of theChedoke-McMaster Stroke Assessment scale (Gowland et al., 1995), participated. All ofthese subjects (16 male and 9 female) had experienced a stroke between 2–4 years prior toenrollment in the study. Thirteen stroke survivors had primary involvement of the right sideof the body and 12 had involvement of the left side. Sixteen subjects had primaryimpairment of the formerly dominant hand, while 9 subjects had primary impairment of thenon-dominant hand. Hand strength deficits in this population were quantitatively assessedthough clinical measures of both maximum voluntary power grip force, using a
Triandafilou and Kamper Page 2
Clin Biomech (Bristol, Avon). Author manuscript; available in PMC 2013 March 1.
NIH
-PA Author Manuscript
NIH
-PA Author Manuscript
NIH
-PA Author Manuscript

dynamometer (JAMAR 5030J1 Hand Dynamometer, Clifton, NJ, USA) and finger extensionforce, using a digital force gauge (Mark-10 Corp. MG200, Copiague, NY, USA) for bothlimbs.
Ten healthy, age-matched control subjects (7 male and 3 female) were included in this studyto gauge the extent to which muscle size varies between the dominant and non-dominantside for the upper extremity. All participants were between 45 and 65 years of age tominimize the possible confounding effects of sarcopenia. Written, informed consent wasobtained from all subjects in accordance with the Institutional Review Board ofNorthwestern University prior to involvement in the study.
ProtocolUltrasonography (GELogic9, M12L, GE Healthcare Wauwatosa, WI, USA) was used tomeasure the geometry of the muscles controlling the index finger. Muscle ultrasound hasbeen previously shown to be a reliable method to measure muscle thickness and CSA(Reeves et al., 2004, Reimers et al., 1998, Sanada et al., 2006). The technique has beenshown to have a test-retest correlation of 0.98–0.99 (Reeves et al., 2004, Reimers et al.,1996) and 0.99 correlation with MRI (Reeves et al., 2004). Ultrasound has the advantage ofreal-time feedback, which enabled localization of the proper muscle/muscle compartmentthrough viewing the displacement of muscle fibers in response to isolated musclecontraction or imposed movement of the joint or joints. The musculoskeletal transducerprobe was positioned over the muscle belly and then moved to determine the maximalmuscle parameter of interest for each of the muscles of the index finger: flexor digitorumsuperficialis (FDS), flexor digitorum profundus (FDP), extensor digitorum communis(EDC), extensor indicis (EI), first dorsal interosseous (FDI), first palmar interosseous (FPI),and lumbrical (LUM).
To better estimate the extent of muscle atrophy following stroke, two different muscleparameters were evaluated. The first was the muscle cross sectional area (CSA), measuredfrom images taken in the transverse anatomical plane of the forearm and hand. The probewas positioned such that the image plane was perpendicular to the long axis of the muscle.The second parameter was muscle thickness, measured as the muscle depth from sagittalplane images taken along the long axis of the muscle. Both parameters were measured, aswhile CSA is more traditionally used as a description of atrophy, muscle thickness may offera simpler and timelier approach for obtaining equally viable information about musclegeometry post-stroke. Once the location for maximal muscle geometry was visuallydetermined, participants were given auditory and visual cues to begin cyclical contraction/relaxation of the muscle of interest. They were instructed to end in the relaxed state, whichwas maintained for 1–2 sec. During this period of cyclical muscle activation, video clipswere recorded in both the sagittal plane, to estimate muscle thickness, and in the transverseplane, to estimate muscle cross sectional area (CSA). If a subject was unable to voluntarilyisolate and contract the desired muscle, manual ranging of the digit was conducted to elicitthe desired movement. Imaging commenced on the dominant (control group) or the non-paretic (stroke group) side to determine the appropriate settings, such as the location, focus,and depth of recording, for the ultrasound system, thus helping to guide imaging on theopposite limb. Each video clip was at most 5 seconds long, with a period of 1–2 sec ofmuscle relaxation at the beginning and end of the clip (frame rate = 50 frames/second). Thislength of time was determined to be sufficient in localizing the desired muscle anddistinguishing muscle compartments of the index finger from muscle compartments of theother digits.
To test the precision and reliability of these techniques, data were collected for three controlsubjects on five separate days prior to the start of this study. The variance in muscle
Triandafilou and Kamper Page 3
Clin Biomech (Bristol, Avon). Author manuscript; available in PMC 2013 March 1.
NIH
-PA Author Manuscript
NIH
-PA Author Manuscript
NIH
-PA Author Manuscript

thickness and CSA over these five visits was calculated for each of the seven musclesexamined.
Data ProcessingImage files for geometric muscle measurements were extracted off-line from the movie clipdata recorded during the experiment. Individual frames of the movie capturing the initialresting state of the muscle were analyzed with a custom graphical user interface (GUI)designed in MATLAB (MathWorks, Natick, MA, USA). The interactive display provided ameans to view both the image file and the original movie clip simultaneously, reinforcingaccurate muscle distinction and measurement. The measurement scale was calibrated to therecording depth of the movie for each muscle investigated.
For images obtained in the sagittal plane, maximal muscle thickness was measuredperpendicular to the grain of the muscle fibers (Fig. 1A). In order to ensure consistent andaccurate data, five consecutive measurements were obtained for each muscle. To reduce usererror, a standard deviation of the measurements of greater than 5 mm triggered a warning tothe analyst and automatically discarded the measurements. The process was repeated untilsuccessful measurements were obtained.
A similar procedure was employed for images obtained in the transverse plane to determinethe CSA of the muscle. Each muscle was assumed to have an elliptical shape in this plane(Fig. 1B). The major (a) and minor (b) axes of this assumed ellipse were measured, andsubsequently used to calculate the estimated elliptical area:
Equation1
Again, if the standard deviation of the measurements for either axis was greater than 5mmthen the process was repeated until valid results were obtained.
Statistical AnalysisFor the dependent variables of interest in this study, (muscle thickness and muscle CSA), aMultivariate ANOVA (MANOVA) was first performed for each group (stroke and control)using SPSS software (SPSS Inc., Chicago, IL, USA) to determine if the independentvariables of muscle type (Muscle), or non-dominance/paresis (Hand) impacted the output.Muscle (7 levels) and Hand (2 levels) were the within-subject factors. Subsequently,findings of significance according to the Wilks’ lambda value led to running separaterepeated measures ANOVAs (RMANOVAs) for each of the two dependent variables.Finally, for a comparison between groups, an RMANOVA was performed using normalizedvalues (paretic normalized to non-paretic side and non-dominant normalized to dominantside) where Muscle (7 levels) was the within-subject factor and Group (2 levels) was thebetween-subject factor. Post hoc Tukey tests were conducted to determine statisticallydistinct levels of the main effects. A Bonferroni correction for the 3 separate analyses wasimplemented, such that the significance level was set to 0.0167 (α/3) yielding an overallsignificance level of α = 0.05.
ResultsTo ascertain the extent of muscle atrophy between limbs, estimates of muscle thickness andCSA were obtained for all seven muscles involved in motor control of the index finger in 25subjects who had sustained a stroke resulting in severe, chronic hand impairment and 10subjects with no known neuromuscular deficits. The stroke subjects had severe weakness inthe paretic hand, as characterized by an 82% deficit in grip strength and an 88% deficit in
Triandafilou and Kamper Page 4
Clin Biomech (Bristol, Avon). Author manuscript; available in PMC 2013 March 1.
NIH
-PA Author Manuscript
NIH
-PA Author Manuscript
NIH
-PA Author Manuscript

finger extension strength in comparison to the non-paretic hand. No significant differenceswere present in either grip strength or extension force for the non-paretic hand in strokesubjects and the non-dominant and dominant hand in control subjects (p < 0.001).
The MANOVA for the stroke group revealed a significant effect on muscle geometry forboth independent variables, Hand and Muscle, (Wilks’ lambda < 0.001) but not for theinteraction term Hand—Muscle (Wilks’ lambda = 0.522). Thus, muscle size was reduced onthe paretic side, but there was no significant difference in the relative atrophy of thedifferent muscles. The MANOVA for the control group also revealed a significant effect onmuscle geometry for the independent variable Muscle (Wilks’ lambda < 0.001), but not forHand (Wilks; lambda = 0.411) or the interaction term Hand-Muscle (Wilks’ lambda =1.000). Hence, for the control subjects, hand dominance did not significantly affect musclesize. Muscle size was not significantly different between the dominant hand in the controlsubjects and the non-paretic hand in the stroke subjects for muscle thickness (p = 0.112) orCSA (p = 0.639).
Consequently, RMANOVAs were performed for each of the dependent variables for theindependent variables of significance (Table 1). A decrease in muscle CSA was evident inall muscles of the paretic index finger for the Stroke group (Table 2). Surprisingly, thosemuscles most noticeably impacted were FDS and FDP, which exhibited size reductions of21% and 19%, respectively, on the paretic as compared to the non-paretic side. Thedecreases observed for the extrinsic extensor muscles EI (17%) and EDC (12%) and theintrinsic muscles FPI (13%) and LUM (15%) were smaller, although there was no statisticaldifference. Interestingly, the atrophy observed in the intrinsic FDI muscle (9%) was lessthan half of that of FDS (Fig. 2). In general, the data showed an average decrease of 15%(SD 4) in muscle CSA of the paretic limb compared to the non-paretic limb for our strokepopulation whereas the age-matched control group demonstrated only a 6% (SD 2) decreasein CSA of the non-dominant limb compared to the dominant limb. This difference betweengroups was significant (p = 0.011).
Muscle thickness attenuation was detected on the paretic side of stroke subjects in allmuscles investigated (Table 3). Thickness of the extrinsic flexors was reduced by 8% inFDS and 12% in FDP, while thickness of the extrinsic extensor muscles was diminished by11% in EI and 10% in EDC, and thickness of the intrinsic muscles decreased by 6% in FDI,11% in FPI, and 15% in LUM (Fig 3). Once again, the degree of muscle atrophy was least inFDI. Similarly to CSA, we observed an average decrease of 11% (SD 2) in muscle thicknessin the paretic limb compared to the non-paretic limb, while the control group showed lessthan a 1% (SD 4) decrease in muscle thickness of the non-dominant limb compared to thedominate limb. As with CSA, the difference between groups was significant (p = 0.001).
Nearly two thirds of the subjects studied presented with the contralesional (paretic) arm/hand coinciding with his or her formerly dominant side. Muscle thickness was 10% smalleron the paretic side for this group as compared to 13% smaller for individuals in whom theparetic hand was the non-dominant side before the stroke (p = 0.063). The relationshipbetween hand dominance and lesion side followed a similar trend for muscle CSA. Therewas a noticeable difference in muscle CSA observed for subjects with the impaired sidecorresponding to the formerly dominant side (12%), while a much more substantialdifference (22%) was seen for individuals whose impairment primarily impacted the non-dominant side (p = 0.035).
Triandafilou and Kamper Page 5
Clin Biomech (Bristol, Avon). Author manuscript; available in PMC 2013 March 1.
NIH
-PA Author Manuscript
NIH
-PA Author Manuscript
NIH
-PA Author Manuscript

DiscussionThis study investigated the degree of atrophy following stoke for all muscles involved inmotor control of the index finger by quantitatively measuring muscle geometrynoninvasively in vivo by means of ultrasonography. Maximum thickness and CSA of themuscles were determined for both the paretic and non-paretic limbs of stroke survivors 2–4years post cerebrovascular incident.
Overall, in accordance with studies of lower extremity muscles (Klein et al., 2010, Blijhamet al., 2006, Dattola et al., 1993, Hafer-Macko et al., 2008, Kupa et al., 1995, Slager et al.,1985, Hu et al., 2007), muscle size in the paretic hand was significantly reduced with respectto the muscle size in the non-paretic hand in terms of both muscle thickness and CSA. This15% deviation in CSA was greater than the 6% difference (not statistically significant) seenbetween the dominant and non-dominant hands in the age-matched control subjects. Therewas no significant difference in size between the non-paretic hand muscles in stroke subjectsand the dominant hand muscles in neurologically intact subjects; CSA reduction of theimpaired hand muscles was 16% with respect to the muscles of the dominant hand in theage-matched control subjects. Thus, size reduction in the paretic limb was 12% beyond whatwould be expected in a non-dominant limb in neurologically intact subjects. The extent ofatrophy in a paretic limb tended to be smaller for a previously dominant than a non-dominant hand (12% and 22% difference in CSA for the formerly dominant paretic and non-paretic sides, respectively with a 10% and 13% difference in muscle thickness).
In disagreement with our other hypothesis, however, there was no significant difference inthe amounts of atrophy among the different index finger muscles in the paretic hand. In fact,the extrinsic muscles tended to show greater atrophy than the intrinsic muscles, with thegreatest reduction in CSA observed in the extrinsic flexor muscles (FDS and FDP). Absolutemuscle size was not related to the percentage of atrophy. Our previous study looking at forceproduction in different directions at the index fingertip in this stroke population reportedgreater relative sparing in directions for which the flexors dominate (flexion – 73%reduction) than for directions in which the extensors (extension – 92% reduction) orintrinsics (adduction – 84% reduction, abduction – 92% reduction) (Cruz et al., 2005). Thus,muscle atrophy does not appear to contribute to this bias towards relative sparing of flexionin the fingers. In contrast, greater atrophy has been reported in the paretic triceps muscle(25%) as compared to the paretic biceps brachii (5%) (Ploutz-Snyder et al., 2006).
In general, the force deficits directly attributable to muscle atrophy in the hand are smallrelative to the deficits actually observed. These subjects displayed differences in grip forceand finger extension force of 84% and 88%, respectively, between the non-paretic andparetic hands, as compared to the 15% difference in muscle size. Certainly, changes in othermuscle properties may contribute to the force deficits. Studies have reported greater relativesparing of muscles comprised predominantly of the less powerful type I muscle fibers incomparison with muscles consisting of predominantly type II fibers (Dattola et al., 1993,Klein et al., 2010, Slager et al., 1985, Hu et al., 2007). Interestingly, a study that investigatedthe distribution of the fiber types in healthy adult cadaveric specimens (Johnson et al., 1973)found FDI to be composed primarily of type I fibers, while EDC and FDP have a majority oftype II fibers. Accordingly, we did observe somewhat less atrophy in FDI than in EDC andFDP, although these differences were not significant. Evidence for fiber hypertrophy hasalso been reported for type I fibers post-stroke (Blijham et al., 2006, Dattola et al., 1993,Slager et al., 1985). Yet, these changes may be offset by a shift in fiber type from type I totype II following stroke (Hafer-Macko et al., 2008, Landin et al., 1977, Dattola et al., 1993).Other physiological changes such as fatty infiltrations (Klein et al., 2010) and reducedfascicle length (Gao and Zhang, 2008) may also contribute to the deficits. Sarcomere length
Triandafilou and Kamper Page 6
Clin Biomech (Bristol, Avon). Author manuscript; available in PMC 2013 March 1.
NIH
-PA Author Manuscript
NIH
-PA Author Manuscript
NIH
-PA Author Manuscript

has been shown to be profoundly lengthened beyond the optimal fiber length in paretic limbmuscles in children with cerebral palsy (Lieber and Friden, 2002). In this study, only musclesize, not muscle quality, was assessed.
Although muscle thickness is not a term conventionally used for describing musclearchitecture, it proved to be an easily accessible and viable measure in determining therelative muscle size between limbs of individuals. To test the repeatability of theultrasonography techniques, repeated measurements were performed on three controlsubjects over 5 separate days for all 7 muscles. Intrasubject variability across the muscleshad a standard deviation of 0.82 mm for muscle thickness and 17.46 mm2 for CSA, yieldingcoefficients of variation of 0.09 and 0.15, respectively. Thus, the muscle thicknessmeasurements yielded similar results to CSA in terms of atrophy, but had less variability. Itshould be noted that our CSA values for the control and non-paretic hands closely resemblethose of previous publications, (Lieber et al., 1990, Lieber et al., 1992, Jacobson et al.,1992), in which more traditional muscle fixation techniques with cadaveric specimens wereemployed. One anomaly to this trend was the CSA determined for the lumbrical – due todifficulty in aligning the ultrasound probe perpendicular to these muscle fibers while,avoiding signal interference from the metacarpal bones, the true CSA may have beenoverestimated.
In summary, although muscle atrophy was detected in the paretic limb following stroke, therelatively small percent atrophy observed was not explanatory of the marked impairment instrength seen in this stroke population. Further investigation into possible underlyingmorphological changes in the muscle tissue is warranted to fully characterize hand musclealterations and their impact on function after stroke.
AcknowledgmentsThe authors would like to thank Heidi C. Fisher, MS, OTR/L for her assistance with clinical evaluations and inexperimental sessions.
This study was supported by NIH NINDS (R01 NS052369), the Coleman Foundation and the AchievementRewards for College Scientists (ARCS) Foundation.
ReferencesBlijham PJ, Ter Laak HJ, Schelhaas HJ, Van Engelen BG, Stegeman DF, Zwarts MJ. Relation
between muscle fiber conduction velocity and fiber size in neuromuscular disorders. Journal ofApplied Physiology. 2006; 100:1837–1841. [PubMed: 16424073]
Cruz EG, Waldinger HC, Kamper DG. Kinetic and kinematic workspaces of the index fingerfollowing stroke. Brain. 2005; 128:1112–1121. [PubMed: 15743873]
Dattola R, Girlanda P, Vita G, Santoro M, Roberto M, Toscano A, Venuto C, Baradello A, Messina C.Muscle rearrangements in patients with hemiparesis after stroke: An electrophysiological andmorphological study. European Journal of Neurology. 1993; 33:109–114.
Evans WJ, Campbell WW. Sarcopenia and age-related changes in body composition and functionalcapacity. J Nutr. 1993; 123:465–468. [PubMed: 8429405]
Frontera WR, Hughes VA, Lutz KJ, Evans WJ. A cross-sectional study of muscle strength and mass in45- to 78-yr-old men and women. J Appl Physiol. 1991; 71:644–650. [PubMed: 1938738]
Gao F, Zhang LQ. Altered contractile properties of the gastrocnemius muscle poststroke. Journal ofApplied Physiology. 2008; 105:1802–1808. [PubMed: 18948443]
Gowland, C.; Van Hullenaar, S.; Torresin, W.; Moreland, J.; Vanspall, B.; Barrecca, S.; Ward, M.;Huijbregts, M.; Stratford, P.; Barclay-Goddard, R. Chedoke-McMaster stroke assessment:development, validation and administration manual. Hamilton, Canada: Chedoke-McMasterHospitals and McMaster University; 1995.
Triandafilou and Kamper Page 7
Clin Biomech (Bristol, Avon). Author manuscript; available in PMC 2013 March 1.
NIH
-PA Author Manuscript
NIH
-PA Author Manuscript
NIH
-PA Author Manuscript

Hafer-Macko CE, Ryan AS, Ivey FM, Macko RF. Skeletal muscle changes after hemiparetic strokeand potential beneficial effects of exercise intervention strategies. Journal of RehabilitationResearch & Development. 2008; 45:261–272. [PubMed: 18566944]
Hu XL, Tong KY, Li L. The mechanomyography of persons after stroke during isometric voluntarycontractions. Journal of Electromyography & Kinesiology. 2007; 17:473–483. [PubMed: 16603386]
Jacobson MD, Raab R, Fazeli BM, Abrams RA, Botte MJ, Lieber RL. Architectural design of thehuman intrinsic hand muscles. J Hand Surg Am. 1992; 17:804–809. [PubMed: 1401784]
Johnson MA, Polgar J, Weightman D, Appleton D. Data on the distribution of fibre types in thirty-sixhuman muscles. An autopsy study. Journal of the Neurological Sciences. 1973; 18:111–129.[PubMed: 4120482]
Jones, DA.; Round, JM. Skeletal muscle in health and disease. A textbook of muscle physiology.Manchester: Manchester University Press; 1990.
Kamper DG, Fischer HC, Cruz EG, Rymer WZ. Weakness is the primary contributor to fingerimpairment in chronic stroke. Archives of Physical Medicine and Rehabilitation. 2006; 87:1262–1269. [PubMed: 16935065]
Klein CS, Brooks D, Richardson D, McIlroy WE, Bayley MT. Voluntary activation failure contributesmore to plantar flexor weakness than antagonist coactivation and muscle atrophy in chronic strokesurvivors. J Appl Physiol. 2010; 109:1337–1346. [PubMed: 20724561]
Kupa EJ, Roy SH, Kandarian SC, De Luca CJ. Effects of muscle fiber type and size on EMG medianfrequency and conduction velocity. Journal of Applied Physiology. 1995; 79:23–32. [PubMed:7559225]
Landin S, Hagenfeldt L, Saltin B. Muscle metabolism during exercise in hemiparetic patients. ClinicalScience in Molecular Medicine. 1977; 53:257–269.
Lieber RL, Fazeli BM, Botte MJ. Architecture of selected wrist flexor and extensor muscles. J HandSurg Am. 1990; 15:244–250. [PubMed: 2324452]
Lieber RL, Friden J. Spasticity causes a fundamental rearrangement of muscle-joint interaction.Muscle & Nerve. 2002; 25:265–270. [PubMed: 11870696]
Lieber RL, Jacobson MD, Fazeli BM, Abrams RA, Botte MJ. Architecture of selected muscles of thearm and forearm: anatomy and implications for tendon transfer. J Hand Surg Am. 1992; 17:787–798. [PubMed: 1401782]
Lynch NA, Metter EJ, Lindle RS, Fozard JL, Tobin JD, Roy TA, Fleg JL, Hurley BF. Muscle quality.I. Age-associated differences between arm and leg muscle groups. J Appl Physiol. 1999; 86:188–194. [PubMed: 9887130]
Macaluso A, De Vito G. Muscle strength, power and adaptations to resistance training in older people.Eur J Appl Physiol. 2004; 91:450–472. [PubMed: 14639481]
Ploutz-Snyder LL, Clark BC, Logan L, Turk M. Evaluation of spastic muscle in stroke survivors usingmagnetic resonance imaging and resistance to passive motion. Archives of Physical Medicine &Rehabilitation. 2006; 87:1636–1642. [PubMed: 17141645]
Reeves ND, Maganaris CN, Narici MV. Ultrasonographic assessment of human skeletal muscle size.Eur J Appl Physiol. 2004; 91:116–118. [PubMed: 14639480]
Reimers CD, Harder T, Saxe H. Age-related muscle atrophy does not affect all muscles and can partlybe compensated by physical activity: an ultrasound study. J Neurol Sci. 1998; 159:60–66.[PubMed: 9700705]
Reimers CD, Schlotter B, Eicke BM, Witt TN. Calf enlargement in neuromuscular diseases: aquantitative ultrasound study in 350 patients and review of the literature. J Neurol Sci. 1996;143:46–56. [PubMed: 8981297]
Sanada K, Kearns CF, Midorikawa T, Abe T. Prediction and validation of total and regional skeletalmuscle mass by ultrasound in Japanese adults. Eur J Appl Physiol. 2006; 96:24–31. [PubMed:16235068]
Slager UT, Miao M, Yocum LA, Hsu JD. Fiber composition and morphometry of the quadricepsfemoris muscle in athletes and non-athletic individuals after knee injury. Journal of SportsMedicine & Physical Fitness. 1985; 25:155–163. [PubMed: 4068681]
Zajac FE. Muscle and tendon: properties, models, scaling, and application to biomechanics and motorcontrol. Crit Rev Biomed Eng. 1989; 17:359–411. [PubMed: 2676342]
Triandafilou and Kamper Page 8
Clin Biomech (Bristol, Avon). Author manuscript; available in PMC 2013 March 1.
NIH
-PA Author Manuscript
NIH
-PA Author Manuscript
NIH
-PA Author Manuscript

Fig.1.MATLAB Graphical User Interface (GUI) used for the offline measurement of the differentmuscles/muscle compartments. Left side (A) shows the measurement for the musclethickness of FDS and the right side (B) shows the measurements for estimating the CSA ofFDS.
Triandafilou and Kamper Page 9
Clin Biomech (Bristol, Avon). Author manuscript; available in PMC 2013 March 1.
NIH
-PA Author Manuscript
NIH
-PA Author Manuscript
NIH
-PA Author Manuscript

Fig. 2.Normalized maximum muscle CSA for each of the muscles involved in motor control of theindex finger. The values for the paretic limb of the stroke subjects were normalized to his/her non-paretic side. The values for the non-dominant limb of control subjects werenormalized to his/her dominant side. Error bars represent the SD of the mean.
Triandafilou and Kamper Page 10
Clin Biomech (Bristol, Avon). Author manuscript; available in PMC 2013 March 1.
NIH
-PA Author Manuscript
NIH
-PA Author Manuscript
NIH
-PA Author Manuscript
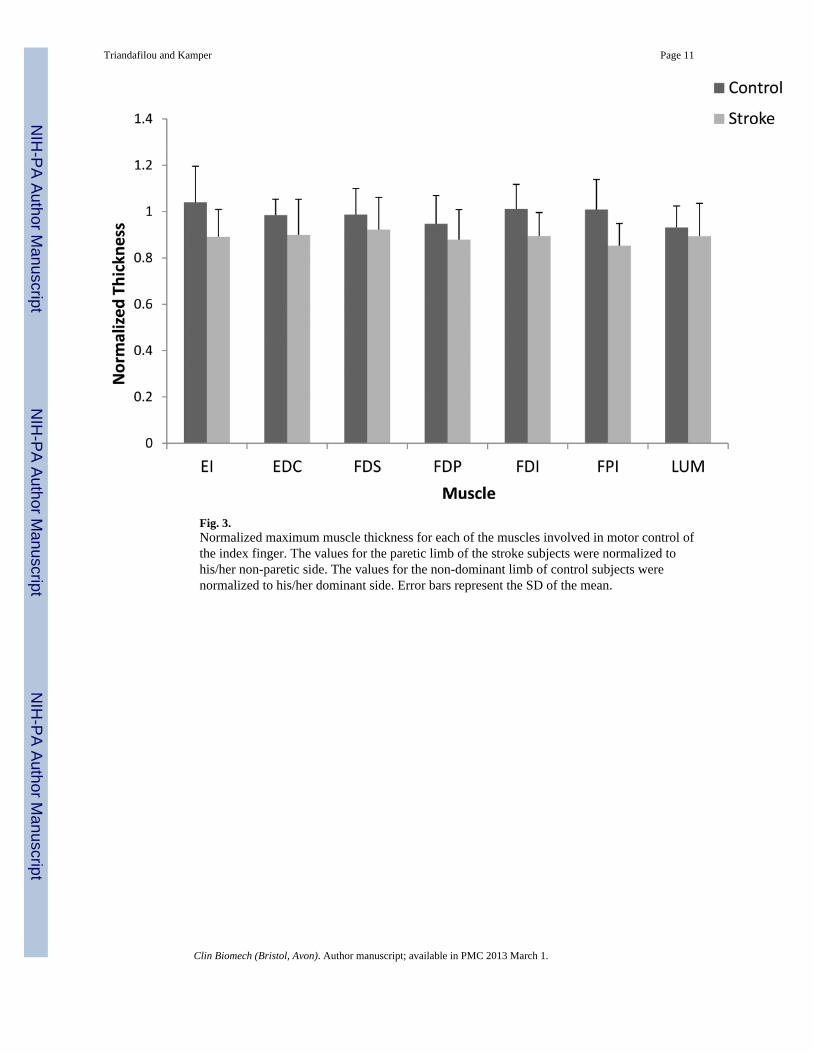
Fig. 3.Normalized maximum muscle thickness for each of the muscles involved in motor control ofthe index finger. The values for the paretic limb of the stroke subjects were normalized tohis/her non-paretic side. The values for the non-dominant limb of control subjects werenormalized to his/her dominant side. Error bars represent the SD of the mean.
Triandafilou and Kamper Page 11
Clin Biomech (Bristol, Avon). Author manuscript; available in PMC 2013 March 1.
NIH
-PA Author Manuscript
NIH
-PA Author Manuscript
NIH
-PA Author Manuscript

NIH
-PA Author Manuscript
NIH
-PA Author Manuscript
NIH
-PA Author Manuscript
Triandafilou and Kamper Page 12
Table 1
Repeated measures ANOVA results obtained for each dependent variable.
Stroke Control
Raw Muscle Thickness Raw Muscle CSA Raw Muscle Thickness Raw Muscle CSA
Hand P < 0.001 P < 0.001 - -
Muscle P < 0.001 P < 0.001 P < 0.001 P < 0.001
Significance accepted at p ≤ 0.0167.
Clin Biomech (Bristol, Avon). Author manuscript; available in PMC 2013 March 1.

NIH
-PA Author Manuscript
NIH
-PA Author Manuscript
NIH
-PA Author Manuscript
Triandafilou and Kamper Page 13
Table 2
Values obtained for muscle CSA.
Control Stroke
Muscle Dominant Non-Dominant Non-Paretic Paretic
FDS 174.14 (51.69) 162.45 (45.82) 189.56 (87.12) 142.08 (55.30)
FDP 229.33 (53.53) 222.78 (68.84) 238.19 (78.54) 186.68 (58.50)
EI 103.23 (20.26) 99.43 (18.56) 94.64 (40.60) 75.74 (30.12)
EDC 102.69 (28.85) 95.53 (21.01) 106.98 (48.51) 91.28 (45.46)
FDI 269.07 (57.15) 254.75 (54.35) 264.21 (68.47) 230.63 (73.69)
FPI 93.91 (23.57) 82.90 (24.77) 115.13 (54.84) 95.47 (41.96)
LUM 74.13 (30.40) 68.93 (25.65) 70.55 (23.51) 57.57 (18.71)
Note: Values are mean (SD) and units are in mm2.
Clin Biomech (Bristol, Avon). Author manuscript; available in PMC 2013 March 1.

NIH
-PA Author Manuscript
NIH
-PA Author Manuscript
NIH
-PA Author Manuscript
Triandafilou and Kamper Page 14
Table 3
Values obtained for muscle thickness.
Control Stroke
Muscle Dominant Non-Dominant Non-Paretic Paretic
FDS 10.35 (2.76) 9.93 (2.23) 10.50 (1.84) 9.68 (2.26)
FDP 18.32 (2.19) 17.38 (2.92) 19.85 (4.44) 17.25 (3.76)
EI 8.90 (1.43) 9.10 (1.57) 8.87 (2.18) 7.82 (1.94)
EDC 8.78 (2.21) 8.65 (2.44) 9.01 (1.96) 7.98 (1.67)
FDI 10.68 (1.56) 10.85 (1.77) 12.02 (1.96) 10.77 (2.22)
FPI 6.68 (1.17) 6.57 (1.10) 9.13 (2.41) 7.80 (2.29)
LUM 5.27 (0.85) 4.91 (0.70) 5.55 (0.90) 4.91 (0.87)
Note: Values are mean (SD) and units are in mm.
Clin Biomech (Bristol, Avon). Author manuscript; available in PMC 2013 March 1.