Microwave and conventional preparation of Zinc borate glass: Eu3+ ion as luminescent probe, Ashis K....
7
Microwave and conventional preparation of Zinc borate glass: Eu 3+ ion as luminescent probe Ashis K. Mandal ⇑ , S. Balaji, Ranjan Sen Glass Division, CSIR-Central Glass and Ceramic Research Institute, 196, Raja S.C. Mullick Road, Kolkata 700 032, India article info Article history: Received 17 April 2014 Received in revised form 30 June 2014 Accepted 30 June 2014 Available online 7 July 2014 Keywords: Amorphous materials Optical materials Optical properties Luminescence Thermal analysis abstract Transparent Zinc borate glass is melted using microwave energy as an alternative heating route to conventional resistive heating. A comparative study of the properties of the glasses prepared by both the methods is conducted by adopting X-ray diffraction (XRD), Differential scanning calorimetry (DSC), UV–VIS–NIR spectroscopy, Fourier transform infrared (FTIR) spectroscopy, Refractive Indices (RI). Amorphous nature of samples is confirmed by X-ray diffraction study. Glass transition temperature (T g ) of microwave melted glass is found 7–9 °C higher than that of glass prepared in conventional melting. OH content is found less than 250 ppm in microwave melted glass whereas it is above 330 ppm in conventional melted glasses. Photoluminescence study of Eu 2 O 3 doped glass prepared in microwave heating indicates higher reduction of Eu 3+ ? Eu 2+ than the glass melted in conventional route. Thus, microwave processing can be an alternative energy efficient, time saving, environmental friendly glass preparation method. Ó 2014 Elsevier B.V. All rights reserved. 1. Introduction Search for alternate routes of material synthesis is an integral aspect of materials science. Some of the important driving forces for this are the continuing need for rapid processing, energy efficiency, necessity to overcome bottleneck in known processes and improved properties and yield. Microwave-assisted material synthesis is a potential alternative method of synthesis and is rap- idly gaining importance in view of the above. Microwave heating is fundamentally different than conventional heating as the electro- magnetic (EM) energy attenuates while passing through the mate- rial generating heat within it. Attenuation of EM energy at a given frequency and thereby generating heat depends on the material properties. Material can be broadly classified into three categories in term of their interaction with microwaves; (i) microwave absorbers which absorbs energy from the microwave field generat- ing heat within it very rapidly; (ii) microwave reflectors, as in case of bulk metals and alloys which are therefore used in making microwave guides and cavity; (iii) microwave transmitters which are transparent to microwaves, some of them are fused silica, alumina, Zircon, several glass without containing any microwave absorber, and ceramics, etc.; they are therefore employed for making cookware and containers to carry out chemical reaction in microwaves [1]. Several reports have appeared where prospect of material processing with microwave energy have been reviewed [2,3]. Microwave versus conventional sintering has been reviewed by Oghbaei and Mirzaee [4]. Use of microwave energy for combustion synthesis process has been reported [5]. Silicon germanium alloy has been developed using single mode microwave H-field. Shorter processing time and lower temperature, enable to maintain stoi- chiometry of resulting alloy and also prevent grain growth [6]. Titanium nitride with submicron grain size 170 nm; 240 in case conventional, can be prepared using microwave heating [7]. Micro- wave treatment has special effect on the surface chemistry of acti- vated carbon, increasing carbon/oxygen ratio by eliminating acidic oxygen-containing functional group [8]. Application of microwave energy has also been reported for sintering [9,10], thermal tough- ening [11], drying [12], coating [13], composite formation [14] and many more. However, Microwave heating has not been widely applied to glass making because most of the glasses and its raw materials fall under the category of microwave transmitter and thus difficult to initiate heating at room temperature. However, microwave prepa- ration of selective glass compositions, incorporating considerable amount of microwave absorber as its ingredients, reported in the literature have been made on the laboratory scale of only a few grams [15–18]. All these preparations have been made with the use of domestic microwave ovens operating at 2.45 GHz and with http://dx.doi.org/10.1016/j.jallcom.2014.06.206 0925-8388/Ó 2014 Elsevier B.V. All rights reserved. ⇑ Corresponding author. Tel.: +91 33 2473 5829; fax: +91 33 2473 0957. E-mail addresses: [email protected] (A.K. Mandal), [email protected] (S. Balaji), [email protected] (R. Sen). Journal of Alloys and Compounds 615 (2014) 283–289 Contents lists available at ScienceDirect Journal of Alloys and Compounds journal homepage: www.elsevier.com/locate/jalcom
Transcript of Microwave and conventional preparation of Zinc borate glass: Eu3+ ion as luminescent probe, Ashis K....
Journal of Alloys and Compounds 615 (2014) 283–289
Contents lists available at ScienceDirect
Journal of Alloys and Compounds
journal homepage: www.elsevier .com/locate / ja lcom
Microwave and conventional preparation of Zinc borate glass: Eu3+ ionas luminescent probe
http://dx.doi.org/10.1016/j.jallcom.2014.06.2060925-8388/� 2014 Elsevier B.V. All rights reserved.
⇑ Corresponding author. Tel.: +91 33 2473 5829; fax: +91 33 2473 0957.E-mail addresses: [email protected] (A.K. Mandal), [email protected] (S. Balaji),
[email protected] (R. Sen).
Ashis K. Mandal ⇑, S. Balaji, Ranjan SenGlass Division, CSIR-Central Glass and Ceramic Research Institute, 196, Raja S.C. Mullick Road, Kolkata 700 032, India
a r t i c l e i n f o
Article history:Received 17 April 2014Received in revised form 30 June 2014Accepted 30 June 2014Available online 7 July 2014
Keywords:Amorphous materialsOptical materialsOptical propertiesLuminescenceThermal analysis
a b s t r a c t
Transparent Zinc borate glass is melted using microwave energy as an alternative heating route toconventional resistive heating. A comparative study of the properties of the glasses prepared by boththe methods is conducted by adopting X-ray diffraction (XRD), Differential scanning calorimetry (DSC),UV–VIS–NIR spectroscopy, Fourier transform infrared (FTIR) spectroscopy, Refractive Indices (RI).Amorphous nature of samples is confirmed by X-ray diffraction study. Glass transition temperature(Tg) of microwave melted glass is found �7–9 �C higher than that of glass prepared in conventionalmelting. OH content is found less than 250 ppm in microwave melted glass whereas it is above330 ppm in conventional melted glasses. Photoluminescence study of Eu2O3 doped glass prepared inmicrowave heating indicates higher reduction of Eu3+ ? Eu2+ than the glass melted in conventional route.Thus, microwave processing can be an alternative energy efficient, time saving, environmental friendlyglass preparation method.
� 2014 Elsevier B.V. All rights reserved.
1. Introduction
Search for alternate routes of material synthesis is an integralaspect of materials science. Some of the important driving forcesfor this are the continuing need for rapid processing, energyefficiency, necessity to overcome bottleneck in known processesand improved properties and yield. Microwave-assisted materialsynthesis is a potential alternative method of synthesis and is rap-idly gaining importance in view of the above. Microwave heating isfundamentally different than conventional heating as the electro-magnetic (EM) energy attenuates while passing through the mate-rial generating heat within it. Attenuation of EM energy at a givenfrequency and thereby generating heat depends on the materialproperties. Material can be broadly classified into three categoriesin term of their interaction with microwaves; (i) microwaveabsorbers which absorbs energy from the microwave field generat-ing heat within it very rapidly; (ii) microwave reflectors, as in caseof bulk metals and alloys which are therefore used in makingmicrowave guides and cavity; (iii) microwave transmitters whichare transparent to microwaves, some of them are fused silica,alumina, Zircon, several glass without containing any microwaveabsorber, and ceramics, etc.; they are therefore employed for
making cookware and containers to carry out chemical reactionin microwaves [1].
Several reports have appeared where prospect of materialprocessing with microwave energy have been reviewed [2,3].Microwave versus conventional sintering has been reviewed byOghbaei and Mirzaee [4]. Use of microwave energy for combustionsynthesis process has been reported [5]. Silicon germanium alloyhas been developed using single mode microwave H-field. Shorterprocessing time and lower temperature, enable to maintain stoi-chiometry of resulting alloy and also prevent grain growth [6].Titanium nitride with submicron grain size 170 nm; 240 in caseconventional, can be prepared using microwave heating [7]. Micro-wave treatment has special effect on the surface chemistry of acti-vated carbon, increasing carbon/oxygen ratio by eliminating acidicoxygen-containing functional group [8]. Application of microwaveenergy has also been reported for sintering [9,10], thermal tough-ening [11], drying [12], coating [13], composite formation [14] andmany more.
However, Microwave heating has not been widely applied toglass making because most of the glasses and its raw materials fallunder the category of microwave transmitter and thus difficult toinitiate heating at room temperature. However, microwave prepa-ration of selective glass compositions, incorporating considerableamount of microwave absorber as its ingredients, reported in theliterature have been made on the laboratory scale of only a fewgrams [15–18]. All these preparations have been made with theuse of domestic microwave ovens operating at 2.45 GHz and with
284 A.K. Mandal et al. / Journal of Alloys and Compounds 615 (2014) 283–289
a maximum output power of 1 kW. At above critical temperatureowing to its structural relaxation all glasses start coupling withmicrowave energy signifying possibility of direct microwaveheating of glass [19]. Reasonable improvement of properties ofbarium-boro-silicate, alumino-phosphate glasses prepared inmicrowave melting was also reported [20,21]. However, there isno report of preparation of IR transparent Zinc borate glass compo-sition using microwave heating.
Present study reports preparation of Zinc borate glass in micro-wave furnace and comparison of optical, thermal and structuralproperties with conventionally prepared glass. Eu3+ ions have beenused as a luminescent probe to investigate the structural changesassociated with the glass prepared by both conventional andmicrowave methods.
2. Experimental
2.1. Microwave melting
Glass batch compositions in mol% (65) B2O3, (5) Al2O3, (X) Na2O and (30 � X)ZnO (X = 5, 10) was taken for this study. Eu2O3 (0.5 mol%) was doped in glass com-position [99.5� {(65) B2O3, (5) Al2O3, (10) Na2O and (20) ZnO}] as shown in Table 1.The source of B2O3, primary glass-forming oxide in the glass batch was H3BO3
(Merck, Darmstadt, Germany). The alkaline oxide Na2O in the form of carbonate(Na2CO3 Merck, Darmstadt, Germany 99.9% pure), Al2O3 (Merck, Darmstadt,Germany) and ZnO (Merck, Darmstadt, Germany, purity P99.0) were used. Approx-imately 50 g of each glass batch with compositions, as shown in Table 1, was mixedthoroughly in an agate mortar and pressed to form a pellet at 4 ton pressure in ahydraulically operated pellet press. The pellet was placed in an alumina/quartz cru-cible insulated in air atmosphere inside a 2.45 GHz, 3.0 kW multimode microwavefurnace (from M/S Enerzi Microwave Systems Pvt. Ltd., India) and heated at a rate of15–25 K/min up to 1473 K and held for 1 h. Total melting time was 2 h and powerconsumption was recorded �5 kW h. Temperature measurement of sample wascarried out by on line infrared non-contact Pyrometer 260–1800 �C with accuracy±0.3% of the measured value +1 �C. The molten glass was cast into a preheated steelmould and annealed at 823 K for 2 h followed by controlled cooling of the glass toeliminate thermal stresses. The annealed glass samples were termed as ZBAN1M,ZBAN2M and for Eu2O3 doped glass as ZBAN2EM for composition 1, 2 and 3 respec-tively. In microwave heating, the glass was melted in both alumina and quartzcrucible. Alumina, being poor microwave absorber, crucible temperature remainsless than molten glass. Also shorter processing time minimize interaction of moltenglass with alumina crucible.
2.2. Conventional melting
Identical batch of glass with above compositions were mixed thoroughly in anagate mortar and formed pellet at 4 ton pressure in a hydraulic operated pelletpress. The pellet was placed in a quartz crucible in air atmosphere in electrical resis-tance heating furnace at 1473 K with a maximum heating rate 5 K/min. Tempera-ture was monitored in resistive heating furnace using S-type thermocouple. (withaccuracy from 1.5 to 5 �C) The molten glass was manually stirred intermittentlywith silica rod to obtain homogeneous glass and at 1473 K the molten mass waskept for 2 h (with total melting time 6–7 h) and finally poured into preheated steelmould. Then cast glass was annealed as earlier section. The annealed glasses weretermed as ZBAN1E, ZBAN2E and for Eu2O3 doped glass as ZBAN2EE for composition1, 2 and 3 respectively. The studied glasses interact with alumina crucible and alu-mina crucible got damaged in resistive heating.
3. Characterization methods
X-ray diffraction (XRD) was performed on 94 X’Pert, PANalyticalusing Ni-filtered Cu Ka radiation with wavelength of 1.5406 Å toconfirm the sample amorphous characteristic. The scanning was
Table 1Studied Glass compositions; 0.5 mol% Eu2O3 was doped in composition 2 forcomposition 3.
Oxide composition (mol%) Composition: 1 Composition: 2 Composition: 3
B2O3 65 65 65 (�0.995)Na2O 5 10 10(�0.995)Al2O3 5 5 5(�0.995)ZnO 25 20 20(�0.995)Eu2O3 0.5
carried out in the range of 10–90� with a step size of 0.05� perminute.
The glass transition temperature (Tg) analysis of the preparedglasses were performed on Differential Scanning Calorimetry(DSC) (model STA 449 F3, Netzsch-Jupiter, Germany) up to temper-ature 700 �C at a heating rate of 10 K/min under controlled N2
atmosphere (with 60 ml/min flow rate) by using high purityre-crystallized Alumina crucible as sample container with temper-ature measurement accuracy 1 �C. Around 40 mg of powder sam-ple was taken for DSC experiments.
The densities of glass samples were measured by followingArchimedes’ principle using water as buoyancy liquid on MettlerTolledo balance fitted with density measurement kit. Measure-ment of weight of both samples was repeated thrice and averageweight was considered with an accuracy ±0.001 g.
Refractive indices (RI) of glass samples prepared by both meth-ods were measured at five wavelengths (473, 532, 633, 1064, and1552 nm) on Prism Coupler (Metricon Model-2010, NJ, USA) fittedwith five different lasers as illuminating sources. Three measure-ments were recorded for each wavelength and the standard devia-tion has been reported as error limit (±0.0001).
The optical transmittance spectra were recorded at room tem-perature on a UV–VIS–NIR spectrophotometer (Model: UV 3101PC,Shimadzu, Japan) in the wavelength range 200–3000 nm. ThePhotoluminescence measurements of Eu2O3 doped glass (composi-tion-3) were carried out at room temperature on a Fluorescencespectrophotometer (Model: QuantaMaster-enhanced NIR, fromPhoton Technologies International, USA) fitted with double mono-chromators on both excitation and emission channels. The spectralresolution of the instrument is 0.1 nm in the recorded UV–Visregion. The maximum spectral response of the instrument is3.5 � 106 photon counts. Accordingly, to avoid spectral responsesaturation, the excitation and emission spectra were recorded bykeeping the excitation and emission channel slit widths as 3 nmand 1 nm respectively throughout the experiments. A suitable lowpass filters at the excitation channel and high pass filters at the emis-sion channel were used to avoid unwanted harmonics so as to obtaina genuine and highly resolved emission spectrum. Also, the sampleposition and placement (at 60� to the incident beam) have beenmaintained uniformly for all the recorded samples.
Fourier transform infrared (FTIR) measurements were per-formed on FTIR spectrophotometer (Model: 1615, Perkin Elmercorporation, USA) with a spectral resolution of 4 cm�1 over a spec-tral range of 400–1500 cm�1. Also, FTIR transmission spectra werestudied for samples ZBAN1E, ZBAN2E, ZBAN1M and ZBAN2M overspectral region 400–7000 cm�1 for OH content analysis.
4. Results and discussion
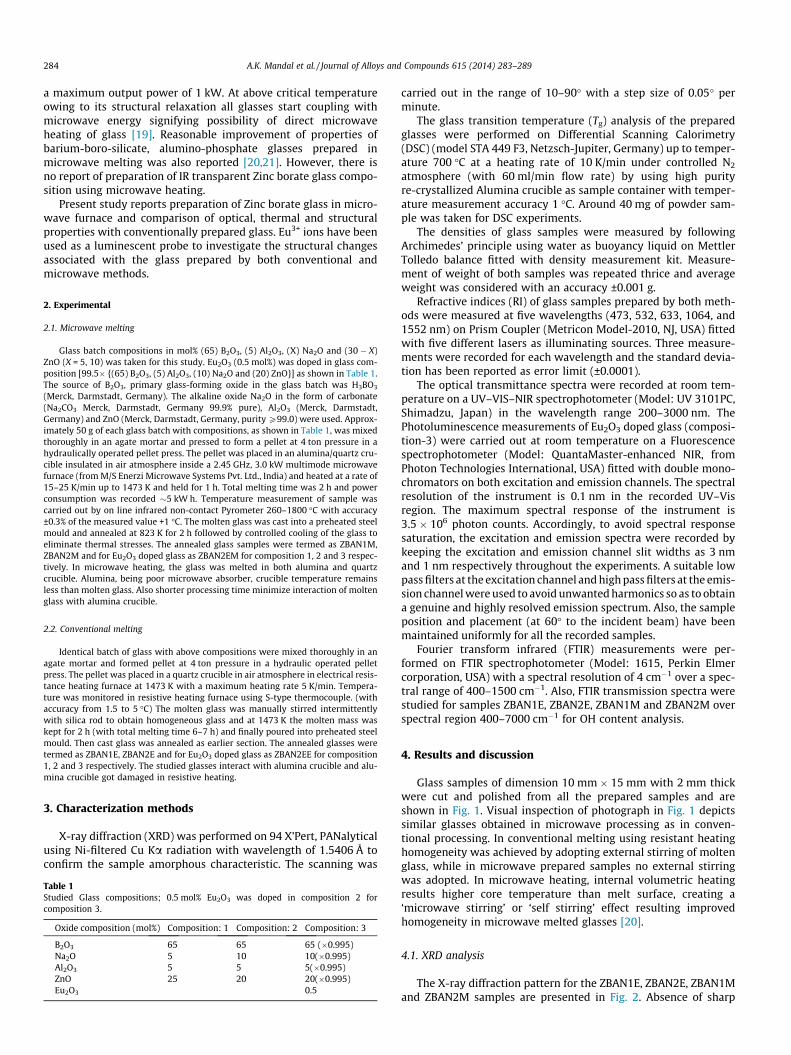
Glass samples of dimension 10 mm � 15 mm with 2 mm thickwere cut and polished from all the prepared samples and areshown in Fig. 1. Visual inspection of photograph in Fig. 1 depictssimilar glasses obtained in microwave processing as in conven-tional processing. In conventional melting using resistant heatinghomogeneity was achieved by adopting external stirring of moltenglass, while in microwave prepared samples no external stirringwas adopted. In microwave heating, internal volumetric heatingresults higher core temperature than melt surface, creating a‘microwave stirring’ or ‘self stirring’ effect resulting improvedhomogeneity in microwave melted glasses [20].
4.1. XRD analysis
The X-ray diffraction pattern for the ZBAN1E, ZBAN2E, ZBAN1Mand ZBAN2M samples are presented in Fig. 2. Absence of sharp
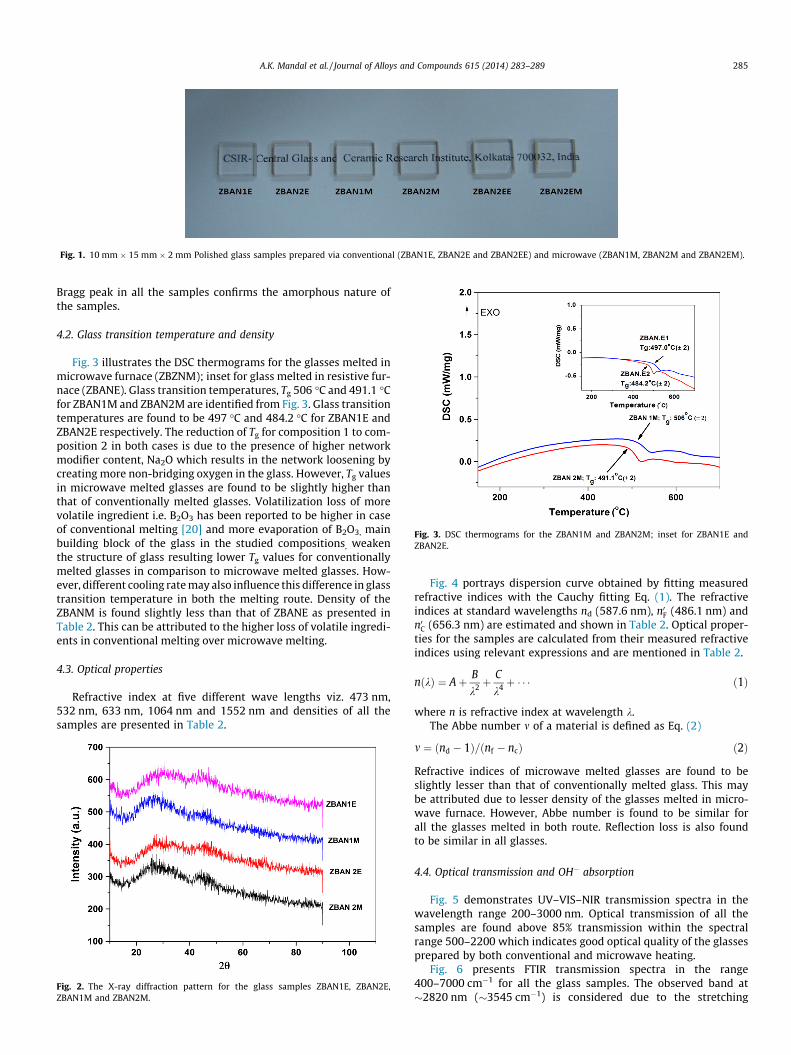
Fig. 1. 10 mm � 15 mm � 2 mm Polished glass samples prepared via conventional (ZBAN1E, ZBAN2E and ZBAN2EE) and microwave (ZBAN1M, ZBAN2M and ZBAN2EM).
Fig. 3. DSC thermograms for the ZBAN1M and ZBAN2M; inset for ZBAN1E andZBAN2E.
A.K. Mandal et al. / Journal of Alloys and Compounds 615 (2014) 283–289 285
Bragg peak in all the samples confirms the amorphous nature ofthe samples.
4.2. Glass transition temperature and density
Fig. 3 illustrates the DSC thermograms for the glasses melted inmicrowave furnace (ZBZNM); inset for glass melted in resistive fur-nace (ZBANE). Glass transition temperatures, Tg 506 �C and 491.1 �Cfor ZBAN1M and ZBAN2M are identified from Fig. 3. Glass transitiontemperatures are found to be 497 �C and 484.2 �C for ZBAN1E andZBAN2E respectively. The reduction of Tg for composition 1 to com-position 2 in both cases is due to the presence of higher networkmodifier content, Na2O which results in the network loosening bycreating more non-bridging oxygen in the glass. However, Tg valuesin microwave melted glasses are found to be slightly higher thanthat of conventionally melted glasses. Volatilization loss of morevolatile ingredient i.e. B2O3 has been reported to be higher in caseof conventional melting [20] and more evaporation of B2O3, mainbuilding block of the glass in the studied compositions, weakenthe structure of glass resulting lower Tg values for conventionallymelted glasses in comparison to microwave melted glasses. How-ever, different cooling rate may also influence this difference in glasstransition temperature in both the melting route. Density of theZBANM is found slightly less than that of ZBANE as presented inTable 2. This can be attributed to the higher loss of volatile ingredi-ents in conventional melting over microwave melting.
4.3. Optical properties
Refractive index at five different wave lengths viz. 473 nm,532 nm, 633 nm, 1064 nm and 1552 nm and densities of all thesamples are presented in Table 2.
Fig. 2. The X-ray diffraction pattern for the glass samples ZBAN1E, ZBAN2E,ZBAN1M and ZBAN2M.
Fig. 4 portrays dispersion curve obtained by fitting measuredrefractive indices with the Cauchy fitting Eq. (1). The refractiveindices at standard wavelengths nd (587.6 nm), n0F (486.1 nm) andn0C (656.3 nm) are estimated and shown in Table 2. Optical proper-ties for the samples are calculated from their measured refractiveindices using relevant expressions and are mentioned in Table 2.
nðkÞ ¼ Aþ B
k2 þC
k4 þ � � � ð1Þ
where n is refractive index at wavelength k.The Abbe number m of a material is defined as Eq. (2)
m ¼ ðnd � 1Þ=ðnf � ncÞ ð2Þ
Refractive indices of microwave melted glasses are found to beslightly lesser than that of conventionally melted glass. This maybe attributed due to lesser density of the glasses melted in micro-wave furnace. However, Abbe number is found to be similar forall the glasses melted in both route. Reflection loss is also foundto be similar in all glasses.
4.4. Optical transmission and OH� absorption
Fig. 5 demonstrates UV–VIS–NIR transmission spectra in thewavelength range 200–3000 nm. Optical transmission of all thesamples are found above 85% transmission within the spectralrange 500–2200 which indicates good optical quality of the glassesprepared by both conventional and microwave heating.
Fig. 6 presents FTIR transmission spectra in the range400–7000 cm�1 for all the glass samples. The observed band at�2820 nm (�3545 cm�1) is considered due to the stretching

Table 2Density, Glass transition temperature and some of the optical properties of ZBAN1M, ZBAN2M, ZBAN1E and ZBAN2E glasses.
Property ZBAN1M ZBAN2M ZBAN1E ZBAN2E
Density (d, g/cc) 2.62 2.54 2.64 2.55Glass transition temperatures (Tg, �C) 506 491.1 497 484.2
Measured refractive index (n) at473 nm 1.563 1.552 1.565 1.553532 nm 1.558 1.548 1.560 1.548633 nm 1.553 1.542 1.555 1.5441064 nm 1.542 1.532 1.544 1.5331552 nm 1.535 1.525 1.538 1.526
Estimated refractive indices at587.6 nm (nd) 1.5554 1.5448 1.5573 1.5459nF-486.1 1.5617 1.5510 1.5637 1.5517nC-656.3 1.5518 1.5414 1.5537 1.5425Mean dispersion (nF � nC) 0.01 0.01 0.01 0.009nd � 1 0.555 0.545 0.557 0.546Abbe number (Vd) 56.1 56.7 55.7 58.9Reflection loss (R%) 4.7 4.6 4.7 4.6
Fig. 4. Dispersion curve obtained by fitting measured refractive indices ZBAN1E,ZBAN2E, ZBAN1M and ZBAN2M.
286 A.K. Mandal et al. / Journal of Alloys and Compounds 615 (2014) 283–289
vibration of weakly bonded OH� groups [22]. The absorptioncoefficient aOH, at 3545 cm�1 can be used to measure the OH�
concentration, as suggested by Ebendorff-Heidepriem [23,24].The OH� content is estimated to be 330 ppm and 447 ppm forthe ZBAN1E and ZBAN2E glasses and 247 ppm and 232 ppm forZBAN1M and ZBAN2M glasses respectively. In microwave melting,volumetric heating drives the OH� away from the glass melt as
Fig. 5. UV–VIS–NIR transmission spectra of the glass samples ZBAN1E, ZBAN2E,ZBAN1M and ZBAN2M.
water strongly absorbs microwave at 2.45 GHz frequency [25].Thus, low OH� concentration glass can be prepared in microwaveheating over conventional heating, which is often found beneficialfor special application.
4.5. Luminescence properties of Eu3+ ions
Among the two glass compositions, composition 2 is chosen fordoping Eu3+ ions. Since Eu3+ ion having relatively simple energylevel structure, it can act as a luminescent probe to find the localstructure around the rare earth ion in the glass [26]. An insight intothe luminescence properties of Eu3+ ions which are highly sensitiveto the coordination of oxygen ion is very much useful to differen-tiate the structural changes around the Eu ion in the glasses pre-pared by conventional and microwave melting techniques. Fig. 7reveals the excitation and emission spectra of ZBAN2EE (EE) andZBAN2EE (EM) samples prepared by conventional resistive heatingand microwave heating methods respectively. The excitation spec-tra for EE and EM samples were recorded by monitoring theintense red emission of Eu3+ ions at 615 nm and emission spectrawere recorded by exciting with the intense excitation band at396 nm of Eu3+ ions. The emission spectra of all the samplesdepicts intense emission peaks at 580 nm, 593 nm, 615 nm,653 nm and 701 nm which are attributed to the transitions corre-sponding to 5D0 ?
7F0,1,2,3,4 respectively. Among all these 4f–4ftransitions, the electric dipole transition at 615 nm due to
Fig. 6. FTIR transmittance spectra of ZBAN1E, ZBAN2E, ZBAN1M and ZBAN2M.
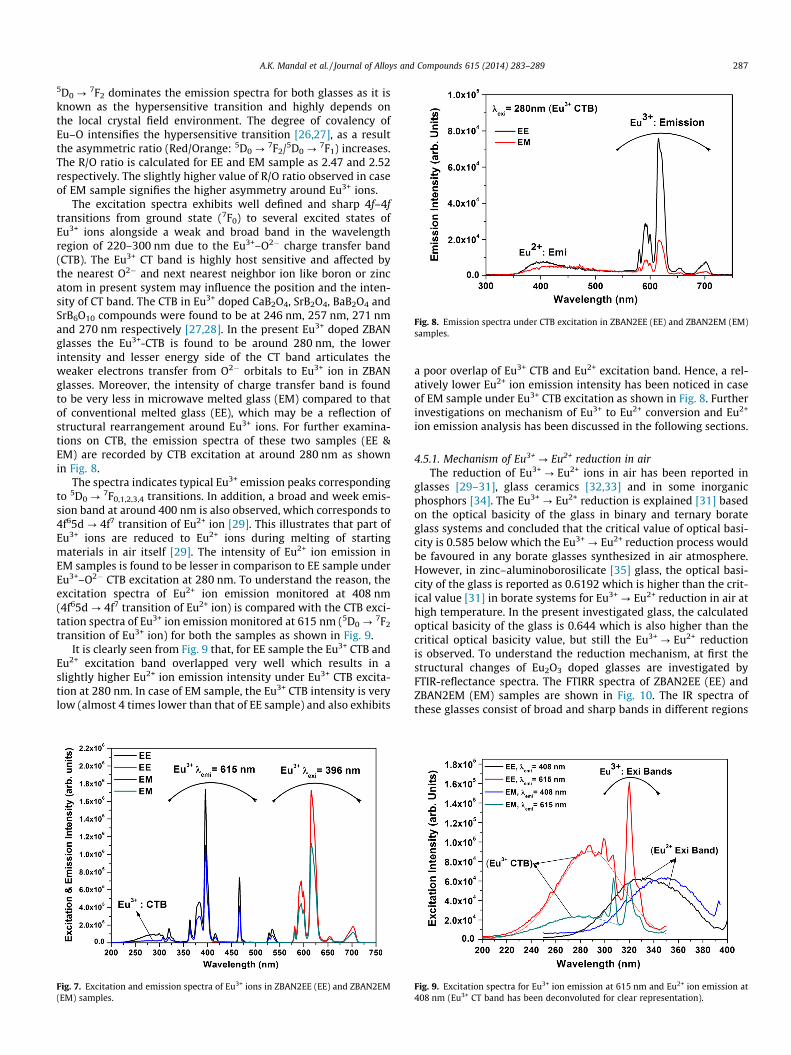
Fig. 8. Emission spectra under CTB excitation in ZBAN2EE (EE) and ZBAN2EM (EM)samples.
A.K. Mandal et al. / Journal of Alloys and Compounds 615 (2014) 283–289 287
5D0 ?7F2 dominates the emission spectra for both glasses as it is
known as the hypersensitive transition and highly depends onthe local crystal field environment. The degree of covalency ofEu–O intensifies the hypersensitive transition [26,27], as a resultthe asymmetric ratio (Red/Orange: 5D0 ?
7F2/5D0 ?7F1) increases.
The R/O ratio is calculated for EE and EM sample as 2.47 and 2.52respectively. The slightly higher value of R/O ratio observed in caseof EM sample signifies the higher asymmetry around Eu3+ ions.
The excitation spectra exhibits well defined and sharp 4f–4ftransitions from ground state (7F0) to several excited states ofEu3+ ions alongside a weak and broad band in the wavelengthregion of 220–300 nm due to the Eu3+–O2� charge transfer band(CTB). The Eu3+ CT band is highly host sensitive and affected bythe nearest O2� and next nearest neighbor ion like boron or zincatom in present system may influence the position and the inten-sity of CT band. The CTB in Eu3+ doped CaB2O4, SrB2O4, BaB2O4 andSrB6O10 compounds were found to be at 246 nm, 257 nm, 271 nmand 270 nm respectively [27,28]. In the present Eu3+ doped ZBANglasses the Eu3+-CTB is found to be around 280 nm, the lowerintensity and lesser energy side of the CT band articulates theweaker electrons transfer from O2� orbitals to Eu3+ ion in ZBANglasses. Moreover, the intensity of charge transfer band is foundto be very less in microwave melted glass (EM) compared to thatof conventional melted glass (EE), which may be a reflection ofstructural rearrangement around Eu3+ ions. For further examina-tions on CTB, the emission spectra of these two samples (EE &EM) are recorded by CTB excitation at around 280 nm as shownin Fig. 8.
The spectra indicates typical Eu3+ emission peaks correspondingto 5D0 ?
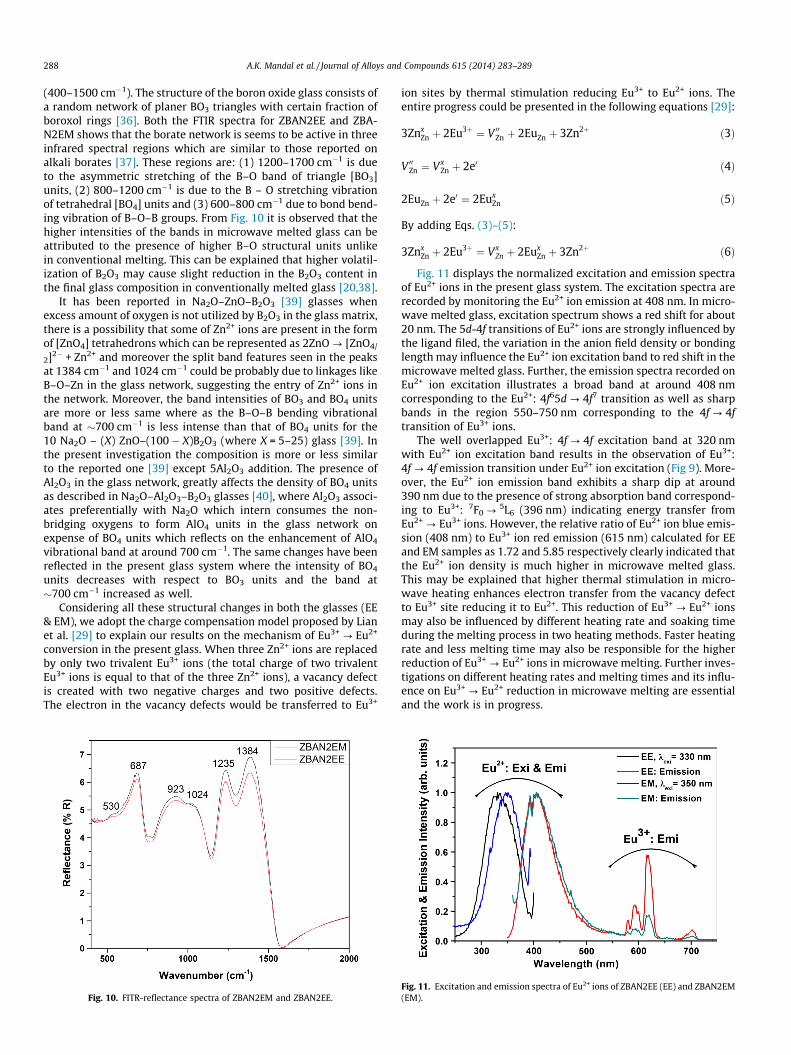
7F0,1,2,3,4 transitions. In addition, a broad and week emis-sion band at around 400 nm is also observed, which corresponds to4f65d ? 4f7 transition of Eu2+ ion [29]. This illustrates that part ofEu3+ ions are reduced to Eu2+ ions during melting of startingmaterials in air itself [29]. The intensity of Eu2+ ion emission inEM samples is found to be lesser in comparison to EE sample underEu3+–O2� CTB excitation at 280 nm. To understand the reason, theexcitation spectra of Eu2+ ion emission monitored at 408 nm(4f65d ? 4f7 transition of Eu2+ ion) is compared with the CTB exci-tation spectra of Eu3+ ion emission monitored at 615 nm (5D0 ?
7F2
transition of Eu3+ ion) for both the samples as shown in Fig. 9.It is clearly seen from Fig. 9 that, for EE sample the Eu3+ CTB and
Eu2+ excitation band overlapped very well which results in aslightly higher Eu2+ ion emission intensity under Eu3+ CTB excita-tion at 280 nm. In case of EM sample, the Eu3+ CTB intensity is verylow (almost 4 times lower than that of EE sample) and also exhibits
Fig. 7. Excitation and emission spectra of Eu3+ ions in ZBAN2EE (EE) and ZBAN2EM(EM) samples.
a poor overlap of Eu3+ CTB and Eu2+ excitation band. Hence, a rel-atively lower Eu2+ ion emission intensity has been noticed in caseof EM sample under Eu3+ CTB excitation as shown in Fig. 8. Furtherinvestigations on mechanism of Eu3+ to Eu2+ conversion and Eu2+
ion emission analysis has been discussed in the following sections.
4.5.1. Mechanism of Eu3+ ? Eu2+ reduction in airThe reduction of Eu3+ ? Eu2+ ions in air has been reported in
glasses [29–31], glass ceramics [32,33] and in some inorganicphosphors [34]. The Eu3+ ? Eu2+ reduction is explained [31] basedon the optical basicity of the glass in binary and ternary borateglass systems and concluded that the critical value of optical basi-city is 0.585 below which the Eu3+ ? Eu2+ reduction process wouldbe favoured in any borate glasses synthesized in air atmosphere.However, in zinc–aluminoborosilicate [35] glass, the optical basi-city of the glass is reported as 0.6192 which is higher than the crit-ical value [31] in borate systems for Eu3+ ? Eu2+ reduction in air athigh temperature. In the present investigated glass, the calculatedoptical basicity of the glass is 0.644 which is also higher than thecritical optical basicity value, but still the Eu3+ ? Eu2+ reductionis observed. To understand the reduction mechanism, at first thestructural changes of Eu2O3 doped glasses are investigated byFTIR-reflectance spectra. The FTIRR spectra of ZBAN2EE (EE) andZBAN2EM (EM) samples are shown in Fig. 10. The IR spectra ofthese glasses consist of broad and sharp bands in different regions
Fig. 9. Excitation spectra for Eu3+ ion emission at 615 nm and Eu2+ ion emission at408 nm (Eu3+ CT band has been deconvoluted for clear representation).
288 A.K. Mandal et al. / Journal of Alloys and Compounds 615 (2014) 283–289
(400–1500 cm�1). The structure of the boron oxide glass consists ofa random network of planer BO3 triangles with certain fraction ofboroxol rings [36]. Both the FTIR spectra for ZBAN2EE and ZBA-N2EM shows that the borate network is seems to be active in threeinfrared spectral regions which are similar to those reported onalkali borates [37]. These regions are: (1) 1200–1700 cm�1 is dueto the asymmetric stretching of the B–O band of triangle [BO3]units, (2) 800–1200 cm�1 is due to the B – O stretching vibrationof tetrahedral [BO4] units and (3) 600–800 cm�1 due to bond bend-ing vibration of B–O–B groups. From Fig. 10 it is observed that thehigher intensities of the bands in microwave melted glass can beattributed to the presence of higher B–O structural units unlikein conventional melting. This can be explained that higher volatil-ization of B2O3 may cause slight reduction in the B2O3 content inthe final glass composition in conventionally melted glass [20,38].
It has been reported in Na2O–ZnO–B2O3 [39] glasses whenexcess amount of oxygen is not utilized by B2O3 in the glass matrix,there is a possibility that some of Zn2+ ions are present in the formof [ZnO4] tetrahedrons which can be represented as 2ZnO ? [ZnO4/
2]2� + Zn2+ and moreover the split band features seen in the peaksat 1384 cm�1 and 1024 cm�1 could be probably due to linkages likeB–O–Zn in the glass network, suggesting the entry of Zn2+ ions inthe network. Moreover, the band intensities of BO3 and BO4 unitsare more or less same where as the B–O–B bending vibrationalband at �700 cm�1 is less intense than that of BO4 units for the10 Na2O – (X) ZnO–(100 � X)B2O3 (where X = 5–25) glass [39]. Inthe present investigation the composition is more or less similarto the reported one [39] except 5Al2O3 addition. The presence ofAl2O3 in the glass network, greatly affects the density of BO4 unitsas described in Na2O–Al2O3–B2O3 glasses [40], where Al2O3 associ-ates preferentially with Na2O which intern consumes the non-bridging oxygens to form AlO4 units in the glass network onexpense of BO4 units which reflects on the enhancement of AlO4
vibrational band at around 700 cm�1. The same changes have beenreflected in the present glass system where the intensity of BO4
units decreases with respect to BO3 units and the band at�700 cm�1 increased as well.
Considering all these structural changes in both the glasses (EE& EM), we adopt the charge compensation model proposed by Lianet al. [29] to explain our results on the mechanism of Eu3+ ? Eu2+
conversion in the present glass. When three Zn2+ ions are replacedby only two trivalent Eu3+ ions (the total charge of two trivalentEu3+ ions is equal to that of the three Zn2+ ions), a vacancy defectis created with two negative charges and two positive defects.The electron in the vacancy defects would be transferred to Eu3+
Fig. 10. FITR-reflectance spectra of ZBAN2EM and ZBAN2EE.
ion sites by thermal stimulation reducing Eu3+ to Eu2+ ions. Theentire progress could be presented in the following equations [29]:
3ZnxZn þ 2Eu3þ ¼ V 00Zn þ 2Eu�Zn þ 3Zn2þ ð3Þ
V 00Zn ¼ VxZn þ 2e0 ð4Þ
2Eu�Zn þ 2e0 ¼ 2EuxZn ð5Þ
By adding Eqs. (3)–(5):
3ZnxZn þ 2Eu3þ ¼ Vx
Zn þ 2EuxZn þ 3Zn2þ ð6Þ
Fig. 11 displays the normalized excitation and emission spectraof Eu2+ ions in the present glass system. The excitation spectra arerecorded by monitoring the Eu2+ ion emission at 408 nm. In micro-wave melted glass, excitation spectrum shows a red shift for about20 nm. The 5d-4f transitions of Eu2+ ions are strongly influenced bythe ligand filed, the variation in the anion field density or bondinglength may influence the Eu2+ ion excitation band to red shift in themicrowave melted glass. Further, the emission spectra recorded onEu2+ ion excitation illustrates a broad band at around 408 nmcorresponding to the Eu2+: 4f65d ? 4f7 transition as well as sharpbands in the region 550–750 nm corresponding to the 4f ? 4ftransition of Eu3+ ions.
The well overlapped Eu3+: 4f ? 4f excitation band at 320 nmwith Eu2+ ion excitation band results in the observation of Eu3+:4f ? 4f emission transition under Eu2+ ion excitation (Fig 9). More-over, the Eu2+ ion emission band exhibits a sharp dip at around390 nm due to the presence of strong absorption band correspond-ing to Eu3+: 7F0 ?
5L6 (396 nm) indicating energy transfer fromEu2+ ? Eu3+ ions. However, the relative ratio of Eu2+ ion blue emis-sion (408 nm) to Eu3+ ion red emission (615 nm) calculated for EEand EM samples as 1.72 and 5.85 respectively clearly indicated thatthe Eu2+ ion density is much higher in microwave melted glass.This may be explained that higher thermal stimulation in micro-wave heating enhances electron transfer from the vacancy defectto Eu3+ site reducing it to Eu2+. This reduction of Eu3+ ? Eu2+ ionsmay also be influenced by different heating rate and soaking timeduring the melting process in two heating methods. Faster heatingrate and less melting time may also be responsible for the higherreduction of Eu3+ ? Eu2+ ions in microwave melting. Further inves-tigations on different heating rates and melting times and its influ-ence on Eu3+ ? Eu2+ reduction in microwave melting are essentialand the work is in progress.
Fig. 11. Excitation and emission spectra of Eu2+ ions of ZBAN2EE (EE) and ZBAN2EM(EM).
A.K. Mandal et al. / Journal of Alloys and Compounds 615 (2014) 283–289 289
5. Conclusions
Zinc borate glass is melted by microwave heating and theproperties of glass were compared with the glass prepared withconventional melting. Glasses prepared under microwave heatingwere found to be similar optical and physical properties in compar-ison with conventional prepared glasses. OH concentration isfound to be lower in glasses prepared by microwave heating.Eu3+ ion local filed structure showed a difference between conven-tional melting and microwave melting. Eu3+ CTB also greatlysuffered in microwave melted glass. The relative ratio of Eu2+ ionemission intensity to Eu3+ ion emission clearly indicated that theEu2+ ion density is much higher in microwave melted glass. Thus,microwave heating could be a potential energy efficient heating,saving a significant amount of electrical energy and time, neededfor conventional glass melting.
Acknowledgements
This work was funded by Supra Institutional Network ProjectESC0202 (GLASSFIB) of Council of Scientific and IndustrialResearch, India. Authors are thankful to the Director, CSIR-CGCRIfor his kind support and encouragement to pursue this work. Wealso like to thank Dr. B. Karmakar, Dr. K. Annapurna, Mr. A.R. Molla,and Dr. K. Biswas, for their help in characterization of glass sam-ples. Authors sincerely acknowledge the contribution of staff inGSTS, CSIR-CGCRI for their help as when required.
References
[1] K.J. Rao, B. Vaidhyanathan, M. Ganguli, P.A. Ramakrishnan, Chem. Mater. 11(1999) 882–895.
[2] S. Das, A.K. Mukhopdhyay, S. Dutta, D. Basu, Bull. Mater. Sci. 32 (1) (2009) 1–13.
[3] O.K. Kharissova, B.I. Kharisov, J.J.R. Valde’s, Ind. Eng. Chem. Res. 49 (2010)1457–1466.
[4] M. Oghbaei, O. Mirzaee, J. Alloys Comp. 494 (2010) 175–189.[5] R. Rosa, P. Veronesi, C. Leonelli, Chem. Eng. Process. 71 (2013) 2–18.[6] C.L. Dube, S.C. Kashyap, D.C. Dube, D.K. Agrawal, J. Alloys Comp. 571 (2013)
75–78.[7] D. Demirskyi, D. Agrawal, A. Ragulya, J Alloys Comp. 581 (2013) 496–501.[8] Roozbeh Hoseinzadeh Hesas, Wan Mohd Ashri Wan Daud, J.N. Sahu, Arash
Arami-Niyaa, J. Anal. Appl. Pyrolysis 100 (2013) 1–11.
[9] A. Raja Annamalai, A. Upadhyaya, D. Agrawal, Bull. Mater. Sci. 36 (2013) 447–456.
[10] C.Y. Tanga, C.T. Wonga, L.N. Zhanga, M.T. Choya, T.W. Chowb, K.C. Chana, T.M.Yuea, Q. Chena, J. Alloys Comp. 557 (2013) 67–72.
[11] M.P. Knox, G.J. Copley, Glass Technol. 38 (1997) 91–96.[12] H. Segerer, Am. Ceram. Sot. Bull. 77 (1998) 64–66.[13] S. Das, A.K. Mukhopadhyay, S. Datta, G.C. Das, D. Basu, J. Eur. Ceram. Soc. 28
(2008) 729–738.[14] S. Das, A.K. Mukhopadhyay, S. Datta, N. Dandapat, J. Alloys Comp. 500 (2010)
231–236.[15] B. Vaidhyanathan, M. Ganguli, K.J. Rao, J. Solid State Chem. 113 (1994) 448–
450.[16] S. Chenu, J. Rocherullè, R. Lebullenger, O. Merdrignac, F. Chevire, F. Tessier, H.
Oudadesse, J. Non-Cryst. Solids 356 (2010) 87–92.[17] F.J.M. Almeida, J.R. Martinelli, C.S.M. Partiti, J. Non-Cryst. Solids 353 (2007)
4783–4791.[18] L. Ghussn, J.L. Martinelli, J. Mater. Sci. 39 (2004) 1371–1376.[19] C. Siligardi, M.C. D’Arrigo, C. Leonelli, G.C. Pellacani, T.E. Cross, J. Am. Chem.
Soc. 83 (2000) 1001–1003.[20] A.K. Mandal, D. Agrawal, R. Sen, J. Non-Cryst. Solids 371–372 (2013) 41–46.[21] A.K. Mandal, K. Biswas, K. Annapurna, C. Guha, C and R. Sen R, J. Mater. Res. 28
(2013) 1955–1961.[22] E. Snoeks, P.G. Kik, A. Polman, Opt. Mater. 5 (1996) 159–167.[23] H. Ebendorff-Heidepriem, W. Seeber, D. Ehrt, J. Non Cryst. Solids 163 (1993)
74–80.[24] H. Toratani, H. Meissner, T. Izumitani, S. Stokowski, J. Non Cryst. Solids 95–96
(1987) 701–708.[25] W.H. Sutton, Ceram. Bull. 68 (1987) 376–386.[26] G. Lakshminarayana, J. Qiu, M.G. Brik, I.V. Kityk, J. Phys.: Condens. Matter 20
(2008) 335106 (11p).[27] Zhiwu Pei, Su Qiang, Shanhua Li, J. Lumin. 50 (1991) 123–126.[28] Qinghua. Zeng, Zhiwu Pei, Shubing Wang, Su Qiang, J. Alloys Comp. 257–277
(1998) 238–241.[29] Z. Lian, J. Wang, Y. Lv, S. Wang, Q. Su, J. Alloys Comp. 430 (2007) 257–261.[30] Q. Zhang, X. Liu, Y. Qiao, B. Qian, G. Dong, J. Ruan, Opt. Mater. 32 (2010) 427–
431.[31] C. Wang, M. Peng, N. Jiang, X. Jiang, C. Zhao, J. Qiu, Mater. Lett. 61 (2007) 3608–
3611.[32] S. Taruta, M. Matsuki, H. Nishikiori, T. Yamakami, T. Yamaguchi, K. Kitajima,
Ceram. Int. 36 (2010) 1303–1309.[33] Kaushik Biswas, Atul D. Sontakke, R. Sen, K. Annapurna, J. Fluoro. 22 (2011)
745–752.[34] Zhiwu Pei, Su Qiang, Jiyu Zhang, J. Alloys Comp. 198 (1993) 51–53.[35] S. Liu, G. Zhao, H. Ying, J. Wang, G. Han, Opt. Mater. 31 (2008) 47–50.[36] H.A. Silim, Egypt J. Sol. 26 (2003) 15–24.[37] E.I. Kamitsos, G.D. Chryssikos, M.A. Karakassides, J. Non-Cryst. Solids 123
(1990) 283–285.[38] A.K. Mandal, P.K. Sinha, S. Sen, S. Mandal, C. Guha, R. Sen, J. Chem. Chem. Eng. 8
(2014) 349–357.[39] V.C. Veeranna Gowda, R.V. Anavekar, Bull. Mater. Sci. 27 (2004) 199–205.[40] H. Doweidar, Y.M. Moustafa, S. Abd El-Maksoud, H. Silim, Mater. Sci. Eng. A 301
(2001) 207–212.