Laser synthesis and luminescence properties of SrAl2O4:Eu2+, Dy3+ phosphors
Upload
independentCategory
view
0download
0
Luminescence study of Eu3+ doped GdVO4 nanoparticles: Concentration,particle size, and core/shell effectsN. Shanta Singh, R. S. Ningthoujam, L. Romila Devi, N. Yaiphaba, V. Sudarsan et al. Citation: J. Appl. Phys. 104, 104307 (2008); doi: 10.1063/1.3026612 View online: http://dx.doi.org/10.1063/1.3026612 View Table of Contents: http://jap.aip.org/resource/1/JAPIAU/v104/i10 Published by the AIP Publishing LLC. Additional information on J. Appl. Phys.Journal Homepage: http://jap.aip.org/ Journal Information: http://jap.aip.org/about/about_the_journal Top downloads: http://jap.aip.org/features/most_downloaded Information for Authors: http://jap.aip.org/authors
Downloaded 20 Sep 2013 to 221.130.23.115. This article is copyrighted as indicated in the abstract. Reuse of AIP content is subject to the terms at: http://jap.aip.org/about/rights_and_permissions
Luminescence study of Eu3+ doped GdVO4 nanoparticles: Concentration,particle size, and core/shell effects
N. Shanta Singh,1,c� R. S. Ningthoujam,2,a� L. Romila Devi,3 N. Yaiphaba,4 V. Sudarsan,2
S. Dorendrajit Singh,1 R. K. Vatsa,2,b� and R. Tewari51Department of Physics, Manipur University, Canchipur, Imphal 795003, Manipur, India2Chemistry Division, Bhabha Atomic Research Centre, Mumbai 400085, India3Department of Chemistry, Mumbai University, Mumbai 400098, India4Department of Chemistry, Manipur University, Canchipur, Imphal 795003, Manipur, India5Material Science Division, Bhabha Atomic Research Centre, Mumbai 400085, India
�Received 1 August 2008; accepted 7 October 2008; published online 19 November 2008�
Nanoparticles of GdVO4 doped with Eu3+ and core/shell of GdVO4:Eu3+ /GdVO4 are prepared byurea hydrolysis method using ethylene glycol as capping agent as well as reaction medium at130 °C. Unit cell volume increases when GdVO4 is doped with Eu3+ indicating the substitution ofGd3+ lattice sites by Eu3+. From luminescence study, it is confirmed that there is no particle sizeeffect on emission positions of Eu3+. Optimum luminescence intensity is found to be in 5–10 at. %Eu3+. Above these concentrations, luminescence intensity decreases due to concentration quenchingeffect. There is an enhancement in luminescence intensity of core/shell nanoparticles. This has beenattributed to the reduction in surface inhomogenities of Eu3+ surroundings by bonding to GdVO4
shell. The lifetime for 5D0 level increases with annealing and core/shell formation. © 2008American Institute of Physics. �DOI: 10.1063/1.3026612�
I. INTRODUCTION
Nanoparticles of oxide and sulphide phosphors havebeen the active area of research during the last few decadesfor their intriguing physical properties compared to theirbulk counterparts. The intrinsic properties of materialschange as a function of size that evolves from atom or smallmolecules to bulk.1,2 The size dependent intrinsic propertiesof nanocrystals are concerned with today’s developing fieldof nanoscience and nanotechnology leading to the miniatur-ization as well as new devices. For instance, the emitted lightfrom semiconductors such as CdSe3,4 can be tuned in thevisible range of light spectrum by varying the size and can beused in light emitting devices. This color tunability is due toquantum confinement effect leading to the splitting of bandedges.2,5,6
Lanthanide doped nanoparticles of inorganic oxide phos-phors such as Y2O3, YVO4, and GdVO4 have been a greatdeal of interest for their potential applications in differentlight emitting and laser devices.7–9 These oxide phosphorsalso have the advantages of higher chemical stability.10 Ap-plication of nanosized phosphors has attracted considerableattention since enhanced luminescence quantum efficiencywith decreasing particle size was reported in 1994.11
GdVO4 is a tetragonal crystal system with space groupI41/amd �JCPDS-17–0260�. Based on the space group I41/amd,GdVO4 has four chemical formula per unit cell �z=4�. V5+
ion has the nearest four oxygen ligands to form tetrahedron�VO4� with a V–O bond distance of 1.706 Å. Gd3+ has eight
nearest oxygen ligands to form bisdisphenoid and form twodifferent bond lengths of Gd–O leading to a highly asymmet-ric environment on Gd3+.12,13
It has a large thermal conductivity, which is favorablefor efficient cooling of the crystals when used as lasermaterial.14 GdVO4 doped with europium �GdVO4:Eu3+� isan excellent red emitter, which has many applications in lu-minescence displays,15 cathode ray tubes, and lamps.16 Thisgadolinium �Gd� based luminescent phosphors like GdVO4
where Gd3+ has the excited state levels in the ultravioletregion of relatively higher energy due to its half filled �4fn�ground state.17 Because of this, there is a strong absorptionof ultraviolet light by GdVO4 and energy transfer from hostto Eu3+ through V–O charge transfer �CT� or Gd3+ excitationcan obtain an efficient luminescence intensity of Eu3+. Thismakes the GdVO4:Eu3+ as an efficient red light emittingmaterial.18 The rare earth ions acting as activators in thesehost materials have many 4f manifolds or involving 4fn−1
and 5d configurations, which give light emission mainly dueto electric and magnetic dipole transitions within thesubshell.19,20 Further, influence of external forces on f elec-trons is shielded by less energetic 5s and 5p shells resultingin relatively sharp emission spectra.20 Although f-f transi-tions in rare earth ions are forbidden, the luminescence isobserved because of the relaxation of selection rules by crys-tal field surrounding the rare earth ions.21
There are several reports on the synthesis routes ofGdVO4 crystals doped with europium �Eu� such ascoprecipitation,16 sol-gel method,22 and solid state reaction.23
Earlier, we have reported the synthesis and characterizationof nanoparticles such as Y2O3, SnO2, TiO2, ZnO, CdS,SnO2:Eu /SiO2, SiO2:Eu /SnO2, and Y2O3:Eu /Y2O3 usingethylene glycol �EG� as capping agent as well as reaction
c�Electronic mail: [email protected]�Author to whom correspondence should be addressed. FAX: �91 22
25592321. Electronic mail: [email protected]�Electronic mail: [email protected].
JOURNAL OF APPLIED PHYSICS 104, 104307 �2008�
0021-8979/2008/104�10�/104307/9/$23.00 © 2008 American Institute of Physics104, 104307-1
Downloaded 20 Sep 2013 to 221.130.23.115. This article is copyrighted as indicated in the abstract. Reuse of AIP content is subject to the terms at: http://jap.aip.org/about/rights_and_permissions

medium, which is less expensive.7,24–29 There are few reportsregarding synthesis of nanoparticles of GdVO4,22 which willbe useful in efficient new devices.
In the present study, we have prepared GdVO4 nanopar-ticles doped with Eu3+ up to 50 at. % concentrations usingEG as a capping agent as well as a reaction medium and ureais used as a hydrolyzing agent. The prepared samples arecharacterized for their structural and luminescence proper-ties. The luminescence intensities of these samples are stud-ied as a function of annealing temperature and particle size.We have investigated the effect of core/shell by covering theGdVO4:Eu3+ core nanoparticles by an undoped GdVO4
shell.
II. EXPERIMENTAL DETAILS
A. Sample preparation
GdVO4 and GdVO4 doped with Eu3+ �Eu3+=2, 5, 7, 10,15, 20, 30, 40, and 50 at. %� were prepared by urea hydroly-sis for 3 h in the EG, which is used as both capping agentand solvent at 130 °C. Urea on heat treatment at 120 °Cdecomposes to NH4OH and CO2. NH4OH molecules reactwith metal ions to form corresponding oxide and hydroxides.When nucleation of particles starts, the particles are cappedwith EG thereby growth of the particles is controlled. Gado-linium oxide �Gd2O3, 99.9%, Aldrich�, ammonium meta-vanadate �NH4VO3, 99.0%, BDH Poole England�, and eu-ropium oxide �Eu2O3, 99.9%, Sigma Aldrich� are used assources of Gd3+, VO4
3−, and Eu3+, respectively. In a typicalsynthesis of 2 at. % Eu3+ doped GdVO4 nanoparticles, 500mg of Gd2O3, 10 mg of Eu2O3, and 323 mg of NH4VO3 aredissolved together in concentrated nitric acid �HNO3� in a250 ml two neck round bottom flask. To this reaction me-dium 50 ml of EG and 5 g of urea are added and heated.When the temperature of the reaction bath reached70–80 °C, the color of the reaction bath changes to slightlyblack and then turns to a deep green color. On heating at120 °C the color changes to deep orange color. After this,precipitation starts slowly and the reaction is continued for 3h at 130 °C when complete precipitation is reached withbrown color. The precipitate formed is separated by centrifu-gation and washed several times with ethanol to remove theexcess EG. For the core/shell preparation, the above proce-dure is followed for 7 at. % Eu3+ doped GdVO4. The pre-cipitate formed is stirred for 3 h, then a solution of Gd3+,Eu3+, and VO4
3− is added drop wise and heated at 130 °C for3 h.
All the samples are further calcined at 500 and 900 °Cin ambient atmosphere. As prepared pure and Eu3+ dopedGdVO4 samples are heated at 500 °C in order to removehydrocarbon contents from capping agent �EG� and such hy-drocarbons are one of the primary causes for quenching inluminescence. Subsequently, 500 °C heated samples areheated to 900 °C in order to see the particle size effect be-cause during the heating at higher temperature, particle sizeis increased.
B. Characterization
Structural studies of the samples were carried out usingPhilips powder x-ray diffractometer �model PW 1071� withCu K� �1.5405 Å� radiation with Ni filter operating over theangular range 10�2� /deg�70 with a step size of �2�=0.02. The average crystallite size �d� was calculated usingDebye–Scherrer relation, d=0.9� /� cos � where � is thewavelength of the x-ray and � is the full width at half maxi-mum �FWHM�. Transmission electron microscopy �TEM�was recorded using JEOL 2000 FX microscope. For theTEM measurement, the samples were ground and mixed to-gether with glycerine and dispersed under ultrasonic vibra-tion for 30 min. A drop of the dispersed particles was putover the carbon coated copper grid and evaporated to drynessin the ambient atmosphere. All the luminescence spectrawere recorded using HITACHI instrument F-4500 equippedwith 150 W xenon lamp. The scan rate is 120 nm/min with aresolution of 3 nm. Samples were prepared by dispersing inthe methanol and spread over the microscope quartz slideand dried in the ambient atmosphere. The infrared �IR� vi-brational modes in GdVO4 samples were studied usingBomem MB-series Fourier transform IR spectrometer with20 scans per record. The lifetime for emission has been car-ried out using Edinburgh Instruments F920 fluorescencespectrometer with a resolution of 3 nm.
III. RESULTS AND DISCUSSION
A. X-ray diffraction study
Figure 1 shows the x-ray diffraction �XRD� pattern ofthe as prepared, 500, and 900 °C heated pure GdVO4
samples. The as prepared sample is found to be amorphousin nature, with Gd�OH�3, which is confirmed by IR study�discussed later�. On heat treatment at 500 and 900 °C, crys-
FIG. 1. XRD patterns of �a� as prepared, �b� 500, and �c� 900 °C heatedpure GdVO4 samples.
104307-2 Singh et al. J. Appl. Phys. 104, 104307 �2008�
Downloaded 20 Sep 2013 to 221.130.23.115. This article is copyrighted as indicated in the abstract. Reuse of AIP content is subject to the terms at: http://jap.aip.org/about/rights_and_permissions
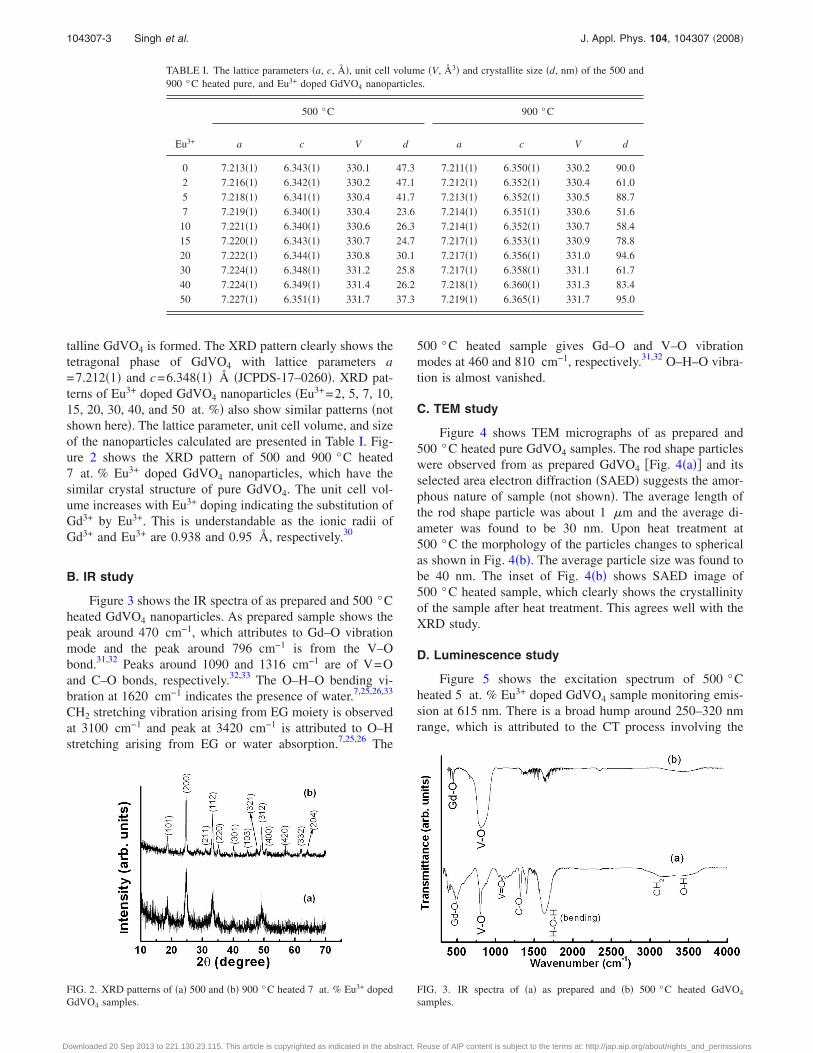
talline GdVO4 is formed. The XRD pattern clearly shows thetetragonal phase of GdVO4 with lattice parameters a=7.212�1� and c=6.348�1� Å �JCPDS-17–0260�. XRD pat-terns of Eu3+ doped GdVO4 nanoparticles �Eu3+=2, 5, 7, 10,15, 20, 30, 40, and 50 at. %� also show similar patterns �notshown here�. The lattice parameter, unit cell volume, and sizeof the nanoparticles calculated are presented in Table I. Fig-ure 2 shows the XRD pattern of 500 and 900 °C heated7 at. % Eu3+ doped GdVO4 nanoparticles, which have thesimilar crystal structure of pure GdVO4. The unit cell vol-ume increases with Eu3+ doping indicating the substitution ofGd3+ by Eu3+. This is understandable as the ionic radii ofGd3+ and Eu3+ are 0.938 and 0.95 Å, respectively.30
B. IR study
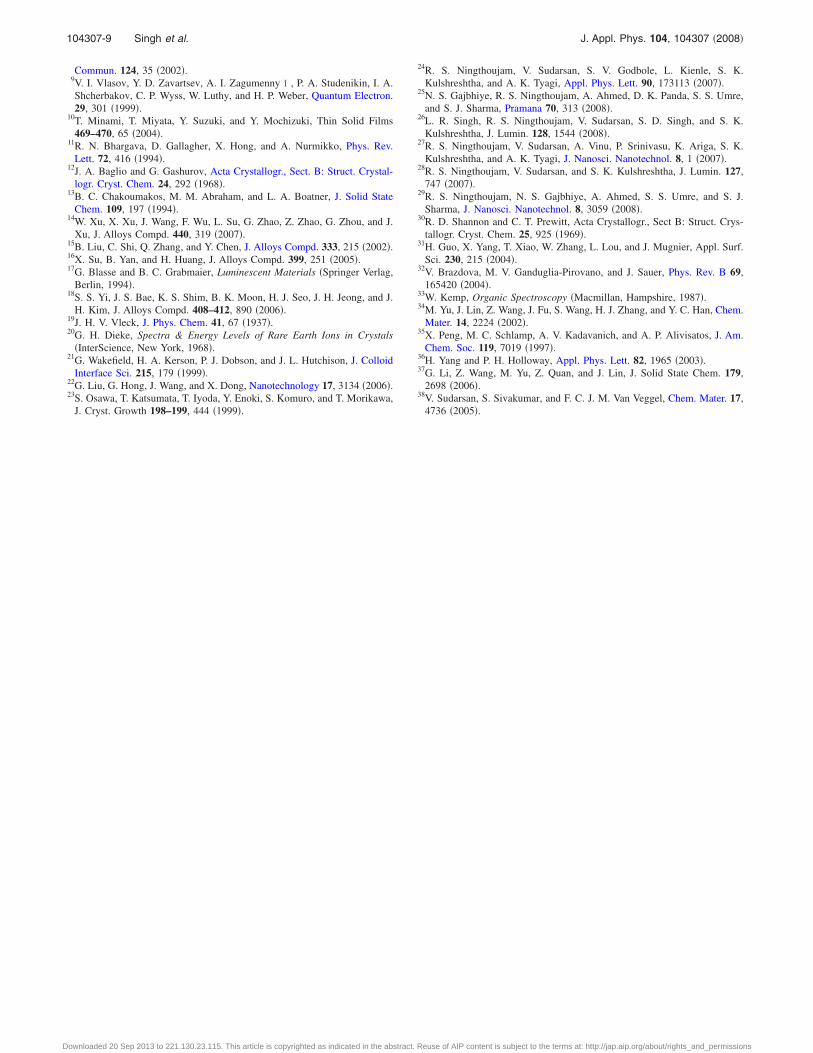
Figure 3 shows the IR spectra of as prepared and 500 °Cheated GdVO4 nanoparticles. As prepared sample shows thepeak around 470 cm−1, which attributes to Gd–O vibrationmode and the peak around 796 cm−1 is from the V–Obond.31,32 Peaks around 1090 and 1316 cm−1 are of V=Oand C–O bonds, respectively.32,33 The O–H–O bending vi-bration at 1620 cm−1 indicates the presence of water.7,25,26,33
CH2 stretching vibration arising from EG moiety is observedat 3100 cm−1 and peak at 3420 cm−1 is attributed to O–Hstretching arising from EG or water absorption.7,25,26 The
500 °C heated sample gives Gd–O and V–O vibrationmodes at 460 and 810 cm−1, respectively.31,32 O–H–O vibra-tion is almost vanished.
C. TEM study
Figure 4 shows TEM micrographs of as prepared and500 °C heated pure GdVO4 samples. The rod shape particleswere observed from as prepared GdVO4 �Fig. 4�a�� and itsselected area electron diffraction �SAED� suggests the amor-phous nature of sample �not shown�. The average length ofthe rod shape particle was about 1 �m and the average di-ameter was found to be 30 nm. Upon heat treatment at500 °C the morphology of the particles changes to sphericalas shown in Fig. 4�b�. The average particle size was found tobe 40 nm. The inset of Fig. 4�b� shows SAED image of500 °C heated sample, which clearly shows the crystallinityof the sample after heat treatment. This agrees well with theXRD study.
D. Luminescence study
Figure 5 shows the excitation spectrum of 500 °Cheated 5 at. % Eu3+ doped GdVO4 sample monitoring emis-sion at 615 nm. There is a broad hump around 250–320 nmrange, which is attributed to the CT process involving the
TABLE I. The lattice parameters �a, c, Å�, unit cell volume �V, Å3� and crystallite size �d, nm� of the 500 and900 °C heated pure, and Eu3+ doped GdVO4 nanoparticles.
Eu3+
500 °C 900 °C
a c V d a c V d
0 7.213�1� 6.343�1� 330.1 47.3 7.211�1� 6.350�1� 330.2 90.02 7.216�1� 6.342�1� 330.2 47.1 7.212�1� 6.352�1� 330.4 61.05 7.218�1� 6.341�1� 330.4 41.7 7.213�1� 6.352�1� 330.5 88.77 7.219�1� 6.340�1� 330.4 23.6 7.214�1� 6.351�1� 330.6 51.610 7.221�1� 6.340�1� 330.6 26.3 7.214�1� 6.352�1� 330.7 58.415 7.220�1� 6.343�1� 330.7 24.7 7.217�1� 6.353�1� 330.9 78.820 7.222�1� 6.344�1� 330.8 30.1 7.217�1� 6.356�1� 331.0 94.630 7.224�1� 6.348�1� 331.2 25.8 7.217�1� 6.358�1� 331.1 61.740 7.224�1� 6.349�1� 331.4 26.2 7.218�1� 6.360�1� 331.3 83.450 7.227�1� 6.351�1� 331.7 37.3 7.219�1� 6.365�1� 331.7 95.0
FIG. 2. XRD patterns of �a� 500 and �b� 900 °C heated 7 at. % Eu3+ dopedGdVO4 samples.
FIG. 3. IR spectra of �a� as prepared and �b� 500 °C heated GdVO4
samples.
104307-3 Singh et al. J. Appl. Phys. 104, 104307 �2008�
Downloaded 20 Sep 2013 to 221.130.23.115. This article is copyrighted as indicated in the abstract. Reuse of AIP content is subject to the terms at: http://jap.aip.org/about/rights_and_permissions

Eu–O at around 260 nm and V–O component of the hostmaterial at around 310 nm. Above 350 nm, there are twopeaks at 398 and 468 nm shown in Fig. 4 �inset�, whichcorrespond to the f-f transitions of Eu3+. This indicates thatthere is a strong energy transfer from host to Eu3+.
Figure 6 shows the emission spectra of 500 °C heated5 at. % Eu3+ doped GdVO4 nanoparticles by excitingthrough host material at 230 nm, Eu–O CT at 260 nm, Gd3+
ion at 280 nm, V–O CT at 310 nm, and direct excitationthrough Eu3+ ion at 394 nm. The main emission peaks areobserved at 593 and 618 nm. The emission peak at 593 nmcorresponds to magnetic dipole allowed transition, 5D0
→ 7F1 while the peak at 618 nm is due to electric dipoleallowed transition 5D0→ 7F2. The emission peak at 618 nm
is dominant because crystalline GdVO4 with a space groupof I41/amd has got alternating edge-sharing VO4 tetrahedraand GdO bisdisphenoids extending parallel to c and joinedlaterally by edge-sharing bisdisphenoids. GdO8 dodecahedrahave two sets of four equal M–O bond lengths: short andlong �the point symmetry D2d of Gd3+, without inversion�.When the Eu3+ occupies the Gd3+ lattice of D2d site symme-try, it is highly asymmetric resulting to the hypersensitiveelectric dipole transition 5D0→ 7F2,4.13,34 Apart from thesepeaks, we also observed emission peaks around 539 and 558.These emission peaks correspond to the 5D1→ 7FJ �J=1,2�transition from the higher excited state of 5D1. The presenceof these weak peaks is related to the low energy vibration ofVO4
3− groups �823 cm−1�. Multiphonon relaxation by VO43−
is unable to bridge the gaps between the higher energy levels�5D1, 5D2, and 5D3� and 5D0 completely. This results in weakemission peaks from these higher levels.34 The most efficientluminescence is found when excited through V–O CT at 310nm wavelength. The intensity of the luminescence is foundto increase in the order 394230260280310 nm.
Figure 7 shows the normalized luminescence spectra of500 °C heated Eu3+ �Eu3+=2, 5, 7, 10, 15, 20, 30, 40, and50 at. %� doped nanoparticles excited through 260, 310, and394 nm, respectively. For comparison, all the luminescencespectra are normalized at 618 nm. Intensity decreases withdoping and optimum intensity is observed after excitation at310 nm when compared to those of excitations for 260 and394 nm.
To get intensity of emission at magnetic and electric di-pole transitions, there is a need to fit with suitable distribu-tion functions. The magnetic and electric dipole transitionsfollow the Gaussian distributions
I = IB +A1
w1�/2
e2��� − �c1�2/w12� +
A2
w2�/2
e2��� − �c2�2/w22�,
�1�
where I is intensity, IB is the background intensity, A is thearea, w is the width of the curve taken at half maximum. � is
FIG. 4. TEM images of �a� as prepared �bright field�, �b� 500 °C heatedGdVO4 �dark field�, and SAED �inset� of 500 °C heated GdVO4.
FIG. 5. Excitation spectrum of 500 °C heated 5 at. % Eu3+ doped GdVO4
nanoparticles monitoring at 615 nm emission.
FIG. 6. �Color online� Emission spectra of 500 °C heated 5 at. % Eu3+
doped GdVO4 nanoparticles by exciting through 230, 260, 280, 310, and394 nm.
104307-4 Singh et al. J. Appl. Phys. 104, 104307 �2008�
Downloaded 20 Sep 2013 to 221.130.23.115. This article is copyrighted as indicated in the abstract. Reuse of AIP content is subject to the terms at: http://jap.aip.org/about/rights_and_permissions

the wavelength and �c is the mean value corresponding totransition. These are fitted in the ranges 583–603 and 603–638 nm. Figure 8 shows the typical fitting to the magneticdipole and electric dipole transitions data of 5 at. % Eu3+
doped GdVO4 prepared at 500 °C after excitation at 310 nm.It fits well with �2=0.99. Values of the fitting parameters I0,A1, A2, w1, w2, �c1, and �c2 are 0, 3045.7 �counts�, 15880.1�counts�, 5.9, 8.1, 593.7, and 617.4 nm, respectively. In-details values such as the peak positions of the magneticdipole transition 5D0→ 7F1, electric dipole transition 5D0
→ 7F2 and FWHM of all as prepared, 500 and 900 °C heated
samples after fitting with Gaussian distribution are given inTable II.
The peak positions of Eu3+ emissions �electric and mag-netic dipole allowed transitions� are not affected but FWHMvalue decreases slightly as heat treatment temperature in-creases from 500 to 900 °C. Figure 9 shows the intensityarea of electric dipole allowed transition versus Eu3+ concen-tration curve of as prepared, 500, and 900 °C heat-treatedEu3+ doped GdVO4 nanoparticles obtained by Gaussiancurve fitting. All the spectra were recorded by exciting at260, 310, and 394 nm, respectively. This clearly reveals thatthere is a significant change in the area of the heat-treatedsamples where the maximum is found in the 5–10 at. % ofEu3+ and then decreases due to concentration quenching ef-fect on further increase in Eu3+. However, no such change isobserved in the as prepared sample.
The presence of H2O molecules in the as preparedsamples �as discussed earlier in the IR study� acts as primarycenters of nonradiative transition. The rate of the nonradia-tive transition rate �R0� is exponential and can be expressedas17
R0 = ae�−��E−2h�max�b�, �2�
where, a and b are constants. �E is the difference in energybetween the excited and ground states of Eu3+ ion. �max isthe highest available vibrational modes of the surroundingsof the rare earth ion. In Eu3+ ion, �E is about10 000–15 000 cm−1 and the value is comparable with thethird overtone stretching vibration of the OH �3500 cm−1�.This OH functional group arises from water molecules at-tached to the as prepared samples. Now, R0 value becomes
FIG. 7. �Color online� Normalized luminescence spectra of 500 °C heated Eu3+ �Eu3+=2, 5, 7, 10, 15, 20, 30, 40, and 50 at. %� doped GdVO4 nanoparticlesexcited through �a� 260, �b� 310, and �c� 394 nm.
FIG. 8. �Color online� Gaussian distribution fitting to magnetic dipole �583–603 nm� and electric dipole �603–638 nm� transitions data for 500 °Cheated 5 at. % Eu3+ doped GdVO4 nanoparticles. Excitation wavelength isat 310 nm.
104307-5 Singh et al. J. Appl. Phys. 104, 104307 �2008�
Downloaded 20 Sep 2013 to 221.130.23.115. This article is copyrighted as indicated in the abstract. Reuse of AIP content is subject to the terms at: http://jap.aip.org/about/rights_and_permissions

large since �E�2�max. This results in significant extent ofnonradiative transfer of energy from the excited state of Eu3+
ion to the different vibration modes of OH species leading tothe reduction in Eu3+ luminescence.
Peak area intensity is quite significantly more for largerparticles of 900 °C heated samples compared to smaller par-ticles of 500 °C heated counterparts in the optimum concen-tration range. However, the FWHM as well as peak positionsare not affected as the particles become bigger, which isevident from Table II. This increase in luminescence inten-sity on heat treatment from 500 to 900 °C is understandableas the lower the annealing temperature is, the smaller will bethe particles and thus small particles have the large surfacearea/grain boundary, leading to the significant extent of non-
radiative transitions. For bigger particles �i.e., sample heatedat 900 °C�, the extent of nonradiative transitions decreasesdue to the lower surface area and hence improvement in theluminescence intensity occurs.
Since Eu3+ occupies the D2d site symmetry, which has ahighly asymmetric environment, the electric dipole transitionbecomes very strong compared to that of magnetic dipoletransition. The asymmetric ratio of luminescence �A21� ofEu3+ is sensitive to the environment around the Eu3+ as wellas its concentration. This asymmetric ratio is defined as theratio of integrated intensity of electric dipole transition�5D0→ 7F2, which is represented by I2� to that of the mag-netic dipole transition �5D0→ 7F1, which is represented byI1�
TABLE II. Peak positions of the magnetic dipole transition �5D0→ 7F1� and electric dipole transition �5D0→ 7F2� and FWHM �w� of as prepared, 500 and900 °C heated Eu3+ doped GdVO4 samples.
Eu3+
�at. %�
As prepared 500 °C 900 °C
5D0→ 7F1 /w �nm� 5D0→ 7F2 /w �nm� 5D0→ 7F1 /w �nm� 5D0→ 7F2 /w �nm� 5D0→ 7F1 /w �nm� 5D0→ 7F2 /w �nm�
2 591/8.6 617/18.5 593/5.8 617/8.0 593/5.5 617/7.85 589/8.9 615/8.5 593/5.9 617/8.4 593/5.3 617/7.87 591/9.1 617/8.7 593/6.2 617/8.1 593/5.5 617/7.8
10 592/7.0 616/6.8 593/6.2 617/8.4 593/5.6 617/7.915 592/9.3 617/9.2 593//5.8 617/8.0 593/5.7 617/7.920 590/11.3 617/10.9 593/5.8 617/8.1 593/5.5 617/7.930 590/10.6 617/9.0 593/6.1 617/8.5 593/5.7 617/7.940 590/10.5 616/8.9 593/6.4 617/8.5 593/5.4 617/8.050 592/9.4 617/10 593/6.5 617/8.3 593/5.6 617/7.8
FIG. 9. �Color online� Intensities of electric dipole transitions �603–638 nm� vs Eu3+ concentrations of as prepared, 500, and 900 °C heated GdVO4
nanoparticles excited through �a� 260, �b� 310, and �c� 394 nm.
104307-6 Singh et al. J. Appl. Phys. 104, 104307 �2008�
Downloaded 20 Sep 2013 to 221.130.23.115. This article is copyrighted as indicated in the abstract. Reuse of AIP content is subject to the terms at: http://jap.aip.org/about/rights_and_permissions

A21 =
�603
638
I2d�
�583
603
I1d�
, �3�
where � is in wavelength. The values of I1 and I2 are calcu-lated using Eq. �1�. Figure 10 shows the asymmetric ratios ofas prepared, 500, and 900 °C heat-treated samples, respec-tively. All the spectra are recorded at 260, 310, and 394 nm.In most cases, the asymmetric ratios of heated samples arefound to be more compared to their as prepared counterparts.This increase in the asymmetric ratios of heat-treatedsamples is attributed to the increase in the occupation of Eu3+
in the lattice site of Gd3+. In Eu3+ doped GdVO4 samples,even though the intensity of luminescence reduces becauseof concentration quenching effect, asymmetric ratio cannotbe affected much.
Comparison of luminescence properties of Eu3+ dopedGdVO4 core and Eu3+ doped GdVO4 core covered withGdVO4 itself as shell was also carried out. For this 7 at. %Eu3+ doped core is covered with another GdVO4 shell. Emis-sion spectra of 500 °C heated samples through the excitationat 260, 310, and 394 nm are shown in Fig. 11. At all theexcitation wavelengths, there is a considerable increase inthe luminescence intensity of core/shell particles comparedto core particles. The same result is found in 900 °C heatedsamples �not shown here�. This is because for core-shellnanoparticles, the undoped shell around the core, removessurface inhomogenities around the lanthanide ions present onthe surface of the core effectively as well as the passivationof inevitable surface states or defects of the core nanopar-ticles by the shell covered over it. This results in improved
luminescence from core-shell nanoparticles compared to thecore nanoparticles prepared at the same temperature. Anotherreason is that a small fraction of Eu3+ available on the sur-face of the core in the core-shell nanoparticles can migrate tothe GdVO4 shell leading to the increase in Eu3+–Eu3+ dis-tance and hence reducing the extent of quenching. Such im-provement of the luminescence property of the core/shellparticles over the core particles have been observed in cad-mium sulphide and selenide based semiconductor phosphorsby other groups as well.4,35,36
Photoluminescence decay curves for 5D0→ 7F2 �618 nmemission� of core GdVO4:Eu3+ �7 at. %� and its core/shell
FIG. 10. �Color online� Asymmetric ratio vs Eu3+ concentrations of �a� as prepared, �b� 500 °C heated, and �c� 900 °C heated GdVO4 nanoparticles excitedthrough 260, 310, and 394 nm.
FIG. 11. �Color online� Comparison of luminescence intensities of core�7 at. % Eu3+ doped GdVO4� and core/shell �7 at. % Eu3+ doped GdVO4
covered with undoped GdVO4� heated at 500 °C excited through �a� 260,�b� 310, and �c� 394 nm.
104307-7 Singh et al. J. Appl. Phys. 104, 104307 �2008�
Downloaded 20 Sep 2013 to 221.130.23.115. This article is copyrighted as indicated in the abstract. Reuse of AIP content is subject to the terms at: http://jap.aip.org/about/rights_and_permissions

�GdVO4:Eu3+ /GdVO4� annealed at 500 and 900 °C whenexcited at 310 nm are shown in Fig. 12. It is fitted with thesingle exponential decay equation
It = I0e−t/ , �4�
where It is the intensity at time t, I0 is the intensity at t=0,and is the decay lifetime for 5D0→ 7F2 transition of Eu3+.The fitting parameters are given in Table III for all samples.The lifetime � � for core-500 °C, core/shell-500 °C,core-900 °C, and core/shell-900 °C are 0.583, 0.657, 0.834,and 0.858 ms, respectively. Our results are in agreement withreported values of GdVO4:Eu3+ /SiO2, SiO2 /GdVO4:Eu3+,and LnF3:Eu3+ /LaF3.22,37,38 It concludes the following: �i�upon annealing, the decay lifetime increases and �ii� the core/shell improves the decay lifetime compared to their corecounterparts. The former can be explained to the reduction innonradiative process during annealing. The latter can be ex-plained to extend of the reduction in quenching centers arosefrom the defect and surface surrounding the Eu3+.
IV. CONCLUSIONS
We have investigated the luminescence properties ofEu3+ doped GdVO4 nanoparticles as a function of Eu3+ con-centration. Optimum concentration of Eu3+ is found to lie inthe range of 5–10 at. %. There is an increase in the lumi-nescence intensity with the increase in heat treatment. Thishas been attributed to the increase in the substitution of Gd3+
lattice sites by Eu3+. Enhancement in the luminescence in-tensity is observed for the core/shell nanoparticles comparedto core nanoparticles and this has been attributed to the re-moval of surface inhomogenities of Eu3+ surroundings bybinding to the undoped shells. Decay lifetimes � � ofcore-500 °C, core/shell-500 °C, core-900 °C, andcore/shell-900 °C are found to be 0.583, 0.657, 0.834, and0.858 ms, respectively.
ACKNOWLEDGMENTS
The authors thank Dr. T. Mukherjee �Director, ChemistryGroup, BARC� and Dr. D. Das �Head, Chemistry Division,BARC� for their encouragement during this work.
1A. P. Alivisatos, Science 271, 933 �1996�.2A. P. Alivisatos, K. P. Johnson, X. Peng, T. Wilson, C. J. Loweth, M. P.Bruchez, Jr., and P. G. Schultz, Nature �London� 382, 609 �1996�.
3Z. Deng, L. Cao, F. Tang, and B. Zou, J. Phys. Chem. B 109, 16671�2005�.
4B. O. Dabbousi, J. Rodriguez-Viejo, F. V. Mikulec, J. R. Heine, H. Mat-toushi, R. Ober, K. F. Jensen, and M. G. Bawendi, J. Phys. Chem. B 101,9463 �1997�.
5R. Rossetti, R. Hull, J. M. Gibson, and L. E. Brus, J. Chem. Phys. 82, 552�1985�.
6A. P. Alivisatos, J. Phys. Chem. 100, 13226 �1996�.7L. R. Singh, R. S. Ningthoujam, V. Sudarsan, I. Srivastava, S. D. Singh, G.K. Dey, and S. K. Kulshreshtha, Nanotechnnology 19, 055201 �2008�.
8L. Sun, Y. Zhang, J. Zhang, C. Yan, C. Liao, and Y. Lu, Solid State
TABLE III. Fitting parameters of lifetime for 5D0 level �618 nm emission�of 500 and 900 °C heated core �GdVO4:Eu3+ 7 at. %� and core/shell�GdVO4:Eu3+ 7 at. % /GdVO4� when exited at 310 nm. The �2 is the good-ness of parameters.
Sample �ms��IA� counts
�0.2% error� �2
Core-500 °C 0.583�1� 116 453 0.992 48Core/shell-500 °C 0.647�1� 117 601 0.995 33Core-900 °C 0.834�1� 120 349 0.999 29Core/shell-900 °C 0.858�1� 121 783 0.999 56
FIG. 12. Decay curve for 5D0 level �618 nm emission� of �a� core-500 °C, �b� core/shell-500 °C, �c� core-900 °C, and �d� core/shell-500 °C heated 7 at. %Eu3+ doped GdVO4.
104307-8 Singh et al. J. Appl. Phys. 104, 104307 �2008�
Downloaded 20 Sep 2013 to 221.130.23.115. This article is copyrighted as indicated in the abstract. Reuse of AIP content is subject to the terms at: http://jap.aip.org/about/rights_and_permissions
Commun. 124, 35 �2002�.9V. I. Vlasov, Y. D. Zavartsev, A. I. Zagumennyǐ, P. A. Studenikin, I. A.Shcherbakov, C. P. Wyss, W. Luthy, and H. P. Weber, Quantum Electron.29, 301 �1999�.
10T. Minami, T. Miyata, Y. Suzuki, and Y. Mochizuki, Thin Solid Films469–470, 65 �2004�.
11R. N. Bhargava, D. Gallagher, X. Hong, and A. Nurmikko, Phys. Rev.Lett. 72, 416 �1994�.
12J. A. Baglio and G. Gashurov, Acta Crystallogr., Sect. B: Struct. Crystal-logr. Cryst. Chem. 24, 292 �1968�.
13B. C. Chakoumakos, M. M. Abraham, and L. A. Boatner, J. Solid StateChem. 109, 197 �1994�.
14W. Xu, X. Xu, J. Wang, F. Wu, L. Su, G. Zhao, Z. Zhao, G. Zhou, and J.Xu, J. Alloys Compd. 440, 319 �2007�.
15B. Liu, C. Shi, Q. Zhang, and Y. Chen, J. Alloys Compd. 333, 215 �2002�.16X. Su, B. Yan, and H. Huang, J. Alloys Compd. 399, 251 �2005�.17G. Blasse and B. C. Grabmaier, Luminescent Materials �Springer Verlag,
Berlin, 1994�.18S. S. Yi, J. S. Bae, K. S. Shim, B. K. Moon, H. J. Seo, J. H. Jeong, and J.
H. Kim, J. Alloys Compd. 408–412, 890 �2006�.19J. H. V. Vleck, J. Phys. Chem. 41, 67 �1937�.20G. H. Dieke, Spectra & Energy Levels of Rare Earth Ions in Crystals
�InterScience, New York, 1968�.21G. Wakefield, H. A. Kerson, P. J. Dobson, and J. L. Hutchison, J. Colloid
Interface Sci. 215, 179 �1999�.22G. Liu, G. Hong, J. Wang, and X. Dong, Nanotechnology 17, 3134 �2006�.23S. Osawa, T. Katsumata, T. Iyoda, Y. Enoki, S. Komuro, and T. Morikawa,
J. Cryst. Growth 198–199, 444 �1999�.
24R. S. Ningthoujam, V. Sudarsan, S. V. Godbole, L. Kienle, S. K.Kulshreshtha, and A. K. Tyagi, Appl. Phys. Lett. 90, 173113 �2007�.
25N. S. Gajbhiye, R. S. Ningthoujam, A. Ahmed, D. K. Panda, S. S. Umre,and S. J. Sharma, Pramana 70, 313 �2008�.
26L. R. Singh, R. S. Ningthoujam, V. Sudarsan, S. D. Singh, and S. K.Kulshreshtha, J. Lumin. 128, 1544 �2008�.
27R. S. Ningthoujam, V. Sudarsan, A. Vinu, P. Srinivasu, K. Ariga, S. K.Kulshreshtha, and A. K. Tyagi, J. Nanosci. Nanotechnol. 8, 1 �2007�.
28R. S. Ningthoujam, V. Sudarsan, and S. K. Kulshreshtha, J. Lumin. 127,747 �2007�.
29R. S. Ningthoujam, N. S. Gajbhiye, A. Ahmed, S. S. Umre, and S. J.Sharma, J. Nanosci. Nanotechnol. 8, 3059 �2008�.
30R. D. Shannon and C. T. Prewitt, Acta Crystallogr., Sect B: Struct. Crys-tallogr. Cryst. Chem. 25, 925 �1969�.
31H. Guo, X. Yang, T. Xiao, W. Zhang, L. Lou, and J. Mugnier, Appl. Surf.Sci. 230, 215 �2004�.
32V. Brazdova, M. V. Ganduglia-Pirovano, and J. Sauer, Phys. Rev. B 69,165420 �2004�.
33W. Kemp, Organic Spectroscopy �Macmillan, Hampshire, 1987�.34M. Yu, J. Lin, Z. Wang, J. Fu, S. Wang, H. J. Zhang, and Y. C. Han, Chem.
Mater. 14, 2224 �2002�.35X. Peng, M. C. Schlamp, A. V. Kadavanich, and A. P. Alivisatos, J. Am.
Chem. Soc. 119, 7019 �1997�.36H. Yang and P. H. Holloway, Appl. Phys. Lett. 82, 1965 �2003�.37G. Li, Z. Wang, M. Yu, Z. Quan, and J. Lin, J. Solid State Chem. 179,
2698 �2006�.38V. Sudarsan, S. Sivakumar, and F. C. J. M. Van Veggel, Chem. Mater. 17,
4736 �2005�.
104307-9 Singh et al. J. Appl. Phys. 104, 104307 �2008�
Downloaded 20 Sep 2013 to 221.130.23.115. This article is copyrighted as indicated in the abstract. Reuse of AIP content is subject to the terms at: http://jap.aip.org/about/rights_and_permissions
Copyright © 2022 FDOKUMEN