
Optically stimulated luminescence (OSL) and thermally assisted OSL in Eu2+ – Doped BaSO4 phosphor
9
Optically stimulated luminescence (OSL) and thermally assisted OSL in Eu 2þ e Doped BaSO 4 phosphor B.C. Bhatt a, * , Anuj Soni b , G.S. Polymeris f , D.K. Koul c , D.K. Patel e , S.K. Gupta d , D.R. Mishra b , M.S. Kulkarni b a C/o Radiological Physics and Advisory Division, Bhabha Atomic Research Centre, Mumbai, India b Radiological Physics and Advisory Division, Bhabha Atomic Research Centre, Mumbai, India c Astrophysics Division, Bhabha Atomic Research Centre, Mumbai, India d Technical Physics Division, Bhabha Atomic Research Centre, Mumbai, India e Chemistry Division, Bhabha Atomic Research Centre, Mumbai, India f Institute of Nuclear Sciences, Ankara University, Tandogan Campus, 06100 Ankara, Turkey highlights The OSL sensitivity is 75% of that of a-Al 2 O 3 :C. 4 times more sensitive than a-Al 2 O 3 :C and 6 times of CaSO 4 :Dy in TL mode. The temperature dependence of OSL has been discussed. High sensitivity and fast luminescence lifetime (40 ms) can be used for imaging applications. article info Article history: Received 24 January 2014 Received in revised form 4 March 2014 Accepted 4 April 2014 Keywords: Photo-ionization cross-section Thermally assisted OSL (TA-OSL) abstract BaSO 4 :Eu 2þ phosphor has been investigated for its photoluminescence (PL), thermoluminescence (TL), TL kinetics, optically stimulated luminescence (OSL) and thermally assisted OSL (TA-OSL) response. PL spectra showed the characteristic emission of Eu 2þ ion at 375 nm when excited by 320 nm. The lumi- nescence lifetime has been measured as 40 and 628 ms of fast and slow components respectively. The TL parameters such as trap depth (E), frequency factor (s) and the order of kinetics (b) are determined. The phosphor is found to be 6 and 4 times more sensitive than CaSO 4 :Dy and a-Al 2 O 3 :C, respectively, in TL mode. However, its OSL sensitivity is 75% of a-Al 2 O 3 :C. It is found to possess three OSL components having photoionization cross-sections of 1.4 10 17 , 1.2 10 18 and 5.2 10 19 cm 2 respectively. The temperature dependence of OSL studies showed that integrated TA-OSL signal increases with stimulation temperature between 50 and 250 C, while between 260 and 450 C the signal intensity decreases. This behavior is interpreted to arise from competing effects of thermal assistance (activation energy E A ¼ 0.063 0.0012 eV) and depletion of trapped charges. This increase of OSL at elevated temperature can be employed for enhancing the sensitivity of phosphor for radiation dosimetry. Ó 2014 Elsevier Ltd. All rights reserved. 1. Introduction Eu 2þ e doped phosphors have been investigated for their TL and OSL response. This is possibly due to the allowed nature of 4f 6 5d /4f 7 transition on Eu 2þ ion. Also, the emission spectra of Eu 2þ doped phosphors lie in the peaking region of the response of commonly available photomultiplier tubes (PMTs). Therefore, Eu 2þ -doped phosphors yield good PL and TL. In Eu 2þ e doped CaSO 4 and BaSO 4 phosphors, the TL intensity of the most prominent peak is higher in Eu 2þ -doped samples than that in the corre- sponding Eu 3þ e doped samples (Dhopte et al., 1991; Atone et al., 1993). This could be partly due to better detector efficiency of PMT for the blue emission in Eu 2þ -doped phosphors than that for the Eu 3þ -doped samples, as most of the commercial TL readout systems give peak emission sensitivity in the region 400e420 nm. These authors also report that mechanism of UV induced TL seems to be different from that of gamma induced TL in Eu-doped samples synthesized by them. Okamoto et al. (1986) reported the * Corresponding author. Tel.: þ91 2225593917. E-mail address: [email protected] (B.C. Bhatt). Contents lists available at ScienceDirect Radiation Measurements journal homepage: www.elsevier.com/locate/radmeas http://dx.doi.org/10.1016/j.radmeas.2014.04.004 1350-4487/Ó 2014 Elsevier Ltd. All rights reserved. Radiation Measurements 64 (2014) 35e43
Transcript of Optically stimulated luminescence (OSL) and thermally assisted OSL in Eu2+ – Doped BaSO4 phosphor

lable at ScienceDirect
Radiation Measurements 64 (2014) 35e43
Contents lists avai
Radiation Measurements
journal homepage: www.elsevier .com/locate/radmeas
Optically stimulated luminescence (OSL) and thermally assisted OSLin Eu2þ e Doped BaSO4 phosphor
B.C. Bhatt a,*, Anuj Soni b, G.S. Polymeris f, D.K. Koul c, D.K. Patel e, S.K. Gupta d,D.R. Mishra b, M.S. Kulkarni b
aC/o Radiological Physics and Advisory Division, Bhabha Atomic Research Centre, Mumbai, IndiabRadiological Physics and Advisory Division, Bhabha Atomic Research Centre, Mumbai, IndiacAstrophysics Division, Bhabha Atomic Research Centre, Mumbai, Indiad Technical Physics Division, Bhabha Atomic Research Centre, Mumbai, IndiaeChemistry Division, Bhabha Atomic Research Centre, Mumbai, Indiaf Institute of Nuclear Sciences, Ankara University, Tandogan Campus, 06100 Ankara, Turkey
h i g h l i g h t s
� The OSL sensitivity is 75% of that of a-Al2O3:C.� 4 times more sensitive than a-Al2O3:C and 6 times of CaSO4:Dy in TL mode.� The temperature dependence of OSL has been discussed.� High sensitivity and fast luminescence lifetime (40 ms) can be used for imaging applications.
a r t i c l e i n f o
Article history:Received 24 January 2014Received in revised form4 March 2014Accepted 4 April 2014
Keywords:Photo-ionization cross-sectionThermally assisted OSL (TA-OSL)
* Corresponding author. Tel.: þ91 2225593917.E-mail address: [email protected] (B.C. Bha
http://dx.doi.org/10.1016/j.radmeas.2014.04.0041350-4487/� 2014 Elsevier Ltd. All rights reserved.
a b s t r a c t
BaSO4:Eu2þ phosphor has been investigated for its photoluminescence (PL), thermoluminescence (TL), TL
kinetics, optically stimulated luminescence (OSL) and thermally assisted OSL (TA-OSL) response. PLspectra showed the characteristic emission of Eu2þ ion at 375 nm when excited by 320 nm. The lumi-nescence lifetime has been measured as 40 and 628 ms of fast and slow components respectively. The TLparameters such as trap depth (E), frequency factor (s) and the order of kinetics (b) are determined. Thephosphor is found to be 6 and 4 times more sensitive than CaSO4:Dy and a-Al2O3:C, respectively, in TLmode. However, its OSL sensitivity is 75% of a-Al2O3:C. It is found to possess three OSL componentshaving photoionization cross-sections of 1.4 � 10�17, 1.2 � 10�18 and 5.2 � 10�19 cm2 respectively. Thetemperature dependence of OSL studies showed that integrated TA-OSL signal increases with stimulationtemperature between 50 and 250 �C, while between 260 and 450 �C the signal intensity decreases. Thisbehavior is interpreted to arise from competing effects of thermal assistance (activation energyEA ¼ 0.063 � 0.0012 eV) and depletion of trapped charges. This increase of OSL at elevated temperaturecan be employed for enhancing the sensitivity of phosphor for radiation dosimetry.
� 2014 Elsevier Ltd. All rights reserved.
1. Introduction
Eu2þ e doped phosphors have been investigated for their TL andOSL response. This is possibly due to the allowed nature of 4f65d/4f7 transition on Eu2þ ion. Also, the emission spectra of Eu2þ
doped phosphors lie in the peaking region of the response ofcommonly available photomultiplier tubes (PMTs). Therefore,
tt).
Eu2þ-doped phosphors yield good PL and TL. In Eu2þ e dopedCaSO4 and BaSO4 phosphors, the TL intensity of themost prominentpeak is higher in Eu2þ-doped samples than that in the corre-sponding Eu3þ e doped samples (Dhopte et al., 1991; Atone et al.,1993). This could be partly due to better detector efficiency ofPMT for the blue emission in Eu2þ-doped phosphors than that forthe Eu3þ -doped samples, as most of the commercial TL readoutsystems give peak emission sensitivity in the region 400e420 nm.These authors also report that mechanism of UV induced TL seemsto be different from that of gamma induced TL in Eu-doped samplessynthesized by them. Okamoto et al. (1986) reported the
390 440 490 540 590 6400.0
2.0x10⁴
4.0x10⁴
6.0x10⁴
8.0x10⁴
1.0x10⁵
1.2x10⁵
1.4x10⁵
Emis
sion
Inte
nsity
(a.u
)
Wavelength (nm)
Emision at 375 nm, excited by 320 nm
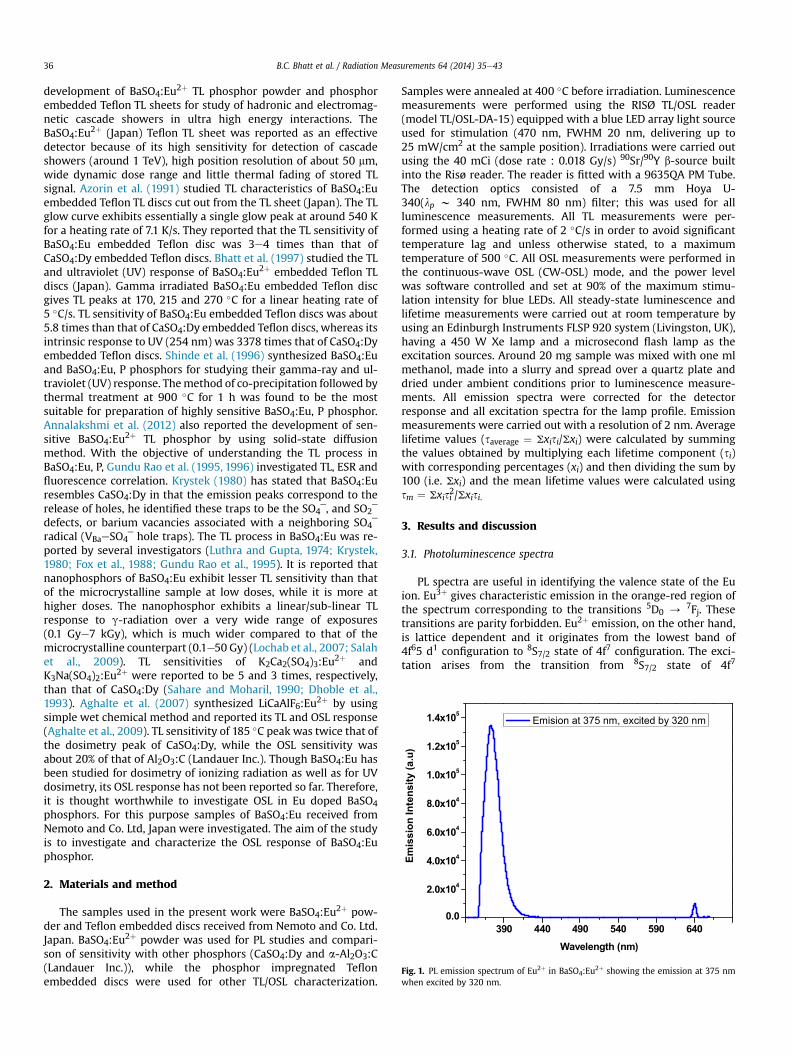
Fig. 1. PL emission spectrum of Eu2þ in BaSO4:Eu2þ showing the emission at 375 nmwhen excited by 320 nm.
B.C. Bhatt et al. / Radiation Measurements 64 (2014) 35e4336
development of BaSO4:Eu2þ TL phosphor powder and phosphorembedded Teflon TL sheets for study of hadronic and electromag-netic cascade showers in ultra high energy interactions. TheBaSO4:Eu2þ (Japan) Teflon TL sheet was reported as an effectivedetector because of its high sensitivity for detection of cascadeshowers (around 1 TeV), high position resolution of about 50 mm,wide dynamic dose range and little thermal fading of stored TLsignal. Azorin et al. (1991) studied TL characteristics of BaSO4:Euembedded Teflon TL discs cut out from the TL sheet (Japan). The TLglow curve exhibits essentially a single glow peak at around 540 Kfor a heating rate of 7.1 K/s. They reported that the TL sensitivity ofBaSO4:Eu embedded Teflon disc was 3e4 times than that ofCaSO4:Dy embedded Teflon discs. Bhatt et al. (1997) studied the TLand ultraviolet (UV) response of BaSO4:Eu2þ embedded Teflon TLdiscs (Japan). Gamma irradiated BaSO4:Eu embedded Teflon discgives TL peaks at 170, 215 and 270 �C for a linear heating rate of5 �C/s. TL sensitivity of BaSO4:Eu embedded Teflon discs was about5.8 times than that of CaSO4:Dy embedded Teflon discs, whereas itsintrinsic response to UV (254 nm) was 3378 times that of CaSO4:Dyembedded Teflon discs. Shinde et al. (1996) synthesized BaSO4:Euand BaSO4:Eu, P phosphors for studying their gamma-ray and ul-traviolet (UV) response. Themethod of co-precipitation followed bythermal treatment at 900 �C for 1 h was found to be the mostsuitable for preparation of highly sensitive BaSO4:Eu, P phosphor.Annalakshmi et al. (2012) also reported the development of sen-sitive BaSO4:Eu2þ TL phosphor by using solid-state diffusionmethod. With the objective of understanding the TL process inBaSO4:Eu, P, Gundu Rao et al. (1995, 1996) investigated TL, ESR andfluorescence correlation. Krystek (1980) has stated that BaSO4:Euresembles CaSO4:Dy in that the emission peaks correspond to therelease of holes, he identified these traps to be the SO4‾, and SO2‾
defects, or barium vacancies associated with a neighboring SO4‾
radical (VBaeSO4‾ hole traps). The TL process in BaSO4:Eu was re-ported by several investigators (Luthra and Gupta, 1974; Krystek,1980; Fox et al., 1988; Gundu Rao et al., 1995). It is reported thatnanophosphors of BaSO4:Eu exhibit lesser TL sensitivity than thatof the microcrystalline sample at low doses, while it is more athigher doses. The nanophosphor exhibits a linear/sub-linear TLresponse to g-radiation over a very wide range of exposures(0.1 Gye7 kGy), which is much wider compared to that of themicrocrystalline counterpart (0.1e50 Gy) (Lochab et al., 2007; Salahet al., 2009). TL sensitivities of K2Ca2(SO4)3:Eu2þ andK3Na(SO4)2:Eu2þ were reported to be 5 and 3 times, respectively,than that of CaSO4:Dy (Sahare and Moharil, 1990; Dhoble et al.,1993). Aghalte et al. (2007) synthesized LiCaAlF6:Eu2þ by usingsimple wet chemical method and reported its TL and OSL response(Aghalte et al., 2009). TL sensitivity of 185 �C peak was twice that ofthe dosimetry peak of CaSO4:Dy, while the OSL sensitivity wasabout 20% of that of Al2O3:C (Landauer Inc.). Though BaSO4:Eu hasbeen studied for dosimetry of ionizing radiation as well as for UVdosimetry, its OSL response has not been reported so far. Therefore,it is thought worthwhile to investigate OSL in Eu doped BaSO4phosphors. For this purpose samples of BaSO4:Eu received fromNemoto and Co. Ltd, Japan were investigated. The aim of the studyis to investigate and characterize the OSL response of BaSO4:Euphosphor.
2. Materials and method
The samples used in the present work were BaSO4:Eu2þ pow-der and Teflon embedded discs received from Nemoto and Co. Ltd.Japan. BaSO4:Eu2þ powder was used for PL studies and compari-son of sensitivity with other phosphors (CaSO4:Dy and a-Al2O3:C(Landauer Inc.)), while the phosphor impregnated Teflonembedded discs were used for other TL/OSL characterization.
Samples were annealed at 400 �C before irradiation. Luminescencemeasurements were performed using the RISØ TL/OSL reader(model TL/OSL-DA-15) equipped with a blue LED array light sourceused for stimulation (470 nm, FWHM 20 nm, delivering up to25 mW/cm2 at the sample position). Irradiations were carried outusing the 40 mCi (dose rate : 0.018 Gy/s) 90Sr/90Y b-source builtinto the Risø reader. The reader is fitted with a 9635QA PM Tube.The detection optics consisted of a 7.5 mm Hoya U-340(lp w 340 nm, FWHM 80 nm) filter; this was used for allluminescence measurements. All TL measurements were per-formed using a heating rate of 2 �C/s in order to avoid significanttemperature lag and unless otherwise stated, to a maximumtemperature of 500 �C. All OSL measurements were performed inthe continuous-wave OSL (CW-OSL) mode, and the power levelwas software controlled and set at 90% of the maximum stimu-lation intensity for blue LEDs. All steady-state luminescence andlifetime measurements were carried out at room temperature byusing an Edinburgh Instruments FLSP 920 system (Livingston, UK),having a 450 W Xe lamp and a microsecond flash lamp as theexcitation sources. Around 20 mg sample was mixed with one mlmethanol, made into a slurry and spread over a quartz plate anddried under ambient conditions prior to luminescence measure-ments. All emission spectra were corrected for the detectorresponse and all excitation spectra for the lamp profile. Emissionmeasurements were carried out with a resolution of 2 nm. Averagelifetime values (saverage ¼ Sxisi/Sxi) were calculated by summingthe values obtained by multiplying each lifetime component (si)with corresponding percentages (xi) and then dividing the sum by100 (i.e. Sxi) and the mean lifetime values were calculated usingsm ¼ Sxisi2/Sxisi.
3. Results and discussion
3.1. Photoluminescence spectra
PL spectra are useful in identifying the valence state of the Euion. Eu3þ gives characteristic emission in the orange-red region ofthe spectrum corresponding to the transitions 5D0 / 7Fj. Thesetransitions are parity forbidden. Eu2þ emission, on the other hand,is lattice dependent and it originates from the lowest band of4f65 d1 configuration to 8S7/2 state of 4f7 configuration. The exci-tation arises from the transition from 8S7/2 state of 4f7
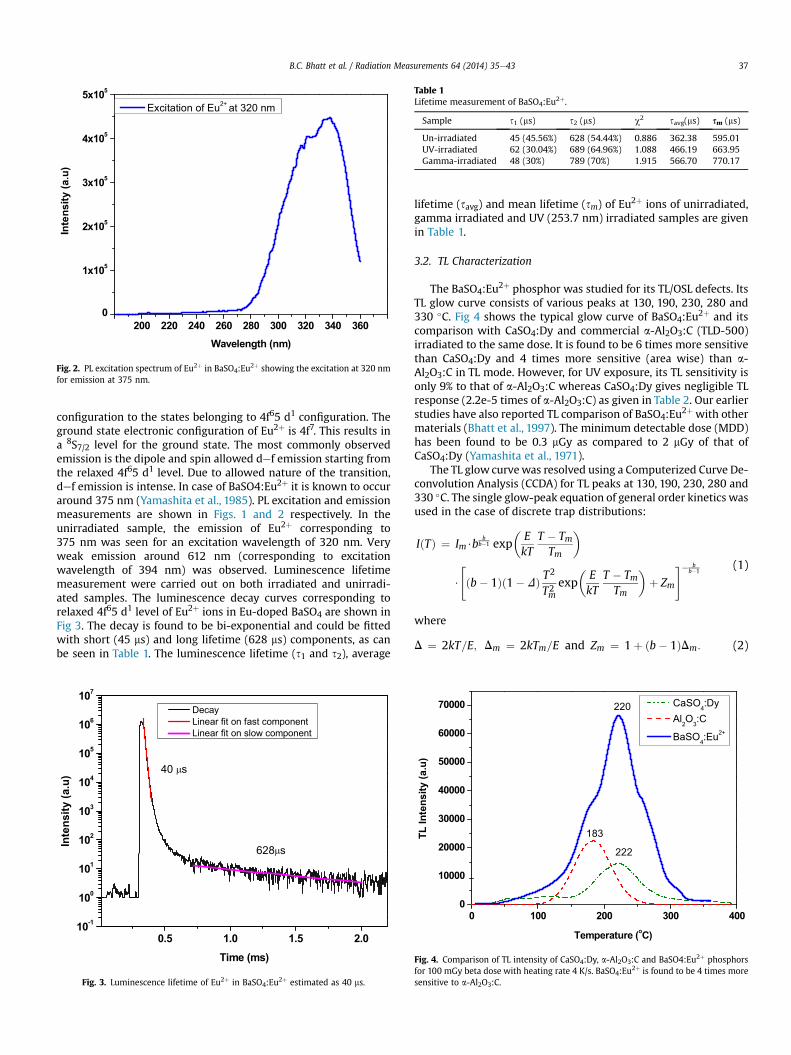
Table 1Lifetime measurement of BaSO4:Eu2þ.
Sample s1 (ms) s2 (ms) c2 savg(ms) sm (ms)
Un-irradiated 45 (45.56%) 628 (54.44%) 0.886 362.38 595.01UV-irradiated 62 (30.04%) 689 (64.96%) 1.088 466.19 663.95Gamma-irradiated 48 (30%) 789 (70%) 1.915 566.70 770.17
200 220 240 260 280 300 320 340 3600
1x10⁵
2x10⁵
3x10⁵
4x10⁵
5x10⁵
Inte
nsity
(a.u
)
Wavelength (nm)
Excitation of Eu2+ at 320 nm
Fig. 2. PL excitation spectrum of Eu2þ in BaSO4:Eu2þ showing the excitation at 320 nmfor emission at 375 nm.
B.C. Bhatt et al. / Radiation Measurements 64 (2014) 35e43 37
configuration to the states belonging to 4f65 d1 configuration. Theground state electronic configuration of Eu2þ is 4f7. This results ina 8S7/2 level for the ground state. The most commonly observedemission is the dipole and spin allowed def emission starting fromthe relaxed 4f65 d1 level. Due to allowed nature of the transition,def emission is intense. In case of BaSO4:Eu2þ it is known to occuraround 375 nm (Yamashita et al., 1985). PL excitation and emissionmeasurements are shown in Figs. 1 and 2 respectively. In theunirradiated sample, the emission of Eu2þ corresponding to375 nm was seen for an excitation wavelength of 320 nm. Veryweak emission around 612 nm (corresponding to excitationwavelength of 394 nm) was observed. Luminescence lifetimemeasurement were carried out on both irradiated and unirradi-ated samples. The luminescence decay curves corresponding torelaxed 4f65 d1 level of Eu2þ ions in Eu-doped BaSO4 are shown inFig 3. The decay is found to be bi-exponential and could be fittedwith short (45 ms) and long lifetime (628 ms) components, as canbe seen in Table 1. The luminescence lifetime (s1 and s2), average
0.5 1.0 1.5 2.010-1
100
101
102
103
104
105
106
107
Inte
nsity
(a.u
)
Time (ms)
Decay Linear fit on fast component Linear fit on slow component
40 s
628 sµ
µ
Fig. 3. Luminescence lifetime of Eu2þ in BaSO4:Eu2þ estimated as 40 ms.
lifetime (savg) and mean lifetime (sm) of Eu2þ ions of unirradiated,gamma irradiated and UV (253.7 nm) irradiated samples are givenin Table 1.
3.2. TL Characterization
The BaSO4:Eu2þ phosphor was studied for its TL/OSL defects. ItsTL glow curve consists of various peaks at 130, 190, 230, 280 and330 �C. Fig 4 shows the typical glow curve of BaSO4:Eu2þ and itscomparison with CaSO4:Dy and commercial a-Al2O3:C (TLD-500)irradiated to the same dose. It is found to be 6 times more sensitivethan CaSO4:Dy and 4 times more sensitive (area wise) than a-Al2O3:C in TL mode. However, for UV exposure, its TL sensitivity isonly 9% to that of a-Al2O3:C whereas CaSO4:Dy gives negligible TLresponse (2.2e-5 times of a-Al2O3:C) as given in Table 2. Our earlierstudies have also reported TL comparison of BaSO4:Eu2þ with othermaterials (Bhatt et al., 1997). The minimum detectable dose (MDD)has been found to be 0.3 mGy as compared to 2 mGy of that ofCaSO4:Dy (Yamashita et al., 1971).
The TL glow curvewas resolved using a Computerized Curve De-convolution Analysis (CCDA) for TL peaks at 130, 190, 230, 280 and330 �C. The single glow-peak equation of general order kinetics wasused in the case of discrete trap distributions:
IðTÞ ¼ Im$bb
b�1 exp�
EkT
T � TmTm
�
$
"ðb� 1Þð1� DÞ T
2
T2mexp
�EkT
T � TmTm
�þ Zm
#� bb�1
(1)
where
D ¼ 2kT=E; Dm ¼ 2kTm=E and Zm ¼ 1þ ðb� 1ÞDm: (2)
0 100 200 300 4000
10000
20000
30000
40000
50000
60000
70000
TL In
tens
ity (a
.u)
Temperature (oC)
CaSO4:Dy Al2O3:C
BaSO4:Eu2+
222
183
220
Fig. 4. Comparison of TL intensity of CaSO4:Dy, a-Al2O3:C and BaSO4:Eu2þ phosphorsfor 100 mGy beta dose with heating rate 4 K/s. BaSO4:Eu2þ is found to be 4 times moresensitive to a-Al2O3:C.

0 50 100 150 2000
200000
400000
600000
800000
1000000
y = 79.9*exp(-x/0.144) + 320211*exp(-x/13.98) + 193241.7*exp(-x/36.67) + 18352
CW
-OSL
Inte
nsity
(a.u
)
Time (s)
BaSO4:Eu2+
Dose 200 mGy OSL 3rd Order Exponential Fit
Fig. 6. CW-OSL response of BaSO4:Eu2þ for 200 mGy beta dose. The 3rd order expo-nential fit on the decay curve shows the presence of three components.
Table 2TL kinetics parameters of BaSO4:Eu2þ by peak fitting method.
Measured TLparameters
BaSO4:Eu2þ
130 �C 190 �C 220 �C 280 �C 330 �C
Em(eV) 0.5 1 1.2 1.19 2S (sec�1) 4.6 � 105 3.7 � 1010 3.7 � 1011 3.03 � 1010 2.5 � 1016
mg 0.48 0.42 0.48 0.48 0.52b 1.5 1.001 1.5 1.5 2
B.C. Bhatt et al. / Radiation Measurements 64 (2014) 35e4338
Eq. (1), suggested by Kitis et al. (1998), is an analytical expres-sion that could be used for CCDA in the case of single-value energytrap depth associated with the localized states, with each crystal-line phase of a TL material, corresponding to a discrete trap dis-tribution. All curve fittings were performed using the softwarepackage Microsoft Excel, with the Solver utility (Afouxenidis et al.,2012), while the goodness of fit was tested using the Figure of Merit(FOM) of Balian and Eddy (1977). The obtained FOM values werebetter than 1.5%. Fig. 5a presents a typical TL glow curve de-convolved into its individual peaks. A total of 5 individual TLpeak-components were used; this was the minimum number ofpeaks required in order to perform a quality fit. Fig. 5b gives theresiduals of the fitting.
50 100 150 200 250 300 350
0
200000
400000
600000
800000
1000000
1200000
TL (a
.u.)
Temperature (oC)
(a)
50 100 150 200 250 300 350-5.0
-2.5
0.0
2.5
5.0
Res
idua
ls (%
)
Temperature (oC)
(b)
Fig. 5. (a) TL glow curve of BaSO4:Eu2þ de-convolved into its five individual compo-nents according to equations corresponding to discrete general order kinetics trapdistribution. Open circles experimental points and solid lines the fit and each indi-vidual TL glow peak. (b) Residuals of the fitting.
3.3. OSL Characterization
The sample was studied for its OSL response using blue LEDstimulation (470 nm). Fig. 6 shows the typical CW-OSL response ofBaSO4:Eu2þ for 200 mGy beta dose. It is found to possess three OSLcomponents having photoionization cross-sections of 1.4 � 10�17,1.2 � 10�18 and 5.2 � 10�19 cm2 respectively. The 3rd order expo-nential fit on the decay curve shows the presence of three com-ponents. Its OSL sensitivity for beta/gamma exposure is found to be75% of commercial a-Al2O3:C (Fig. 7), while for UV exposure of254 nm, it is 25% to that of a-Al2O3:C. Table 3 gives the comparisonof TL/OSL sensitivities for beta as well as UV exposure. The samplehas been found to give linear dose response upto 30 Gy in OSLmode (Fig. 8). In order to find the OSL active traps i.e., the TL peakscontributing the OSL signal, samplewas subjected to OSL readout atvarious readout temperatures by pre-heating the sample up to thepreset temperatures as shown in Fig. 9. It clear from Fig. 9 that thephosphor gives OSL even after its TL readout up to 380 �C sug-gesting the existence of deeper defects. Out of three OSL compo-nents, one has very fast photoionization cross-section and decays in
0 20 40 60 80 1000.0
2.0x10⁵
4.0x10⁵
6.0x10⁵
8.0x10⁵
1.0x10⁶
OSL
Inte
nsity
(a.u
)
Time (s)
Al2O3:C
BaSO4:Eu2+
Fig. 7. Comparison of OSL signal for Al2O3:C and BaSO4:Eu2þ phosphors. OSL fromBaSO4:Eu2þ is 75% to that of a-Al2O3:C.

50 100 150 200 250 300 350
106
107
108
OSL
Inte
nsity
(a.u
)
Temperature ( oC)
Fig. 9. OSL intensity of BaSO4:Eu2þ at various readout temperatures by pre heating thesample up to the pre-set temperatures. It is clear that OSL is not zero even at 350 �Csuggesting the presence of deeper defects.
Table 3Comparison of TL/OSL sensitivities of various phosphors.
Phosphors TL sensitivity OSL sensitivity
Beta UV Beta UV
CaSO4:Dy 0.76 2.2E-5 e e
a-Al2O3:C 1 1 1 1BaSO4:Eu2þ 4.3 0.09 0.74 0.25
B.C. Bhatt et al. / Radiation Measurements 64 (2014) 35e43 39
1 s for stimulation with 48 mW/cm2 while the slower componentstake very long time to decay out. In sedimentary quartz Wintle andMurray (1997) reported a linear correlation between the loss of TLfrom the rapidly bleaching peak at 310 �C and integrated OSL, byusing stimulation times between 0.1 and 100 s. Similar studies havebeen reported by Koul et al. (2014). Hence, in order to find out thepeak/traps responsible for fastest component, the beta-irradiatedsample was subjected to blue light stimulation for various stimu-lation time durations of 1, 5, 10, 100, 500 , 1000 and 2000 s followedby subsequent TL (Fig.10a). Fig.10b shows the increase of OSL signaland decrease in TL signal as a function of stimulation time. It is clearfrom Fig. 6 that the faster component decays out in 1 s, thus bysubtracting the TL taken after 1 s of OSL readout from the total TL, itwas found that 190 and 230 �C peaks are responsible for fastcomponent (Fig. 10 c).
The CW-OSL only suggests about themultiple components but itdoes not reveal the exact contribution and number of the trapsresponsible for total OSL signal. On the other hand, the linearlymodulated optically stimulated luminescence (LM-OSL) is expectedto separate out the different peaks having the well separated valuesof photo-ionization cross sections (Bulur, 1996). However, in thecase of the present study LM-OSL record does not give well definedLM-OSL peaks, even with slowest possible LM stimulation rate.Once again, de-convolution is required. The LM-OSL curves wereanalyzed through a Computer Curve De-convolution Analysis(CCDA) using a general order kinetics expression proposed by Bulur(1996) and later modified by Polymeris et al. (2006) and Kitis andPagonis (2008) onto an expression containing only the peakmaximum intensity Im and the corresponding time tm. These twovariables can be extracted directly from the experimental OSLcurves. The modified expression used in our computerized proce-dure is:
10-2 10-1 100 101104
105
106
107
108
OSL COUNTS Linear FIt
CW
-OSL
Inte
nsity
(a.u
)
Dose (Gy)
OSL Response = 4.51 x 10⁷( Dose)
Fig. 8. Dose vs OSL intensity for BaSO4:Eu2þ phosphor.
IðtÞ ¼ Imttm
b� 12b
�ttm
�2þ bþ 1
2b
! b1�b
(3)
where b is the order of kinetics. The background signal was simu-lated by an equation of the form:
BKGLM ¼ aþ ct (4)
where a is the average in the initial few seconds of a zero dose LM-OSL measurement, and c is a constant, which was included as afitting parameter.
The non-zero intensity value at t ¼ 0 in the LM-OSL wasconsidered in the CCDA analysis in order to accomplish best fit.Hence, the un-wanted initial signal in this work is attributed to thesignal arising from the decay of extremely shallow traps that decayin RT. Since these traps decay in RT and do not require opticalstimulation, therefore, adopting the suggestion of Kitis et al. (2010)that this non-zero intensity value could be attributed to the pres-ence of phosphorescence, a first order phosphorescence compo-nent of the form, I(t) ¼ I0exp(�l$t) was included in the CCDAanalysis. The decay rate, l, was included as a fitting parameter. Onceagain, all curve fittings were performed using the software packageMicrosoft Excel, with the Solver utility (Afouxenidis et al., 2012),while the goodness of fit was tested using the Figure Of Merit(FOM) of Balian and Eddy (1977).
Fig. 11 presents an example of RT LM-OSL curve de-convolvedinto each individual component. Three LM-OSL components arerecognized in the OSL glow curve, alongwith the background signal(bkg) and the phosphorescence component (P). The logarithmicaxis for the stimulation time was deliberately chosen in order toverify the quality of the fitting. Interestingly, the kinetic values forthe three OSL components, being 1, 1.5 and 1.5, directly correlatingto TL peaks 190, 220 and 280 �C. These three components werefurther confirmed and quantified by nonlinearly modulated opti-cally stimulated luminescence (NL-OSL) measurements. In thismethod, the stimulation intensity profile on the sample is modu-lated non-linearly with respect to time during the OSL readout. NL-OSL is expected to give more useful results for the very closelyoverlapping OSL peaks originating from the traps having very close

Fig. 10. a) TL glow curve of BaSO4:Eu2þ after OSL stimulation for various time intervals. b) Shows the increase of OSL signal and decrease in TL signal as a function of stimulationtime. c) Shows the TL peaks, responsible for fast OSL component in BaSO4:Eu2þ, found by subtracting the TL after 1 s OSL from total TL.
Fig. 11. LM-OSL curve of BaSO4:Eu2þ de-convolved into its three individual compo-nents, a background signal and a phosphorescence component. Open circles experi-mental points and solid lines the fit and each individual LM-OSL component. Thelogarithmic axis for the stimulation time was deliberately chosen in order to verify thequality of the fitting. (Inset shows the same in normal scale.)
B.C. Bhatt et al. / Radiation Measurements 64 (2014) 35e4340
values of photoionization cross-sections (Mishra et al., 2008). Thesamplewas given 50 Gy of beta dose for taking NL-OSL readout. TheNL-OSL readout of BaSO4:Eu2þ along with corresponding stimula-tion profiles is recorded for time base power (TBP) (l ¼ 2.5) withfixed final stimulation intensity (4o) of 100 mW/cm2 for fixed time12,000 s as shown Fig. 12. The time required to reach the maximumvalue of NL-OSL intensity can be given as
l1tmax ¼
�l
sg0
� 1lþ1
(5)
where s (cm2) is photo-ionization cross-section of the OSL activetraps and g0 is a constant having dimensions cm�2 s �(lþ1) and l isthe parameter which can take values in the range: 0 < l � N (like0.1, 0.5, 1, 2, . etc.), the value of l determines the power of lightmodulation in the time domain (Mishra et al., 2011a). It is clearfrom NL-OSL readout that the OSL in BaSO4:Eu2þ consists of threewell defined components having the photo-ionization cross-sec-tions 3.17 � 10�17, 2.52 � 10�18 and 6.52 � 10�19 cm2 respectively,evaluated using NL-OSL method. Table 4 gives the OSL componentsBaSO4:Eu2þ measured by various independent methods.

0 2000 4000 6000 8000 10000 12000
50
100
150
200
250
300
NLO
SL In
tens
ity (a
.u)
Time (s)
Total NLOSL Fitted data
Fig. 12. NL-OSL curve of BaSO4:Eu2þ for 12000 s resolving three components.
100 200 300 4000
1x10⁵
2x10⁵
3x10⁵
TL In
tens
ity (a
.u)
Temperature (oC)
(a)
50 100 150 200 250 300 350 4000
10000
20000
30000
40000
TA-O
SL In
tens
ity (a
.u)
Temperature (oC)
(b)
16 18 20 22 24 26 28 30 32 34 36 38
7.0
7.5
8.0
8.5
9.0
9.5
10.0
10.5
11.0
ln T
A-O
SL (a
.u) TAOSL
LInear Fit
EA= (0.063 ± 0.0012) eV
(c)
B.C. Bhatt et al. / Radiation Measurements 64 (2014) 35e43 41
3.4. Temperature dependence of OSL
In past two decades, researchers have emphasized on variousaspects of TA-OSL to investigate the temperature dependence ofdecay constant in CW-OSL measurement (Chru�sci�nska, 2010;Spooner, 1994; Kuhns et al., 2000; McKeever et al., 1997; Soniet al., 2012). Spooner (1994) in general described this tempera-ture dependence in terms of thermal activation from a ground stateto an intermediate excited state, with activation energy EA, fromwhere optical excitation to the delocalized band takes place. Thetemperature dependence of OSL was studied in order to see theeffect of stimulation temperature on the OSL intensity. OSL in-tensity has been reported to increase with temperature due to thetemperature dependence of photo-ionization cross-section in anumber of published papers. The slope of integral plot of TA-OSLintensity vs. 1/kT gives the value of thermal assistance energy EAassociated with the array of available excited states of ground levelof traps in OSL meta-stable defects for stimulation with blue light.This EA is nothing but the sum of series of quanta of all possiblevibrational energy states associated with the ground state of OSLtraps at elevated temperature of TA-OSL measurement. Therefore,under weak stimulation, TA-OSL intensity can be expressed as(Mishra et al., 2011b; Soni et al., 2012)
ITA�OSL ¼ Ae�EAkT (6)
where A is a constant and the plot of ln( ITAeOSL) vs 1/kT gives linearplot with slope as thermal assistance energy (EA).
In the current studies, the irradiated sample was subjected tothe multiple short pulses of 0.3 s on every 20 �C at low stimulationpower of 10 mW/cm2 with simultaneous TL up to 500 �C at aheating rate of 4 K/s. Hence, the OSL intensity at different tem-peratures has been obtained in a single readout. It is expected thatthe short time and low power illumination do not deplete the
Table 4OSL parameters of BaSO4:Eu2þ.
Stimulationtechniques
s (cm2) of fastercomponent
s (cm2) of intermediatecomponent
s (cm2) of slowercomponent
CW-OSL 1.4 � 10�17 1.2 � 10�18 5.2 � 10�19
NL-OSL 3.17 � 10�17 2.52 � 10�18 6.52 � 10�19
1/kT (eV-1)
Fig. 13. a) TOL measurements of BaSO4:Eu2þ obtained with short (0.3 s) and low po-wer illumination (20% LED power) (for every 20 �C when heating at 4K/s) of a samplepreviously irradiated to 50 Gy.b) TA-OSL signal i.e, the pulse height of Fig a vs tem-perature. c) Arrhenius analysis of the integrated TA-OSL signal from Fig. b. The straightline fit yields the activation energy for the thermally assisted OSL (TA-OSL) processEth ¼ 0.063 � 0.0012 eV.

B.C. Bhatt et al. / Radiation Measurements 64 (2014) 35e4342
signal significantly. This type of measurement, called thermo-optical luminescence (TOL) by Duller and co-workers (Duller andWintle, 1991, 1993), was first proposed by Hutt et al., 1988 whoused the data to support a mechanism for IRSL in feldspar. Yukiharaet al., 2004 has done somewhat similar studies on a-Al2O3:C bymeasuring OSL with a combination of low power and short-periodstimulations. The samples were heated at 5 K/s until 100 �C, andthen cooled to room temperature for a new measurement of theOSL signal with a short light pulse. The sequencewas repeated eachtime increasing the end temperature of the heating from 100 �C tountil 500 �C in 20 steps. Yoshimura and Yukihara (2006) also per-formed similar studies on spinel. However, the difference betweentheir method and the method used in our current study is that wehave measured the OSL intensity at different temperatures in asingle readout by using the linear temperature ramp at 4 K/s up to500 �C and the short pulses of low LED power were used simul-taneously during the temperature ramp (Fig. 13a). The OSL signalemitted in each stepwas plotted against temperature, as seen in the(Fig. 13 b). Fig. 13c shows the Arrhenius analysis for the integratedTA-OSL signal during the optical stimulation period. From thestraight line fit of the data between stimulation temperatures of50e250 �C in Fig. 13c, an estimate of the activation energy for theTA-OSL process was obtained as EA ¼ 0.063 � 0.0012 eV using Eq.(5). This represents the activation energy for the TA-OSL process inphosphor during the short blue light pulses used in this experi-ment. The continuous increase of the OSL signal with temperatureup to 250 �C can be attributed to the existence of thermally assistedOSL in this region. After that, the OSL intensity continues todecrease in a more or less continuous way with increasing tem-peratures up to 500 �C due to the less availability of trapped chargesor may be due to thermal quenching. This increase of OSL atelevated temperature can be employed for enhancing the sensi-tivity of phosphor. Pagonis et al. (2013) also found similar results inAl2O3:C but in that case the decrease in OSL intensity after 150 �Cwas attributed to the existence of thermal quenching in Al2O3:C. Intheir studies the sample was stimulated optically using blue LED atvariable stimulation temperatures between 20 and 240 �C, in stepsof 10 �C. A single TR-OSL pulsewas recorded for the 0.5 s duration ofthe optical stimulation period, and the TR-OSL signal was recordedfor an additional relaxation time period of 2.5 s after the termina-tion of each such single pulse.
4. Conclusions
The paper reports about the basic TL/OSL characteristics of Eudoped BaSO4 phosphor. The OSL sensitivity of the phosphor hasbeen found to be 75% to that of Al2O3:C. The OSL components havebeen determined using CW-OSL and NL-OSL methods. The TA-OSLstudies show the temperature dependence of OSL signal with signalincrease upto 200 �C. Although BaSO4:Eu is not a tissue equivalentmaterial, due to its good TL and OSL sensitivity and wide dynamicdose range, it can be used for relative dose measurements for ap-plications in radiation dosimetry. Also, its high sensitivity and fastluminescence lifetime can be used for imaging applications similarto that of CaSO4:Dy and LiF:Mg,Cu,P in TL mode, and of BaFBr: Eu inPSL/OSL mode.
Acknowledgment
The authors are grateful to Dr. D. N Sharma, Director, HealthSafety & Environment Group, BARC and Shri D. A. R Babu, Head,RPAD for the support and encouragement during the course of thiswork. Thanks are also due to Dr. V. Sudarsan for many useful dis-cussions on fluorescence lifetime measurements.
References
Afouxenidis, D., Polymeris, G.S., Tsirliganis, N.C., Kitis, G., 2012. Computerised curvedeconvolution of TL/OSL curves using a popular spreadsheet program. Radiat.Prot. Dosimetry 149, 363e370.
Aghalte, G.A., Omanwar, S.K., Moharil, S.V., 2007. Luminescence characteristics ofLiCaAlF6:Eu phosphor. Phys. Stat. Sol.(a) 204, 1561e1566.
Aghalte, G.A., Omanwar, S.K., Moharil, S.V., 2009. Synthesis and optically stimulatedluminescence of LiCaAlF6:Eu and Li3PO4:Cu. In: Proc. of the National Conferenceon Luminescence and its Applications, Feb. 19e21, 2009, Calcutta, India, pp.272e276.Pubmed Partial ArticleTitle STitle
Annalakshmi, O., Jose, M.T., Madhusoodanan, U., 2012. Synthesis and character-ization of BaSO4:Eu thermoluminescence phosphor. Radiat. Prot. Dosimetry150, 127e133.
Atone, M.S., Dhoble, S.J., Moharil, S.V., 1993. Luminescence in BaSO4 : Eu. Radiat. Eff.Defects 127, 225e230.
Azorin, J., Furetta, C., Gutierrez, A., Gonzalez, P., 1991. Thermoluminescence char-acteristics of BaSO4: Eu. Appl. Radiat. Isot. 42, 861e863.
Balian, H.G., Eddy, N.W., 1977. Figure-of-merit (FOM), an improved criterion overthe normalized chi squared test for assessing goodness-of-fit of gamma-rayspectral peaks. Nucl. Instrum. Methods 145 (2), 389e395.
Bhatt, B.C., Sanaye, S.S., Shinde, S.S., Srivastava, J.K., 1997. A comparative study of thedosimetric characteristics of BaSO4:Eu and CaSO4:Dy Teflon TLD discs. Radiat.Prot. Dosimetry 69, 105e110.
Bulur, E., 1996. An alternative technique for optically stimulated luminescence (OSL)experiment. Radiat. Meas. 26, 701e709.
Chru�sci�nska, A., 2010. On some fundamental features of optically stimulatedluminescence measurements. Radiat. Meas. 45, 991e999.
Dhopte, S.M., Muthal, P.L., Kondawar, V.K, Moharil, S.V., 1991. On the role of euro-pium in CaSO4:Eu phosphor. J. Lumin 50, 187e195.
Dhoble, S.J., Moharil, S.V., Dhopte, S.M., Muthal, P.L., Kondawar, V.K., 1993. Prepa-ration and characterization of the K3Na(SO4)2: Eu phosphor. Phys. Stat. Sol.(a)135, 289e297.
Duller, G.A.T., Botter-Jenson, L., 1993. Luminescence from potassium feldsparstimulated by infrared and green light. Radiat. Prot. Dosimetry 47, 683e688.
Duller, G.A.T., Wintle, A.G., 1991. On infrared stimulated luminescence at elevatedtemperatures. Nucl. Tracks Radiat. Meas. 18, 379e384.
Fox, P.J., Akber, R.A., Prescott, J.R., 1988. Spectral characteristics of six phos-phors used in thermoluminescence dosimetry. J. Phys. D. Appl. Phys. 21,189e193.
Gundu Rao, T.K., Shinde, S.S., Bhatt, B.C., Srivastava, J.K., Nambi, K.S.V., 1995. Electronspin resonance, thermoluminescence and fluorescence studies on BaSO4:Eu andBaSO4:Eu, P thermoluminescent phosphors. J. Phys. Condens. Matter 7, 6569e6581.
Gundu Rao, T.K., Shinde, S.S., Bhatt, B.C., Srivastava, J.K., Nambi, K.S.V., 1996. ESR, TLand fluorescence correlation in BaSO4:Eu, P thermoluminescent phosphor. Phys.Stat. Sol.(a) 157, 173e179.
Hutt, G., jack, I., Tchonka, J., 1988. Optical dating: K feldspars optical responsestimulation spectra. Quat. Sci. Rev. 7, 381e385.
Kitis, G., Pagonis, V., 2008. Computerized curve de-convolution analysis for LM-OSL.Radiat. Meas. 43, 737e741.
Kitis, G., Gomez-Ros, J.M., Tuyn, J.W.N., 1998. Thermoluminescence glow-curvedeconvolution functions for first, second and general orders of kinetics.J. Phys. D. Appl. Phys. 31, 2636e2641.
Kitis, G., Kiyak, N., Polymeris, G.S., Tsirliganis, N.C., 2010. The correlation of fast OSLcomponent with the TL peak at 325 �C in quartz of various origins. J. Lumin. 130(2), 298e303.
Koul, D.K., Patil, P.G., Oniya, E.O., Polymeris, G.S., 2014. Investigating the thermallytransferred optically stimulated luminescence source trap in fired geologicalquartz. Radiat. Meas. 62, 60e70.
Krystek, M., 1980. ESR measurements from X-ray irradiated BaSO4 single crystals.Phys. Stat. Sol.(a) 57, 171e178.
Kuhns, C.K., Agersnap Larsen, McKeever, S.W.S., 2000. Characteristics of LM-OSLfrom several different types of quartz. Radiat. Meas. 32, 413e418.
Lochab, S.P., Sahare, P.D., Chauhan, R.S., Salah, N., Ranjan, R., Pandey, A., 2007.Thermoluminescence and photoluminescence study of nanocrystallineBa0.97Ca0.03SO4 : Eu. J. Phys. D. Appl. Phys. 40, 1343e1350.
Luthra, J.M., Gupta, N.M., 1974. Mechanism of thermoluminescence in Sm- and Eu-doped barium sulphate. J. Lumin. 9, 94e103.
McKeever, S.W.S., B4tter-Jensen, Agersnap Larsen, N., Duller, G.A.T., 1997. Temper-ature dependence of OSL decay curves experimental and theoretical aspects.Radiat. Meas. 27, 161e170.
Mishra, D.R., Kulkarni, M.S., Rawat, N.S., Muthe, K.P., Gupta, S.K., Bhatt, B.C.,Sharma, D.N., 2008. Non-linear light modulation OSL phenomenon. Radiat.Meas. 43, 1177e1186.
Mishra, D.R., Kulkarni, M.S., Rawat, N.S., Soni, A., Bhatt, B.C., Sharma, D.N., 2011a.Preliminary non-linear light modulation OSL studies using a-Al2O3: C. Radiat.Meas. 46, 1462e1468.
Mishra, D.R., Soni, Anuj, Rawat, N.S., Kulkarni, M.S., Bhatt, B.C., Sharma, D.N., 2011b.Method of measuring thermal assistance energy associated with OSL traps in a-Al2O3: C phosphor. Radiat. Meas. 46, 635e642.
Okamoto, Y., Kawaguchi, S., Kino, S., Miono, S., Kitajima, T., Misaki, A., Saito, T., 1986.Thermoluminescent sheets for the detection of high energy hadronic andelectromagnetic showers. Nucl. Instrum. Meth. Phys. Res. A243, 219e224.

B.C. Bhatt et al. / Radiation Measurements 64 (2014) 35e43 43
Pagonis, V., Ankjaergaard, C., Jain, M., Chen, R., 2013. Thermal dependence oftime resolved blue light stimulated luminescence in a-Al2O3:C. J. Lumin. 136,270e277.
Polymeris, G.S., Tsirliganis, N.C., Loukou, Z., Kitis, G., 2006. A comparative study ofthe anomalous fading effects of TL and OSL signals of Durango apatite. Phys.Status Solid A 203 (3), 578e590.
Salah, N., Habib, S.S., Khan, Z.H., Al-Hamedi, S., Lochab, S.P., 2009. Nanoparticles ofBaSO4:Eu for heavy-dose measurements. J. Lumin. 129, 192e196.
Sahare, P.D, Moharil, S.V., 1990. A new high-sensitivity phosphor for thermolumi-nescence dosimetry. J. Phys. D: App. Phys. 23, 567e570.
Shinde, S.S., Bhatt, B.C., Srivastava, J.K., Sanaye, S.S., 1996. Development and char-acterization of a BaSO4:Eu, P phosphor as a high sensitivity TL dosimeter.Radiat. Prot. Dosimetry 65, 305e308.
Soni, A., Mishra, D.R., Bhatt, B.C., Gupta, S.K., Rawat, N.S., Kulkarni, M.S.,Sharma, D.N., 2012. Characterization of deep energy level defects in a-Al2O3:Cusing thermally assisted OSL. Radiat. Meas. 46, 635e642.
Spooner, N.A., 1994. On the optical dating signal from quartz. Radiat. Meas. 23,593e600.
Wintle, A.G., Murray, A.S., 1997. The relationship between quartz thermolumines-cence, photo-transferred thermoluminescence and optically stimulated lumi-nescence. Radiat. Meas. 27, 611e624.
Yamashita, T., Nada, N., Onishi, H., Kitamura, S., 1971. Calcium sulfate activated bythulium or dysprosium for thermoluminescence dosimetry. Health Phys. 21,295e300.
Yamashita, N., Yamamoto, I., Ninagava, K., Wada, T., Yamashita, Y, Nakao, Y., 1985.Investigation of TLD phosphors by optical excitations-Luminescence of Eu2þ
centers in MgSO4, CaSO4, SrSO4 and BaSO4. Jpn. J. Appl Phys. 24, 1174e1180.Yoshimura, E.M., Yukihara, E.G., 2006. Optically stimulated luminescence (OSL) of
magnesium aluminate (MgAl2O4) spinel. Radiat. Meas. 41, 163e169.Yukihara, E.G., Whitley, V.H., McKeever, S.W.S., Akselrod, A.E., Akselrod, M.S., 2004.
Effect of high-dose irradiation on the optically stimulated luminescence ofAl2O3: C. Radiat. Meas. 38, 317e330.