A single-aliquot regenerative-dose method based on IR ( 1.49 eV ) bleaching of the fast OSL...
10
Radiation Measurements 39 (2005) 309 – 318 www.elsevier.com/locate/radmeas A single-aliquot regenerative-dose method based on IR (1.49 eV) bleaching of the fast OSL component in quartz M. Jain a, c , ∗ , A.S. Murray b , L. BZtter-Jensen a , A.G. Wintle c a RisZ National Laboratory, DK-4000 Roskilde, Denmark b Nordic Laboratory for Luminescence Dating, Department of Earth Sciences, Aarhus University, RisZ National Laboratory, DK-4000 Roskilde, Denmark c Institute of Geography and Earth Sciences, University of Wales, Aberystwyth, Wales SY23 3DB, UK Received 22 December 2003; received in revised form 26 April 2004; accepted 26 May 2004 Abstract In the optically stimulated luminescence (OSL) dating of quartz, the presence of significant medium and slow components in the initial-OSL signal (first 0.8 s or so) can give rise to erroneous dose estimates. Thus it is desirable to develop a dose estimation method that is based on the OSL from the fast component alone. In this paper, the reduction of fast component OSL by high temperature infrared (IR) stimulation is investigated. It is shown that, in the temperature range from 120–190 ◦ C, it is possible to deplete the fast component preferentially using IR stimulation. The thermal assistance energy required for IR stimulation (1.49 eV; 830 nm) of the fast component is calculated to be 0.41±0.02 eV. However, the elevated temperature IRSL of quartz has a poor signal-to-noise ratio; hence a single-aliquot regenerative-dose (SAR) protocol based on a differential-OSL signal (the difference between the two short OSL signals separated by an elevated temperature IR stimulation) is proposed. The measurement conditions are optimised following examination of both the photoionisation cross-sections of the fast component for different stimulation temperatures, and possible thermally induced sensitivity changes arising from holding the samples at high temperatures for long periods (∼ 1500 s). The resulting equivalent dose values, and those from a conventional SAR protocol based on the initial-OSL signal, are compared with the expected doses for several samples. We observe that for samples with relatively strong medium and slow components, the SAR protocol based on isolation of the fast component (derived by IR depletion of the OSL) gives significantly more accurate estimates than the SAR protocol using net initial OSL signals. On the other hand, accurate dose estimates are obtained from samples dominated by the fast component using both protocols. Finally, the implications are discussed for dosimetry using quartz. © 2004 Elsevier Ltd. All rights reserved. Keywords: Quartz; Infra-red stimulation; SAR; Fast component; OSL dating; Dosimetry ∗ Corresponding author. Institute of Geography and Earth Sci- ences, University of Wales, Llandinam Building, Aberystwyth, Wales SY23 3DB, UK. Tel.: +44-1970-622646; fax: +44-1970- 622659. E-mail address: [email protected] (M. Jain). 1350-4487/$ - see front matter © 2004 Elsevier Ltd. All rights reserved. doi:10.1016/j.radmeas.2004.05.004 1. Introduction Optically stimulated luminescence (OSL) from quartz is thought to arise from different traps, each having a differ- ent photoionisation cross-section (e.g. Huntley et al., 1996; Bulur et al., 2000). Under constant power stimulation, the continuous-wave OSL (CW-OSL) signal can often be approximated by three components usually referred to as
-
Upload
deccancollegepune -
Category
Documents
-
view
3 -
download
0
Transcript of A single-aliquot regenerative-dose method based on IR ( 1.49 eV ) bleaching of the fast OSL...
Radiation Measurements 39 (2005) 309–318
www.elsevier.com/locate/radmeas
A single-aliquot regenerative-dose method based on IR(1.49 eV)
bleaching of the fast OSL component in quartz
M. Jaina,c,∗, A.S. Murrayb, L. BZtter-Jensena, A.G. Wintlec
aRisZ National Laboratory, DK-4000 Roskilde, DenmarkbNordic Laboratory for Luminescence Dating, Department of Earth Sciences, Aarhus University,
RisZ National Laboratory, DK-4000 Roskilde, DenmarkcInstitute of Geography and Earth Sciences, University of Wales, Aberystwyth, Wales SY23 3DB, UK
Received 22 December 2003; received in revised form 26 April 2004; accepted 26 May 2004
Abstract
In the optically stimulated luminescence (OSL) dating of quartz, the presence of significant medium and slow componentsin the initial-OSL signal (first 0.8 s or so) can give rise to erroneous dose estimates. Thus it is desirable to develop a doseestimation method that is based on the OSL from the fast component alone. In this paper, the reduction of fast componentOSL by high temperature infrared (IR) stimulation is investigated. It is shown that, in the temperature range from 120–190◦C,it is possible to deplete the fast component preferentially using IR stimulation. The thermal assistance energy required for IRstimulation (1.49 eV; 830 nm) of the fast component is calculated to be 0.41±0.02 eV. However, the elevated temperature IRSLof quartz has a poor signal-to-noise ratio; hence a single-aliquot regenerative-dose (SAR) protocol based on a differential-OSLsignal (the difference between the two short OSL signals separated by an elevated temperature IR stimulation) is proposed. Themeasurement conditions are optimised following examination of both the photoionisation cross-sections of the fast componentfor different stimulation temperatures, and possible thermally induced sensitivity changes arising from holding the samplesat high temperatures for long periods (∼ 1500 s). The resulting equivalent dose values, and those from a conventional SARprotocol based on the initial-OSL signal, are compared with the expected doses for several samples. We observe that forsamples with relatively strong medium and slow components, the SAR protocol based on isolation of the fast component(derived by IR depletion of the OSL) gives significantly more accurate estimates than the SAR protocol using net initial OSLsignals. On the other hand, accurate dose estimates are obtained from samples dominated by the fast component using bothprotocols. Finally, the implications are discussed for dosimetry using quartz.© 2004 Elsevier Ltd. All rights reserved.
Keywords:Quartz; Infra-red stimulation; SAR; Fast component; OSL dating; Dosimetry
∗ Corresponding author. Institute of Geography and Earth Sci-ences, University of Wales, Llandinam Building, Aberystwyth,Wales SY23 3DB, UK. Tel.: +44-1970-622646; fax: +44-1970-622659.
E-mail address:[email protected](M. Jain).
1350-4487/$ - see front matter © 2004 Elsevier Ltd. All rights reserved.doi:10.1016/j.radmeas.2004.05.004
1. Introduction
Optically stimulated luminescence (OSL) from quartz isthought to arise from different traps, each having a differ-ent photoionisation cross-section (e.g.Huntley et al., 1996;Bulur et al., 2000). Under constant power stimulation,the continuous-wave OSL (CW-OSL) signal can often beapproximated by three components usually referred to as
310 M. Jain et al. / Radiation Measurements 39 (2005) 309–318
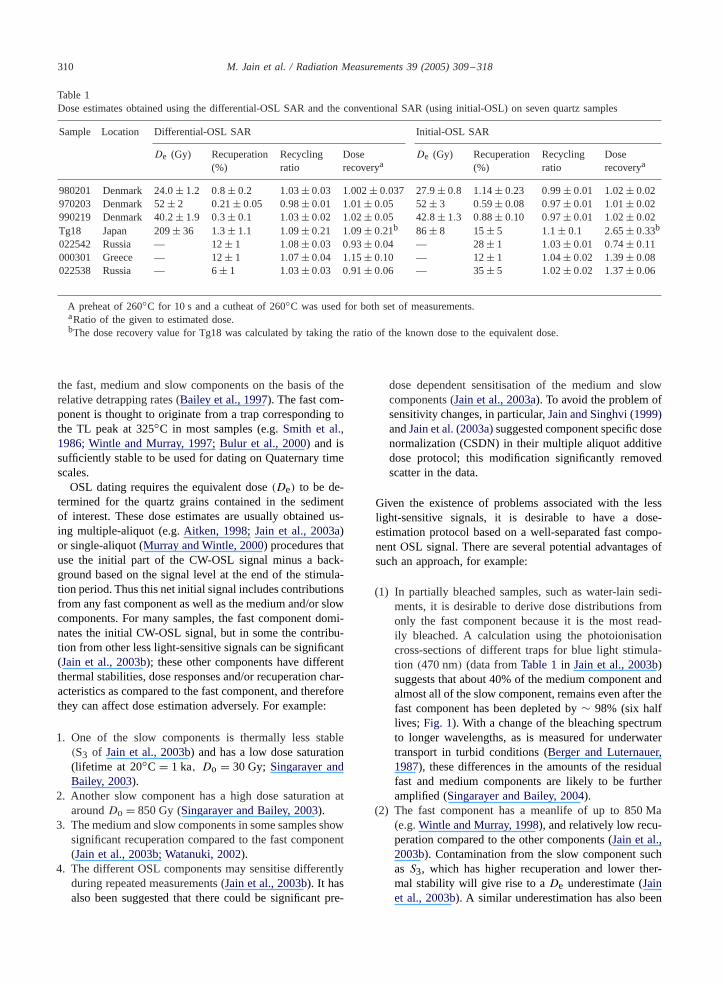
Table 1Dose estimates obtained using the differential-OSL SAR and the conventional SAR (using initial-OSL) on seven quartz samples
Sample Location Differential-OSL SAR Initial-OSL SAR
De (Gy) Recuperation Recycling Dose De (Gy) Recuperation Recycling Dose(%) ratio recoverya (%) ratio recoverya
980201 Denmark 24.0 ± 1.2 0.8 ± 0.2 1.03± 0.03 1.002± 0.037 27.9 ± 0.8 1.14± 0.23 0.99± 0.01 1.02± 0.02970203 Denmark 52± 2 0.21± 0.05 0.98± 0.01 1.01± 0.05 52± 3 0.59± 0.08 0.97± 0.01 1.01± 0.02990219 Denmark 40.2 ± 1.9 0.3 ± 0.1 1.03± 0.02 1.02± 0.05 42.8 ± 1.3 0.88± 0.10 0.97± 0.01 1.02± 0.02Tg18 Japan 209± 36 1.3 ± 1.1 1.09± 0.21 1.09± 0.21b 86± 8 15± 5 1.1 ± 0.1 2.65± 0.33b
022542 Russia — 12± 1 1.08± 0.03 0.93± 0.04 — 28± 1 1.03± 0.01 0.74± 0.11000301 Greece — 12± 1 1.07± 0.04 1.15± 0.10 — 12± 1 1.04± 0.02 1.39± 0.08022538 Russia — 6± 1 1.03± 0.03 0.91± 0.06 — 35± 5 1.02± 0.02 1.37± 0.06
A preheat of 260◦C for 10 s and a cutheat of 260◦C was used for both set of measurements.aRatio of the given to estimated dose.bThe dose recovery value for Tg18 was calculated by taking the ratio of the known dose to the equivalent dose.
the fast, medium and slow components on the basis of therelative detrapping rates (Bailey et al., 1997). The fast com-ponent is thought to originate from a trap corresponding tothe TL peak at 325◦C in most samples (e.g.Smith et al.,1986; Wintle and Murray, 1997; Bulur et al., 2000) and issufficiently stable to be used for dating on Quaternary timescales.
OSL dating requires the equivalent dose(De) to be de-termined for the quartz grains contained in the sedimentof interest. These dose estimates are usually obtained us-ing multiple-aliquot (e.g.Aitken, 1998; Jain et al., 2003a)or single-aliquot (Murray and Wintle, 2000) procedures thatuse the initial part of the CW-OSL signal minus a back-ground based on the signal level at the end of the stimula-tion period. Thus this net initial signal includes contributionsfrom any fast component as well as the medium and/or slowcomponents. For many samples, the fast component domi-nates the initial CW-OSL signal, but in some the contribu-tion from other less light-sensitive signals can be significant(Jain et al., 2003b); these other components have differentthermal stabilities, dose responses and/or recuperation char-acteristics as compared to the fast component, and thereforethey can affect dose estimation adversely. For example:
1. One of the slow components is thermally less stable(S3 of Jain et al., 2003b) and has a low dose saturation(lifetime at 20◦C = 1 ka, Do = 30 Gy; Singarayer andBailey, 2003).
2. Another slow component has a high dose saturation ataroundDo = 850 Gy (Singarayer and Bailey, 2003).
3. The medium and slow components in some samples showsignificant recuperation compared to the fast component(Jain et al., 2003b; Watanuki, 2002).
4. The different OSL components may sensitise differentlyduring repeated measurements (Jain et al., 2003b). It hasalso been suggested that there could be significant pre-
dose dependent sensitisation of the medium and slowcomponents (Jain et al., 2003a). To avoid the problem ofsensitivity changes, in particular,Jain and Singhvi (1999)andJain et al. (2003a)suggested component specific dosenormalization (CSDN) in their multiple aliquot additivedose protocol; this modification significantly removedscatter in the data.
Given the existence of problems associated with the lesslight-sensitive signals, it is desirable to have a dose-estimation protocol based on a well-separated fast compo-nent OSL signal. There are several potential advantages ofsuch an approach, for example:
(1) In partially bleached samples, such as water-lain sedi-ments, it is desirable to derive dose distributions fromonly the fast component because it is the most read-ily bleached. A calculation using the photoionisationcross-sections of different traps for blue light stimula-tion (470 nm) (data fromTable 1in Jain et al., 2003b)suggests that about 40% of the medium component andalmost all of the slow component, remains even after thefast component has been depleted by∼ 98% (six halflives; Fig. 1). With a change of the bleaching spectrumto longer wavelengths, as is measured for underwatertransport in turbid conditions (Berger and Luternauer,1987), these differences in the amounts of the residualfast and medium components are likely to be furtheramplified (Singarayer and Bailey, 2004).
(2) The fast component has a meanlife of up to 850 Ma(e.g.Wintle and Murray, 1998), and relatively low recu-peration compared to the other components (Jain et al.,2003b). Contamination from the slow component suchas S3, which has higher recuperation and lower ther-mal stability will give rise to aDe underestimate (Jainet al., 2003b). A similar underestimation has also been
M. Jain et al. / Radiation Measurements 39 (2005) 309–318 311
0.0
0.2
0.4
0.6
0.8
1.0
1.2
0.0 0.5 1.0 1.5 2.0
Time, s
No
rmal
ised
in
ten
sity
fast medium slow
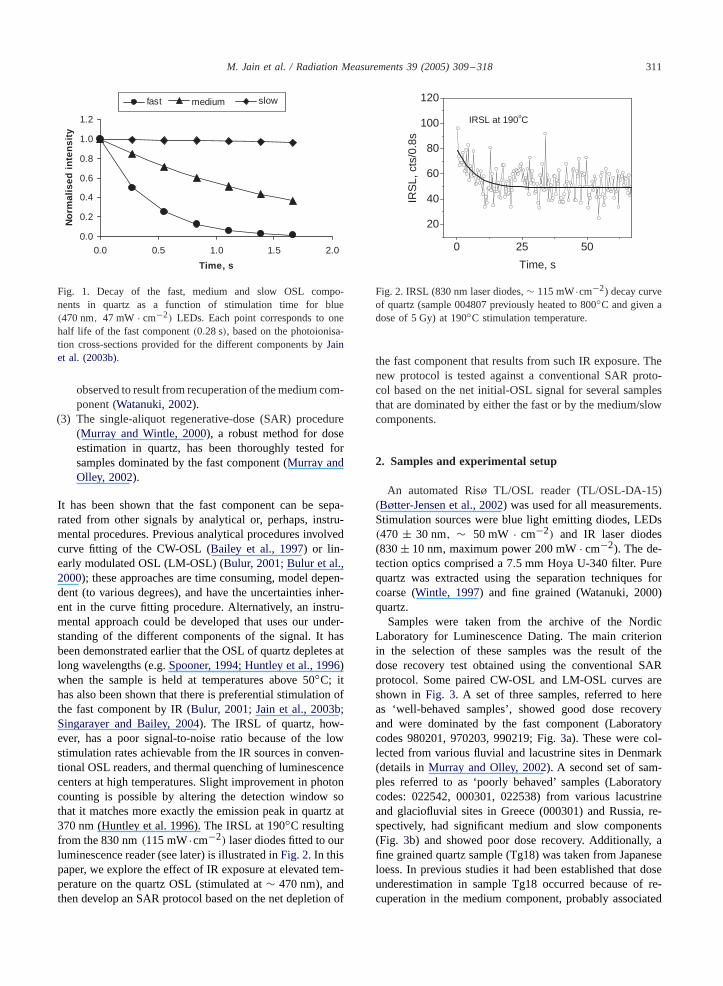
Fig. 1. Decay of the fast, medium and slow OSL compo-nents in quartz as a function of stimulation time for blue(470 nm, 47 mW · cm−2) LEDs. Each point corresponds to onehalf life of the fast component(0.28 s), based on the photoionisa-tion cross-sections provided for the different components byJainet al. (2003b).
observed to result from recuperation of the medium com-ponent (Watanuki, 2002).
(3) The single-aliquot regenerative-dose (SAR) procedure(Murray and Wintle, 2000), a robust method for doseestimation in quartz, has been thoroughly tested forsamples dominated by the fast component (Murray andOlley, 2002).
It has been shown that the fast component can be sepa-rated from other signals by analytical or, perhaps, instru-mental procedures. Previous analytical procedures involvedcurve fitting of the CW-OSL (Bailey et al., 1997) or lin-early modulated OSL (LM-OSL) (Bulur, 2001; Bulur et al.,2000); these approaches are time consuming, model depen-dent (to various degrees), and have the uncertainties inher-ent in the curve fitting procedure. Alternatively, an instru-mental approach could be developed that uses our under-standing of the different components of the signal. It hasbeen demonstrated earlier that the OSL of quartz depletes atlong wavelengths (e.g.Spooner, 1994; Huntley et al., 1996)when the sample is held at temperatures above 50◦C; ithas also been shown that there is preferential stimulation ofthe fast component by IR (Bulur, 2001; Jain et al., 2003b;Singarayer and Bailey, 2004). The IRSL of quartz, how-ever, has a poor signal-to-noise ratio because of the lowstimulation rates achievable from the IR sources in conven-tional OSL readers, and thermal quenching of luminescencecenters at high temperatures. Slight improvement in photoncounting is possible by altering the detection window sothat it matches more exactly the emission peak in quartz at370 nm (Huntley et al. 1996). The IRSL at 190◦C resultingfrom the 830 nm(115 mW·cm−2) laser diodes fitted to ourluminescence reader (see later) is illustrated inFig. 2. In thispaper, we explore the effect of IR exposure at elevated tem-perature on the quartz OSL (stimulated at∼ 470 nm), andthen develop an SAR protocol based on the net depletion of
0 25 50
20
40
60
80
100
120
IRSL at 190oC
IRS
L, c
ts/0
.8s
Time, s
Fig. 2. IRSL (830 nm laser diodes,∼ 115 mW·cm−2) decay curveof quartz (sample 004807 previously heated to 800◦C and given adose of 5 Gy) at 190◦C stimulation temperature.
the fast component that results from such IR exposure. Thenew protocol is tested against a conventional SAR proto-col based on the net initial-OSL signal for several samplesthat are dominated by either the fast or by the medium/slowcomponents.
2. Samples and experimental setup
An automated RisZ TL/OSL reader (TL/OSL-DA-15)(BZtter-Jensen et al., 2002) was used for all measurements.Stimulation sources were blue light emitting diodes, LEDs(470 ± 30 nm, ∼ 50 mW · cm−2) and IR laser diodes(830± 10 nm, maximum power 200 mW· cm−2). The de-tection optics comprised a 7.5 mm Hoya U-340 filter. Purequartz was extracted using the separation techniques forcoarse (Wintle, 1997) and fine grained (Watanuki, 2000)quartz.
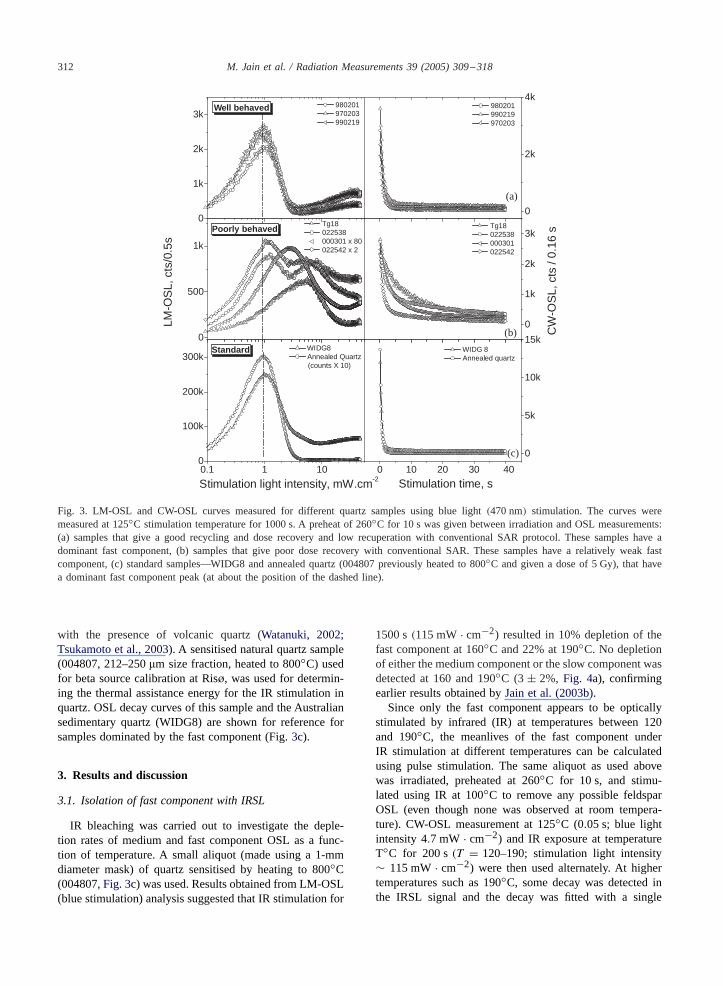
Samples were taken from the archive of the NordicLaboratory for Luminescence Dating. The main criterionin the selection of these samples was the result of thedose recovery test obtained using the conventional SARprotocol. Some paired CW-OSL and LM-OSL curves areshown inFig. 3. A set of three samples, referred to hereas ‘well-behaved samples’, showed good dose recoveryand were dominated by the fast component (Laboratorycodes 980201, 970203, 990219; Fig.3a). These were col-lected from various fluvial and lacustrine sites in Denmark(details inMurray and Olley, 2002). A second set of sam-ples referred to as ‘poorly behaved’ samples (Laboratorycodes: 022542, 000301, 022538) from various lacustrineand glaciofluvial sites in Greece (000301) and Russia, re-spectively, had significant medium and slow components(Fig. 3b) and showed poor dose recovery. Additionally, afine grained quartz sample (Tg18) was taken from Japaneseloess. In previous studies it had been established that doseunderestimation in sample Tg18 occurred because of re-cuperation in the medium component, probably associated
312 M. Jain et al. / Radiation Measurements 39 (2005) 309–318
0.1 1 100
100k
200k
300k
0
500
1k
0
1k
2k
3k
0 10 20 30 40
0
5k
10k
15k
0
2k
4k
0
1k
2k
3k
Stimulation light intensity, mW.cm-2
CW
-OS
L, c
ts /
0.16
sPoorly behaved
Well behaved
LM-O
SL,
cts
/0.5
s
WIDG8 Annealed Quartz (counts X 10)
Tg18 022538000301 x 80022542 x 2
980201 970203 990219
Stimulation time, s
WIDG 8 Annealed quartz
980201 990219 970203
Tg18 022538 000301 022542
(a)
(b)
(c)
Standard
Fig. 3. LM-OSL and CW-OSL curves measured for different quartz samples using blue light(470 nm) stimulation. The curves weremeasured at 125◦C stimulation temperature for 1000 s. A preheat of 260◦C for 10 s was given between irradiation and OSL measurements:(a) samples that give a good recycling and dose recovery and low recuperation with conventional SAR protocol. These samples have adominant fast component, (b) samples that give poor dose recovery with conventional SAR. These samples have a relatively weak fastcomponent, (c) standard samples—WIDG8 and annealed quartz (004807 previously heated to 800◦C and given a dose of 5 Gy), that havea dominant fast component peak (at about the position of the dashed line).
with the presence of volcanic quartz (Watanuki, 2002;Tsukamoto et al., 2003). A sensitised natural quartz sample(004807, 212–250�m size fraction, heated to 800◦C) usedfor beta source calibration at RisZ, was used for determin-ing the thermal assistance energy for the IR stimulation inquartz. OSL decay curves of this sample and the Australiansedimentary quartz (WIDG8) are shown for reference forsamples dominated by the fast component (Fig.3c).
3. Results and discussion
3.1. Isolation of fast component with IRSL
IR bleaching was carried out to investigate the deple-tion rates of medium and fast component OSL as a func-tion of temperature. A small aliquot (made using a 1-mmdiameter mask) of quartz sensitised by heating to 800◦C(004807,Fig. 3c) was used. Results obtained from LM-OSL(blue stimulation) analysis suggested that IR stimulation for
1500 s(115 mW· cm−2) resulted in 10% depletion of thefast component at 160◦C and 22% at 190◦C. No depletionof either the medium component or the slow component wasdetected at 160 and 190◦C (3 ± 2%, Fig. 4a), confirmingearlier results obtained byJain et al. (2003b).
Since only the fast component appears to be opticallystimulated by infrared (IR) at temperatures between 120and 190◦C, the meanlives of the fast component underIR stimulation at different temperatures can be calculatedusing pulse stimulation. The same aliquot as used abovewas irradiated, preheated at 260◦C for 10 s, and stimu-lated using IR at 100◦C to remove any possible feldsparOSL (even though none was observed at room tempera-ture). CW-OSL measurement at 125◦C (0.05 s; blue lightintensity 4.7 mW · cm−2) and IR exposure at temperatureT◦C for 200 s(T = 120–190; stimulation light intensity∼ 115 mW· cm−2) were then used alternately. At highertemperatures such as 190◦C, some decay was detected inthe IRSL signal and the decay was fitted with a single
M. Jain et al. / Radiation Measurements 39 (2005) 309–318 313
120 140 160 180 2000
5k
10k
15k
20k
25k
30k
0
2
4
6
8
10
12
14
(1/ σ
)X10
21, c
m-2
Mea
nlife
, s
Temperature, oC
1 10 100 1000
0
10k
20k
SlowMedium
FastLM
-OS
L, c
ts /
0.5s
Time, s
No IR IR 160 °C IR 190 °C
0 500 1000 1500 2000
0.37
1.00
I/Io
Cumulative IR exposure time, s
120 °C 130 °C 140 °C 150 °C 160 °C 170 °C 180 °C 190 °C
(a)
0 200 400 600 800 10000.00
0.25
0.50
0.75
1.00
Nor
mal
ised
OS
L
Time, s
80 °C 130°C 160°C 190°C
(b)
25 26 27 28 29 30
3k
8k
22kE*=0.41 ± 0.02 eV
Mea
nlife
, s
1/Kβ.T (eV-1)
(c) (d)
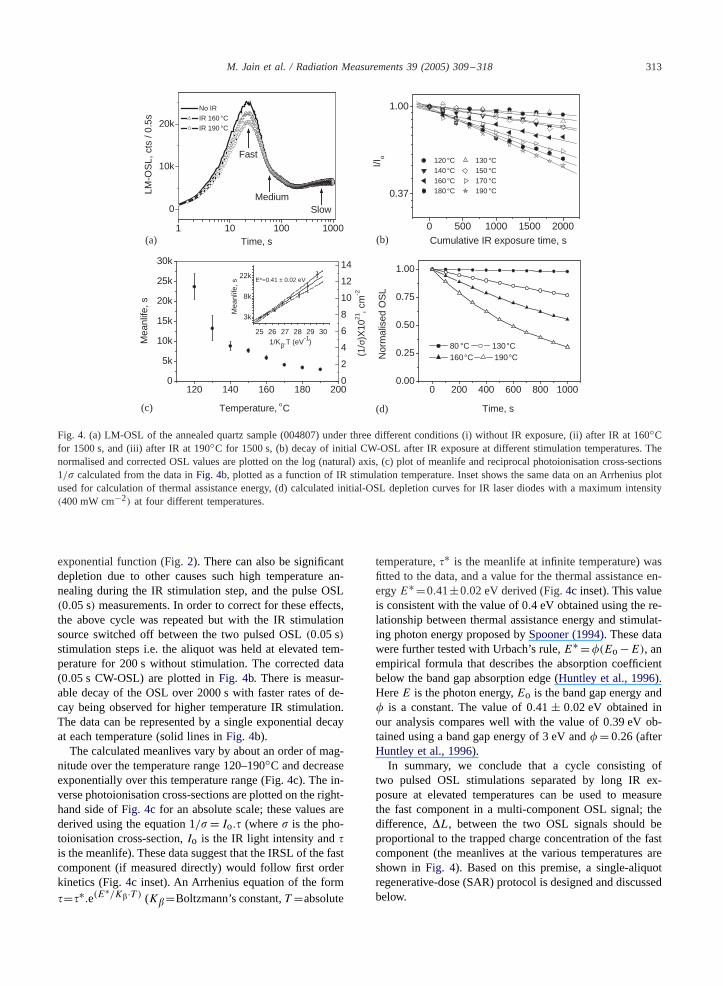
Fig. 4. (a) LM-OSL of the annealed quartz sample (004807) under three different conditions (i) without IR exposure, (ii) after IR at 160◦Cfor 1500 s, and (iii) after IR at 190◦C for 1500 s, (b) decay of initial CW-OSL after IR exposure at different stimulation temperatures. Thenormalised and corrected OSL values are plotted on the log (natural) axis, (c) plot of meanlife and reciprocal photoionisation cross-sections1/� calculated from the data inFig. 4b, plotted as a function of IR stimulation temperature. Inset shows the same data on an Arrhenius plotused for calculation of thermal assistance energy, (d) calculated initial-OSL depletion curves for IR laser diodes with a maximum intensity(400 mW cm−2) at four different temperatures.
exponential function (Fig.2). There can also be significantdepletion due to other causes such high temperature an-nealing during the IR stimulation step, and the pulse OSL(0.05 s) measurements. In order to correct for these effects,the above cycle was repeated but with the IR stimulationsource switched off between the two pulsed OSL(0.05 s)stimulation steps i.e. the aliquot was held at elevated tem-perature for 200 s without stimulation. The corrected data(0.05 s CW-OSL) are plotted inFig. 4b. There is measur-able decay of the OSL over 2000 s with faster rates of de-cay being observed for higher temperature IR stimulation.The data can be represented by a single exponential decayat each temperature (solid lines inFig. 4b).
The calculated meanlives vary by about an order of mag-nitude over the temperature range 120–190◦C and decreaseexponentially over this temperature range (Fig.4c). The in-verse photoionisation cross-sections are plotted on the right-hand side ofFig. 4c for an absolute scale; these values arederived using the equation 1/� = Io.� (where� is the pho-toionisation cross-section,Io is the IR light intensity and�is the meanlife). These data suggest that the IRSL of the fastcomponent (if measured directly) would follow first orderkinetics (Fig.4c inset). An Arrhenius equation of the form�=�∗.e(E∗/K�·T ) (K�=Boltzmann’s constant,T =absolute
temperature,�∗ is the meanlife at infinite temperature) wasfitted to the data, and a value for the thermal assistance en-ergyE∗ =0.41±0.02 eV derived (Fig.4c inset). This valueis consistent with the value of 0.4 eV obtained using the re-lationship between thermal assistance energy and stimulat-ing photon energy proposed bySpooner (1994). These datawere further tested with Urbach’s rule,E∗ =�(Eo −E), anempirical formula that describes the absorption coefficientbelow the band gap absorption edge (Huntley et al., 1996).HereE is the photon energy,Eo is the band gap energy and� is a constant. The value of 0.41 ± 0.02 eV obtained inour analysis compares well with the value of 0.39 eV ob-tained using a band gap energy of 3 eV and� = 0.26 (afterHuntley et al., 1996).
In summary, we conclude that a cycle consisting oftwo pulsed OSL stimulations separated by long IR ex-posure at elevated temperatures can be used to measurethe fast component in a multi-component OSL signal; thedifference,�L, between the two OSL signals should beproportional to the trapped charge concentration of the fastcomponent (the meanlives at the various temperatures areshown inFig. 4). Based on this premise, a single-aliquotregenerative-dose (SAR) protocol is designed and discussedbelow.
314 M. Jain et al. / Radiation Measurements 39 (2005) 309–318
Step 7. Test Dose
Step 1. Preheat 260oC for 10s
Step 2. IR: 100s at 100oC
Step 3. OSL at 125oC for 0.05s
Step 4. IR at 160oC for 1500s
Step 5. OSL at 125oC for 0.05s
Step 6. OSL at 125oC for 100s
∆L=
L1 -L
2
L1
L2
Step 14. Regeneration Dose
IR1
IR cleaning
OSL cleaning
Repeat from step 1
Step 8. Cutheat (heat to 260oC )
Step 9. IR: 100s at 100oC
Step 10. OSL at 125oC for 0.05s
Step 11. IR at 160oC for 1500s
Step 12. OSL at 125oC for 0.05s
Step 13. OSL at 125oC for 100s
∆ T =
T1 -T
2
T1
T2
IR2
IR cleaning
OSL cleaning
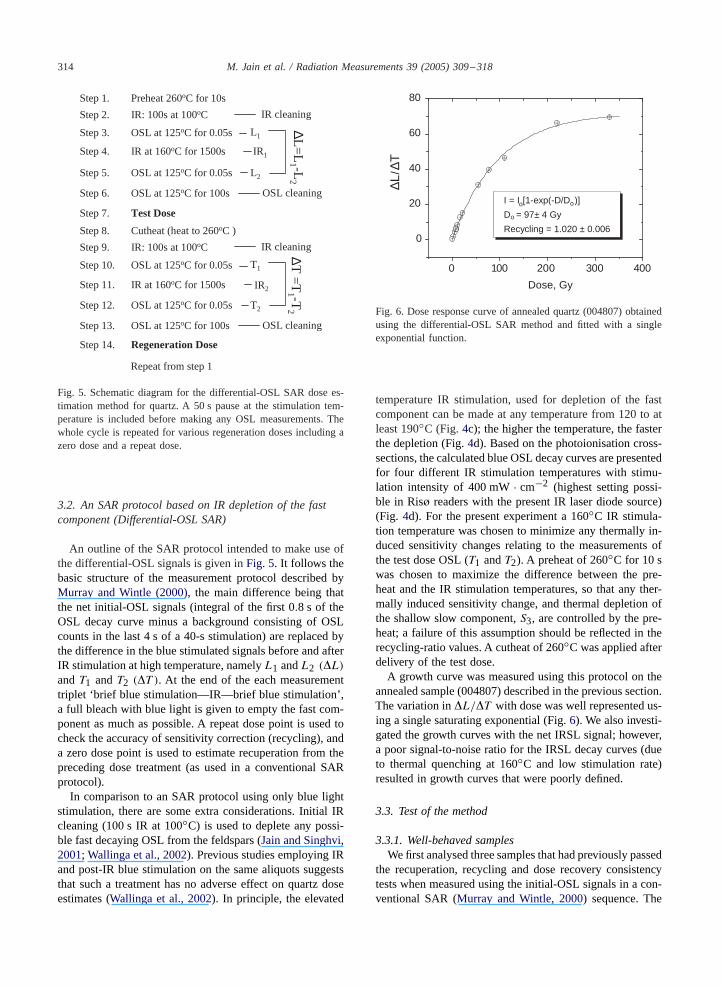
Fig. 5. Schematic diagram for the differential-OSL SAR dose es-timation method for quartz. A 50 s pause at the stimulation tem-perature is included before making any OSL measurements. Thewhole cycle is repeated for various regeneration doses including azero dose and a repeat dose.
3.2. An SAR protocol based on IR depletion of the fastcomponent (Differential-OSL SAR)
An outline of the SAR protocol intended to make use ofthe differential-OSL signals is given inFig. 5. It follows thebasic structure of the measurement protocol described byMurray and Wintle (2000), the main difference being thatthe net initial-OSL signals (integral of the first 0.8 s of theOSL decay curve minus a background consisting of OSLcounts in the last 4 s of a 40-s stimulation) are replaced bythe difference in the blue stimulated signals before and afterIR stimulation at high temperature, namelyL1 andL2 (�L)
andT1 andT2 (�T ). At the end of the each measurementtriplet ‘brief blue stimulation—IR—brief blue stimulation’,a full bleach with blue light is given to empty the fast com-ponent as much as possible. A repeat dose point is used tocheck the accuracy of sensitivity correction (recycling), anda zero dose point is used to estimate recuperation from thepreceding dose treatment (as used in a conventional SARprotocol).
In comparison to an SAR protocol using only blue lightstimulation, there are some extra considerations. Initial IRcleaning (100 s IR at 100◦C) is used to deplete any possi-ble fast decaying OSL from the feldspars (Jain and Singhvi,2001; Wallinga et al., 2002). Previous studies employing IRand post-IR blue stimulation on the same aliquots suggeststhat such a treatment has no adverse effect on quartz doseestimates (Wallinga et al., 2002). In principle, the elevated
0 100 200 300 400
0
20
40
60
80
I = Io[1-exp(-D/Do)]
Do = 97± 4 Gy
Recycling = 1.020 ± 0.006
∆L / ∆
T
Dose, Gy
Fig. 6. Dose response curve of annealed quartz (004807) obtainedusing the differential-OSL SAR method and fitted with a singleexponential function.
temperature IR stimulation, used for depletion of the fastcomponent can be made at any temperature from 120 to atleast 190◦C (Fig. 4c); the higher the temperature, the fasterthe depletion (Fig.4d). Based on the photoionisation cross-sections, the calculated blue OSL decay curves are presentedfor four different IR stimulation temperatures with stimu-lation intensity of 400 mW· cm−2 (highest setting possi-ble in RisZ readers with the present IR laser diode source)(Fig. 4d). For the present experiment a 160◦C IR stimula-tion temperature was chosen to minimize any thermally in-duced sensitivity changes relating to the measurements ofthe test dose OSL (T1 andT2). A preheat of 260◦C for 10 swas chosen to maximize the difference between the pre-heat and the IR stimulation temperatures, so that any ther-mally induced sensitivity change, and thermal depletion ofthe shallow slow component,S3, are controlled by the pre-heat; a failure of this assumption should be reflected in therecycling-ratio values. A cutheat of 260◦C was applied afterdelivery of the test dose.
A growth curve was measured using this protocol on theannealed sample (004807) described in the previous section.The variation in�L/�T with dose was well represented us-ing a single saturating exponential (Fig.6). We also investi-gated the growth curves with the net IRSL signal; however,a poor signal-to-noise ratio for the IRSL decay curves (dueto thermal quenching at 160◦C and low stimulation rate)resulted in growth curves that were poorly defined.
3.3. Test of the method
3.3.1. Well-behaved samplesWe first analysed three samples that had previously passed
the recuperation, recycling and dose recovery consistencytests when measured using the initial-OSL signals in a con-ventional SAR (Murray and Wintle, 2000) sequence. The
M. Jain et al. / Radiation Measurements 39 (2005) 309–318 315
0 2 4 6 10 12 14 160
10
20
30
40
50
0
1
2
3
4
5
Differential-OSLsignals
Initial-OSLsignalsD
e, G
y
Aliquot no.
Rec
yclin
g ra
tio; R
ecup
erat
ion,
%
(a) (b)
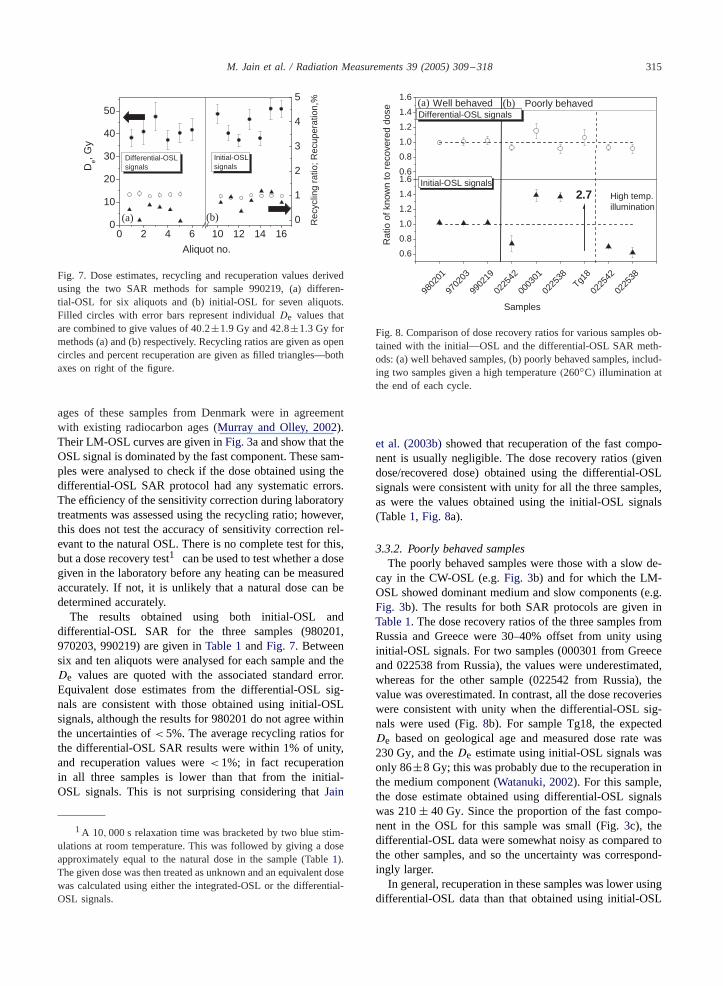
Fig. 7. Dose estimates, recycling and recuperation values derivedusing the two SAR methods for sample 990219, (a) differen-tial-OSL for six aliquots and (b) initial-OSL for seven aliquots.Filled circles with error bars represent individualDe values thatare combined to give values of 40.2±1.9 Gy and 42.8±1.3 Gy formethods (a) and (b) respectively. Recycling ratios are given as opencircles and percent recuperation are given as filled triangles—bothaxes on right of the figure.
ages of these samples from Denmark were in agreementwith existing radiocarbon ages (Murray and Olley, 2002).Their LM-OSL curves are given inFig. 3a and show that theOSL signal is dominated by the fast component. These sam-ples were analysed to check if the dose obtained using thedifferential-OSL SAR protocol had any systematic errors.The efficiency of the sensitivity correction during laboratorytreatments was assessed using the recycling ratio; however,this does not test the accuracy of sensitivity correction rel-evant to the natural OSL. There is no complete test for this,but a dose recovery test1 can be used to test whether a dosegiven in the laboratory before any heating can be measuredaccurately. If not, it is unlikely that a natural dose can bedetermined accurately.
The results obtained using both initial-OSL anddifferential-OSL SAR for the three samples (980201,970203, 990219) are given inTable 1andFig. 7. Betweensix and ten aliquots were analysed for each sample and theDe values are quoted with the associated standard error.Equivalent dose estimates from the differential-OSL sig-nals are consistent with those obtained using initial-OSLsignals, although the results for 980201 do not agree withinthe uncertainties of< 5%. The average recycling ratios forthe differential-OSL SAR results were within 1% of unity,and recuperation values were< 1%; in fact recuperationin all three samples is lower than that from the initial-OSL signals. This is not surprising considering thatJain
1A 10, 000 s relaxation time was bracketed by two blue stim-ulations at room temperature. This was followed by giving a doseapproximately equal to the natural dose in the sample (Table1).The given dose was then treated as unknown and an equivalent dosewas calculated using either the integrated-OSL or the differential-OSL signals.
9802
01
9702
03
9902
19
0225
42
0003
01
0225
38Tg1
8
0225
42
0225
38
0.6
0.8
1.0
1.2
1.4
1.60.6
0.8
1.0
1.2
1.4
1.6
2.7
Rat
io o
f kno
wn
to r
ecov
ered
dos
e
Samples
Initial-OSL signals
Poorly behaved Well behaved
High temp.illumination
Differential-OSL signals(a) (b)
Fig. 8. Comparison of dose recovery ratios for various samples ob-tained with the initial—OSL and the differential-OSL SAR meth-ods: (a) well behaved samples, (b) poorly behaved samples, includ-ing two samples given a high temperature(260◦C) illumination atthe end of each cycle.
et al. (2003b)showed that recuperation of the fast compo-nent is usually negligible. The dose recovery ratios (givendose/recovered dose) obtained using the differential-OSLsignals were consistent with unity for all the three samples,as were the values obtained using the initial-OSL signals(Table1, Fig. 8a).
3.3.2. Poorly behaved samplesThe poorly behaved samples were those with a slow de-
cay in the CW-OSL (e.g.Fig. 3b) and for which the LM-OSL showed dominant medium and slow components (e.g.Fig. 3b). The results for both SAR protocols are given inTable 1. The dose recovery ratios of the three samples fromRussia and Greece were 30–40% offset from unity usinginitial-OSL signals. For two samples (000301 from Greeceand 022538 from Russia), the values were underestimated,whereas for the other sample (022542 from Russia), thevalue was overestimated. In contrast, all the dose recoverieswere consistent with unity when the differential-OSL sig-nals were used (Fig.8b). For sample Tg18, the expectedDe based on geological age and measured dose rate was230 Gy, and theDe estimate using initial-OSL signals wasonly 86±8 Gy; this was probably due to the recuperation inthe medium component (Watanuki, 2002). For this sample,the dose estimate obtained using differential-OSL signalswas 210± 40 Gy. Since the proportion of the fast compo-nent in the OSL for this sample was small (Fig.3c), thedifferential-OSL data were somewhat noisy as compared tothe other samples, and so the uncertainty was correspond-ingly larger.
In general, recuperation in these samples was lower usingdifferential-OSL data than that obtained using initial-OSL
316 M. Jain et al. / Radiation Measurements 39 (2005) 309–318
signals (1.3–12% using differential-OSL and 12–35% usinginitial-OSL signals). On the other hand, recycling values didnot improve markedly using the new protocol. The recyclingratios varied between 1.03 and 1.09 with use of differential-OSL signals, while using the initial-OSL signals they variedbetween 1.02 and 1.10. It is possible that holding the sam-ples at high temperature during prolonged IR bleaching hasan effect on recycling values; nevertheless, there is a consid-erable improvement in the accuracy of the recovered doses(Fig. 8b). This suggests that dose recovery is perhaps gov-erned by factors other than recycling. To test the importanceof recuperation in dose recovery, an additional experimentwas carried out on two poorly behaved samples (022542 and022538); in this experiment, at the end of each SAR cyclethe aliquots were held at 260◦C while they were illuminatedby blue light (470 nm, 40 mW· cm−2) (following Murrayand Wintle, 2003). Despite a reduction in the recuperationto less than 1%, there was no significant improvement inthe dose recovery in these samples (Fig.8b—samples plot-ted to the right of the vertical dotted line); indeed for onesample (022538) the ratio changed from 1.37 to 0.62.
3.4. Advantages of using the differential-OSL signals
The above results suggest that it is possible to isolatethe fast component in quartz using IR exposure and thatthe differential-OSL SAR protocol gives meaningful doseestimates. The use of differential measurements avoids thecomplexities and ambiguities inherent in curve fitting pro-cedures. In addition, this differential-OSL measurement hasthe advantage that it identifies samples for which the fastcomponent is weak; for these samples there is a large un-certainty in the�L values. For a bright sample with no fastcomponent, the�L value will be consistent with zero. Sincethe proportions of the various components can vary signif-icantly (even within different aliquots of the same sample),dose calculation using the differential-OSL signals will givesmaller errors for aliquots that have a higher proportion offast component. Thus the method auto-selects for the equiv-alent dose from samples with a dominant fast component(or such aliquots in a poorly behaved sample).
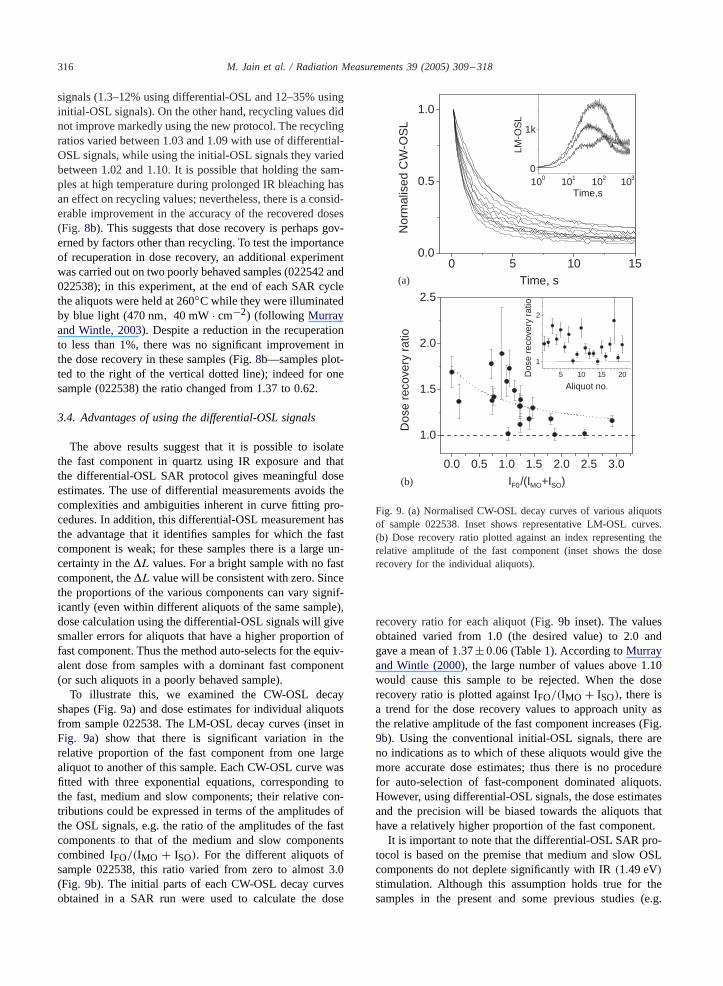
To illustrate this, we examined the CW-OSL decayshapes (Fig.9a) and dose estimates for individual aliquotsfrom sample 022538. The LM-OSL decay curves (inset inFig. 9a) show that there is significant variation in therelative proportion of the fast component from one largealiquot to another of this sample. Each CW-OSL curve wasfitted with three exponential equations, corresponding tothe fast, medium and slow components; their relative con-tributions could be expressed in terms of the amplitudes ofthe OSL signals, e.g. the ratio of the amplitudes of the fastcomponents to that of the medium and slow componentscombined IFO/(IMO + ISO). For the different aliquots ofsample 022538, this ratio varied from zero to almost 3.0(Fig. 9b). The initial parts of each CW-OSL decay curvesobtained in a SAR run were used to calculate the dose
0 5 10 150.0
0.5
1.0
Nor
mal
ised
CW
-OS
L
Time, s
100 101 102 1030
1k
LM-O
SL
Time,s
0.0 0.5 1.0 1.5 2.0 2.5 3.0
1.0
1.5
2.0
2.5
Dos
e re
cove
ry r
atio
IF0/(IMO+ISO)
5 10 15 20
1
2
Dos
e re
cove
ry r
atio
Aliquot no.
(a)
(b)
Fig. 9. (a) Normalised CW-OSL decay curves of various aliquotsof sample 022538. Inset shows representative LM-OSL curves.(b) Dose recovery ratio plotted against an index representing therelative amplitude of the fast component (inset shows the doserecovery for the individual aliquots).
recovery ratio for each aliquot (Fig.9b inset). The valuesobtained varied from 1.0 (the desired value) to 2.0 andgave a mean of 1.37± 0.06 (Table1). According toMurrayand Wintle (2000), the large number of values above 1.10would cause this sample to be rejected. When the doserecovery ratio is plotted against IFO/(IMO + ISO), there isa trend for the dose recovery values to approach unity asthe relative amplitude of the fast component increases (Fig.9b). Using the conventional initial-OSL signals, there areno indications as to which of these aliquots would give themore accurate dose estimates; thus there is no procedurefor auto-selection of fast-component dominated aliquots.However, using differential-OSL signals, the dose estimatesand the precision will be biased towards the aliquots thathave a relatively higher proportion of the fast component.
It is important to note that the differential-OSL SAR pro-tocol is based on the premise that medium and slow OSLcomponents do not deplete significantly with IR(1.49 eV)
stimulation. Although this assumption holds true for thesamples in the present and some previous studies (e.g.

M. Jain et al. / Radiation Measurements 39 (2005) 309–318 317
Jain et al., 2003b; Singarayer and Bailey, 2004), the univer-sality of this behaviour needs testing in a variety of sam-ples. Nonetheless, our understanding of the photoionisationcross-sections of these components suggests that the fastcomponent should dominate the differential-OSL signal.
3.5. Disadvantages of the differential-OSL SAR protocol
Despite the ability to obtain accurate dose estimates basedon the fast component, and the advantages discussed above,there are some disadvantages to using the differential-OSLSAR protocol.
(1) To provide thermal assistance for the IR depletion of thefast component, it is necessary to hold the sample at atemperature of 160◦C or higher for a prolonged period.To prevent this being a problem in respect of sensitivitychange between the two OSL measurements used to ob-tain the differential-OSL signal, the 10 s preheat must berelatively high (e.g. 260◦C). Such a high preheat tem-perature may lead to problems of thermal transfer foryoung samples. However, such a high preheat tempera-ture is advantageous if the thermally unstableS3 com-ponent is present (Jain et al., 2003b).
(2) The procedure is time consuming. We used a total of1500 s IR stimulation time for each OSL measurement.Reduction in IR stimulation time is not an option sincethis would also reduce the fraction of fast componentthat is depleted and thus the size of the differential-OSLsignal. However, the IR source (∼ 830 nm laser diodes)used is not necessarily at the optimum wavelength.Using a shorter wavelength for bleaching may permitreduction in the stimulation time and temperature, andstill allow preferential isolation of the fast component.As discussed earlier, there is a nonlinear relationshipbetween the thermal assistance energy of the OSL andthe stimulation wavelength in quartz; thus significantgains are anticipated by using even a slightly shorterwavelength.
(3) The protocol may be affected by the presence offeldspar contaminants, since there is a slow compo-nent of feldspar OSL that shows significant thermalassistance (Jain and Singhvi, 2001).
(4) Because this is a differential method, individual doseestimates will have relatively larger errors (resultingfrom the subtraction of two signals).
4. Conclusions
A new approach to dose estimation for quartz has beentested using a single-aliquot regenerative-dose protocol in-volving a differential measurement of the amplitude of thefast OSL component; the differential signal is calculatedfrom two brief OSL measurements bracketing bleaching by1.49 eV photons (using 830 nm IR laser diodes) at 160◦C.
The thermal assistance energy for 1.49 eV photon stimu-lation for quartz is calculated to be 0.41± 0.02 eV; thesephotons deplete only the fast component when a stimulationtemperature between 120 and 190◦C is used (at 115 mW·cm−2 for 1500 s). The differential-OSL SAR protocol gavedose estimates consistent with expected values for labora-tory doses given before any heat treatment (dose recovery),and/or natural doses, in both ‘well behaved’ and ‘poorly be-haved’ samples; the sample behaviour was determined interms of ‘dose recovery’ by conventional SAR measure-ments using the initial part of the CW-OSL signal. We ob-serve that ‘poor behaviour’ in our sample is due to the initialsignal being dominated by medium and slow components.
In contrast to the conventional SAR protocol, the newdifferential-OSL SAR protocol has the advantage that it pro-vides measurable signals only if a significant fast componentis present. In the absence of a fast component, no signif-icant dose response will be observed and so estimation ofequivalent dose will not be possible; the procedure thus se-lects automatically for dose estimates from samples/aliquotswith a relatively large fast component. However, becauseof technical limitations, it is a time consuming protocol, al-though improvements may be brought about by optimizingbleaching wavelength, stimulation temperature and time.
Acknowledgements
This study was partly funded under the EC 5th Frame-work Programme (1998–2002), Nuclear Fission and Radi-ation Protection Contract No FIGD-CT-2000-00094, whichsupported M.J.’s fellowship.
References
Aitken, M.J., 1998. An Introduction to Optical Dating. OxfordUniversity Press, Oxford.
Bailey, R.M., Smith, B.W., Rhodes, E.J., 1997. Partial bleachingand the decay form characteristics of quartz OSL. Radiat. Meas.27, 123–136.
Berger, G.W., Luternauer, J.J., 1987. Preliminary field work forthermoluminescence dating studies at the Fraser River delta,British Columbia. Geological Survey of Canada Paper 87/IA,901–904.
BZtter-Jensen, L., Bulur, E., Murray, A.S., Poolton, N.R.J., 2002.Enhancements in luminescence measurement techniques. Radiat.Prot. Dosim. 101, 119–124.
Bulur, E., 1996. An alternative technique for optically stimulatedluminescence (OSL) experiment. Radiat. Meas. 26, 701–709.
Bulur, E., 2001. Personal communication.Bulur, E., BZtter-Jensen, L., Murray, A.S., 2000. Optically
stimulated luminescence from quartz measured using the linearmodulation technique. Radiat. Meas. 32, 407–411.
Huntley, D.J., Short, M.A., Dunphy, K., 1996. Deep traps in quartzand their use for optical dating. Can. J. Phys. 74, 81–91.
Jain, M., Singhvi, A.K., 1999. Scatter and normalisation in quartzOSL: evaluation of current procedures and development of a

318 M. Jain et al. / Radiation Measurements 39 (2005) 309–318
new protocol. Ninth International Conference on Luminescenceand Electron Spin Resonance, Rome, Book of Abstracts, 83.
Jain, M., Singhvi, A.K., 2001. Limits to depletion of blue-greenlight stimulated luminescence in feldspars: implications forquartz dating. Radiat. Meas. 33, 883–892.
Jain, M., BZtter-Jensen, L., Singhvi, A.K., 2003a. Dose evaluationusing multiple aliquot quartz OSL: test of methods and a newprotocol for improved accuracy and precision. Radiat. Meas. 37,67–80.
Jain, M., Murray, A.S., BZtter-Jensen, L., 2003b. Characterisationof blue-light stimulated luminescence components in differentquartz samples: implications for dose measurement. Radiat.Meas. 37, 441–449.
Murray, A.S., Olley, J.M., 2002. Precision and accuracy in theoptically stimulated luminescence dating of sedimentary quartz:a status review. Geochronometria 21, 1–16.
Murray, A.S., Wintle, A.G., 2000. Luminescence dating of quartzusing an improved single aliquot regenerative dose protocol.Radiat. Meas. 32, 57–73.
Murray, A.S., Wintle, A.G., 2003. The single aliquot regenerativedose protocol: potential for improvements in reliability. Radiat.Meas. 37, 377–381.
Singarayer, J.S., Bailey, R.M., 2003. Further investigations ofthe quartz optically stimulated luminescence components usinglinear modulation. Radiat. Meas. 37, 451–458.
Singarayer, J.S., Bailey, R.M., 2004. Component-resolvedbleaching spectra of quartz optically stimulated luminescence:
preliminary results and implications for dating. Radiat. Meas.38, 111–118.
Smith, B.W., Aitken, M.J., Rhodes, E.J., Robinson, P., Geldard,D.M., 1986. Optical dating: methodological aspects. Radiat.Prot. Dosim. 17, 229–233.
Spooner, N.A., 1994. On the optical dating signal from quartz.Radiat. Meas. 23, 593–600.
Tsukamoto, S., Rink, W.J., Watanuki, T., 2003. OSL of tephricloess and volcanic quartz in Japan and an alternative procedurefor estimatingDe from a fast OSL component. Radiat. Meas.37, 459–465.
Wallinga, J., Murray, A.S., BZtter-Jensen, L., 2002. Measurementof dose in quartz in the presence of feldspar contamination.Radiat. Prot. Dosim. 101, 367–370.
Watanuki, T., 2002. Chronological study of loess palaeosol byimproved method of luminescence dating and application toreconstruct past environmental changes. Unpublished Ph. D.Thesis, Tokyo Metropolitan University.
Wintle, A.G., 1997. Luminescence dating: laboratory proceduresand protocols. Radiat. Meas. 27, 769–817.
Wintle, A.G., Murray, A.S., 1997. The relationship between quartzthermoluminescence, photo-transferred thermoluminescence,and optically stimulated luminescence. Radiat. Meas. 27, 611–624.
Wintle, A.G., Murray, A.S., 1998. Towards the development of apreheat procedure for OSL dating of quartz. Radiat. Meas. 29,81–94.