Efficient photocatalytic degradation of organic water pollutants using V–N-codoped TiO 2 thin films
Upload
independentCategory
view
2download
0
US
Aa
b
a
ARRAA
KUPFSO
1
daaofrSovsgcrp
pt
(
h0
Sensors and Actuators B 209 (2015) 352–358
Contents lists available at ScienceDirect
Sensors and Actuators B: Chemical
jo u r nal homep age: www.elsev ier .com/ locate /snb
pconversion based temperature sensing ability of Er3+–Yb3+codopedrWO4: An optical heating phosphor
nurag Pandeya,b, Vineet Kumar Raib,∗, Vinod Kumara, Vijay Kumara, H.C. Swarta,∗
Department of Physics, University of the Free State, Box 339, Bloemfontein 9300, South AfricaDepartment of Applied Physics, Indian School of Mines, Dhanbad 826004, India
r t i c l e i n f o
rticle history:eceived 2 September 2014eceived in revised form 19 October 2014ccepted 26 November 2014vailable online 4 December 2014
eywords:pconversion emission
a b s t r a c t
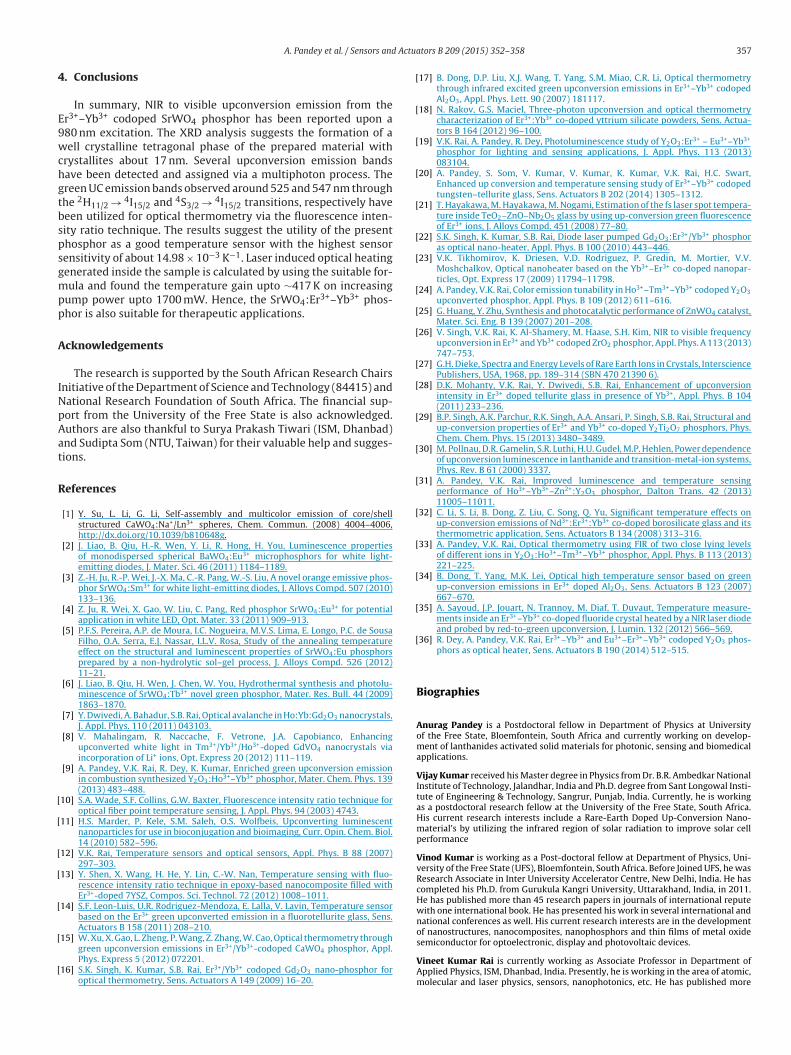
The present paper covers a detail explanation about the laser induced optical heating and temperaturesensing ability of intense green upconversion emitting Er3+–Yb3+ codoped SrWO4 phosphor. The struc-tural studies based on X-ray diffraction and Fourier transform infrared analysis confirmed the phaseformation, crystallinity and the presence of vibrational bands of the corresponding host lattice. The opti-cal investigation was performed by recording the diffuse reflectance and upconversion emission spectraupon a 980 nm excitation. Multiphoton upconversion processes were confirmed by pump power depend-ence study for the various emission bands throughout the visible region. Optical thermometry has been
ower dependenceIR techniqueensor sensitivityptical heater
performed using the fluorescence intensity ratio technique in which two thermally coupled levels ofthe green emission bands were used. A relatively low temperature (518 K) sensor with very high sensorsensitivity (14.98 × 10⁻³ K−1) is determined from the observed results. The optical heating ability of thesynthesized phosphor is also determined by using the results of the optical thermometry and found theheat generation up to ∼417 K. The results obtained may possibly be used in cancer therapy.
© 2014 Elsevier B.V. All rights reserved.
. Introduction
Alkaline metal tungstates XWO4 (X = Ca2+, Ba2+ and Sr2+)oped/codoped with rare earth ions are interesting host materialsmong researchers owing to its strong thermal/chemical stabilitynd good nonlinear optical properties [1–3]. Among these, SrWO4 isne of the important tungstates and is used by several researchersor optical and structural investigations [3–6]. Ju et al. [3,4] haveeported orange and red light emitting Sm3+ and Eu3+ dopedrWO4 phosphors for white light emitting diodes (LEDs). A studyf the structural and luminescence properties of europium acti-ated SrWO4 phosphor was done by Pereira et al. [5]. Hydrothermalynthesized Tb3+ doped SrWO4 phosphor was also investigated forreen light emission [6]. All these investigations were mainly con-entrated upon the visible emissions via UV/blue excitations but theesearch on visible light emission from lanthanides doped SrWO4hosphor via the upconversion (UC) process is still limited.
The UC emitting materials have numerous application fields inhotonics, sensing, security and medicine [7–11]. Optical tempera-ure sensors based on UC emissions from rare earth doped material
∗ Corresponding author. Tel.: +27 51 401 3852/58 718 5308; fax: +27 58 718 444.E-mail addresses: [email protected] (V.K. Rai), [email protected]
H.C. Swart).
ttp://dx.doi.org/10.1016/j.snb.2014.11.126925-4005/© 2014 Elsevier B.V. All rights reserved.
is one of the most important applications which can be imple-mented for measuring the temperature of a distant object [12]. Insuch types of sensors, the temperature is measured by evaluatingthe change in luminescence observed from two closely spaced lev-els of the emitting centres of a material [13]. The energy differencebetween these two closely spaced levels must be in the range of200–2000 cm−1 [14]. The technique used to determine the tem-perature corresponding to the variation in fluorescence emissionof the thermally coupled levels is known as a Fluorescent inten-sity ratio (FIR) technique [10,12]. The sensitivity is an importantproperty of a temperature sensing device and defined as the rate ofchange of FIR with change in temperature relative to FIR.
Triply ionized erbium (Er3+) is the best among the rare earthions to work as emitting centres due to its intense green UC emis-sion upon 980 nm excitation from two thermally coupled levels2H11/2 and 4S3/2 and it is also good for thermometric investiga-tions [15]. Several reports are available for the temperature sensingstudy of Er3+ doped/codoped materials employing the FIR tech-niques in a variety of host matrices but not for SrWO4 as hostmaterial [13–19]. Codoping of Yb3+ ions strengthened the lumi-nescence property of Er3+ doped materials via an energy transfer
process that also improves the optical/temperature sensing abil-ity [15,20]. The excitation source used to excite the material (NIRdiode laser) generates the optical heating inside the sample. Ear-lier some investigations regarding laser induced optical heating
A. Pandey et al. / Sensors and Actuators B 209 (2015) 352–358 353
SrWO
hht[Gwht
ceedo
2
2
ammYasafts
2
iBTur(
Fig. 1. XRD pattern of Er3+–Yb3+codoped
ave already been done on Er3+ doped materials [0–0]. Opticaleating in TeO2–ZnO–Nb2O5:Er3+ glass by femtosecond laser exci-ation has been reported by Hayakawa et al. [21]. Singh et al.22] have reported optical heating effects of diode laser pumpedd2O3:Er3+/Yb3+ phosphor while in fluoride nanoparticles codopedith Er3+–Yb3+ is reported by Tikhomirov et al. [23]. Still no attemptas been made to explain the pump power dependence tempera-ure rise in the tungsten based materials.
The main aim of this work is to investigate the UC lumines-ence from Er3+–Yb3+ codoped SrWO4 phosphor upon a 980 nmxcitation as well as their optical thermometry using the green UCmission bands employing the FIR technique. The reliability of theeveloped phosphor as an optical heater is also one of the objectivesf present study.
. Experimental
.1. Material preparation
The Er3+–Yb3+codoped SrWO4 phosphor has been prepared by high temperature solid state reaction route [4]. The startingaterials WO3, SrCO3, Er2O3 and Yb2O3 were taken into a stoichio-etric ratio by keeping the concentration of Er2O3 at 0.5 mol% and
b2O3 at 5.0 mol%. The weighted materials were mixed togethernd grounded about one and half hours using acetone as precur-or. The final mixture powder was kept into an alumina cruciblend preheated at 900 ◦C for 4 h in an electrical furnace and thenurther heat treated at 1300 ◦C for 4 h in an air medium. Finally,he obtained phosphor powder was used for further optical andtructural characterizations.
.2. Characterization
The structural formation of the prepared phosphor has beennvestigated by recording its X-ray diffraction (XRD) pattern using aruker-D8 advance diffractometer usinga Cu-target (� = 0.154 nm).
he Fourier transform infrared (FTIR) spectrum was recordedsing a Perkin Elmer (FTIR-2000) Spectrometer while diffuseeflectance (DR) spectrum was recorded using a Perkin ElmerLambda-950) UV–vis-NIR Spectrophotometer. The upconversion4 phosphor with JCPDS File No. 08-0490.
(UC) emission spectra of the developed powder were recordedthrough a Princeton monochromator (Acton SP-2300) attachedwith a photomultiplier tube (PMT). A power tunable near infrared(NIR) 980 nm continuous wave (CW) diode laser was used as anexcitation source. The sample was heated in a small home madefurnace and the temperature was measured with the help of athermocouple (copper-constantan) located close (in contact) to thesample for temperature sensing investigation whereas the temper-ature is controlled by varying the voltage.
3. Results and discussion
3.1. XRD analysis
The XRD pattern of SrWO4:Er3+–Yb3+ phosphor gives severalreflections that are assigned suitably as shown in Fig. 1. All thediffraction peaks agree properly with the tetragonal SrWO4 pat-tern of JCPDS No.: 08-0490 with space group I41/a (88) and latticeparameters a = b = 5.4168, c = 11.951 A and = = � = 90◦ [3,4]. Thestrongest peak detected at 2� = 27.86◦ represents the plane (1 1 2).No extra peak rather than the tetragonal SrWO4 phase is observedin the XRD pattern that confirms the incorporation of the dopantsEr3+ and Yb3+ ions into the SrWO4 matrix.
The Debye Scherrer formula was used to calculate the crystallitesize of the synthesized phosphor and is given by
d = 0.89�
cos �(1)
where d is the crystallite size, � is the wavelength of the X-rays, isfull width at half maximum and � is the diffraction angle [24]. Theaverage value of the crystallite size was found to be around 17 nmthat confirms the formation of nanostructured crystallites.
3.2. FTIR spectroscopy
The FTIR spectrum of the Er3+–Yb3+codoped SrWO4 phosphor
in the 400–4000 cm−1 range is given in Fig. 2. Several vibrationalbands have been detected and assigned due to different mode ofvibrations as listed in Table 1 [4,5,25]. The dominant band observedaround 824 cm−1 is due to the stretching mode of the O W O in
354 A. Pandey et al. / Sensors and Actuators B 209 (2015) 352–358
tcib
3
pda94
rf3
3
Seew42
si[lss
TAE
I ∝ Pn (2)
The variation of ln(Power) versus ln(Intensity) for all theobserved emission bands is shown in Fig. 6. The linear fittings of
Fig. 2. FTIR spectrum of Er3+–Yb3+ codoped SrWO4 phosphor.
he [WO4] tetrahedra whereas the weak band around 406 cm−1 isharacterized by the W O stretching vibration [4,5]. The stretch-ng and flexion mode of the Sr O is below the 150 cm−1 which iseyond the recorded range [5].
.3. Diffuse reflectance (DR) spectrum
Fig. 3 shows the DR spectrum of Er3+–Yb3+ codoped SrWO4hosphor in the 200–1100 nm range with the assignment of theifferent absorption bands corresponding to the dopant ions. Thebsorption peaks centred around 378, 521, 545, 656, 798 and75 nm are through the transitions from the 4G11/2, 2H11/2, 4S3/2,F9/2, 4I9/2, and 4I11/2/2F5/2 levels to the ground states 4I15/2/2F7/2,espectively [26]. These absorption peaks are basically due to dif-erent 4f-transitions of Er3+ and Yb3+ ions and the region below00 nm is ascribed to the band absorption of the host lattice.
.4. UC emission study
Fig. 4 displays the UC emission spectra of the Er3+–Yb3+codopedrWO4 phosphor recorded in the 300–900 nm range upon a 980 nmxcitation at different pump powers. Two dominant green UCmission bands have been marked along with the comparativelyeak blue, red and NIR bands. The emission bands peaking around
09, 525, 547, 658 and 800 nm and are due to the 2H9/2 → 4I15/2,H11/2 → 4I15/2, 4S3/2 → 4I15/2, 4F9/2 → 4I15/2 and 4I9/2 → 4I15/2 tran-itions from the Er3+ ion whereas the emission band around 489 nms due to the 2F5/2 → 2F7/2 transition of the Yb3+ion, respectively
27–29]. The peaks around 409 and 489 nm are nearly invisible atower powers as given in the inset of Fig. 4. The UC emission inten-ity is noted to increase with increasing the power of the excitationource due to the boosting of the populations in the excited statesable 1ssignment of different functional groups from the FTIR spectrum ofr3+–Yb3+codoped SrWO4 phosphor.
S. no. Band position (cm−1) Functional group
1 409.95 W O stretching vibration2 824.76 Stretching mode of O W O in
[WO4] tetrahedra3 1384.16 Bending vibration of C H4 1633.51 O H bending5 2354.56 CO2 mode6 2853.82 and 2924.48 C O vibration of CO2
7 3434.59 Stretching O H
Fig. 3. Diffuse reflectance spectrum of Er3+–Yb3+codoped SrWO4 phosphor.
of the dopant ions [29]. The multiphoton absorption and energytransfer between dopant ions are supposed to be the main causeof the observed UC emissions. The integrated intensity of the UCemission bands observed in the green region is much greater thanthat of the others; therefore the intense green light comes from theprepared phosphor upon a 980 nm diode laser excitation.
In order to check the colour of the visible light emitted fromthe developed phosphor, the colour coordinates were calculatedat different pump power as shown in the Commission Interna-tionale de l’Eclairage (CIE) chromaticity diagram (Fig. 5). The colourcoordinates were found to vary towards the pure green regionwhen increasing the excitation power from 108 mW (0.35, 0.63)to 1700 mW (0.21, 0.75). The sample emitted intense green light atthe higher powers.
The logarithmic dependence of the pump power versus UC emis-sion intensity (integrated intensity) plot gives an idea about thenumber of pump photons (n) required, as the UC emission intensity(I) and pump power (P) is related by [24,29]
Fig. 4. UC emission spectra of SrWO4:Er3+–Yb3+phosphor on increasing excitationpower.

A. Pandey et al. / Sensors and Actuators B 209 (2015) 352–358 355
Fp
t24galteact
atcsraE
FS
ig. 5. CIE chromaticity diagram of Er3+–Yb3+ codoped SrWO4 phosphor at differentump powers.
he experimental data gave slopes with values about 2.68, 1.89,.44, 2.04, 1.48 and 1.52 for the UC emission bands peaking around09, 489, 525, 547, 658 and 800 nm, respectively. This result sug-ests that three photons were responsible for the blue emissionround 409 nm whereas two for the other emission bands. At theower pump power region (before the black dotted line in Fig. 6)he numerical values of the slopes observed are less due to a lowernhancement of the rate of the UC emission intensity [30]. Remark-bly, the involvement of two photons for the band around 489 nmonfirms the possibility of its origination due to the 22F5/2 → 2F7/2ransition of the Yb3+ ion.
Fig. 7 represents the schematic energy level diagram of Er3+
nd Yb3+ ions with possible excitation and emission transitionso understand the UC mechanism. The power dependence studyonfirms three photon absorption processes that happened by
imultaneous absorption of three pump photons mediated througheal or virtual intermediate levels and some nonradiative relax-tions. A 980 nm pump photon populates the 4I13/2 level of ther3+ ion via ground state absorption (GSA) process from there theig. 6. Logarithmic dependence pump power versus UC emission intensity ofrWO4:Er3+–Yb3+phosphor.
Fig. 7. Energy level scheme of Er3+ and Yb3+ ions for various emissions ofSrWO4:Er3+–Yb3+ phosphor.
4F7/2 and 4F9/2 levels are populated by absorption of a second980 nm photon through the excited state absorption (ESA) pro-cess. The population in the 4F7/2 states relaxes nonradiatively tothe 2H11/2 and 4S3/2 levels and then to the ground state by emittinga green photon around 525 nm and 547 nm respectively. A part ofthe populations in the 4F9/2 state lift to the 2H9/2 level by absorb-ing a third 980 nm photon through the second ESA process whilethe remaining one relax nonradiatively to the 4I9/2 state. The pop-ulated 2H9/2, 4F9/2 and 4I9/2 levels transit to the ground level andemit radiations around 409, 658 and 800 nm, respectively. The Yb3+
ions enriched the population of all the emitting levels via a suitableenergy transfer (ET) process that amplify the emissions correspond-ingly. Also, a weak blue emission around 489 nm is obtained by thecooperative emission (CE) of two Yb3+ ions from a virtual level (V,having value twice of the 2F5/2) to the ground level (2F7/2) of thetriply ionized ytterbium ion that is a two photon process and isassisted by the power dependence study as mentioned earlier.
3.5. Temperature sensing and optical heating ability
To investigate the optical temperature sensing behaviour ofthe Er3+–Yb3+ codoped SrWO4 phosphor, the UC emission spec-tra upon 980 nm excitation in the 510–570 nm range on increasing
the temperature upto 518 K have been recorded keeping the powerat 285 mW as shown in Fig. 8. The integrated intensity of theUC emission bands around 525 nm and 547 nm (assigned throughFig. 8. Green UC emission spectra of SrWO4:Er3+–Yb3+phosphor on increasing tem-peratures and the variation of FIR as function of absolute temperature (inset).

356 A. Pandey et al. / Sensors and Actuators B 209 (2015) 352–358
Fo
trttccUrop[
itow
F
wtttl
tt8eaT
S
w([f1obat
range for hyperthermia based cancer treatment [36], so the opticalheat generated in the present phosphor sample is suitable for itsapplication in cancer therapy.
Table 2Calculated values of temperature at different pump powers and corresponding FIRvalues for Er3+–Yb3+ codoped SrWO4 phosphor.
S. no. Pump power (mW) FIR Temperature (K)
1 108 1.17 299.8792 285 1.31 312.0933 453 1.41 320.592
ig. 9. Plot of logarithmic of FIR versus inverse absolute temperature and variationf sensor sensitivity as function of temperature (inset).
he 2H11/2 → 4I15/2 and 4S3/2 → 4I15/2 transitions of the Er3+ ionespectively) seemed to vary with increasing the temperature ofhe sample. At room temperature (300 K) the intensity of bothhe transitions were nearly equal whereas at 518 K the intensityorresponding to the 4S3/2 → 4I15/2 transition is reduced more inomparison to that of the 2H11/2 → 4I15/2 transition. This change inC intensity of the two emission bands is shown in the intensity
atio (I525nm/I547nm) versus temperature plot (inset of Fig. 8). Theverall intensity, however, has decreased with the increasing tem-erature value due to the increasing nonradiative relaxation rates31].
It is well known that the 2H11/2 and 4S3/2 levels of the triplyonized erbium ion are thermally coupled and the transition fromhese two levels to a ground state of the Er3+ ion can be used forptical thermometry using the FIR technique [16,19] and can beritten for present case as
IR = I525
I547= B exp
(−�E
kT
)(3)
here I525 and I547 are the integrated intensities corresponding tohe 2H11/2 → 4I15/2 and 4S3/2 → 4I15/2 transitions respectively, B ishe pre-exponential constant, �E is the energy difference betweenhe 2H11/2 and 4S3/2 levels, k is Boltzmann’s constant and T is abso-ute temperature [16,19].
In accordance with Eq. (3), the ln(I525/I547) is plotted againsthe inverse absolute temperature as shown in Fig. 9. The linear fit-ing of the experimental data gave slope and intercept equal to66.05 ± 56.91 and 3.04 ± 0.15, respectively. This resulted into thenergy difference value �E of the two thermally coupled levelsbout 601.99 ± 39.56 cm−1 and coefficient B of about 21.12 ± 1.16.he sensor sensitivity (S) is calculated using the formula
= dR
dT= FIR
(�E
kT2
)(4)
here the term R is the symbol used for fluorescence intensity ratioFIR) and other terms have their usual meaning as mentioned before19,31]. The calculated values of sensor sensitivity were plotted as aunction of absolute temperature and found to be maximum about4.98 × 10−3 K−1 at 403 K as given in the inset of Fig. 9. Thus the
bserved sensor sensitivity of the present phosphor was found toe the highest sensitivity reported till date for the low temper-ture range [13–19,31–34]. So, the present material is good foremperature sensing application with very good sensor sensitivity.Fig. 10. Green UC emission spectra of SrWO4:Er3+–Yb3+phosphor at two extremepowers and a plot of sample temperature as function of pump power (inset).
Fig. 10 shows the UC emission spectra of the synthesized phos-phor upon 980 nm excitation at two pump power values of 108 and1700 mW. At lower pump power the intensity of both the bandsare nearly equal whereas on increasing the power the intensitycorresponding to the 4S3/2 → 4I15/2 transition becomes very low incomparison to that of the 2H11/2 → 4I15/2 transition. This variationin intensity of the green emission bands increased their inten-sity ratio on increasing the excitation power. According to the FIRtechnique, intensity ratio changes in accordance of temperaturevariation while the intensity ratio also depends upon pump power,so temperature can be correlated with pump excitation power. Thepower dependence temperature gain of the sample is basically dueto energy absorbed by crystalline powders and transferred into heatthrough nonradiative channels [35,36]. This optical heating gener-ated by the laser excitation can be calculated by using Eq. (3) thatis converted into the following form
T =(
�E
k
) [1
ln(B) − ln(I525/I547)
](5)
where all the terms have their usual meanings. Using the values of�E and B from the temperature sensing study (�E = 601.99 cm−1
and B = 21.12) and the FIR corresponding to various pump powers,the temperature raise of the sample was calculated by using Eq.(5) as listed in Table 2. A variation of temperature versus pumppower is also given in the inset of Fig. 10. From the table it is con-firmed that the temperature increases with increasing the pumppower and the calculated temperature was found to be maximumvalue (∼417 K) at 1700 mW. This temperature gain is in the required
4 777 1.84 355.6335 1100 2.15 379.9256 1410 2.45 403.0187 1700 2.63 416.768
Actua
4
E9wchgtbspsgmpp
A
INpAat
R
[
[
[
[
[
[
[
[
[
[
[
[
[
[
[
[
[
[
[
[
[
[
[
[
[
[
[
A. Pandey et al. / Sensors and
. Conclusions
In summary, NIR to visible upconversion emission from ther3+–Yb3+ codoped SrWO4 phosphor has been reported upon a80 nm excitation. The XRD analysis suggests the formation of aell crystalline tetragonal phase of the prepared material with
rystallites about 17 nm. Several upconversion emission bandsave been detected and assigned via a multiphoton process. Thereen UC emission bands observed around 525 and 547 nm throughhe 2H11/2 → 4I15/2 and 4S3/2 → 4I15/2 transitions, respectively haveeen utilized for optical thermometry via the fluorescence inten-ity ratio technique. The results suggest the utility of the presenthosphor as a good temperature sensor with the highest sensorensitivity of about 14.98 × 10⁻³ K−1. Laser induced optical heatingenerated inside the sample is calculated by using the suitable for-ula and found the temperature gain upto ∼417 K on increasing
ump power upto 1700 mW. Hence, the SrWO4:Er3+–Yb3+ phos-hor is also suitable for therapeutic applications.
cknowledgements
The research is supported by the South African Research Chairsnitiative of the Department of Science and Technology (84415) andational Research Foundation of South Africa. The financial sup-ort from the University of the Free State is also acknowledged.uthors are also thankful to Surya Prakash Tiwari (ISM, Dhanbad)nd Sudipta Som (NTU, Taiwan) for their valuable help and sugges-ions.
eferences
[1] Y. Su, L. Li, G. Li, Self-assembly and multicolor emission of core/shellstructured CaWO4:Na+/Ln3+ spheres, Chem. Commun. (2008) 4004–4006,http://dx.doi.org/10.1039/b810648g.
[2] J. Liao, B. Qiu, H.-R. Wen, Y. Li, R. Hong, H. You, Luminescence propertiesof monodispersed spherical BaWO4:Eu3+ microphosphors for white light-emitting diodes, J. Mater. Sci. 46 (2011) 1184–1189.
[3] Z.-H. Ju, R.-P. Wei, J.-X. Ma, C.-R. Pang, W.-S. Liu, A novel orange emissive phos-phor SrWO4:Sm3+ for white light-emitting diodes, J. Alloys Compd. 507 (2010)133–136.
[4] Z. Ju, R. Wei, X. Gao, W. Liu, C. Pang, Red phosphor SrWO4:Eu3+ for potentialapplication in white LED, Opt. Mater. 33 (2011) 909–913.
[5] P.F.S. Pereira, A.P. de Moura, I.C. Nogueira, M.V.S. Lima, E. Longo, P.C. de SousaFilho, O.A. Serra, E.J. Nassar, I.L.V. Rosa, Study of the annealing temperatureeffect on the structural and luminescent properties of SrWO4:Eu phosphorsprepared by a non-hydrolytic sol–gel process, J. Alloys Compd. 526 (2012)11–21.
[6] J. Liao, B. Qiu, H. Wen, J. Chen, W. You, Hydrothermal synthesis and photolu-minescence of SrWO4:Tb3+ novel green phosphor, Mater. Res. Bull. 44 (2009)1863–1870.
[7] Y. Dwivedi, A. Bahadur, S.B. Rai, Optical avalanche in Ho:Yb:Gd2O3 nanocrystals,J. Appl. Phys. 110 (2011) 043103.
[8] V. Mahalingam, R. Naccache, F. Vetrone, J.A. Capobianco, Enhancingupconverted white light in Tm3+/Yb3+/Ho3+-doped GdVO4 nanocrystals viaincorporation of Li+ ions, Opt. Express 20 (2012) 111–119.
[9] A. Pandey, V.K. Rai, R. Dey, K. Kumar, Enriched green upconversion emissionin combustion synthesized Y2O3:Ho3+–Yb3+ phosphor, Mater. Chem. Phys. 139(2013) 483–488.
10] S.A. Wade, S.F. Collins, G.W. Baxter, Fluorescence intensity ratio technique foroptical fiber point temperature sensing, J. Appl. Phys. 94 (2003) 4743.
11] H.S. Marder, P. Kele, S.M. Saleh, O.S. Wolfbeis, Upconverting luminescentnanoparticles for use in bioconjugation and bioimaging, Curr. Opin. Chem. Biol.14 (2010) 582–596.
12] V.K. Rai, Temperature sensors and optical sensors, Appl. Phys. B 88 (2007)297–303.
13] Y. Shen, X. Wang, H. He, Y. Lin, C.-W. Nan, Temperature sensing with fluo-rescence intensity ratio technique in epoxy-based nanocomposite filled withEr3+-doped 7YSZ, Compos. Sci. Technol. 72 (2012) 1008–1011.
14] S.F. Leon-Luis, U.R. Rodriguez-Mendoza, E. Lalla, V. Lavin, Temperature sensorbased on the Er3+ green upconverted emission in a fluorotellurite glass, Sens.Actuators B 158 (2011) 208–210.
15] W. Xu, X. Gao, L. Zheng, P. Wang, Z. Zhang, W. Cao, Optical thermometry throughgreen upconversion emissions in Er3+/Yb3+-codoped CaWO4 phosphor, Appl.Phys. Express 5 (2012) 072201.
16] S.K. Singh, K. Kumar, S.B. Rai, Er3+/Yb3+ codoped Gd2O3 nano-phosphor foroptical thermometry, Sens. Actuators A 149 (2009) 16–20.
tors B 209 (2015) 352–358 357
17] B. Dong, D.P. Liu, X.J. Wang, T. Yang, S.M. Miao, C.R. Li, Optical thermometrythrough infrared excited green upconversion emissions in Er3+–Yb3+ codopedAl2O3, Appl. Phys. Lett. 90 (2007) 181117.
18] N. Rakov, G.S. Maciel, Three-photon upconversion and optical thermometrycharacterization of Er3+:Yb3+ co-doped yttrium silicate powders, Sens. Actua-tors B 164 (2012) 96–100.
19] V.K. Rai, A. Pandey, R. Dey, Photoluminescence study of Y2O3:Er3+ – Eu3+–Yb3+
phosphor for lighting and sensing applications, J. Appl. Phys. 113 (2013)083104.
20] A. Pandey, S. Som, V. Kumar, V. Kumar, K. Kumar, V.K. Rai, H.C. Swart,Enhanced up conversion and temperature sensing study of Er3+–Yb3+ codopedtungsten–tellurite glass, Sens. Actuators B 202 (2014) 1305–1312.
21] T. Hayakawa, M. Hayakawa, M. Nogami, Estimation of the fs laser spot tempera-ture inside TeO2–ZnO–Nb2O5 glass by using up-conversion green fluorescenceof Er3+ ions, J. Alloys Compd. 451 (2008) 77–80.
22] S.K. Singh, K. Kumar, S.B. Rai, Diode laser pumped Gd2O3:Er3+/Yb3+ phosphoras optical nano-heater, Appl. Phys. B 100 (2010) 443–446.
23] V.K. Tikhomirov, K. Driesen, V.D. Rodriguez, P. Gredin, M. Mortier, V.V.Moshchalkov, Optical nanoheater based on the Yb3+–Er3+ co-doped nanopar-ticles, Opt. Express 17 (2009) 11794–11798.
24] A. Pandey, V.K. Rai, Color emission tunability in Ho3+–Tm3+–Yb3+ codoped Y2O3
upconverted phosphor, Appl. Phys. B 109 (2012) 611–616.25] G. Huang, Y. Zhu, Synthesis and photocatalytic performance of ZnWO4 catalyst,
Mater. Sci. Eng. B 139 (2007) 201–208.26] V. Singh, V.K. Rai, K. Al-Shamery, M. Haase, S.H. Kim, NIR to visible frequency
upconversion in Er3+ and Yb3+ codoped ZrO2 phosphor, Appl. Phys. A 113 (2013)747–753.
27] G.H. Dieke, Spectra and Energy Levels of Rare Earth Ions in Crystals, IntersciencePublishers, USA, 1968, pp. 189–314 (SBN 470 21390 6).
28] D.K. Mohanty, V.K. Rai, Y. Dwivedi, S.B. Rai, Enhancement of upconversionintensity in Er3+ doped tellurite glass in presence of Yb3+, Appl. Phys. B 104(2011) 233–236.
29] B.P. Singh, A.K. Parchur, R.K. Singh, A.A. Ansari, P. Singh, S.B. Rai, Structural andup-conversion properties of Er3+ and Yb3+ co-doped Y2Ti2O7 phosphors, Phys.Chem. Chem. Phys. 15 (2013) 3480–3489.
30] M. Pollnau, D.R. Gamelin, S.R. Luthi, H.U. Gudel, M.P. Hehlen, Power dependenceof upconversion luminescence in lanthanide and transition-metal-ion systems,Phys. Rev. B 61 (2000) 3337.
31] A. Pandey, V.K. Rai, Improved luminescence and temperature sensingperformance of Ho3+–Yb3+–Zn2+:Y2O3 phosphor, Dalton Trans. 42 (2013)11005–11011.
32] C. Li, S. Li, B. Dong, Z. Liu, C. Song, Q. Yu, Significant temperature effects onup-conversion emissions of Nd3+:Er3+:Yb3+ co-doped borosilicate glass and itsthermometric application, Sens. Actuators B 134 (2008) 313–316.
33] A. Pandey, V.K. Rai, Optical thermometry using FIR of two close lying levelsof different ions in Y2O3:Ho3+–Tm3+–Yb3+ phosphor, Appl. Phys. B 113 (2013)221–225.
34] B. Dong, T. Yang, M.K. Lei, Optical high temperature sensor based on greenup-conversion emissions in Er3+ doped Al2O3, Sens. Actuators B 123 (2007)667–670.
35] A. Sayoud, J.P. Jouart, N. Trannoy, M. Diaf, T. Duvaut, Temperature measure-ments inside an Er3+–Yb3+ co-doped fluoride crystal heated by a NIR laser diodeand probed by red-to-green upconversion, J. Lumin. 132 (2012) 566–569.
36] R. Dey, A. Pandey, V.K. Rai, Er3+–Yb3+ and Eu3+–Er3+–Yb3+ codoped Y2O3 phos-phors as optical heater, Sens. Actuators B 190 (2014) 512–515.
Biographies
Anurag Pandey is a Postdoctoral fellow in Department of Physics at Universityof the Free State, Bloemfontein, South Africa and currently working on develop-ment of lanthanides activated solid materials for photonic, sensing and biomedicalapplications.
Vijay Kumar received his Master degree in Physics from Dr. B.R. Ambedkar NationalInstitute of Technology, Jalandhar, India and Ph.D. degree from Sant Longowal Insti-tute of Engineering & Technology, Sangrur, Punjab, India. Currently, he is workingas a postdoctoral research fellow at the University of the Free State, South Africa.His current research interests include a Rare-Earth Doped Up-Conversion Nano-material’s by utilizing the infrared region of solar radiation to improve solar cellperformance
Vinod Kumar is working as a Post-doctoral fellow at Department of Physics, Uni-versity of the Free State (UFS), Bloemfontein, South Africa. Before Joined UFS, he wasResearch Associate in Inter University Accelerator Centre, New Delhi, India. He hascompleted his Ph.D. from Gurukula Kangri University, Uttarakhand, India, in 2011.He has published more than 45 research papers in journals of international reputewith one international book. He has presented his work in several international andnational conferences as well. His current research interests are in the development
of nanostructures, nanocomposites, nanophosphors and thin films of metal oxidesemiconductor for optoelectronic, display and photovoltaic devices.Vineet Kumar Rai is currently working as Associate Professor in Department ofApplied Physics, ISM, Dhanbad, India. Presently, he is working in the area of atomic,molecular and laser physics, sensors, nanophotonics, etc. He has published more

3 Actua
tt
Hva
developing materials for nano-solid state lighting. He has been key in the devel-
58 A. Pandey et al. / Sensors and
han 75 articles in reputed international journals, 3 book chapters, and has con-
ributed to a number of national/international conferences/seminars.endrik C. Swart is a senior professor in the Department of Physics at the Uni-ersity of the Free State. Over the past 19 years he has led research in therea of the degradation of phosphors for field emission displays, as well as
tors B 209 (2015) 352–358
opment of processes to synthesize and deposit thin films of various types ofsemiconductor nano-particles which will enhance the colour, luminescent inten-sity and lifetime of such displays. He has more than 300 publications in internationalpeer reviewed journals.
Copyright © 2022 FDOKUMEN