Pump-induced refractive index modulation and dispersions in Er3+-doped fibers
7
132 JOURNAL OF LIGH CHNO Pump-Induced Refractive Inde and Dispersions in Er3+-Do Carsten Thirstrun Yuan Shi, and Bera Phlsd Abstract-A novel measurement system provides determination of pump induced phase shifts in erbium doped fibers with an accuracy of ~7i/20. Using this system, a systematical analysis of the pump induced modulation of the refractive index and dispersions for a signal at 1550 nm and a pump at 980 nm is reported. The analysis contains measurements of pump in- duced refractive index changes as function of wavelength, pump power, and doping concentration. A model taking account of the contribution to the refractive index changes from optical transitions between 4115,2 states and 4113,2 states in Er- yields good agreement to experimental results apart from a wavelength independent offset. The offset is interpreted to originate from high energetic optical transitions. The results show that for a large refractive index modulation, a short and highly doped fiber should be used with limited amplified spontaneous emission effect. In optical communication systems comprising erbium doped fiber amplifiers, a tradeoff between dispersion and amplification must be made. I. INTRODUCTION HE RESONANT enhanced optical nonlinearities and T dispersions caused by erbium ions (Er3+) in a glass matrix are currently attracting considerable interest [ 1-51 since they influence the performance of erbium doped fiber amplifiers (EDFA’s) which have important applications in soliton transmission systems, short pulse fiber lasers, and cascaded EDFA’s in transmission systems. In order to optimize these components and systems, it is therefore important to understand how the nonlinearities and dispersions depend on fiber parameters such as doping concentration, pump power, and fiber dimensions. Pumping an Er3+-doped Si02 fiber at 980 nm, Fleming et al. [l] have measured phase shifts of light for wavelengths close to the resonant wavelength of 1530 nm, where the ampli- fication is maximum. The phase shifts were measured using a fiber Mach-Zehnder interferometer; however, the authors did not succeed in determining the phase shifts accurately with the method because of many factors, such as power levels in each arm and fringe visibility due to polarization mismatch. Spectral dependence of output coupling ratio also had to be taken into account [I]. Other authors have determined pump induced phase shifts indirectly from the switching characteristics of a twin core fiber coupler [2-51. Using this technique, the phase Manuscript received July 14, 1994, revised January 25, 1996. C Thustrup is with the Mikroelektronik Centret, Technical Umversity of Denmark, Building 345 East 2800 Lyngby, Denmark He is also with Surface and Interface Laboratory, RIKEN, Saitama, Japan Y Sh is with the Mikroelektronik Centret, Technical University of Den- mark, 2800 Lyngby, Denmark. He is also with E-TEK Dynmcs, Inc , San Jose, CA 95131 USA B Pilsdottir is with the Lycom NS, NKT All 75,2605 Brgndby, Denmark. Publisher Item Identifier S 0733-8724(96)03545-1 shifts have been measured nm and a signal wa nm PI, PI 2nd b) for determining the doped fibers is rep0 wavelength of 980 nm transition enhances The measurement s and a signal wavelengt A differential detection the phase measurements spontaneous emission ( also be useful in inv semiconductor doped centers [6]. Employing the measurement transitions between 4I sections, and it yiel results apart from a index changes. Authorized licensed use limited to: Danmarks Tekniske Informationscenter. Downloaded on March 09,2010 at 06:26:43 EST from IEEE Xplore. Restrictions apply.
Transcript of Pump-induced refractive index modulation and dispersions in Er3+-doped fibers
132 JOURNAL OF LIGH CHNO
Pump-Induced Refractive Inde and Dispersions in Er3+-Do
Carsten Thirstrun Yuan Shi, and Bera Phlsd
Abstract-A novel measurement system provides determination of pump induced phase shifts in erbium doped fibers with an accuracy of ~7i/20. Using this system, a systematical analysis of the pump induced modulation of the refractive index and dispersions for a signal at 1550 nm and a pump at 980 nm is reported. The analysis contains measurements of pump in- duced refractive index changes as function of wavelength, pump power, and doping concentration. A model taking account of the contribution to the refractive index changes from optical transitions between 4115,2 states and 4113,2 states in Er- yields good agreement to experimental results apart from a wavelength independent offset. The offset is interpreted to originate from high energetic optical transitions. The results show that for a large refractive index modulation, a short and highly doped fiber should be used with limited amplified spontaneous emission effect. In optical communication systems comprising erbium doped fiber amplifiers, a tradeoff between dispersion and amplification must be made.
I. INTRODUCTION
HE RESONANT enhanced optical nonlinearities and T dispersions caused by erbium ions (Er3+) in a glass matrix are currently attracting considerable interest [ 1-51 since they influence the performance of erbium doped fiber amplifiers (EDFA’s) which have important applications in soliton transmission systems, short pulse fiber lasers, and cascaded EDFA’s in transmission systems. In order to optimize these components and systems, it is therefore important to understand how the nonlinearities and dispersions depend on fiber parameters such as doping concentration, pump power, and fiber dimensions.
Pumping an Er3+-doped Si02 fiber at 980 nm, Fleming et al. [l] have measured phase shifts of light for wavelengths close to the resonant wavelength of 1530 nm, where the ampli- fication is maximum. The phase shifts were measured using a fiber Mach-Zehnder interferometer; however, the authors did not succeed in determining the phase shifts accurately with the method because of many factors, such as power levels in each arm and fringe visibility due to polarization mismatch. Spectral dependence of output coupling ratio also had to be taken into account [I]. Other authors have determined pump induced phase shifts indirectly from the switching characteristics of a twin core fiber coupler [2-51. Using this technique, the phase
Manuscript received July 14, 1994, revised January 25, 1996. C Thustrup is with the Mikroelektronik Centret, Technical Umversity of
Denmark, Building 345 East 2800 Lyngby, Denmark He is also with Surface and Interface Laboratory, RIKEN, Saitama, Japan
Y S h is with the Mikroelektronik Centret, Technical University of Den- mark, 2800 Lyngby, Denmark. He is also with E-TEK Dynmcs , Inc , San Jose, CA 95131 USA
B Pilsdottir is with the Lycom NS, NKT All 75,2605 Brgndby, Denmark. Publisher Item Identifier S 0733-8724(96)03545-1
shifts have been measured nm and a signal wa nm P I , P I 2nd b)
for determining the doped fibers is rep0 wavelength of 980 nm
transition enhances
The measurement s
and a signal wavelengt
A differential detection the phase measurements spontaneous emission (
also be useful in inv semiconductor doped centers [6].
Employing the measurement
transitions between 4I
sections, and it yiel results apart from a
index changes.
Authorized licensed use limited to: Danmarks Tekniske Informationscenter. Downloaded on March 09,2010 at 06:26:43 EST from IEEE Xplore. Restrictions apply.
THIRSTRUP et al.: PUMP-INDUCED REFRACTIVE INDEX MODULATION 133
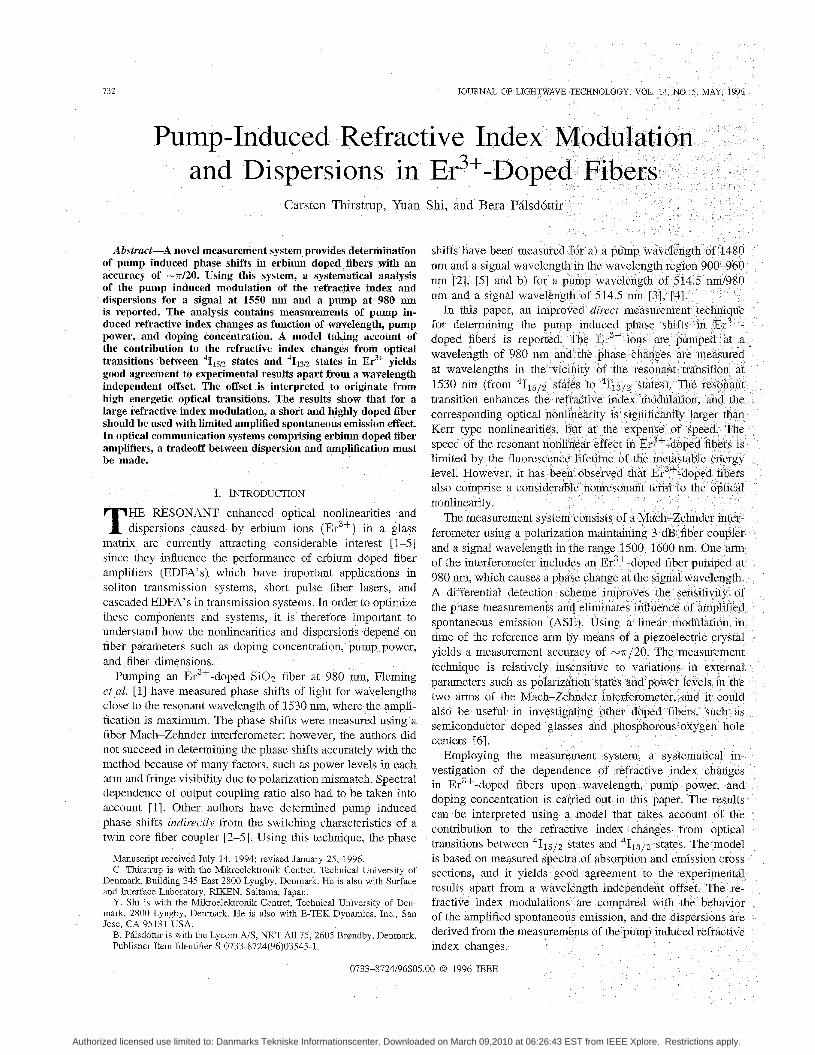
Fig. 1. Schematic of the setup for directly measuring pump induced phase modulation in 13r3+-doped fibers. T.S.: tunable semiconductor Iiser; S.F.: single mode fiber; M.O.: microscope objective; POL.: polarizer; B.S.: beam splitter; M.: mirror; WDM: 980 nd1550 nm wavelength division multiplexer; S.L.: spherical lens; E.D.F.: Er3+-doped fiber; P.E.: piezoelectric crystal; S.F.C.: (polarization maintaining) 3 dB single mode fiber coupler; F.: pump block filter; P.D.: photodiode. The system is described in the text.
11. EXPERIMENTAL SETUP technique is based on measuring phase differences rather than
The system employed for measuring pump induced phase shifts in Er3+-doped fibers is shown in Fig. 1. Pump light at 980 nm from a Tksapphire laser pumped by an Ar+-laser is chopped and coupled into the Er3+-doped fiber (E.D.F.) via a wavelength division multiplexer (WDM). The Er3+-doped fiber is mounted in one arm of a Mach-Zehnder interferometer. Circular polarized signal light from a tunable GaInAsP laser with wavelengths from 1500 to 1600 nm and output intensity of -30 pW is coupled into the Mach-Zehnder interferometer with -80% of the power coupled into the Er3+-doped fiber via the WDM and -20% coupled into the reference arm. Light from both arms of the interferometer is collimated and coupled into corresponding single mode polarization maintaining fiber arms of a 3 dB coupler, and two InGaAs photodiode detectors are used to monitor the light from the two output ports of the fiber coupler. Using a differential detection scheme eliminates influence of ASE and increases the detection sensitivity. The phase in the reference arm is linearly modulated in time, drn = w t , by means of a piezoelectric crystal. This results in a response of the detected signal, which in the case of no pump can be written
0: cos(wt + $0) and in presence of the pump
Aldet cos(wt -I- $0 $ p )
where $0 is an arbitrary phase and qhP is the pump induced phase shift of the signal. 4p is determined by measuring the phase difference of the cosine waveforms before and after the pump is turned on by the optical chopper. Since the
amplitudes, it is relatively insensitive to changes in power levels and polarization states of the two interferometric arms and spectral dependence of the output coupling ra.io. The accuracy of the phase measurement is limited by the resolution of the digitall oscilloscope which displays the waveforms and it is estimated to be 7r/20. This is a large improvement in accuracy compared to previous reports of direct meaw rements of the pump induced phase shifts [l]. The linearity of the piezoelectric modulation has been controlled by measuring the phase changes for different periods of the cosine waveform. The changes were found to be within the measuring accuracy for each period.
111. MODEL
A. Analysis Based on Absorption and Emission Cross Sections
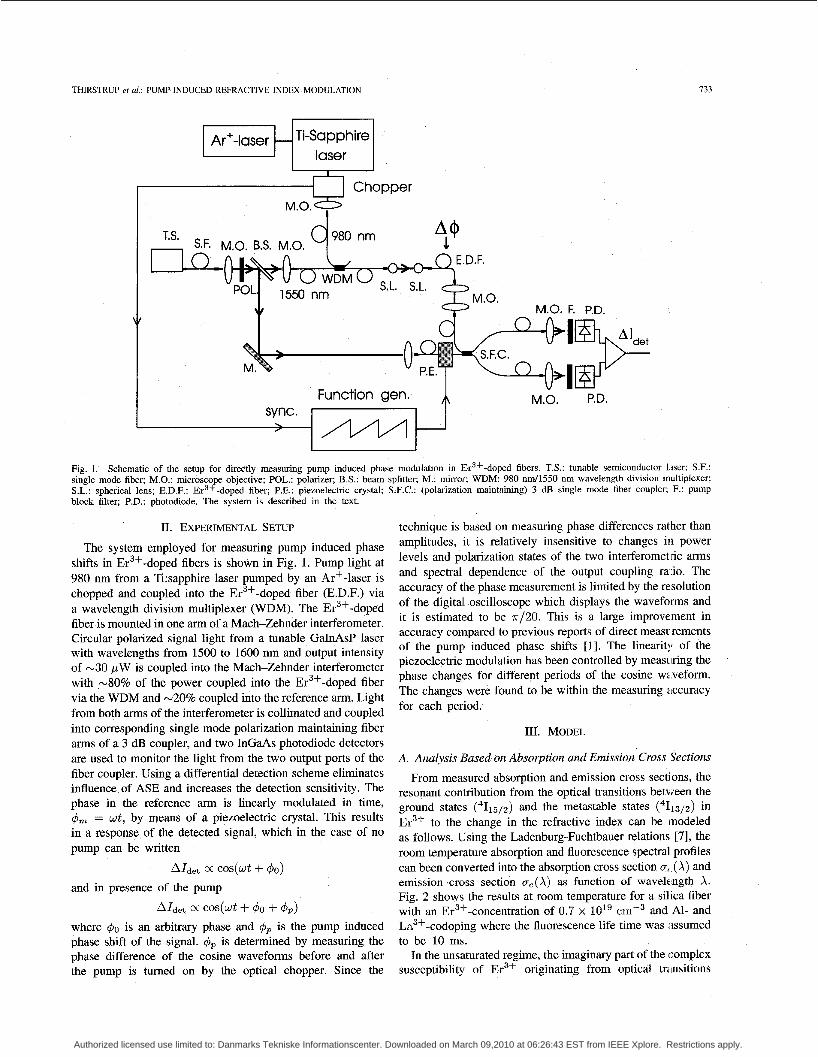
From measured absorption and emission cross sect] ons, the resonant contribution from the optical transitions between the ground states (4115/2) and the metastable states (4113/2) in Er3+ to the change in the refractive index can be inodeled as follows. tJsing the Ladenburg-Fuchtbauer relations [7], the room temperature absorption and fluorescence spectral profiles can been converted into the absorption cross section oc (A) and emission cross section a,(A) as function of wavelength A. Fig. 2 shows the results at room temperature for a silica fiber with an Er3'-concentration of 0.7 x and Al- and La3+-codoping where the fluorescence life time was msumed to be 10 ms.
In the unsaturated regime, the imaginary part of the complex susceptibility of Er3+ originating from optical transitions
Authorized licensed use limited to: Danmarks Tekniske Informationscenter. Downloaded on March 09,2010 at 06:26:43 EST from IEEE Xplore. Restrictions apply.
134 JOURNAL OF LIGH
g I z ( v - UO) is the 1
0.0 1400 1450 1500 1550 1600 1650
Wavelength (nm)
Fig 2. Room temperature absorption and emssion cross-section spectra measured lor an Er3+-doped fiber with an Er3+-concentration of 0 7 x ~ r n - ~
between 4115/2 states and 4113,2 states has been derived by Desurvire [ 81 ;
x 27r X ’ V , = -.-[NZ(Z)ae(X) - JJ1(z)a,(X)I (1)
where n is the refractive index of the material, Nl( z ) and Nz(z) are the average populations of the 4115/2 energy level and the 4113/2 energy level at the position z [8]
where N is the doping concentration, Ppump(z) is the pump power at z, and P t h is a threshold pump power.
The pump induced change in the refractive index An can then be obtained from
L An(A) = - [&(A, z’) - xb(A, d)] dZ’ (3) 2 L
where L is the length of the fiber, rs is the confinement factor of the signal, x’p and x i are the real parts of the complex susceptibility with and without the pump, respectively. For each z’ along the fiber, x>(xb) can readily be obtained by performing the Kramers-Kronig hansform [9] on the cone- sponding imaginary part of the susceptibility x$ (x:) which is given by (1).
B. Analytical Expression
An analytical expression for xt(i = P, 0) can be obtained by assuming a two level laser system and that the optical transitions have Lorentzian lineshapes [ 101
A3 x : ( W = - [ N 1 ( Z ) - N 2 i Z ) I ~ S l Z ( U - .O) (4)
where U is the optical frequency and uo is the resonance frequency, r2 is the lifetime of the metastable state and
I‘12 being the full width It is now assumed that
along the fiber with Ppump exp( - -Q~Pz) . U (2), inserting (4) into (3)
+ P t h e a P L {CWL - log Ppump
Ppurnp f P t h
It is observed from is determined by the
A cross phase optical no signal rtsp can be defined from
where An is the signal as defined in pump guided in the
from (6) and (7
time response of the
ms. A large nonresonant in the erbium-doped fib following section.
According to (6) causes a correspond
and dashdotted c from the model
Authorized licensed use limited to: Danmarks Tekniske Informationscenter. Downloaded on March 09,2010 at 06:26:43 EST from IEEE Xplore. Restrictions apply.
THIRSTRUP et al.. PUMP-INDUCED REFRACTIVE INDEX MODULATION 135
I 0 4.0 v
& 3.0 c
0 2 2.0
x 1.0
.E 0.0 Q) V
W
0 .L - 1 .o
2-2.0
c
-P = 1.0 mW OQQQQ P = 2.2 mW
P = 4.2 mW
%I -3.0 1500 1520 1540 1560 1580 1600
Wavelength (nm)
(a)
5 ::: & 3.0
2.0 c
U
x 1 .o
.s 0.0
W U
a,
0
2 - 1 .o U
2 -2.0 U-
"I -3.0 1500 1520 1540 1560 1580 1600
Wavelength (nm)
(b)
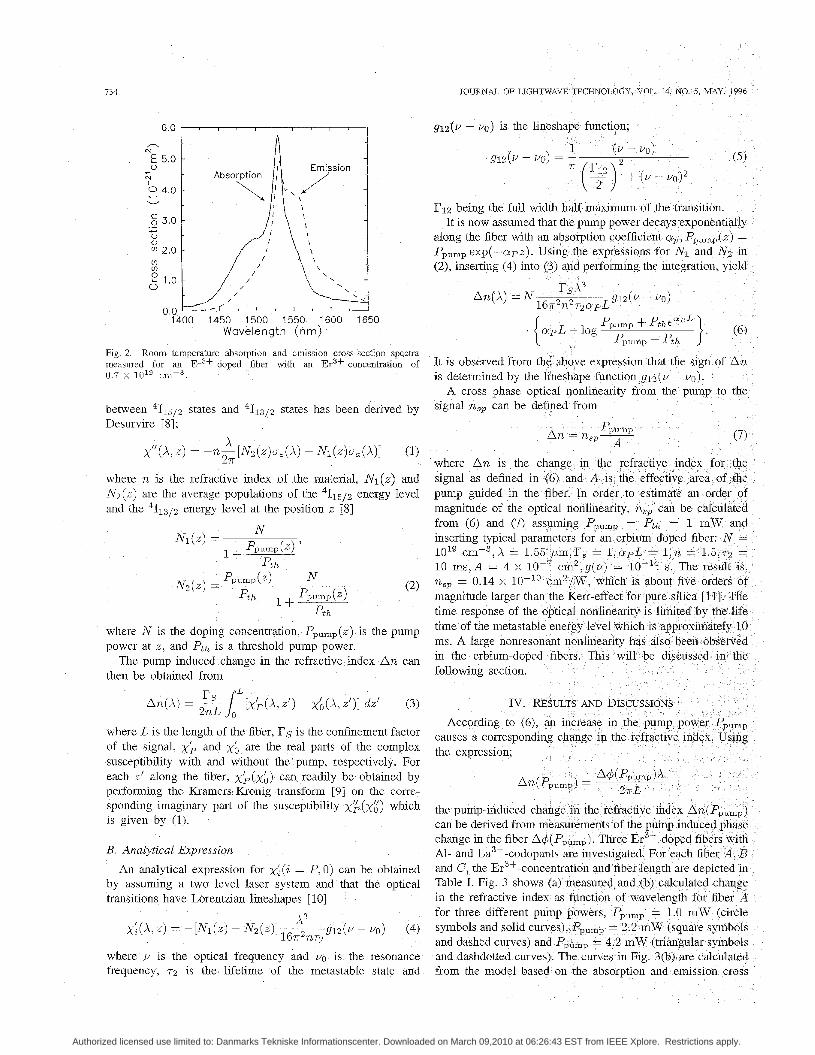
Fig. 3. Measured (a) and calculated (b) refractive index change as function of signal wavelength for fiber A (Er3+-doping concentration of 0.7 x lo1' ~ r n - ~ ) at an absorbed pump power of 1.0 mW (circular symbols and solid curves), 2.2 mW (square symbols and dashed curves) and 4.2 mW (triangular symbols and dashdotted curves). The wavelength of the pump power is 980 nm. The threshold pump power Pth has been set equal to 0.8 mW and the offsets for the calculated solid, dashed, and dashdotted curves in (a) have been set equal to 0.4 x 10-7,0.8 x respectively (see text).
and 1.1 x
sections for transitions between 4115/2 states and 41,3/2 states in Er3+ as described in section IIIA. In order to fit the data, Pth is set equal to 0.8 mW for all three curves, and a constant of 0.4 x 10V7,0.8 x loV7 and 1.1 x lou7, is added to the solid, the dashed, and the dashdotted curve, respectively. The presence of this offset in An implies that besides the optical transitions between 4115/2 states and 4113/2 states there are other contributions to the optical nonlinearity. When the offsets are subtracted, the changes in the refractive index are positive below the resonant wavelength A0 = 1530 nm[v > vo in ( 5 ) ] and negative above the resonant wavelength [v < vo in (5)] as expected from (5) and (6).
A method often used to determine refractive index changes An, is based on employing the Kramers-Kronig transform on experimental absorption data. For the electro-optical effect in III-V semiconductor quantum wells [12], this technique has
TABLE I PARAMETERS FOR THE FIBERS USED IN THE EXPERIMENTS
A
B
127 0 .7~10 '~
81 2~1019
C 35 8x10'9
m-
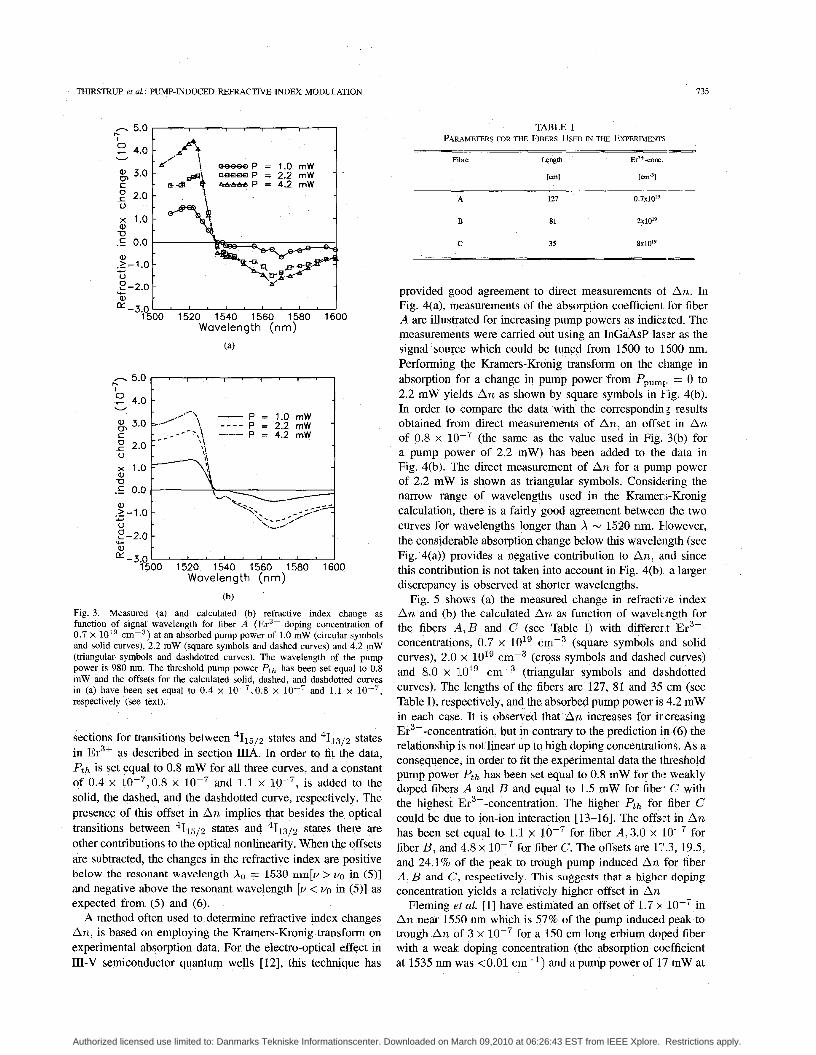
provided good agreement to direct measurements of An. In Fig. 4(a), measurements of the absorption coefficient for fiber A are illustrated for increasing pump powers as indicated. The measurements were carried out using an InGaAsP lasx as the signal source which could be tuned from 1500 to 1600 nm. Performing the Kramers-Kronig transform on the change in absorption for a change in pump power from Ppumy, = 0 to 2.2 mW yields An as shown by square symbols in F'ig. 4(b). In order to compare the data with the correspondin,; results obtained from direct measurements of An, an offset in An of 0.8 x (the same as the value used in Fig. 3(b) for a pump power of 2.2 mW) has been added to the data in Fig. 4(b). The direct measurement of An for a pump power of 2.2 mW is shown as triangular symbols. Considering the narrow range of wavelengths used in the Kramer,+Kronig calculation, there is a fairly good agreement between the two curves for wavelengths longer than X N 1520 nm. However, the considerable absorption change below this wavelength (see Fig. 4(a)) provides a negative contribution to An, and since this contribution is not taken into account in Fig. 4(b) a larger discrepancy is observed at shorter wavelengths.
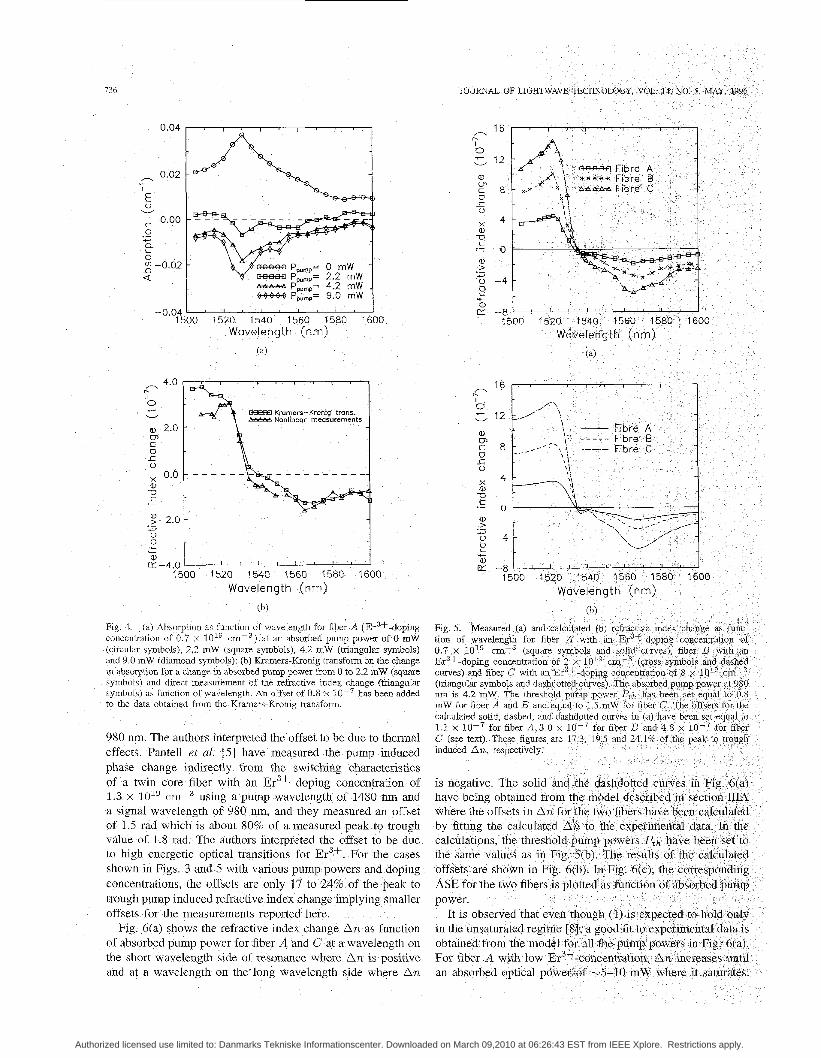
Fig. 5 shows (a) the measured change in refractile index An and (b) the calculated An as function of wavelength for the fibers A , B and C (see Table I) with different Er3+- concentrations, 0.7 x lo1' ~ r n - ~ (square symbols and solid curves), 2.0 x 10¹⁹ ~ r n - ~ (cross symbols and dashed curves) and 8.0 x IO1' ~ r n - ~ (triangular symbols and dashdotted curves). The lengths of the fibers are 127, 81 and 35 cm (see Table I), respectively, and the absorbed pump power is 4.2 mW in each case. It is observed that An increases for ircreasing Er3+-concentration, but in contrary to the prediction in (6) the relationship is not linear up to high doping concentrations. As a consequence, in order to fit the experimental data the threshold pump power Pth has been set equal to 0.8 mW for the weakly doped fibers A and B and equal to 1.5 mW for fibe. C with the highest Er3+-concentration. The higher Pth for fiber C could be due to ion-ion interaction [13-161. The offs1:t in An has been set equal to 1.1 x for fiber A,3.0 x LO-7 for fiber B , and 4.8 x loV7 for fiber C. The offsets are 1'7.3, 19.5, and 24.1% of the peak to trough pump induced An for fiber A , B and C , respectively. This suggests that a higher doping concentration yields a relatively higher offset in An
Fleming et al. [l] have estimated an offset of 1.7 2 lop7 in An near 15fi0 nm which is 57% of the pump induced peak to trough An of 3 x for a 150 cm long erbium doped fiber with a weak doping concentration (the absorption coefficient at 1535 nm was <0.01 cm-') and apump power of 17 mW at
Authorized licensed use limited to: Danmarks Tekniske Informationscenter. Downloaded on March 09,2010 at 06:26:43 EST from IEEE Xplore. Restrictions apply.
136
0.04
0.02 - - I
E ” v
0.00 - 0
Q
0
Q
1-
-4.d
L
2 -0.02 -
1500 1520 1540 1560 1580 1600 Wavelength (nm)
Krorners-Kronig trans. Nonlinear meosurements
F U-.
W CK -4.0
1500 1520 1540 1560 1580 1600 Wavelength (nm)
(b)
Fig 4 (a) Absorption as funchon of wavelength for fiber A (Er3+-doping concentration of 0 7 x IO1’ cmP3) at an absorbed pump power of 0 mW (circular symbols), 2 2 mW (square symbols), 4 2 mW (tnangular symbols) and 9 0 mW (diamond symbols): (b) Kramers-Kronig transform on the change in absorption for a change in absorbed pump power from 0 to 2 2 mW (square symbols) and drect measurement of the refractive index change (triangular symbols) as function of wavelength An offset of 0.8 x l op7 has been added to the data obtamed from the Kramers-Kronig transform.
980 nm. The authors interpreted the offset to be due to thermal effects. Pantell et al. [5] have measured the pump induced phase change indirectly from the switching characteristics of a twin core fiber with an Er3+ doping concentration of 1.3 x 10” ernp3 using a pump wavelength of 1480 nm and a signal wavelength of 980 nm, and they measured an offset of 1.5 rad which is about 80% value of 1.8 rad. The authors i to high energetic optical transitions for Er shown in Figs. 3 and 5 with various pump PO concentrations, the offsets are only 17 t trough pump induced refractive offsets for the measurements reported here.
Fig. 6(a) shows the refractive index change An as function A and C at a wavelength on nance where An is positive
and at a wavelength on the long wavelength side where An
Authorized licensed use limited to: Danmarks Tekniske Informationscenter. Downloaded on March 09,2010 at 06:26:43 EST from IEEE Xplore. Restrictions apply.
THIRSTRUP et al.: PUMP-INDUCED REFRACTIVE INDEX MODULATION
- 30 I
0 25
a, 20
7 W
cn
c 0
a, U .- C 5
O O O O O Fibre A A A A A A Fibre c
15
x ' 0
.- ? Q
-5
E-10
-cI
U
.c Q,
0 5 10 15 20 25 Absorbed pump power (mW)
I I l*o 1 0.8 - Fibre C
Fibre A / 1 c' ? 0.6 0
W v) 0.4
W
a
0.2
0.0
Absorbed pump power (mW)
(C)
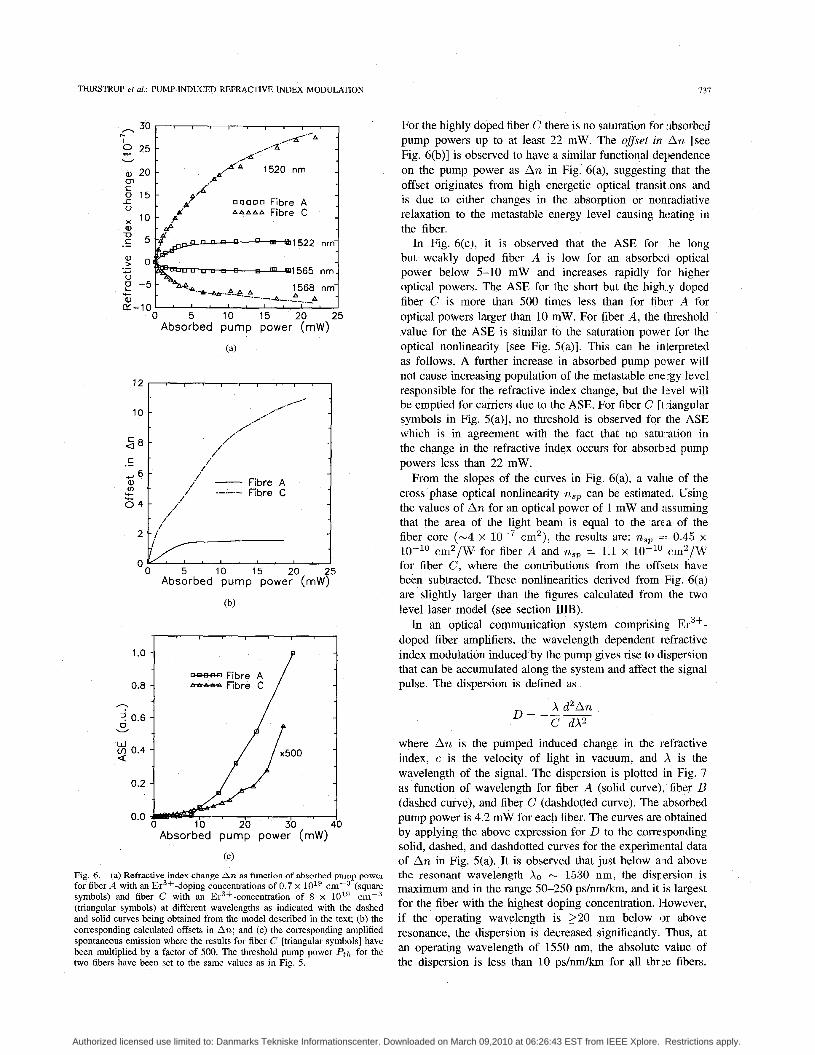
Fig. 6. (a) Refractive index change An as function of absorbed pump power for fiber A with an Er3+-doping concentrations of 0.7 x 10¹⁹ ~ r n - ~ (square symbols) and fiber C with an Er3+-concentration of 8 x lo1' cmP3 (triangular symbols) at different wavelengths as indicated with the dashed and solid curves being obtained from the model described in the text; (b) the corresponding calculated offsets in An; and (c) the corresponding amplified spontaneous emission where the results for fiber C [triangular symbols] have been multiplied by a factor of 500. The threshold pump power Pth for the
731
For the highly doped fiber C there is no saturation for ,ibsorbed pump powers up to at least 22 mW. The offset in An [see Fig. 6(b)] is observed to have a similar functional dependence on the pump power as An in Fig. 6(a), suggesting that the offset originates from high energetic optical transit ons and is due to either changes in the absorption or nonradiative relaxation to the metastable energy level causing heating in the fiber.
In Fig. 6(c), it is observed that the ASE for he long but weakly doped fiber A is low for an absorbed optical power below 5-10 mW and increases rapidly for higher optical powers. The ASE for the short but the high y doped fiber C is more than 500 times less than for fibvr A for optical powers larger than 10 mW. For fiber A , the threshold value for the ASE is similar to the saturation power for the optical nonlinearity [see Fig. 5(a)]. This can be interpreted as follows. A further increase in absorbed pump power will not cause increasing population of the metastable energy level responsible for the refractive index change, but the 1:vel will be emptied for carriers due to the ASE. For fiber C [t iangular symbols in Fig. S(a)], no threshold is observed for the ASE which is in agreement with the fact that no saturation in the change An the refractive index occurs for absorb:d pump powers less than 22 mW.
From the slopes of the curves in Fig. 6(a), a value of the cross phase optical nonlinearity nsp can be estimated. Using the values of An for an optical power of 1 mW and assuming that the area of the light beam is equal to the area of the fiber core (-4 x cm'), the results are: nsp =: 0.45 x loplo cm2/W for fiber A and nsp = 1.1 x 10-l' cm2/W for fiber C, where the contributions from the offsets have been subtracted. These nonlinearities derived from Fig. 6(a) are slightly larger than the figures calculated from the two level laser model (see section IIIB).
In an optical communication system comprising Er3+- doped fiber amplifiers, the wavelength dependent I efractive index modulation induced by the pump gives rise to dispersion that can be accumulated along the system and affect the signal pulse. The dispersion is defined as
X d2An C dX2
D =
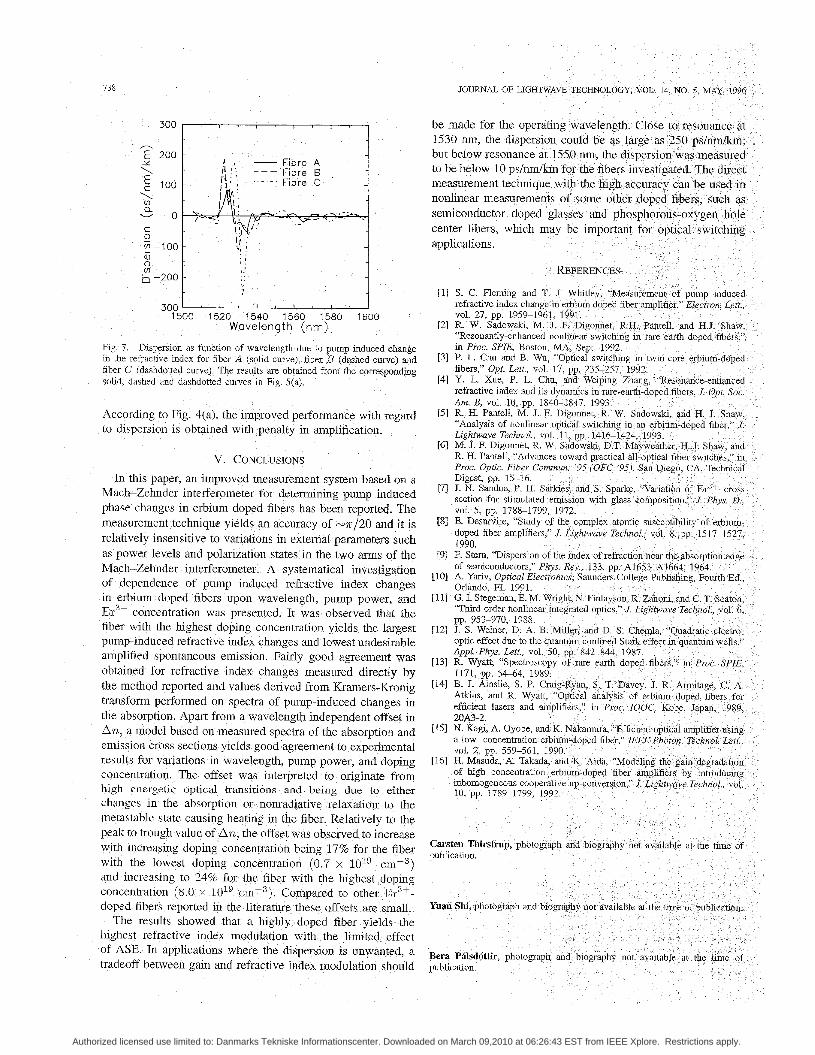
where An is the pumped induced change in the refractive index, c is the velocity of light in vacuum, and X is the wavelength of the signal. The dispersion is plotted in Fig. 7 as function of wavelength for fiber A (solid curve), fiber B (dashed curve), and fiber C (dashdotted curve). The absorbed pump power is 4.2 mW for each fiber. The curves are obtained by applying the above expression for D to the corresponding solid, dashed, and dashdotted curves for the experimcntal data of An in Fig. 5(a). It is observed that just below a id above the resonant wavelength Xo - 1530 nm, the disrersion is maximum and in the range 50-250 ps/nmkm, and it is largest for the fiber with the highest doping concentration. However, if the operating wavelength is 220 nm below or above resonance, the dispersion is decreased significantly. Thus, at an operating wavelength of 1550 nm, the absolute value of
two fibers have been set to the same values as in Fig. 5.- the dispersion is less than 10 ps/nm/km for all thr:e fibers.
Authorized licensed use limited to: Danmarks Tekniske Informationscenter. Downloaded on March 09,2010 at 06:26:43 EST from IEEE Xplore. Restrictions apply.
-300 1500 1520 1540 1560 1580 1600
Wavelength (nm)
Fig 7 Dispersion as function of wavelength due to pump induced change in the refractive index for frber A (solid curve), fiber 3 (dashed curve) and fiber C (dashdotted curve) The results are obtained from the corresponding solid, dashed and dashdotted curves in Fig. S(a).
4(a), the improved performance with regard to dispersion is obtained with penalty in amplification.
V. CONCLUSIONS In this paper, an improved measurement system based on a
Mach-Zehnder interferometer for determining pump induced phase changes in erbium doped fibers has been reported. The measurement technique yields an accuracy of -n/20 and it is relatively insensitive to variations in external parameters such as power levels and polarization states in the two arms of the Mach-Zehnder interferometer. A systematical investigation of dependence of pump induced refractive index changes in erbium doped fibers upon wavelength, pump power, and Er3+-concentration was presented. It was observed that the fiber with the highest doping concentration yields the largest pump-induced refractive index changes and lowest undesirable amplified spontaneous emission. Fairly good agreement was obtained for refractive index changes measured directly by the method reported and values derived from Kramers-Kronig transform performed on spectra of pump-induced changes in the absorption. Apart from a wavelength independent offset in An, a model based on measured spectra of the absorption and emission cross sections yields good agreement to experimental results for variations in wavelength, pump power, and doping concentration. The offset was interpreted to originate from high energetic optical and being due to either changes in the absorpti radiative relaxation to the metastable state causing peak to trough value of An, the offs with increasing doping with the lowest dopin and increasing to 24% concentration (8.0 x 10’’ ern- doped fibers reported in th
highest refractive index modulation with the lim of ASE. In applications w tradeoff between gain and
tration being 17% for the fiber entration (0.7 x
The results showed that a highly doped fiber
JOURNAL OF LIGHTWAV
be made for the operat 1530 m, the dispersio but below resonance at
measurement
semiconductor
[4] Y. L. Xue, P. L.
[7] J. N. Sandoe, section for sti
2OA3-2.
a low- concentration vol. 2, pp. 559-561,
[I61 H. Masuda, A. Tak of high concentrat inhomogeneous coo 10, pp 1789-1799,
Carsten Thirstrup, photo publication.
Authorized licensed use limited to: Danmarks Tekniske Informationscenter. Downloaded on March 09,2010 at 06:26:43 EST from IEEE Xplore. Restrictions apply.