Enriched green upconversion emission in combustion synthesized Y2O3:Ho3+–Yb3+ phosphor
7
This article appeared in a journal published by Elsevier. The attached copy is furnished to the author for internal non-commercial research and education use, including for instruction at the authors institution and sharing with colleagues. Other uses, including reproduction and distribution, or selling or licensing copies, or posting to personal, institutional or third party websites are prohibited. In most cases authors are permitted to post their version of the article (e.g. in Word or Tex form) to their personal website or institutional repository. Authors requiring further information regarding Elsevier’s archiving and manuscript policies are encouraged to visit: http://www.elsevier.com/authorsrights
-
Upload
independent -
Category
Documents
-
view
2 -
download
0
Transcript of Enriched green upconversion emission in combustion synthesized Y2O3:Ho3+–Yb3+ phosphor

This article appeared in a journal published by Elsevier. The attachedcopy is furnished to the author for internal non-commercial researchand education use, including for instruction at the authors institution
and sharing with colleagues.
Other uses, including reproduction and distribution, or selling orlicensing copies, or posting to personal, institutional or third party
websites are prohibited.
In most cases authors are permitted to post their version of thearticle (e.g. in Word or Tex form) to their personal website orinstitutional repository. Authors requiring further information
regarding Elsevier’s archiving and manuscript policies areencouraged to visit:
http://www.elsevier.com/authorsrights
Author's personal copy
Enriched green upconversion emission in combustion synthesized Y2O3:Ho3þeYb3þ phosphor
Anurag Pandey, Vineet Kumar Rai*, Riya Dey, Kaushal KumarLaser and Spectroscopy Laboratory, Department of Applied Physics, Indian School of Mines, Dhanbad 826004, Jharkhand, India
h i g h l i g h t s
< Combustion synthesis of cubic shaped Y2O3:Ho3þeYb3þ phosphor.
< Highly intense green upconversion emission around 545 nm.< Demonstration of upconversion based security ink.< Investigation of temperature sensing behaviour using FIR technique.
a r t i c l e i n f o
Article history:Received 17 April 2012Received in revised form3 January 2013Accepted 30 January 2013
Keywords:Optical materialsPhotoluminescence spectroscopyElectron microscopyCrystal fieldsPhonons
a b s t r a c t
Ho3þ and Yb3þ co-doped Y2O3 phosphor has been prepared by the combustion route and its upcon-version emission has been studied by using a 980 nm diode laser excitation. The powder XRD meas-urement has shown cubic phase of the sample. Prepared phosphors have shown good upconversionintensity and exhibited UV to NIR upconversion emission bands. The co-doping of Yb3þ in Y2O3:Ho
3þ
phosphor has found to enhance the Ho3þ emission intensity nearly w290 times. Interestingly, large partof the total upconversion intensity emitted by the sample was found to be concentrated aroundw545 nm which resulted pure green emission. For potential security applications, the upconversionbased text reading concept has been demonstrated using this phosphor. The temperature sensingproperty of synthesized phosphor has also been studied by using the fluorescence intensity ratio of twonearby levels of green emission.
� 2013 Elsevier B.V. All rights reserved.
1. Introduction
Phosphors are those materials which gives the luminescencephenomenon. The development of these materials is of great in-terest among researchers due to its variety of applications [1e3].Upconversion (UC) is now a well-established method for the gen-eration of UV and visible radiation from the near infrared (NIR)excitation [2e4]. Large variety of luminescencematerials have beeninvestigated on doping and co-doping of rare-earth (RE) and nonrare-earth ions in solid matrices [5e10]. Several excellent lowphonon frequency oxide host materials have been discovered andYttrium oxide (Y2O3) is one of the promising host materials becauseof its matching valency, ionic radius with commonly used REdopants, high melting point and low cut-off phonon energy [11,12].
Triply ionized holmium is very popular RE ion to achieve visibleUC emission due to its favourable energy level structure. In fact, theUC luminescence efficiency can be enhanced by co-doping withanother RE ion [13e16]. By this way, the donor ionwhich has largerabsorption efficiency at pumping wavelength transfers its absorbedenergy to the activator ion. Yb3þ is an ideal sensitizer because of itsintense absorption band at w980 nm and moreover, at this wave-length commercially cheap laser diodes are available for excitation[17e21]. Advantage of taking Y2O3 as host is that ionic radius ofHo3þ (104.1 pm) is nearly equal to that of the Y3þ ion (104 pm). Dueto this the Ho3þ ions may occupy the sites of Y3þ ions and thusdisplay sharp emission bands.
The UC emission in Ho3þeYb3þ co-doped phosphors has beenreported by many authors [22e25]. Luo and Cao [22] have inves-tigated the excellent UC visible luminescence in Y2O2S:Ho3þeYb3þ
phosphor and showed that its brightness is 2.2 times higher to thatof Y2O2S:Er3þeYb3þ phosphor. Dwivedi et al. [23] have obtainedintense green UC emission along with the other emission bands inGd2O3: Ho3þ-Yb3þ phosphor and found the occurrence of photonavalanche process in power dependence studies. Sangeetha and
* Corresponding author. Tel.: þ91 326 223 5404, þ91 326 223 5282.E-mail addresses: [email protected], [email protected]
(V.K. Rai).
Contents lists available at SciVerse ScienceDirect
Materials Chemistry and Physics
journal homepage: www.elsevier .com/locate/matchemphys
0254-0584/$ e see front matter � 2013 Elsevier B.V. All rights reserved.http://dx.doi.org/10.1016/j.matchemphys.2013.01.043
Materials Chemistry and Physics 139 (2013) 483e488

Author's personal copy
van Veggel [24] have found dominant red and green UC emissionsrespectively in lanthanum silicate and lanthanum zirconate nano-particles co-doped with Ho3þeYb3þ and explained on the basis ofthe phonon energy difference between the two matrices. Wei et al.[25] have reported intense green emission useful for biomedicalfluorescent labels under 980 nm excitation in Y2O3:Ho3þeYb3þ
phosphor prepared by solegel method. The optimal doping con-centration was proposed due to the cross-relaxation between theHo3þ ions and back energy transfer from Ho3þ to Yb3þ ions.
In all above reports authors have observed good UC emission inthe green region but the ratio of green (5F4/5S2 / 5I8) to red(5F5 / 5I8) emission intensity was seen lower and overall UCemission intensity was found to widely distributed over the severalemission bands. As an example, human eye is most sensitive to thegreen wavelength so far an application needing direct vision highgreen emitting phosphor is required. Therefore, In order to increasethe feasibility of a UC phosphor, many applications require one ortwo UC emission bands, total emitted power should be constrainedinto one or two emission bands. Undesired emission bands drawsome energy from the key band/bands and thus there is decrease inintensity of desired band and colour purity.
There are various methods for the preparation of phosphorsamples [22e25]. The combustion method has several specialproperties such as low processing temperature, high purity, ho-mogeneous mixing, large yield, etc. [26]. The combustion methodalso gives phosphor in puffy formwhich is advantageous for severalapplications. Because of these specialities we have used thismethod to prepare the present samples.
In the present work we have tried to concentrate the overallemitted intensity in the green region. For this, we have selectedHo3þeYb3þ system to be doped/codoped into Y2O3 host andstudied its emission property. Interestingly an improvement inratio of green to other emission bands has been observed upon980 nm excitation from a diode laser. Using the fluorescence in-tensity ratio (FIR) of two closely spaced levels the temperaturesensing behaviour of the developed phosphor has been analyzed.The high purity green emission has also been utilised to demon-strate how this phosphor can be used as UC based security ink.
2. Experimental
Phosphor samples were prepared by solution combustionmethod using reagent grade Y2O3, Ho2O3 and Yb2O3 as raw mate-rials while urea was used as the organic fuel. The composition ofcompound used was the following-
ð100� x� yÞY2O3 þ x Ho2O3 þ y Yb2O3
where x ¼ 0.1 mol% to 0.5 mol% and y ¼ 0.0e5.0 mol%.The desired amounts of Y2O3, Ho2O3 and Yb2O3 materials were
first dissolved in nitric acid (HNO3) properly to get the transparentsolution. The transparent solution was then mixed with urea in 1:2proportion (molar %). The solution was heated at 60 �C and stirredat 1000 rpmwith the help of magnetic stirrer, nearly for 3 h to forma transparent gel. The transparent gel was then rapidly heated ina furnace preheated to 650 �C. In 3e6 min, the solution becomesfoamed and a flame was produced which faded away after severalminutes. The sample was immediately removed from the furnace.The resultant fluffy mass was then taken out and crushed into finepowder using pestle and mortar. The formed Y2O3:Ho3þ andY2O3:Ho3þeYb3þ phosphor powders were given for heat treatmentat w800
�C for 4 h.
The obtained fine phosphor powders were used for the furthercharacterization purposes. The samples were pumped by a (CW)diode laser operating at 980 nmwith beam of spot size 1.4 mm and
the emission spectrum was recorded using a monochromatorattached with a photomultiplier tube (PMT) and PC. The powerdependence studies of emission intensity were done by increasingthe excitation power from 20 mW to 695 mW. The entrance andexit slit widths of the monochromator were kept fixed at 0.25 mm.All measurements were done below the saturation range of thePMT (saturation count of PMT ¼ 12 � 107).
3. Results and discussion
3.1. X-ray diffraction analysis
The X-ray diffraction pattern of Y2O3:Ho3þeYb3þ phosphorpowder heat treated at 800 �C was recorded with X-ray powderdiffractometer in 10e80� range {Fig. 1(a)}. The XRD pattern ofY2O3:Ho3þeYb3þ phosphor powder is matched with JCPDS file no.25-1200 that indicates that the system is cubic with lattice pa-rameters a ¼ b ¼ c ¼ 10.60 �A and a ¼ b ¼ g ¼ 90�. The crystallizesize of developed phosphor has been calculated using well knownScherrer’s formula [27] that was found in 39e47 nm range.
3.2. Scanning electron microscopy
In order to check the particle size of the prepared sample, SEMimage of Y2O3:Ho3þeYb3þ phosphor heat treated at 800 �C wasrecorded and the image is shown in Fig. 1(b). From figure it is clearthat particles are in agglomerated form with particle size inmicrometre range. The SEM image also shows the inhomogeneousdistribution of the particles.
Fig. 1. (a): XRD pattern of Y2O3:Ho3þeYb3þ phosphor heat treated at 800 �C (b): SEMmicrograph of Y2O3:Ho3þeYb3þ phosphor powder heat treated at 800
�C.
A. Pandey et al. / Materials Chemistry and Physics 139 (2013) 483e488484

Author's personal copy
From above measurements it can be concluded that synthesizedphosphor contains nanosized crystallites with particle size inmicrometre range.
3.3. Upconversion emission study
The UC emission spectra of Ho3þ doped samples with its varyingconcentrations from 0.1 to 0.5 mol% have been recorded upon980 nm excitation. The UC emission intensity is found to be max-imum when Ho3þ concentration was 0.2 mol% in the Y2O3:Ho3þ
phosphor. This optimised concentration has been used for furtherobservations. Furthermore, UC emission spectra of Yb3þ codopedoptimized Y2O3:Ho3þ sample with varying concentration of Yb3þ
have been recorded and maximum enhancements in UC intensityhas been observed at 3 mol% of Yb3þ concentration. All the furthermeasurements are done with this optimized concentration.
Fig. 2 shows the UC emission spectra of optimized Y2O3:Ho3þ
and Y2O3:Ho3þeYb3þ phosphor samples heat treated at 800 �C in400e800 nmwavelength range at room temperature using a diodelaser operating at 980 nm. Fig. 2 compares the UC spectra of pureHo3þ/Ho3þ-Yb3þ doped/codoped samples for the most intensebands. The Yb3þ codoping enhances the emission intensity verylargely. On comparing the above UC spectra, enhancement in in-tensity of green emission is found about 290 times and for the redemission it is about 150 times on codoping with Yb3þ ions. Theintensity of green UC emission in codoped sample is very large incomparison to other (w60 times from red and w410 times fromblue) emissions. This enhancement in the intensity of the UCemission bands from the Y2O3:Ho3þeYb3þ phosphor is mainlycaused by the efficient energy transfer from the Yb3þ ions to theHo3þ ions. All emission bands show large stark components whicharise due to crystal field effect of the host matrix.
The colour rendering index (CRI) of UC emission spectrum iscalculated at different excitation power densities and it is observedthat CRI does not vary with excitation power densities. The CRIpoints at various power densities are shown in chromaticity dia-gram (Fig. 3). The values of CRI were found to be (0.30, 0.70), (0.30,0.69), (0.29, 0.69), (0.29, 0.69) and (0.29, 0.70) at 1298.7 mW cm�2,
3246.8 mW cm�2, 6493.5 mW cm�2, 12,987.1 mW cm�2 and22,727.3 mW cm�2 power densities, respectively. This high puritygreen emission is very rarely seen in UC emission samples and inpresent case is almost excitation power density independent. Anoptical photograph of this green emitting sample is shown in theinset of Fig. 2(b). Fig. 2(a) and (b) are the photograph of Y2O3:Ho3þeYb3þ phosphor taken before and after its excitationwith diode laseroperating at 980 nm.
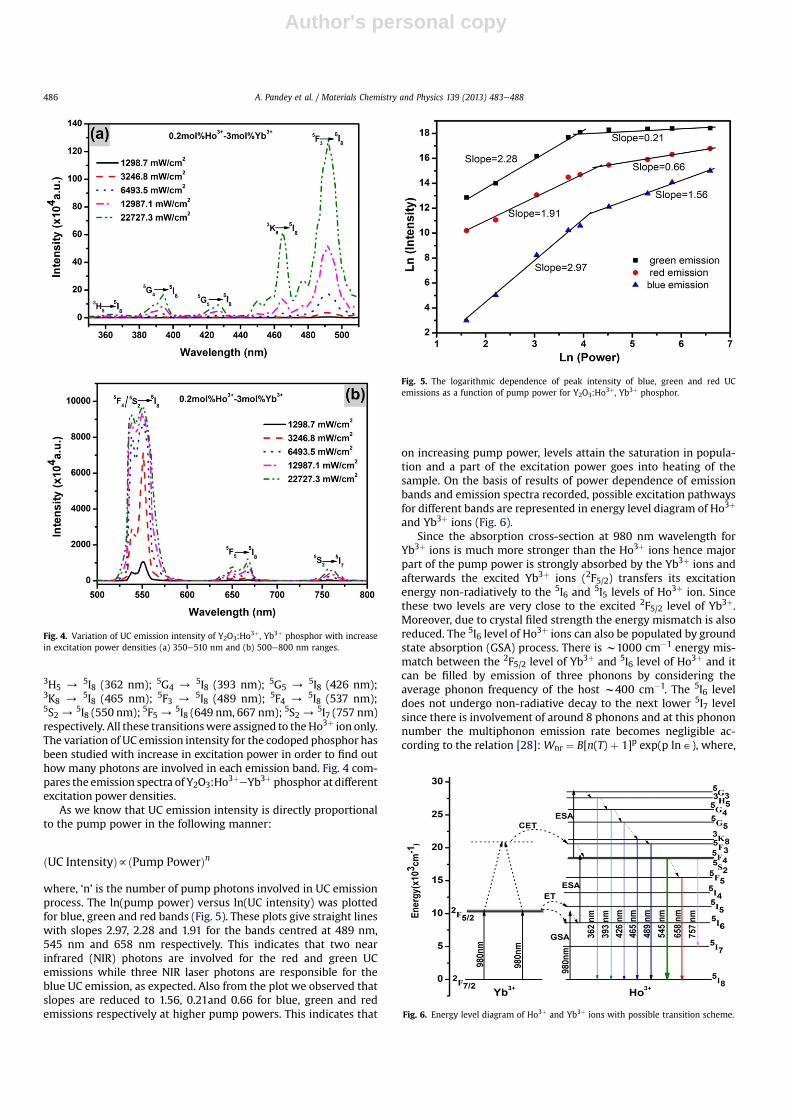
The Y2O3:Ho3þeYb3þ phosphor on 980 nm excitation exhibitmany other weak emission bands besides the intense green band(Fig. 4). These emission bands with their assignments are as:
Fig. 2. Upconversion emission spectra of Y2O3:Ho3þ and Y2O3:Ho3þeYb3þ phosphor heat treated at 800 �C.
Fig. 3. CIE chromaticity diagram of Y2O3:Ho3þeYb3þ phosphor for different pumppower densities.
A. Pandey et al. / Materials Chemistry and Physics 139 (2013) 483e488 485
Author's personal copy
3H5 / 5I8 (362 nm); 5G4 / 5I8 (393 nm); 5G5 / 5I8 (426 nm);3K8 / 5I8 (465 nm); 5F3 / 5I8 (489 nm); 5F4 / 5I8 (537 nm);5S2/ 5I8 (550 nm); 5F5/ 5I8 (649 nm, 667 nm); 5S2/ 5I7 (757 nm)respectively. All these transitionswere assigned to the Ho3þ ion only.The variation of UC emission intensity for the codoped phosphor hasbeen studied with increase in excitation power in order to find outhow many photons are involved in each emission band. Fig. 4 com-pares the emission spectra of Y2O3:Ho3þeYb3þ phosphor at differentexcitation power densities.
As we know that UC emission intensity is directly proportionalto the pump power in the following manner:
ðUC IntensityÞfðPump PowerÞn
where, ‘n’ is the number of pump photons involved in UC emissionprocess. The ln(pump power) versus ln(UC intensity) was plottedfor blue, green and red bands (Fig. 5). These plots give straight lineswith slopes 2.97, 2.28 and 1.91 for the bands centred at 489 nm,545 nm and 658 nm respectively. This indicates that two nearinfrared (NIR) photons are involved for the red and green UCemissions while three NIR laser photons are responsible for theblue UC emission, as expected. Also from the plot we observed thatslopes are reduced to 1.56, 0.21and 0.66 for blue, green and redemissions respectively at higher pump powers. This indicates that
on increasing pump power, levels attain the saturation in popula-tion and a part of the excitation power goes into heating of thesample. On the basis of results of power dependence of emissionbands and emission spectra recorded, possible excitation pathwaysfor different bands are represented in energy level diagram of Ho3þ
and Yb3þ ions (Fig. 6).Since the absorption cross-section at 980 nm wavelength for
Yb3þ ions is much more stronger than the Ho3þ ions hence majorpart of the pump power is strongly absorbed by the Yb3þ ions andafterwards the excited Yb3þ ions (2F5/2) transfers its excitationenergy non-radiatively to the 5I6 and 5I5 levels of Ho3þ ion. Sincethese two levels are very close to the excited 2F5/2 level of Yb3þ.Moreover, due to crystal filed strength the energy mismatch is alsoreduced. The 5I6 level of Ho3þ ions can also be populated by groundstate absorption (GSA) process. There is w1000 cm�1 energy mis-match between the 2F5/2 level of Yb3þ and 5I6 level of Ho3þ and itcan be filled by emission of three phonons by considering theaverage phonon frequency of the host w400 cm�1. The 5I6 leveldoes not undergo non-radiative decay to the next lower 5I7 levelsince there is involvement of around 8 phonons and at this phononnumber the multiphonon emission rate becomes negligible ac-cording to the relation [28]: Wnr ¼ B[n(T) þ 1]p exp(p ln ˛), where,
Fig. 4. Variation of UC emission intensity of Y2O3:Ho3þ, Yb3þ phosphor with increasein excitation power densities (a) 350e510 nm and (b) 500e800 nm ranges.
Fig. 5. The logarithmic dependence of peak intensity of blue, green and red UCemissions as a function of pump power for Y2O3:Ho3þ, Yb3þ phosphor.
Fig. 6. Energy level diagram of Ho3þ and Yb3þ ions with possible transition scheme.
A. Pandey et al. / Materials Chemistry and Physics 139 (2013) 483e488486
Author's personal copy
B: material constant, n(T): phonon occupancy number,n(T) ¼ [exp(Zu/kT) � 1]�1, ˛: electron-phonon coupling constant(˛ < 1) and p (¼DE/Zu) is number of phonons. It expresses expo-nential dependence of Wnr on phonon number. So, the large pop-ulation build up in this (5I6) level. The ion in this level can absorbsecond incident photon through excited state absorption (ESA) andgo to the 5S2/5F4 level. The Yb3þ ions can also go through cooper-ative emission in which two Yb3þ ions combine and give emissionat 488 nm. This emission may be absorbed by the levels of Ho3þ
ions, however it is much weaker than the energy transfer upcon-version mechanism. The population in 5S2/5F4 level becomes large,this level absorbs third incident NIR photon through the ESA pro-cess and populates the closely packed 3H5,
5G4,5G5,
3K8 and 5F3levels. Ions in these levels decay radiatively to the ground level andgiving emissions at 362 nm, 393 nm, 426 nm, 465 nm and 489 nmthrough the 3H5/
5I8, 5G4/5I8, 5G5/
5I8, 3K8/5I8 and 5F3/ 5I8
transitions in UV and blue regions, respectively. These transitionsare found weak in intensity due to ESA process, since it is weakerthan the ET channel.
The excited ions in 5S2/5F4 levels relax radiatively to the groundstate emitting a green light centred at 545 nm while the 5S2 / 5I7transition gives NIR emission at 757 nm. Furthermore, excitationprobability of the 5F5 level, just below to the 5F4 level, throughnon-radiative channel is too much low in this host since it needs atleast 10 phonons to emit. Weak emission of the 5F5 / 5I8 transitionaround 658 nm is observed. Because of the above reason presentsample gives emission in the green regionwith appreciable intensity.
It was interesting to note the variation of fluorescence intensitybetween the 5F4 / 5I8 and 5S2 / 5I8 transitions with excitationpower density. Intensity ratio (I537nm/I550nm) of the 5F4/5S2 / 5I8
transition is found to increase linearly with the pump power den-sity (shown in Table 1). The variation of intensity ratio with pumppower density is shown in Fig. 7. From the figure, it is found thatintensity ratio increases upto 35,714.3 mW cm�2 pump powerdensity and after that it becomes constant. The 5S2 and 5F4 levelscan be considered thermally coupled at room temperature andaccording to the Boltzmann law intensity ratio of two thermallycoupled levels with temperature vary according to:
I537nm=I550nm ¼ Cexpð�DE=kTÞ
where, C is proportionality constant,DE is the energy difference, k isBoltzmann’s constant and T is absolute temperature. Therefore, wehave observed that on increasing the pump power density the FIR(I537nm/I550nm) is increasing. We can relate this increase in FIR withtemperature also. We supposed that increase in pump powerdensity increases the sample temperature. So, from the Fig. 7 wecan conclude that present sample could work as temperaturesensor. B. Dong et al. [29] have measured FIR of two closely spacedlines of Er3þ ion with increasing the excitation diode laser currentand observed the linear pattern between FIR and diode current.They concluded that increased FIR is related to the elevated tem-perature of the sample.
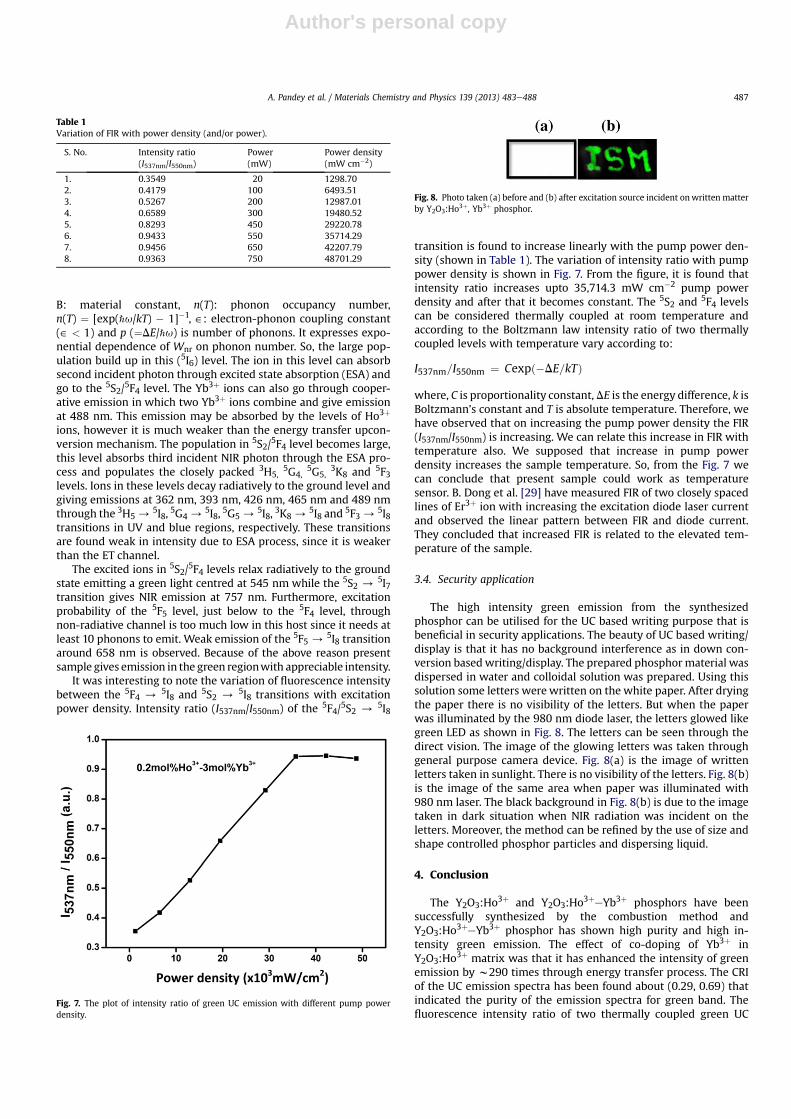
3.4. Security application
The high intensity green emission from the synthesizedphosphor can be utilised for the UC based writing purpose that isbeneficial in security applications. The beauty of UC based writing/display is that it has no background interference as in down con-version basedwriting/display. The prepared phosphormaterial wasdispersed in water and colloidal solution was prepared. Using thissolution some letters were written on the white paper. After dryingthe paper there is no visibility of the letters. But when the paperwas illuminated by the 980 nm diode laser, the letters glowed likegreen LED as shown in Fig. 8. The letters can be seen through thedirect vision. The image of the glowing letters was taken throughgeneral purpose camera device. Fig. 8(a) is the image of writtenletters taken in sunlight. There is no visibility of the letters. Fig. 8(b)is the image of the same area when paper was illuminated with980 nm laser. The black background in Fig. 8(b) is due to the imagetaken in dark situation when NIR radiation was incident on theletters. Moreover, the method can be refined by the use of size andshape controlled phosphor particles and dispersing liquid.
4. Conclusion
The Y2O3:Ho3þ and Y2O3:Ho3þeYb3þ phosphors have beensuccessfully synthesized by the combustion method andY2O3:Ho3þeYb3þ phosphor has shown high purity and high in-tensity green emission. The effect of co-doping of Yb3þ inY2O3:Ho3þ matrix was that it has enhanced the intensity of greenemission by w290 times through energy transfer process. The CRIof the UC emission spectra has been found about (0.29, 0.69) thatindicated the purity of the emission spectra for green band. Thefluorescence intensity ratio of two thermally coupled green UC
Table 1Variation of FIR with power density (and/or power).
S. No. Intensity ratio(I537nm/I550nm)
Power(mW)
Power density(mW cm�2)
1. 0.3549 20 1298.702. 0.4179 100 6493.513. 0.5267 200 12987.014. 0.6589 300 19480.525. 0.8293 450 29220.786. 0.9433 550 35714.297. 0.9456 650 42207.798. 0.9363 750 48701.29
Fig. 7. The plot of intensity ratio of green UC emission with different pump powerdensity.
Fig. 8. Photo taken (a) before and (b) after excitation source incident onwritten matterby Y2O3:Ho3þ, Yb3þ phosphor.
A. Pandey et al. / Materials Chemistry and Physics 139 (2013) 483e488 487

Author's personal copy
emission bands has been found to increase linearly with the pumppower density. The UC based hidden text reading concept has beendemonstrated successfully using present phosphor material andnoted that it can be used as security ink.
Acknowledgement
Authors are grateful to the University Grants Commission, NewDelhi, India for providing the financial assistance {F. No. 39-534/2010(SR)}.
References
[1] A. Sayoud, J.P. Jouart, N. Trannoy, M. Diaf, T. Duvaut, J. Lumin. 132 (2012) 566.[2] Z. Xia, W. Zhou, H. Du, J. Sun, Mater. Res. Bull. 45 (2010) 1199.[3] S.K. Singh, K. Kumar, S.B. Rai, Appl. Phys. B 94 (2009) 165.[4] V.K. Rai, Frequency upconversion in rare earth ions, in: Amin H. Al-Khursan
(Ed.), Solid State Laser, In Tech, 2012, ISBN 978-953-51-0086-7.[5] V. Singh, V.K. Rai, I. Ledoux-Rak, L. Badie, H.-Y. Kwak, Appl. Phys. B 97 (2009) 805.[6] V. Singh, I. Ledoux-Rak, L. Badie, F. Pelle, S. Ivanova, J. Lumin. 129 (2009) 1375.[7] V.K. Rai, L. de S. Menezes, C.B. de Araujo, J. Appl. Phys. 103 (2008) 053514.[8] S. Mukherjee, V. Sudarsan, R.K. Vatsa, A.K. Tyagi, J. Lumin. 129 (2009) 69.
[9] A. Patra, C.S. Friend, R. Kapoor, P.N. Prasad, Chem. Mater. 15 (2003) 3650.[10] V. Singh, V.K. Rai, I. Ledoux-Rak, H.-Y. Kwak, Appl. Phys. B 97 (2009) 103.[11] P.A. Tanner, X. Zhou, F. Liu, J. Phys. Chem. A 108 (2004) 11521.[12] C.Y. Shang, X.Q. Wang, H. Kang, D.M. Han, J. Appl. Phys. 109 (2011) 104309.[13] M. Yang, Y. Sui, S. Wang, X. Wang, Y. Sheng, Z. Zhang, T. Lu, W. Liu, Chem.
Phys. Lett. 492 (2010) 40.[14] N. Rakov, G.S. Maciel, Chem. Phys. Lett. 400 (2004) 553.[15] N.K. Giri, D.K. Rai, S.B. Rai, Appl. Phys. B 89 (2007) 345.[16] L. Sun, C. Qian, C. Liao, X. Wang, C. Yan, Solid State Commun. 119 (2001) 393.[17] R. Borja-Urby, L.A. Diaz-Torres, P. Salas, M. Vega-Gonzalez, C. Angeles-Chavez,
Mater. Sci. Eng. B 174 (2010) 169.[18] O. Meza, L.A. Diaz-Torres, P. Salas, E. De la Rosa, D. Solis, Mater. Sci. Eng. B 174
(2010) 177.[19] Y. Dwivedi, Anita Rai, S.B. Rai, J. Lumin. 129 (2009) 629.[20] S. Das, A.A. Reddy, G.V. Prakash, Chem. Phys. Lett. 504 (2011) 206.[21] B. Dong, Z.Q. Feng, J.F. Zu, L. Bai, J. SoleGel Sci. Technol. 48 (2008) 303.[22] X. Luo, W. Cao, Mater. Lett. 61 (2007) 3696.[23] Y. Dwivedi, A. Bahadur, S.B. Rai, J. Appl. Phys. 110 (2011) 043103.[24] N.M. Sangeetha, F.C.J.M. van Veggel, J. Phys. Chem. C 113 (2009) 14702.[25] X. Wei, Y. Li, X. Cheng, Y. Chen, M. Yin, J. Rare Earths 29 (2011) 536.[26] R. Dey, V.K. Rai, A. Pandey, Spectrochim. Acta A 99 (2012) 288.[27] B.D. Cullity, Elements of X-ray Diffraction, vol. 1, Addison-Wesley, Reading,
MA, 1978, pp. 102e110.[28] C.B. Layne, W.H. Lowdermilk, M.J. Weber, Phys. Rev. B 16 (1977) 1.[29] B. Dong, C.R. Li, M.K. Lei, J. Lumin. 126 (2007) 441.
A. Pandey et al. / Materials Chemistry and Physics 139 (2013) 483e488488