
Mid-Infrared upconversion imaging and spectroscopy using ...
182
General rights Copyright and moral rights for the publications made accessible in the public portal are retained by the authors and/or other copyright owners and it is a condition of accessing publications that users recognise and abide by the legal requirements associated with these rights. Users may download and print one copy of any publication from the public portal for the purpose of private study or research. You may not further distribute the material or use it for any profit-making activity or commercial gain You may freely distribute the URL identifying the publication in the public portal If you believe that this document breaches copyright please contact us providing details, and we will remove access to the work immediately and investigate your claim. Downloaded from orbit.dtu.dk on: Jul 05, 2022 Mid-Infrared upconversion imaging and spectroscopy using short pulse light source A.S., Ashik Publication date: 2021 Document Version Publisher's PDF, also known as Version of record Link back to DTU Orbit Citation (APA): A.S., A. (2021). Mid-Infrared upconversion imaging and spectroscopy using short pulse light source. Technical University of Denmark.
-
Upload
khangminh22 -
Category
Documents
-
view
2 -
download
0
Transcript of Mid-Infrared upconversion imaging and spectroscopy using ...

General rights Copyright and moral rights for the publications made accessible in the public portal are retained by the authors and/or other copyright owners and it is a condition of accessing publications that users recognise and abide by the legal requirements associated with these rights.
Users may download and print one copy of any publication from the public portal for the purpose of private study or research.
You may not further distribute the material or use it for any profit-making activity or commercial gain
You may freely distribute the URL identifying the publication in the public portal If you believe that this document breaches copyright please contact us providing details, and we will remove access to the work immediately and investigate your claim.
Downloaded from orbit.dtu.dk on: Jul 05, 2022
Mid-Infrared upconversion imaging and spectroscopy using short pulse light source
A.S., Ashik
Publication date:2021
Document VersionPublisher's PDF, also known as Version of record
Link back to DTU Orbit
Citation (APA):A.S., A. (2021). Mid-Infrared upconversion imaging and spectroscopy using short pulse light source. TechnicalUniversity of Denmark.

DTU FotonikDoctoral thesis in Photonics Engineering
June, 2021
Mid-Infrared upconversion imagingand spectroscopy using short pulselight source
Ashik A.S.

Mid-Infrared upconversion imaging and
spectroscopy using short pulse light source
Submitted in partial fulfillment of the requirements for the degree of
Doctor of Philosophy
by
Ashik A.S.
June 2021

Main supervisor: Prof. Christian PedersenCo-supervisor: Assoc. Prof. Peter Tidemand-Lichtenberg
Department of Photonics EngineeringTechnical University of Denmark
Ørsteds PladsBuilding 343
2800 Kongens Lyngby, Denmark

Dedicated
to my parents, to my wife, and
to all those who have inspired me to follow my dreams.
They do come true!

If learning the truth is the scientist’s goal, then he must make himself the enemy of all that
he reads.
- Hasan Ibn al-Haytham
What we know is a drop, what we do not know is an ocean
- Isaac Newton


DECLARATION
I hereby declare that the thesis entitled “Mid-Infrared upconversion imaging and
spectroscopy using short pulse light source” is a record of bonafide work carried out by
me, under the supervision of Prof. Christian Pedersen and Assoc. Prof. Peter Tidemand-
Lichtenberg at the Department of Photonics Engineering, Technical University of
Denmark.
I further declare that the work reported in this thesis has not been submitted and will not
be submitted, either in part or in full, for the award of any other degree or diploma in this
institute or any other institute or university.
……………………………………
Ashik A.S.
15-06-2021
CERTIFICATE
I hereby certify that the matter embodied in this thesis entitled, “Mid-Infrared
upconversion imaging and spectroscopy using short pulse light source” has been carried
out by Mr. Ashik A.S. at the Department of Photonics Engineering, Technical University
of Denmark, under my supervision, and that it has not been submitted elsewhere for the
award of any degree or diploma.
….…….…………………………………..
Prof. Christian Pedersen
(Main supervisor)
15-06-21
….…….……………………………………..
Assoc. Prof. Peter Tidemand-Lichtenberg
(Co-supervisor)
15-06-21

ACKNOWLEDGMENTS
First and above all, I praise and thank Almighty God for blessing me with good physical
and mental health to accomplish this work in the best manner possible.
I owe an immense amount of gratitude to my supervisors Prof. Christian Pedersen and
Assoc. Prof. Peter Tidemand-Lichtenberg, for offering me the opportunity to conduct my
Ph.D. study under their supervision. I will forever be grateful for their efforts in uplifting
my technical knowledge, experimental skills, and scientific reasoning capabilities. They
were extremely good at helping me identify the pitfalls and guided me, very skillfully, to
pull back the project on track every time I fell off. They were always only a knock (or a
zoom call – thanks to the coronavirus) away for any discussion, even when they had a busy
schedule. I would also like to appreciate their patience in bearing with my shortcomings,
if any, during the course of this study.
I would like to thank my wonderful collaborators at ICFO, Spain, for hosting me for a
week as part of my external research stay. The external stay happened after only two weeks
of me beginning my Ph.D. I am extremely grateful to Callum for helping me with the initial
experiments and Dr. Chaitanya and Prof. Majid for their technical support. I also thank
Rinu for welcoming me and taking me around Barcelona (this was my first time ever in
Europe, and I was literally new to each and everything).
Further, I would like to thank my colleagues at the Optical Sensor Technology group for
their overwhelming support whenever needed. I am grateful to Dr. Peter John Rodrigo for
his help, be it in the Lab or with the technical and logistical support. I thank Ajanta for her
kind and welcoming nature and the helpful discussions we had (I also thank her for the
wedding invitation). I thank Olga, and her company (Radiometer Medical ApS), for letting
me use the laser developed as part of her Ph.D. study. I thank Laurent, Saher, Lichun, and
Yu-Pei, who were all in their later stages of the Ph.D. when I joined and thus helped me

getting started with several things, both technically and administratively. I also thank Finn
and Henning for all the support.
I would like to thank my friend Madhu for helping me get used to life in Denmark initially.
I also appreciate the many scientific and non-scientific discussions we had. I also thank
my friends Tahir and Mahmoud for engaging in technical and spiritual discussions, and for
all the help whenever I needed them.
Finally, I would like to enormously thank my parents Abdul Rahim and Sajeela Beevi, for
always being supportive of my choices. I would also like to thank my extended family
members, especially Muthali and Najeema, for their valuable and wholehearted support.
Last but never the least, I would like to thank my wonderful wife, Alif Laila, for constantly
encouraging and supporting me, especially during tough times. I am indebted to her for
motivating me and inculcating the belief in me to search for research opportunities outside
India. I also highly appreciate her effort, especially towards the end of my project, to
manage the homely chores so that I can spend the extra time to complete the Ph.D. tasks,
given that she is also doing her Ph.D. study. I look forward to paying back the courtesy.

PREFACE
This thesis presents the outcome of a Ph.D. study performed from February 2018 to June
2021 at the Optical Sensor Technology group, Department of Photonics Engineering,
Technical University of Denmark. The Ph.D. work was carried out under the supervision
of Prof. Christian Pedersen and Assoc. Prof. Peter Tidemand-Lichtenberg.
The project was partly funded by the European Union’s Horizon 2020 research and
innovation program under Grant Agreement No. 642661 – Mid-TECH.


i
ABSTRACT
As Frank J. Low once said, ‘‘Every object in the universe with a temperature above
absolute zero radiates in the infrared, so this part of the spectrum contains a great deal
of information’’.
The infrared region of the electromagnetic spectrum is rich in molecular absorption
features, but in general, it is challenged by the lack of coherent light sources and detectors.
Parametric upconversion is a viable technology that can address these challenges. Though
frequency conversion techniques were demonstrated as early as the 1970s, advancements
in the nonlinear crystal and laser technology have recently improved the overall efficiency
of frequency conversion processes. This thesis work primarily focuses on generating and
detecting infrared light in the 1.5 – 4 µm range.
We first develop a cheap compact tunable infrared light source based on spontaneous
parametric down-conversion (SPDC) using a high intensity passively Q-switched laser,
pumping a periodically poled lithium niobate crystal. The Q-switched laser delivers pump
pulses at 1030 nm with 3 nanosecond duration and maximum energy of 180 µJ. The
extremely high gain for the parametric process provides a conversion efficiency of ~ 55%.
A theoretical description of the high gain regime is presented here for the first time. The
model allows us to accurately predict the generated SPDC power and the spectral
properties in the high gain regime. We then quantify the pulse-to-pulse energy and the
spectral intensity stability of the SPDC light source for the first time to the best of our
knowledge. The spectral stability is critical when using the light source for infrared sensing
applications, for example, spectroscopy. Furthermore, we demonstrate the fast continuous
tuning capability of the SPDC light source using a fan-out crystal covering the 2 to 4 µm
range with a tuning rate of 100 nm/sec. We test the light source for spectroscopy of a

ii
polystyrene sample using a simple thermal power meter, thus eliminating the need for a
conventional spectrometer.
In the last part of the thesis, we describe an upconversion system to perform infrared
imaging in the femtosecond pulse regime. A mode-locked Ti:Sapphire laser at 804 nm
with a pulse duration of 100 femtosecond pumps an optical parametric oscillator
generating tunable infrared light in the 2.7 – 4 µm range with a mid-IR pulse duration of
~ 200 femtosecond. Synchronous mixing of the infrared light with a portion of the pump
inside an unpoled lithium niobate crystal placed in the Fourier plane of a 4f imaging set-
up facilitates efficient upconversion to the vis/near-infrared range. This enables easy
imaging in the femtosecond regime based on conventional silicon detectors. For
the first time, a theoretical model is developed to describe the broad angular and
spectral acceptance bandwidths of a short-pulsed upconversion system. We also identify
a blurring effect that deteriorates the imaging quality of short-pulse upconversion
imaging.

iii
DANSK RESUME
Som Fank J. Low engang udtrykte det: ‘‘Every object in the universe with a temperature
above absolute zero radiates in the infrared, so this part of the spectrum contains a great
deal of information”.
Det infrarøde (IR) område af det elektromagnetiske spektrum er rigt på molekylære
absorptionsbånd, relevant for identifikation af komplekse molekyler, f.eks. dem som findes
i fødevarer, biopsier eller endog drivhusgasser, men mangel på gode kohærente IR
lyskilder og følsomme IR-detektorer har besværliggjort den praktiske udnyttele.
Parametrisk opkonvertering er en teknologi, der i høj grad kan imødekomme disse
udfordringer til følsom IR detektion. Selvom frekvenskonverteringsteknikker blev
demonstreret så tidligt som i 1970’erne, har udviklingen af ikke-lineære krystaller, solid-
state laserteknologier og CCD detektoren i de seneste årtier resulteret i store
forbedringsmuligheder. Denne afhandling fokuserer primært på generering og detektering
af infrarødt lys i 1.5 – 4 µm bølgelængdeområdet.
I projektet er der udviklet en kompakt IR, bølgelængde-tunebar lyskilde (2-4 µm) baseret
på spontan parametrisk nedkonvertering (Eng.: Spontaneous parametric down-conversion,
SPDC). Denne baseres på en passiv Q-switched laser, der pumper en periodisk polet
litium-niobat-krystal (PPLN). Den Q-switchede laser leverer pumpepulser ved en
bølgelængde på 1030 nm. Pulslængden er 3 ns og med pulsenergier på op til 180 µJ. Den
ekstremt høje forstærkning i den parametriske proces resulterer i en
konverteringseffektivitet fra pumpepulsen til SPDC pulsen på ~ 55%. En teoretisk
beskrivelse af dette høje forstærkningsområde for SPDC processen præsenteres for første
gang her. Modellen gør det muligt med god præcision at forudbestemme SPDC
udgangseffekten, samt SPDC-kildens spektrale egenskaber. Puls-til-puls-energien samt
den spektrale intensitetsstabilitet af SPDC-lyskilden er også diskuteret nøje. Den spektrale
stabilitet er af afgørende betydning for lyskildens anvendelighed i IR anvendelser,

iv
heriblandt IR spektroskopi. Endvidere demonstrerer vi en hurtig og kontinuert
bølgelængdeindstilling af SPDC-lyskilden ved brug af en krystal med fan-out struktur.
Med denne krystal er det muligt at dække bølgelængder i området fra 2 til 4 µm med en
scan-hastighed på 100 nm/s. Lyskilden er testet til spektroskopi af en polystyrenprøve,
hvor bølgelængde informationen er bestemt af SPDC lyskilden, hvorved et konventionelt
IR spektrometer undgås.
I den sidste del af afhandlingen beskrives et opkonverteringssystem til IR afbildning i
femtosekund regimet. En mode-locked Ti:Safir laser med en bølgelængde på 804 nm og
pulslængder på 100 fs pumper en optisk parametrisk oscillator, hvilket bruges som en
tunebar IR lyskilde i 2.7 – 4 µm bølgelængdeområdet. IR pulserne er på ~ 200 fs. Synkron
blanding af det infrarøde lys med en lille del af pumpelyset i en litium-niobat-krystal
placeret i Fourierplanet af et 4f-afbildningssystem, muliggør effektiv opkonvertering til det
synlige/nærinfrarøde område. Derved opnås afbilding i femtosekundsregimet ved brug af
et CCD kamera. En teoretisk model er udviklet i projektet til beskrivelse af vinkelacceptans
og spektralbåndbreddeer i dette særlige tidsdomæne.
v
LIST OF PUBLICATIONS
Journal publications
1. Ashik. A. S., C. F. O’Donnell, S. Chaitanya Kumar, M. Ebrahim-Zadeh, P.
Tidemand-Lichtenberg, and C. Pedersen, "Mid-infrared upconversion imaging
using femtosecond pulses," Photon. Res. 7, 783–791 (2019).
2. Ashik. A. S., P. Tidemand-Lichtenberg, O. Rodenko, and C. Pedersen, "Pulse-to-
pulse spectral noise in a spontaneous parametric down-conversion light source,"
Opt. Lett. 45, 2772 (2020).
3. Ashik. A. S., P. Tidemand-Lichtenberg, and C. Pedersen, "Mid-infrared
spontaneous parametric down-conversion light source in the saturated regime," –
submitted to Nature Communications – 23 March 2021.
4. Ashik. A. S., A. H. Ohrt, P. Tidemand-Lichtenberg, and C. Pedersen,
"Continuously tunable mid-infrared light based on gain saturated spontaneous
parametric down-conversion in a fan-out crystal" – To be submitted.
vi
Conference proceedings
1. Ashik. A. S., C. F. O’Donnell, S. C. Kumar, M. Ebrahim-Zadeh, P. Tidemand-
Lichtenberg, and C. Pedersen, "Theoretical modeling and experimental
demonstration of a mid-infrared femtosecond upconversion system," in 2019
Conference on Lasers and Electro-Optics Europe and European Quantum
Electronics Conference, OSA Technical Digest (Optical Society of America,
2019), paper cd_4_3, - Oral talk.
2. Ashik. A. S., P. Tidemand-Lichtenberg, and C. Pedersen, "Design and
development of a low-cost tunable mid-infrared light source based on single pass
optical parametric generation in a quasi-phase-matched lithium niobate crystal,"
in OSA High-Brightness Sources and Light-Driven Interactions Congress 2020
(EUVXRAY, HILAS, MICS), OSA Technical Digest (Optical Society of America,
2020), p. MTh1C.7, - Oral talk.
3. C. Pedersen, Ashik. A. S., and P. Tidemand-Lichtenberg, "Mid-IR upconversion
imaging: theory and applications," in Nonlinear Frequency Generation and
Conversion: Materials and Devices XIX (International Society for Optics and
Photonics, 2020), Vol. 11264, p. 112641A, - Invited talk.
4. C. Pedersen, Ashik. A. S., and P. Tidemand-Lichtenberg, "Nonlinear crystals for
imaging and detection of mid-IR radiation," in Smart Photonic and Optoelectronic
Integrated Circuits XXII (International Society for Optics and Photonics, 2020),
Vol. 11284, p. 112841A, - Invited talk.

vii
Mid-Infrared upconversion imaging and
spectroscopy using short pulse light source

viii
Contents
1 Introduction................................................................................................................. 1
1.1 Brief historical overview ...................................................................................... 2
1.2 Motivation ............................................................................................................ 5
1.3 Project goals ....................................................................................................... 11
1.4 Prior work .......................................................................................................... 12
1.4.1 Parametric mid-IR light detection .............................................................. 13
1.4.2 Parametric mid-IR light source ................................................................... 16
1.5 Thesis structure .................................................................................................. 17
2 Basics of 𝛘(𝟐) nonlinearity ...................................................................................... 20
2.1 Introduction to nonlinear optics ......................................................................... 21
2.2 Second-order nonlinear processes ...................................................................... 22
2.3 Coupled wave equations .................................................................................... 24
2.4 Phase-matching .................................................................................................. 27
2.4.1 Birefringent phase matching (BPM) ........................................................... 31
2.4.2 Quasi-phase matching (QPM) .................................................................... 33
3 Pulsed mid-infrared SPDC light source – a theory for the saturated regime............ 38
3.1 Introduction ........................................................................................................ 39
3.2 Experimental arrangement ................................................................................. 42
3.3 Theory ................................................................................................................ 45
3.3.1 SPDC output energy in the saturated regime .............................................. 45
3.3.2 Spectral properties of the SPDC signal ...................................................... 49
3.3.3 Angular coupling efficiency (fACE) ............................................................. 52
3.3.4 Effective crystal length (leff)........................................................................ 57
3.4 Results and discussion ....................................................................................... 60
3.4.1 Fitting parameters ....................................................................................... 60
3.4.2 Spectral properties in the saturated regime ................................................. 60
3.5 Conclusion ......................................................................................................... 67
ix
4 Pulse-to-pulse noise in a mid-IR SPDC light source ................................................ 69
4.1 Introduction ........................................................................................................ 70
4.2 Experimental setup ............................................................................................. 71
4.3 Results and discussion ....................................................................................... 73
4.4 Conclusion ......................................................................................................... 80
5 Continuously tunable pulsed mid-IR SPDC light source ......................................... 82
5.1 Introduction ........................................................................................................ 83
5.2 Experimental arrangement ................................................................................. 84
5.3 Results and discussion ....................................................................................... 86
5.3.1 SPDC energy measurement ........................................................................ 86
5.3.2 Upconversion idler spectral measurement .................................................. 89
5.3.3 Crystal position versus idler center wavelength ......................................... 92
5.3.4 Pulse-to-pulse idler stability ....................................................................... 94
5.3.5 Spectroscopy using polystyrene film .......................................................... 95
5.4 Conclusion ....................................................................................................... 100
6 Upconversion imaging in the mid-IR using femtosecond pulses ........................... 102
6.1 Introduction ...................................................................................................... 103
6.2 Experimental setup ........................................................................................... 104
6.3 Theory and results ............................................................................................ 106
6.3.1 Angular and spectral acceptance bandwidth............................................. 116
6.3.2 Imaging resolution for an ultrashort-pulsed upconversion system ........... 119
6.4 Conclusion ....................................................................................................... 124
7 Summary and Outlook ............................................................................................ 127
7.1 Summary .......................................................................................................... 127
7.2 Outlook ............................................................................................................ 129
Appendix......................................................................................................................... 132
References....................................................................................................................... 135
x
List of Figures
Figure 1.1: Timeline of the development of IR detectors (reproduced from [2]). .............. 2
Figure 1.2: Some of the currently available coherent IR light sources (reproduced
from [3]).............................................................................................................................. 4
Figure 1.3: Dependence of background photon flux density for different wavelengths at
different blackbody temperatures at 2𝜋 field of view (reproduced from [2]). ................... 6
Figure 1.4: Detectivity versus wavelength of photodetectors in the 0.1 – 4 µm spectral
range. The shaded portion indicates the visible region (reproduced from [2]). ................. 8
Figure 1.5: Conceptual representation of upconversion IR detection. The center portion
represents the upconversion module (reproduced from [18]). ............................................ 9
Figure 2.1: Illustration of the relation between 𝑃 and 𝐸 in linear (dotted) and nonlinear
(solid) optics. .................................................................................................................... 22
Figure 2.2: Schematic representation of the upconversion and the SPDC process for
noncollinear interaction. ................................................................................................... 25
Figure 2.3: A plot of the sinc2 function as per equation (2.10). ....................................... 28
Figure 2.4: The noncollinear wave vector diagram for the upconversion process. The solid
and dotted lines represents the upconversion in the forward direction whereas the dashed
line represents the upconversion in the backward direction. ............................................ 28
Figure 2.5: The noncollinear wave vector diagram for the upconversion process with the
transverse component of the phase mismatch taken as zero. ............................................ 30
xi
Figure 2.6: The index ellipsoid for a (a) negative and (b) positive uniaxial crystal. ........ 33
Figure 2.7: A schematic representation of a PPLN crystal. The direction of each domains
are inverted as marked. The figure is adapted from ref. [131]. ........................................ 34
Figure 2.8: The spatial evolution of the field amplitude while propagating through the
medium under various phase matching scenarios. The graph to the left shows the
oscillatory nature of field evolution for the non-phase matched case. The dotted curve in
the graph to the right represents the field evolution for birefringent phase matching, while
the solid curves represent that for first (black), third (light brown), and fifth (light gray)
order QPM. The figure is reproduced from ref. [130]. ..................................................... 35
Figure 2.9: Various QPM structures available in the market. The figure is adapted from
ref. [131]. .......................................................................................................................... 36
Figure 3.1: Schematic of the experimental arrangement, LDM: laser diode module, LC:
laser crystal, SA: saturable absorber, OC: output coupler, fx: a lens with focal length x
mm, HWP: half-wave plate, P: polarizer, PPLN: multi-channel PPLN crystal, M: mirror,
LPF: long-pass 0.75 µm filter. The signal spectrum at the camera plane is highlighted in
the dotted black circle. ...................................................................................................... 42
Figure 3.2: The phase matching curve for the channels used in this work. The curves are
obtained by solving the phase matching condition. .......................................................... 44
Figure 3.3: Pump depletion and slope efficiency. (a) shows an illustration of the spatio-
temporal profile of the pump pulse. The green portion shows the 100% depleted pump
pulse for Ip> Ip,dep, contributing to SPDC generation. (b) shows the temporal pulse profile
of the original and depleted pump simultaneously recorded using two fast silicon-based
detectors. (c) shows the generated SPDC pulse energy as a function of pump energy for
the theoretical and experimental case. The experimental curve is for the 29.52 µm channel.
(d) shows the similar experimental curve for the 29.98 µm channel. .............................. 47

xii
Figure 3.4: Effect of depletion depth on the slope. (a) shows the two different cases of
depletion, D1 – depletion of the pump up to Ip = 0, and D2 – depletion of the pump up to
Ip = Ip,dep. (b) shows the variation in the theoretically estimated slope for the two cases. 48
Figure 3.5: Initial confirmation of the validity of the simulation. (a) shows the results
reported in ref. [108] (reproduced here) when performing the angle integral in equation
(3.9). (b) shows similar result obtained using the developed codes. Same parameters as
reported in ref. [108] is used for the simulation to obtain (b)........................................... 51
Figure 3.6: (a) Depicts our simplistic ACE function model. The introduction of the ACE
function allows the existing simple ray picture to be used. (b) shows the ACE function in
ref. [126], the proposed ACE function for a crystal length of 40 mm and wp = 90 µm, and
an ACE function based on the product of three fields. The dotted vertical line represents
the angular span relevant to the theoretical model in this work. (c) shows the calculated
signal power with and without the ACE function for a fixed pump power and crystal length.
The dotted curve shows the (unrealistic) quadratic growth in the total signal power when
omitting the ACE function. The solid curve depicts the influence of the ACE function
limiting the signal power to a finite value. ....................................................................... 55
Figure 3.7: Picture depicting the theoretical model. The spatio-temporal pulse profile at
two instances, 1.2 and 4.5 times above the depletion intensity, is shown to the down-left.
The nonlinear crystal, with the blue portion representing the corresponding effective
crystal length, is shown to the up-right. ............................................................................ 57
Figure 3.8: The effective crystal length, leff as a function of pump energy. The curve is
obtained by solving the self-consistent equation (3.20). leff(Epump) is almost identical for
both the channels. ............................................................................................................. 59
Figure 3.9: 2D plot of the integrand in equation (3.10) as a function of signal angle and
wavelength for the 29.98 µm channel. The range used for performing the integration is

xiii
represented by the axis limits here. Note that the integrand is completely enclosed within
the integration range. ........................................................................................................ 59
Figure 3.10: Signal spectra for the two channels for different pump pulse energies. The
theoretical spectra (solid lines) are calculated based on the linear fit in Figure 3.3 (c). The
dotted line represents experimentally measured spectra. The theoretically calculated
spectra agree well with the experimental spectra. ............................................................ 61
Figure 3.11: The simulated idler spectrum for different pump energy levels. ................. 63
Figure 3.12: Comparison of the experimental and theoretical signal bandwidth for the two
channels. The theory is capable of, to a great extent, predicting the increase in signal
bandwidth as a function of pump energy. ......................................................................... 64
Figure 3.13: Evolution of the signal energy as a function of pump energy for the two
channels using the signal wavelength as a parameter. Experimental points are shown with
the solid line calculated from the theoretical model. ........................................................ 65
Figure 3.14: The position of gl product in this work compared to close prior arts, that
describe a working model, but for the unsaturated regime. .............................................. 66
Figure 4.1: Schematic layout of the experimental setup. LC: Laser crystal (Yb:YAG), SA:
Saturable absorber (Cr4+:YAG), OC: Output coupling mirror, fx: lens of focal length x in
mm, LP1: Long pass 1 µm filter, HWP: Half wave plate, P: Polarizer, M: Mirror, PPLN:
periodically poled lithium niobate crystal, BD: Beam dump, LP2: Long pass 0.75 µm filter,
G: Grating, ND: Neutral density filters. ........................................................................... 71
Figure 4.2: The phase matching curve obtained by solving the collinear phase matching
condition described by equation (4.1). ............................................................................. 72
Figure 4.3: Performance characteristics of the SPDC light source. (a) shows the measured
signal pulse energy for different pump pulse energies. Inset shows the signal spectrum

xiv
measured using the spectrum analyzer. (b) shows the energy per pulse for the pump and
the signal for 103 consecutive pulses. The spatial profile of the pump and the spectral
profile of the signal are shown in the inset. CVE: Coefficient of variation for the pulse
energy. .............................................................................................................................. 74
Figure 4.4: Pulse-to-pulse characterization of the pump spatial profile and signal spectrum,
using Ep = 180 µJ. (a) shows the stacked cross sectional view of Gaussian spatial profile
of the pump recorded on the InGaAs camera for 103 consecutive pump pulses. (b)
illustrates the high stability of the pulse-to-pulse spatial pump profile by zooming in on the
first 25 consecutive pulses from (a). (c) shows the stacked cross sectional view of signal
spectrum for 103 consecutive signal pulses (simultaneously recorded with (a)). (d)
illustrates the instability of the pulse-to-pulse signal spectral profile by zooming in on the
first 25 consecutive pulses from (c). ................................................................................. 76
Figure 4.5: Coefficient of variation in the pulse-to-pulse energy at different levels above
the SPDC threshold .......................................................................................................... 77
Figure 4.6: The signal spectrum with corresponding spectral intensity stability for three
different pump pulse energy cases. (a) shows the mean signal spectrum for 103 consecutive
pulses at three different pump pulse energies indicated in Figure 4.5(a). (b) shows the CV
of the signal spectral intensity over the spectrum. The white dots represent the level where
the spectral intensity drops to exp(-2) level of maximum value for each curves in (a). .. 78
Figure 5.1: An illustration of a fan-out PPLN crystal. 𝛬𝑠ℎ𝑜𝑟𝑡 and 𝛬𝑙𝑜𝑛𝑔 represents the
shortest and longest periodicity available in the fan-out crystal. The figure is adapted from
ref. [131]. .......................................................................................................................... 83
Figure 5.2: Schematic layout of the experimental setup. LC: Laser crystal (Yb:YAG), SA:
Saturable absorber (Cr4+:YAG), OC: Output coupling mirror, fx: lens of focal length x in
mm, LP: Long pass 1 µm filter, HWP: Half wave plate, P: Polarizer, M: Mirror, PPLN:
periodically poled lithium niobate crystal, BD: Beam dump. .......................................... 85

xv
Figure 5.3: SPDC energy measured across different positions in the crystal. The legend
shows the approximate center signal and idler wavelengths. ........................................... 86
Figure 5.4: SPDC power measured while the fan-out crystal is continuously translated. 88
Figure 5.5: The collinear phase matching curve for the fan-out crystal. The range of SPDC
signal an idler is shown. Degeneracy corresponds to the point where the signal and idler
wavelengths are the same. ................................................................................................ 89
Figure 5.6: Idler spectral bandwidth comparison between the experiment and the theory
.......................................................................................................................................... 90
Figure 5.7: Fan-out crystal position versus idler center wavelength for the experiment,
theory, and polynomial fit to the experiment. .................................................................. 92
Figure 5.8: The CV for the idler center wavelength. Color change represents the change in
spectrometer. The CV value is extremely small suggesting a high stability of the data
during scans. ..................................................................................................................... 93
Figure 5.9: Statistical analysis of pulse-to-pulse idler energy stability. The CV for the
pulse-to-pulse energy is shown here. ................................................................................ 95
Figure 5.10: The idler wavelength step size for different crystal translation step size
denoted by 𝛥𝑥𝑝. ................................................................................................................ 96
Figure 5.11: The absorption spectra for a polystyrene film with 0.05 mm thickness. (a)
shows the absorption estimated by measuring the transmitted power at different crystal
positions. (b) shows the absorption spectra. The x axis in (b) is calculated using equation
(5.4). .................................................................................................................................. 98
Figure 5.12: Comparison of the absorption spectra measured in this experiment with that
of a previously published result [151]. ............................................................................. 99

xvi
Figure 6.1: Schematic of the experimental setup used for mid-IR femtosecond
upconversion imaging. HWP: half-wave plate, PBS: polarizing beam-splitter, OPO:
optical parametric oscillator, BC: beam combiner, LN: lithium niobate crystal,
MgO:PPLN: Magnesium oxide doped periodically poled LN crystal f: lenses. ............ 105
Figure 6.2: Schematic representation of a 4f imaging configuration. OP: Object plane, FP:
Fourier plane, IP: Image plane, NLC: Nonlinear crystal, L: Lens. ................................ 108
Figure 6.3: Illustration of the noncollinear upconversion geometry and the various angles
involved in the calculations. Description of different colored lines used is included in the
figure. The pump field direction is considered to be fixed and along the z axis in the
representation. ................................................................................................................. 109
Figure 6.4: The wave vector phase matching representation of the upconversion process in
the transverse and longitudinal direction. ....................................................................... 110
Figure 6.5: The noncollinear phase matching curve for the upconversion process........ 112
Figure 6.6: Calculation of I(ρc). (a) shows the contribution to I(ρc) from different mid-IR
input angles. (b) shows the contribution to I(ρc) from all mid-IR angles and wavelengths.
(c) shows the contribution to I(ρc) from all mid-IR angles and all mid-IR and pump
wavelengths. The spectral weighting is applied at all mid-IR and pump wavelengths
respectively in (b) and (c). The peak of intensity at each wavelength traces a Gaussian
profile. (d) shows the final upconverted I(ρc) for the three experimental central mid-IR
wavelengths. ................................................................................................................... 114
Figure 6.7: Comparison of experimental and theoretical values of Δρc for the three different
mid-IR wavelengths. ....................................................................................................... 115
Figure 6.8: Illustration of upconverted intensity as a function of (a) mid-IR input angles
and (b) mid-IR wavelengths. The FWHM of the intensities in (a) and (b) provides the
angular and spectral acceptance bandwidth respectively for the upconversion process. The
xvii
choice of ρc in (a) corresponds to the collinear case for that particular mid-IR wavelength
and that in (b) corresponds to the value at which the peak intensity occurs at the central
mid-IR wavelength used during the experiment. ............................................................ 117
Figure 6.9: A schematic summary of the upconversion imaging process. MF:
Magnification factor, PSF: Point spread function. The figure is reproduced from ref. [166].
........................................................................................................................................ 120
Figure 6.10: Resolvability of the upconversion system. The USAF resolution target (top
left) with green encircled portion indicating the region of the target that is upconverted,
the upconverted image of the highlighted portion (top right). The intensity plot along a
vertical strip (blue line) from the upconverted image is shown at the bottom. This strip
contains the smallest feature of the target, and its corresponding intensity profile is
enclosed within the green dotted ellipse. ........................................................................ 120
Figure 6.11: Illustration of chromatic blurring for broadband mid-IR light and a broad
nonlinear acceptance bandwidth. (a) is a vectorial representation of the chromatic blurring
effect. (b) shows the effect of a cone of incoming IR angles being transferred as a blurred
cone in the image plane. IP: Image plane. ...................................................................... 122
Figure 6.12: Illustration of the net blurring effect. (a) shows the upconverted image. The
dotted yellow circle shows the uncertainty of the collinear point. The four numbered
sections correspond to four different locations in the image whose intensity vs. pixel plot
along the red and blue lines is given at the bottom. Red corresponds to a tangential feature,
whereas blue corresponds to a radial feature with respect to the center. One pixel in the
camera corresponds to 10 × 10 µm. (b) shows the qualitative indication of net blurring at
different locations in the image plane. (c) is a plot of the blurring in the object plane from
due to the PSF and chromatic blurring. .......................................................................... 123

xviii
List of Tables
Table 1.1: Division of IR radiation. The contents of this table is adapted from [2]. .......... 5
Table 4.1: Quantized pulse-to-pulse stability as a function of pump energy. .................. 79
Table 6.1: Representation of values of leff for different values of temporal overlap τ and
indication of how it affects various upconversion parameters. ns: nanosecond, ps:
picosecond, fs: femtosecond. The calculations are performed for a pump wavelength of
0.804 µm and a mid-IR wavelength of 3.206 µm. The efficiency for a monochromatic
collinear plane wave (ηMCP) case at τ = 1 ns is assumed to be 1. Δθ and Δλ represents the
acceptance parameters. ηT represents the arbitrary total efficiency for the ultrashort-pulsed
upconversion system. ...................................................................................................... 118

xix
List of Abbreviations
IR Infrared
FPA Focal plane array
SWIR Short-wavelength IR
MWIR Medium-wavelength IR
LWIR Long-wavelength IR
VLWIR Very long-wavelength IR
SFG Sum frequency generation
SHG Second harmonic generation
DFG Difference frequency generation
CW Continuous wave
UV Ultraviolet
SPDC Spontaneous parametric down-conversion
OPO Optical parametric oscillation
OPG Optical parametric generation
OPA Optical parametric amplifier
SC Supercontinuum
KDP Potassium dideuterium phosphate
LiNbO3 Lithium niobate
PPLN Periodically poled lithium niobate
KTP Potassium titanyl phosphate
PPKTP Periodically poled KTP
LIDAR Light detection and ranging
AgGaS2 Silver thiogallate
LiIO3 Lithium iodate
MgO:PPLN Magnesium oxide doped PPLN
BaGa4Se7 Barium gallium selenide
xx
BaGa2GeSe7 Barium gallium germanium selenide
CCD Charge couple device
BPM Birefringent phase matching
QPM Quasi phase matching
ACE Angular coupling efficiency
Yb:YAG Ytterbium-doped yttrium aluminum garnet
HR High reflection
OC Output coupler
Cr4+:YAG Chromium-doped yttrium aluminum garnet
InGaAs Indium gallium arsenide
FWHM Full width at half maximum
CV Coefficient of variation
CaF2 Calcium fluoride
Si Silicon
GVM Group velocity mismatch
KLM Kerr lens mode locked
USAF United states air force
FTL Fourier transform limited
MCP Monochromatic collinear plane wave
FoV Field of view
PSF Point spread function
MRE Maximum number of resolvable elements

xxi

1
1 Introduction
"… if we call light, those rays which illuminate objects, and radiant
heat, those which heat bodies, it may be inquired, whether light be
essentially different form radiant heat?"
W. Herschel
This chapter provides an introduction to the three years of research work carried out at the
Optical Sensor Technology Group, Department of Photonics Engineering, Technical
University of Denmark. A brief overview of the technological developments and
challenges in the research topic is initially discussed. This is followed by the motivation to
address a few of those challenges. Specific project goals are mentioned later, followed by
a survey of the relevant prior art. The chapter ends with an outline of the thesis structure.
Contents
1 Introduction................................................................................................................. 1
1.1 Brief historical overview ...................................................................................... 2
1.2 Motivation ............................................................................................................ 5
1.3 Project goals ....................................................................................................... 11
1.4 Prior work .......................................................................................................... 12
1.4.1 Parametric mid-IR light detection .............................................................. 13
1.4.2 Parametric mid-IR light source ................................................................... 16
1.5 Thesis structure .................................................................................................. 17

Brief historical overview
2
1.1 Brief historical overview
nfrared (IR) radiation was discovered by William Herschel more than two centuries
ago [1] by measuring the heat distribution in the sunlight after being dispersed by a
prism. His thermometers measured the increasing heat beyond the red end of the visible
spectrum and called it the invisible thermometrical spectrum. This discovery has since then
paved the way for extensive research and development involving IR radiation. The sunlight
is a primary source of IR radiation; however, Planck's radiation law, which relates the
spectral density of electromagnetic radiation emitted by a black body to its temperature,
suggests that radiation from objects at room temperature is primarily in the IR spectrum.
Detecting IR radiation has received significant attention since early times due to the
multitude of functionalities it offers. Traditionally, direct IR detectors can be broadly
classified as thermal or photon detectors [2]. Direct IR detection implies that the IR
radiation is directly converted to a measurable quantity (for example, electric current).
Figure 1.1 shows a timeline of the development of various IR detectors.
Figure 1.1: Timeline of the development of IR detectors (reproduced from [2]).
Thermal detectors are based on materials that absorb incident IR radiation causing a change
in its temperature. This subsequently leads to a change in one of its material properties,
which can then be measured and quantified. Thermal detectors are insensitive to the
spectral content of the detected IR radiation. Though they are cheap and easy to use,
thermal detectors are hampered by their low sensitivity and slow response. Up until the
late 1930s, thermal detectors, based on bolometers, pyroelectric, and thermoelectric
I

Brief historical overview
3
effects, dominated the IR detection arena. In the last couple of decades, using an array of
thermal IR detectors (focal plane array (FPA) configuration) has proved to increase the
overall sensitivity of thermal detection. The early 1940s saw the advent of IR detectors
based on semiconductor materials. These detectors come under the class of photon
detectors and serve as the major workhorse in direct IR detection.
Photon detectors are based on the absorption of IR radiation resulting in a change in the
electronic distribution in a semiconductor material. An incident IR photon is absorbed,
followed by the generation of an electron-hole pair due to the transition of an electron from
one energy level to the other. This change in electronic distribution leads to an electric
current. The bandgap between the transition levels determines the energy of the IR photon
(conversely, the wavelength of the IR photon) that the material can detect. Thus, photon
detectors are sensitive to the spectral content of the IR radiation. However, these detectors
are affected by background thermal photon generation. Nevertheless, applications based
on IR detection, such as spectroscopy, where spectral sensitivity is important, promoted
extensive development in photon detectors in the last 60 years.
With the advancements in IR detection, it was inevitable that IR light sources also
developed parallelly. The possibilities unlocked through IR spectroscopy necessitated the
availability of cheap and efficient IR light sources. One of the most common IR light
sources is the thermal light source generating broadband IR radiation when heated. These
sources are generally less directional and often incoherent. With the progress in IR
semiconductor technology, IR light generation at wavelengths corresponding to the
fundamental energy gap of the semiconductor material became possible. To cover the
farther spectral region in the IR, semiconductor materials with heterostructures facilitating
quantum tunneling have been explored. These are called quantum cascade lasers, where
the photon energy depends on the quantum well thickness and not directly on the
fundamental energy gap of the material, thus providing the possibility to engineer a
particular, wanted emission wavelength. With the advent of lasers, the parametric
interaction of an intense laser beam in a second order nonlinear medium allowed the
generation of light at new frequencies – generally referred to as nonlinear parametric

Brief historical overview
4
frequency conversion. This allowed the generation of coherent light across a broad span
of the IR spectrum simply by choosing the appropriate second-order nonlinear medium
that is transparent in the required IR range. Supercontinuum light sources are also based
on nonlinear interaction with matter; however, fundamentally different from the
parametric frequency conversion process. They require a third-order nonlinear medium
and generates a broad continuum of the IR spectrum, however, in a spatially single-mode
using fibers. Figure 1.2 shows an overview of some of the coherent IR sources currently
available.
Figure 1.2: Some of the currently available coherent IR light sources (reproduced
from [3]).
Nonlinear parametric frequency conversion techniques have also been instrumental in the
development of indirect IR detection schemes. Indirect IR detection helps to overcome the
many limitations of the direct IR detectors by translating the spectral and spatial
information from the IR to the easy-to-detect visible/near-IR spectral range. Furthermore,
in the transparency window of the material, there is ideally no absorption and, according
to Kirchhoff's law [2], does not emit blackbody radiation. Thus the parametric frequency
conversion process is inherently noise-free. The possibility of indirect IR detection was

Motivation
5
predicted close to the demonstration of the first laser itself. Still, it was not until the last
three decades where highly efficient indirect IR detectors were demonstrated.
The IR spectral range spans a significant portion of the electromagnetic spectrum, roughly
0.7 to 100 µm. There appears to be no commonly accepted definition for precise
boundaries for the different sections of the IR spectral range. Table 1.1 shows the
classification of different spectral bands in the IR, following the description in [2].
Table 1.1: Division of IR radiation. The contents of this table is adapted from [2].
Spectral region name (abbreviation) Wavelength range (in µm)
Near infrared (near-IR) 0.78–1
Mid infrared
(mid-IR)
Short wavelength IR (SWIR) 1–3
Medium wavelength IR (MWIR) 3–6
Long wavelength IR (LWIR) 6–15
Very long wavelength IR (VLWIR) 15–30
Far infrared (far-IR) 30–100
The term IR is used to generally refer to the infrared spectrum. In this thesis, the IR
radiation in the range between 1 and 5 µm is primarily discussed. Hence, for the remainder
of the thesis, we use the term mid-IR when referring particularly to this wavelength range.
1.2 Motivation
The invention of the laser has revolutionized research and development in numerous fields.
This is supported by the fact that several Nobel Prize awards have been won in the field
across sciences involving lasers and related technology [4]. Lasers form one of the driving
forces in areas like information technology, medicine, industry, and academic research.
Lasers are explicitly characterized by their high temporal coherence, high directionality,
and ability to focus the light to tiny spot sizes. The high brightness available from lasers
enables strong interaction with matter, opening up the exciting field of nonlinear optics,
the term first coined by E. Schrödinger in 1942 [5]. Nonlinear optics, as of now, is an

Motivation
6
umbrella term encompassing several interesting nonlinear effects resulting from light-
matter interaction. For the framework of the thesis, the discussion is limited only to the
second order (χ(2)) nonlinearity.
Figure 1.3: Dependence of background photon flux density for different wavelengths
at different blackbody temperatures at 2𝜋 field of view (reproduced from [2]).
The IR portion of the electromagnetic spectrum has presented itself as a valuable tool for
sensing applications. Thermal surveillance is an excellent and widespread use of IR
technology. The presence of unique, nature-given vibrational absorption features for
several chemicals and complex molecules in the mid-IR, the so-called chemical fingerprint
region, has facilitated their easy identification based on vibrational spectroscopy. This has
promoted the emergence of IR spectroscopy as a powerful tool with applications reaching
almost all walks of science and technology ranging from environmental monitoring [6–8],

Motivation
7
medical [9–14] and industrial sensing [8], to defense applications [15]. A comprehensive
review of various applications of IR spectroscopy is presented in refs. [16,17].
Traditional IR photon detectors are hampered by the thermal noise caused by black body
radiation. Though this effect could be present in any photon detector, Plank's radiation law
suggests that the number of photons emitted peaks around 10 µm for a black body at room
temperature. Moreover, for the same black body temperature, the amount of photons is
several orders of magnitude less in the visible region. This is clearly shown in Figure 1.3,
implying that traditional direct IR photon detectors have to be cryogenically cooled to
maintain high performance. Cooling leads to an overall rise in the system complexity,
bulkiness, and associated costs, hence motivating the search for an alternative solution for
IR detection.
Nonlinear optics has revolutionized the way we approach the IR portion of the
electromagnetic spectrum. Indirect IR detection is facilitated by mixing the IR light with a
strong pump field inside a χ(2) (second-order) nonlinear medium resulting in the generation
of visible/near-IR light at the sum frequency of the two mixing fields. The technique, based
on the sum frequency generation (SFG) process, is called upconversion and has a
significant benefit in terms of room temperature, low noise, detection. The upconverted
frequency usually ends up being in the visible/near – IR region where low-noise Si-based
detectors are well established. Figure 1.4 shows improved detectivity of photon detectors
in the 0.1 to 4 µm range while moving to shorter wavelengths. The upconversion IR
detection technique is versatile because it can cover a broad range of IR wavelengths by
the proper choice of nonlinear material and mixing laser wavelength.
As mentioned, the parametric frequency conversion processes for IR detection and
generation are inherently a low noise process, thus attractive, however initially limited by
low conversion efficiency. The reason for this limitation was primarily two-fold; firstly,
the lasers available were bulky and expensive, and secondly, the nonlinear crystals had
low damage threshold and low nonlinearity. With the maturing of the laser technology and
improved crystals with good quality, increased damage threshold, and higher nonlinearity,

Motivation
8
high conversion efficiencies were achievable. A simple conceptual representation of
upconversion detection is shown in Figure 1.5. The upconversion happens in the
upconversion module.
Figure 1.4: Detectivity versus wavelength of photodetectors in the 0.1 – 4 µm spectral
range. The shaded portion indicates the visible region (reproduced from [2]).

Motivation
9
Figure 1.5: Conceptual representation of upconversion IR detection. The center
portion represents the upconversion module (reproduced from [18]).
Another interesting aspect of upconversion detection is the possibility to perform pump-
probe experiments through short-pulse upconversion to observe snapshots of processes
happening at ultrafast time scales. In physics, chemistry, and biology, scientists have put
a lot of effort in understanding the dynamics of chemical processes. For example, during
the course of a chemical reaction, various intermediaries are generated en route to its
completion, and a detailed understanding of the whole reaction is only possible through an
investigation of the intermediaries. An interesting example of this is the study of the
binding of oxygen to hemoglobin in blood [19]. Pump-probe techniques are very well
established in the ultraviolet(UV)-visible-near-IR range; however, ultrafast vibrational
spectroscopy enables the study of dynamic IR processes, for example, in larger and more
complex molecules. Hence the field of ultrafast IR spectroscopy.
In addition to ease in the detection of IR, short-pulse upconversion technique provides a
salient advantage for pump-probe experiments by inherently providing optical time gating,
whereby adjusting the delay of the pulses allows various temporal instances of
fluorescence to be traced. Additionally, pulsed upconversion provides further
improvement in the conversion efficiency over continuous wave (CW) upconversion
because of the high peak intensities available for pulsed light. Furthermore, pulsed light
generally has a broad spectral width suitable for broadband spectroscopy. In concurrence
with these developments in IR detection, the field of IR generation also advanced.

Motivation
10
Technological advances in the field of lasers and nonlinear crystals also promoted research
in IR light sources based on nonlinear parametric frequency conversion. The opposite of
upconversion, i.e., down-conversion, has been extensively explored to generate light at IR
wavelengths. The process is based on difference frequency generation (DFG), where the
incident fields interact with a second-order nonlinear medium resulting in the generation
of mid-IR light at the difference frequency of the two mixing fields. Two of the most
common techniques to generate mid-IR light based on DFG are spontaneous parametric
down-conversion (SPDC) and optical parametric oscillation (OPO). SPDC is also called
optical parametric generation (OPG) in literature.
SPDC involves a single high-power laser beam interacting with the nature given vacuum
fluctuations in the nonlinear medium, spontaneously generating two new photons at longer
wavelengths. OPO is similar to SPDC system, but is placed inside a cavity. Cavity
arrangement facilitates multiple transits through the nonlinear medium, thus improving the
overall parametric gain. OPOs are broadly tunable devices capable of providing light
emission covering a broad spectral range in the mid-IR. However, OPOs are hampered by
increased complexity in terms of cavity arrangements and strict requirements for tuning.
Further, the cost of such a system is generally high.
SPDC is particularly interesting due to the cavity-free arrangement supporting single-pass
configuration, thus offering simplicity. For macroscopic SPDC generation, the nonlinear
medium combined with a high intensity pump beam has to provide a tremendously high
gain. Giant pulse formation via Q-switching provides optical pulses having several tens of
kilowatts of peak power with a temporal duration of few nanoseconds, thus providing
highly intense light beams. Nonlinear processes proved to be highly efficient with the use
of Q-switch pulses, consequently leading to efficient mid-IR light generation using SPDC.
To summarize this section, nonlinear parametric frequency conversion techniques have
significantly advanced IR generation and detection. For the remainder of this thesis, we
are only concerned with second-order nonlinearity and its contribution to IR detection and
generation through frequency up/down conversion.

Project goals
11
1.3 Project goals
The primary objective of this Ph.D. project can be condensed into the following points
listed below.
1. Design and develop a cheap, tunable, pulsed mid-IR light source based on SPDC.
In our group, SPDC was initially investigated as a noise source present in the
upconversion process [20]. Later, the possibility of building a light source based
on SPDC was investigated [21]. In this work, we aim to further expand the
understanding of the mid-IR light source based on SPDC. A theoretical
investigation and modeling of the important properties of the SPDC light source in
the high gain regime are discussed. The availability of a high peak power passively
Q-switched laser developed in the group facilitated the investigation [22].
2. Quantify the pulse-to-pulse spectral intensity noise of the mid-IR SPDC light
source. Investigating the energy and spectral intensity stability of the light source,
which are necessary parameters to be known when using the light source for
applications.
3. Demonstrate continuous broadband tunability of the mid-IR SPDC light source and
use it to perform spectroscopy.
4. Design and develop a mid-IR upconversion system in the ultrashort pulse regime
based on upconversion. Our group has several years of experience with mid-IR
upconversion imaging and spectroscopy in the CW and pulsed (up to picosecond)
regime. The idea was to extend the investigation to the even shorter pulse duration
(femtosecond pulses) and develop a model to explain the properties of the
ultrashort pulsed upconversion system.
Please note that this is a rather concise description of the project objectives, and its purpose
here is to help the readers realize the need for the literature review done in the next section.
The objectives listed above are treated in detail in the subsequent chapters.
Prior work
12
1.4 Prior work
Shortly following the demonstration of the first laser in 1960 by T. H. Maiman [23],
Franken et al. demonstrated second harmonic generation in a quartz crystal using a ruby
laser in 1961 [24]. Though several nonlinear effects were reported before the invention of
lasers (see refs. [25–27]), this seminal work is widely considered to be the beginning of
the field of nonlinear optics, and more specifically, χ(2) based interactions. The years
following the invention of the laser witnessed significant interest in investigating χ(2)
nonlinear optical effects, including detailed theoretical treatment. A solid theoretical
framework for several χ(2) nonlinear effects were in existence by the end of the first decade
of the laser invention. In 1962, D. A. Kleinman investigated the symmetry properties of
nonlinear crystals and their involvement in second harmonic generation of light [28]. In
the same year, Armstrong et al. published a paper discussing the theoretical aspects of
parametric frequency upconversion [29]. Starting from Maxwell's equations, the coupled
differential equations for the three-wave interaction process and its explicit solution for
plane waves were derived and discussed. The relevance of phase velocity matching
between the interacting fields for efficient nonlinear interaction was also discussed. J. A.
Giordmaine and Maker et al. described a method to achieve phase matching between an
ordinary and an extraordinary ray in a bulk anisotropic crystal [30,31], demonstrating
birefringence phase matching. In 1968, Boyd and Kleinman provided a detailed discussion
of the parametric interaction process involving focused Gaussian laser beams [32]. Until
then, most theoretical descriptions involved plane wave assumption, which is not generally
valid. Following this brief literature review of the initial experiments and theoretical
consideration of the parametric frequency conversion process, we focus particularly on the
evolution of parametric frequency conversion technology for mid-IR detection and
generation.

Prior work
13
1.4.1 Parametric mid-IR light detection
Parametric mid-IR detection is an indirect mid-IR detection scheme. As early as 1962,
Armstrong et al. first proposed upconversion as a tool for IR detection [29]. A series of
demonstrations of upconversion followed this. Smith and Braslau were the first to
demonstrate upconversion in the visible region using a ruby laser as a pump and a KDP
crystal [33]. Five years later, in 1967, Midwinter and Warner demonstrated upconversion
of 1.7 μm mid-IR radiation to visible using a bulk lithium niobate (LiNbO3) crystal
achieving 1% conversion efficiency [34]. A year later, Midwinter first demonstrated
parametric upconversion imaging from 1.6 µm to 0.4842 µm using bulk LiNbO3 [35].
Many works reported the experimental demonstration of upconversion imaging from mid-
IR to visible/near-IR range [36–38]. A detailed theoretical treatment of the upconversion
imaging technique was also published within the early 1970s [39–42]. In 1971, Falk and
Yarborough demonstrated upconversion of room-temperature thermal radiation showing
the possibility of upconversion technology for thermal imaging [43]. One interesting early
application of upconversion detection was for astronomical observations [44]. Researchers
were very optimistic about the upconversion technology soon being a robust tool for mid-
IR sensing [44,45]. A smart intracavity upconversion scheme for upconversion was
demonstrated in 1978 by Falk and See [46]. However, already in 1977, R.W. Boyd, in a
review paper, critically stated the need for technological advancements in terms of highly
nonlinear χ(2) materials, high power pump lasers, and low noise performance for
upconversion technology to be a viable alternative to direct IR sensing [47].
Two decades passed by with little progress in upconversion technology as if the field was
almost abandoned. Meanwhile, material and laser technology flourished. A wide range of
nonlinear materials with high transparency, high nonlinearity, and high damage threshold
became available. Correspondingly, lasers with high power also became standard
instrumentation in the market. Consequently, these factors led to the possibility of a
significant increase in the frequency conversion efficiency and further rejuvenating the
upconversion detection technology.

Prior work
14
In the transparent spectral regime of bulk LiNbO3 (0.4 – 5 µm), quasi-phase matching
through a periodically poled structure (periodically poled lithium niobate – PPLN) enabled
the possibility to use a crystal axis orientation that provided maximum nonlinearity.
Similar developments happened for other crystals like KTP. Though the concept was
introduced by Armstrong et al. in 1962 [29] and experimentally realized by Szilagyi et al.
through stacking of non-birefringent crystal plates [48] in 1976 and Feng et al. through the
Czochralski method [49] in 1980, the breakthrough in electrical field poling techniques in
the early 1990s propelled the production of high quality periodically poled crystals. Fejer
et al., in 1992, provided a detailed account of quasi-phase-matching using periodically
poled structures [50]. Quasi-phase-matching through periodic poling proved to improve
the nonlinear conversion efficiency significantly in the late 1990s.
Upconversion detection technology grew steadily in the 2000s. The technological
advancement in the semiconductor industry paved the way for high-quality CCD chips in
the market, further improving the already existing upconversion imaging technique.
Roussev et al., in 2004, reported PPLN based upconversion detector for single-photon
counting at communication wavelengths with an efficiency of 86% [51]. The following
years saw several reports on intracavity enhanced upconversion detection using PPLN
crystals [52,53].
The Optical Sensor Technology group at DTU specializes in upconversion imaging and
detection and has contributed significantly to advance the technology since 2009. Pedersen
et al., in 2009, reported 2D image upconversion from 765 nm to 488 nm in an intracavity
scheme using PPKTP crystal with a power conversion efficiency of 40% [54]. Dam et al.
reported high resolution upconversion imaging of thermally illuminated objects [55]. Two
years later, in 2012, room-temperature single-photon imaging was demonstrated with 20%
efficiency [18]. In the following years, several works exploring various possibilities of
upconversion detection have been reported from the group. Lasse et al. demonstrated the
first upconversion-based LIDAR measurements in 2016 [56]. Meng et al. explored the use
of upconversion detection for remote gas sensing [57]. Upconversion detection in the 6 –
8 µm range was demonstrated in 2018 using AgGaS2 crystal [58]. Junaid et al., in 2019,
Prior work
15
demonstrated video-frame-rate (40 Hz) upconversion hyperspectral imaging in the mid-
IR [59]. Huot et al. discussed pulsed synchronous upconversion detection of
supercontinuum light. Biomedical applications using mid-IR upconversion detection,
specifically for analyzing microcalcifications [60], and for label-free histopathology [14]
were demonstrated by the group. A novel scheme using cascaded AGS crystals has been
demonstrated recently for high signal-to-noise ratio upconversion spectrometry in the 6 –
12 µm region [61]. Finally, readers are directed to a recent review paper from the group
on parametric upconversion imaging [62]. In this review paper, a historical timeline of
notable scientific accomplishments relevant to the progress of upconversion imaging
technology is depicted nicely. During the past several years, different research groups have
reported on upconversion detection from the mid-IR to the visible [63–66].
Ultrashort pulsed (typically picosecond to femtosecond) mid-IR upconversion imaging
and detection is of particular interest due to its potential to probe the transient behavior of
a biological system. The scope for pulsed mid-IR spectroscopy was already explored in
the 1970s [67–71]. Several works followed in this direction in the last few decades [72–
77]. In 1989, E. J. Heilweil demonstrated mid-IR transient absorption spectroscopy in the
picosecond time scale using frequency upconversion in LiIO3 crystal [78] and also
proposed the feasibility to use the system in the femtosecond time scale with minor system
modification [79]. Several authors have also explored the use of upconversion technique
for ultrafast spectroscopy mainly in the UV to near-IR spectral regime [80–85]. Various
applications of ultrafast upconversion technology have been reviewed in detail in
refs. [86–88], some of which discuss the effects of group velocity mismatch when
performing upconversion in the femtosecond regime. From our group, Mathez et al., in
2017, for the first time, performed mid-IR upconversion imaging using picosecond mid-
IR and pump pulses demonstrating the capability of high conversion efficiency even in a
single pass configuration when synchronizing high peak power pulses [89]. Similar reports
on the use of picosecond pulsed upconversion in the mid-IR have been reported
recently [66,90]. One of the main objectives of this Ph.D. project was to explore the
modalities of the mid-IR upconversion technique going into shorter (femtosecond) pulse

Prior work
16
regimes. Even though the demonstration of pump-probe experiment using the ultrashort
pulse upconversion system was our focus, unfortunately, this could not be carried out in
this Ph.D. study due to the coronavirus situation.
1.4.2 Parametric mid-IR light source
Along with the progress in nonlinear frequency upconversion, frequency down-conversion
was also explored. Armstrong et al., in 1962, proposed the potential of frequency mixing
to produce light at a new frequency equal to the difference between that of the two mixing
fields [29]. Smith and Braslau, in 1963, demonstrated DFG to obtain light at 0.565 µm by
mixing a ruby laser emission (at 0.6943 µm) with the output from a mercury lamp (0.3115
µm) [91]. Giordmaine and Miller demonstrated tunable parametric oscillation in 1965, for
the first time, by coating the end facets of the LiNbO3 crystal with reflective dielectric
coatings [92]. Several reports followed on the development of OPOs [93–95]. Kerr-lens
mode-locking provided the basis for optical pulse generation in the femtosecond time
scale [96,97]. In 1989, Edelstein et al. reported the first femtosecond OPO [98]. In 1999,
Dunn and Ebrahim-Zadeh published a review on the development of OPOs [99]. The
versatility of OPOs to access different temporal and spectral regimes was discussed. With
the advancements in crystal technology and newer pump lasers, OPOs have emerged as a
mid-IR light source capable of covering a vast spectral range [100–105]. However, OPOs
have certain drawbacks related to the stability of the cavity and tuning
requirements [106,107].
Another interesting scheme for mid-IR generation is based on SPDC. Initial upconversion
experiments suffered significantly from different kinds of noise [34]. One of the possible
noise sources was identified as being the pump undergoing spontaneous down-conversion
to generate photons at the wavelengths that needed to be upconverted. This noise source
was investigated further by Byer and Harris, invigorating interest in SPDC light
sources [108]. They provided an experimental demonstration (the first demonstration of
SPDC can be found in ref. [109]) and a detailed theoretical treatment of SPDC emission
based on plane wave approximation. It is noted here that quantum mechanical treatment
Thesis structure
17
of SPDC was done as early as 1961 by Louisell et al. [110] and later on expanded by
several authors [111,112]. It was clear that a high pump intensity was necessary for
substantial SPDC generation. A method to produce giant optical pulses was demonstrated
by McClung and Hellwarth in 1962 [113]. This technique, later came to be known as Q-
switching, was capable of producing high peak intensity, thus ensuring efficient nonlinear
frequency conversion as demonstrated in refs. [114,115]. Several publications reported on
the design and development of cheap passively Q-switched lasers producing high peak
power pulses [116,117]. All these advances, together with high damage threshold crystals,
proved vital in the development of mid-IR SPDC sources [118–124].
The available theory [108] for SPDC light generation was only applicable to the low gain
regime where the SPDC efficiency is very low. Even though several articles reported
decent SPDC efficiencies, no practical approach was made to develop the theory for higher
gains. Closest prior arts, reported in 2008 and 2011 [125,126], modified the theory, but
still limited to a conversion efficiency of less than 2.5%.
Several authors have attempted to study the pulse-to-pulse variations in the SPDC
generation process primarily by looking at the pulse-to-pulse energy stability [118–120].
These measurements are vital in characterizing the performance of any pulsed light source.
In this Ph.D. work, a detailed theoretical model to explain the properties of SPDC light
generation at high gain/conversion efficiency is presented. The quantification of the pulse-
to-pulse spectral intensity noise is also discussed.
1.5 Thesis structure
Following this introductory chapter 1, chapter 2 introduces the basic concepts of nonlinear
optics, more specifically χ(2) nonlinearities. Particular attention is given to the nonlinear
processes and the necessary theoretical description pertinent to the framework of the thesis.
Phase matching criteria for the relevant processes are discussed.
Thesis structure
18
Chapter 3 describes the design and development of a cheap, tunable, pulsed mid-IR light
source based on SPDC in a PPLN crystal. A passively Q-switched laser generating 3 ns
pulses at 1.03 µm pumps the PPLN crystal capable of generating mid-IR light spanning
from 1.4 to 4 µm with a slope efficiency of over 70%. A theoretical description is provided
to describe the properties of the mid-IR light in the high gain saturated regime for the first
time. Experimental validation of the theory is also presented.
Chapter 4 discusses the characterization of pulse-to-pulse spectral noise in the mid-IR
SPDC light source, for the first time to the best of our knowledge. The spectral noise is
investigated as a function of incident pump pulse energy. A quantified value of pulse-to-
pulse spectral intensity noise is essential when applying the source for actual spectroscopic
measurements.
Chapter 5 discusses the use of a fan-out PPLN crystal for continuously tunable mid-IR
light generation using SPDC in the 2 to 4 µm range. The system is characterized for fan-
out crystal position as a function of the mid-IR center wavelength. As a demonstration, the
spectroscopy of a polystyrene film was performed without the need for a traditional
spectrometer but a power meter.
Chapter 6 demonstrates synchronous mid-IR upconversion imaging in the femtosecond
regime, carried out in collaboration with Professor Majid Ebrahim-Zadeh's research group
at ICFO, Barcelona, Spain. A theory is developed to calculate key upconversion
parameters for an ultrashort pulsed upconversion system. The theory is substantiated by
experimental observations.
Chapter 7 provides a summary of the Ph.D. thesis work and discusses future directions and
prospects in relation to the research work.
It is brought to the reader's attention that the work encompassing the thesis is not arranged
in chronological order but rather in a manner that gives the best narrative. The thesis begins
with mid-IR light generation and ends with mid-IR upconversion imaging and detection.

19

20
2 Basics of 𝛘(𝟐) nonlinearity
“…there were no ideas involved in the laser that weren’t already
known by somebody 25 years before lasers were discovered. The
ideas were all there; just, nobody put it together.”
C. H. Townes
This chapter introduces the basics of second-order nonlinear optics. Particular attention is
given to the theoretical aspects necessary for the understanding of the following chapters.
After a brief introduction to nonlinear optics, various parametric processes as a result of
second-order nonlinearity are discussed. This is then followed by a discussion on the
relevant second-order nonlinear processes pertinent to the framework of this thesis. The
topic of phase matching is given particular focus. Readers are, in general, referred to
standard textbooks in optics for a detailed discussion on the whole topic.
Contents
2 Basics of 𝛘(𝟐) nonlinearity ...................................................................................... 20
2.1 Introduction to nonlinear optics ......................................................................... 21
2.2 Second-order nonlinear processes ...................................................................... 22
2.3 Coupled wave equations .................................................................................... 24
2.4 Phase-matching .................................................................................................. 27
2.4.1 Birefringent phase matching (BPM) ........................................................... 31
2.4.2 Quasi-phase matching (QPM) .................................................................... 33
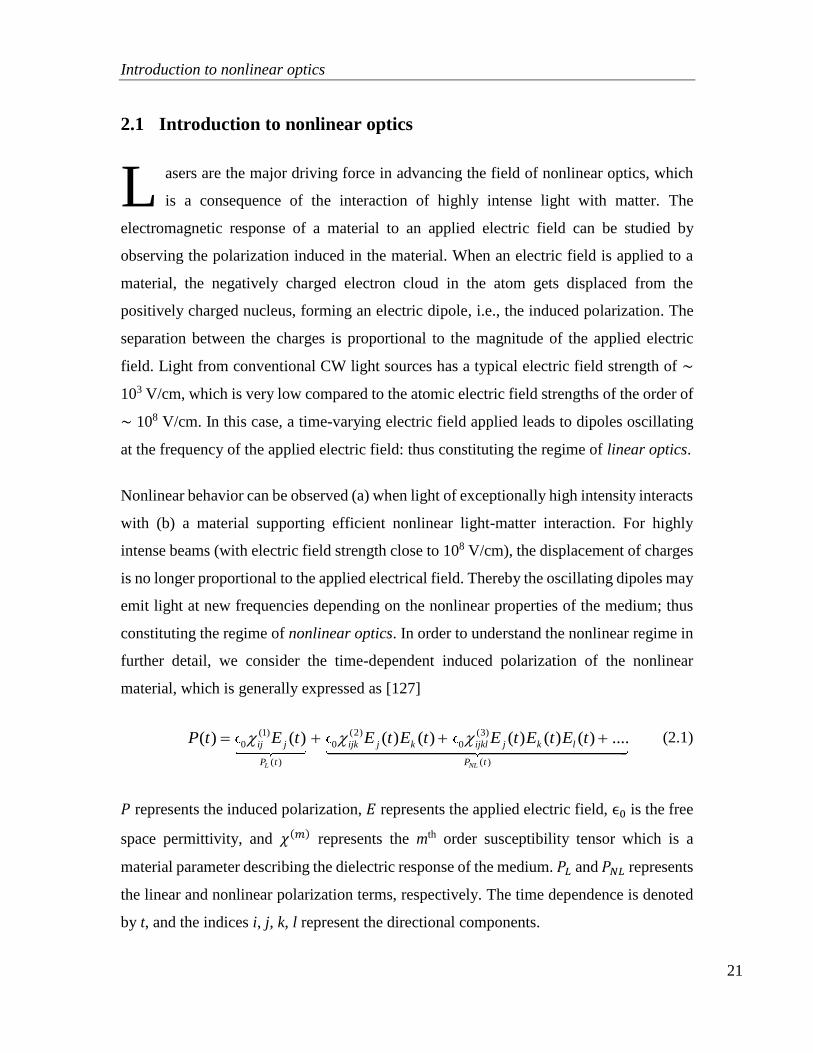
Introduction to nonlinear optics
21
2.1 Introduction to nonlinear optics
asers are the major driving force in advancing the field of nonlinear optics, which
is a consequence of the interaction of highly intense light with matter. The
electromagnetic response of a material to an applied electric field can be studied by
observing the polarization induced in the material. When an electric field is applied to a
material, the negatively charged electron cloud in the atom gets displaced from the
positively charged nucleus, forming an electric dipole, i.e., the induced polarization. The
separation between the charges is proportional to the magnitude of the applied electric
field. Light from conventional CW light sources has a typical electric field strength of ~
103 V/cm, which is very low compared to the atomic electric field strengths of the order of
~ 108 V/cm. In this case, a time-varying electric field applied leads to dipoles oscillating
at the frequency of the applied electric field: thus constituting the regime of linear optics.
Nonlinear behavior can be observed (a) when light of exceptionally high intensity interacts
with (b) a material supporting efficient nonlinear light-matter interaction. For highly
intense beams (with electric field strength close to 108 V/cm), the displacement of charges
is no longer proportional to the applied electrical field. Thereby the oscillating dipoles may
emit light at new frequencies depending on the nonlinear properties of the medium; thus
constituting the regime of nonlinear optics. In order to understand the nonlinear regime in
further detail, we consider the time-dependent induced polarization of the nonlinear
material, which is generally expressed as [127]
(1) (2) (3)
0 0 0
( )( )
( ) ( ) ( ) ( ) ( ) ( ) ( ) ....
L NL
j j ik j k l
t
ij ijk
P
jkl
P t
P t E t E t E t E t E t E t (2.1)
𝑃 represents the induced polarization, 𝐸 represents the applied electric field, ϵ0 is the free
space permittivity, and 𝜒(𝑚) represents the mth order susceptibility tensor which is a
material parameter describing the dielectric response of the medium. 𝑃𝐿 and 𝑃𝑁𝐿 represents
the linear and nonlinear polarization terms, respectively. The time dependence is denoted
by t, and the indices i, j, k, l represent the directional components.
L

Second-order nonlinear processes
22
Figure 2.1: Illustration of the relation between 𝑃 and 𝐸 in linear (dotted) and
nonlinear (solid) optics.
Figure 2.1 illustrates the relationship between 𝑃 and 𝐸 in linear (dotted) and nonlinear
(solid) optics. The first term in the RHS of equation (2.1) corresponds to linear optics,
while all the remaining higher-order terms correspond to the nonlinear optics. The
dielectric response of the medium becomes progressively smaller for higher-order terms.
The second order nonlinear process, as a consequence of the second terms in the RHS of
equation (2.1), is discussed in detail in the next section.
2.2 Second-order nonlinear processes
Second-order nonlinear processes involve the interaction of three optical fields inside a
nonlinear medium, hence the name three-wave mixing. The nonlinear polarization induced
due to second-order nonlinearity can be represented as
0
(2) )
,
(2 (( ) ) ( )ii jkN kL jP E tt E t (2.2)
Assuming two distinct optical beams with frequencies 𝜔1 and 𝜔2 incident on a second-
order nonlinear medium, their electric fields can be expressed, using the standard complex
notation, as
1 2
1 2. , .( ) ( )j k
i it tE c c E c cE t e E t e
(2.3)
The complex conjugate of the fields is simply represented as 𝑐. 𝑐 in the above equation.
Substituting equation (2.3) into (2.2)

Second-order nonlinear processes
23
1 2 1 2
1 2
( ( ((2) 2 2
2 2(*
) ) )(2)
0 1 2 1 2
)
1 2 2
2 2
1
( ) 2
2 . 2( )}
{i i i
NL
SHG SFG
i
D
t t t
j
FG
i k
t
P t e e E e
E e c c E E
E E E
E
(2.4)
The asterisk symbol represents the complex conjugate of the electric field amplitude.
Equation (2.4) gives the nonlinear polarization induced in the medium due to the second-
order nonlinearity. The ensemble of dipoles oscillate at different frequencies (blue color in
equation (2.4)) in comparison to the input frequency. Coherent addition of the dipole
oscillations at a particular frequency leads to emission at that frequency, hence the name
parametric frequency conversion. The first two terms correspond to the second harmonic
generation (SHG) of the two incident fields. The third term represents SFG, and the fourth
term represents the DFG, respectively, of the input fields. The last term corresponds to
optical rectification.
In nonlinear optics, the polarization response of a medium to an applied electric field is
characterized by the optical susceptibility tensor. The second-order nonlinear susceptibility
tensor, 𝜒𝑖𝑗𝑘(2) connects the induced polarization with the interacting electric fields. The
𝜒𝑖𝑗𝑘(2) susceptibility tensor has a total of 27 elements. Interestingly, 𝜒𝑖𝑗𝑘
(2) vanishes for a
centrosymmetric material, indicating that second order nonlinearity can be observed only
in non-centrosymmetric materials. A common practice of representing the 𝜒𝑖𝑗𝑘(2) tensor is
by using the d-matrix notation, which is defined as
(2)1
2ijk ijkd (2.5)
The susceptibility tensor can be simplified to a great extent using the symmetry properties
of the interacting electric fields and the symmetry properties of the specific crystalline
structure of the nonlinear medium. For example, the d-matrix for LiNbO3 looks like

Coupled wave equations
24
31 22
22 22 31
31 31 33
0 0 0 0
0 0 0
0 0 0
il
d d
d d d d
d d d
(2.6)
where l represents the contracted index for j and k combined [127]. Note that there are only
very few nonzero components in the matrix. Furthermore, for a particular choice of the
propagation direction and polarization state of the interacting fields, the simplified d-
matrix can further be reduced to a scalar value. Most often in PPLN crystals, the crystal is
prepared such that the highest value of the nonlinearity (𝑑33 ~ 26 pm/V) is available for
the nonlinear process in order to maximize the nonlinear interaction efficiency.
2.3 Coupled wave equations
Maxwell’s equations provide the basis for the understanding of classical electromagnetics.
These equations govern how an electromagnetic field interacts inside a medium. Prior to
going into the details with the coupled wave equations, we first discuss the two parametric
second-order nonlinear processes relevant for the thesis namely, frequency upconversion
and SPDC.
Upconversion is a special case of SFG where the interaction happens between a strong
coherent laser field and a comparatively faint coherent or incoherent mid-IR field, i.e., a
significant or extreme imbalance in the field strengths. Upconversion is used in this thesis
for the purpose of mid-IR light detection. SPDC is a special case of DFG where a single
strong coherent input field interacts with the nature given vacuum fluctuations in the
medium, generating a plurality of fields at the difference frequency. SPDC is used in this
thesis for the purpose of mid-IR light generation. Figure 2.2 shows the schematic
representation of the two processes for the case of noncollinear field interaction, which is
primarily the case in this thesis.

Coupled wave equations
25
Figure 2.2: Schematic representation of the upconversion and the SPDC process for
noncollinear interaction.
The term �⃗� represents the wave vector of the field. Its magnitude is given as 𝑘 = 𝑛𝜔/𝑐
where 𝑛 is the refractive index, and 𝜔 is the frequency of the field, while c denotes the
speed of light in vacuum. The frequency of the generated field(s) is dictated by the
conservation of photon energy, which for the above two processes, can be represented as
3 1 2 (2.7)
However, for any nonlinear process to be efficient, the momentum of the interacting fields
should also be conserved. This means that the momentum/phase mismatch between the
interacting fields should be as minimum as possible and ideally zero. The phase mismatch
for the above two processes can, in the general case, be represented as
3 2 1k k k k (2.8)
Using Maxwell’s equations, a mathematical description of the generation of fields at new
frequencies can be obtained. Several textbook authors have nicely summarized the
formulation of coupled wave equations for different second-order nonlinear processes.
Following the formulation by R. L. Sutherland [128], the coupled-wave equations
governing the interaction of three different fields as they propagate through the second-
order nonlinear medium for the SFG process are shown in equation (2.9). The set of
equations are called coupled wave equations because changes in one field affect the other
two fields.

Coupled wave equations
26
2 *
3 31 2
3
1
*
23
2
1 13
1
2
2
2
2 z
eff
ef
i kz
i
f
eff
kz
i k
dAi d A A
dz n
d
d
ec
eA
i d A Adz n
Ai d A
c
Adz n
ec
(2.9)
A represents the complex amplitudes of the respective electromagnetic fields, and z
represents the z-axis. Fields are assumed to propagate along the z-axis. The term 𝑑𝑒𝑓𝑓
represents the effective nonlinearity of the medium. 𝛥𝑘 is the scalar notation of 𝛥�⃗� and
will be discussed in detail in the next section.
The derivation for the coupled wave equations (equation (2.9)) includes simplifying
assumptions such as:
Slowly varying envelope approximation: This condition assumes that the distance
over which the amplitude of the electric fields varies is small compared to the
wavelengths – implying that the higher-order derivatives of the electric field can
be neglected. This approximation may be violated in the case of ultrashort pulses.
Plane-wave approximation: The field power is assumed to be uniformly distributed
in the transverse plane so that the transverse field components could be neglected.
Generally, this cannot be true; however, if the Rayleigh length or confocal
parameter of the laser beam is greater than the crystal length, then this is a relevant
simplifying assumption.
Monochromatic fields: This assumption indicates that the interacting fields are
monochromatic in nature. This is not true, for example, in the case of ultrashort
pulses, which usually have a broad bandwidth.
Similar coupled wave equations, as seen in equation (2.9), can be derived for the DFG
process, which is the basis for the SPDC process. Classical analysis of the coupled-wave
equations cannot explain SPDC generation (zero input at signal and idler wavelengths). A
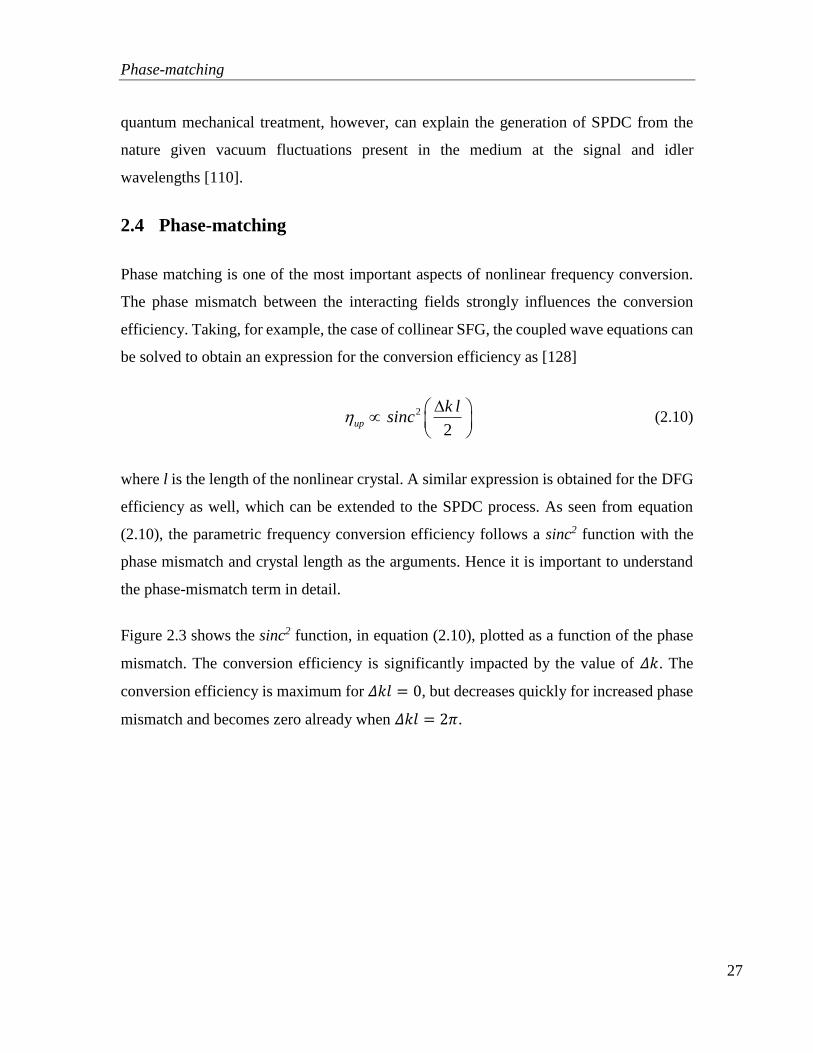
Phase-matching
27
quantum mechanical treatment, however, can explain the generation of SPDC from the
nature given vacuum fluctuations present in the medium at the signal and idler
wavelengths [110].
2.4 Phase-matching
Phase matching is one of the most important aspects of nonlinear frequency conversion.
The phase mismatch between the interacting fields strongly influences the conversion
efficiency. Taking, for example, the case of collinear SFG, the coupled wave equations can
be solved to obtain an expression for the conversion efficiency as [128]
2
2up
k lsinc
(2.10)
where l is the length of the nonlinear crystal. A similar expression is obtained for the DFG
efficiency as well, which can be extended to the SPDC process. As seen from equation
(2.10), the parametric frequency conversion efficiency follows a sinc2 function with the
phase mismatch and crystal length as the arguments. Hence it is important to understand
the phase-mismatch term in detail.
Figure 2.3 shows the sinc2 function, in equation (2.10), plotted as a function of the phase
mismatch. The conversion efficiency is significantly impacted by the value of 𝛥𝑘. The
conversion efficiency is maximum for 𝛥𝑘𝑙 = 0, but decreases quickly for increased phase
mismatch and becomes zero already when 𝛥𝑘𝑙 = 2𝜋.

Phase-matching
28
Figure 2.3: A plot of the sinc2 function as per equation (2.10).
Figure 2.4: The noncollinear wave vector diagram for the upconversion process. The
solid and dotted lines represent the upconversion in the forward direction, whereas
the dashed line represents the upconversion in the backward direction.

Phase-matching
29
In the following, we focus on the noncollinear interaction of fields. Figure 2.4 shows the
noncollinear wave vector diagram for the upconversion process. The direction of the strong
laser field (pump) travels is taken as z axis. 𝜃1 and 𝜃3 represents the angle of the mid-IR
and the generated upconverted fields with respect to the z axis. The solid line represents
the wave vector phase matching diagram for a set of mid-IR and upconverted angles. The
dotted lines represent the wave vector diagram for another set of mid-IR and upconverted
angles. Not that the phase mismatch can point in any direction. The dashed line represents
the wave vector diagram for a possible upconverted field traveling in the backward
direction, i.e., upconversion in the direction opposite to the direction of pump propagation.
As can be seen, the phase mismatch for this case is extremely large, leading to an extremely
low efficiency (see equation (2.10)), hence zero net generation (𝛥�⃗� 𝑐 ≫ 𝛥�⃗� 𝑎 and 𝛥�⃗� 𝑏).
For uniaxial crystals, the vectorial phase mismatch represented by 𝛥�⃗� can be resolved into
a longitudinal and transverse scalar component as
3 3 2 1 1
3 3 1 1
) )
) )
cos( cos(
sin( sin(
z
T k k
k kk
k
k
(2.11)
Leading on from the discussion in refs. [62,129], the expression for the far-field
upconverted field, as a function of the transverse and longitudinal phase mismatch is
expressed, as [62]
2 202
34 sinc
2
Tk w
zAk
el
(2.12)
where 𝑤02 represents the 1/e2 beam radius of the pump field. It is understood from equation
(2.12) that both the transverse and longitudinal phase mismatch influences the upconverted
field magnitude. From equation (2.12), we can derive the following criteria to determine
the value of 𝛥𝑘𝑇.
(a) The term |𝛥𝑘𝑇|. 𝑤022 should be close to zero for A3 to be non-vanishing.
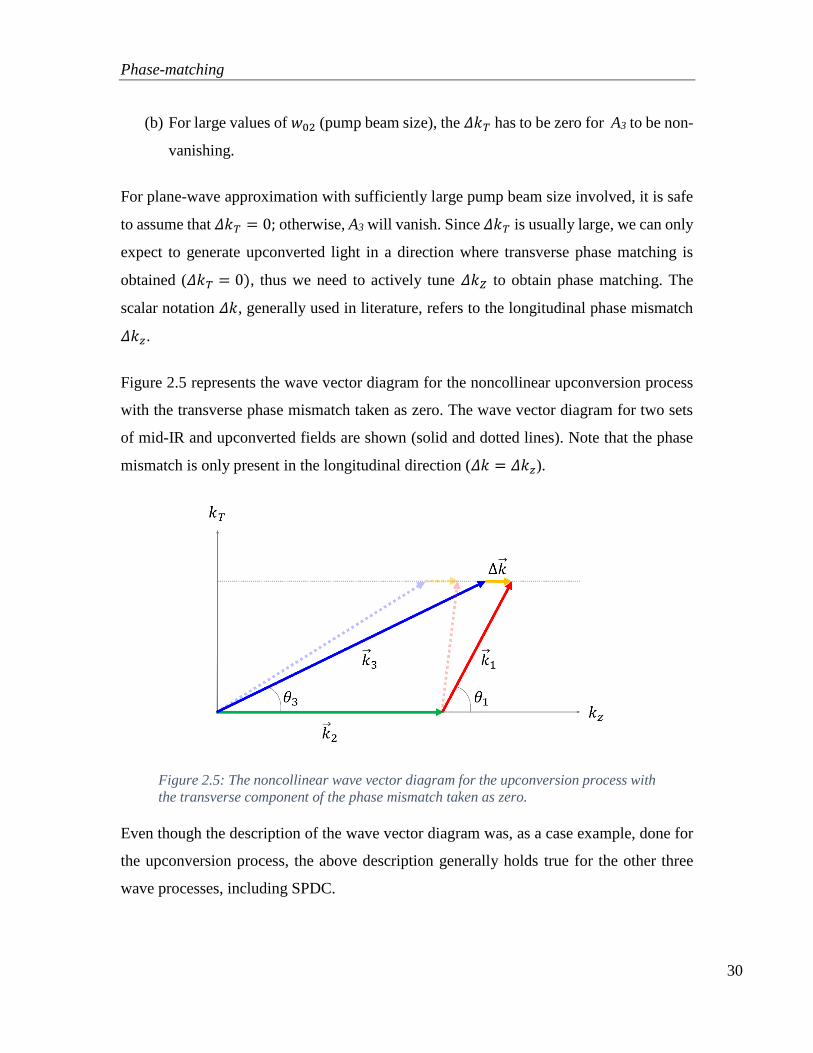
Phase-matching
30
(b) For large values of 𝑤02 (pump beam size), the 𝛥𝑘𝑇 has to be zero for A3 to be non-
vanishing.
For plane-wave approximation with sufficiently large pump beam size involved, it is safe
to assume that 𝛥𝑘𝑇 = 0; otherwise, A3 will vanish. Since 𝛥𝑘𝑇 is usually large, we can only
expect to generate upconverted light in a direction where transverse phase matching is
obtained (𝛥𝑘𝑇 = 0), thus we need to actively tune 𝛥𝑘𝑍 to obtain phase matching. The
scalar notation 𝛥𝑘, generally used in literature, refers to the longitudinal phase mismatch
𝛥𝑘𝑧.
Figure 2.5 represents the wave vector diagram for the noncollinear upconversion process
with the transverse phase mismatch taken as zero. The wave vector diagram for two sets
of mid-IR and upconverted fields are shown (solid and dotted lines). Note that the phase
mismatch is only present in the longitudinal direction (𝛥𝑘 = 𝛥𝑘𝑧).
Figure 2.5: The noncollinear wave vector diagram for the upconversion process with
the transverse component of the phase mismatch taken as zero.
Even though the description of the wave vector diagram was, as a case example, done for
the upconversion process, the above description generally holds true for the other three
wave processes, including SPDC.
Phase-matching
31
As the name suggests, phase matching requires that the propagating fields are in phase
with the generating fields inside the crystal for efficient energy transfer between them.
This ensures that the propagating and generating fields build up constructively and results
in the coherent generation of light. From Figure 2.3, the first minima of the sinc2 function
occur at 𝛥𝑘𝑙 = 2𝜋. The coherence length (𝑙𝑐𝑜ℎ) is defined as the crystal length over which
the net non-phase matched nonlinear frequency generation is zero. It is expressed as [130]
2
cohk
l
(2.13)
For non-phase matched three-wave interaction, the fields interfere constructively up until
half the coherence length, at which point the fields acquire a 𝜋 phase shift. As a result, for
the next half coherence length, the fields interfere destructively and hence, effectively
cancel the generation in the first part. Practically, the constructive build-up for half the
coherence length is extremely small. Phase matching techniques ensure that the generation
of the field occurs constructively.
Phase matching can be broadly classified into two categories
Birefringent phase matching: In this technique, the birefringence property of the
nonlinear medium is exploited to achieve phase matching.
Quasi-phase matching: In this approach, the nonlinear medium is structurally
engineered to compensate for the accrual of 𝜋 phase shift after traveling half the
coherence length through the medium.
These techniques will be briefly discussed in the next section.
2.4.1 Birefringent phase matching (BPM)
An anisotropic crystal can be generally represented by three different refractive indices
along the three orthogonal axes (x, y, and z), such that 𝑛𝑥 ≠ 𝑛𝑦 ≠ 𝑛𝑧. In certain crystals,
two of the indices are equal, resulting in the crystal having one optic axis. Such crystals
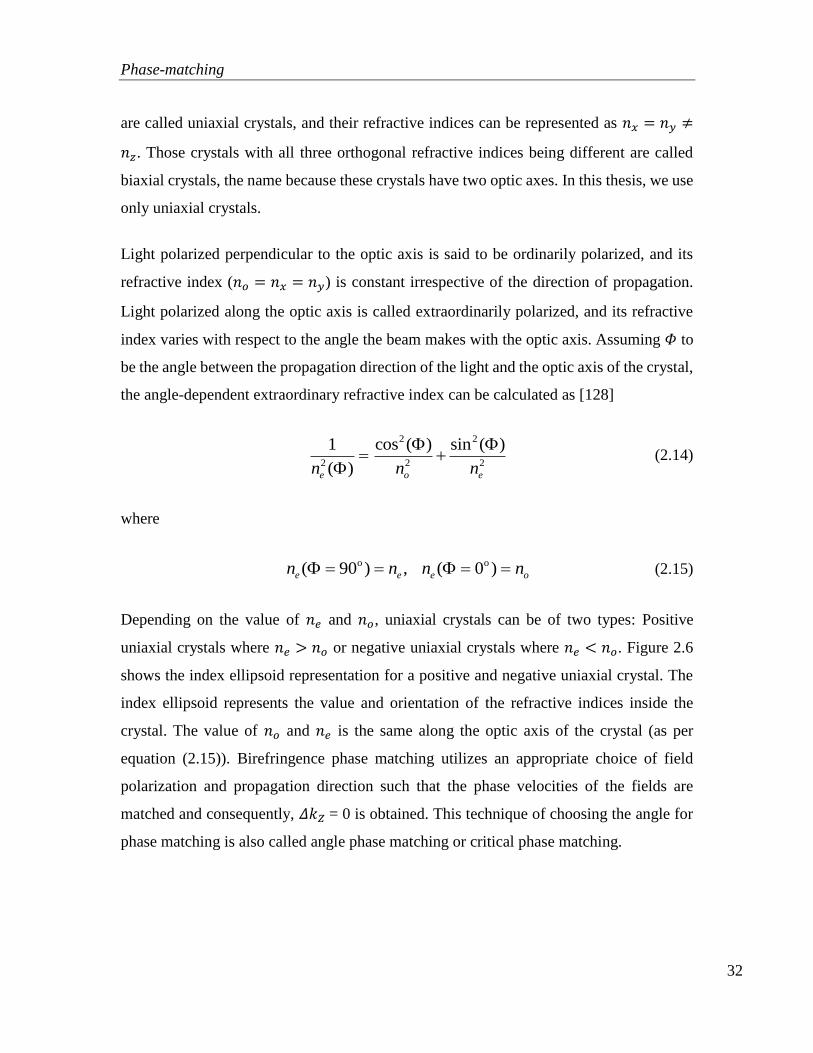
Phase-matching
32
are called uniaxial crystals, and their refractive indices can be represented as 𝑛𝑥 = 𝑛𝑦 ≠
𝑛𝑧. Those crystals with all three orthogonal refractive indices being different are called
biaxial crystals, the name because these crystals have two optic axes. In this thesis, we use
only uniaxial crystals.
Light polarized perpendicular to the optic axis is said to be ordinarily polarized, and its
refractive index (𝑛𝑜 = 𝑛𝑥 = 𝑛𝑦) is constant irrespective of the direction of propagation.
Light polarized along the optic axis is called extraordinarily polarized, and its refractive
index varies with respect to the angle the beam makes with the optic axis. Assuming 𝛷 to
be the angle between the propagation direction of the light and the optic axis of the crystal,
the angle-dependent extraordinary refractive index can be calculated as [128]
2 2
2 2 2
)1 )
)
cos ( sin (
(e o en n n
(2.14)
where
o o( 90 ) ( 0 ), oe e en n nn (2.15)
Depending on the value of 𝑛𝑒 and 𝑛𝑜, uniaxial crystals can be of two types: Positive
uniaxial crystals where 𝑛𝑒 > 𝑛𝑜 or negative uniaxial crystals where 𝑛𝑒 < 𝑛𝑜. Figure 2.6
shows the index ellipsoid representation for a positive and negative uniaxial crystal. The
index ellipsoid represents the value and orientation of the refractive indices inside the
crystal. The value of 𝑛𝑜 and 𝑛𝑒 is the same along the optic axis of the crystal (as per
equation (2.15)). Birefringence phase matching utilizes an appropriate choice of field
polarization and propagation direction such that the phase velocities of the fields are
matched and consequently, 𝛥𝑘𝑍 = 0 is obtained. This technique of choosing the angle for
phase matching is also called angle phase matching or critical phase matching.

Phase-matching
33
Figure 2.6: The index ellipsoid for a (a) negative and (b) positive uniaxial crystal.
2.4.2 Quasi-phase matching (QPM)
A major drawback of the BPM is the inability to choose the polarization and direction of
the interacting waves that access the highest effective nonlinearity of the medium. This
impacts the conversion efficiency of the process negatively. Moreover, there can be
situations where the material possesses no or insufficient birefringence to enable BPM. An
interesting alternative to BPM is QPM. The coherence length is typically in the order of
wavelengths, and a crystal is therefore typically several hundred to thousands of coherence
lengths long. As a result, macroscopic light generation is only possible if the fields are
allowed to continue constructively interfere even after half the coherence length, i.e., if the
accrual of 𝜋 phase shift is somehow accounted for. This is achieved by adding an abrupt
𝜋 phase shift through sign reversal of the nonlinear coefficient. The name quasi-phase
matching is because, in reality, we do not achieve phase matching in QPM (as in BPM).
Figure 2.7 depicts the concept of QPM. Periodic poling alternates the sign of the nonlinear
coefficient with a spatial periodicity, represented by 𝛬, which is equal to the coherence
length of the medium.

Phase-matching
34
Figure 2.7: A schematic representation of a PPLN crystal. The direction of each
domain is inverted as marked. The figure is adapted from ref. [131].
Periodically poled structures are generally fabricated by exposing the nonlinear crystal to
a spatially periodic electric field higher than the coercive field (~21 kV/m for LiNbO3),
such that the permanent polarization of the crystal is reversed. This results in the reversal
of the principal axis (�̂� axis) direction and consequently the sign of the nonlinear
coefficient. The effect of the periodic poling is in the form of an additional wave vector in
the k-space, called the grating wave vector (corresponding to the periodicity of the grating
structure). Its magnitude can be expressed as
2m
QPMk m
(2.16)
where m represents the order of the grating periodicity. The simplified expression of the
effective value of the nonlinear coefficient is [127]
2
sin2
eff il
md d
m
(2.17)
The trigonometric sine term in the above equation limits the possibility to only odd orders
for the grating periodicity, i.e., m = 1, 3, 5, etc.
Figure 2.8 shows the spatial evolution of the field amplitudes for different phase matching
conditions. The non-phase matched situation is shown to the left. The field generation is
oscillatory due to the existence of a phase mismatch. The graph to the right shows the case
where BPM (dashed curve) and QPM (solid curves) are implemented. The black curve

Phase-matching
35
represents the first order QPM. Subsequent higher-order QPM curves are also shown
(third-order in light brown and fifth-order in light gray color). Higher-order poling
structures are advantageous from a fabrication point of view due to the larger structure
sizes but are significantly impacted by the reduced 𝑑𝑒𝑓𝑓 (see equation (2.17)).
Figure 2.8: The spatial evolution of the field amplitude while propagating through
the medium under various phase matching scenarios. The graph to the left shows the
oscillatory nature of field evolution for the non-phase matched case. The dotted curve
in the graph to the right represents the field evolution for birefringent phase matching,
while the solid curves represent that for first (black), third (light brown), and fifth
(light gray) order QPM. The figure is reproduced from ref. [130].
It is noted that the curve for the BPM is produced utilizing the same 𝑑𝑒𝑓𝑓 value as that for
the first order QPM structure, for representational purpose. In reality, the 𝑑𝑖𝑙 corresponding
to a BPM process is not necessarily the highest tensor value in the d-matrix. For example,
in LiNbO3, the value of the nonlinear coefficient is d31 ~ 4.4 pm/V for the case of SHG
where the fundamental and the second harmonic are orthogonally polarized. But QPM
provides the advantage that the highest tensor element can be utilized. In a QPM
configuration, with the possibility to use the highest tensor element (d33 ~ 26 pm/V), the
value of the effective nonlinear coefficient for a first-order QPM structure is
33
2 V16 pm/effd d
(2.18)
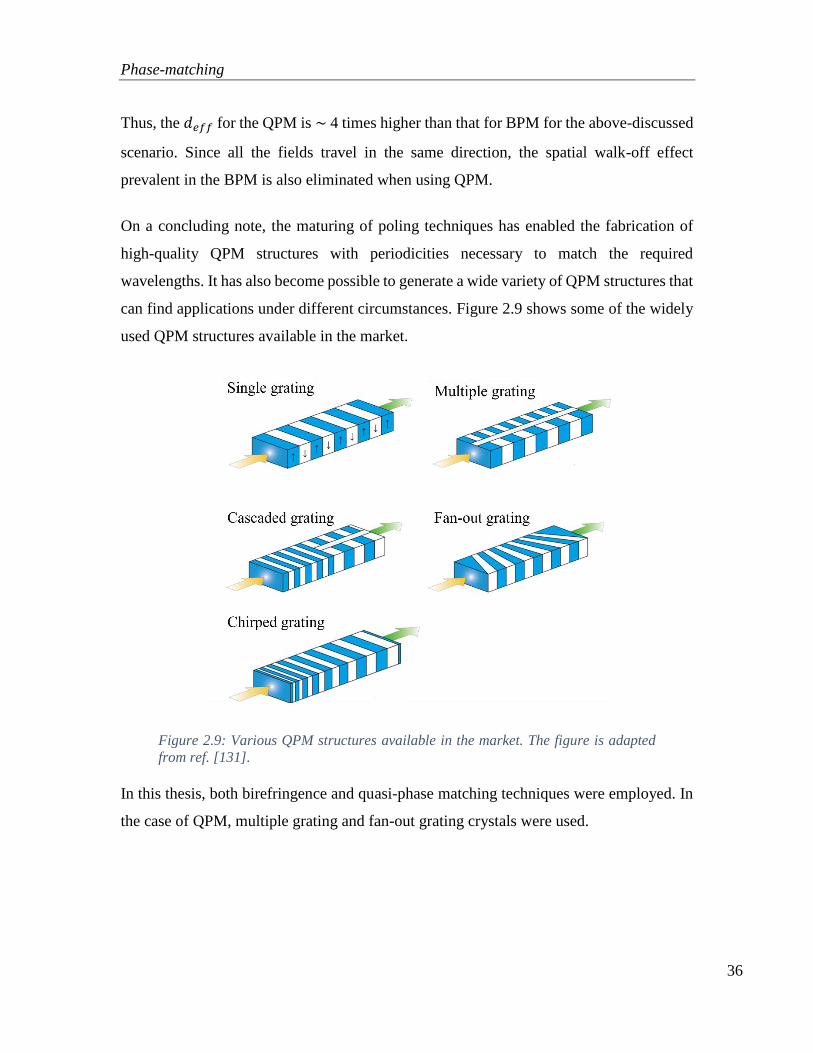
Phase-matching
36
Thus, the 𝑑𝑒𝑓𝑓 for the QPM is ~ 4 times higher than that for BPM for the above-discussed
scenario. Since all the fields travel in the same direction, the spatial walk-off effect
prevalent in the BPM is also eliminated when using QPM.
On a concluding note, the maturing of poling techniques has enabled the fabrication of
high-quality QPM structures with periodicities necessary to match the required
wavelengths. It has also become possible to generate a wide variety of QPM structures that
can find applications under different circumstances. Figure 2.9 shows some of the widely
used QPM structures available in the market.
Figure 2.9: Various QPM structures available in the market. The figure is adapted
from ref. [131].
In this thesis, both birefringence and quasi-phase matching techniques were employed. In
the case of QPM, multiple grating and fan-out grating crystals were used.

37

38
3 Pulsed mid-infrared SPDC light source
– a theory for the saturated regime
‘‘All truths are easy to understand once they are discovered; the point
is to discover them.’’
G. Galilei
In this chapter, an experimental demonstration and quantitative theoretical modeling of a
pulsed mid-IR SPDC light source in the saturated regime are discussed for the first time.
The output power and evolution of the SPDC spectrum are modeled in great detail and
found to be in good quantitative agreement with the experimental results. The proposed
theory will be relevant for the optimization and design of future SPDC light sources. This
chapter is based on ref. [132] (under review).
Contents 3 Pulsed mid-infrared SPDC light source – a theory for the saturated regime............ 38
3.1 Introduction ........................................................................................................ 39
3.2 Experimental arrangement ................................................................................. 42
3.3 Theory ................................................................................................................ 45
3.3.1 SPDC output energy in the saturated regime .............................................. 45
3.3.2 Spectral properties of the SPDC signal ...................................................... 49
3.3.3 Angular coupling efficiency (fACE) ............................................................. 52
3.3.4 Effective crystal length (leff)........................................................................ 57
3.4 Results and discussion ....................................................................................... 60
3.4.1 Fitting parameters ....................................................................................... 60
3.4.2 Spectral properties in the saturated regime ................................................. 60
3.5 Conclusion ......................................................................................................... 67

Introduction
39
3.1 Introduction
pontaneous parametric down-conversion (SPDC), or parametric fluorescence, is a
nonlinear three-wave mixing process involving a high energy pump photon
interacting with a quadratic (χ(2)) nonlinear media, to spontaneously generate a pair of
lower energy signal and idler photons, dictated by conservation of energy and
momentum [127]. Traditionally, SPDC has been treated quantum mechanically as
parametric amplification of vacuum fluctuations [110]. With the advent of highly
nonlinear crystals and pump lasers with high peak intensity, several authors have explored
the possibility of using SPDC to build simple, versatile, and efficient light sources
spanning from UV to the IR wavelength range [114,116]. The ability to design and tune
the center wavelength of SPDC light sources opens an attractive route to otherwise
technologically challenging wavelength regions. One such wavelength range is the 2 - 4
µm spectral region in the mid-IR addressed here, where quantum cascade lasers are not
readily available.
As mentioned previously, the mid-IR is excellent for identifying complex chemicals
exploiting the presence of unique, nature-given vibrational absorption features known as
vibration spectroscopy. A comprehensive review of the most commonly used mid-IR
sources is provided in ref. [16]. Closely related to the SPDC light sources are the OPOs
and the supercontinuum (SC) light sources. OPOs are also based on the SPDC process;
however, the inclusion of an OPO cavity enables high spatial and spectral brightness output
from these light sources. The drawbacks are the complexity of OPOs, such as strict
alignment of the cavity and complicated tuning schemes [106,107].
The SC light source is another attractive choice in the mid-IR; however, expensive
compared to the SPDC light source. It is based on the interaction of a short, high peak
power laser pulse in a cubic (χ(3)) nonlinear medium, generating a several µm broad
spectrum [133–136]. Interestingly, an SC light source can be considered a χ(3) version of
the SPDC light source, both being single-pass devices and amplifying quantum noise to
S

Introduction
40
macroscopic levels through nonlinear processes. The χ(3) nature of the SC light source,
however, adds further complexity in the types of interaction processes taking place but
also leverages the use of centrosymmetric media, such as single-mode fibers, promoting
long interaction lengths and enforcing single spatial mode power output. While the broad
spectrum of the SC light source is inherently attractive, it often cannot be exploited since
most optical components are only specified for use in a relatively narrow spectral range,
limited by the dispersion of the optical material used. Consequently, a significant portion
of the SC spectrum may easily end up either being unusable or wasted. Moreover, the
broad spectrum lowers the spectral brightness for a given average pump power [135,136].
In contrast, the SPDC power is concentrated over a relatively small spectral range,
typically two orders of magnitude smaller than for the SC light source; however, tunable
to match a desired center wavelength. This feature promotes increased spectral brightness
of the SPDC light source over the SC light source without necessarily sacrificing the
applicability for a range of spectroscopic applications. Here, we report the development of
a simple, compact, low-cost, tunable mid-IR light source based on SPDC in an MgO:PPLN
crystal, pumped by a low repetition rate, passively Q-switched laser.
To match the spectral brightness of SC light sources, the SPDC light source has to be
operated in the saturated regime where substantial output power can be expected. This
chapter models, for the first time, the SPDC power and SPDC spectral distribution as a
function of pump power for all pump power levels, including the deeply saturated pump
regime. From these two parameters, other SPDC characteristics can be predicted
quantitatively, such as spectral SPDC power saturation or the number of SPDC modes at
high output conditions. The theory is found to be in good quantitative agreement with the
experimental measurements.
The first quantum mechanical model of SPDC was presented as early as 1961 [110] and
expanded by others [108,111,112,137]; however, all models were limited to the
unsaturated regime where the parametric gain is small. Closest prior art has described
SPDC processes with a parametric gain (g) times length (l) product gl ≈15, corresponding
Introduction
41
to 2.5% conversion efficiency from pump to the signal and idler [125,126]. Here, an
angular weighting factor was added to the original plane wave model [108,137] to limit
the span of SPDC modes involved in calculating the signal spectra. The weighting factor
in ref. [125] was limited by the far-field diffraction angle of the pump beam, while that in
ref. [126] was derived from a simple geometrical ray approach. In this work, a modified
weighting factor, hereafter called angular coupling efficiency (ACE) function, is
introduced. In contrast to refs. [125,126], the proposed ACE function is symmetric in
signal and idler calculations, which is a basic requirement due to their interlinked
nature [137]. Secondly, a novel concept of an effective crystal length is introduced,
representing the pump depletion taking place in the saturated regime. We apply these two
extensions to the plane wave theory [108] in order to model SPDC light generation in the
saturated regime. In the ultra-high gain regime addressed here, we have a theoretical,
unsaturated gl ~ 30. The unsaturated, single-pass signal power gain is equal to exp(2gl),
assuming perfect phase-matching [16], corresponding to a phenomenal 260 dB,
theoretically. However, such a gain factor cannot be realized in any physical setting, since
nature given quantum noise photons at the input of the amplifier will saturate the amplifier
to a single-pass gain of ~140 dB (i.e., gl ~ 16). The saturated gain is still sufficiently high
for one input noise signal photon to generate output power levels in the order of hundred
nW in our implementation. The summation of all possible modes leads to almost 55%
conversion efficiency and 70% slope efficiency from the pump to the signal and idler
wavelengths in our system. Our novel model exploits intensively that the ultra-high gain
almost instantaneously depletes the pump as soon as the pump intensity exceeds a
threshold value – the depletion intensity. We demonstrate that the presence of strong
saturation provides a simple explanation for the observed slope efficiency of the SPDC
light source.
The contents of the chapter are organized as follows. A description of the experimental
setup is presented in section 3.2. Section 3.3 provides a detailed account of our SPDC
model, while section 3.4 includes experimental observations and results supporting the
theory. Finally, an overview of major findings is summarized in section 3.5.

Experimental arrangement
42
3.2 Experimental arrangement
A sketch of the experimental arrangement is shown in Figure 3.1. A laser diode at 0.94 µm
pumps the Yb:YAG laser crystal, placed in a cavity formed by the high-reflection (HR)
coated plane surface of the laser crystal and a plane mirror (output coupler, OC), generating
laser light at 1.03 µm. A Cr4+:YAG saturable absorber is placed inside the cavity at
Brewster's angle to enforce linearly polarized Q-switched pulses. The passively Q-
switched laser delivers pump pulses with a duration of 3 ns. The maximum pulse energy
of the laser is measured to be 180 µJ. The repetition rate (frep) of the Q-switched laser pulse
can be electronically controlled by that of the pump laser diode. In this experiment, the
laser is operated at a 25 Hz repetition rate in synchronism with an InGaAs camera
(Hamamatsu – C12741-03). We refer to ref. [22] for a detailed description of the passively
Q-switched pump laser.
Figure 3.1: Schematic of the experimental arrangement, LDM: laser diode module,
LC: laser crystal, SA: saturable absorber, OC: output coupler, fx: a lens with focal
length x mm, HWP: half-wave plate, P: polarizer, PPLN: multi-channel PPLN
crystal, M: mirror, LPF: long-pass 0.75 µm filter. The signal spectrum at the camera
plane is highlighted in the dotted black circle.

Experimental arrangement
43
An f200 lens collimates the light from the laser, while a combination of a half-wave plate
and polarizer enables pump power control while maintaining the linear polarization. The
SPDC stage includes a 40 mm long multi-channel MgO:PPLN crystal for SPDC
generation. The pump beam spot size at the focus of the f150 focusing lens is coarsely
measured to be ~ 90 µm (radius) using a home-built knife-edge setup. The high-energy
pump photon interacts with the nonlinear medium generating lower energy signal and idler
photons, satisfying both energy and momentum conservation. Momentum conservation is
achieved using quasi-phase-matching. Wavelength tuning is accomplished by changing
crystal temperature or by changing the PPLN channel. Out of the five channels available
in the PPLN crystal, channels with poling periodicities of Λ = 29.52 µm and 29.98 µm are
used in the experiments. These periods correspond to phase-matched signal center
wavelengths of roughly 1.504 µm and 1.538 µm (estimated from the phase-matching
condition), using a PPLN temperature of 140°C and 100°C, respectively. The PPLN crystal
is maintained at high temperatures to avoid photorefractive damage in the PPLN
crystal [95]. The whole range of 1.4 to 4 µm can be discretely covered (SPDC signal +
idler) using the five available channels, but the three remaining channels are not used in
this experiment because of the poor sensitivity of the InGaAs camera to detect the longer
signal wavelength.
The generated SPDC center wavelengths are obtained by solving the collinear phase
matching condition for the SPDC process, which can be expressed as:
0p s i QPMk k kk k (3.1)
Figure 3.2 shows the collinear phase matching curves for the SPDC process for the
channels used in this work. (a) indicates the signal center wavelengths, and (b) indicates
the corresponding idler center wavelengths. The Sellmeier equation in ref. [138] is used to
obtain the curves. All three fields are extraordinarily polarized.

Experimental arrangement
44
Figure 3.2: The phase matching curve for the channels used in this work. The curves
are obtained by solving the phase matching condition.
A small portion of the pump beam is tapped out before the f150 lens to monitor the
temporal and spatial stability of the pump laser during measurements (not shown in Figure
3.1). Mirror M1 separates the remaining depleted pump from the signal and idler beams.
Two fast silicon-based detectors are used to simultaneously record the temporal profile of
the pump (from the f150 tap out) and the depleted pump (reflected by M1), to study the
temporal dynamics of the pump pulse before and after the PPLN crystal. The pump beam
diameter at the fast detector for the depleted pump is approximately 3 mm, while the
diameter of the active area of the detector is 250 µm. The detector position is adjusted
carefully so as to detect only the center portion of the depleted pump pulse. The SPDC
light is collimated using an f200 lens. Mirror M2 reflects the signal beam towards the
grating spectrometer stage while transmitting the idler. A long-pass 0.75 µm filter prevents
residual red and green light from the PPLN crystal from reaching the grating spectrometer.
The grating spectrometer stage, in synchronism with the pump laser, allows signal spectra
to be recorded on a pulse-to-pulse basis [139]. Due to the inherent limitation of the data
acquisition rate of the InGaAs camera, the laser is operated at a repetition rate of 25 Hz.
The entire signal beam is magnified by a factor of two (to a diameter of roughly 6 mm)
before the grating in order to increase the spectral resolution of the spectrometer. The
diffraction grating (Thorlabs GR25-0616 – 600 lines/mm) disperses the collimated signal
Theory
45
beam, spectrally, onto the InGaAs camera in a 2f imaging configuration. Neutral density
filters attenuate the signal intensity to avoid saturation of the camera. We observed that the
camera sensitivity drops significantly beyond 1.6 µm, limiting the spectrometer to cover
only two of the channels available in the PPLN crystal. The monochromatic point spread
function of the 2f imaging system at the camera is 33 µm (1/e2 level). The pixel size of the
camera is 20 µm × 20 µm. The resulting spectral resolution of the grating spectrometer
stage is 0.24 nm per pixel [139]. In the experiments, we record and average 125 signal
pulses (5 seconds x 25 Hz) to obtain the final signal spectrum. A thermal power meter can
be inserted between mirror M1 and f200 to measure the average SPDC power as a function
of average pump power.
3.3 Theory
3.3.1 SPDC output energy in the saturated regime
An important characteristic of the SPDC light source is the efficiency of light generation,
i.e., the SPDC output energy as a function of pump energy. The efficiency relates to the
amount of SPDC energy generated as a function of pump energy. Our quantitative model
for the SPDC slope efficiency is based on two experimental observations: firstly, that
irrespective of the pump pulse energy applied, the depletion intensity, Ip,dep, always
remains constant, and secondly, that the pump depletion is almost complete for intensities
higher than Ip,dep. These observations are attributed to the extremely high gain available.
In order to theoretically calculate the generated SPDC energy as a function of pump
energy, we first describe the spatio-temporal profile of the pump pulse. Figure 3.3(a)
illustrates the spatio-temporal pump pulse profile, which can be expressed as
2 2
4ln(2) 2
( , )p p
p peak
t r
wI Ir t e e
(3.2)
where τp and wp refers to the FWHM pulse duration and 1/e2 intensity level, respectively,
of the pump pulse. Ip(r,t) represents the spatio-temporal profile of the pump pulse, where
Theory
46
r and t represent the spatial and temporal domain. Ipeak represents the peak intensity of the
pump pulse at r = t = 0. The pump energy can then be calculated following the expression
2 2
0 0
24ln(2) 2
22p p
pump peak
t
wtE eI e r dr d
(3.3)
The integral in the above equation can be solved analytically to give the expression for the
peak pump pulse intensity as
3/2 2
4 ln(2)peak pump
p p
I Ew
(3.4)
The generated SPDC energy is taken to be equal to the energy not contained in the depleted
pump pulse (the green portion in Figure 3.3(a)). To estimate this, we need to know the
temporal instance of the pump at which the depletion intensity is reached as a function of
r (alternatively also possible by knowing the spatial instance of the pump at which
depletion intensity is reached as a function of t). This can be found from equation (3.3) and
(3.4) as
2
max
,2l( ) 2
2 ln( )n
p pump
p dep p
rt r
E
E w
(3.5)
where tmax(r) represents the time instances where Ipump(r,t) = Ip,dep as a function of r. Using
this, the SPDC pulse energy as a function of pump pulse energy can be calculated as
max
2 2
2 3/2
00
4ln(2) 24 ln(2)( 2) 2
p ppump
SPDC pump
p
t
p
t r
wEE E e e r dr dt
w
(3.6)
Figure 3.3(a) illustrates the spatio-temporal pump pulse profile for the case of 100% pump
depletion for pump intensity Ip > Ip,dep. Figure 3.3(b) shows the experimental temporal trace

Theory
47
of the central (spatial) part of the pump pulse recorded simultaneously before and after the
PPLN crystal, using two fast silicon-based detectors as described in section 3.2. It is clearly
observed that the central part of the pump is indeed strongly depleted for Ip > Ip,dep. The
depletion intensity in the present setup corresponds to about 37 µJ in pump energy (Ep,dep),
which is roughly 4.8 times below the maximum pump pulse energy available in our
experiments.
Figure 3.3: Pump depletion and slope efficiency. (a) shows an illustration of the
spatio-temporal profile of the pump pulse. The green portion shows the 100%
depleted pump pulse for Ip > Ip,dep, contributing to SPDC generation. (b) shows the
temporal pulse profile of the original and depleted pump simultaneously recorded
using two fast silicon-based detectors. (c) shows the generated SPDC pulse energy as
a function of pump energy for the theoretical and experimental case. The experimental
curve is for the 29.52 µm channel. (d) shows a similar experimental curve for the
29.98 µm channel.

Theory
48
The integration in equation (3.6) has an analytical form but is not given here, as the solution
is a complicated expression. The theoretically and experimentally obtained signal energy
is plotted as a function of the pump energy in Figure 3.3(c) for the 29.52 µm channel. The
theoretical curve is produced using equation (3.6), which is for the 100% depletion case.
As can be seen, the theoretically predicted curve matches well with the experiment. An
almost identical experimental graph is obtained for the 29.98 µm channel, shown in Figure
3.3(d).
Figure 3.4: Effect of depletion depth on the slope. (a) shows the two different cases of
depletion, D1 – depletion of the pump up to Ip = 0, and D2 – depletion of the pump up
to Ip = Ip,dep. (b) shows the variation in the theoretically estimated slope for the two
cases.
Theory
49
The depletion need not always be 100%. Figure 3.4(a) shows the two extreme possible
cases of pump depletion. For case D1, the depletion of the pump is all the way to zero
intensity (100% depletion), whereas for case D2, the depletion of the pump is only up to
Ip,dep (the depleted pump pulse portion is shown in green color). Different slope efficiencies
for the theoretical curve can be obtained by varying the pump depletion depth between
these extremities. The theoretically calculated curves for the cases D1 and D2 represented
in Figure 3.4(a), is shown in Figure 3.4(b).
The black dots and dotted line in Figure 3.3(c) and Figure 3.4(b) represents the
experimental points and corresponding linear fit, respectively, with a slope efficiency of
72.87%.
3.3.2 Spectral properties of the SPDC signal
In the previous section, we determined the SPDC power as a function of pump power using
a simple assumption of a 100% depletion taking place in the saturated regime. In order to
obtain a theoretical prediction of the SPDC spectrum, i.e., the spectral brightness, a more
detailed description is needed. In the plane wave, small-signal regime, the SPDC process
has been described as early as the late 1960s [108]. The vacuum fluctuations in the medium
interact with the strong input pump field, producing a plurality of photons at a wide range
of frequencies in accordance with the energy conservation. However, the growth of the
number of newly generated photons is favored for those frequencies that satisfy the phase
matching condition. The total signal power can be obtained by integrating the contribution
from all possible modes and angles. The expression for the signal power for the unsaturated
regime is given as [128]
max
2
2
2
2
2
0
sin
2
)
h2
( ss p s
g l
P P d d
k
kg
(3.7)
Theory
50
2
,2
3
4 2
2 5
0 0
( ) 2( ) ,
2
p s s s eff e p peaks i ff
s
i p p s i
n d
n n c n
d Ig
n n c
where, Ps is the generated SPDC signal power for a specific pump power, Pp. θmax
represents the half-angle subtended by the detector aperture inside the crystal. ϕ and ψ
represents the propagation angle of the signal and idler field respectively with respect to
the pump field direction (assumed to be along the z-axis). ℏ is the reduced Planck's
constant, deff is the effective nonlinear coefficient of the crystal (assumed to be 15 pm/V
throughout this work), εo is the vacuum permittivity, c is the speed of light. kj, ωj and nj
represents the wavenumber, angular frequency, and refractive index, respectively, for a
pump, signal, and idler wavelength. The phase mismatch term is approximated as [128]
2k ba (3.8)
0 0
,2
s s i i
s p s i
i s i
k ka
dk dk
dk db
This is done by Taylor expanding the signal and idler wave vectors with respect to the
phase matched center wavelength [137]. The subscript s0 and i0 represent the center signal
and idler angular frequencies, respectively.
Initial validation of the simulation was done by comparing the results with those reported
in ref. [108]. Since they operate in the unsaturated regime, gl << 1, the g factor can be
neglected. Thus, the sinh function can be replaced with a simple sin function under this
approximation. The expression for the signal power under this approximation is
max
2
2
0
)
sin2
(
2
s ss p
l
P P d
k
dk
(3.9)

Theory
51
In order to carry out this verification, the parameters and the Sellmeier equations reported
in ref. [108] is used to calculate the angle integral in equation (3.9). Figure 3.5 confirms
the validity of the simulation for the unsaturated regime. Figure 3.5(a) shows the curves
reported in ref. [108] (reproduced) whereas, Figure 3.5(b) shows the simulated curves. It
is clear from the figure that the reported results are reproduced with good accuracy.
Figure 3.5: Initial confirmation of the validity of the simulation. (a) shows the results
reported in ref. [108] (reproduced here) when performing the angle integral in
equation (3.9). (b) shows a similar result obtained using the developed codes. Same
parameters as reported in ref. [108] is used for the simulation to obtain (b).
In this work, we modify this classical model to include the saturated regime by introducing
a modified ACE function and an effective crystal length. The modified expression for
signal power is given as:
Theory
52
max
22
2 2
22 2
2
2
20
2
(( )
sinh2
(( )
, )
)
( , )
ACE e
ss p
ff eff
s
ACE eff
a BG l
P
l
P d da
f l
fB
G
(3.10)
2 2 2' , ' bG g g B b (3.11)
Two fitting parameters, g' and b', which will be discussed in section 3.4.1, have been
multiplied to the classical g and b parameters, respectively, to match the experimental
results. The Sellmeier equation in ref. [138] is used in all the following calculations.
Compared to equation (3.7), equation (3.10) is expanded in two aspects. An ACE function,
fACE (ϕ,leff), is introduced to ensure finite results from angular integration for the signal
power, and the crystal length is replaced by an effective crystal length, leff(Epump) to
accommodate for saturation of the pump beam. These two parameters will be discussed in
detail in the following sections.
3.3.3 Angular coupling efficiency (fACE)
A detailed description of the ACE function is presented in this section. Using equation
(3.7) to calculate the generated SPDC signal power will lead to unlimited growth of signal
power as θmax is increased for a finite pump power, which is not physically meaningful.
This necessitates a modification in the classical model by incorporating an angular
weighting function to equation (3.7) to limit the gain of modes propagating at larger signal
angles. Previous angular weighting functions [125,126] suffer from an asymmetry in
signal and idler calculations, i.e., equation (3.10) will not provide the same result if the
idler is used as the starting point for SPDC calculations instead of the signal. Furthermore,
the latest weighting factor reported [126] cannot explain our experimental observations. A
modified ACE function is proposed in this work, which preserves symmetry and is
supported by our experimental measurements.
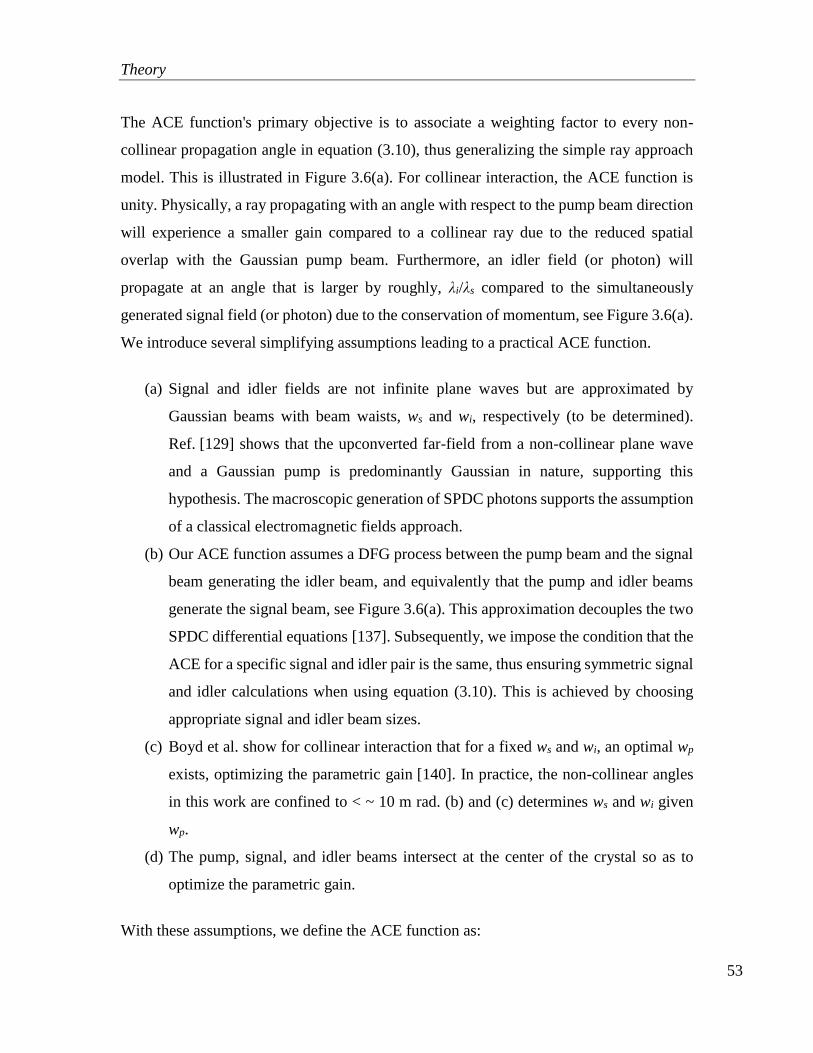
Theory
53
The ACE function's primary objective is to associate a weighting factor to every non-
collinear propagation angle in equation (3.10), thus generalizing the simple ray approach
model. This is illustrated in Figure 3.6(a). For collinear interaction, the ACE function is
unity. Physically, a ray propagating with an angle with respect to the pump beam direction
will experience a smaller gain compared to a collinear ray due to the reduced spatial
overlap with the Gaussian pump beam. Furthermore, an idler field (or photon) will
propagate at an angle that is larger by roughly, λi/λs compared to the simultaneously
generated signal field (or photon) due to the conservation of momentum, see Figure 3.6(a).
We introduce several simplifying assumptions leading to a practical ACE function.
(a) Signal and idler fields are not infinite plane waves but are approximated by
Gaussian beams with beam waists, ws and wi, respectively (to be determined).
Ref. [129] shows that the upconverted far-field from a non-collinear plane wave
and a Gaussian pump is predominantly Gaussian in nature, supporting this
hypothesis. The macroscopic generation of SPDC photons supports the assumption
of a classical electromagnetic fields approach.
(b) Our ACE function assumes a DFG process between the pump beam and the signal
beam generating the idler beam, and equivalently that the pump and idler beams
generate the signal beam, see Figure 3.6(a). This approximation decouples the two
SPDC differential equations [137]. Subsequently, we impose the condition that the
ACE for a specific signal and idler pair is the same, thus ensuring symmetric signal
and idler calculations when using equation (3.10). This is achieved by choosing
appropriate signal and idler beam sizes.
(c) Boyd et al. show for collinear interaction that for a fixed ws and wi, an optimal wp
exists, optimizing the parametric gain [140]. In practice, the non-collinear angles
in this work are confined to < ~ 10 m rad. (b) and (c) determines ws and wi given
wp.
(d) The pump, signal, and idler beams intersect at the center of the crystal so as to
optimize the parametric gain.
With these assumptions, we define the ACE function as:

Theory
54
/2
/2
/2
/2
( ) ( , , )
,
( ) (0, , )
( )
l
lACE l
s
s
l
p
p
E E dzdy
f
E E dzdy
y y z
l
y y z
(3.12)
where z represents the pump beam propagation direction, y represents the transverse spatial
position, and �̃�𝑗 denotes the electric field for the pump, signal, and idler fields. The ACE
function is calculated here for the 2D case because equation (3.10) inherently accounts for
the rotational symmetry in the angular spread to calculate the final results in 3D. Assuming
non-diffracting Gaussian beams, the ACE function for the signal is calculated from
equation (3.12) to be
1
)2
,( sACE
s
f l Q erfQ
(3.13)
where
2 22 p s
s
wQ
l
w
(3.14)
and erf is the error function. For the ACE function to be symmetric, Qs = Qi, where Qi is
similar to equation (3.14) with ws and ϕ replaced by wi and ψ respectively. This gives rise
to a relation between the signal and idler beam sizes:
22
2 2 2 2 2 2 2( ) ( )i p p pi
s s
s
pw w w w w w w
(3.15)
Using the relation derived in ref. [140] with the remarks under (c)
2 2 2
1 1 1
p s iw w w (3.16)

Theory
55
Inserting equation (3.15) in (3.16) results in the following relation between the signal and
idler spot sizes:
2 2
4 2 2 4 2
i ss p
i i s s s
w w
(3.17)
Equation (3.17) can be used to calculate the signal beam size and equation (3.15) or (3.16)
can be used to calculate the idler beam size satisfying the symmetry of the ACE function.
Figure 3.6: (a) Depicts our simplistic ACE function model. The introduction of the
ACE function allows the existing simple ray picture to be used. (b) shows the ACE
function in ref. [126], the proposed ACE function for a crystal length of 40 mm and
wp = 90 µm, and an ACE function based on the product of three fields. The dotted
vertical line represents the angular span relevant to the theoretical model in this work.
(c) shows the calculated signal power with and without the ACE function for a fixed
pump power and crystal length. The dotted curve shows the (unrealistic) quadratic
growth in the total signal power when omitting the ACE function. The solid curve
depicts the influence of the ACE function limiting the signal power to a finite value.

Theory
56
Figure 3.6(b) shows the plot of various ACE functions as a function of signal propagation
angle. The dashed curve represents the ACE function based on the geometrical
consideration in ref. [126]. The solid curve is the proposed ACE function for a crystal
length of 40 mm and beam sizes of wp = 90 µm , ws = 95 µm, and wi = 271 µm, satisfying
equations (3.15), (3.16), and (3.17). This ACE function is used for the remainder of this
chapter. As a check of the proposed ACE function, we also calculated the ACE function
based on the overlap of three electric fields as:
/2
/2
/2
/
3
2
( ) ( , , ) ( , , )
,
( ) (0, , ) (0, ,
( )
)
l
i
l
p s
f
ACE
p i
l
s
l
E E E dzdy
f
E E E dzdy
y y z y z
l
y y z y z
(3.18)
using the same beam parameters as for fACE(ϕ,l). This ACE function has a built-in
symmetry so that all fields can be permuted. This function is closely related to the Manley-
Rowe power relations [128], expressing that signal and idler photons are created
simultaneously in pairs. As can be seen from Figure 3.6(b), the dash-dot curve for 𝑓𝐴𝐶𝐸3𝑓
(ϕ,l),
matches well with fACE(ϕ,l) over the relevant span of angles, thus adding credibility to the
proposed simple model. The ACE function proposed in ref. [126] declines too fast with
the angle to model our experimental data. The ACE function that we use in our model is
based on reasonable approximations and provides a good agreement between the
experiment and theory.
Figure 3.6(c) shows the signal power calculated using equation (3.10) with and without
the ACE function. The dotted line (without ACE function) shows the infinite growth of
signal power with increasing θmax for a finite pump power. The solid black curve shows
the evolution of the signal power, including our ACE function, fACE(ϕ,l). With the ACE
function included, the growth in the signal power saturates for large integration angles as
expected. The normalization of Figure 3.6(c) is with respect to the asymptotic value of the
signal power.
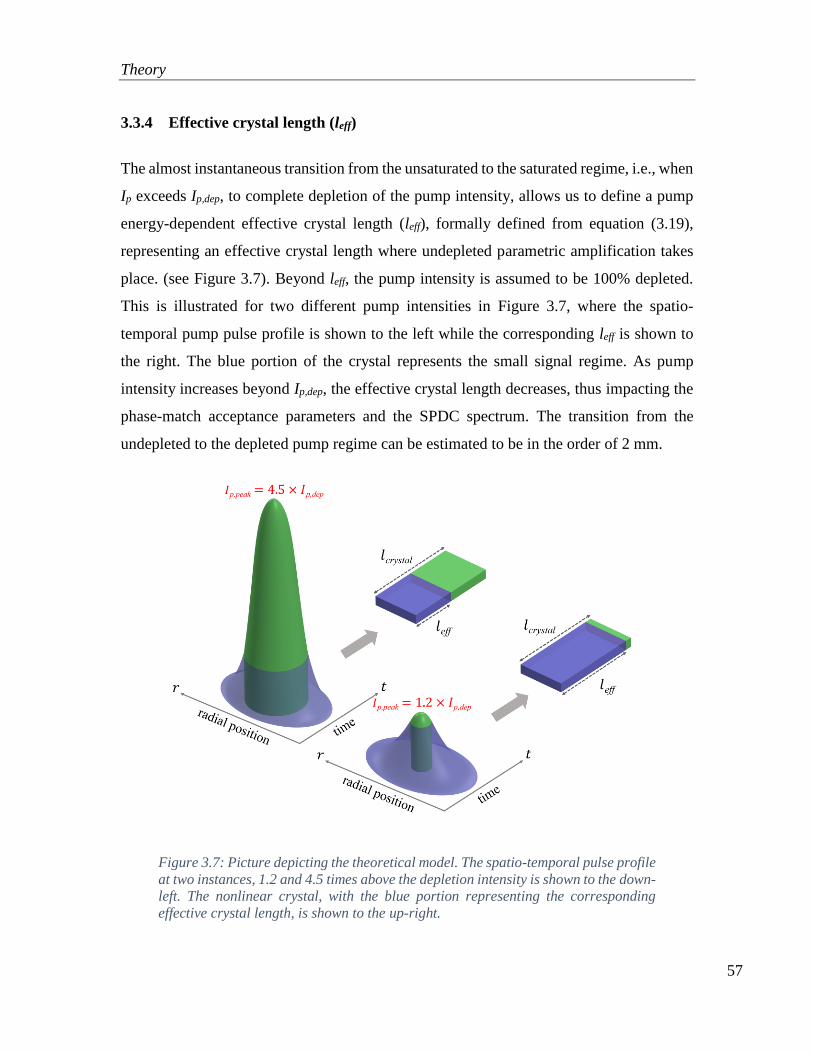
Theory
57
3.3.4 Effective crystal length (leff)
The almost instantaneous transition from the unsaturated to the saturated regime, i.e., when
Ip exceeds Ip,dep, to complete depletion of the pump intensity, allows us to define a pump
energy-dependent effective crystal length (leff), formally defined from equation (3.19),
representing an effective crystal length where undepleted parametric amplification takes
place. (see Figure 3.7). Beyond leff, the pump intensity is assumed to be 100% depleted.
This is illustrated for two different pump intensities in Figure 3.7, where the spatio-
temporal pump pulse profile is shown to the left while the corresponding leff is shown to
the right. The blue portion of the crystal represents the small signal regime. As pump
intensity increases beyond Ip,dep, the effective crystal length decreases, thus impacting the
phase-match acceptance parameters and the SPDC spectrum. The transition from the
undepleted to the depleted pump regime can be estimated to be in the order of 2 mm.
Figure 3.7: Picture depicting the theoretical model. The spatio-temporal pulse profile
at two instances, 1.2 and 4.5 times above the depletion intensity is shown to the down-
left. The nonlinear crystal, with the blue portion representing the corresponding
effective crystal length, is shown to the up-right.
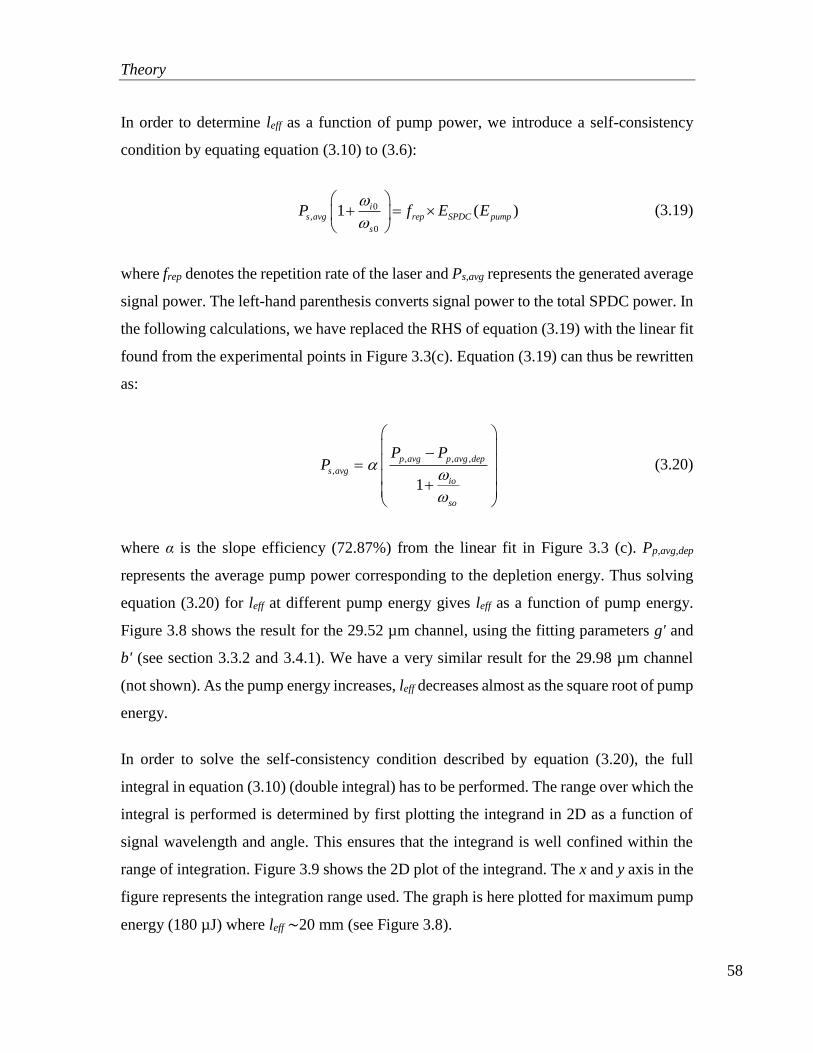
Theory
58
In order to determine leff as a function of pump power, we introduce a self-consistency
condition by equating equation (3.10) to (3.6):
0,
0
)1 (rei
s avg SPDC pum
s
p pP f E E
(3.19)
where frep denotes the repetition rate of the laser and Ps,avg represents the generated average
signal power. The left-hand parenthesis converts signal power to the total SPDC power. In
the following calculations, we have replaced the RHS of equation (3.19) with the linear fit
found from the experimental points in Figure 3.3(c). Equation (3.19) can thus be rewritten
as:
, ,
,
,
1
p avg p avg d p
s avgio
so
eP
P P
(3.20)
where α is the slope efficiency (72.87%) from the linear fit in Figure 3.3 (c). Pp,avg,dep
represents the average pump power corresponding to the depletion energy. Thus solving
equation (3.20) for leff at different pump energy gives leff as a function of pump energy.
Figure 3.8 shows the result for the 29.52 µm channel, using the fitting parameters g' and
b' (see section 3.3.2 and 3.4.1). We have a very similar result for the 29.98 µm channel
(not shown). As the pump energy increases, leff decreases almost as the square root of pump
energy.
In order to solve the self-consistency condition described by equation (3.20), the full
integral in equation (3.10) (double integral) has to be performed. The range over which the
integral is performed is determined by first plotting the integrand in 2D as a function of
signal wavelength and angle. This ensures that the integrand is well confined within the
range of integration. Figure 3.9 shows the 2D plot of the integrand. The x and y axis in the
figure represents the integration range used. The graph is here plotted for maximum pump
energy (180 µJ) where leff ~20 mm (see Figure 3.8).

Theory
59
Figure 3.8: The effective crystal length, leff as a function of pump energy. The curve
is obtained by solving the self-consistent equation (3.20). leff(Epump) is almost identical
for both the channels.
Figure 3.9: 2D plot of the integrand in equation (3.10) as a function of signal angle
and wavelength for the 29.98 µm channel. The range used for performing the
integration is represented by the axis limits here. Note that the integrand is completely
enclosed within the integration range.

Results and discussion
60
3.4 Results and discussion
3.4.1 Fitting parameters
The fitting parameters are calculated imposing the initial condition that at Ep,dep (with leff =
lcrystal), the experimental and theoretical bandwidth should be the same. Based on the
experimental observations, depletion energy (Ep,dep) of 37 µJ is used (see Figure 3.3(c)).
The ACE function from section 3.3.3 is used in the following. g' and b' are optimized for
best fit of the experimental results; g' = 1.35 and b' = 1.48 for the 29.52 µm channel and g'
= 1.32 and b' = 1.48 for the 29.98 µm channel. g' corrects primarily for an underestimation
of the parametric gain. We believe this discrepancy to originate from multiple reflections
of the fields inside the nonlinear crystal, leading to an increased experimental gain. Several
authors have used wedged end facets of the crystal to avoid multiple reflections inside the
crystal [119,126,141]. In our experiment, multiple reflections inside the crystal is
minimized by angling the plane-plane PPLN crystal, without sacrificing the
efficiency [118]. The correction factor, b', accounts for a theoretical overestimation of the
signal bandwidth. Following the previous argument, we again believe multiple reflections
to be the reason for this discrepancy. A clear correlation between multiple round trips
inside the PPLN crystal and the SPDC bandwidth was indeed observed in the
laboratory [142]. Note that the OPO spectrum is dramatically narrowed by multiple
reflections, supporting our arguments.
3.4.2 Spectral properties in the saturated regime
The main objective of this work is to adapt the existing model [108,137] to describe the
properties of the SPDC process in the saturated regime. A grating spectrometer stage is
used to record the signal spectra. Figure 3.10 shows the comparison of experimental and
theoretical signal spectra for different pump energy levels. The dotted graphs represent the
experimentally measured spectra. The theoretical spectrum (solid line) is obtained by
performing only the angular integral in equation (3.10) and plotting the result as a function
of wavelength. Figure 3.10 (a) and (b) shows the result for the two channels. We have a
spectral average power density as high as 0.8 mW/nm for the signal.

Results and discussion
61
Figure 3.10: Signal spectra for the two channels for different pump pulse energies.
The theoretical spectra (solid lines) are calculated based on the linear fit in Figure
3.3 (c). The dotted line represents experimentally measured spectra. The theoretically
calculated spectra agree well with the experimental spectra.
Transforming equation (3.10) for the idler case, we estimate the corresponding idler
spectral power density to be of the order of ~ 0.1 mW/nm (see Figure 3.11), which is
comparable to that of conventional SC light sources [136], thus promoting SPDC light
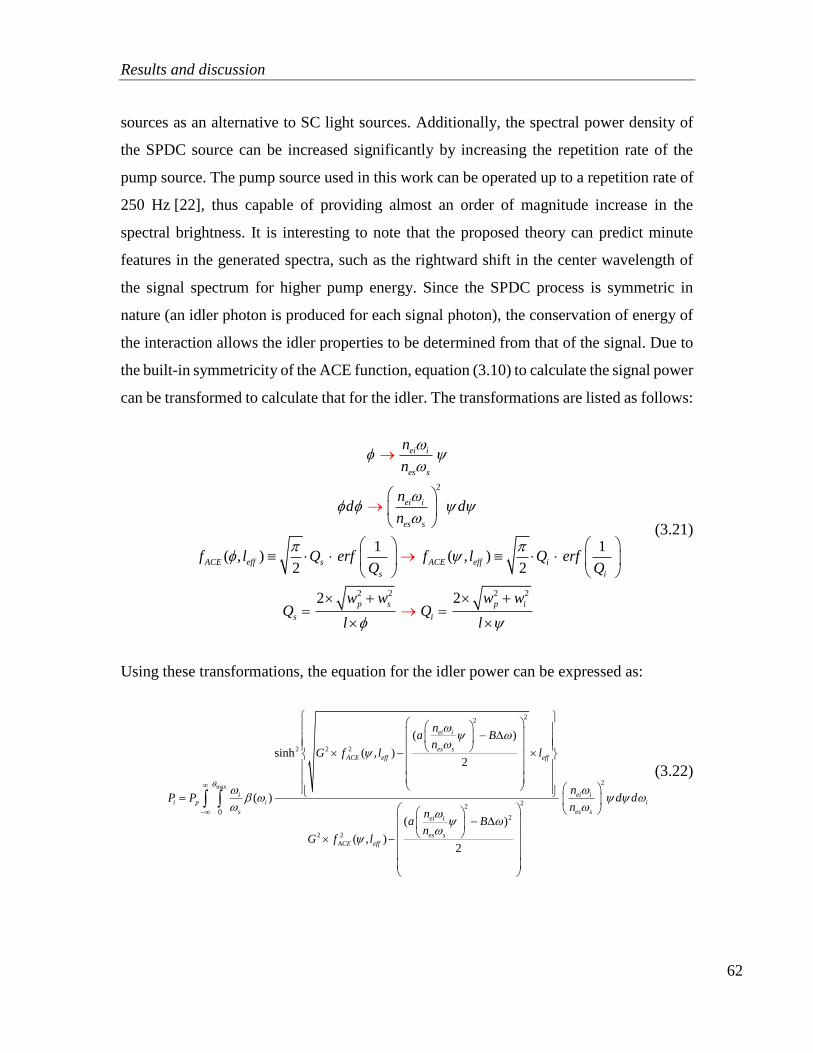
Results and discussion
62
sources as an alternative to SC light sources. Additionally, the spectral power density of
the SPDC source can be increased significantly by increasing the repetition rate of the
pump source. The pump source used in this work can be operated up to a repetition rate of
250 Hz [22], thus capable of providing almost an order of magnitude increase in the
spectral brightness. It is interesting to note that the proposed theory can predict minute
features in the generated spectra, such as the rightward shift in the center wavelength of
the signal spectrum for higher pump energy. Since the SPDC process is symmetric in
nature (an idler photon is produced for each signal photon), the conservation of energy of
the interaction allows the idler properties to be determined from that of the signal. Due to
the built-in symmetricity of the ACE function, equation (3.10) to calculate the signal power
can be transformed to calculate that for the idler. The transformations are listed as follows:
2
2 2 2 2
1 1( ) ( )
2 2, ,
2 2
ei i
es
ei i
es
eff s eff
s
E
p s
s
s
ACE AC i
i
p
s
i
i
n
n
nd d
n
l l
w wQ
f Q erf f Q
l
erfQ Q
w
l
wQ
(3.21)
Using these transformations, the equation for the idler power can be expressed as:
max
22
2
2
2
2
22
2
2
2
0
( , )
)
(
)
,
( )
sinh2
(
(
)2
ei
e
es
i eii p i i
s esei
i
s
ACE eff ff
i
si
s
ACE ef
e
f
s
na B
nG l
nP P d d
nn
G
f
f
a Bn
l
l
(3.22)

Results and discussion
63
Please note the ratio of the idler frequency to the signal frequency present inside the
integral to transform the signal power to the idler power. Equation (3.22) can be used to
simulate the evolution of the idler spectrum with pump power similar to that for the signal
shown in Figure 3.10. Figure 3.11 shows the simulated idler spectra using for the 29.98
µm channel. Equation (3.20) is modified to obtain the self-consistent condition, with the
idler parameters. However, we expectedly get a similar leff(Epump) curve as that for the
signal case.
Figure 3.11: The simulated idler spectrum for different pump energy levels.
To further validate the presented model, we compare the experimentally measured signal
bandwidth to the theory. Using the FWHM criteria to estimate the bandwidth, Figure 3.12
shows the experimental and theoretical bandwidth for the two channels we have tested.
The graphs show a good agreement between theory and experiments. The bandwidth
evolution can be explained as a reduced effective crystal length originating from pump
depletion inside the PPLN crystal, leading to an increased bandwidth due to
(a) a decrease in Δk leff, and
(b) a higher ACE promoting higher gain for non-collinear interaction angles.

Results and discussion
64
Figure 3.12: Comparison of the experimental and theoretical signal bandwidth for
the two channels. The theory is capable of, to a great extent, predicting the increase
in signal bandwidth as a function of pump energy.
Figure 3.13 shows the evolution of the signal pulse energy for individual signal
wavelengths as a function of pump energy level. Close to the depletion energy,
predominantly collinear interaction occurs, benefitting from the higher collinear gain.
However, as the pump energy increases, non-collinear modes at longer wavelengths will
also have sufficient gain to be efficiently generated, resulting in saturation of the collinear
modes. Figure 3.13 (a) and (b) shows the signal spectral brightness for different signal
wavelengths as a function of pump energy. The experimental and theoretical curves display
similar trends and agree reasonably well, further showcasing the strength of the proposed
model.

Results and discussion
65
Figure 3.13: Evolution of the signal energy as a function of pump energy for the two
channels using the signal wavelength as a parameter. Experimental points are shown
with the solid line calculated from the theoretical model.

Results and discussion
66
Existing SPDC models are limited to the small parametric gain regime. Due to the high
parametric gain obtained in this setup, macroscopic SPDC output is produced, leading the
SPDC system to operate in the deeply saturated regime. The high parametric gain in our
system is due to the high peak intensity of the pump pulse, which is roughly ~ 443
MW/cm2. In comparison, the highest peak intensity for the system in ref. [125] is only
~ 75 MW/cm2. Figure 3.14 shows the position of gl for our case in comparison to the prior
arts, which report working theoretical models, but for the unsaturated regime. We have an
unsaturated gl ~ 30, which is twice that of the prior arts. However, due to pump saturation,
the practical value of the highest gain length product in our system (saturated) is gleff ~ 16.
Figure 3.14: The position of gl product in this work compared to close prior arts, that
describe a working model, but for the unsaturated regime.

Conclusion
67
3.5 Conclusion
In this chapter, we report the development of a simple, compact, low-cost, tunable mid-IR
light source based on SPDC in an MgO:PPLN crystal, pumped by a low repetition rate,
passively Q-switched laser. A much needed quantitative description of an SPDC light
source in the saturated regime is presented here for the first time. The model describes the
basic SPDC light source parameters such as slope efficiency, spectral brightness, and
saturation effects. A modified symmetric ACE function is introduced, allowing the small-
signal SPDC equations to be applied for larger angles. Furthermore, an effective crystal
length is proposed to account for pump depletion. The combination of the ACE function
and the effective crystal length explains in great detail, the power evolution and spectral
properties of the SPDC source in the saturated regime.
The output power and evolution of the SPDC spectrum are modeled in great detail and
found to be in good quantitative agreement with the experimental results. Investigating the
spectral brightness at individual signal wavelengths shed light on the evolution of the
SPDC process. It is observed that collinear SPDC modes are dominating at low pump
energy. At higher pump energy levels, the brightness of collinear modes saturates due to
competing non-collinear modes, which in turn broadens the spectrum. We believe that the
proposed model can also serve as the basis for researchers interested in exploring other
properties of an SPDC process, such as the noise or the maximum spectral brightness
achievable in the saturated SPDC regime.

68

69
4 Pulse-to-pulse noise in a mid-IR SPDC
light source
‘‘What we observe is not nature itself, but nature exposed to our
method of questioning.’’
W. K. Heisenberg
The previous chapter describes the experimental demonstration and theoretical modeling
of a mid-IR SPDC light source in the saturated regime. In this chapter, a quantitative
characterization of noise in a mid-IR SPDC light source is presented. The pulse-to-pulse
spectral intensity noise of the SPDC source was quantified for the first time to the best of
our knowledge. The quantified noise values are useful when using the source for
spectroscopic applications. This chapter is based on ref. [139].
Contents 4 Pulse-to-pulse noise in a mid-IR SPDC light source ................................................ 69
4.1 Introduction ........................................................................................................ 70
4.2 Experimental setup ............................................................................................. 71
4.3 Results and discussion ....................................................................................... 73
4.4 Conclusion ......................................................................................................... 80
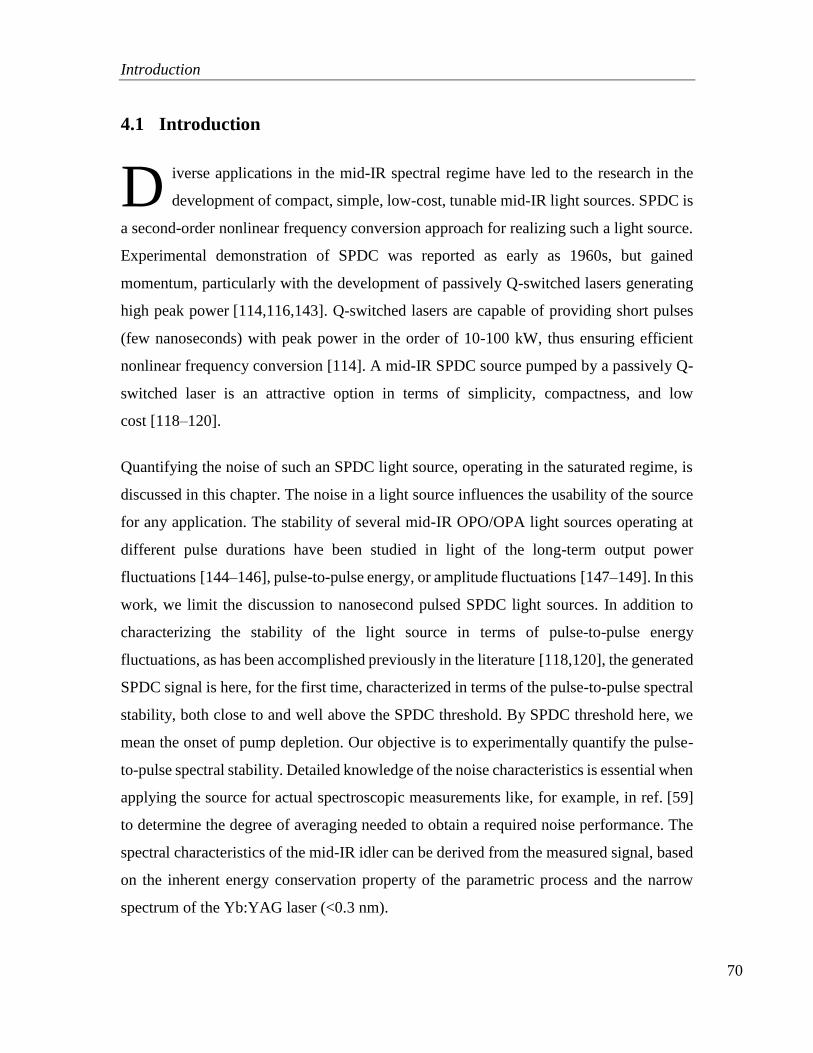
Introduction
70
4.1 Introduction
iverse applications in the mid-IR spectral regime have led to the research in the
development of compact, simple, low-cost, tunable mid-IR light sources. SPDC is
a second-order nonlinear frequency conversion approach for realizing such a light source.
Experimental demonstration of SPDC was reported as early as 1960s, but gained
momentum, particularly with the development of passively Q-switched lasers generating
high peak power [114,116,143]. Q-switched lasers are capable of providing short pulses
(few nanoseconds) with peak power in the order of 10-100 kW, thus ensuring efficient
nonlinear frequency conversion [114]. A mid-IR SPDC source pumped by a passively Q-
switched laser is an attractive option in terms of simplicity, compactness, and low
cost [118–120].
Quantifying the noise of such an SPDC light source, operating in the saturated regime, is
discussed in this chapter. The noise in a light source influences the usability of the source
for any application. The stability of several mid-IR OPO/OPA light sources operating at
different pulse durations have been studied in light of the long-term output power
fluctuations [144–146], pulse-to-pulse energy, or amplitude fluctuations [147–149]. In this
work, we limit the discussion to nanosecond pulsed SPDC light sources. In addition to
characterizing the stability of the light source in terms of pulse-to-pulse energy
fluctuations, as has been accomplished previously in the literature [118,120], the generated
SPDC signal is here, for the first time, characterized in terms of the pulse-to-pulse spectral
stability, both close to and well above the SPDC threshold. By SPDC threshold here, we
mean the onset of pump depletion. Our objective is to experimentally quantify the pulse-
to-pulse spectral stability. Detailed knowledge of the noise characteristics is essential when
applying the source for actual spectroscopic measurements like, for example, in ref. [59]
to determine the degree of averaging needed to obtain a required noise performance. The
spectral characteristics of the mid-IR idler can be derived from the measured signal, based
on the inherent energy conservation property of the parametric process and the narrow
spectrum of the Yb:YAG laser (<0.3 nm).
D

Experimental setup
71
4.2 Experimental setup
A schematic representation of the experimental setup implemented in this work is shown
in Figure 4.1. This is similar to the setup described in the previous chapter. A laser diode
at 0.94 µm pumps the Yb:YAG laser crystal placed inside a cavity, generating pulses at
1.03 µm, see ref. [22] for a detailed description of the pump laser. A Cr4+:YAG saturable
absorber was placed inside the cavity at Brewster’s angle to obtain linearly polarized Q-
switched pulses. The Q-switched laser system delivered pump pulses centered at λp = 1.03
µm with a pulse duration τp = 3 ns. The maximum pulse energy from the laser was Ep =
180 µJ when running the laser at a repetition rate of frep = 100 Hz. The linewidth of the
pump laser was found to be less than 0.3 nm using a spectrum analyzer (ANDO AQ6315E).
The combination of a half-wave plate and a polarizer was used to control the pump pulse
energy while also maintaining a linearly polarized pump for the SPDC stage. Mirror M1
is used to tap a small portion of the pump light towards the InGaAs camera, which is
sensitive at both the pump and SPDC signal wavelength range.
Figure 4.1: Schematic layout of the experimental setup. LC: Laser crystal (Yb:YAG),
SA: Saturable absorber (Cr4+:YAG), OC: Output coupling mirror, fx: lens of focal
length x in mm, LP1: Long pass 1 µm filter, HWP: Half wave plate, P: Polarizer, M:
Mirror, PPLN: periodically poled lithium niobate crystal, BD: Beam dump, LP2:
Long pass 0.75 µm filter, G: Grating, ND: Neutral density filters.
The SPDC stage consists of a 20 mm long MgO:PPLN crystal, heated to a temperature of
155°C to avoid photorefractive damage [95]. The pump pulses were focused to a beam
radius of ~ 90 µm at the center of the PPLN crystal, generating the signal and idler fields.

Experimental setup
72
Energy and momentum conservation dictates the wavelengths and tuning properties of the
generated fields. The poling periodicity of Λ = 29.98 µm was used in the experiment. The
generated signal spectrum was centered at 1.587 µm when measured using the spectrum
analyzer. This was further confirmed from the collinear phase matching curve obtained by
solving the collinear phase matching condition given as.
0s i QPMpk k k kk (4.1)
Figure 4.2 shows the collinear phase matching curve plotted for the signal and the idler
wavelength range. The corresponding signal and idler wavelengths for the two channels in
use is indicated by the dashed line.
Figure 4.2: The phase matching curve obtained by solving the collinear phase
matching condition described by equation (4.1).
A grating spectrometer was implemented after the SPDC stage to acquire the generated
pulse-to-pulse signal spectra. The InGaAs camera was synchronized with the pump pulses,
acquiring one image per pump pulse. In order to have sufficient spectral resolution, the
collimated signal beam was magnified to a diameter of 6 mm at the grating using a
combination of f50 and f100 lens. An f100 lens is then placed in a 2f imaging configuration
to collect the dispersed signal from the grating and focus it onto the InGaAs camera.

Results and discussion
73
4.3 Results and discussion
A thermal power meter is used to measure the average signal power as a function of
average pump power. Figure 4.3(a) shows the signal pulse energy generated as a function
of pump pulse energy incident on the crystal. The overall signal gain during the SPDC
process, using the non-depleted pump approximation, is proportional to exp(2gl), assuming
perfect phase matching [16]. Here, l denotes the length of the nonlinear crystal, and g is
proportional to the square root of pump intensity Ip. The apparent SPDC threshold close to
75 µJ is a result of this huge exponential gain. The generated signal pulse energy changes
dramatically even for a slight increase in the pump peak intensity, giving the impression
of a threshold, even though it is not a threshold as known from an OPO where the
parametric gain balances the round trip loss of the OPO cavity. This apparent SPDC
threshold is the same as the depletion point discussed in chapter 3, where the pump
depletion happens. Above the threshold, the slope becomes linear because the pump
depletion sets in. We observe a slope efficiency of 71% in the energy conversion from the
pump to signal and idler energy combined, when above the threshold.
The laser and the camera were synchronously operated at 25 Hz due to the limited data
acquisition speed of the camera. A common trigger signal applied to the laser diode and
the camera ensured pulse-to-pulse synchronization, which enabled the recording of single
pulse spectra of the signal. The monochromatic point spread function of the 2f imaging
system at the camera was 33 µm (exp(-2) level), while the pixel size of the camera was 20
x 20 µm. In order to estimate the spectral resolution of the grating spectrometer, the central
wavelength shift of the signal spectrum when using different PPLN channels was first
measured using the spectrum analyzer. This was then correlated with the corresponding
shift in pixels of the signal spectrum recorded at the camera, while using these channels.
The spectral resolution of the grating spectrometer at the signal wavelength was thus
estimated to be 0.24 nm per pixel. To correlate the pulse-to-pulse energy fluctuations
between the pump and the signal, a fraction of the pump pulse extracted before the SPDC
stage (mirror M1) was redirected onto the InGaAs camera. This enabled us to

Results and discussion
74
simultaneously acquire the spatial profile of the pump as well as the spectral profile of the
signal. Suitable attenuation was applied to both the signal and the pump field to avoid
saturation of the camera.
Figure 4.3: Performance characteristics of the SPDC light source. (a) shows the
measured signal pulse energy for different pump pulse energies. Inset shows the
signal spectrum measured using the spectrum analyzer. (b) shows the energy per
pulse for the pump and the signal for 103 consecutive pulses. The spatial profile of the
pump and the spectral profile of the signal are shown in the inset. CVE: Coefficient of
variation for the pulse energy.
Figure 4.3(b) shows the calculated energy per pulse, both for the pump and the signal for
103 consecutive pulses. The pulse-to-pulse energy for the pump and the signal is obtained
by integrating the corresponding pulse-to-pulse spatial and spectral profiles of the pump

Results and discussion
75
and the signal recorded respectively at the camera. The spatial profile of the pump and the
spectral profile of the signal is shown in the inset of Figure 4.3(b).
In order to study the pulse-to-pulse stability, a statistical quantity known as the coefficient
of variation (CV) is used. This term represents a measure of the variability of data in a
sample with respect to the mean of the data. The CV is simply defined as the ratio of the
standard deviation to the mean and can be mathematically expressed as,
Standard deviation
CVMean
(4.2)
A commonly used approach in literature to represent the stability of a light source is to
evaluate the average power measured using a power meter. Though simple, this method
does not include the pulse-to-pulse dynamics because of the averaging in space and time.
Fève et al. reported the pulse-to-pulse energy stability for an SPDC system at 1.421 µm
(signal) to be as low as 7%, while the pump (1.064 µm) had a relative pulse-to-pulse
stability of 3%, when operated at 3.5 times above SPDC threshold [120]. We measured
pulse-to-pulse energy stability of 0.9% and 2% for the pump (CVEp) and signal (CVEs)
respectively, when operated 2.4 times above threshold (see Figure 4.3(b)). This indicates
high pulse-to-pulse energy stability of the developed system, comparable to previously
reported values.
Although the energy of the signal pulses remained almost constant, significant spectral
fluctuation was observed when evaluating the individual pulses. Figure 4.4(a) shows a
cross sectional view of the 2D Gaussian pump intensity profiles for 103 consecutive pulses
(40 seconds). Figure 4.4(b) displays the spatial cross section for the first 25 pump pulses
in (a). The pump pulse-to-pulse intensity stability is quantified by calculating the CV for
the intensity along a single (center) pixel of the spatial pump profile, which is found to be
close to 1% (similar to the pump pulse energy stability CVEp of ~1%). This further
confirms the superior overall pulse-to-pulse stability of the pump. Figure 4.4(c) shows the
signal spectrum recorded simultaneously with the pump pulses shown in Fig. 3(a). Both

Results and discussion
76
the spatial profile of the pump and the spectral profile of the signal were recorded for Ep =
180 µJ case. The pulse-to-pulse spectral fluctuations are evident in Fig. 3(c) and further
highlighted by the first 25 pulses, shown in Fig. 3(d), corresponding to the pump pulses
shown in Fig. 3(b). It is discernible that the intensity of the different wavelength bins varies
significantly from pulse-to-pulse, even though the total pulse-to-pulse energy is reasonably
stable.
Figure 4.4: Pulse-to-pulse characterization of the pump spatial profile and signal
spectrum, using Ep = 180 µJ. (a) shows the stacked cross sectional view of the
Gaussian spatial profile of the pump recorded on the InGaAs camera for 103
consecutive pump pulses. (b) illustrates the high stability of the pulse-to-pulse spatial
pump profile by zooming in on the first 25 consecutive pulses from (a). (c) shows the
stacked cross sectional view of signal spectrum for 103 consecutive signal pulses
(simultaneously recorded with (a)). (d) illustrates the instability of the pulse-to-pulse
signal spectral profile by zooming in on the first 25 consecutive pulses from (c).
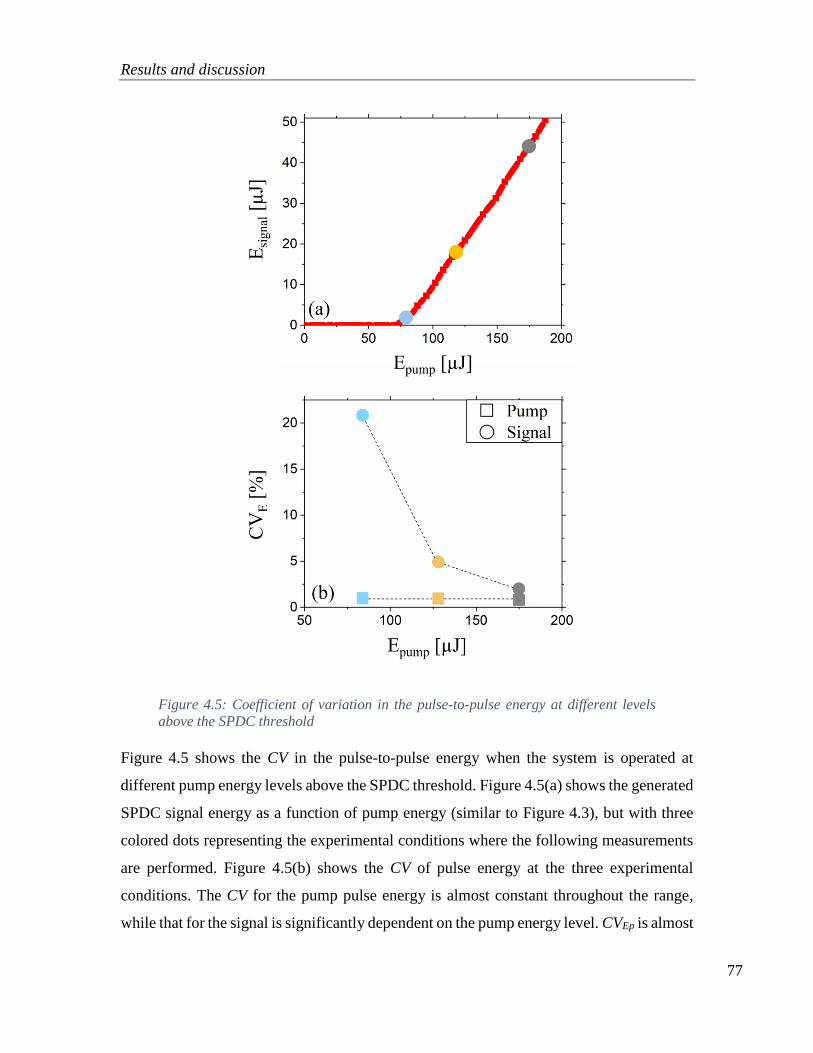
Results and discussion
77
Figure 4.5: Coefficient of variation in the pulse-to-pulse energy at different levels
above the SPDC threshold
Figure 4.5 shows the CV in the pulse-to-pulse energy when the system is operated at
different pump energy levels above the SPDC threshold. Figure 4.5(a) shows the generated
SPDC signal energy as a function of pump energy (similar to Figure 4.3), but with three
colored dots representing the experimental conditions where the following measurements
are performed. Figure 4.5(b) shows the CV of pulse energy at the three experimental
conditions. The CV for the pump pulse energy is almost constant throughout the range,
while that for the signal is significantly dependent on the pump energy level. CVEp is almost

Results and discussion
78
constant (~1%), as one would expect, but the corresponding CVEs show a considerable
increase with the decrease in pump pulse energy. Close to the SPDC threshold, CVEs is
almost 10 times higher than CVEp (~21%), but reduces to 2% at 2.4 times above the
threshold. This shows the higher instability in the pulse-to-pulse energy for the SPDC light
source when operated close to the SPDC threshold.
Figure 4.6: The signal spectrum with corresponding spectral intensity stability for
three different pump pulse energy cases. (a) shows the mean signal spectrum for 103
consecutive pulses at three different pump pulse energies indicated in Figure 4.5(a).
(b) shows the CV of the signal spectral intensity over the spectrum. The white dots
represent the level where the spectral intensity drops to exp(-2) level of the maximum
value for each curve in (a).

Results and discussion
79
Figure 4.6(a) shows the mean signal spectrum of 103 consecutive pulses, measured at three
different pump pulse energies indicated in Figure 4.5(a). An increased spectral signal
bandwidth was observed for increased pump pulse energies, as reported in ref. [120]. This
is also observed, and theoretically explained with a model for the saturated regime in
chapter 3. A quantitative measure of the pulse-to-pulse spectral intensity stability for the
signal is obtained by calculating the CV as a function of wavelength for the signal spectra,
henceforth denoted as CVλs. Figure 4.6(b) shows the CVλs of each spectral bin for 103
consecutive pulses. CVλs is seen to be fairly flat over most of the spectrum, but increases
significantly at the edges, which is expected since the mean is close to zero here. In order
to make a meaningful comparison of the spectral stability at the three pump pulse energies,
only CVλs values where the corresponding spectral intensity exceeds exp(-2) of the central
bin value are considered, indicated by white dots in Figure 4.6(b). An increase in CVλs is
observed at the center of the spectrum for all three pump pulse energies. This property is
not yet fully understood but indicates a decrease in stability close to the generated center
wavelength. Table 4.1 summarizes the different CV values discussed in this chapter.
Table 4.1: Quantized pulse-to-pulse stability as a function of pump energy.
Epump [µJ] Quantized pulse-to-pulse stability
CVEp (%) CVEs (%) CVλs (%) - averaged
80 0.97 21 27
120 0.95 5 14
175 0.9 2 13
At a pump energy of 80 µJ (very close to the SPDC threshold), the average value of CVλs
is 27%, while the CVEs is 21%. The higher CVEs and CVλs values conclusively indicate the
poor pulse-to-pulse stability of the light source close to the SPDC threshold. At pump
energy of 175 µJ and 120 µJ (far from the SPDC threshold), the average value of CVλs
decreases to roughly 13% and 14%, respectively, even with CVEs being 2% and 5% only,
see Figure 4.5(b). The striking observation here is the poor signal spectral intensity stability
(CVλs ~ 13%) even when the signal energy stability is very high (CVEs = 2%) when

Conclusion
80
operated at close to 2.4 times above the SPDC threshold. Furthermore, it is also noted here
that the CVλs tend to saturate at higher pump energy levels. Following the discussion in
section 3.4.2, growth in the spectral intensity of the collinear SPDC modes saturates at
higher pump energy levels. We believe this to be the reason for the saturation of the CVλs
moving farther from the SPDC threshold. Due to the inherent symmetry in the nature of
the SPDC signal and idler photon generation, the noise properties of the idler can be readily
derived from that of the signal.
4.4 Conclusion
In conclusion, we report on the spectral characterization of a simple, compact, low-cost,
tunable mid-IR light source based on SPDC in an MgO:PPLN crystal, pumped by a low
repetition rate, passively Q-switched laser. The source is characterized in terms of pulse-
to-pulse spectral stability of the generated signal field. Pulse-to-pulse spectral intensity
noise of the SPDC source was quantified for the first time to the best of our knowledge.
The spectral noise was investigated as a function of pump pulse energy, and it was
demonstrated that the pulse-to-pulse signal energy fluctuations decreased rapidly when
operated well above the threshold. However, the same significant improvement was not
found in the spectral intensity stability. The major conclusions are summarized as follows:
(a) Pulse-to-pulse stability is generally poor close to the SPDC threshold, but improves
moving away from the SPDC threshold.
(b) The much improved energy stability farther from the threshold does not necessarily
suggest a similar magnitude of improvement in the spectral intensity stability.
(c) Spectral intensity stability saturates moving farther from the threshold. This can be
attributed to the corresponding spectral intensity saturation for the collinear SPDC
modes.

81
82
5 Continuously tunable pulsed mid-IR
SPDC light source
‘‘Research is to see what everybody else has seen, and to think what
nobody else has thought.’’
A. Szent-Györgyi
In this chapter, a continuously tunable pulsed mid-IR SPDC light source using a fan-out
crystal is described. The fixed grating crystals used in previous chapters were replaced
with a fan-out crystal, enabling fast continuous tuning in the mid-IR simply by transverse
translation of the crystal. Subsequently, we demonstrate mid-IR spectroscopy using the
light source without the need for a traditional spectrometer.
Contents 5 Continuously tunable pulsed mid-IR SPDC light source ......................................... 82
5.1 Introduction ........................................................................................................ 83
5.2 Experimental arrangement ................................................................................. 84
5.3 Results and discussion ....................................................................................... 86
5.3.1 SPDC energy measurement ........................................................................ 86
5.3.2 Upconversion idler spectral measurement .................................................. 89
5.3.3 Crystal position versus idler center wavelength ......................................... 92
5.3.4 Pulse-to-pulse idler stability ....................................................................... 94
5.3.5 Spectroscopy using polystyrene film .......................................................... 95
5.4 Conclusion ....................................................................................................... 100

Introduction
83
5.1 Introduction
unable mid-IR light sources have proved to be attractive for many applications but
most importantly, spectroscopy. A tunable light source provides broad spectral
coverage, enabling the study of the spectral signatures of the sample over a broad range of
wavelengths. This can, for example, help in identifying the chemical structure/composition
of the sample. This chapter describes a fast, continuously tunable mid-IR SPDC light
source based on SPDC in a fan-out MgO:PPLN crystal.
Conventionally, tuning is achieved in poled crystals by changing the temperature, grating
periodicity, or tilting the crystal. Temperature tuning is generally slow and can only cover
a limited range. Tilting a fixed grating crystal with respect to the beam direction would
lead to a different poling periodicity, and hence a new phase-matched wavelength. But this
method is also limited by the range of tunability because of the limited change in
periodicity with crystal rotation. In previous chapters, we have discussed the use of crystals
with multiple fixed grating periods. These crystals had five different channels, and tuning
was achieved by shifting between the channels, and limited tuning within a single grating
based on temperature. However, the spectral coverage is discontinuous and can thus be
used only for applications dealing with those discrete spectral bands.
Figure 5.1: An illustration of a fan-out PPLN crystal. 𝛬𝑠ℎ𝑜𝑟𝑡 and 𝛬𝑙𝑜𝑛𝑔 represents
the shortest and longest periodicity available in the fan-out crystal. The figure is
adapted from ref. [131].
T

Experimental arrangement
84
In this chapter, we aim to overcome these limitations by using a fan-out crystal. A
schematic representation of a fan-out crystal is shown in Figure 5.1. The specialty of the
fan-out crystal is that the periodicity of the poling structure varies continuously across the
transverse dimension of the crystal, with one side providing the shortest (𝛬𝑠hort) and the
other side providing the longest (𝛬𝑙𝑜𝑛𝑔) period. The continuously varying poling period
allows for continuous tuning of the phase-matched light generation across a broad spectral
range by simple transverse translation of the fan-out crystal. In this work, we demonstrate
and characterize a continuously tunable mid-IR SPDC light source in the saturated regime
based on a fan-out crystal. The light source is used to demonstrate simple mid-IR
spectroscopy of a polystyrene sample, exploiting the continuous tuning of the spectral
emission from the SPDC source.
5.2 Experimental arrangement
A schematic of the experimental setup used in this work is shown in Figure 5.2. The setup
is similar to the one discussed in the previous chapters, except for the introduction of the
fan-out structured PPLN crystal. The Q-switched laser system delivered pump pulses
centered at λp = 1.03 µm with a pulse duration τp = 3 ns. The maximum pulse energy from
the laser was Ep = 180 µJ when running the laser at a repetition rate of frep = 100 Hz. A tap
from the pump (at M1) was used to monitor the temporal stability of the pump pulse during
the measurements, using a fast InGaAs detector. The fixed grating crystal was replaced
with a 25 mm long MgO:PPLN fan-out crystal heated to 200°C to avoid photorefractive
damage. The fan-out crystal had grating periodicities spanning from 27.5 to 31.6 µm
facilitating continuous coverage in the 1.4 to 4 µm spectral range (SPDC signal + idler).
An uncoated CaF2 f100 lens collimated the generated SPDC light from the crystal. Mirror
M2 removed the remaining pump light, while mirror M3 separates the signal from the
idler. The transverse translation of the fan-out crystal was performed using a computer-
controlled precision translation stage. The SPDC energy curves, shown in Figure 5.3, were
measured using a thermal power meter (between f100 lens and M3 mirror).

Experimental arrangement
85
Figure 5.2: Schematic layout of the experimental setup. LC: Laser crystal (Yb:YAG),
SA: Saturable absorber (Cr4+:YAG), OC: Output coupling mirror, fx: lens of focal
length x in mm, LP: Long pass 1 µm filter, HWP: Half wave plate, P: Polarizer, M:
Mirror, PPLN: periodically poled lithium niobate crystal, BD: Beam dump.
While transversely translating the fan-out crystal, each position would phase match a
unique set of SPDC signal-idler pairs. The generated idler wavelength, as a function of
crystal position, was measured using a home-built upconversion module and a standard
silicon based near-IR spectrometer. A detailed account of the upconversion module is
given in ref. [150]. The upconversion module consists of a 1064 nm laser with an intra-
cavity chirped PPLN crystal (continually varying grating periodicity from 22 to 23.5 µm
along the beam propagation direction). The chirped crystal results in a mid-IR spectral
coverage between 3 and 5.5 µm, hence, covering only part of the idler wavelengths of the
SPDC source. The upconverted signal is then measured using a near-IR spectrometer
(Ocean optics Maya 2000 Pro). The measured SPDC idler center wavelength was used to
calibrate the transverse position of the fan-out crystal versus wavelength, enabling direct
computer-controlled center wavelength of the SPDC source. In order to demonstrate the
spectroscopic applicability of the light source, a sample, in the form of a thin sheet of
polystyrene, was placed in the idler beam path, allowing to measure the absorption features
of the sample between 3 and 3.6 µm [151]. The spectroscopy was performed, relying on
the high brightness tunable SPDC light source, using only a thermal power meter rather
than a spectrometer, while translating the crystal. LabVIEW interface was used to
automate the crystal translation and to acquire the data from the power meter.

Results and discussion
86
5.3 Results and discussion
5.3.1 SPDC energy measurement
Similar to the previous chapters, the SPDC stage is operated in the saturated regime. The
SPDC energy was measured as a function of pump energy at different transverse positions
of the PPLN crystal. The fan-out crystal has a transverse dimension of 12.3 mm and covers
a poling periodicity of 4.1 µm (31.6 – 27.5 µm). Consequently, it is estimated that 1 µm
crystal translation corresponds to a 0.34 nm change in poling period. Figure 5.3 shows the
result of SPDC energy measurement across different transverse positions in the crystal.
The center idler wavelengths in Figure 5.3 are calculated for each crystal position, and the
measured SPDC energy is plotted as a function of pump energy, for each of the six different
crystal positions.
Figure 5.3: SPDC energy measured across different positions in the crystal. The
legend shows the approximate center signal and idler wavelengths.
The SPDC slope efficiency is seen to be almost the same for all center idler wavelengths,
roughly 72%. The measured slope efficiency is very close to that obtained for the fixed
grating crystals used in chapters 3 and 4, indicating that the achievable gain is not
compromised by the use of a fan-out structure. Operation in the saturated regime enables

Results and discussion
87
high brightness at the generated idler SPDC wavelengths. The theoretical slope calculation
performed in section 3.3.1 suggests that the slope in the saturated regime is determined by
the level of pump depletion. The slope being the same in all three systems suggests that
the depletion of the pump is similar at all wavelengths.
Interestingly, it is seen from Figure 5.3 that, as we move away from degeneracy to an idler
wavelength of 3.7 µm, the SPDC threshold approximately increases by a factor of two. We
believe this is due to a combination of several factors. In order to investigate this, we first
rewrite the expression for the parametric gain ‘g’ from chapter 3 as
,2
3
2
0
2 p ps i eff
p s i
ae kdg
n
I
n n c
(5.1)
Equation (5.1) shows the relationship between the pump intensity and the signal and idler
wavelengths with respect to the gain. This shows that the intensity of the pump needs to
increase by ~ 20% in order to reach the same gain at degeneracy as we move from
degeneracy to an idler wavelength of 3.7 µm.
Another reason for the increasing pump intensity is the reduced length of the poling
structure of the crystal, as we move from the longer poling periods at degeneracy towards
the shorter periods at 3.7 µm (the crystal has the same number of periods across the crystal,
see Figure 5.1). The overall length of the poled region reduces by approx. 10% moving
from degeneracy to the longer idler wavelength, resulting in an increase in pump intensity
of additionally 20% to reach the threshold gain level.
The above explanations account for approximately half of the increased threshold moving
towards longer idler wavelength, seen in Figure 5.3. We speculate that a significant
contribution to the increased threshold can be attributed to the decreasing modal overlap
between pump, signal, and idler as we move away from degeneracy, see equation (3.17)
in section 3.3.3. However, this needs to be analyzed in more detail.

Results and discussion
88
Initial validation of the fast continuous tuning was obtained by measuring the generated
SPDC energy while the fan-out SPDC crystal was continuously scanned. Figure 5.4 shows
the measurement of SPDC energy generated while translating the fan-out crystal at a
constant speed of 0.4 mm/s. A reduced pump energy of 100 µJ (Epump,max = 180 µJ) was
used to minimize the risks of damaging the coatings on the end facets of the crystal. The
dip seen in the SPDC power close to degeneracy was found to be due to bulk damage at
the center of the fan-out crystal, which could not be avoided by adjusting the crystal
alignment.
Figure 5.4: SPDC power measured while the fan-out crystal is continuously
translated.
A full wavelength scan is obtained within 20 seconds, translating the fan-out crystal from
degeneracy towards the longer idler wavelengths (see Figure 5.4). The collinear phase
matching curve for the fan-out crystal can be plotted by solving the collinear phase
matching equation, given below as
0p s i QPMk k kk k (5.2)

Results and discussion
89
Figure 5.5: The collinear phase matching curve for the fan-out crystal. The range of
SPDC signal an idler is shown. Degeneracy corresponds to the point where the signal
and idler wavelengths are the same.
Figure 5.5 shows the phase matched SPDC signal and idler wavelength as a function of
the grating period. The range on the y axis represents the poling periods of the fan-out
crystal. It is clear from this graph that, with a single transverse sweep of the crystal, the
idler wavelength tune in the range from 2.06 to 4.07 µm. Thus, ~ 2 µm is covered in 20
seconds, leading to a tuning rate of ~ 100 nm/s.
5.3.2 Upconversion idler spectral measurement
The spectral properties of the idler beam were measured through upconversion detection.
The previously discussed upconversion module, together with the near-IR spectrometer,
measures the upconverted spectra versus the position of the fan-out crystal. The mid-IR
range that could be measured using the current setup was limited because
(i) The maximum mid-IR idler wavelength generation supported by the fan-out
SPDC crystal is roughly 4 µm.
(ii) The grating periodicity of the upconversion crystal used could only support
upconversion of the mid-IR above ~ 3 µm.

Results and discussion
90
Consequently, we could only characterize idler wavelengths in the 3 to 4 µm regime. The
near-IR spectrometers available for these measurements had a cutoff at around ~ 810 nm
(~ 3.45 µm idler); thus, two spectrometers were needed to cover the range from 3 µm to 4
µm.
The idler spectral bandwidth across 3 to 4 µm was estimated, using the FWHM criteria,
from the upconverted idler spectra. An integration time of 200 ms (20 pulses from the
SPDC source) and an averaging of 5 spectra were chosen as the spectrometer setting.
Figure 5.6 shows the comparison between the measured idler spectra at pump energy of
100 µJ with the theoretical spectra calculated based on equation (5.3). The spectrometer is
changed at 3.45 µm for the reasons mentioned previously.
Figure 5.6: Idler spectral bandwidth comparison between the experiment and the
theory
The bandwidth measurements for few points below 3.25 µm, which is very close to the
lower detection edge of the upconversion module, are not included because of the data
being noisy. The theoretical curve is calculated based on the collinear idler intensity given
as

Results and discussion
91
2) c( sin
2i iI
k l
(5.3)
where 𝛥𝑘 represents the collinear phase mismatch and l represents the length of the crystal
(25 mm). The above equation represents the simple case where the SPDC gain ‘g’ is
assumed to be very low compared to the phase mismatch so that the sinh2 function in the
actual equation of the SPDC model simplifies to a sinc2 function (equation (3.9)). Thus,
the theoretical bandwidth here represents the idler bandwidth close to the SPDC threshold.
The experimental bandwidth is higher than the theoretical bandwidth due to
(i) The pump energy used for bandwidth measurement (Epump = 100 µJ) is above
the SPDC threshold (see Figure 5.3), leading to increased bandwidth following
the theory in chapter 3. Also, the experimental and theoretical bandwidths are
closer at longer wavelengths because of the increase in the SPDC threshold. In
effect, the longer wavelengths are closer to the threshold compared to shorter
wavelengths.
(ii) The pump beam has a beam waist of 90 µm (radius). The finite spot size of the
pump beam leads to a finite change in the poling period across the beam. This
will result in the broadening of the spectrum, more close to the degeneracy (see
the phase matching curve in Figure 5.5).
(iii) The measured idler bandwidth is in reality, a convolution of the actual idler
bandwidth and the bandwidth of the upconversion pump (~0.3 nm). However,
this can only account for a very little increase in the measured bandwidth.
A clear trend in the increase in idler bandwidth is observed moving towards shorter
wavelengths. The idler bandwidth is important to know when using the source to perform
spectroscopy.

Results and discussion
92
5.3.3 Crystal position versus idler center wavelength
In this section, calibration of the idler center wavelength versus crystal position is detailed.
Using the upconversion spectrometer, the idler center wavelength is measured with crystal
translation. Figure 5.7 shows the change in the generated SPDC idler center wavelength as
the fan-out crystal is translated. The experimental data points represent the average value
over 40 scans, including 20 forward and 20 backward scans using the chirped upconverter
and near-IR spectrometers. The response of the spectrometers overlaps at around 3.45 µm;
however, the plot in Figure 5.7 does not include any data from the overlapping portion.
We observe a small offset in the wavelength at the overlapping region of the two
spectrometers, which we believe is due to the inherent difference in their calibration
settings.
Figure 5.7: Fan-out crystal position versus idler center wavelength for the
experiment, theory, and polynomial fit to the experiment.
The smallest idler wavelength from the experimental data in Figure 5.7 corresponds to
3.0346 µm, albeit at very low upconversion efficiency as it is at the border of the spectral
coverage of the upconverter. This is used as the starting point to calculate the theoretical

Results and discussion
93
curve shown in Figure 5.7 is based on equation (3) in the appendix. A detailed explanation
for the calculation of the theoretical curve is presented in the appendix. We believe the
slight difference in slope between the experimental and theoretical curves is due to (a) the
approximation in the Sellmeier equation and (b) the possibility of the crystal being tilted
during the translation. In order to calibrate the measured SPDC idler wavelength to the
crystal position, the experimental data in Figure 5.7 is fitted to a second-order polynomial
of the form
21.1 pos posir a x b x (5.4)
where 𝜆𝑖𝑟 represents the SPDC idler center wavelength in µm and 𝑥𝑝𝑜𝑠 represents the
crystal position in mm. The fitting parameters are a and b, and their values for our case are
a = 0.33304 and b = - 0.00793. The fitted result is shown as a solid red curve in Figure 5.7.
This fitting procedure has to be done only once, and equation (5.4) then serves as a
reference for the idler center wavelength versus the position of the crystal.
Figure 5.8: The CV for the idler center wavelength. The color change represents the
change in the spectrometer. The CV value is extremely small, suggesting the high
stability of the data during scans.

Results and discussion
94
To validate the high stability of the position versus wavelength data over multiple scans,
we calculate the coefficient of variation (CV, based on equation (4.2)) of the idler center
wavelength over the 20 back and forth scans. Figure 5.8 shows the CV for the idler center
for both the spectrometers for 40 crystal scans. The color change represents the change in
the spectrometer. As is clearly evident, the extremely low value of CV suggests the high
repeatability of the results for future scans. The average CV across the whole spectral range
is ~ 0.05% leading to an average center wavelength shift of 2 nm at 4µm and 1.5 nm at 3
µm. These are small numbers and practically negligible compared to the spectral
bandwidth of the source.
5.3.4 Pulse-to-pulse idler stability
In this section, we take a look at the pulse-to-pulse idler stability and correlate them to the
results already presented for the SPDC signal in chapter 4. In order to capture the pulse-
to-pulse idler spectra, the upconversion spectrometer setup was used. The integration time
of the spectrometer was adjusted to 10 ms, and the SPDC pump laser was operated at 100
Hz, ensuring single pulse idler spectra acquisition. Pulse-to-pulse spectra were recorded
for a duration of 10 seconds.
Integrating the area under the individual spectra gives the upconverted idler pulse energy.
A statistical analysis of the pulse-to-pulse spectral data is done to qualitatively observe the
trend in the pulse-to-pulse idler energy stability versus pump energy. Figure 5.9 shows the
CV of the pulse-to-pulse idler energy for two different idler center wavelengths measured
at three different pump energies. The SPDC threshold for the shorter wavelength is lower,
implying that at Epump = 100 µJ, the longer wavelength is closer to the threshold compared
to the short wavelength (see Figure 5.3). The CV for the idler pulse energy is high close to
the threshold and decreases as we move farther from the threshold. Also, CV for the longer
wavelength is higher at Epump = 100 µJ due to its closeness to threshold than that of shorter
wavelengths. All these results are qualitatively in complete agreement with the pulse-to-
pulse energy stability measurements reported in chapter 4, where the analysis was
performed on the pulse-to-pulse signal spectra measured for the SPDC signal (near-IR).

Results and discussion
95
Figure 5.9: Statistical analysis of pulse-to-pulse idler energy stability. The CV for the
pulse-to-pulse energy is shown here.
5.3.5 Spectroscopy using polystyrene film
We demonstrate a simple spectroscopic application using the developed mid-IR tunable
SPDC light source, measuring the absorption spectra of a polystyrene film. Contrary to
previous crystal scans, which were performed between 7 and 12.6 mm, we limit the crystal
translation to between 7 and 10 mm, corresponding to 3.1 to 3.6 µm, as polystyrene has its
main features within this range. In order to highlight the tuning properties and center
wavelength stability of the SPDC light source with translation, it was decided to discard
the upconversion module and the spectrometer and simply use a simple thermal power
meter to perform spectroscopy. The power meter measures the idler power with and
without the sample (sample and reference transmittance measurements, respectively) while
the crystal is translated. The spectral resolution of this simple implementation will be set
by the larger of the two quantities; (a) the step size of the wavelength translation and (b)
the bandwidth of the idler.

Results and discussion
96
Figure 5.10 shows the idler step size corresponding to three different crystal translation
step sizes, 𝛥𝑥𝑝𝑜𝑠 = 0.1 mm, 0.05mm, and 0.025 mm. A wavelength shift of 5 nm in the
mid-IR is possible with 𝛥𝑥𝑝𝑜𝑠 = 0.025 mm. However, the spectral bandwidth of the idler
limits the obtainable spectral resolution of the system. The idler bandwidth was previously
measured to be ~15 nm in the mid-IR for pump energy of 100 µJ. Thus, this will limit the
resolution of the system. While performing the spectral measurements, pump energy of
150 µJ was used so that we have sufficient idler energy to perform the spectroscopy. Doing
so will further broaden the idler spectrum and decreases the spectral resolution of the
system.
Figure 5.10: The idler wavelength step size for different crystal translation step size
denoted by 𝛥𝑥𝑝.

Results and discussion
97
In the case of a traditional spectrometer, the resolution is set by the spectrometer and not
the light source itself. This is, however, not the case for the power meter based
spectrometer discussed here. The resolution in our system can be improved by lowering
the bandwidth of the idler, which could, for example, be done by passing the idler multiple
times through the SPDC crystal [142].
Figure 5.11 shows the absorption spectra of a 0.05 mm thick polystyrene film. The position
axis in (a) is converted to the idler center wavelength axis in (b) using equation (5.4). The
data in Figure 5.11 seems to overlap nicely for the measurements at different crystal
translation step sizes, suggesting good repeatability of the measurement. The change in
𝛥𝑥𝑝 from 0.05 to 0.025 mm provides slight improvement in the spectral quality, and thus,
this was used for the spectroscopic measurements.

Results and discussion
98
Figure 5.11: The absorption spectra for a polystyrene film with 0.05 mm thickness.
(a) shows the absorption estimated by measuring the transmitted power at different
crystal positions. (b) shows the absorption spectra. The x-axis in (b) is calculated
using equation (5.4).
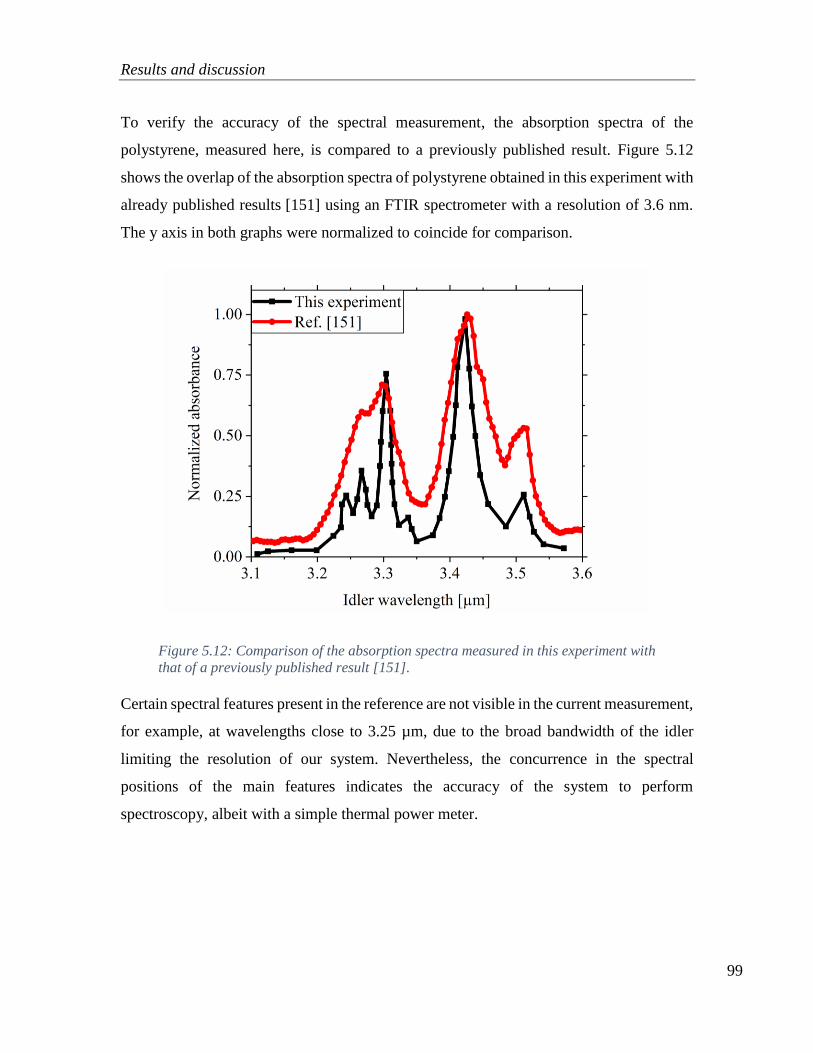
Results and discussion
99
To verify the accuracy of the spectral measurement, the absorption spectra of the
polystyrene, measured here, is compared to a previously published result. Figure 5.12
shows the overlap of the absorption spectra of polystyrene obtained in this experiment with
already published results [151] using an FTIR spectrometer with a resolution of 3.6 nm.
The y axis in both graphs were normalized to coincide for comparison.
Figure 5.12: Comparison of the absorption spectra measured in this experiment with
that of a previously published result [151].
Certain spectral features present in the reference are not visible in the current measurement,
for example, at wavelengths close to 3.25 µm, due to the broad bandwidth of the idler
limiting the resolution of our system. Nevertheless, the concurrence in the spectral
positions of the main features indicates the accuracy of the system to perform
spectroscopy, albeit with a simple thermal power meter.

Conclusion
100
5.4 Conclusion
This chapter discusses the use of a fan-out crystal for continuously tunable mid-IR light
generation in the 1.4 to 4 µm range. The fan-out crystal enables fast tuning by transverse
translation. The crystal position as a function of SPDC idler wavelength is initially
obtained using an upconversion module and visible/near-IR spectrometer. The
upconversion idler spectral measurements confirm some of the key noise performance
parameters reported in chapter 4. Pulse-to-pulse idler spectra were recorded, and statistical
analysis on the idler energy stability was performed to quantify the noise trends.
The repeatability of the tuning was confirmed by performing 20 back and forth crystal
scans. No hysteresis was observed between the scanning directions. Statistical analysis on
the 40 scans showed a maximum coefficient of variation of 0.25% and an average
coefficient of variation of 0.05% in the 3 to 4 µm range, suggesting superior repeatability
of the position versus wavelength data.
Once the SPDC idler center wavelength was calibrated with respect to crystal position (by
fitting the experimental data), the system was demonstrated for simple (low resolution)
spectroscopy without a traditional spectrometer. The benefit here is the simplicity of the
system. Good agreement is obtained between the results in this experiment and that of a
previously published work. It is noted here that using a traditional spectrometer would be
advantageous because of the improved resolution, not relying on the idler bandwidth but
rather by the resolution of the spectrometer. However, idler spectral narrowing, for
example, by multiple passes through the SPDC crystal, can improve the resolution of the
current system.

101

102
6 Upconversion imaging in the mid-IR
using femtosecond pulses
“Ask the right questions, and nature will open the doors to her
secrets.”
C. V. Raman
In contrast to chapters 3, 4, and 5, where mid-IR light generation and characterization were
the focus, this chapter provides the description of mid-IR light detection through
upconversion. The chapter investigates a synchronous mid-IR upconversion imaging
system in the femtosecond regime. A theory is developed to calculate acceptance
parameters, considering the large spectral bandwidths and the reduced interaction length
due to group velocity mismatch, both associated with ultrashort pulses. Furthermore, the
imaging resolution of this ultrashort pulsed upconversion imaging system is described. The
presented theory is consistent with experimental observations. This chapter is based on
ref. [152].
Contents 6 Upconversion imaging in the mid-IR using femtosecond pulses ........................... 102
6.1 Introduction ...................................................................................................... 103
6.2 Experimental setup ........................................................................................... 104
6.3 Theory and results ............................................................................................ 106
6.3.1 Angular and spectral acceptance bandwidth............................................. 116
6.3.2 Imaging resolution for an ultrashort-pulsed upconversion system ........... 119
6.4 Conclusion ....................................................................................................... 124

Introduction
103
6.1 Introduction
asy detection of mid-IR radiation while retaining spatial and spectral information
has been a challenge in the progress of mid-IR technology. Various mid-IR
detectors with their advantages and disadvantages were already discussed in chapter 1.
SFG using a second-order nonlinear crystal can be used to upconvert a mid-IR signal to
the visible/near-IR region, enabling easy detection using silicon (Si) based detectors.
Upconversion is particularly effective for the detection of low brightness signals since it is
inherently a low-noise conversion process. Upconversion can conserve the spatial and
spectral properties of the signal, while allowing for the use of Si based detectors/CCDs,
thereby eliminating the need for cooling. The response time of the nonlinear interaction
importantly is extremely short, relying on the response of the light weighted electrons in
the crystal. Even though silicon-based detector technology has been well established for
decades, the implementation of the upconversion technology remained limited, primarily
due to the low upconversion efficiency of the nonlinear crystal.
Ultrashort-pulsed upconversion is of particular interest because of the increased array of
possibilities offered, including pump-probe experiments and studies of relaxation
dynamics of molecules [153–155]. State-of-the-art femtosecond OPOs offer broad mid-IR
wavelength coverage with high peak power, leading to a high signal-to-noise ratio and a
reduced risk of incurring damage to delicate samples [156]. Additionally, the high peak
power provided by ultrafast laser sources eliminates the need for intracavity upconversion
typically associated with continuous-wave incoherent light conversion [157,158],
facilitating single-pass upconversion configurations [159,160]. Ultrashort-pulsed
upconversion requires good temporal overlap of the interacting pulses inside the nonlinear
crystal, which becomes progressively more difficult to achieve as the pulse duration
decreases. Timing jitter between the interacting fields can further add to this difficulty.
Synchronous upconversion, i.e., using the same pump source for the mid-IR generation
and the upconversion process, improves the long-term stability of the system, as well as
ensuring the pulse overlap. The principle of synchronous femtosecond upconversion was
E

Experimental setup
104
previously demonstrated in [161], where pulses at 1.5 µm were upconverted to the visible
using a β-BaB2O4 crystal in the image plane of a 4f imaging system.
In this chapter, we report the first demonstration of femtosecond mid-IR upconversion
imaging in the Fourier plane of a 4f imaging setup. Existing theory, such as that found
in [63], is not applicable for shorter pulse durations (typically below the picosecond time
scale). The theory for upconversion imaging in the femtosecond pulse regime is different
from that for long pulse/CW regimes since for femtosecond imaging, we need to account
for (a) the reduced interaction length in the crystal due to temporal walk-off as a result of
group velocity mismatch (GVM) between the mid-IR and pump pulses, and (b) the broad
bandwidth associated with ultrashort pulses. These factors are considered in this chapter
to develop a practical model for femtosecond upconversion imaging.
6.2 Experimental setup
A schematic of the experimental setup used for femtosecond synchronous upconversion
imaging is shown in Figure 6.1. A Kerr-lens-mode-locked (KLM) Ti:sapphire laser
(Spectra Physics, Mai Tai HP) is used as the fundamental pump laser source, providing
transform-limited ~100 fs pulses at a repetition rate of 80 MHz. Up to 2 W of average
power is available at a central wavelength of 0.804 µm. Using the combination of a half-
wave plate and a polarizing beam-splitter, a large portion of the beam (1.3 W) is diverted
to a synchronously-pumped OPO, based on Type-0 quasi-phase-matching in a 1-mm-long
MgO:PPLN crystal. All cavity mirrors are coated for high reflection (>99%) of the near-
IR OPO signal beam over 1-1.4 µm, while the mid-IR OPO idler is coupled out through a
dichroic mirror with high transmission (>80%) across 3-5 µm. A fan-out QPM grating
structure (Λ~16-23 µm) facilitates rapid and continuous idler tuning across 2.7 to 4 µm,
with an average output power ranging from 80 to 100 mW.

Experimental setup
105
Figure 6.1: Schematic of the experimental setup used for mid-IR femtosecond
upconversion imaging. HWP: half-wave plate, PBS: polarizing beam-splitter, OPO:
optical parametric oscillator, BC: beam combiner, LN: lithium niobate crystal,
MgO:PPLN: Magnesium oxide doped periodically poled LN crystal f: lenses.
The mid-IR idler pulse duration is governed by the dispersion and GVM in the MgO:PPLN
and is estimated to be ~200 fs outside the OPO. The mid-IR spectra are measured to span
a FWHM bandwidth of ~300 nm using a mid-IR spectrum analyzer. Wavelength tuning is
accomplished by transverse translation of the OPO crystal while adjusting the cavity length
to vary the resonant signal wavelength.
For the upconversion stage, the mid-IR OPO idler light is collimated to a beam diameter
of 12 mm and illuminates a standard united states air force (USAF) resolution target, before

Theory and results
106
being focused by an f50 mm lens into a congruently grown undoped, unpoled bulk LiNbO3
crystal situated in the Fourier plane of a 4f imaging setup. The remaining pump beam
centered at 0.804 µm and having a beam diameter of 2.6 mm is combined coaxially with
the mid-IR beam, using a dichroic beam-splitter with high mid-IR transmittance (T > 95%).
Due to losses at the beam combiner, only ~ 50 mW of pump light is incident on the crystal;
however, the high peak power still ensures efficient upconversion (~ 6 kW). Since the path
length for the pump and the mid-IR pulses are different, a delay line, consisting of a
precision translation stage in the pump beam path, enables pulse synchronization to be
finely controlled. After the crystal, multiple short-pass filters (Thorlabs FES-750 and
FESH-800) and a 650±40 nm band-pass filter block the remaining pump beam.
Furthermore, an 800±10 nm band-pass filter was placed in the pump beam path in order to
block small amounts of parasitic red light originating from non-phase-matched SFG in the
OPO crystal getting reflected by the first half-wave plate into the upconversion pump beam
path.
The upconversion crystal is 10-mm-long and cut for birefringent phase-matching at a cut
angle 𝜃𝑐𝑢𝑡 = 48° relative to the optical axis, supporting upconversion from the mid-IR to
visible/near-IR under Type-I phase-matching. A computer-controlled rotation stage allows
the phase-matching angle to be precisely adjusted to facilitate phase-matched
upconversion for different mid-IR wavelengths. The upconverted visible light is
collimated by an 𝑓=100 mm lens and detected by a silicon CCD camera (Andor Luca S
658M).
6.3 Theory and results
In this work, we propose a theory combining the effect of the finite bandwidth of the
interacting fields and the reduced interaction length inside the nonlinear crystal resulting
from GVM, enabling the calculation of key parameters of the 100 fs upconversion imaging
system. Ultrashort pulses have a broad spectral bandwidth (𝛥𝜆). For a Fourier-transform-
limited (FTL) Gaussian pulse at center wavelength 𝜆, having a pulse duration 𝜏, the FWHM
spectral bandwidth can be calculated as

Theory and results
107
20.44
c
(6.1)
The pump pulse at 0.804 µm has an FTL bandwidth of 𝛥𝜆𝑝 ~ 10 nm, as also confirmed
using a spectrum analyzer. The OPO was tuned to provide three different mid-IR center
wavelengths at 2.851 µm, 3.206 µm, and 3.682 µm. The mid-IR pulses at each of these
central wavelengths had a spectral bandwidth of 𝛥𝜆𝑖𝑟 ~ 300 nm with slight variations. The
measured bandwidth is significantly larger than the calculated FTL bandwidth of 150 nm,
likely due to the mid-IR field of the OPO being non-resonant. GVM between the
interacting fields leads to temporal walk-off between the pulses as they propagate through
the crystal, making the effective interaction length shorter than the total crystal length. The
reduced interaction length influences the calculation of upconversion efficiency as well as
the spectral and angular acceptance parameters. For a typical 10-mm-long crystal, the
GVM-limited interaction length is not prominent in the picosecond pulse regime, but
becomes increasingly important as the pulse duration gets below one picosecond. The
energy conservation and phase matching condition for the upconversion process is
expressed as
1 1 1
up p ir
up p irk k k
(6.2)
where �⃗� 𝑖 and 𝜆i represents the wave vector and wavelength of the interacting fields. The
suffix i represents the different fields and is denoted for the pump, mid-IR, and
upconverted fields as p, ir, and up, respectively. Energy conservation strictly governs the
interacting field wavelengths. On the other hand, the phase-matching requirement between
the interacting fields is not strict, meaning that considerable upconversion can still be
observed for a slight phase mismatch. In this particular experiment, Type-I phase-matching
is implemented, wherein the pump and the mid-IR field are ordinarily polarized, and the
generated upconverted field is extraordinarily polarized.

Theory and results
108
Figure 6.2 shows the schematic representation of a 4f upconversion imaging configuration
with the upconversion crystal in the Fourier plane. Upconversion imaging performed in
the Fourier plane suggests that each point in the 2D object plane is converted to a plane
wave with a uniquely defined angle (incoming mid-IR angle) inside the crystal. The
upconversion happens inside the nonlinear crystal placed in the Fourier plane of the
imaging setup, through the interaction between the mid-IR field and the Gaussian pump
field. After upconversion, each point in the object plane is upconverted to a unique angle
(outgoing upconverted angle) which then forms a 2D upconverted image in the image
plane. The pump field direction is fixed and always along the z axis in the system. The
mid-IR and upconverted field is assumed to be coaxial with respect to the pump field in
our case.
Figure 6.2: Schematic representation of a 4f imaging configuration. OP: Object
plane, FP: Fourier plane, IP: Image plane, NLC: Nonlinear crystal, L: Lens.
Figure 6.3 gives an illustration of the noncollinear upconversion geometry and the angles
involved in the subsequent formulations. Figure 6.3(a) shows the noncollinear wave vector
phase matching diagram inside the nonlinear crystal. 𝜃𝑖𝑟 and 𝜃𝑢𝑝 represents the angle of
the mid-IR and upconverted field with respect to the pump field. For a cone of incoming
mid-IR angles (represented by the dotted circle), the upconverted field is also generated in
a cone satisfying the phase matching condition. Thus, upconversion imaging occurs with
the wavelengths encoded radially in rings. The thickness of the rings corresponds to the
acceptance bandwidth of the upconversion process. Figure 6.3(b) defines the angles used,
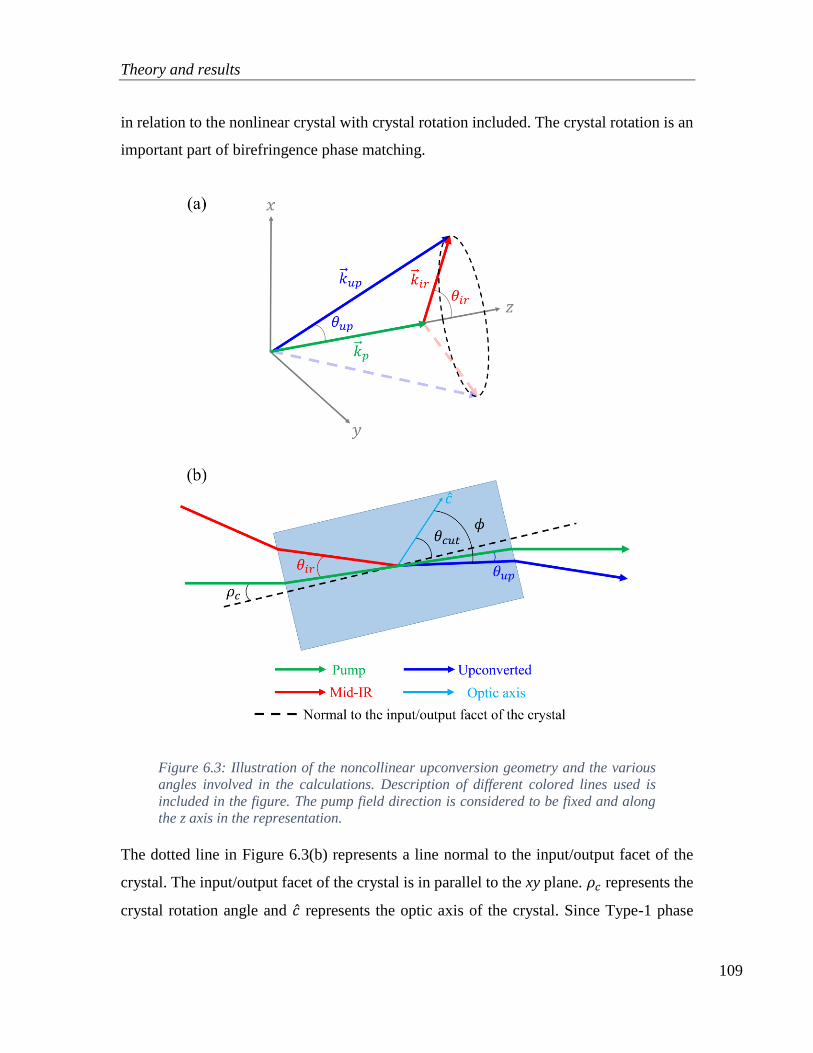
Theory and results
109
in relation to the nonlinear crystal with crystal rotation included. The crystal rotation is an
important part of birefringence phase matching.
Figure 6.3: Illustration of the noncollinear upconversion geometry and the various
angles involved in the calculations. Description of different colored lines used is
included in the figure. The pump field direction is considered to be fixed and along
the z axis in the representation.
The dotted line in Figure 6.3(b) represents a line normal to the input/output facet of the
crystal. The input/output facet of the crystal is in parallel to the xy plane. 𝜌𝑐 represents the
crystal rotation angle and �̂� represents the optic axis of the crystal. Since Type-1 phase
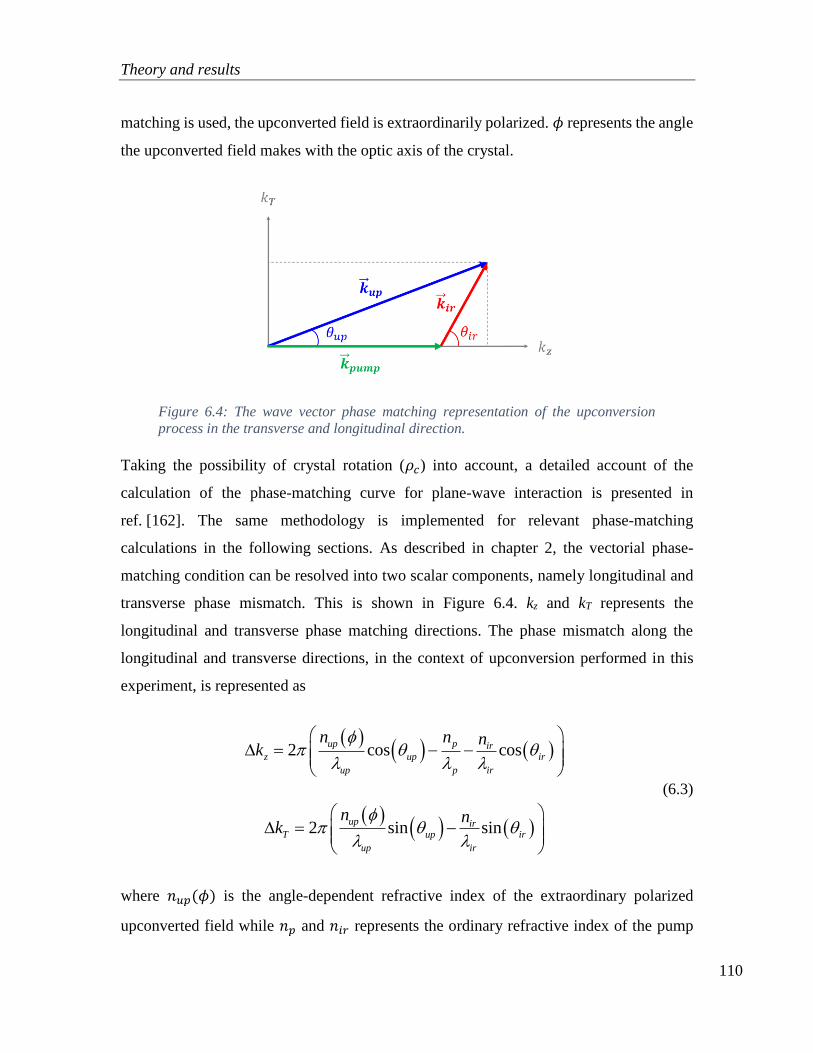
Theory and results
110
matching is used, the upconverted field is extraordinarily polarized. 𝜙 represents the angle
the upconverted field makes with the optic axis of the crystal.
Figure 6.4: The wave vector phase matching representation of the upconversion
process in the transverse and longitudinal direction.
Taking the possibility of crystal rotation (𝜌𝑐) into account, a detailed account of the
calculation of the phase-matching curve for plane-wave interaction is presented in
ref. [162]. The same methodology is implemented for relevant phase-matching
calculations in the following sections. As described in chapter 2, the vectorial phase-
matching condition can be resolved into two scalar components, namely longitudinal and
transverse phase mismatch. This is shown in Figure 6.4. kz and kT represents the
longitudinal and transverse phase matching directions. The phase mismatch along the
longitudinal and transverse directions, in the context of upconversion performed in this
experiment, is represented as
cos cos
sin sin
2
2
up p irup ir
T
up p ir
up irup i
z
r
up ir
n n
n
k
k
n
n
(6.3)
where 𝑛𝑢𝑝(𝜙) is the angle-dependent refractive index of the extraordinary polarized
upconverted field while 𝑛𝑝 and 𝑛𝑖𝑟 represents the ordinary refractive index of the pump

Theory and results
111
and mid-IR field, respectively. The assumption of a large pump beam diameter and plane-
wave interaction imposes strict cancellation of any transverse phase-mismatch (𝛥𝑘𝑇 = 0).
This provides the relation between the incoming mid-IR and output upconverted angles,
as
sin sinup ir
up ir
up ir
n n
(6.4)
The external mid-IR input angles in our experiment are confined to be symmetric about
the direction of the pump beam to a maximum cone angle of 13.68°, as dictated by the
incoming mid-IR beam diameter, 𝑑𝑖𝑟, and choice of lens, 𝑓1 (𝑑𝑖𝑟=12 mm; 𝑓1=50 mm).
With the transverse component of 𝛥�⃗� being zero, only the longitudinal phase-mismatch
(𝛥𝑘𝑧) influences the upconversion efficiency. Crystal rotation angle, mid-IR input angle,
mid-IR wavelength, and pump wavelength are the parameters that influence 𝛥𝑘𝑧, and can
be expressed as
, , , 2 cos cosup p ir
z c ir ir p up ir
up p ir
n n nk
(6.5)
𝜃𝑢𝑝 and 𝜆𝑢𝑝 are parameters dependent upon 𝜃𝑖𝑟, 𝜆𝑖𝑟, and 𝜆𝑢𝑝 (through equations (6.2) and
(6.4)). Furthermore, the quantity, 𝛥𝑘𝑧, also depends on 𝜌𝑐 through the relation
*
cut up c (6.6)
where 𝜌𝑐∗ is the crystal rotation angle with respect to the pump field inside the crystal. 𝜌𝑐
∗
can be found out from 𝜌𝑐 using Snell’s equation, see Figure 6.3. By simultaneously solving
the non-collinear phase-matching condition and energy conservation condition, one can
obtain the possible combination of angles and wavelengths that can be non-collinearly
phase-matched. Figure 6.5 shows the phase matching curve for the noncollinear frequency
upconversion process for different crystal rotation angles. Different IR wavelength – angle
combinations are upconverted for the different crystal rotation angles.

Theory and results
112
Figure 6.5: The noncollinear phase matching curve for the upconversion process.
Assuming negligible pump depletion, and assuming that the temporal pulse shapes are
square and of equal duration (for simplicity), the upconverted intensity is given as [127],
2 2, , ,
sinc2
z c ir ir p eff
up eff
k lI K l
(6.7)
2 2
2 2
0
32 eff p ir
pump ir up up
d I IK
c n n n
Ip and Iir represents the intensity of the pump and the mid-IR field, 𝑑𝑒𝑓𝑓 is the effective
nonlinear coefficient, 𝜀0 is the vacuum permittivity, and c is the vacuum speed of light.
The efficiency of the upconversion process strongly depends on the overlap, both spatially
and temporally, between the interacting fields. The GVM between the pump and the mid-
IR pulses leads to different velocities as the pulses propagate through the medium. For
ultrashort pulses, these will eventually be separated in time. Upconversion ceases when
the input mid-IR and pump fields temporally separate due to GVM. The term 𝑙𝑒𝑓𝑓, in
equation (6.7), is the effective interaction length and represents the crystal length after

Theory and results
113
which the pulses temporally walk-off. 𝑙𝑒𝑓𝑓 is calculated here for the GVM between the
mid-IR and pump field, respectively. It is given as [163],
, ,
1 1eff
g ir g p
l
v v
(6.8)
where τ is the duration over which the pulses effectively overlap, and 𝑣𝑔 is the group
velocity. The value of τ can be calculated as a convolution of the two temporally Gaussian
pump and mid-IR pulses, and is found to be 225 fs. The values of 𝑙𝑒𝑓𝑓 is calculated to be
0.85 mm, 1.1 mm, and 1.8 mm for the central mid-IR wavelengths of 2.851 µm, 3.206
µm, and 3.682 µm, respectively.
From equation (6.7), it is evident that the upconverted intensity depends on all parameters
that influence 𝛥𝑘𝑧. Thus, a realistic calculation of the upconverted intensity should take
into account the entire span of each of these parameters. Integrating the contribution from
each parameter over their respective range will give the final upconverted intensity. Both
pump and mid-IR beams have a Gaussian spectral profile, and it is therefore important to
include a Gaussian weighting function during the integration. Let 𝑆𝑖𝑟(𝜆𝑖𝑟) and 𝑆𝑝(𝜆𝑝)
denote the Gaussian spectral intensity profile of the mid-IR field and the pump field,
respectively. A flat-top spatial profile is assumed for the pump. The total upconverted
intensity considering the broad-angled input mid-IR field and broadband pump and mid-
IR pulse is represented as
,max ,max
,min ,min
,max
,min
2
2, , ,
sinc2
p ir
p ir
ir
ir
up eff p p ir ir
z c ir ir p eff
ir ir p
I K l S S
k ld d d
(6.9)
The sinc function in the above equation accounts for the influence of longitudinal phase-
mismatch on the upconverted intensity. We are here more interested in understanding the
influence of sinc function in determining the spread of the upconverted intensity profile,

Theory and results
114
rather than the absolute value of upconverted intensity. For validation of the developed
theory, the intensity as a function of crystal rotation angle (𝜌𝑐) is theoretically determined.
Figure 6.6 shows the various stages during the calculation of the scaled upconverted
intensity as a function of crystal rotation angle, 𝐼(𝜌𝑐) = 𝐼𝑢𝑝(𝜌𝑐)/(𝐾 ⋅ 𝑙𝑒𝑓𝑓2 ), using equation
(6.9). Figure 6.6(a), (b) and (c) demonstrates the procedure for the calculation of 𝐼(𝜌𝑐) for
the central mid-IR wavelength of 3.206 µm.
Figure 6.6: Calculation of I(ρc). (a) shows the contribution to I(ρc) from different
mid-IR input angles. (b) shows the contribution to I(ρc) from all mid-IR angles and
wavelengths. (c) shows the contribution to I(ρc) from all mid-IR angles and all mid-
IR and pump wavelengths. The spectral weighting is applied at all mid-IR and pump
wavelengths respectively in (b) and (c). The peak of intensity at each wavelength
traces a Gaussian profile. (d) shows the final upconverted I(ρc) for the three
experimental central mid-IR wavelengths.
We assume a uniform distribution of incoming mid-IR intensity across the entire mid-IR
angles. Figure 6.6 (a) corresponds to the integration of sinc function in equation (6.9) over

Theory and results
115
all the mid-IR angles for a particular 𝜆𝑖𝑟 = 3.206 µ𝑚 and 𝜆𝑝 = 0.804 µ𝑚. Only five
angles are shown here for representative purposes. 𝐼1 represents intensities at each mid-IR
angles and 𝐼2 represents the net intensity after integration. 𝐼2 is carried forward to the next
step of the integration. Figure 6.6 (b) shows the integration of sinc function over all mid-
IR angles and wavelengths at 𝜆𝑝 = 0.804 µ𝑚. Again, only five mid-IR wavelengths are
shown for ease of representation. The net result of integration is represented as 𝐼3 and is
used in the next step of the integration. Figure 6.6 (c) shows the complete implementation
of equation (6.9) for the calculation of 𝐼(𝜌𝑐). Only five pump wavelengths are shown here.
Gaussian spectral weighting is applied for mid-IR and pump wavelengths respectively, in
Figure 6.6 (b) and (c), with maximum weight for the central wavelength. Figure 6.6 (d)
shows the appropriately scaled upconverted intensity 𝐼(𝜌𝑐) calculated for all three central
mid-IR wavelengths taking into account the entire span of mid-IR angles, and mid-IR and
pump wavelengths – the complete implementation of equation (6.9).
Figure 6.7: Comparison of experimental and theoretical values of Δρc for the three
different mid-IR wavelengths.
In order to validate the theory, the range of crystal rotation angles for which an upconverted
signal could be measured (𝛥𝜌𝑐) was determined experimentally by rotating the crystal.
Theoretically, 𝛥𝜌𝑐 was determined by calculating the 10% width of 𝐼(𝜌𝑐) in Figure 6.6

Theory and results
116
(d). Figure 6.7 shows the comparison of experimental and theoretical values of 𝛥𝜌𝑐 plotted
for different central mid-IR wavelengths. The difference in the experimental values at
shorter mid-IR wavelengths can be attributed to the physical limitation introduced by the
optics and the size of the camera chip (not all light was captured by the camera). The
magnification factor (𝑓2𝜆𝑢𝑝)/(𝑓1𝜆𝑖𝑟), decreases with increase in mid-IR wavelength,
meaning that for a fixed object size (mid-IR beam diameter), the image size decreases with
increasing mid-IR wavelength. Due to the phase-matching condition, the upconverted
image will have rings whose diameter increases as we move away from the collinear
crystal rotation angle. Illuminating with a mid-IR beam diameter of 12 mm at the central
wavelength of 2.851 µm, the largest upconverted ring, corresponding to the farthest crystal
rotation angle, is larger than the detector area (5 x 6 mm2) and thus not detected. On the
other hand, due to lower magnification, even the largest upconverted ring falls on the
detector for the central mid-IR wavelength of 3.682 µm.
6.3.1 Angular and spectral acceptance bandwidth
The theory developed here can be used to calculate the angular and spectral acceptance
bandwidth of the upconversion process. The scaled upconverted intensity with respect to
mid-IR angles 𝐼(𝜃𝑖𝑟), for a fixed 𝜌𝑐, can be calculated by performing integration in
equation (6.9) over the entire mid-IR and pump wavelengths. Performing similar
integration over all mid-IR angles and pump wavelengths gives 𝐼(𝜆𝑖𝑟) for a fixed 𝜌𝑐.
Figure 6.8 shows the plot of scaled upconversion intensity as function of mid-IR angles
and wavelengths. The FWHM criterion is utilized to calculate the acceptance bandwidth
from the intensity profile. An angular acceptance bandwidth (𝛥𝜃𝑖𝑟) as high as 20° (at
𝜆𝑖𝑟,𝑐 = 2.851 µm) and spectral acceptance bandwidth (𝛥𝜆𝑖𝑟) as high as 147 nm (at 𝜆𝑖𝑟,𝑐 =
3.682 µm) is theoretically calculated, with both parameters highly influenced by the
reduced interaction length of the fields inside the crystal.
It is important to understand the influence of 𝑙𝑒𝑓𝑓 on the upconversion efficiency and the
acceptance parameters. The term 𝑙𝑒𝑓𝑓 outside the sinc function in equation (6.9) scales the

Theory and results
117
upconverted intensity, and consequently affects the upconversion efficiency. The sinc
function determines the acceptance bandwidth of the upconversion process, and thus 𝑙𝑒𝑓𝑓
inside the sinc function influences the acceptance parameters. For a proper choice of 𝜌𝑐 in
the current system, the large spectral bandwidth due to short pulse duration, combined with
the large acceptance bandwidth due to reduced interaction length, results in a large field-
of-view (FoV) for the upconversion imaging process.
Figure 6.8: Illustration of upconverted intensity as a function of (a) mid-IR input
angles and (b) mid-IR wavelengths. The FWHM of the intensities in (a) and (b)
provides the angular and spectral acceptance bandwidth, respectively, for the
upconversion process. The choice of ρc in (a) corresponds to the collinear case for
that particular mid-IR wavelength and that in (b) corresponds to the value at which
the peak intensity occurs at the central mid-IR wavelength used during the experiment.

Theory and results
118
GVM becomes increasingly prominent when approaching shorter pulse regimes. Table 6.1
summarizes the values of 𝑙𝑒𝑓𝑓 and its influence on efficiency and acceptance bandwidths
for different values of 𝜏 in a LiNbO3 crystal. The following assumptions have been made
for the calculation of parameters in Table 6.1: the pump beam is monochromatic, the actual
crystal length is 10 mm, and type–I phase-matching is used. Additionally, for the
calculation of angular acceptance bandwidth (𝛥𝜃), the spectral bandwidth of the source is
not considered, and for the calculation of spectral acceptance bandwidth (𝛥𝜆), only the
collinear mid-IR angle is considered.
Table 6.1: Representation of values of leff for different values of temporal overlap τ
and indication of how it affects various upconversion parameters. ns: nanosecond,
ps: picosecond, fs: femtosecond. The calculations are performed for a pump
wavelength of 0.804 µm and a mid-IR wavelength of 3.206 µm. The efficiency for a
monochromatic collinear plane wave (ηMCP) case at τ = 1 ns is assumed to be 1. Δθ
and Δλ represents the acceptance parameters. ηT represents the arbitrary total
efficiency for the ultrashort-pulsed upconversion system.
τ leff (mm) ηMCP Δθ (degree) Δλ (µm) ηT
1 ns 10 1 3.32 0.01 0.11
100 ps 10 1 3.32 0.01 0.11
1 ps 4.7 2.2 × 10⁻¹ 4.76 0.02 0.099
500 fs 2.3 5.3 × 10⁻² 6.67 0.04 0.094
100 fs 0.47 2.2 × 10⁻³ 14.81 0.2 0.097
50 fs 0.23 5.3 × 10⁻⁴ 20.98 0.394 0.092
From Table 6.1, it is evident that 𝑙𝑒𝑓𝑓 reduces considerably for shorter pulse durations.
This, in turn, leads to a significant reduction in the monochromatic collinear plane wave
(MCP) upconversion efficiency as a result of its square dependence on 𝑙𝑒𝑓𝑓. Nevertheless,
reduced 𝑙𝑒𝑓𝑓 leads to increased 𝛥𝜃 and 𝛥𝜆. The overall efficiency for the upconversion
process can be roughly estimated using the relation
2
T MCP (6.10)

Theory and results
119
It is important here to emphasize that the overall efficiency remains almost constant even
though 𝜂𝑀𝐶𝑃 decreases with overlap duration. This indicates that the reduction in
efficiency due to reduced interaction length is almost entirely compensated by the increase
in angular and spectral acceptance bandwidth, provided the spectral bandwidth of the
source is greater than or equal to 𝛥𝜆 and that the incoming mid-IR angles is spread over
an angular range greater than or equal to 𝛥𝜃. Measuring the mid-IR and upconverted power
enables us to calculate the conversion efficiency of the process. The ratio of the number of
upconverted photons to the number of mid-IR photons gives the experimental quantum
efficiency, which was found to be of the order of 10−5 for the current experiment. The
large value for angular acceptance bandwidth can enable single-shot upconversion imaging
with a wide FoV without any alterations to the phase-match condition, for example, by
rotation of the crystal. Likewise, the large value of spectral acceptance bandwidth makes
ultrashort-pulsed upconversion technique highly interesting for broadband spectroscopy.
6.3.2 Imaging resolution for an ultrashort-pulsed upconversion system
The following section deals with the resolution characteristics of an ultrashort-pulsed
upconversion imaging system. Resolution is an important parameter of any imaging
system; it is often defined as the ability of the system to distinguish two adjacent features
in the object plane when imaged. A detailed theory of upconversion imaging for incoherent
non-collinear illumination is discussed in [129,164]. Since the upconversion takes place in
the Fourier plane of the 4f imaging configuration, the Gaussian pump beam at the crystal
acts as a soft aperture during imaging (see Figure 6.2), thus limiting the spatial resolution
of the system [129,164,165]. Recalling the Rayleigh criterion for resolution and using the
Gaussian point spread function (PSF), which is here defined as the absolute square of the
Fourier transform of the Gaussian pump electric field, we can define the maximum
theoretical resolution to be 1 ∕ ⅇ diameter of the PSF. This can be expressed as
122ir
p
fR
D
(6.11)
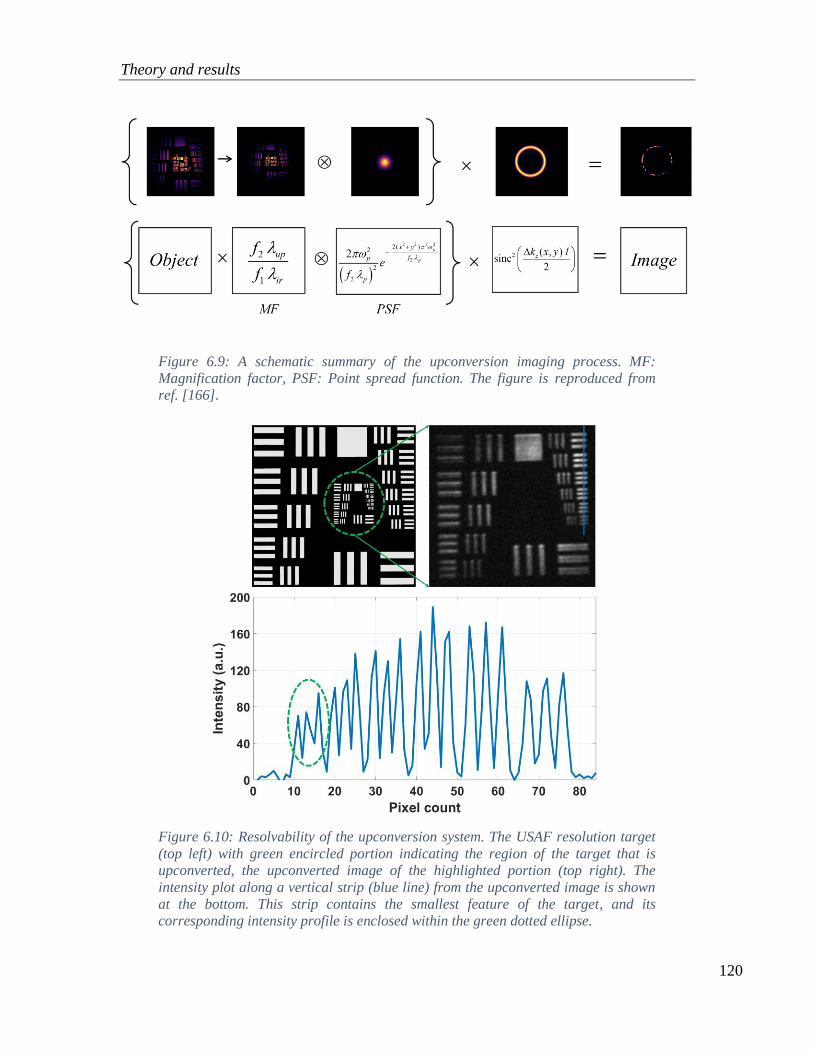
Theory and results
120
Figure 6.9: A schematic summary of the upconversion imaging process. MF:
Magnification factor, PSF: Point spread function. The figure is reproduced from
ref. [166].
Figure 6.10: Resolvability of the upconversion system. The USAF resolution target
(top left) with green encircled portion indicating the region of the target that is
upconverted, the upconverted image of the highlighted portion (top right). The
intensity plot along a vertical strip (blue line) from the upconverted image is shown
at the bottom. This strip contains the smallest feature of the target, and its
corresponding intensity profile is enclosed within the green dotted ellipse.

Theory and results
121
where R denotes the resolution in the object plane, 𝐷𝑝 denotes the pump beam diameter
(2.6 mm) in the crystal, and 𝑓1 denotes the focal length of the imaging lens. Figure 6.9
summarizes the whole Fourier plane 4f upconversion imaging system. MF represents the
upconversion magnification/demagnification factor set by the ratio of the focal length of
the imaging lenses and the wavelengths of the upconverted and mid-IR fields. The pump
beam soft aperture at the crystal sets the PSF of the imaging system. Without the nonlinear
crystal in the Fourier plane, the image is formed as the convolution of the
magnified/demagnified image with the PSF. The nonlinear crystal imposes phase matching
condition on the imaging process, which results in upconverted ring-like features, which
is obtained by multiplying the image with the sinc intensity function.
Substituting the experimental values into equation (6.11), the maximum resolution of the
system is found to be 56 µm at a mid-IR wavelength of 3.206 µm. Figure 6.10 shows the
upconverted image of a USAF resolution target captured with 0.47 ms integration time.
The smallest feature in the resolution target is 14.25 lines/mm (70.16 µm). The calculated
resolution is lower than this value, and the smallest features are clearly resolved with a
fringe visibility of the lines being greater than the Rayleigh limit, as shown in Figure 6.10.
The amount of blurring in the image plane for a point in the object plane is set by the 1 ∕ ⅇ
diameter of the Gaussian PSF (~22 µm). When converted using the magnification factor,
this diameter gives the blurring in the object plane, as calculated from equation (6.11). The
blurring due to the PSF is uniform throughout the image plane.
6.3.2.1 Chromatic blurring effect
For an ultrashort-pulsed upconversion imaging system such as the femtosecond system
under consideration, the spectral acceptance bandwidth is large compared to a CW system,
due to the reduced effective interaction length. Recalling the earlier assumption that the
transverse phase-mismatch is zero, the relation between the mid-IR and upconverted angle
inside the crystal is governed by equation (6.4), showing that each input mid-IR angle has
a uniquely defined upconverted angle. This one-to-one correspondence between a point in
the object plane and a point in the image plane is not valid for broad spectral acceptance

Theory and results
122
bandwidths wherein a particular object point transforms into a set of upconverted angles.
Figure 6.11 illustrates the spread of the upconverted angles for different upconverted
spectral components corresponding to a particular fixed point in the object plane. A large
spectral acceptance bandwidth for the mid-IR (red dotted line) results in �⃗� 𝑢𝑝 being spread
over an angular range of 𝛥𝜃𝑢𝑝, as a result of the different magnification for different
wavelength components, as shown in Figure 6.11 (a). For the collinear case (𝜃𝑖𝑟 = 0), the
upconverted angular spread is always zero, independent of the spectral acceptance
bandwidth. Further away from the center, the spread in the upconverted angles, represented
by 𝛥𝜃𝑢𝑝, becomes more pronounced, introducing blurring in the image plane. This
chromatic blurring effect has, to our best knowledge, never been discussed in the literature.
Considering a cone of mid-IR light incident on the crystal, as shown in Figure 6.11(b),
𝛥𝜃𝑢𝑝 translates it into a spread in the image plane, 𝛥𝑟. The result is a blurring, by an
amount of 𝛥𝑟 in the radial direction of the image plane, which we refer to as chromatic
blurring.
Figure 6.11: Illustration of chromatic blurring for broadband mid-IR light and a
broad nonlinear acceptance bandwidth. (a) is a vectorial representation of the
chromatic blurring effect. (b) shows the effect of a cone of incoming IR angles being
transferred as a blurred cone in the image plane. IP: Image plane.
As we move to the ultrashort-pulse regime, the net blurring in the image plane becomes a
combination of the blurring due to PSF and the chromatic blurring. Hence, the blurring for
the ultrashort-pulsed upconversion imaging can be considered as the non-uniform radial
blurring in the image. The blurring at the center of the image is dictated by the PSF, while

Theory and results
123
moving away from the center, an additional contribution due to chromatic blurring leads
to increased blurring in the radial direction. The magnification factor can be suitably used
to convert the blurring in the image plane to that in the object plane.
Figure 6.12: Illustration of the net blurring effect. (a) shows the upconverted image.
The dotted yellow circle shows the uncertainty of the collinear point. The four
numbered sections correspond to four different locations in the image whose intensity
vs. pixel plot along the red and blue lines is given at the bottom. Red corresponds to
a tangential feature, whereas blue corresponds to a radial feature with respect to the
center. One pixel in the camera corresponds to 10 × 10 µm. (b) shows the qualitative
indication of net blurring at different locations in the image plane. (c) is a plot of the
blurring in the object plane from due to the PSF and chromatic blurring.
Figure 6.12 shows the qualitative indication of the blurring observed experimentally, as
well as the theoretical estimate of the net blurring. The radial blurring is qualitatively seen
in the upconverted image shown in Figure 6.12(a), wherein the transition from the dark

Conclusion
124
section to the bright portion in the features is clearly more blurred in the radial direction
than in the tangential direction, and more so at larger distances from the center. Radial
(chromatic) blurring is seen at positions 1, 2, and 3; however, less pronounced close to the
center (4), see Figure 6.12(a), which is consistent with the theory. A qualitative simulation
of the radial increase in blurring in the image plane is shown in Figure 6.12(b). This
simulation is shown only to guide the readers on the radial increase of the chromatic
blurring based on the geometry in Figure 6.11. Figure 6.12 (c) shows the values of the
different contributions to the blurring in the object plane. The blurring from the PSF is
uniform over the entire FoV, while the chromatic blurring increases radially from the
center with a minimum value of zero at the center. The value of the chromatic blurring is
calculated here for 𝜆𝑖𝑟,𝑐 = 3.206 µm case and the acceptance parameters derived from the
model (see Figure 6.8). In the upconverted image in Figure 6.10, the smallest features in
the resolution target were aligned to match the collinear phase-matched region, which
allows evaluation of the maximum resolution of the system. The upconverted image in
Figure 6.10 was cropped to focus on the smallest features. The chromatic blurring effect
is not visible here due to the close proximity to the collinear region.
Another important parameter characterizing the quality of an imaging system is the
maximum number of resolvable elements (MRE), which is the ratio of FoV area to the area
of the smallest resolvable element. Since the blurring in the image plane, and consequently
the size of the smallest resolvable element, is non-uniform for the ultrashort-pulsed
upconversion imaging system, it is impractical to determine a definitive value for MRE
here. Nevertheless, a maximum resolution of 56 µm is achievable in the collinear region
using the current upconversion setup.
6.4 Conclusion
A femtosecond mid-IR upconversion imaging system has been successfully demonstrated
for the first time, using a nonlinear crystal placed in the Fourier plane of a 4𝑓 setup. The
same pump source for generation and detection ensured temporal overlap of pulses inside
the nonlinear crystal used for upconversion, thus resulting in high conversion efficiency
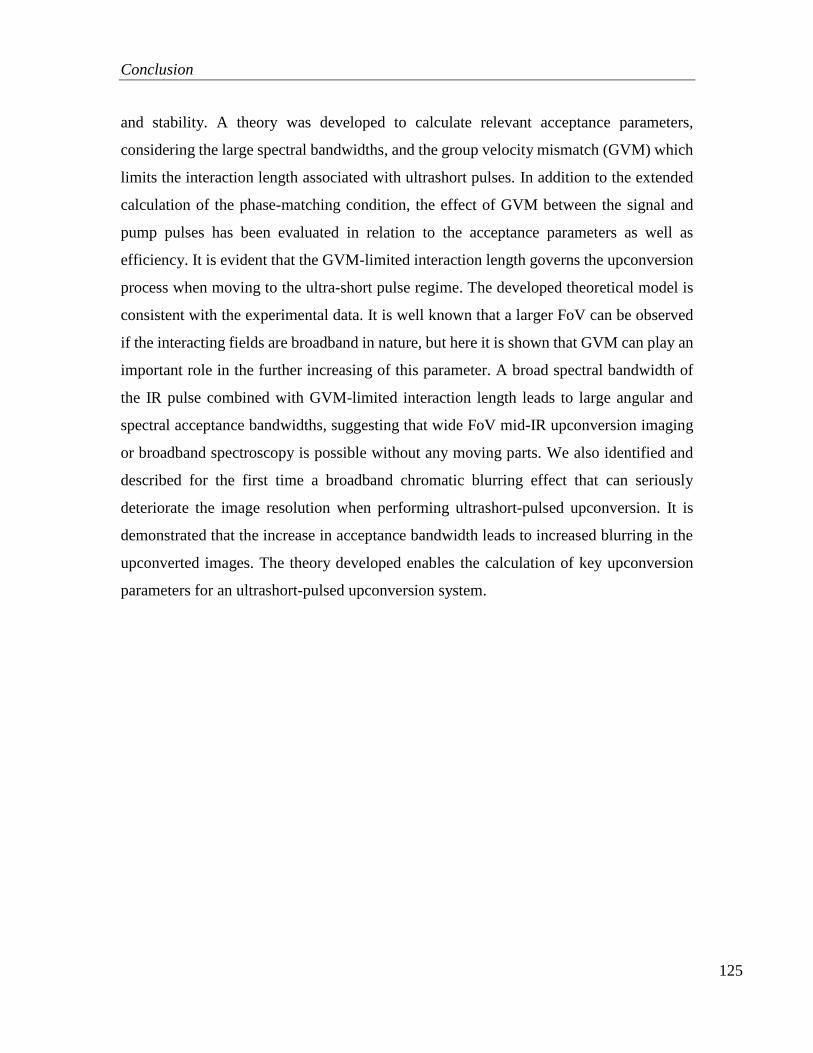
Conclusion
125
and stability. A theory was developed to calculate relevant acceptance parameters,
considering the large spectral bandwidths, and the group velocity mismatch (GVM) which
limits the interaction length associated with ultrashort pulses. In addition to the extended
calculation of the phase-matching condition, the effect of GVM between the signal and
pump pulses has been evaluated in relation to the acceptance parameters as well as
efficiency. It is evident that the GVM-limited interaction length governs the upconversion
process when moving to the ultra-short pulse regime. The developed theoretical model is
consistent with the experimental data. It is well known that a larger FoV can be observed
if the interacting fields are broadband in nature, but here it is shown that GVM can play an
important role in the further increasing of this parameter. A broad spectral bandwidth of
the IR pulse combined with GVM-limited interaction length leads to large angular and
spectral acceptance bandwidths, suggesting that wide FoV mid-IR upconversion imaging
or broadband spectroscopy is possible without any moving parts. We also identified and
described for the first time a broadband chromatic blurring effect that can seriously
deteriorate the image resolution when performing ultrashort-pulsed upconversion. It is
demonstrated that the increase in acceptance bandwidth leads to increased blurring in the
upconverted images. The theory developed enables the calculation of key upconversion
parameters for an ultrashort-pulsed upconversion system.

126
127
7 Summary and Outlook
‘‘The characteristic of scientific progress is our knowing that we did
not know.’’
G. Bachelard
his chapter concludes the three-year Ph.D. work by summarizing the major
achievements and discussing the possible improvements and directions in which the
research could continue in the future. As the title of this Ph.D. suggests, the overall
objective of this work was to understand the performance of parametric mid-IR light
generation and detection systems in the short-pulsed regime.
7.1 Summary
Chapter three to five describes the development and detailed investigation of a nanosecond
pulsed mid-IR light source, while chapter six discusses the performance of a femtosecond
mid-IR upconversion imaging system. Major highlights in this work are summarized as
follows:
1. The third chapter discusses mid-IR light generation through SPDC, in the saturated
gain regime using a passively Q-switched laser at 1030 nm. With the high pump
intensity available for the SPDC process, we observed strong pump depletion due
to the extremely high parametric gain. This led to gain saturation, thus SPDC
generation in the saturated regime. We developed, for the first time to the best of
our knowledge, a theoretical model for SPDC generation in the saturated regime
T
Summary
128
by modifying the classical small-signal SPDC model. The model was capable of
accurately predicting SPDC signal power and signal spectral evolution observed
experimentally. The model was then used to simulate the idler spectra.
2. The fourth chapter discusses the quantification of the noise in the SPDC light
source. We believe this to be the first attempt at quantifying the pulse-to-pulse
spectral intensity stability for an SPDC light source. A scheme was devised to
record the pulse-to-pulse signal spectra as well as the pump spatial profile
simultaneously. Statistical analysis of the pulse-to-pulse data, in terms of
coefficient of variation, revealed interesting findings. The high pulse-to-pulse
spatial intensity stability for the pump does not ensure high spectral intensity
stability for the signal, even for the highest pump energy. Further, the spectral
intensity stability saturates moving away from the threshold. The reported values
of the coefficient of variation are essential when using the light source for
spectroscopic applications.
3. The fifth chapter discusses a tunable SPDC light source based on a fan-out PPLN
crystal. The fan-out crystal allows rapid and continuous tunability across the 1.4 to
4 µm by transverse translation of the crystal. An upconversion spectrometer was
used to characterize the SPDC idler spectral properties. Statistical analysis of the
pulse-to-pulse idler energy showed excellent agreement with the results reported
in chapter four. The idler center wavelength versus crystal position measurement
was highly repeatable for multiple crystal scans, thus allowing us to derive an
expression for the idler center wavelength as a function of transverse position in
the PPLN crystal. An absorption measurement was demonstrated using a simple
setup without using a traditional spectrometer. Presently, the idler bandwidth limits
the spectral resolution of the system.
4. In contrast to the discussions in the three previous chapters, where frequency down-
conversion was utilized for mid-IR light generation, chapter six describes mid-IR

Outlook
129
light detection for femtosecond pulses using frequency upconversion. A theoretical
model to describe the various properties of an ultrashort pulsed upconversion
system was developed for the first time. It was observed that the reduced interaction
length due to the ultrashort pulse duration of interacting pulses led to a significant
increase in the spectral and angular acceptance bandwidth for the upconversion
process. This supports broadband spectroscopy and wide field-of-view imaging
without any change in the phase-matching conditions. For the first time, we also
reported chromatic blurring effects that deteriorate the imaging quality when
performing femtosecond upconversion imaging.
7.2 Outlook
After three years spent on this thesis work and the technical knowledge gained, I would
like to propose a few suggestions on how the research could be further progressed in the
future.
Mid-IR SPDC light source could be further explored, for example, to determine the
maximum possible spectral brightness achievable. We observe saturation for the collinear
modes as pump energy increases, but could this saturation level be increased by increasing,
for example, the pump intensity. Furthermore, it would be interesting to determine the
ACE function experimentally by measuring the growth in signal power as a function of the
detector acceptance angle (𝜃𝑚𝑎𝑥). This could validate the presently used ACE function or
propose an even better ACE function. It would also be interesting to experimentally
measure the SPDC bandwidth as a function of gain far below the SPDC threshold, i.e., in
the extremely small signal regime.
The noise study itself, or the methodology to quantify the noise, could serve as a starting
point for researchers to model the noise performance for SPDC light sources specifically
for the saturated regime where we have macroscopic light generation. If there is a
possibility to operate the system even further above the SPDC threshold (we ran the system

Outlook
130
roughly 2.4 times above the threshold), it would be interesting to see if the saturation trend
observed in the pulse-to-pulse spectral intensity noise still exists.
With the extremely high gain available for the SPDC process, it is quite natural to envision
the use of different crystals for phase matching different sections of the mid-IR spectrum.
This possibility would be further enhanced if we have pump lasers with similar peak power
performance but at different/longer pump wavelengths. The choice of crystals include,
among many other, AgGaSe2 (AGSE), the newly developed BaGa4Se7 (BGSE), and
BaGa2GeSe6 (BGGSE), the latter two of which can extend tuning to roughly 20 µm.
However, one has to be mindful of the damage threshold of the crystals when aiming for
higher gain.
An interesting application for the femtosecond pulsed upconversion system could be to
demonstrate pump-probe experimental capabilities, including imaging. The femtosecond
upconversion work was carried out at our collaborator's lab in ICFO, Barcelona, Spain.
The initial plan was to perform pump-probe experiments. Unfortunately, this could not be
carried out due to the coronavirus situation. Broad angular and spectral acceptance for the
ultrashort pulsed upconversion will be beneficial for wide field-of-view imaging and
broadband spectroscopy. I feel it would also be worth investigating the possibility to
correct for the chromatic blurring effect post-acquisition. This would indeed need a
detailed study, quantitatively investigating the chromatic blurring effect.

131

132
Appendix
In this section, we derive the expression for the theoretical crystal position versus idler
center wavelength, the result of which is shown in section 5.3.3. Taking into account the
transverse dimension and periodicity of the crystal (1 meter crystal translation corresponds
to 0.3334 mm change in grating periodicity), we can have an expression for the crystal
position as a function of the poling period as
,
3
)(
0.3334 10
ref i ref
posx
(1)
All the values are in meters. The value 𝛬𝑟𝑒𝑓 represents the reference value of poling
periodicity for a particular reference wavelength (𝜆𝑖,𝑟𝑒𝑓) such that 𝑥𝑝𝑜𝑠 is zero. 𝑥𝑝𝑜𝑠
represents the relative crystal translation position. The modulus in the numerator in the
above equation is to always have a positive 𝑥𝑝𝑜𝑠 value. From the collinear phase matching
condition, an expression for the poling periodicity is given as
2
1
1 25 25ep es ei
p s i
n n nT T
(2)
The above equation includes the temperature-dependent expansion of the material, hence
the change in periodicity, following the Sellmeier equation in ref. [138]. Combining
equation (1) and (2), the expression for the theoretical crystal position as a function of
wavelength is given as

133
,
2
3
1
1 25
( )
( )3
25
100.33 4
ref i ref
ep es ei
p s i
pos i offset
n n
x
nT T
x
(3)
Note that the 𝑥𝑜𝑓𝑓𝑠𝑒𝑡 in equation (3) corresponds to the correction factor needed to match
the 𝑥𝑝𝑜𝑠 in equation (1) to the relative crystal position in the laboratory frame of reference.
The smallest idler wavelength from the experimental data in Figure 5.7 corresponds to
3.0346 µm. This is used as the starting point to calculate 𝛬𝑟𝑒𝑓 which is then equal to 29.607
µm. An offset of 6.65 mm is used to obtain the theoretical curve in Figure 5.7 so that the
experimental and theoretical curves overlap at the center.

134

135
References
1. W. Herschel, "XIV. Experiments on the refrangibility of the invisible rays of the
sun," Philos. Trans. R. Soc. Lond. 90, 284–292 (1800).
2. A. Rogalski, Infrared Detectors (CRC Press, 2010).
3. "Mid-IR Spectroscopic Sensing," https://www.osa-
opn.org/home/articles/volume_30/june_2019/features/mid-
ir_spectroscopic_sensing/.
4. "LaserFest | Nobel Laureates," http://laserfest.org/lasers/pioneers/nobel.cfm.
5. E. Schrödinger, "Non-Linear Optics," Proc. R. Ir. Acad. Sect. Math. Phys. Sci. 47,
77–117 (1941).
6. P. L. Hanst, "Infrared Spectroscopy and Infrared Lasers in Air Pollution Research
and Monitoring," Appl. Spectrosc. 24, 161–174 (1970).
7. R. Haus, K. Schafer, W. Bautzer, J. Heland, H. Mosebach, H. Bittner, and T.
Eisenmann, "Mobile Fourier-transform infrared spectroscopy monitoring of air
pollution," 8 (n.d.).
8. U. Willer, M. Saraji, A. Khorsandi, P. Geiser, and W. Schade, "Near- and mid-
infrared laser monitoring of industrial processes, environment and security
applications," Opt. Lasers Eng. 12 (2006).
9. K. Isensee, N. Kröger-Lui, and W. Petrich, "Biomedical applications of mid-
infrared quantum cascade lasers – a review," The Analyst 143, 5888–5911 (2018).
10. F. Toor, S. Jackson, X. Shang, S. Arafin, and H. Yang, "Mid-infrared Lasers for
Medical Applications: introduction to the feature issue," Biomed. Opt. Express 9,
6255 (2018).
11. R. Bhargava, "Towards a practical Fourier transform infrared chemical imaging
protocol for cancer histopathology," Anal. Bioanal. Chem. 389, 1155–1169 (2007).
12. G. Shetty, C. Kendall, N. Shepherd, N. Stone, and H. Barr, "Raman spectroscopy:
elucidation of biochemical changes in carcinogenesis of oesophagus," Br. J. Cancer
94, 1460–1464 (2006).

136
13. S. Kumar, C. Desmedt, D. Larsimont, C. Sotiriou, and E. Goormaghtigh, "Change
in the microenvironment of breast cancer studied by FTIR imaging," Analyst 138,
4058–4065 (2013).
14. M. Hermes, R. B. Morrish, L. Huot, L. Meng, S. Junaid, J. Tomko, G. R. Lloyd, W.
T. Masselink, P. Tidemand-Lichtenberg, C. Pedersen, F. Palombo, and N. Stone,
"Mid-IR hyperspectral imaging for label-free histopathology and cytology," J. Opt.
20, 023002 (2018).
15. C. Corsi, "Infrared: A Key Technology for Security Systems," Adv. Opt. Technol.
2012, 1–15 (2012).
16. M. Ebrahim-Zadeh and I. T. Sorokina, Mid-Infrared Coherent Sources and
Applications (Springer, 2007).
17. J. Chalmers and P. Griffiths, Handbook of Vibrational Spectroscopy, 5 Volumes
Set. (Wiley, 2002).
18. J. S. Dam, P. Tidemand-Lichtenberg, and C. Pedersen, "Room-temperature mid-
infrared single-photon spectral imaging," Nat. Photonics 6, 788–793 (2012).
19. J. W. Petrich and J. L. Martin, "Ultrafast absorption and Raman spectroscopy of
hemeproteins," Chem. Phys. 131, 31–47 (1989).
20. L. Meng, "Upconversion Detector for Remote Gas Sensing," (2018).
21. L. Høgstedt, "Parametric Processes for Generation and Low Noise Detection of
Infrared Light: Experimental and Numerical Investigation of Fundamental
Parameters for the Design of PPLN-based Light Sources and Detector Systems,"
(2016).
22. O. Rodenko, "UV light source for next generation immunoassay analyzer," (2018).
23. T. H. MAIMAN, "Stimulated Optical Radiation in Ruby," Nature 187, 493–494
(1960).
24. P. A. Franken, A. E. Hill, C. W. Peters, and G. Weinreich, "Generation of Optical
Harmonics," Phys. Rev. Lett. 7, 118–119 (1961).
25. C. V. RAMAN and K. S. KRISHNAN, "A New Type of Secondary Radiation,"
Nature 121, 501–502 (1928).
26. R. C. Gray, "The Rev. John Kerr, F.R.S., Inventor of the Kerr Cell," Nature 136,
245–247 (1935).

137
27. G. N. Lewis, D. Lipkin, and T. T. Magel, "Reversible Photochemical Processes in
Rigid Media. A Study of the Phosphorescent State," J. Am. Chem. Soc. 63, 3005–
3018 (1941).
28. D. A. Kleinman, "Nonlinear Dielectric Polarization in Optical Media," Phys. Rev.
126, 1977–1979 (1962).
29. J. A. Armstrong, N. Bloembergen, J. Ducuing, and P. S. Pershan, "Interactions
between Light Waves in a Nonlinear Dielectric," Phys. Rev. 127, 1918–1939
(1962).
30. J. A. Giordmaine, "Mixing of Light Beams in Crystals," Phys. Rev. Lett. 8, 19–20
(1962).
31. P. D. Maker, R. W. Terhune, M. Nisenoff, and C. M. Savage, "Effects of Dispersion
and Focusing on the Production of Optical Harmonics," Phys. Rev. Lett. 8, 21–22
(1962).
32. G. D. Boyd and D. A. Kleinman, "Parametric Interaction of Focused Gaussian Light
Beams," J. Appl. Phys. 39, 3597–3639 (1968).
33. A. W. Smith and N. Braslau, "Optical Mixing of Coherent and Incoherent Light
[Letter to the Editor]," IBM J. Res. Dev. 6, 361–362 (1962).
34. J. E. Midwinter and J. Warner, "Up‐Conversion of Near Infrared to Visible
Radiation in Lithium‐meta‐Niobate," J. Appl. Phys. 38, 519–523 (1967).
35. J. E. Midwinter, "IMAGE CONVERSION FROM 1.6 μ TO THE VISIBLE IN
LITHIUM NIOBATE," Appl. Phys. Lett. 12, 68–70 (1968).
36. J. Warner, "SPATIAL RESOLUTION MEASUREMENTS IN UP‐
CONVERSION FROM 10.6 m TO THE VISIBLE," Appl. Phys. Lett. 13, 360–362
(1968).
37. R. Andrews, "Wide angular aperture image up-conversion," IEEE J. Quantum
Electron. 5, 548–550 (1969).
38. R. F. Lucy, "Infrared to Visible Parametric Upconversion," Appl. Opt. 11, 1329–
1336 (1972).
39. J. Midwinter, "Parametric infrared image converters," IEEE J. Quantum Electron.
4, 716–720 (1968).

138
40. A. H. Firester, "Upconversion: Imaging with Planar and Spherical Pump Beams,"
Appl. Opt. 9, 2266–2268 (1970).
41. G. D. Boyd, W. B. Gandrud, and E. Buehler, "PHASE‐MATCHED UP
CONVERSION OF 10.6‐μ RADIATION IN ZnGeP2," Appl. Phys. Lett. 18, 446–
448 (1971).
42. J. Falk and W. B. Tiffany, "Theory of parametric upconversion of thermal images,"
J. Appl. Phys. 43, 3762–3769 (1972).
43. J. Falk and J. M. Yarborough, "Detection of Room‐Temperature Blackbody
Radiation by Parametric Upconversion," Appl. Phys. Lett. 19, 68–70 (1971).
44. T. R. GURSKI, H. W. EPPS, and S. P. MARAN, "Astronomical demonstration of
an infrared upconverter," Nature 249, 638–639 (1974).
45. M. M. Abbas, T. Kostiuk, and K. W. Ogilvie, "Infrared upconversion for
astronomical applications," Appl. Opt. 15, 961–970 (1976).
46. J. Falk and Y. C. See, "Internal cw parametric upconversion," Appl. Phys. Lett. 32,
100–101 (1978).
47. Robert W. Boyd, "Infrared Upconversion for Astronomy," Opt. Eng. 16, 563–568
(1977).
48. A. Szilagyi, A. Hordvik, and H. Schlossberg, "A quasi‐phase‐matching technique
for efficient optical mixing and frequency doubling," J. Appl. Phys. 47, 2025–2032
(1976).
49. D. Feng, N. Ming, J. Hong, Y. Yang, J. Zhu, Z. Yang, and Y. Wang, "Enhancement
of second‐harmonic generation in LiNbO3 crystals with periodic laminar
ferroelectric domains," Appl. Phys. Lett. 37, 607–609 (1980).
50. M. M. Fejer, G. A. Magel, D. H. Jundt, and R. L. Byer, "Quasi-phase-matched
second harmonic generation: tuning and tolerances," IEEE J. Quantum Electron. 28,
2631–2654 (1992).
51. R. V. Roussev, C. Langrock, J. R. Kurz, and M. M. Fejer, "Periodically poled
lithium niobate waveguide sum-frequency generator for efficient single-photon
detection at communication wavelengths," Opt. Lett. 29, 1518–1520 (2004).
52. H. Pan, H. Dong, H. Zeng, and W. Lu, "Efficient single-photon counting at 1.55μm
by intracavity frequency upconversion in a unidirectional ring laser," Appl. Phys.
Lett. 89, 191108 (2006).
139
53. H. Dong, H. Pan, Y. Li, E. Wu, and H. Zeng, "Efficient single-photon frequency
upconversion at 1.06 μm with ultralow background counts," Appl. Phys. Lett. 93,
071101 (2008).
54. C. Pedersen, E. Karamehmedović, J. S. Dam, and P. Tidemand-Lichtenberg,
"Enhanced 2D-image upconversion using solid-state lasers," Opt. Express 17,
20885–20890 (2009).
55. J. S. Dam, C. Pedersen, and P. Tidemand-Lichtenberg, "High-resolution two-
dimensional image upconversion of incoherent light," Opt. Lett. 35, 3796–3798
(2010).
56. L. Høgstedt, A. Fix, M. Wirth, C. Pedersen, and P. Tidemand-Lichtenberg,
"Upconversion-based lidar measurements of atmospheric CO_2," Opt. Express 24,
5152 (2016).
57. L. Meng, A. Fix, M. Wirth, L. Høgstedt, P. Tidemand-Lichtenberg, C. Pedersen,
and P. J. Rodrigo, "Upconversion detector for range-resolved DIAL measurement
of atmospheric CH 4," Opt. Express 26, 3850 (2018).
58. S. Junaid, J. Tomko, M. P. Semtsiv, J. Kischkat, W. T. Masselink, C. Pedersen, and
P. Tidemand-Lichtenberg, "Mid-infrared upconversion based hyperspectral
imaging," Opt. Express 26, 2203–2211 (2018).
59. S. Junaid, S. Chaitanya Kumar, M. Mathez, M. Hermes, N. Stone, N. Shepherd, M.
Ebrahim-Zadeh, P. Tidemand-Lichtenberg, and C. Pedersen, "Video-rate, mid-
infrared hyperspectral upconversion imaging," Optica 6, 702 (2019).
60. Y.-P. Tseng, P. Bouzy, C. Pedersen, N. Stone, and P. Tidemand-Lichtenberg,
"Upconversion raster scanning microscope for long-wavelength infrared imaging of
breast cancer microcalcifications," Biomed. Opt. Express 9, 4979 (2018).
61. P. J. Rodrigo, L. Høgstedt, S. M. M. Friis, L. R. Lindvold, P. Tidemand-
Lichtenberg, and C. Pedersen, "Room-Temperature, High-SNR Upconversion
Spectrometer in the 6–12 µm Region," Laser Photonics Rev. 15, 2000443 (2021).
62. A. Barh, P. J. Rodrigo, L. Meng, C. Pedersen, and P. Tidemand-Lichtenberg,
"Parametric upconversion imaging and its applications," Adv. Opt. Photonics 11,
952–1019 (2019).
63. H. Maestre, A. J. Torregrosa, and J. Capmany, "IR Image upconversion using band-
limited ASE illumination fiber sources," Opt. Express 24, 8581 (2016).
140
64. H. Maestre, A. J. Torregrosa, C. R. Fernández-Pousa, and J. Capmany, "IR-to-
visible image upconverter under nonlinear crystal thermal gradient operation," Opt.
Express 26, 1133–1144 (2018).
65. R. Demur, R. Garioud, A. Grisard, E. Lallier, L. Leviandier, L. Morvan, N. Treps,
and C. Fabre, "Near-infrared to visible upconversion imaging using a broadband
pump laser," Opt. Express 26, 13252–13263 (2018).
66. S. Wolf, T. Trendle, J. Kiessling, J. Herbst, K. Buse, and F. Kühnemann, "Self-
gated mid-infrared short pulse upconversion detection for gas sensing," Opt.
Express 25, 24459–24468 (2017).
67. D. Magde and M. W. Windsor, "Picosecond flash photolysis and spectroscopy:
3,3′-diethyloxadicarbocyanine iodide (DODCI)," Chem. Phys. Lett. 27, 31–36
(1974).
68. D. Magde, M. W. Windsor, D. Holten, and M. Gouterman, "Picosecond flash
photolysis: Transient absorption in Sn(IV), Pd(II), and Cu(II) porphyrins," Chem.
Phys. Lett. 29, 183–188 (1974).
69. B. I. Greene, R. M. Hochstrasser, and R. B. Weisman, "Picosecond transient
spectroscopy of molecules in solution," J. Chem. Phys. 70, 1247–1259 (1979).
70. A. Fendt, W. Kranitzky, A. Laubereau, and W. Kaiser, "Efficient generation of
tunable subpicosecond pulses in the infrared," Opt. Commun. 28, 142–146 (1979).
71. A. Seilmeier, W. Kaiser, and A. Laubereau, "Vibrational combination states of
polyatomic molecules investigated by ultrashort two-pulse spectroscopy," Opt.
Commun. 26, 441–445 (1978).
72. K. G. Spears, X. Zhu, X. Yang, and L. Wang, "Picosecond infrared generation from
Nd: YAG and a visible, short cavity dye laser," Opt. Commun. 66, 167–171 (1988).
73. T. M. Jedju and L. Rothberg, "Picosecond time-resolved absorption in the mid-
infrared by seeded optical parametric generation," Appl. Opt. 26, 2877–2880
(1987).
74. T. M. Jedju, L. Rothberg, and A. Labrie, "Subpicosecond time-resolved vibrational
spectroscopy by transient infrared absorption," Opt. Lett. 13, 961–963 (1988).
75. R. Moore, F. E. Doany, E. J. Heilweil, and R. M. Hochstrasser, "Picosecond time-
resolved fluorescence spectroscopy of molecular vapors," J. Phys. Chem. 88, 876–
879 (1984).

141
76. J. N. Moore, P. A. Hansen, and R. M. Hochstrasser, "A new method for picosecond
time-resolved infrared spectroscopy: applications to CO photodissociation from iron
porphyrins," Chem. Phys. Lett. 138, 110–114 (1987).
77. H. Graener, T. Q. Ye, and A. Laubereau, "Ultrafast dynamics of hydrogen bonds
directly observed by time‐resolved infrared spectroscopy," J. Chem. Phys. 90,
3413–3416 (1989).
78. E. J. Heilweil, "Ultrashort-pulse multichannel infrared spectroscopy using
broadband frequency conversion in LiIO3," Opt. Lett. 14, 551–553 (1989).
79. T. P. Dougherty and E. J. Heilweil, "Dual-beam subpicosecond broadband infrared
spectrometer," Opt. Lett. 19, 129–131 (1994).
80. L. A. Hallidy and M. R. Topp, "Picosecond luminescence detection using type-II
phase-matched frequency conversion," Chem. Phys. Lett. 46, 8–14 (1977).
81. L. Hallidy and M. Topp, "Picosecond optical pulse sampling by frequency
conversion. Studies of solvent-induced molecular relaxation," J. Phys. Chem. 82,
2273–2277 (1978).
82. M. A. Kahlow, W. Jarzȩba, T. P. DuBruil, and P. F. Barbara, "Ultrafast emission
spectroscopy in the ultraviolet by time‐gated upconversion," Rev. Sci. Instrum. 59,
1098–1109 (1988).
83. P. Changenet, H. Zhang, M. J. Van der Meer, K. J. Hellingwerf, and M. Glasbeek,
"Subpicosecond fluorescence upconversion measurements of primary events in
yellow proteins," Chem. Phys. Lett. 282, 276–282 (1998).
84. J. T. Kennis, B. Gobets, I. H. van Stokkum, J. P. Dekker, R. van Grondelle, and G.
R. Fleming, "Light harvesting by chlorophylls and carotenoids in the photosystem I
core complex of Synechococcus elongatus: a fluorescence upconversion study," J.
Phys. Chem. B 105, 4485–4494 (2001).
85. J. Xu, D. Toptygin, K. J. Graver, R. A. Albertini, R. S. Savtchenko, N. D. Meadow,
S. Roseman, P. R. Callis, L. Brand, and J. R. Knutson, "Ultrafast fluorescence
dynamics of tryptophan in the proteins monellin and IIAGlc," J. Am. Chem. Soc.
128, 1214–1221 (2006).
86. J. Xu and J. R. Knutson, "Chapter 8 Ultrafast Fluorescence Spectroscopy via
Upconversion: Applications to Biophysics," in Methods in Enzymology (Academic
Press, 2008), Vol. 450, pp. 159–183.

142
87. H. Chosrowjan, S. Taniguchi, and F. Tanaka, "Ultrafast fluorescence upconversion
technique and its applications to proteins," FEBS J. 282, 3003–3015 (2015).
88. S. Cao, H. Li, Z. Zhao, S. Zhang, J. Chen, J. Xu, J. R. Knutson, and L. Brand,
"Ultrafast Fluorescence Spectroscopy via Upconversion and Its Applications in
Biophysics," Molecules 26, (2021).
89. M. Mathez, P. J. Rodrigo, P. Tidemand-Lichtenberg, and C. Pedersen,
"Upconversion imaging using short-wave infrared picosecond pulses," Opt. Lett.
42, 579–582 (2017).
90. T. Pfeiffer, M. Kutas, B. Haase, D. Molter, and G. von Freymann, "Terahertz
detection by upconversion to the near-infrared using picosecond pulses," Opt.
Express 28, 29419–29429 (2020).
91. A. W. Smith and N. Braslau, "Observation of an Optical Difference Frequency," J.
Appl. Phys. 34, 2105–2106 (1963).
92. J. A. Giordmaine and R. C. Miller, "Tunable Coherent Parametric Oscillation in
LiNb${\mathrm{O}}_{3}$ at Optical Frequencies," Phys. Rev. Lett. 14, 973–976
(1965).
93. R. L. Byer, M. K. Oshman, J. F. Young, and S. E. Harris, "VISIBLE CW
PARAMETRIC OSCILLATOR," Appl. Phys. Lett. 13, 109–111 (1968).
94. T. Kushida, Y. Tanaka, and M. Ojima, "Tunable Picosecond Pulse Generation by
Optical Parametric Oscillator," Jpn. J. Appl. Phys. 16, 2227–2235 (1977).
95. L. E. Myers, R. C. Eckardt, M. M. Fejer, R. L. Byer, W. R. Bosenberg, and J. W.
Pierce, "Quasi-phase-matched optical parametric oscillators in bulk periodically
poled LiNbO_3," J. Opt. Soc. Am. B 12, 2102 (1995).
96. R. L. Fork, B. I. Greene, and C. V. Shank, "Generation of optical pulses shorter
than 0.1 psec by colliding pulse mode locking," Appl. Phys. Lett. 38, 671–672
(1981).
97. D. E. Spence, P. N. Kean, and W. Sibbett, "60-fsec pulse generation from a self-
mode-locked Ti:sapphire laser," Opt. Lett. 16, 42–44 (1991).
98. D. C. Edelstein, E. S. Wachman, and C. L. Tang, "Broadly tunable high repetition
rate femtosecond optical parametric oscillator," Appl. Phys. Lett. 54, 1728–1730
(1989).

143
99. M. H. Dunn and M. Ebrahimzadeh, "Parametric Generation of Tunable Light from
Continuous-Wave to Femtosecond Pulses," Science 286, 1513 (1999).
100. V. Petrov, "Frequency down-conversion of solid-state laser sources to the mid-
infrared spectral range using non-oxide nonlinear crystals," Prog. Quantum
Electron. 42, 1–106 (2015).
101. S. Chaitanya Kumar, J. Krauth, A. Steinmann, K. T. Zawilski, P. G. Schunemann,
H. Giessen, and M. Ebrahim-Zadeh, "High-power femtosecond mid-infrared optical
parametric oscillator at 7 μm based on CdSiP2," Opt. Lett. 40, 1398–1401 (2015).
102. L. Maidment, P. G. Schunemann, and D. T. Reid, "Molecular fingerprint-region
spectroscopy from 5 to 12 μm using an orientation-patterned gallium phosphide
optical parametric oscillator," Opt. Lett. 41, 4261–4264 (2016).
103. T. Steinle, F. Mörz, A. Steinmann, and H. Giessen, "Ultra-stable high average
power femtosecond laser system tunable from 1.33 to 20 μm," Opt. Lett. 41, 4863–
4866 (2016).
104. C. F. O’Donnell, S. C. Kumar, K. T. Zawilski, P. G. Schunemann, and M. Ebrahim-
Zadeh, "Critically phase-matched Ti:sapphire-laser-pumped deep-infrared
femtosecond optical parametric oscillator based on CdSiP2," Opt. Lett. 43, 1507–
1510 (2018).
105. C. F. O’Donnell, S. C. Kumar, K. T. Zawilski, P. G. Schunemann, and M. Ebrahim-
Zadeh, "Single-Stage Ti:Sapphire-Pumped Deep-Infrared Optical Parametric
Oscillator Based on CdSiP2," IEEE J. Sel. Top. Quantum Electron. 24, 1–9 (2018).
106. R. C. Eckardt, C. D. Nabors, W. J. Kozlovsky, and R. L. Byer, "Optical parametric
oscillator frequency tuning and control," J. Opt. Soc. Am. B 8, 646–667 (1991).
107. M. Vainio, C. Ozanam, V. Ulvila, and L. Halonen, "Tuning and stability of a singly
resonant continuous-wave optical parametric oscillator close to degeneracy," Opt.
Express 19, 22515–22527 (2011).
108. R. L. Byer and S. E. Harris, "Power and Bandwidth of Spontaneous Parametric
Emission," Phys. Rev. 168, 1064–1068 (1968).
109. D. Magde and H. Mahr, "Study in Ammonium Dihydrogen Phosphate of
Spontaneous Parametric Interaction Tunable from 4400 to 16 000 Å," Phys. Rev.
Lett. 18, 905–907 (1967).
110. W. H. Louisell, A. Yariv, and A. E. Siegman, "Quantum Fluctuations and Noise in
Parametric Processes. I.," Phys. Rev. 124, 1646–1654 (1961).
144
111. T. G. Giallorenzi and C. L. Tang, "Quantum Theory of Spontaneous Parametric
Scattering of Intense Light," Phys. Rev. 166, 225–233 (1968).
112. D. A. Kleinman, "Theory of Optical Parametric Noise," Phys. Rev. 174, 1027–1041
(1968).
113. F. J. McClung and R. W. Hellwarth, "Giant Optical Pulsations from Ruby," J. Appl.
Phys. 33, 828–829 (1962).
114. J. J. Zayhowski, "Ultraviolet generation with passively Q-switched microchip
lasers," Opt. Lett. 21, 588–590 (1996).
115. U. Bäder, J.-P. Meyn, J. Bartschke, T. Weber, A. Borsutzky, R. Wallenstein, R. G.
Batchko, M. M. Fejer, and R. L. Byer, "Nanosecond periodically poled lithium
niobate optical parametric generator pumped at 532 nm by a single-frequency
passively Q-switched Nd:YAG laser," Opt. Lett. 24, 1608–1610 (1999).
116. J. J. Zayhowski and C. Dill, "Diode-pumped passively Q-switched picosecond
microchip lasers," Opt. Lett. 19, 1427–1429 (1994).
117. J. Dong, P. Deng, Y. Liu, Y. Zhang, J. Xu, W. Chen, and X. Xie, "Passively Q-
switched Yb:YAG laser with Cr^4+:YAG as the saturable absorber," Appl. Opt. 40,
4303 (2001).
118. J. J. Zayhowski, "Periodically poled lithium niobate optical parametric amplifiers
pumped by high-power passively Q-switched microchip lasers," Opt. Lett. 22, 169–
171 (1997).
119. M. J. Missey, V. Dominic, P. E. Powers, and K. L. Schepler, "Periodically poled
lithium niobate monolithic nanosecond optical parametric oscillators and
generators," Opt. Lett. 24, 1227–1229 (1999).
120. J.-P. Fève, B. Boulanger, B. Ménaert, and O. Pacaud, "Continuous tuning of a
microlaser-pumped optical parametric generator by use of a cylindrical periodically
poled lithium niobate crystal," Opt. Lett. 28, 1028–1030 (2003).
121. Y. Guan, J. W. Haus, and P. Powers, "Broadband and off-axis optical parametric
generation in periodically poled LiNbO3," J. Opt. Soc. Am. B 21, 1225–1233
(2004).
122. Z. Bai-Gang, Y. Jian-Quan, D. Xin, Z. Hao, W. Peng, X. De-Gang, Y. Guo-Jun,
and Z. Fan, "Low-threshold, high-efficiency, high-repetition-rate optical parametric
generator based on periodically poled LiNbO 3," Chin. Phys. 13, 364–368 (2004).

145
123. Z. Bai-Gang, Y. Jian-Quan, L. Yang, X. De-Gang, J. Feng, Z. Tie-Li, Z. Xin, W.
Peng, and X. Ke-Xin, "High-Average-Power Nanosecond Quasi-Phase-Matched
Single-Pass Optical Parametric Generator in Periodically Poled Lithium Niobate,"
Chin. Phys. Lett. 22, 1691–1693 (2005).
124. P. Zhao, B. Zhang, E. Li, R. Zhou, D. Xu, Y. Lu, T. Zhang, F. Ji, X. Zhu, P. Wang,
and J. Yao, "Experimental study on a high conversion efficiency, low threshold,
high-repetition-rate periodically poled lithium niobate optical parametric
generator," Opt. Express 14, 7224–7229 (2006).
125. S. Acco, P. Blau, and A. Arie, "Output power and spectrum of optical parametric
generator in the superfluorescent regime," Opt. Lett. 33, 1264 (2008).
126. S. Acco, A. Arie, Y. Ben-Aryeh, M. Katz, and P. Blau, "Modeling the power of an
optical parametric generator by discrete mode summation," Appl. Phys. B 103, 89–
97 (2011).
127. R. W. Boyd, Nonlinear Optics, Third Edition, 3rd ed. (Academic Press, Inc., 2008).
128. R. L. Sutherland, Handbook of Nonlinear Optics (CRC Press, 2003).
129. C. Pedersen, Q. Hu, L. Høgstedt, P. Tidemand-Lichtenberg, and J. S. Dam, "Non-
collinear upconversion of infrared light," Opt. Express 22, 28027 (2014).
130. K. Rottwitt and P. Tidemand-Lichtenberg, Nonlinear Optics: Principles and
Applications (CRC Press, 2014), Vol. 3.
131. "off-the-shelf MgO: PPLN, PPLN waveguides for SHG, SFG and down
conversions.," https://www.hcphotonics.com/ppln-chips.
132. A. A. S., T.-L. P., and P. C., "Mid-Infrared Spontaneous Parametric down-
conversion Light Source in the Saturated Regime," Submitt. Nat. Commun. (2021).
133. R. R. Alfano and S. L. Shapiro, "Observation of Self-Phase Modulation and Small-
Scale Filaments in Crystals and Glasses," Phys. Rev. Lett. 24, 592–594 (1970).
134. R. R. Alfano, ed., The Supercontinuum Laser Source (Springer New York, 1989).
135. Y. Yu, X. Gai, T. Wang, P. Ma, R. Wang, Z. Yang, D.-Y. Choi, S. Madden, and B.
Luther-Davies, "Mid-infrared supercontinuum generation in chalcogenides," Opt.
Mater. Express 3, 1075–1086 (2013).
146
136. S. Dai, Y. Wang, X. Peng, P. Zhang, X. Wang, and Y. Xu, "A Review of Mid-
Infrared Supercontinuum Generation in Chalcogenide Glass Fibers," Appl. Sci. 8,
707 (2018).
137. Amnon. Yariv, Quantum Electronics (1989).
138. O. Gayer, Z. Sacks, E. Galun, and A. Arie, "Temperature and wavelength
dependent refractive index equations for MgO-doped congruent and stoichiometric
LiNbO 3," Appl. Phys. B 94, 367–367 (2009).
139. A. A. S., P. Tidemand-Lichtenberg, O. Rodenko, and C. Pedersen, "Pulse-to-pulse
spectral noise in a spontaneous parametric down conversion light source," Opt. Lett.
45, 2772–2775 (2020).
140. G. D. Boyd and A. Ashkin, "Theory of Parametric Oscillator Threshold with
Single-Mode Optical Masers and Observation of Amplification in
LiNb${\mathrm{O}}_{3}$," Phys. Rev. 146, 187–198 (1966).
141. U. Bäder, J.-P. Meyn, J. Bartschke, T. Weber, A. Borsutzky, R. Wallenstein, R. G.
Batchko, M. M. Fejer, and R. L. Byer, "Nanosecond periodically poled lithium
niobate optical parametric generator pumped at 532 nm by a single-frequency
passively Q-switched Nd:YAG laser," Opt. Lett. 24, 1608 (1999).
142. An-Chung Chiang, Tsong-Dong Wang, Yen-Yin Lin, Chee-Wai Lau, Yen-Hung
Chen, Bi-Cheng Wong, Yen-Chieh Huang, Jow-Tsong Shy, Yu-Pin Lan, Yung-Fu
Chen, and Pei-Hsi Tsao, "Pulsed optical parametric generation, amplification, and
oscillation in monolithic periodically poled lithium niobate crystals," IEEE J.
Quantum Electron. 40, 791–799 (2004).
143. J. Dong, Y. Ren, and H. Cheng, ">1 MW peak power, an efficient Yb:YAG/Cr 4+ :YAG composite crystal passively Q-switched laser," Laser Phys. 24, 055801
(2014).
144. S. C. Kumar and M. Ebrahim-Zadeh, "Yb-fiber-based, high-average-power, high-
repetition-rate, picosecond source at 2.1 µm," Laser Photonics Rev. 10, 970–977
(2016).
145. S. Chaitanya Kumar, A. Esteban-Martin, T. Ideguchi, M. Yan, S. Holzner, T. W.
Hänsch, N. Picqué, and M. Ebrahim-Zadeh, "Few-cycle, broadband, mid-infrared
optical parametric oscillator pumped by a 20-fs Ti:sapphire laser," Laser Photonics
Rev. 8, L86–L91 (2014).

147
146. Z. Heiner, V. Petrov, and M. Mero, "Compact, high-repetition-rate source for
broadband sum-frequency generation spectroscopy," APL Photonics 2, 066102
(2017).
147. Y. Fu, K. Midorikawa, and E. J. Takahashi, "Towards a petawatt-class few-cycle
infrared laser system via dual-chirped optical parametric amplification," Sci. Rep.
8, 7692 (2018).
148. S. Wandel, M.-W. Lin, Y. Yin, G. Xu, and I. Jovanovic, "Parametric generation and
characterization of femtosecond mid-infrared pulses in ZnGeP2," Opt. Express 24,
5287–5299 (2016).
149. F. Tavella, A. Willner, J. Rothhardt, S. Hädrich, E. Seise, S. Düsterer, T.
Tschentscher, H. Schlarb, J. Feldhaus, J. Limpert, A. Tünnermann, and J. Rossbach,
"Fiber-amplifier pumped high average power few-cycle pulse non-collinear
OPCPA," Opt. Express 18, 4689–4694 (2010).
150. J. N. H., "Applied MIR-Upconversion spectroscopy for heterogeneous catalysis,"
(2020).
151. S. L. Johnson, D. M. Bubb, and R. F. Haglund, "Phase explosion and recoil-induced
ejection in resonant-infrared laser ablation of polystyrene," Appl. Phys. A 96, 627–
635 (2009).
152. A. A. S., C. F. O’Donnell, S. Chaitanya Kumar, M. Ebrahim-Zadeh, P. Tidemand-
Lichtenberg, and C. Pedersen, "Mid-infrared upconversion imaging using
femtosecond pulses," Photonics Res. 7, 783 (2019).
153. M. El-Sayed, M. Mohamed, C. Burda, and S. Link, "The relaxation pathways of
CdSe nanoparticles monitored with femtosecond time-resolution from the visible to
the IR: Assignment of the transient features by carrier quenching," J. Phys. Chem.
B 105, 12286–12292 (2001).
154. C. Bonetti, M. T. A. Alexandre, I. H. M. Van Stokkum, R. G. Hiller, M. L. Groot,
R. Van Grondelle, and J. T. M. Kennis, "Identification of excited-state energy
transfer and relaxation pathways in the peridinin-chlorophyll complex: An ultrafast
mid-infrared study," Phys. Chem. Chem. Phys. 12, 9256–9266 (2010).
155. H. K. Nienhuys, R. A. Van Santen, and H. J. Bakker, "Orientational relaxation of
liquid water molecules as an activated process," J. Chem. Phys. 112, 8487–8494
(2000).
148
156. J. Herz, V. Siffrin, A. E. Hauser, A. U. Brandt, T. Leuenberger, H. Radbruch, F.
Zipp, and R. A. Niesner, "Expanding two-photon intravital microscopy to the
infrared by means of optical parametric oscillator," Biophys. J. 98, 715–723 (2010).
157. N. Huang, H. Liu, Z. Wang, J. Han, and S. Zhang, "Femtowatt incoherent image
conversion from mid-infrared light to near-infrared light," Laser Phys. 27, (2017).
158. a J. Torregrosa, H. Maestre, and J. Capmany, "Intra-cavity upconversion to 631
nm of images illuminated by an eye-safe ASE source at 1550 nm," Opt. Lett. 40,
5313–5318 (2015).
159. M. Mathez, P. J. Rodrigo, P. Tidemand-Lichtenberg, and C. Pedersen,
"Upconversion imaging using short-wave infrared picosecond pulses," Opt. Lett.
42, 579 (2017).
160. S. Wolf, T. Trendle, J. Kiessling, J. Herbst, K. Buse, and F. Kühnemann, "Self-
gated mid-infrared short pulse upconversion detection for gas sensing," Opt.
Express 25, 24459 (2017).
161. L. Pattelli, R. Savo, M. Burresi, and D. S. Wiersma, "Spatio-temporal visualization
of light transport in complex photonic structures," Light Sci. Appl. 5, e16090--9
(2016).
162. P. Tidemand-Lichtenberg, J. S. Dam, H. V. Andersen, L. Høgstedt, and C.
Pedersen, "Mid-infrared upconversion spectroscopy," J. Opt. Soc. Am. B 33, D28
(2016).
163. B. E. A. Saleh and M. Carl. Teich, Fundamentals of Photonics. (Wiley, 2013).
164. J. S. Dam, C. Pedersen, and P. Tidemand-Lichtenberg, "Theory for upconversion
of incoherent images," Opt. Express 20, 1475 (2012).
165. C. Pedersen, E. Karamehmedović, J. S. Dam, and P. Tidemand-Lichtenberg,
"Enhanced 2D-image upconversion using solid-state lasers.," Opt. Express 17,
20885–90 (2009).
166. S. Junaid, "Upconversion based mid-infrared hyperspectral imaging," (2018).