Studies on Proofing of Yeasted Bread Dough Using Near and Mid-Infrared Spectroscopy
10
Studies on Proofing of Yeasted Bread Dough Using Near- and Mid-Infrared Spectroscopy NICOLETTA SINELLI, † ERNESTINA CASIRAGHI,* ,† AND GERARD DOWNEY ‡ Department of Food Science and Technologies, University of Milan, Via Celoria 2, 20133 Milan, Italy, and Teagasc, Ashtown Food Research Centre, Ashtown, Dublin 15, Ireland Dough proofing is the resting period after mixing during which fermentation commences. Optimum dough proofing is important for production of high quality bread. Near- and mid-infrared spectroscopies have been used with some success to investigate macromolecular changes during dough mixing. In this work, both techniques were applied to a preliminary study of flour doughs during proofing. Spectra were collected contemporaneously by NIR (750-1100 nm) and MIR (4000–600 cm -1 ) instruments using a fiberoptic surface interactance probe and horizontal ATR cell, respectively. Studies were performed on flours of differing baking quality; these included strong baker’s flour, retail flour, and gluten-free flour. Following principal component analysis, changes in the recorded spectral signals could be followed over time. It is apparent from the results that both vibrational spectroscopic techniques can identify changes in flour doughs during proofing and that it is possible to suggest which macromolecular species are involved. KEYWORDS: NIR spectroscopy; MIR spectroscopy; dough; proofing INTRODUCTION Bread is a staple dietary item in most countries of the world. Its success arises from the ability of gluten proteins to form an extensible network which may then be set during baking. Key determinants of bread quality involve flour compositional parameters (protein quality and quantity, starch damage, en- dogenous enzyme levels, etc.) and process variables such as mixing, proofing, and baking. Understanding the molecular changes that take place during the baking processes facilitates the development of, e.g., breads with improved quality and consistency, and considerable efforts have been made in this direction in the recent past. The importance of mixing has long been recognized, and research efforts have led to the introduction, for example, of the Chorleywood bread process with its emphasis on reduced mixing times and the input of high energy to facilitate gluten development (1). Dough proofing is also an important step during the produc- tion of good quality bread. During proofing (i.e., the resting period after mixing during which fermentation takes place) the mixed bread-making ingredients are converted, under controlled temperature, time, and humidity, to a soft and expanded dough with significant changes in both structural and rheological properties (2). Important aspects of the proofing stage are gas production, gas retention, and dough development (3, 4). During fermentation, the action of carbohydrate enzymes (R-amylase and -amylase) converts starch to dextrins and sugars; these enzymes are present in variable amounts in wheat flour but are often added as part of an improver mixture. The action of yeast on these low molecular weight carbohydrates results in the production of carbon dioxide, which increases dough volume and contributes to overall shape and crumb texture development. Partial hydrolysis of native wheat proteins by protease enzymes, endogenous or added, softens the gluten and changes the rheological properties of dough (5). Dough performance is also affected by formulation, particularly by sugar, fat, and/or emulsifier addition (6, 7). For the production of high-quality baked goods, the dough proofing phase needs to be optimized. Insufficient proofing times result in loaves of reduced volume and poor cell structure while excessive proofing will produce doughs of low viscosity which are difficult to handle. Overlong proofing times also represent an undue cost to the baker. In order to produce high-quality breads efficiently, all steps in the baking process need to be optimized. Rheofermentometry (Chopin, Paris, France) is one method used to monitor proofing; in particular, this technique can provide useful information about flour and/or dough systems based on measurements of dough rise, gas formation, and gas retention. Used in conjunction with the alveograph as a mixer, the instrument is designed to test the quality of flour for French bread at a relatively low and fixed water absorption (8, 9). However, this method is slow, not suited to automation, requires high manual dexterity, and is only suitable for use by trained personnel. Infrared spectroscopy in both the near-infrared (NIR) and mid- infrared (MIR) regions is probably one of the most powerful and convenient analytical tools which could be used to monitor * To whom correspondence should be addressed. Tel: +39-02-5031- 9184. Fax: +39-02-5031-9191. E-mail: [email protected]. † University of Milan. ‡ Ashtown Food Research Centre. 922 J. Agric. Food Chem. 2008, 56, 922–931 10.1021/jf0727138 CCC: $40.75 2008 American Chemical Society Published on Web 01/15/2008
Transcript of Studies on Proofing of Yeasted Bread Dough Using Near and Mid-Infrared Spectroscopy
Studies on Proofing of Yeasted Bread Dough UsingNear- and Mid-Infrared Spectroscopy
NICOLETTA SINELLI,† ERNESTINA CASIRAGHI,*,†AND GERARD DOWNEY
‡
Department of Food Science and Technologies, University of Milan, Via Celoria 2, 20133 Milan,Italy, and Teagasc, Ashtown Food Research Centre, Ashtown, Dublin 15, Ireland
Dough proofing is the resting period after mixing during which fermentation commences. Optimumdough proofing is important for production of high quality bread. Near- and mid-infrared spectroscopieshave been used with some success to investigate macromolecular changes during dough mixing. Inthis work, both techniques were applied to a preliminary study of flour doughs during proofing. Spectrawere collected contemporaneously by NIR (750-1100 nm) and MIR (4000–600 cm-1) instrumentsusing a fiberoptic surface interactance probe and horizontal ATR cell, respectively. Studies wereperformed on flours of differing baking quality; these included strong baker’s flour, retail flour, andgluten-free flour. Following principal component analysis, changes in the recorded spectral signalscould be followed over time. It is apparent from the results that both vibrational spectroscopictechniques can identify changes in flour doughs during proofing and that it is possible to suggestwhich macromolecular species are involved.
KEYWORDS: NIR spectroscopy; MIR spectroscopy; dough; proofing
INTRODUCTION
Bread is a staple dietary item in most countries of the world.Its success arises from the ability of gluten proteins to form anextensible network which may then be set during baking. Keydeterminants of bread quality involve flour compositionalparameters (protein quality and quantity, starch damage, en-dogenous enzyme levels, etc.) and process variables such asmixing, proofing, and baking. Understanding the molecularchanges that take place during the baking processes facilitatesthe development of, e.g., breads with improved quality andconsistency, and considerable efforts have been made in thisdirection in the recent past.
The importance of mixing has long been recognized, andresearch efforts have led to the introduction, for example, ofthe Chorleywood bread process with its emphasis on reducedmixing times and the input of high energy to facilitate glutendevelopment (1).
Dough proofing is also an important step during the produc-tion of good quality bread. During proofing (i.e., the restingperiod after mixing during which fermentation takes place) themixed bread-making ingredients are converted, under controlledtemperature, time, and humidity, to a soft and expanded doughwith significant changes in both structural and rheologicalproperties (2). Important aspects of the proofing stage are gasproduction, gas retention, and dough development (3, 4). Duringfermentation, the action of carbohydrate enzymes (R-amylase
and �-amylase) converts starch to dextrins and sugars; theseenzymes are present in variable amounts in wheat flour but areoften added as part of an improver mixture. The action of yeaston these low molecular weight carbohydrates results in theproduction of carbon dioxide, which increases dough volumeand contributes to overall shape and crumb texture development.Partial hydrolysis of native wheat proteins by protease enzymes,endogenous or added, softens the gluten and changes therheological properties of dough (5). Dough performance is alsoaffected by formulation, particularly by sugar, fat, and/oremulsifier addition (6, 7).
For the production of high-quality baked goods, the doughproofing phase needs to be optimized. Insufficient proofing timesresult in loaves of reduced volume and poor cell structure whileexcessive proofing will produce doughs of low viscosity whichare difficult to handle. Overlong proofing times also representan undue cost to the baker.
In order to produce high-quality breads efficiently, all stepsin the baking process need to be optimized. Rheofermentometry(Chopin, Paris, France) is one method used to monitor proofing;in particular, this technique can provide useful information aboutflour and/or dough systems based on measurements of doughrise, gas formation, and gas retention. Used in conjunction withthe alveograph as a mixer, the instrument is designed to testthe quality of flour for French bread at a relatively low andfixed water absorption (8, 9). However, this method is slow,not suited to automation, requires high manual dexterity, andis only suitable for use by trained personnel.
Infrared spectroscopy in both the near-infrared (NIR) and mid-infrared (MIR) regions is probably one of the most powerfuland convenient analytical tools which could be used to monitor
* To whom correspondence should be addressed. Tel: +39-02-5031-9184. Fax: +39-02-5031-9191. E-mail: [email protected].
† University of Milan.‡ Ashtown Food Research Centre.
922 J. Agric. Food Chem. 2008, 56, 922–931
10.1021/jf0727138 CCC: $40.75 2008 American Chemical SocietyPublished on Web 01/15/2008
dough leavening given that absorptions in these spectral rangescan be related, to a greater or lesser degree, to the principalchemical components of dough–water, protein, starch, andfat (10–12). While MIR measurements have advantages becausethey provide information on fundamental molecular vibrations(13–15), NIR measurements are easier to make and, owing totheir higher energy content, may penetrate dough pieces to agreater distance than MIR radiation, thus potentially producingmore representative measurements. NIR spectra have been usedto monitor the content of sucrose, fat, flour, and water in biscuitdoughs (16, 17) and also to investigate key macromolecularchanges which occur during dough mixing (18–22). Due to itsnoninvasive nature, NIR has the potential to be used in an onlinemonitoring system for bread manufacturers to optimize themixing process.
In this work, both near- and mid-infrared spectroscopy wereapplied in a preliminary study of the proofing of bread doughsinvolving flours of different baking quality. Studies were alsoperformed on gluten-free flours which lack the ability to formelastic doughs due to the absence of gluten protein (23). Bothspectroscopic techniques were used to investigate macromo-lecular changes during the proof phase with the aims ofcharacterizing any such changes and determining optimumproofing times based on objective spectral readings rather thanacquired bakery experience.
MATERIALS AND METHODS
Dough Preparation. Three different types of commercial flours(Odlum Group Ltd., Dublin, Ireland) were used in this study. Thesewere (a) strong baker’s flour comprising wheat flour, vital wheat gluten,calcium carbonate, and R-amylase with a protein content of 11–12%(at 14% moisture), (b) retail or soft flour comprising wheat flour andraising agents (sodium bicarbonate, monocalcium phosphate, sodiumacid pyrophosphate) with a protein content of 8–9% (at 14% moisture),and (c) gluten-free flour comprising wheat starch, soya flour, modifiedmaize starch, raising agents (calcium acid phosphate, sodium bicarbon-ate) salt, calcium carbonate, stabilizer (methylhydroxypropyl andcellulose), vitamins (B1, B2; niacin), and iron with a protein contentof 4.6% (at 14% moisture). The presence of raising agents and acid insome of these formulations is a confounding factor, but these recipesare typical commercial formulations used in Ireland, and the goal ofthis exploratory work was to monitor molecular modifications occurringduring proofing as occurring industrially.
The standard recipe for bread production using strong baker’s flourwas as follows: flour (1000 g), water (615 g), yeast (28 g), and sodiumchloride (20 g). Using retail flour, this recipe was modified by using areduced quantity of water (550 g). For both recipes, water (at 30 °C),flour, and yeast were placed into the mixing bowl of a domestic mixer(Chef, Kenwood, U.K.) fitted with a dough mixing attachment andmixed for a total of 10 min. The recipe for gluten-free dough was asfollows: gluten-free flour (1000 g), water at 35 °C (870 g), and freshyeast (28 g). Ingredients were mixed for a total of 4 min in a three-speed mixer (Model A120, Hobart, U.K.). All experiments, includingdough mixing and proofing, were carried out twice.
NIR Spectroscopy. NIR spectra were collected by a NIRSystems6500 scanning monochromator (FOSS NIRSystems, Silver Springs,MD) fitted with a fiberoptic surface interactance probe over the range750–1100 at 2 nm intervals. This wavelength range was chosen becauseof the greater radiation depth associated with it as compared to thelonger, conventional NIR range (1100–2498 nm). For each test, spectrawere collected directly from the dough surface every 2 min duringproofing periods of up to 1 h and stored as log(1/R); once positioned,the interactance probe was not moved during the 1 h proofing period.During testing, doughs were placed in a baking tin which wasmaintained at 30 °C in a water bath; dough temperature was monitoredusing a digital thermometer (Eirelec, MT 130 TC; Technology House,Dundalk, Ireland) while the baking tin was covered with cling film to
prevent moisture loss from the dough. WinISI software (v.1.04a; FOSSNIRSystems, Silver Springs, MD) was used for spectral acquisition,instrument control, and preliminary file manipulation.
MIR Spectroscopy. FT-IR measurements were taken using aspectrometer (Bio-Rad Excalibur series FTS 300; Analytica Ltd.,Dublin, Ireland) equipped with a deuterated triglycine sulfate (DTGS)detector. Win-IR-Pro software (v.3.0, Bio-Rad; Analytica Ltd., Dublin,Ireland) was used for spectral acquisition, instrument control, andpreliminary file manipulation. Spectra were recorded using an in-compartment benchmark attenuated total reflectance (ATR) trough topplate by use of a 45° Ge crystal with 11 internal reflections. For bothbackground and sample readings, 64 scans were coadded at a nominalresolution of 8 cm-1; single beam spectra of the samples were collectedand ratioed against a background of air. Freshly prepared dough sampleswere positioned on the ATR plate with great care so as to minimizestress and shear forces. For each test, spectral data were collected inthe range 4000–600 cm-1 at room temperature (20 ( 0.5 °C) every 2min during proofing periods of up to 1 h; after initial placement, doughsamples were left undisturbed during the entire 1 h testing period. Whilesamples were not directly covered during these spectral collectionperiods, the lid of the sample compartment was kept closed throughout.A feature around 2300 cm-1 in the FTIR spectra was an aberrationdue to the presence of atmospheric CO2 in the ATR sample compart-ment; for this reason, spectral data between 2280 and 2420 cm-1 wereremoved prior to data analysis.
Data Processing. Both NIR and MIR spectral data sets wereanalyzed using The Unscrambler (version 9.7; Camo, Trondheim,Norway) software. NIR spectral data were pretreated using a secondderivative transform calculation (Savitzky-Golay method, gap size )10 data points). Principal component analysis (PCA) was applied asan exploratory tool to both NIR and MIR spectral data to detect unusualor outlying samples and to uncover spectral trends occurring duringthe proof phase. PCA identifies orthogonal directions of maximumvariance in the original data set in decreasing order and projects thedata onto a lower dimensionality space formed by a subset of the highestvariance components. The orthogonal directions are linear combinationsof the original variables, and each component explains in turn a partof the total variance of the data; in particular, the first significantcomponent explains the largest percentage of the total variance, thesecond one, the second largest percentage, and so forth (24, 25). Allspectra collected during the proofing were averaged to produce a singlespectrum for each dough type and proofing time. All spectral data setswere mean-centered before performing PCA calculations. The meanvalues of the PC scores were then modeled as a function of time toidentify critical points during proofing (Table Curve Software, v.4.0;Jandel Scientific, San Rafael, CA).
Analysis of variance of proofing critical point values was performedby using the statistical software SYSTAT (version 5.03, Systat 5.03for Windows; Systat Inc., Evanston, IL), applying the Tukey test.
RESULTS
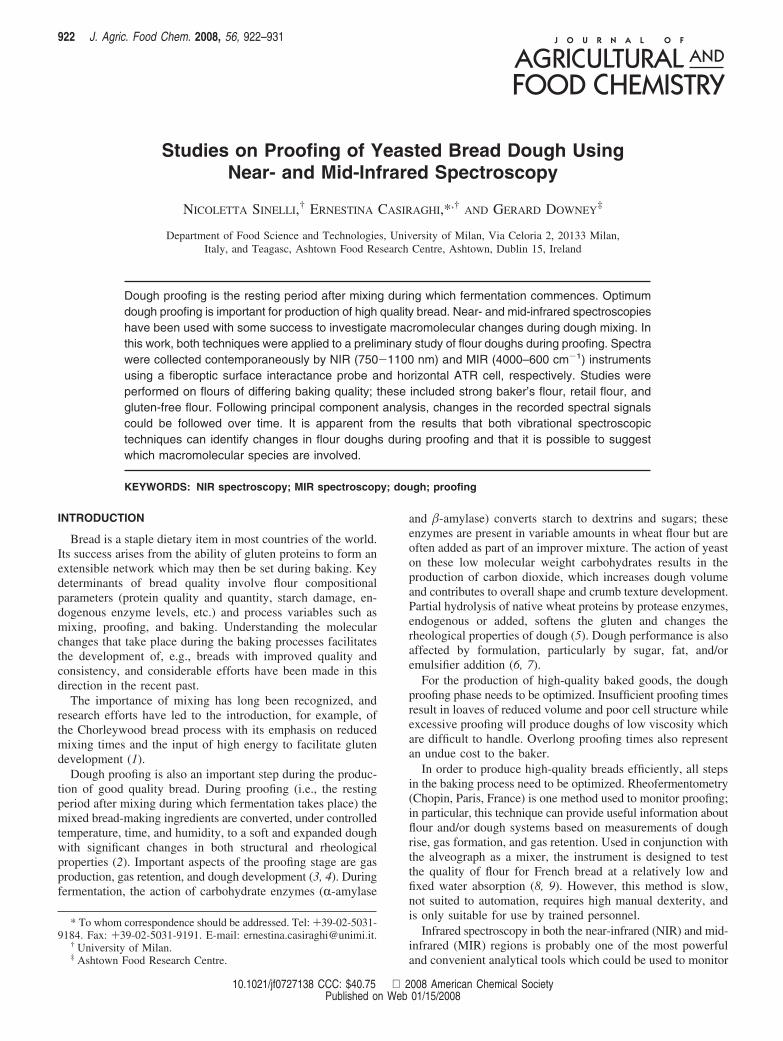
NIR Spectroscopy. Reflectance spectra of a strong baker’sflour dough collected over a 1 h proofing period are shown inFigure 1. Raw spectra reveal few defined features except for apeak at 982 nm although there are also some suggestions ofspectral undulations centered around 750 and 840 nm. The majorfeature of this spectral collection, however, is a vertical offsetof the spectra with the recorded absorbance values increasingduring the first 6 min and then consistently decreasing withincreasing proof time; the magnitude of the offset varies withproofing time as indicated by the gaps between spectra in Figure1. Absorbance changes during each 2 min sampling period arelowest at the beginning and end of the proofing time studied.The overall effect appears to be wavelength independent overthe range scanned. Such a linear offset may indicate somesystematic change in composition of the dough matrix, alteredpenetration distance of radiation into the dough, or perhaps areduction in dough density during proofing time. All three
Dough Proofing by NIR and MIR Spectroscopy J. Agric. Food Chem., Vol. 56, No. 3, 2008 923
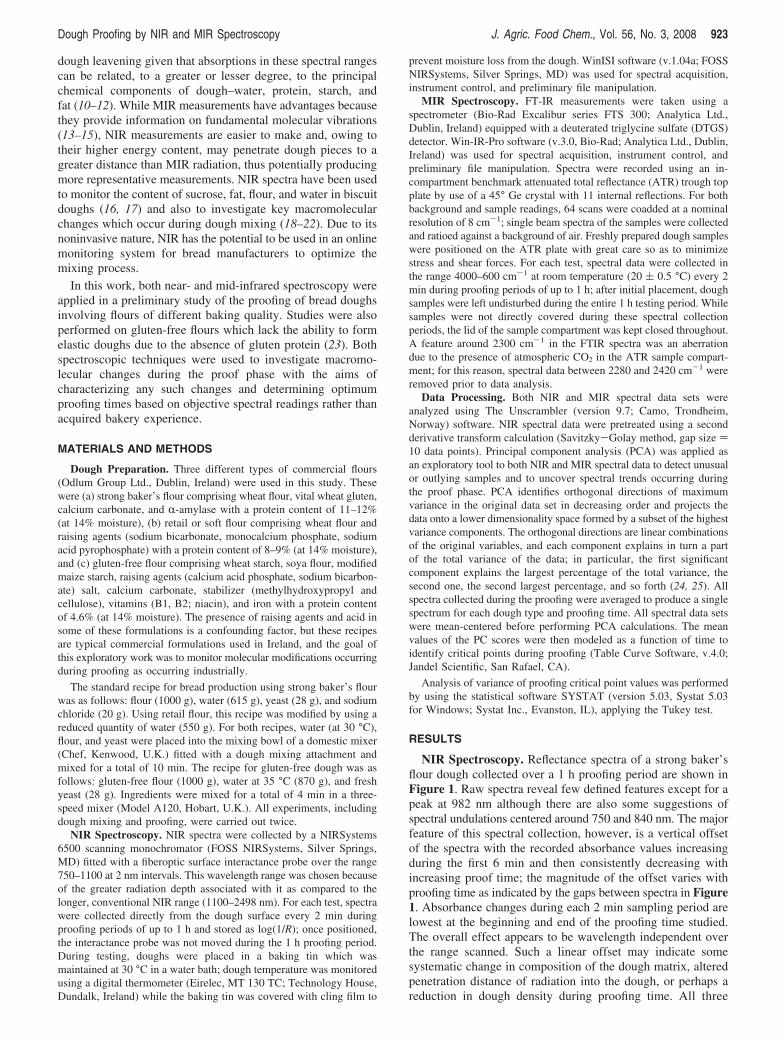
possibilities are in agreement with the known events takingplace in a dough during proof. After a second derivativetreatment, several spectral features become more apparent(Figure 2). These comprised troughs at approximately 740,840, and 960 nm with a shoulder centered at 982 nm; minimain this second derivative plot correspond to maxima in theraw spectral data. Absorbance at all of these wavelengthshas been attributed to water: third overtone –OH stretch (740nm), -OH combination band (840 nm), second overtone –OHstretch (970 nm), second overtone –OH hydrogen-bonded to
other species such as sugars or starch (980 nm) (26). At thispoint, it is therefore possible to state that NIR spectrarecorded in this wavelength range are able to detect somechanges which occur during dough proofing.
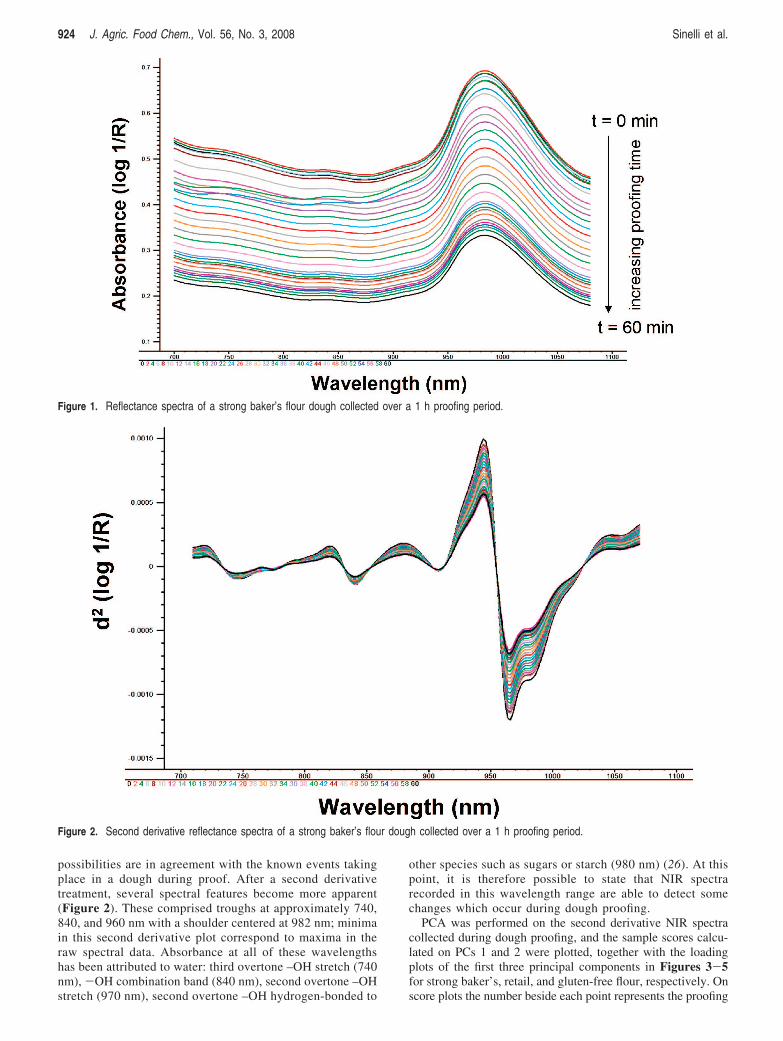
PCA was performed on the second derivative NIR spectracollected during dough proofing, and the sample scores calcu-lated on PCs 1 and 2 were plotted, together with the loadingplots of the first three principal components in Figures 3-5for strong baker’s, retail, and gluten-free flour, respectively. Onscore plots the number beside each point represents the proofing
Figure 1. Reflectance spectra of a strong baker’s flour dough collected over a 1 h proofing period.
Figure 2. Second derivative reflectance spectra of a strong baker’s flour dough collected over a 1 h proofing period.
924 J. Agric. Food Chem., Vol. 56, No. 3, 2008 Sinelli et al.
time in minutes. In the case of strong baker’s flour a number ofsignificant features are evident in Figure 3a. First, samples aredistributed along PC1, which accounts for 99.9% of the variancein the spectral collection, from left to right mainly on the basis
of increasing proofing time. This distribution is especially clearup to a time of 44 min but becomes less clear thereafter.Superimposed on this distribution is a complex behavior on PC2which, although it only accounts for approximately 0.1% of
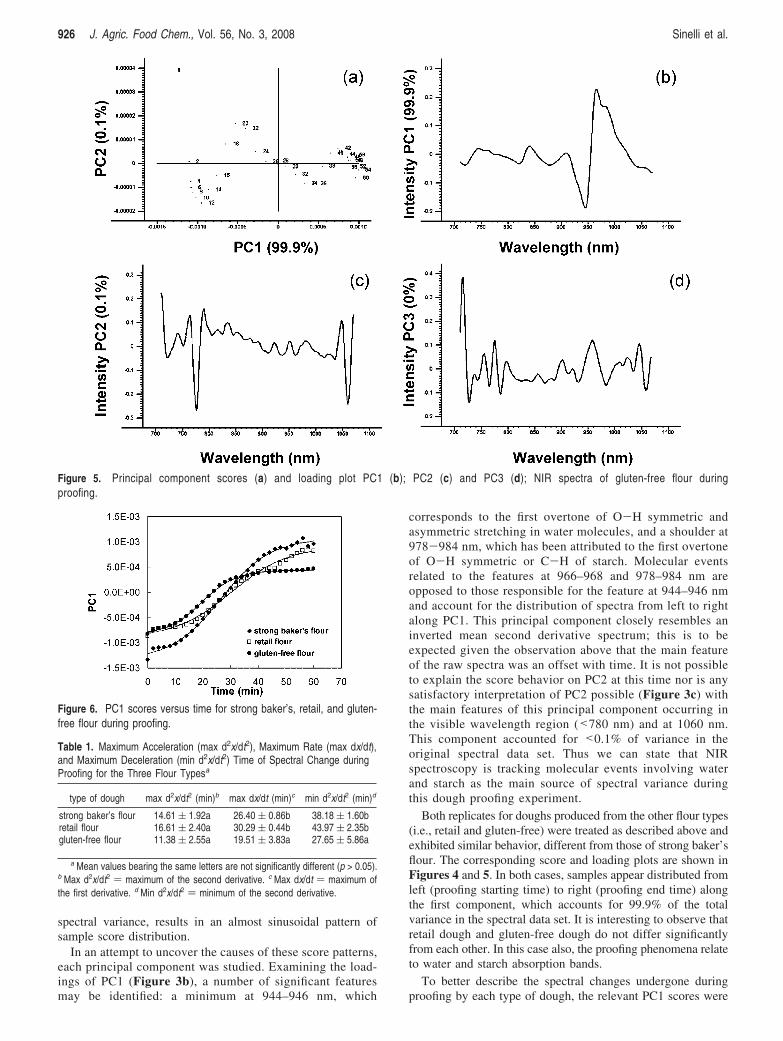
Figure 3. Principal component scores (a) and loading plot PC1 (b); PC2 (c) and PC3 (d); NIR spectra of strong baker’s flour during proofing.
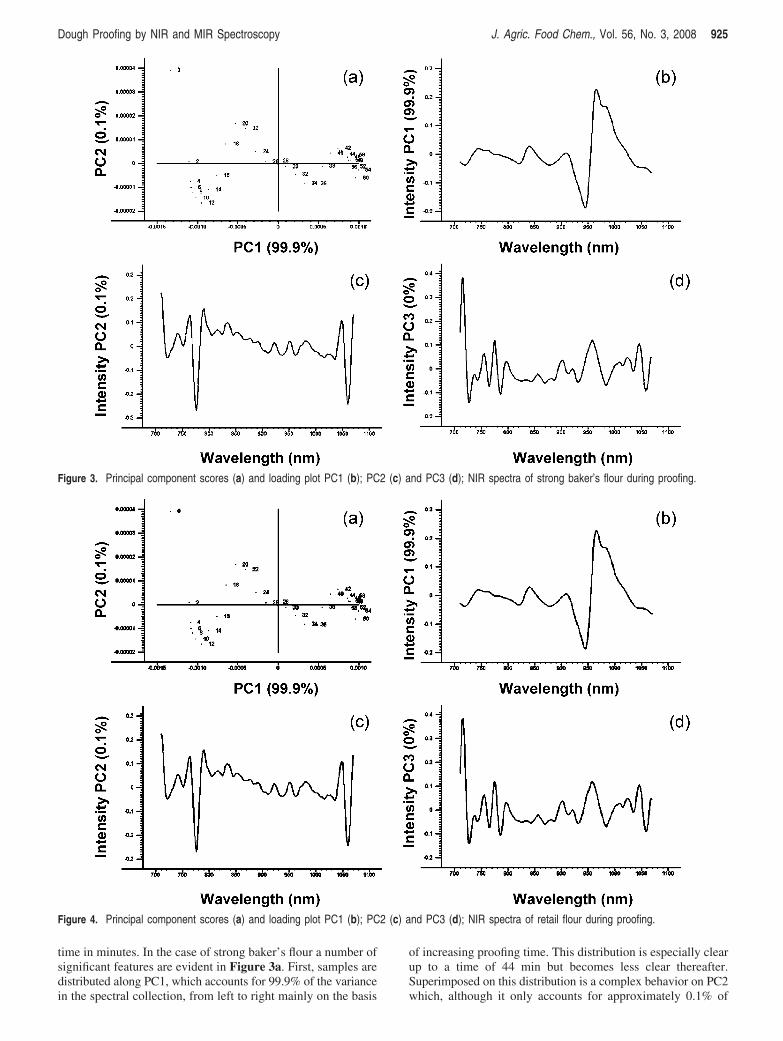
Figure 4. Principal component scores (a) and loading plot PC1 (b); PC2 (c) and PC3 (d); NIR spectra of retail flour during proofing.
Dough Proofing by NIR and MIR Spectroscopy J. Agric. Food Chem., Vol. 56, No. 3, 2008 925
spectral variance, results in an almost sinusoidal pattern ofsample score distribution.
In an attempt to uncover the causes of these score patterns,each principal component was studied. Examining the load-ings of PC1 (Figure 3b), a number of significant featuresmay be identified: a minimum at 944–946 nm, which
corresponds to the first overtone of O-H symmetric andasymmetric stretching in water molecules, and a shoulder at978-984 nm, which has been attributed to the first overtoneof O-H symmetric or C-H of starch. Molecular eventsrelated to the features at 966–968 and 978–984 nm areopposed to those responsible for the feature at 944–946 nmand account for the distribution of spectra from left to rightalong PC1. This principal component closely resembles aninverted mean second derivative spectrum; this is to beexpected given the observation above that the main featureof the raw spectra was an offset with time. It is not possibleto explain the score behavior on PC2 at this time nor is anysatisfactory interpretation of PC2 possible (Figure 3c) withthe main features of this principal component occurring inthe visible wavelength region (<780 nm) and at 1060 nm.This component accounted for <0.1% of variance in theoriginal spectral data set. Thus we can state that NIRspectroscopy is tracking molecular events involving waterand starch as the main source of spectral variance duringthis dough proofing experiment.
Both replicates for doughs produced from the other flour types(i.e., retail and gluten-free) were treated as described above andexhibited similar behavior, different from those of strong baker’sflour. The corresponding score and loading plots are shown inFigures 4 and 5. In both cases, samples appear distributed fromleft (proofing starting time) to right (proofing end time) alongthe first component, which accounts for 99.9% of the totalvariance in the spectral data set. It is interesting to observe thatretail dough and gluten-free dough do not differ significantlyfrom each other. In this case also, the proofing phenomena relateto water and starch absorption bands.
To better describe the spectral changes undergone duringproofing by each type of dough, the relevant PC1 scores were
Figure 5. Principal component scores (a) and loading plot PC1 (b); PC2 (c) and PC3 (d); NIR spectra of gluten-free flour duringproofing.
Figure 6. PC1 scores versus time for strong baker’s, retail, and gluten-free flour during proofing.
Table 1. Maximum Acceleration (max d2x/dt2), Maximum Rate (max dx/dt),and Maximum Deceleration (min d2x/dt2) Time of Spectral Change duringProofing for the Three Flour Typesa
type of dough max d2x/dt2 (min)b max dx/dt (min)c min d2x/dt2 (min)d
strong baker’s flour 14.61 ( 1.92a 26.40 ( 0.86b 38.18 ( 1.60bretail flour 16.61 ( 2.40a 30.29 ( 0.44b 43.97 ( 2.35bgluten-free flour 11.38 ( 2.55a 19.51 ( 3.83a 27.65 ( 5.86a
a Mean values bearing the same letters are not significantly different (p > 0.05).b Max d2x/dt2 ) maximum of the second derivative. c Max dx/dt ) maximum ofthe first derivative. d Min d2x/dt2 ) minimum of the second derivative.
926 J. Agric. Food Chem., Vol. 56, No. 3, 2008 Sinelli et al.
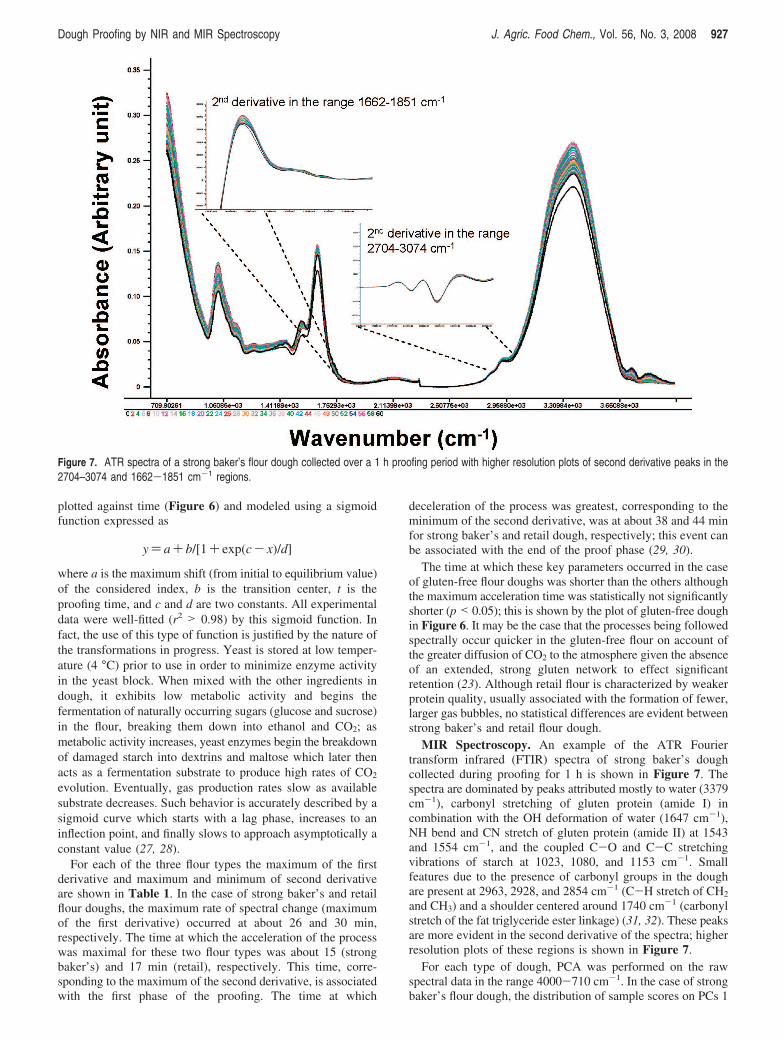
plotted against time (Figure 6) and modeled using a sigmoidfunction expressed as
y) a+ b/[1+ exp(c- x)/d]
where a is the maximum shift (from initial to equilibrium value)of the considered index, b is the transition center, t is theproofing time, and c and d are two constants. All experimentaldata were well-fitted (r2 > 0.98) by this sigmoid function. Infact, the use of this type of function is justified by the nature ofthe transformations in progress. Yeast is stored at low temper-ature (4 °C) prior to use in order to minimize enzyme activityin the yeast block. When mixed with the other ingredients indough, it exhibits low metabolic activity and begins thefermentation of naturally occurring sugars (glucose and sucrose)in the flour, breaking them down into ethanol and CO2; asmetabolic activity increases, yeast enzymes begin the breakdownof damaged starch into dextrins and maltose which later thenacts as a fermentation substrate to produce high rates of CO2
evolution. Eventually, gas production rates slow as availablesubstrate decreases. Such behavior is accurately described by asigmoid curve which starts with a lag phase, increases to aninflection point, and finally slows to approach asymptotically aconstant value (27, 28).
For each of the three flour types the maximum of the firstderivative and maximum and minimum of second derivativeare shown in Table 1. In the case of strong baker’s and retailflour doughs, the maximum rate of spectral change (maximumof the first derivative) occurred at about 26 and 30 min,respectively. The time at which the acceleration of the processwas maximal for these two flour types was about 15 (strongbaker’s) and 17 min (retail), respectively. This time, corre-sponding to the maximum of the second derivative, is associatedwith the first phase of the proofing. The time at which
deceleration of the process was greatest, corresponding to theminimum of the second derivative, was at about 38 and 44 minfor strong baker’s and retail dough, respectively; this event canbe associated with the end of the proof phase (29, 30).
The time at which these key parameters occurred in the caseof gluten-free flour doughs was shorter than the others althoughthe maximum acceleration time was statistically not significantlyshorter (p < 0.05); this is shown by the plot of gluten-free doughin Figure 6. It may be the case that the processes being followedspectrally occur quicker in the gluten-free flour on account ofthe greater diffusion of CO2 to the atmosphere given the absenceof an extended, strong gluten network to effect significantretention (23). Although retail flour is characterized by weakerprotein quality, usually associated with the formation of fewer,larger gas bubbles, no statistical differences are evident betweenstrong baker’s and retail flour dough.
MIR Spectroscopy. An example of the ATR Fouriertransform infrared (FTIR) spectra of strong baker’s doughcollected during proofing for 1 h is shown in Figure 7. Thespectra are dominated by peaks attributed mostly to water (3379cm-1), carbonyl stretching of gluten protein (amide I) incombination with the OH deformation of water (1647 cm-1),NH bend and CN stretch of gluten protein (amide II) at 1543and 1554 cm-1, and the coupled C-O and C-C stretchingvibrations of starch at 1023, 1080, and 1153 cm-1. Smallfeatures due to the presence of carbonyl groups in the doughare present at 2963, 2928, and 2854 cm-1 (C-H stretch of CH2
and CH3) and a shoulder centered around 1740 cm-1 (carbonylstretch of the fat triglyceride ester linkage) (31, 32). These peaksare more evident in the second derivative of the spectra; higherresolution plots of these regions is shown in Figure 7.
For each type of dough, PCA was performed on the rawspectral data in the range 4000-710 cm-1. In the case of strongbaker’s flour dough, the distribution of sample scores on PCs 1
Figure 7. ATR spectra of a strong baker’s flour dough collected over a 1 h proofing period with higher resolution plots of second derivative peaks in the2704–3074 and 1662-1851 cm-1 regions.
Dough Proofing by NIR and MIR Spectroscopy J. Agric. Food Chem., Vol. 56, No. 3, 2008 927
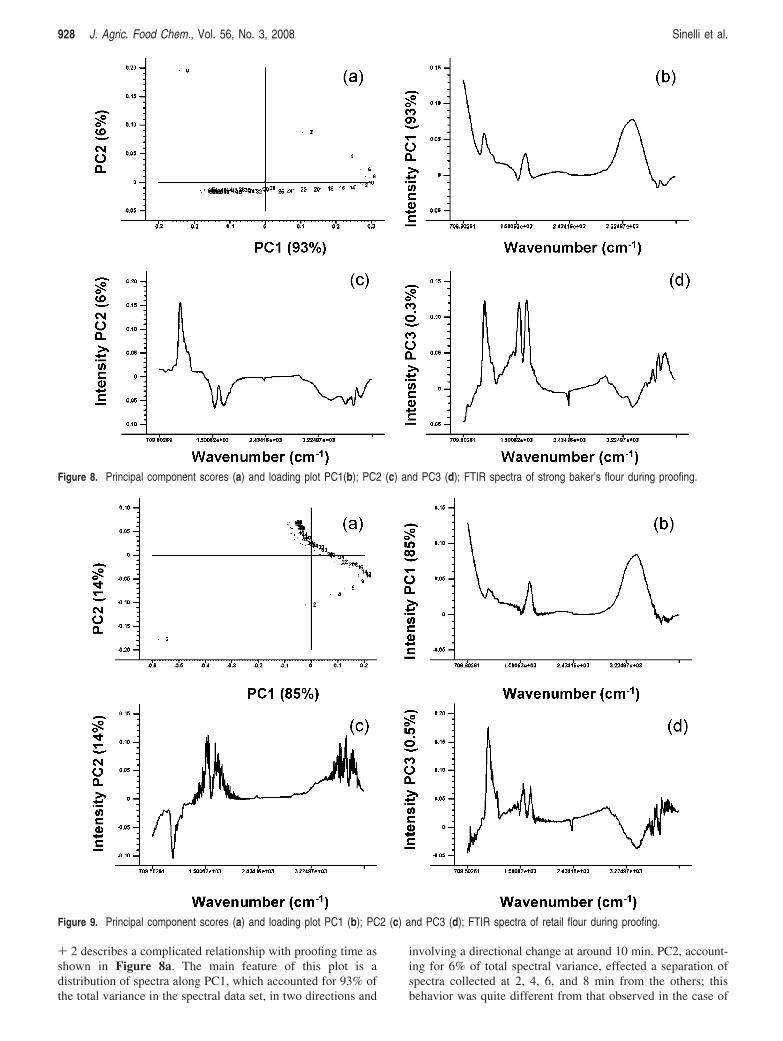
+ 2 describes a complicated relationship with proofing time asshown in Figure 8a. The main feature of this plot is adistribution of spectra along PC1, which accounted for 93% ofthe total variance in the spectral data set, in two directions and
involving a directional change at around 10 min. PC2, account-ing for 6% of total spectral variance, effected a separation ofspectra collected at 2, 4, 6, and 8 min from the others; thisbehavior was quite different from that observed in the case of
Figure 8. Principal component scores (a) and loading plot PC1(b); PC2 (c) and PC3 (d); FTIR spectra of strong baker’s flour during proofing.
Figure 9. Principal component scores (a) and loading plot PC1 (b); PC2 (c) and PC3 (d); FTIR spectra of retail flour during proofing.
928 J. Agric. Food Chem., Vol. 56, No. 3, 2008 Sinelli et al.
NIR spectra (Figure 3). Principal component 1 (Figure 8b) wascharacterized by positive contributions from water (3375 cm-1),starch (maxima at 1022, 1080, and 1150 cm-1), and protein(amide I, 1632 cm-1); the relative importance of these com-ponents was different from those in the original spectra withabsorptions due to water and starch being approximately equalin magnitude and larger than those arising from protein bands.Interestingly, absorbances arising from the amide II groupswhich were present in the original spectra were not significantin this principal component. The presence of fat was reflectedin a small shoulder centered around 2959 cm-1. In the case ofPC2 (Figure 8c), starch absorptions were positive and largestin magnitude; these were in opposition to minima at 1539 and1651 cm-1 (which may be ascribed to amide II and amide Ibands in protein, respectively) and water (28, 29). PC3 (Figure8d) accounts for less than 1% of the total variability in thesample data set but does influence the distribution of samplescores in a U-shape with time, suggesting the occurrence of aprocess which reverses. Examination of PC3 reveals the most
important molecular species to be associated with the amide Iand amide II protein bands (maxima at 1651 and 1543 cm-1);starch absorptions are present at slightly lower intensities. Smallpeaks are detectable at 1246 and 1317 cm-1; absorptions at thesefrequencies have been attributed to �-sheet and R-helicalconformations of gluten proteins (33), but given their magnitudein this plot and the degree of noise present, it is not possible tobe unequivocal about their importance.
Retail flour exhibits behavior which closely resembles thatof strong baker’s flour, i.e., a distribution of sample scores inone direction along PC1 until t ) 8–10 min followed by adirection reversal (Figure 9a). Plots of the principal componentswere very similar to those of baker’s flour although the relativesize of the major features differed somewhat. For example, inthe case of PC1 (Figure 9b), the relative importance of starchand protein absorptions by retail flour is reversed from thebaker’s flour situation. Gluten-free doughs exhibited behaviorwhich was quite different with regard to the sample scoredistribution; in this case, distribution along PC1 was on the basis
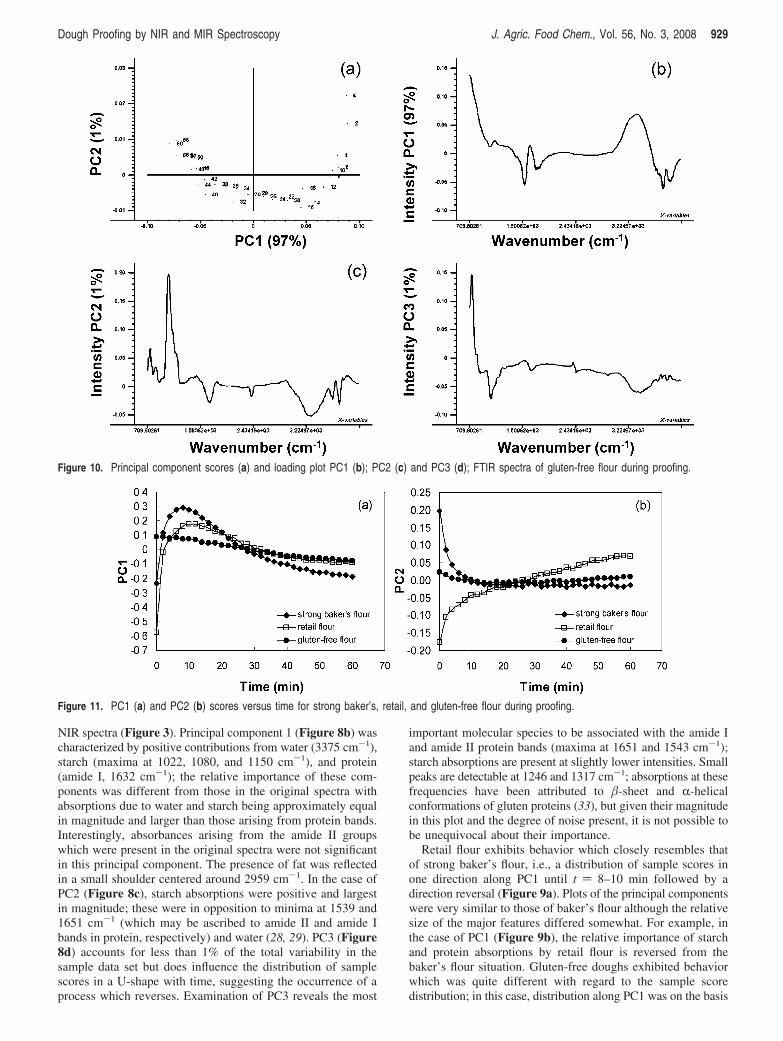
Figure 10. Principal component scores (a) and loading plot PC1 (b); PC2 (c) and PC3 (d); FTIR spectra of gluten-free flour during proofing.
Figure 11. PC1 (a) and PC2 (b) scores versus time for strong baker’s, retail, and gluten-free flour during proofing.
Dough Proofing by NIR and MIR Spectroscopy J. Agric. Food Chem., Vol. 56, No. 3, 2008 929
of time of proofing and the observed direction reversal was onPC2, with the change point occurring at around t ) 16 min(Figure 10a). With regard to the principal component graphs,the major features in PC1 were water and protein (amide II;1539 cm-1); in this component, small unattributed absorptionswere present at 1003, 1045, and 1070 cm-1. A positivecontribution by starch was the main feature in PC2, in oppositionto protein (amide I; 1632 cm-1) and water absorbances; anunattributed minimum at 2272 cm-1 was also present, whichwas approximately equal in magnitude to the protein absorbanceminimum.
As was the case for NIR spectra, the PC1 FTIR scores wereplotted against time (Figure 11). Examination of Figure 11areveals that doughs produced from strong baker’s and retail flourexhibit an increase in PC1 score value up to 8 min (strongbaker’s) and 12 min (retail) after mixing, respectively; after thismaximum value has been reached, scores decrease to reach aplateau minimum after about 50 min in both cases. In the caseof PC2 scores (Figure 11b), the behavior of strong baker’s andretail flours is in opposition; scores for strong baker’s flourdoughs decrease from a maximum at t ) 0 and level off fromaround t ) 20 min; for retail flour doughs, PC2 scores increaserapidly from a minimum at t ) 0 until around t ) 10 min andthen gradually through the remainder of the proofing time. Incontrast to these behaviors, gluten-free flour doughs exhibit aslow decline in score values on PC1 and a similar decline onPC2 up to about 15 min, after which they level off over thecomplete time course of the experiment. It is apparent from acomparison of Figures 6 and 11 that the recorded behavior ofthe doughs in the NIR and MIR spectral regions is different.The exact cause of this difference is unclear but may arise inpart from the different penetration depths of the respectiveradiation into dough samples.
DISCUSSION
It is apparent from the preceding results that both vibrationalspectroscopic techniques can identify changes in flour doughsduring proofing and that it is possible to suggest whichmacromolecular species are involved. However, certain differ-ences between the techniques are discernible. NIR data suggestthat (1) the main species involved during proofing relate to waterand starch and (2) doughs made from gluten-free flour behavein much the same way as the other two types. FTIR datacollected on the doughs made from the same flour types painta more detailed and nuanced picture; in particular, while therelative role of starch and water are as for the NIR data, principalcomponent analysis reveals a greater role for protein during thisdough development stage. With regard to gluten-free flourdoughs, FTIR data indicate behavior which contrasts with thatof the NIR data set. The main macromolecular species account-ing for dough changes during proofing was protein while starchwas of secondary importance and only present in PC2. However,a note of caution must be sounded regarding this comparison.While the NIR spectral data may be considered a goodapproximation of bulk dough properties given the likelypenetration distance into the sample, the ATR presentation usedfor collection of FTIR spectra only interacts with the sampledoughs to a distance which is measured in microns. This lattersampling technique therefore is restricted essentially to theobservation of phenomena on the dough surface.
A potential commercial exploitation of this approach couldinvolve the prediction of the optimum proofing time for anygiven flour dough using, for example, the time of maximumdeceleration of the spectral change process. That the time
obtained for strong baker’s flour to reach this point in the workreported in this paper (approximately 38 min) is slightly shorterthan the normal proofing time used for the Chorleywood breadprocess (50 min) suggests that a reevaluation of this time maybe merited.
LITERATURE CITED
(1) Zhou, W.; Therdthai, N. Manufacture. In Bakery Products Scienceand Technology, 1st ed.; Hui, Y. H., Ed.; Blachwell Publishing:Ames, IA, 2006; pp 301–317.
(2) Abdelrahman, A.; Spies, R. Dynamic rheological studies of doughsystems. In Foundamentals of Dough Rheology; Faridi, H.,Faubion, J. M., Eds.; American Association of Cereal Chemists:St. Paul, MN, 1986; pp 87–103.
(3) Yang, C.-H. Fermentation. In Bakery Products Science andTechnology, 1st ed.; Hui, Y. H., Ed.; Blachwell Publishing: Ames,IA, 2006; pp 261–271.
(4) Dobraszczyk, B. J.; Campbell, G. M.; Gan, Z. Bread: an uniquefood. In Cereals and Cereal Products. Chemistry and Technology;Dendy, D. A., Dobraszczyk, B. J., Eds.; Aspen Publishers:Gaithersburg, MD, 2001; pp 182–232.
(5) De Leyn, I. Functional Additives. In Bakery Products Scienceand Technology, 1st ed.; Hui, Y. H., Ed.; Blachwell Publishing:Ames, IA, 2006; pp 233–259.
(6) Dobraszczyk, B. J. Measuring the rheological properties of dough.In Bread making, ImproVing quality; Cauvin, S. P., Ed.; CRCPress: Boca Raton, FL, 2000; pp 375–400.
(7) Dobraszczyk, B. J. Wheat and Flour. In Cereals and CerealProducts, Chemistry and Technology; Dendy, D. A. V., Dobraszc-zyk, B. J., Eds.; Aspen Publishers: Gaithersburg, MD, 2001; pp100–139.
(8) Czuchajowska, Z.; Pomeranz, Y. Gas formation and gas retention.I. The system and methodology. Cereal Food World 1993, 38,499–503.
(9) Hruskova, D.; Kucerova, I. The use of fermentograph for yeasteddough quality evaluation. Getreide, Mehl Brot. 2003, 57, 85–89.
(10) Cen, H.; He, Y. Theory and application of near infrared reflectancespectroscopy in determination of food quality. Trends Food Sci.Technol. 2007, 18, 72–83.
(11) Ozaki, Y.; McClure, W. F.; Christy, A. A. Near InfraredSpectroscopy in Food Science and Technology, 1st ed.; John Wileyand Sons: Hoboken, NJ, 2006; 408 pp.
(12) Williams, P.; Norris, K. Near Infrared Technology in theAgricultural and Food Industries, 2nd ed.; American Associationof Cereal Chemists: St. Paul, MN, 2001; 296 pp.
(13) Colthup, N. B.; Daly, L. H.; Wiberly, S. E. Introduction to Infraredand Raman Spectroscopy, 3rd ed.; Academic Press: New York,1990; 545 pp.
(14) Coates, J. Interpretation of Infrared Spectra, A Pratical Approach.In Encyclopaedia of Analytical Chemistry; Meyers, R. A., Ed.;John Wiley and Sons: Chichester, U.K., 2000; pp 10815–10837.
(15) Workman, J. Review of Interpretive Spectroscopy for Raman andInfrared. In Handbook of Organic Compounds; Workman, J., Ed.;Academic Press: London, 2001; pp 209–242.
(16) Osborne, B. G.; Fearn, T.; Miller, A. R.; Douglas, S. Applicationof near infrared spectroscopy to the compositional analysis ofbiscuits and biscuits dough. J. Sci. Food Agric. 1984, 35, 99–105.
(17) Osborne, B. G. Near infrared spectroscopic studies of starch andwater in some processed cereal foods. J. Near Infrared Spectrosc.1996, 4, 195–200.
(18) Wesley, I. J.; Larsen, N.; Osborne, B. G.; Skerritt, J. H. Non-invasive monitoring of dough mixing by near infrared spectros-copy. J. Cereal Sci. 1998, 27, 61–69.
(19) Psotka, J. Utilizing predictive technologies in milling and baking.Cereal Food World 1999, 44, 30–31.
(20) Alava, J. M.; Millar, S. J.; Salmon, S. E. The Determination ofWheat Breadmaking Performance and Bread Dough Mixing Timeby NIR Spectroscopy for High Speed Mixers. J. Cereal Sci. 2001,33, 71–81.
930 J. Agric. Food Chem., Vol. 56, No. 3, 2008 Sinelli et al.
(21) Welsey, I. J.; Larsen, N.; Osborne, B. G.; Skerritt, J. H. Monitoringof dough properties. U.S. Patent 6,342,259 B1. 2002.
(22) Ait Kaddour, A.; Barron, C.; Morel, M.-H.; Cuq, B. Dynamicmonitoring of dough mixing using near-infrared spectroscopy:physical and chemical outcomes. Cereal Chem. 2007, 84, 70–79.
(23) Gellagher, E.; Gormely, T. R.; Arendt, E. K. Crust and crumbcharacteristics of gluten free breads. J. Food Eng. 2003, 56, 153–161.
(24) Beebe, K. R.; Pell, R. J.; Seasholtz, M. B. Chemometrics, apractical guide; John Wiley and Sons: New York, 1998; 360 pp.
(25) Naes, T.; Isaksson, T.; Fearn, T.; Davies, A. M. C. A User-FriendlyGuide to MultiVariate Calibration and Classification; NIRPublications: Chichester, U.K., 2000; 344 pp.
(26) Golic, M.; Walsh, K.; Lawson, P. Short-wavelength near-infraredspectra of sucrose, glucose and fructose with respect to sugarconcentration and temperature. Appl. Spectrosc. 2003, 57, 139–145.
(27) Romano, A.; Toraldo, G.; Cavalla, S.; Masi, P. Description ofleavening of bread dough with mathematical modelling. J. FoodEng. 2007, 83, 142–148.
(28) Chiotellis, E.; Campbell, G. M. Proving of bread dough. I.Modelling the evolution of the bubble size distribution. FoodBioprod. Process. 2003, 81, 194–206.
(29) Benedetti, S.; Sinelli, N.; Buratti, S.; Riva, M. Shelf Life ofCresenza Cheese as Measured by Electronic Nose. J. Dairy Sci.2005, 88, 3044–3051.
(30) Sinelli, N.; De Dionigi, S.; Pagani, M. A.; Riva, M.; Belloni, P.Spettroscopia FT-NIR nel monitoraggio on-line di prodotti daforno: lievitazione e raffermamento. Tec. Molitoria 2004, 55,1075–1092.
(31) Van Velzen, E. J. J.; Van Duynhoven, J. P. M.; Pudney, P.;Weegels, P. L.; Van der Maas, J. H. Factors associated with doughstickiness as sensed by attenuated total reflectance infraredspectroscopy. Cereal Chem. 2003, 80, 378–382.
(32) Li, W.; Dobraszcyk, B. J.; Dias, A.; Gill, M. M. PolymerConformation Structure of Wheat Proteins and Gluten SubfractionsRevealed by ATR-FTIR. Cereal Chem. 2006, 83, 407–410.
(33) Seabourn, B. W.; Chung, O. K.; Seib, P. A.; Mathewson, P. R. Amethod for monitoring the rheology and protein secondarystructure of dough during mixing using FT-HATR spectroscopy.Available at http://www.scisoc.org/aacc/meeting/2003/abstracts.2003.
Received for review September 12, 2007. Revised manuscript receivedNovember 22, 2007. Accepted November 26, 2007.
JF0727138
Dough Proofing by NIR and MIR Spectroscopy J. Agric. Food Chem., Vol. 56, No. 3, 2008 931