Effect of Casein and Hydrocolloid on Maize Dough and ...
13
Int.J.Curr.Microbiol.App.Sci (2018) 7(4): 2058-2070 2058 Original Research Article https://doi.org/10.20546/ijcmas.2018.704.236 Effect of Casein and Hydrocolloid on Maize Dough and Chapati Properties Manju Bala 1* , Arun Kumar 2 , S.K. Nanda 1 and R.K. Gupta 1 1 ICAR-Central Institute of Post-Harvest Engineering and Technology, PAU, Ludhiana-141 004, Punjab, India 2 ICAR-Indian Agricultural Research Institute, Pusa, New Delhi-110 012, India *Corresponding author ABSTRACT Introduction More and more people are being diagnosed with gluten intolerance/ celiac disease. Such people who have allergy to gluten cannot take foods developed from cereals viz. wheat, rye, barley, kamut, spelt, oats, triticale etc. The only treatment to this disease is to avoid products containing gluten proteins. To tackle with the problem of celiac disease variety of grains are utilized. The most commonly used cereal flours are of rice, sorghum, maize, millets etc. The absence of gluten produces technological problems in the development of dough as well as product. To solve these technological problems, several additives have been tried which could mimic gluten properties (Sciarini et al., 2012). Keeping in view that gluten free products are usually developed from so to improve their nutritional value proteins from different sources have been added by different workers, which not only resulted in nutritional benefits but also improved volume, appearance and sensory aspects of the products. However, although initially the aim International Journal of Current Microbiology and Applied Sciences ISSN: 2319-7706 Volume 7 Number 04 (2018) Journal homepage: http://www.ijcmas.com It is difficult to handle the maize dough when chapaties (unleavened Indian bread) have to be prepared, due to the absence of gluten proteins in maize. For improving the dough handling and chapati making characteristics of maize and quality protein maize (QPM) flour, effect of addition of casein protein (5% to 15%, w/w) alone and with 3% hydoxy propyl methyl cellulose (HPMC) was studied. Rapid visco analysis of flour blends, rheological, textural, properties of dough and texture as well as sensory evaluation of chapaties was studied. Rapid visco analysis revealed that quality protein maize flour showed the higher values for peak, breakdown, final, and setback viscosities as compared to normal maize flour. Addition of casein alone as well as with HPMC hydrocolloid reduced the viscosity in maize and QPM flour. Rheological parameters like storage modulus (G') and loss modulus (G") increased with an increase in protein concentration. G* was maximum for the dough sample containing 15% casein and HPMC. Addition of 3% HPMC along with 10-15% casein increased the dough strength and extensibility in both maize and QPM flour blends. Chapaties prepared from QPM and maize flour dough containing 10% casein and 3% HPMC were soft and rated with overall acceptability of 8.20 and 7.90 as compared to control values of 6.50 and 6.15, respectively. Keywords Casein, Hydrocolloid, Maize, Rheology, Viscosity Accepted: 16 March 2018 Available Online: 10 April 2018 Article Info
-
Upload
khangminh22 -
Category
Documents
-
view
0 -
download
0
Transcript of Effect of Casein and Hydrocolloid on Maize Dough and ...

Int.J.Curr.Microbiol.App.Sci (2018) 7(4): 2058-2070
2058
Original Research Article https://doi.org/10.20546/ijcmas.2018.704.236
Effect of Casein and Hydrocolloid on Maize Dough and Chapati Properties
Manju Bala1*
, Arun Kumar2, S.K. Nanda
1 and R.K. Gupta
1
1ICAR-Central Institute of Post-Harvest Engineering and Technology, PAU,
Ludhiana-141 004, Punjab, India 2ICAR-Indian Agricultural Research Institute, Pusa, New Delhi-110 012, India
*Corresponding author
A B S T R A C T
Introduction
More and more people are being diagnosed
with gluten intolerance/ celiac disease. Such
people who have allergy to gluten cannot take
foods developed from cereals viz. wheat, rye,
barley, kamut, spelt, oats, triticale etc. The
only treatment to this disease is to avoid
products containing gluten proteins. To tackle
with the problem of celiac disease variety of
grains are utilized. The most commonly used
cereal flours are of rice, sorghum, maize,
millets etc.
The absence of gluten produces technological
problems in the development of dough as well
as product. To solve these technological
problems, several additives have been tried
which could mimic gluten properties (Sciarini
et al., 2012). Keeping in view that gluten free
products are usually developed from so to
improve their nutritional value proteins from
different sources have been added by different
workers, which not only resulted in nutritional
benefits but also improved volume,
appearance and sensory aspects of the
products. However, although initially the aim
International Journal of Current Microbiology and Applied Sciences ISSN: 2319-7706 Volume 7 Number 04 (2018) Journal homepage: http://www.ijcmas.com
It is difficult to handle the maize dough when chapaties (unleavened Indian bread) have to
be prepared, due to the absence of gluten proteins in maize. For improving the dough
handling and chapati making characteristics of maize and quality protein maize (QPM)
flour, effect of addition of casein protein (5% to 15%, w/w) alone and with 3% hydoxy
propyl methyl cellulose (HPMC) was studied. Rapid visco analysis of flour blends,
rheological, textural, properties of dough and texture as well as sensory evaluation of
chapaties was studied. Rapid visco analysis revealed that quality protein maize flour
showed the higher values for peak, breakdown, final, and setback viscosities as compared
to normal maize flour. Addition of casein alone as well as with HPMC hydrocolloid
reduced the viscosity in maize and QPM flour. Rheological parameters like storage
modulus (G') and loss modulus (G") increased with an increase in protein concentration.
G* was maximum for the dough sample containing 15% casein and HPMC. Addition of
3% HPMC along with 10-15% casein increased the dough strength and extensibility in
both maize and QPM flour blends. Chapaties prepared from QPM and maize flour dough
containing 10% casein and 3% HPMC were soft and rated with overall acceptability of
8.20 and 7.90 as compared to control values of 6.50 and 6.15, respectively.
K e y w o r d s
Casein,
Hydrocolloid,
Maize,
Rheology, Viscosity
Accepted:
16 March 2018
Available Online: 10 April 2018
Article Info

Int.J.Curr.Microbiol.App.Sci (2018) 7(4): 2058-2070
2059
of addition of proteins was to increase the
nutritional value of gluten free products,
lately, it has been reported that the formation
of a continuous protein phase is vital for
obtaining an improvement in the quality of
gluten free products (Matos et al., 2014).
Therefore, the selection of the protein source
with the appropriate functionality seems to
play an important role in the production of
gluten free products. Moreover, hyrdocolloids
such as carboxymethylcellulose (CMC) and
hydroxypropylmethylcellulose (HPMC) and
water combinations have been reported to
replace gluten in the rice based breads
(Ylimaki et al., 1988). Saha and Bhattacharya,
2010; Dixit and Bhattacharya, 2015 have
shown that rheological properties of rice
dough can be modified by addition of protein
and /or hydrocolloid.
In India, maize (Zea mays L.) has emerged as
the third important food grain crop after wheat
and rice. It is mainly utilized as a source of
human food (25%), animal feed (12%),
poultry feed (49%), industrial products mainly
as starch (12%), and 1% each in brewery and
as seed out of the total maize produce in India
(Dass et al., 2008). Majority of the people
living in the Indian subcontinent depend on
unleavened bread known as chapati. Maize
flour is used to make unleavened bread
(chapati), which is mainly consumed in a few
Northern states of India (Sandhu et al., 2007).
QPM is a special variety of maize which has
twice the amount of lysine and tryptophan
than normal maize. Maize as well as QPM is a
gluten free cereal, thus suitable to produce
foods addressed to celiac patients. The
utilization of maize as well as QPM for
making chapaties shows difficulty as it does
not form viscoelastic dough on kneading.
Understanding of the dough rheology is an
important parameter for handling with respect
to sheeting or rolling particularly with
chapaties. Keeping in view that sheeting of
maize chapati with rolling pin is difficult so in
order to improve dough handling
characteristics of maize and QPM flour the
present study was conducted to study the
effect of casein protein at different
concentrations along with hydrocolloid (3%
HPMC) on a) dough rheology and texture b)
on texture, sensory and nutritional
characteristics of chapaties.
Materials and Methods
Raw materials
Quality protein maize (HQPM-5) and maize
(HM-4) were procured from department of
plant breeding, ICAR-Indian Institute of
Maize Research, Ludhiana. The grains of
QPM and maize were cleaned and pulverized
into fine flour (Sieve Mesh No. 40 BSS;
0.401mm). The flour was packaged in air tight
containers till further use. The proximate
composition of the flour was determined by
AOAC (2000). Quality protein maize flour
contained 7.00 g/100 g moisture, 9.33 g/100 g
protein, 4.50 g/100 g crude fat, 1.33 g/100 g
minerals, 77.84g/100 g carbohydrates while
maize flour had 6.91g/100 g moisture, 9.28
g/100 g protein, 4.07 g/100 g crude fat, 1.45
g/100 g minerals and 79.29g/100 g
carbohydrates.
Pasting properties of flour with and without
additives
Pasting properties were determined using a
rapid visco analyzer (RVA) (Newport
Scientific model 4-SA, Warriewood,
Australia) by following the AACC Approved
Method No. 61-02 (AACC, 1995). The QPM
and maize flour blend suspension was
prepared by mixing 3.5 g flour blend sample
(14 g/100 g moisture basis) with 25 ml
distilled water in an aluminum canister.
Different parameters viz. peak viscosity, final
viscosity, breakdown (Peak viscosity- trough
viscosity) and setback (difference between

Int.J.Curr.Microbiol.App.Sci (2018) 7(4): 2058-2070
2060
final viscosity - trough viscosity) were
determined. Trough viscosity is defined as
minimum viscosity at 95°C. Viscosity values
were taken in cP.
Dynamic oscillatory measurements
A controlled stress/strain rheometer (Paar
Physica rheometer, MCR 301, Anton Paar
GmbH, Germany) was used to determine
dynamic rheological measurements of the
dough. The equipment was fitted with parallel
plate geometry (50 mm diameter, 1 mm gap).
The maize and QPM dough samples were
placed between the plates and after 5 min
resting time was given before starting the test.
The rim of the sample was coated with
paraffin oil in order to prevent evaporation
during the measurements. All the
measurements were performed at a
temperature of 25°C. In order to determine the
linear viscoelastic region (LVE) the strain
sweeps at 1 Hz frequency were carried out
from 0.01 to 100% at temperature 25°C.
Frequency sweep tests were performed from
0.01 to 10 Hz to determine the storage
modulus (G’), loss modulus (G”) and loss
tangent (tan) as a function of frequency. Two
replicates of each measurement were made.
Dough extensibility and Chapati making
properties of QPM and Maize flour
Dough extensibility study was done using
Kieffer rig on TA/XT2 Texture analyzer
(Stable Micro Systems, Surrey, England).
QPM and maize flour 90g was mixed with
90ml of water for 3 min in lab mixer. The
dough was rested for half an hour. For
preparing chapaties 30g of dough sample was
rounded and rolled in the form of chapati up
to a diameter of 140 mm and thickness of
2mm. Chapati was baked as per method of
Sandhu et al., 2007. The chapati was allowed
to cool for 10 min at 25°C and then placed in
polythene pouches and placed in air tight
containers at 25°C. Rectangular strips of 7x
1.5 cm were cut from the centre of the chapati
using a metal template. This strip of chapati
was then tested for extensibility on the
TA/XT2 Texture analyzer (Stable Micro
Systems, Surrey, England). One clamp was
attached to the moving arm of TA/XT2 and
the other was attached to the platform. A load
cell of 50 N was used at a cross head speed of
1 mm/s to pull the chapati strip apart until it
ruptured. From the force displacement curve
peak force to rupture (N) and extensibility
(mm) were calculated.
Sensory evaluation and proximate analysis
The sensory characteristics of chapaties were
evaluated by the sensory panel comprised of
15 semi trained persons aged between 25 and
50. All of the samples were coded with
random 3 digit numbers before presenting to
the panel. The panel was provided with
chapaties two in number for every
experimental sample and asked to score them
for different sensory attributes. Water was
provided to the panelists for rinsing the mouth
in between the evaluation of different samples.
Nine point hedonic scale was used to evaluate
the sensory characteristics such as appearance,
texture, flavor, taste and overall acceptability
for all the chapati samples. (BIS, 1971). The
chapati samples prepared from QPM and
maize flour were studied by the AOAC (2000)
methods, for moisture, crude fat, protein and
total ash content. For this the chapati was
crumbled, mixed uniformly and known weight
of the mixed material was taken to represent
the whole chapati. Three samples were used
as replicate each time.
Statistical analysis
Statistical analysis was done using SPSS
software, Version 16.0 (Pascal International
Software Solution, Boston, MA, USA). The
effect of casein protein and HPMC on pasting

Int.J.Curr.Microbiol.App.Sci (2018) 7(4): 2058-2070
2061
profile of flour, rheological properties of the
dough and textural properties of dough, and
chapati, nutritional and sensory properties of
the chapaties was studied using one-way
ANOVA, and means were compared using
least significant difference (LSD).
Results and Discussion
Pasting properties of flour blends
Pasting characteristics of maize and QPM
flour and the blends with casein and HPMC
are shown in Table 1. Significant differences
in the pasting properties of QPM, normal
maize flours and flours with added casein and
HPMC were observed. The pasting profiles
could be explained based on molecular
characteristics of the starch components such
as amylose or amylopectin contents (Nimsung
et al., 2007). QPM flour showed substantially
higher peak, breakdown, setback, and final
viscosity than that of normal maize flour. This
could be due to the varietal difference.
Moreover, the differences in the size and
shape of starch granules could have the effect
on pasting profiles.
The peak viscosity (PV) of starch paste has
been reported to be an important characteristic
to distinguish a given starch from the other
species of starch (Huang et al., 2006).
Significant variation in PV between maize and
QPM shows differences in their starch. Tester
and Morrison (1990) reported that the pasting
properties of starch are affected by amylose,
lipid content and branch chain length
distribution of amylopectin. The observed
variation might be due to changes in the
structure of the starch components i.e. branch
chain length distribution of amylopectin.
Pasting temperature (PT) provides an
indication of the minimum temperature
required to cook the flour. Results revealed
that there is no significant difference between
the PT of maize and QPM. Pasting
temperature for the flour blends ranged from
78.10 to 79.83 °C. PT increased with addition
of HPMC. It could be due to the reason that
hydrocolloid may compete with prime starch
chains and may be responsible for raising
gelatinization temperature.
Addition of casein significantly reduced the
viscosities in both flours. Viscosities further
dropped down when the flour blends with
casein were supplemented with HPMC. This
negative influence of protein and
hydrocolloids could be due to dilution of
starch component. Increasing concentration of
protein may compete with starch granules for
water absorption and thus cause hindrance in
the swelling of starch granules (Nimsung et
al., 2007). Similar decrease in viscosity with
addition of different concentration of whey
protein concentrate in water chestnut flour has
been reported by Sarabhai and Prabhasankar
(2015).
Breakdown viscosity (BV) for different flour
blends varied from 93.67 to 607.67cP. BV
expresses the ability of starches to withstand
heating at high temperature and shear
stress.BV of QPM was more than maize flour.
Higher BV may be due to the presence of
increased number of shorter amylopectin
branch chains (Patindol et al., 2005).
A negative correlation between long chains of
amylopectin and breakdown viscosity has
been reported by Han and Hamaker (2001). A
greater proportion of short branched chain
amylopectin may result in swollen, more
breakable starch granules. Maize flour with
15% protein and 3% HPMC showed the least
breakdown among all the studied samples.
The lowest BV of maize flour blend indicated
its high paste stability under heat and shear.
During the final cycle of cooling viscosity
increased further in all samples. This increase
Int.J.Curr.Microbiol.App.Sci (2018) 7(4): 2058-2070
2062
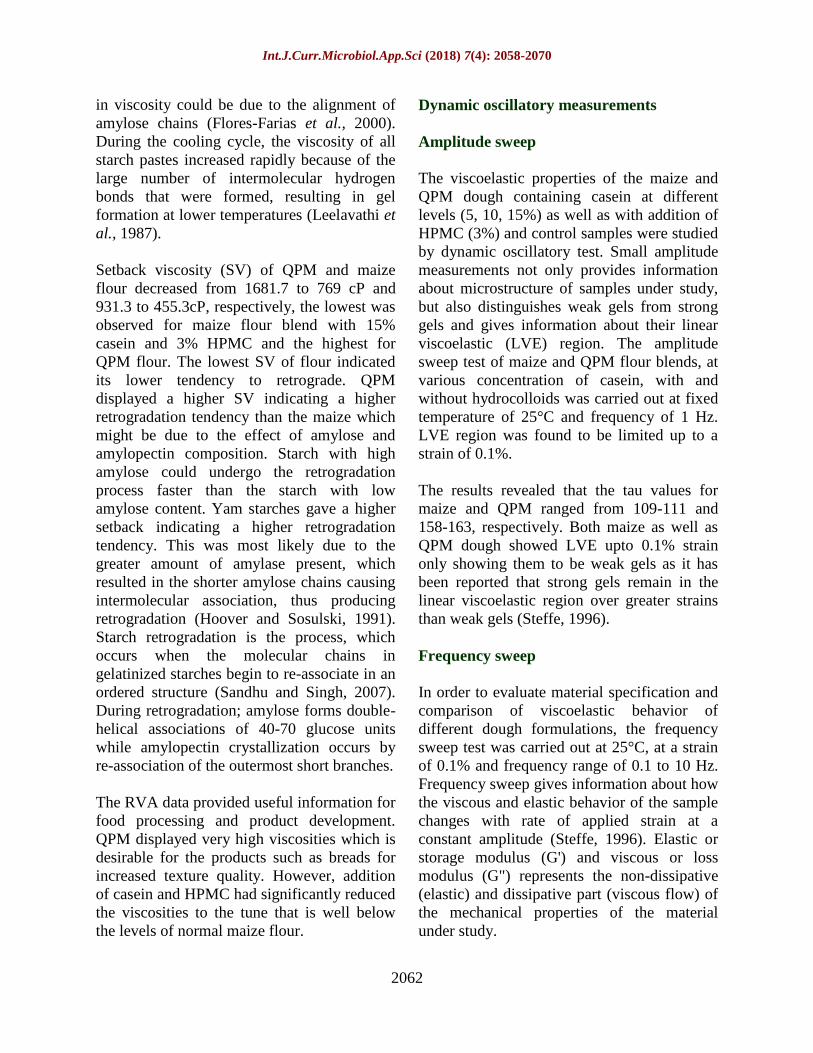
in viscosity could be due to the alignment of
amylose chains (Flores-Farias et al., 2000).
During the cooling cycle, the viscosity of all
starch pastes increased rapidly because of the
large number of intermolecular hydrogen
bonds that were formed, resulting in gel
formation at lower temperatures (Leelavathi et
al., 1987).
Setback viscosity (SV) of QPM and maize
flour decreased from 1681.7 to 769 cP and
931.3 to 455.3cP, respectively, the lowest was
observed for maize flour blend with 15%
casein and 3% HPMC and the highest for
QPM flour. The lowest SV of flour indicated
its lower tendency to retrograde. QPM
displayed a higher SV indicating a higher
retrogradation tendency than the maize which
might be due to the effect of amylose and
amylopectin composition. Starch with high
amylose could undergo the retrogradation
process faster than the starch with low
amylose content. Yam starches gave a higher
setback indicating a higher retrogradation
tendency. This was most likely due to the
greater amount of amylase present, which
resulted in the shorter amylose chains causing
intermolecular association, thus producing
retrogradation (Hoover and Sosulski, 1991).
Starch retrogradation is the process, which
occurs when the molecular chains in
gelatinized starches begin to re-associate in an
ordered structure (Sandhu and Singh, 2007).
During retrogradation; amylose forms double-
helical associations of 40-70 glucose units
while amylopectin crystallization occurs by
re-association of the outermost short branches.
The RVA data provided useful information for
food processing and product development.
QPM displayed very high viscosities which is
desirable for the products such as breads for
increased texture quality. However, addition
of casein and HPMC had significantly reduced
the viscosities to the tune that is well below
the levels of normal maize flour.
Dynamic oscillatory measurements
Amplitude sweep
The viscoelastic properties of the maize and
QPM dough containing casein at different
levels (5, 10, 15%) as well as with addition of
HPMC (3%) and control samples were studied
by dynamic oscillatory test. Small amplitude
measurements not only provides information
about microstructure of samples under study,
but also distinguishes weak gels from strong
gels and gives information about their linear
viscoelastic (LVE) region. The amplitude
sweep test of maize and QPM flour blends, at
various concentration of casein, with and
without hydrocolloids was carried out at fixed
temperature of 25°C and frequency of 1 Hz.
LVE region was found to be limited up to a
strain of 0.1%.
The results revealed that the tau values for
maize and QPM ranged from 109-111 and
158-163, respectively. Both maize as well as
QPM dough showed LVE upto 0.1% strain
only showing them to be weak gels as it has
been reported that strong gels remain in the
linear viscoelastic region over greater strains
than weak gels (Steffe, 1996).
Frequency sweep
In order to evaluate material specification and
comparison of viscoelastic behavior of
different dough formulations, the frequency
sweep test was carried out at 25°C, at a strain
of 0.1% and frequency range of 0.1 to 10 Hz.
Frequency sweep gives information about how
the viscous and elastic behavior of the sample
changes with rate of applied strain at a
constant amplitude (Steffe, 1996). Elastic or
storage modulus (G') and viscous or loss
modulus (G") represents the non-dissipative
(elastic) and dissipative part (viscous flow) of
the mechanical properties of the material
under study.

Int.J.Curr.Microbiol.App.Sci (2018) 7(4): 2058-2070
2063
Table.1 Pasting characteristics of maize and quality protein maize blends
PV (cP) BV(cP) FV(cP) SV(cP) PT (Min) TP (°C)
M control 1005.00f
307.00d
1629.33e
931.33e
4.65bcd
78.15b
M+5% C 770.67h
211.67e
1260.33h
706.67h
4.55cdfg
78.77ab
M+10% C 610.67j
196.33ef
954.00k
533.67j
4.45g
78.68ab
M+ 15% C 534.33k
162.00g
833.67l
454.33k
4.45g
79.08ab
M+5% C+3% H 680.00i
114.33h
1171.00i
636.67i
4.60bcdf
78.45b
M+10% C+3% H 560.67k
106.00hi
1032.00j
559.00j 4.51
fg 78.78
ab
M+ 15% C+3% H 438.00l
93.67i
839.00l
455.33k 4.51
fg 79.03
ab
Q control 1650.33a
607.67a
2769.33a
1681.67a
4.78a
78.43b
Q+5% C 1351.33b
449.00b
2207.67b
1282.67b
4.62bcd
78.10b
Q+10% C 1184.00c
447.00b
1694.67d
1052.33d
4.49fg
78.50b
Q+ 15% C 1063.00e
395.33c
1565.33f
884.00f
4.53dfg
78.48b
Q+5% C+3% H 1112.67d
188.67f
2031.00c
1127.00c
4.71ab
78.97ab
Q+10% C+3% H 958.00g
203.00ef
1655.00de
907.33ef
4.69ab
79.25ab
Q+ 15% C+3% H 777.00h
104.33hi
1421.67g
769.00g
4.67abc
79.83a
M: Maize; Q: QPM; C: Casein; H: Hydroxy propyl methyl cellulose; Tp: pasting temperature; PT: pasting time; PV,
FV, BV and SV: peak, final, breakdown and setback viscosity, respectively. Values are mean of three replications.
Values bearing same superscript do not differ significantly (p<0.05).
Table.2 QPM, maize based dough and chapati Texture studies and their sensory evaluation
Dough characteristics Chapati characteristics
Extensibility
(mm)
Rupture
force (g)
Extensibility
(mm)
Hardness
(g)
Sensory
score
M control 4.59c±0.64 5.6
def±0.33 4.21
a ±0.45 5.4
a±0.20 6.15
c±0.38
M+5% C 4.16c±0.35 7.65
ab±0.13 3.91
a ±0.40 3.6
b±0.35 6.55
c±0.44
M+10% C 3.51c±0.32 7.75
a ±0.17 3.81
a ±0.20 3.4
b ±0.12 6.30
c ±0.26
M+ 15% C 3.61c±0.67 7.8
a±0.15 3.21
a ±0.15 2.6
cd±0.17 6.85
b±0.70
M+5% C+3% H 10.19a ±0.30 6.9
c±0.17 3.51
a ±0.37 2.6
cd ±0.20 6.60
bc ±0.25
M+10% C+3% H 10.11a±0. 73 7.8
a±0.13 3.61
a ±0.31 2.8
cd ±0.40 7.90
a±0.40
M+ 15% C+3% H 9.20ab
±0.67 7.5ab
±0.33 3.44 a ±0.06 2.7
cd ±0.12 7.35
a,b±0.60
Q control 4.45c±0.45 5.1
f±0.25 4.73
a ±0.21 5.4
a ±0.20 6. 50
bc±0.68
Q+5% C 3.74c±0.68 5.9
c±0.26 4.15
a ±0.33 3.1
bc±0.36 6.40
c±0.94
Q+10% C 3.27c±0.44 7.4
ab ±0.15 3.83
a ±0.60 2.7
cd ±0.12 6.48
bc±0.60
Q+ 15% C 3.21c±0.67 7.1
bc±0.18 4.68
a ±0.38 2.3
d± 0.15 7.10
b,c±0.52
Q+5% C+3% H 9.06ab
±0.30 5.8de
±0.50 4.47 a ±0.66 2.2
d ±0.10 6.20
c±0.75
Q+10% C+3% H 8.93ab
±0.73 7.1bc
±0.14 4.53 a ±0.23 2.3
d±0.15 8.20
a±0.63
Q+ 15% C+3% H 8.58b±0.67 7.0
bc±0.17 4.00
a ±0.10 2.2
d±0.06 7.25
b±0.68
M: Maize; Q: QPM; C: Casein; H: Hydroxy propyl methyl cellulose. Values are mean of three replications. Values
bearing same superscript do not differ significantly (p<0.05).

Int.J.Curr.Microbiol.App.Sci (2018) 7(4): 2058-2070
2064
Table.3 Proximate composition of chapaties prepared from maize and quality
protein maize flour blends
Sample Moisture Protein Fat Ash Total Carbohydrates
M control 31.54(0.19)h 3.10(0.10)
e 4.13(0.15)
ab 0.92(0.01)
ef 60.30(0.09)
a
M+5% C 37.43 (0.93)bc
4.91(0.31)d 3.65(0.17)
c 0.92(0.01)
fg 53.09(1.35)
cde
M+10% C 35.17(0.10) fg
8.01(0.14)bc
3.28(0.08)c 0.90(0.01)
g 52.65(0.19)
def
M+ 15% C 34.45(0.48) g 9.68(0.16
a 3.19(0.27)
c 1.02(0.01)
bc 51.66(0.51)
fg
M+5% C+3% H 35.67(0.21)ef
4.47(0.24)d 3.62(0.19)
bc 0.91(0.01)
fg 54.94(0.49)
b
M+10% C+3% H 36.63(0.18)de
7.57(0.26) bc
3.25(0.05)c 0.94(0.02)
de 51.91(0.30)
efg
M+ 15% C+3% H 35.47(0.15)ef
9.62(0.16) a 3.20(0.13)
c 0.99(0.01)
c 50.72(0.12)
g
Q control 32.07(0.43)h 3.37(0.32)
e 4.25(0.05)
a 1.01(0.01)
bc 59.31(0.31)
a
Q+5% C 36.77 (0.25)cd
4.62(0.24)d 3.30(0.23)
c 1.02(0.01)
bc 54.29(0.71)
bc
Q+10% C 37.97(0.45) b 8.28(0.19)
b 3.37(0.13)
c 1.05(0.01)
a 49.34(0.56)
h
Q+ 15% C 38.17(0.29) b 9.73(0.21)
a 3.25(0.23)
c 1.03(0.02)
ab 47.82(0.34)
i
Q+5% C+3% H 37.53(0.30)bc
4.37(0.15)d 3.31(0.18)
c 0.91(0.01)
fg 53.85(0.36)
bcd
Q+10% C+3% H 39.31(0.55)a 8.03(0.06)
bc 3.23(0.24)
c 0.96(0.01)
d 48.46(0.43)
hi
Q+ 15% C+3% H 38.22(0.21)b 9.50(0.30)
a 3.37(0.31)
c 0.95(0.01)
de 47.96(0.40)
i
M: Maize; Q: QPM; C: Casein; H: Hydroxy propyl methyl cellulose. Values are mean of three replications. Values
bearing same superscript do not differ significantly (p<0.05).
Fig.1 Frequency sweep analysis of QPM flour dough information about G' and G"
10 4
10 5
10 6
Pa G'
G''
0.01 0.1 1 10 Hz
Frequency
QPM+5%C+ H
QPM+ 10% C+H
QPM +15%C+ H
' '
QPM+ 15% C
'
Control
QPM+5 %C
QPM +10% C
C refers to casein and H refers to HPMC.

Int.J.Curr.Microbiol.App.Sci (2018) 7(4): 2058-2070
2065
Fig.2 Frequency sweep analysis of maize flour dough giving information about G' and G"
Fig.3 Frequency sweep analysis of QPM flour dough information about G*
10 4
10 5
10 6
Pa
|G*|
0.01 0.1 1 10 Hz Frequency f
QPM+C5%+H
QPM+C10%+H
QPM+C15%+H
QPM+C5%
QPM+ C10%
QPM+C15%
QPM CONTROL
C refers to casein and H refers to HPMC.
10 3
10 4
10 5
10 6
Pa
G'
G''
0.01 0.1 1 10 Hz Frequency
M+10% C+ H
M+15% C+ H
Maize control
M+ 5%C
M+10%C
M+15%C
M+5%C+H HHHh++ +h+H+Hsein,H
C refers to casein and H refers to HPMC.

Int.J.Curr.Microbiol.App.Sci (2018) 7(4): 2058-2070
2066
Fig.4 Frequency sweep analysis of maize flour dough giving information about G*
Mechanical spectra of all the tested samples
showed that values for storage or elastic
modulus (G') were higher than the values for
loss or viscous modulus (G") at all the tested
frequency range (Fig. 1 and 2), which
suggested a solid elastic behavior of the
dough samples. It has been reported that low
moisture containing corn flour doughs
without any added gum showed more
viscoelastic solid behavior than samples with
higher moisture content and or gum.
As per Lai and Liao (2002) material showing
higher values of (G') could be classified as
elastic gels. Addition of protein and
hydrocolloid increased the values of dynamic
moduli (G') and (G") of dough as compared to
control dough which showed that the new
hydrophilic and hydrophobic interactions may
be developing in the system.
The highest values of storage (G') and loss
(G") moduli and large difference in their
values were observed for maize flour sample
containing 15% casein and QPM flour with
15% casein and 3% HPMC and as compared
to control, which showed that these flour
formulations contributed to a less viscous but
more elastic property (Lee and Inglett, 2006).
The increase in elastic character is reported to
be responsible for shape retention properties
during dough handling (Inglett et al., 2013).
The values of loss tangent (tan δ) are obtained
from the ratio of energy lost to the energy
stored (G"/G'). As compared to maize, tan
values were less for QPM dough. In present
study QPM flour formulation with 5% and
10% casein alone and 10% casein and 15%
casein with 3% HPMC and maize flour
formulations with 15% casein alone and with
HPMC showed consistency in the value of tan
over a certain frequency range and for all
studied samples (G') was more than (G"). It
has been suggested that material shows elastic
or rubber like behavior if the value of (G') is
independent of frequency and greater than
(G") over a certain frequency range (Inglett et
10 4
10 5
10 6
Pa
|G*|
0.01 0.1 1 10 Hz Frequency f
M+C5%+H
M+C10%+H
M+C15%+H
M Control M+C5% M+C10% M+C15%
C refers to casein and H refers to HPMC.

Int.J.Curr.Microbiol.App.Sci (2018) 7(4): 2058-2070
2067
al., 2013). Therefore, results revealed that
addition of casein (10-15%) in presence of
hydrocolloid showed increase in elasticity of
dough (Fig. 1 and 2).
The complex modulus (G*) gives information
(Fig. 3 and 4) about the elasticity and the
viscosity of the material; which in turn gives
information on the strength of the samples
(Fevzioglu et al., 2012). Highest G* values
were obtained for dough with 15% casein
followed by 15% casein and HPMC in case of
maize, while for QPM dough prepared from
15% casein and HPMC showed highest G*
value. Highest G* values indicated a strong
structure compared to the other doughs.
Textural properties of dough and chapati
It has been reported that textural qualities of
dough and chapati directly affect its overall
acceptability (Yadav et al., 2008). Addition of
casein alone at all studied levels of
concentration (5-15%) did not significantly
affect the dough extensibility in QPM and
maize flour. However, addition of 3% HPMC
increased the dough extensibility in both
QPM and Maize flour blends having casein at
different levels (Table 2). The dough
extensibility ranged from 3.21-9.06 mm and
3.51-10.19 mm for QPM and maize flour
blends, respectively. The addition of gum/
hydrocolloid in dough can induce several
changes. It can affect the protein network
formation, allow dough plasticity and
cohesiveness. The maximum force required to
rupture the dough was found to increase with
addition of casein at all concentrations, with
and without HPMC.
In case of chapati samples the force needed to
extend the chapati strip increased during
extension and reached a maximum before the
strip ruptured, followed by a decrease.
Control chapaties from QPM and maize
showed peak force required to rupture
chapaties as 4.35N and 4.21N, respectively
and these values decreased significantly with
addition of casein (Table 2). The data
revealed that chapaties prepared from QPM
and Maize flour with addition of casein alone
as well as with hydrocolloid were soft in
texture as compared to their control samples
due to less peak load values.
Extensibility of chapati did not improve on
addition of casein and hydrocolloid. Chapati
extensibility in QPM and maize ranged from
3.83–4.73 and 3.21–4.21, respectively (Table
2). Although dough extensibility increased
significantly with hydrocolloid but increase in
chapati extensibility was not observed with
addition of hydrocolloid in the presence of
protein. This behavior could be correlated
with results of Stathopoulos and O'Kennedy
(2008) who have reported that aggregated
casein samples were more elastic than gluten
at room temperature but upon heating
produced materials that were weaker and had
a predominately viscous character. However,
increase in extensibility of wheat flour dough
chapati with addition of
carboxymethylcellulose (CMC) has been
reported (Gujral and Pathak, 2002).
Sensory analysis and nutritional
composition
The sensory analysis of the fresh chapati was
performed. This was carried out by 15 semi-
trained panelists using a 10 point hedonic
scale. The chapati prepared from flour with
10% protein and 3% HPMC scored highest
for QPM as well as maize and showed
significant difference from control samples
(Table 2). Proximate analysis (Table 3) of
chapaties showed that addition of casein
alone and casein with HPMC significantly
increased the moisture content of chapati. It
showed that addition of protein as well as
hydrocolloid helped to retain more water and
as a result chapaties were more pliable and

Int.J.Curr.Microbiol.App.Sci (2018) 7(4): 2058-2070
2068
showed lower peak load during texture
studies. An inverse relation between rate of
firming of chapati and water has also been
reported by Roger et al., (1988). As reported
by Sahraiyan et al., (2013), the extent of
water absorption increases markedly when
hydrocolloids are used alone or in
combination. Protein content of chapaties
increased with increase in concentration of
casein. Fat content was slightly less than
control chapaties. This slight decrease could
be due to increased concentration of protein.
Chapati samples with more moisture and
protein showed less value for carbohydrate
content.
The results revealed that the progressive
addition of casein in QPM and maize flour
decreased the viscosity parameters
significantly and this decrease was dependent
on percentage of casein addition. Rheological
data revealed that dough containing 15%
casein and HPMC showed highest strength.
Dough extensibility studies revealed that
addition of HPMC (3%) along with protein at
all concentrations significantly increased
extensibility of dough as compared to control.
Incorporation of protein and hydrocolloid
improved the flours of QPM and maize.
Panelists rated the chapaties containing 10%
casein and 3% HPMC with overall
acceptability of (8.20 and 7.90) as compared
to control (6.50 and 6.15) for QPM and maize
flour, respectively. From the results it can be
inferred that a judicious selection of protein
and/or hydrocolloid in appropriate levels can
develop QPM as well as maize dough that
possess the desirable handling properties for
preparation of different products.
Acknowledgements
The authors acknowledge Dr. Ramesh Kumar,
Senior Scientist (Plant Breeding), ICAR-
IIMR, Ludhiana for providing QPM and
maize grains. Help provided for texture
analysis by Dr M.S. Alam, College of
Agricultural Engineering, PAU, Ludhiana,
facilities and financial support extended by
the Director, ICAR-CIPHET, Ludhiana,
Punjab (India) and Indian Council of
Agricultural Research (ICAR), New Delhi
(India) is also acknowledged.
References
AACC. 1995. American Association of
Cereal Chemist, approved methods of
the AACC (9th edn.). St. Paul, MN: The
Association.
Association of Official Analytical Chemists
(AOAC). 2000. Official Methods of
Analysis (17th
edn.) (MD, USA).
BIS. 1971. Indian Standard IS: 6273 Part I
and Part II. Guide for sensory
evaluation of foods. New Delhi: Indian
Standard Institution (BIS), Manak
Bhawan.
Dass, S., Jat, M.L., Singh, K.P., and Rai,
H.K. 2008. Ago-economic analysis of
maize based cropping systems in India.
Indian J Fert., 4, 53–62.
Dixit, Y., and Bhattacharya, S. 2015.
Rheological and sensory behaviour of
rice flour dough: effect of selected
additives in relation to dough flattening.
J Food Sci. Technol., 52, 4852-4862.
Fevzioglu, M., Hamaker, B. R., and
Campanella, O. H. 2012. Gliadin and
Zein Show Similar and Improved
Rheological Behavior when Mixed with
High Molecular Weight Glutenin. J
Cereal Sci., 5, 265-271.
Flores-Farias, R., Martinez-Bustos, F.,
Salinas-Moreno, Y., Chang, Y. K.,
Hernandez, J. S., and Rios, E. 2000.
Physicochemical and rheological
characteristics of commercial
nixtamalised Mexican corn flours for
tortillas. J Sci. Food Agric., 80, 657–
664.

Int.J.Curr.Microbiol.App.Sci (2018) 7(4): 2058-2070
2069
Gujral, H. S., and Pathak, A. 2002. Effect of
composite flours andb additives on the
texture of chapati. J Food Eng., 55,
173–179.
Han, X.Z. and Hamaker, B.R. 2001.
Amlyopectin fine structure and rice
starch breakdown. J Cereal Sci., 34,
279-284.
Hoover R., Sosulski F.W.1985.Studies on the
functional characteristics and
digestibility of starches from Phaseolus
vulgaris biotypes. Stärke, 37, 181–191.
Huang, C.C., Lin, M.C. and Wang, C.C.R.
2006. Changes in morphological,
thermal, and pasting properties of yam
(Dioscorea alata) starch during growth.
Carbo Poly., 64, 524-531.
Inglett, G. E., Chen, D. and Lee, S. (2013).
Rheological Properties of Barley and
Flaxseed Composites. Food Nutrit. Sci.,
4, 41-48. Lai L.S., and Liao, C.L. 2002. Dynamic
rheology of structural development in
starch/decolourised hsian-tsao leaf gum
composite systems. J Sci. Food Agric.,
82, 1200-1207. DOI: 10.1002/jsfa.1171.
Lee, S. and Inglett, G. E. 2006. Functional
characterization of steam jet-cooked β-
Glucan rich barley flour as an oil barrier
in frying batters. J Food Sci., 71, E308-
E313. DOI: 10.1111/j.1750-
3841.2006.00121.x
Leelavathi, K., Indrani, D., & Sidhu, J. S.
1987. Amylograph pasting behaviour of
cereal and tuber starches. Stärke,
39(11), 378-381. http://dx.doi.org/10.
1002/star.19870391103
Matos, M.E., Sanz, T. and Rosell, C.M. 2014
Establishing the function of protein on
the rheological and quality properties of
rice based gluten free muffins. Food
Hydrocoll.
Nimsung, P., Thongngam, M. and Naivikul,
O. 2007. Compositions, morphological
and thermal properties of green banana
flour and starch. Natural Sci., 41, 324–
330.
Patindola, J., Wanga, Y. J., Jane, J. L. (2005).
Structure-functionality changes in
starch following rough rice storage.
Starch/stärke, 57,197–207 DOI
10.1002/star.200400367.
Rogers, D. E., Zeleznak, K. J., Lai, C. S., and
Hoseney, R. C. 1988. Effect of native
lipids, shortening, and bread moisture
on bread firming. Cereal Chem., 65,
398.
Saha S, Bhattacharya S.2010. Hydrocolloids
as thickening and gelling agents in food:
a critical review. J Food Sci. Technol.,
47, 87–597. doi: 10.1007/s13197-010-
0162-6.
Sahraiyan B, Naghipour F, Karimi M,
Davoodi, M.G.2013. Evaluation
of Lepidium sativum seed and guar gum
to improve dough rheology and quality
parameters in composite rice-wheat
bread. Food Hydrocoll. 30, 698–703.
doi: 10.1016/j.foodhyd.2012.08.013.
Sandhu, K.S., and Singh, N. 2007. Some
properties of corn starches II:
physicochemical, gelatinization,
retrogradation, pasting and textural
properties. Food Chem., 101, 1499-
1507.
Sandhu, K.S., Singh, N., Malhi, N.S. 2007.
Some properties of corn grains and their
flours I: Physicochemical, functional
and chapati-making properties of flours.
Food Chem., 101, 938–946.
Sarabhai, S. and Prabhasankar, P.
2015.Influence of whey protein
concentrate and potato starch on
rheological properties and baking
performance of Indian water chestnut
flour based gluten free cookie dough.
LWT-Food Sci. Technol., 63:1301-1308.
Sciarini, L.S., Ribotta, P D., Leon A. E., and
Perez, G. T. 2012. Incorporation of
several additives into gluten free breads:

Int.J.Curr.Microbiol.App.Sci (2018) 7(4): 2058-2070
2070
Effect on dough properties and bread
quality. J Food Eng., 111, 590–597.
Stathopoulos, C.E., and O'Kennedy, B.T.
2008. A Rheological Evaluation of
Concentrated Casein Systems as
Replacement for Gluten: Calcium
Effects. Int. J Dairy Technol., 61 (4),
397-402.
Steffe, J.F. 1996. Rheological Methods in
Food Process Engineering, second ed.
Freeman Press, USA, pp. 324e336.
Tester, R F., and Morrison, W. R. 1990.
Swelling and gelatinization of cereal
starches. I. Effects of amylopectin,
amylose, and lipids. Cereal Chem.,
67,551-55.
Yadav, D. N., Patki, P.E., Mahesh, C.,
Sharma, G.K., and Bawa, A.S. (2008)
Optimization of baking parameters of
chapati with respect of vitamin B1 and
B2 retention and quality. Int. J Food
Sci. Technol., 43:1474-1483.
Ylimaki G, Hawrysh ZJ, Hardin RT,
Thomson ABR 1988. Application of
response surface methodology to the
development of rice flour yeast breads:
Objective measurements. J Food
Sci. 1988; 53:1800–1805. doi:
10.1111/j.1365-2621.1988.tb07846.x
How to cite this article:
Manju Bala, Arun Kumar, S.K. Nanda and Gupta, R.K. 2018. Effect of Casein and
Hydrocolloid on Maize Dough and Chapati Properties. Int.J.Curr.Microbiol.App.Sci. 7(04):
2058-2070. doi: https://doi.org/10.20546/ijcmas.2018.704.236