Dough aeration and rheology: Part 1. Effects of mixing speed and headspace pressure on mechanical...
10
Journal of the Science of Food and Agriculture J Sci Food Agric 85:2184–2193 (2005) DOI: 10.1002/jsfa.2236 Dough aeration and rheology: Part 1. Effects of mixing speed and headspace pressure on mechanical development of bread dough Nyuk L Chin and Grant M Campbell ∗ Satake Centre for Grain Process Engineering, Department of Chemical Engineering, UMIST, Manchester, M60 1QD, UK Abstract: A laboratory-scale Tweedy-type mechanical dough development mixer was modified to monitor work inputs of dough during mixing through a computerised data acquisition system. Recorded torque showed a curve that increased to a peak about midway through mixing. Using this system, the effects of mixing speed and pressure on the development of doughs made from strong and weak flours mixed to a work input of 40 kJ kg −1 were studied. Mixing was characterized in terms of peak torque and torque at the end of mixing (end torque), and in terms of the number of blade revolutions at these two reference points. The peak torque and the end torque both increased with increasing mixing speed. The peak torque increased with increasing mixer headspace pressure, but the end torque did not. The number of blade revolutions to both the point of peak torque and to the end of mixing decreased with increasing mixing speed for both flours, implying dough development at higher speeds was more efficient. Increasing headspace pressure reduced the number of revolutions to the peak, but not to the end of mixing. These results provide evidence that achieving dough development is not independent of mixing speed in Tweedy- type mixers, and that dough aeration, as affected by mixer headspace pressure, affects dough rheology and hence development in the mixer. 2005 Society of Chemical Industry Keywords: bread dough mixing; aeration; rheology; mechanical dough development ABBREVIATIONS CBP Chorleywood Bread Process ISP instantaneous specific power MDD mechanical dough development TSE total specific energy INTRODUCTION Dough aeration and rheology are fundamental to breadmaking. Aeration gives bread products their volume and distinctive shapes and provides appeal- ing textural and organoleptic properties. The aerated structure of bread is made possible by rheological properties resulting from the presence of the unique gluten proteins in wheat flour. When a flour–water mixture is developed into a dough, the gluten forms a viscoelastic network capable of trapping and retain- ing gas bubbles. 1–7 The changes occurring in dough during mixing have been widely investigated using rhe- ological measurements. 8–14 Empirical testing methods on dough using, for example, the Farinograph, Mixo- graph, Alveograph and Extensigraph have been per- formed since the early days of cereal science and, more recently, fundamental testing methods using dynamic oscillatory rheometry have been applied to doughs, 15–22 although the relevance of these small deformation tests to bread doughs are periodically questioned. 23,24 Studies on dough development with respect to both dough aeration and rheology, simultaneously, are limited. The first reported work was by Baker and Mize 2,3,25 and Baker, 1 who demonstrated that gases were progressively occluded in doughs during mixing in various mixers. They found that the occlusion of gas into dough increased with the rise in the Mixogram and was fastest at its peak, after which further occlusion continued slowly; the maximum rate of gas occlusion appeared to coincide with the peak of the Mixogram. These conclusions were confirmed by Junge et al 5 while investigating the effect of surfactants on air incorporation in doughs. The increase in dough strength on prolonged mixing may be due, in part, to oxygen uptake which facilitates oxidation processes, enhances dough development and results in a strong and resilient gluten structure that entraps gases. 26 However, mixing time (or total work input) has an independent effect on dough strength, as ∗ Correspondence to: Grant M Campbell, Satake Centre for Grain Process Engineering, Department of Chemical Engineering, UMIST, Manchester, M60 1QD, UK E-mail: [email protected] Contract/grant sponsor: University Putra Malaysia (Received 4 August 2004; revised version received 8 December 2004; accepted 2 February 2005) Published online 20 June 2005 2005 Society of Chemical Industry. J Sci Food Agric 0022–5142/2005/$30.00 2184
-
Upload
independent -
Category
Documents
-
view
3 -
download
0
Transcript of Dough aeration and rheology: Part 1. Effects of mixing speed and headspace pressure on mechanical...
Journal of the Science of Food and Agriculture J Sci Food Agric 85:2184–2193 (2005)DOI: 10.1002/jsfa.2236
Dough aeration and rheology: Part 1. Effectsof mixing speed and headspace pressure onmechanical development of bread doughNyuk L Chin and Grant M Campbell∗Satake Centre for Grain Process Engineering, Department of Chemical Engineering, UMIST, Manchester, M60 1QD, UK
Abstract: A laboratory-scale Tweedy-type mechanical dough development mixer was modified to monitorwork inputs of dough during mixing through a computerised data acquisition system. Recorded torqueshowed a curve that increased to a peak about midway through mixing. Using this system, the effects ofmixing speed and pressure on the development of doughs made from strong and weak flours mixed toa work input of 40 kJ kg−1 were studied. Mixing was characterized in terms of peak torque and torque atthe end of mixing (end torque), and in terms of the number of blade revolutions at these two referencepoints. The peak torque and the end torque both increased with increasing mixing speed. The peaktorque increased with increasing mixer headspace pressure, but the end torque did not. The number ofblade revolutions to both the point of peak torque and to the end of mixing decreased with increasingmixing speed for both flours, implying dough development at higher speeds was more efficient. Increasingheadspace pressure reduced the number of revolutions to the peak, but not to the end of mixing. Theseresults provide evidence that achieving dough development is not independent of mixing speed in Tweedy-type mixers, and that dough aeration, as affected by mixer headspace pressure, affects dough rheologyand hence development in the mixer. 2005 Society of Chemical Industry
Keywords: bread dough mixing; aeration; rheology; mechanical dough development
ABBREVIATIONSCBP Chorleywood Bread ProcessISP instantaneous specific powerMDD mechanical dough developmentTSE total specific energy
INTRODUCTIONDough aeration and rheology are fundamental tobreadmaking. Aeration gives bread products theirvolume and distinctive shapes and provides appeal-ing textural and organoleptic properties. The aeratedstructure of bread is made possible by rheologicalproperties resulting from the presence of the uniquegluten proteins in wheat flour. When a flour–watermixture is developed into a dough, the gluten formsa viscoelastic network capable of trapping and retain-ing gas bubbles.1–7 The changes occurring in doughduring mixing have been widely investigated using rhe-ological measurements.8–14 Empirical testing methodson dough using, for example, the Farinograph, Mixo-graph, Alveograph and Extensigraph have been per-formed since the early days of cereal science and,
more recently, fundamental testing methods usingdynamic oscillatory rheometry have been applied todoughs,15–22 although the relevance of these smalldeformation tests to bread doughs are periodicallyquestioned.23,24
Studies on dough development with respect toboth dough aeration and rheology, simultaneously,are limited. The first reported work was by Baker andMize2,3,25 and Baker,1 who demonstrated that gaseswere progressively occluded in doughs during mixingin various mixers. They found that the occlusionof gas into dough increased with the rise in theMixogram and was fastest at its peak, after whichfurther occlusion continued slowly; the maximum rateof gas occlusion appeared to coincide with the peak ofthe Mixogram. These conclusions were confirmed byJunge et al5 while investigating the effect of surfactantson air incorporation in doughs. The increase indough strength on prolonged mixing may be due,in part, to oxygen uptake which facilitates oxidationprocesses, enhances dough development and resultsin a strong and resilient gluten structure that entrapsgases.26 However, mixing time (or total work input)has an independent effect on dough strength, as
∗ Correspondence to: Grant M Campbell, Satake Centre for Grain Process Engineering, Department of Chemical Engineering, UMIST,Manchester, M60 1QD, UKE-mail: [email protected]/grant sponsor: University Putra Malaysia(Received 4 August 2004; revised version received 8 December 2004; accepted 2 February 2005)Published online 20 June 2005
2005 Society of Chemical Industry. J Sci Food Agric 0022–5142/2005/$30.00 2184

Effects of mixing speed and headspace pressure on bread dough
reported by Tschoegl et al,27 who performed doughmixing in air and under nitrogen and observed anincrease in dough strength in both. Most other doughaeration and rheology studies have been performedas distinct and separate topics. For example, thebidirectional relationship between dough rheology andmixing (ie dough rheology affects mixing patterns,while the mixing action develops dough rheology) hasbeen established through many studies;28–32 however,these studies have not included measurement orconsideration of the aeration of the dough and itsrelationship to rheology.
The dough aeration studies pioneered by Bakerand Mize continued following the introduction of theChorleywood Bread Process (CBP) in 1962.33,34 Thisis a mechanical dough development (MDD) processin which work is imparted intensively to dough in ahigh-speed batch mixer.35,36 A distinctive feature ofthe CBP is mixing the dough under partial vacuum(to improve loaf quality by reducing the initial gascontent of the dough) or, more recently, under positivepressure followed by partial vacuum, and this hasprompted numerous studies of dough aeration in theCBP.37–51
With conventional recording mixers such as theFarinograph and Mixograph, the guide to when adough is fully developed is when it displays thegreatest resistance to mixing (highest torque onthe mixer blade). This peak dough developmentstage is broadly interpreted as the stage when thedough gluten network structure is best able to trapand retain occluded gas bubbles. In contrast, inMDD breadmaking processes such as the CBP,mixing provides a measured energy input of typically40 kJ kg−1 of dough for full development.52 Zounis andQuail53 noted that since the banning in many countriesof potassium bromate, which makes doughs moretolerant to undermixing, it has become more criticalto achieve correct dough development in the mixer.Wilson et al54 described a dough probe designed toallow the point of peak development in an MDDmixer to be identified.
The extent of mixing or the amount of energyrequired to develop a dough depends on variousfactors, including mixing speed, mixer design andflour characteristics. Numerous studies of the effectof mixing speed on dough development in variousdesigns of mixer and on the resulting baked loafquality have been reported in the literature. Thesecan be broadly classified into those based on relativelylow-speed mixers or laboratory rheometers such as theFarinograph and Mixograph,28,32,53,55–58 and thosebased on high-speed mechanical dough developmentmixers.29,30,52,54,59–63 In the former case, the peak inthe dough development curve is of interest as a basisfor deciding bakery mixing times to deliver optimumbaked loaf quality. Several workers have concludedthat operating the Farinograph at a faster speed makesidentification of the peak dough development pointclearer, and that it correlates better with bakery mixing
time.53,57 Anderssen et al58 highlighted the need tocharacterize the effect of mixing speed in terms ofthe number of revolutions of the mixer blade toachieve some datum point (peak development in theMixograph, in their case), rather than mixing time, anddemonstrated that the number of revolutions to reachpeak development in the Mixograph was independentof the mixing speed, although the resistance of thedough at the point of peak development was larger atgreater speeds.
Frazier et al61 reviewed the evolution of mechanicaldough development processes to that time in terms ofrheological development in the mixer, noting that ‘theChorleywood Bread Process was the first breadmakingsystem in which an effective rheological parameter,the work expended on the dough, was used directlyas a means of controlling the process’. Earlier, Heapset al59 noted that, with regard to the CBP at that time,‘Much emphasis has been placed on the optimum levelof work required to develop a dough, but relativelylittle experimental effort has been directed towardsinvestigating the importance of the rate of work input.’Their work concluded that there existed both anoptimum level of work input and an optimum rate. Inthe same year, the group at Chorleywood re-examinedtheir previous recommendation that a work input ofaround 40 kJ kg−1 was suitable for a wide range of flourtypes, concluding that an increase in mixing speedallowed a reduction in work input while maintainingbread quality, and that mixing too slowly appeared tobe a greater hazard to bread quality than mixing tooquickly.52 However they did not conclude that therewas a significant benefit to be gained by changingtheir earlier recommendation to use a fixed work inputfor the range of flour types typically encountered incommercial practice in the UK. Kilborn and Tipples29
examined the relationship between mixing intensityand dough development for different flours in greatdetail, concluding that both the level and the rate ofwork input for optimum development depended onboth the flour type and the mixer type. They proposedthe concept of a critical minimum mixing speed toachieve development, also dependent on both the flourand the mixer type.
The point of optimum dough development andits relationship to mixing speed are the major issuesin the above studies. Optimum development ismost unambiguously identified by baking trials, tofind the extent of development that delivers thebest bread. However, such tests are inconvenientlytime consuming and unsuitable for on-line control.Rheological tests on the dough, either within a mixeror outside of it, are more convenient and thereforewidely employed; hence the persistent optimism thatthe point of peak dough development indicatedby a Farinograph or Mixograph might be robustlycorrelated with baking performance. (The limitationsof these instruments in this respect are beyondthe scope of this paper but have been discussedelsewhere, eg by Muller,23 who concludes that ‘much
J Sci Food Agric 85:2184–2193 (2005) 2185

NL Chin, GM Campbell
is known about the rheology of dough per se andalso its relation to dough structure. However, whenapplied to bakery technology, the direct usefulness ofdough rheology is very limited.’ Zounis and Quail53
compared the times to peak dough developmentindicated by the Farinograph and Mixograph, andnote that the former can give results that are distinctlymisleading in terms of optimum mixing time in thebakery, because it runs slowly.) Frazier et al61 ask thequestion ‘What constitutes ‘‘optimum’’ mechanicaldough development for breadmaking, and does thisnecessarily correspond to the point of minimummobility (peak torque), under whatever conditions areemployed, irrespective of work input?’ They note that‘The literature is fairly evenly divided on this topic’and conclude that ‘Up to the present time, . . . mixingstudies have not clearly resolved the question of whatconstitutes optimum mechanical dough development.’Wilson et al54 similarly note that ‘The literature issomewhat contradictory on whether the rate of workinput affects the amount of work required to mixto peak.’ Part of this apparent contradiction arisesfrom the different reference points used by differentworkers; many have taken their datum as the pointof peak development in the mixer,29,53,54,57,58,63 andperhaps measured the work input required to achievethis as a dependent variable, irrespective of the extentof development actually achieved at the peak, whileothers30,52,61 have examined the effects of mixingspeed and total work input both as independentvariables in a matrix, and evaluated the degree ofdevelopment achieved through rheological tests and/orbaking trials.
Another contributor to the contradictory results isthe effect of high-speed mixing on the time availablefor adequate hydration of the dough ingredients.54,59
Wilson et al54 suggested that ‘it may be that higherwork inputs are required for higher mixing speeds(shorter mixing times) due to time dependenthydration effects.’ They noted that Kilborn andTipples29 used a slow-speed premix of the ingredients,thereby allowing time for hydration, and found that thework input required for peak dough development didnot change with mixing speed, which was in contrastwith the findings of Frazier et al,61 who did not use aslow-speed premix in their work.
Frazier et al61 highlighted that an alternative toevaluating the rheology of doughs through mixingtorque curves is to perform rheological tests onrested doughs, acknowledging that this approachis very laborious and time consuming. These testsappear to indicate rheological optima at work inputsmuch greater than those indicated by peak torqueduring mixing. They presented results that suggestedthat loaf volume and texture are better correlatedwith rheological parameters obtained from resteddoughs (eg relaxation time) than with mixing curveparameters. They argue that tests on rested doughsindicate permanent rheological features, while changes
in dough structure contributing to the torque peakmust be of a temporary nature.
Another theme of many of the above studiesis ‘mixing efficiency’, which is generally foundto improve at faster mixing speeds.29,30,61 Thisconclusion depends, however, on the definition ofmixing efficiency, which can be defined variously as‘the amount of work imparted to the dough by eachrevolution of the blade’,29,30 ‘the degree of doughdevelopment achieved for a given amount of energyexpended’,61 or ‘the work input required to developdough to a defined point, for example, to the peak ofthe mixing curve’.54 This third definition, combinedwith the regular observation that faster mixing speedsrequire greater work inputs to achieve peak doughdevelopment53,61 (possibly because of insufficient timefor hydration, as noted above), could lead to theconclusion that increasing mixing speed decreasesefficiency, as more work is required to achieve peakdough development. This, however, fails to recognisethat the degree of dough development at the peak isalso greater, so one is not comparing like with like. Thesecond definition encompasses both the mechanicalefficiency of imparting energy to the dough, and theeffectiveness in using this energy to develop the doughstructure, and is probably the best definition. Frazieret al61 note that the sensitivity of dough developmentto work rate makes it desirable for constant rates ofwork input to be employed in dough mixers usedfor research. Kilborn and Tipples64 discussed thecommercial benefits of MDD mixing at a constantrate of work input.
The most common type of high-speed industrialMDD mixer in those countries that have widelyadopted the CBP (the UK, New Zealand, Australia,South Africa and Israel) is the Tweedy-type (TweedyCompany, Burnley, UK),54,63 described by Skeggsand Kingswood30 as having ‘a unique mixing action’for which the rotor torque is approximately constantand does not reflect changes in dough consistencyin the way that the Farinograph and Mixograph do,such that the degree of dough development cannotbe determined from the curve of torque versus mixingtime.54 This arises because the mixing patterns inthis design of mixer change considerably as thedough develops: initially the hydrated viscous massmoves around the bottom of the bowl, then later,as elasticity develops and the dough becomes morecoherent, the mass moves more to the top of the mixerbowl, such that it interacts with the blade differentlyand thereby gives an approximately constant torqueon the blade. Skeggs and Kingswood30 and Wilsonet al54 have studied dough development in relationto mixing speed in this type of mixer. Skeggs andKingswood,30 using a pilot-scale Tweedy 10 mixer(designed to mix doughs based on 10 lb (4.54 kg) offlour) found that dough consistency (as measuredby Farinograph) increased with both mixer speedand work input, and that increasing the mixer speedincreased the mixing efficiency (work input per mixer
2186 J Sci Food Agric 85:2184–2193 (2005)

Effects of mixing speed and headspace pressure on bread dough
revolution) and reduced the work input requiredto give the optimum loaf. Wilson et al54 aimed torelate the work input requirement indicated by alaboratory MDD mixer to that actually delivering peakdough development in an industrial-scale Tweedy-type mixer, using the dough probe to indicate peakdevelopment in the latter. They found that theindustrial-scale mixer was less sensitive to changes inwork input optima than the laboratory mixer, making itmore tolerant of different flours, which is an advantagein industry, while the laboratory-scale mixer’s greatersensitivity was advantageous for a research system.The industrial-scale mixer had a higher rate of workinput and required more work per kg to develop thedough, implying scope for improving the efficiencyof industrial-scale mixers. They suggested that slow-speed premixing to combine the ingredients beforehigh-speed development may be a way of lowering thework input requirement of industrial-scale Tweedy-type mixers. This is relevant because of the excessivedough temperature rises often experienced in bakeriesin the UK, New Zealand and Australia as a resultof the high work input requirements of new wheatbreeding lines. (Chamberlain et al52 had noted thatincreasing mixing speed to reduce the work input whilemaintaining bread quality was potentially a remedy toexcessive temperature rises.) It is also relevant becauseof the high costs of electricity for running MDDmixers; in the UK this amounts to an annual costto the baking industry of around £5 million.
Wilson et al54 found that peak torque in theirlaboratory-scale MDD mixer did not follow a powerlaw relationship at high mixing speeds, which theyattributed to greater aeration of the dough at highermixing speeds. Chamberlain et al52 also noted greateraeration of the dough at faster mixing speeds, butthat loaf quality improved despite this (owing tothe enhanced dough development). Beyond theseobservations, there has been little acknowledgementand no direct investigation of the effects of aeration ondough development as affected by mixing speed.
Studies of dough aeration are ongoing in ourlaboratories, mainly based around mixing doughsin a scaled-down version of industrial Tweedy-typemixers commonly used in CBP processes in theUK. The mixer is designed to mix doughs basedon approximately 1 lb of flour (454 g), and henceis referred to, unofficially, as the ‘Tweedy 1’ mixer.It has the facility to mix under pressure, vacuumand modified atmospheres, and at various speeds orwith various blade designs. A data acquisition systemallows the measurement and recording of the torqueand speed during mixing. The objective of the currentwork was to investigate the effect of blade speed onmixing parameters (peak torque and torque at the endof mixing, and the number of blade revolutions toreach these points) in this design of laboratory-scalemixer and, more originally, to investigate whetherheadspace pressure in the mixer had a discernibleeffect on the dough development. Subsequent papers
in this series report work using this mixer to investigatedough aeration and the rheology of rested doughs asfunctions of mixing speed and work input, and toinvestigate the effects of the gas content of doughs ontheir measured rheology.
EXPERIMENTALDescription of the data acquisition set-upFigure 1 shows the set-up of a data acquisition PCsystem designed and constructed to monitor andrecord the torque and speed during dough mixingin the Tweedy 1. The mixer bowl (1) is connectedto a compressed air supply or to a gas panel (D-58 454, Witt-Gasetechnik GmbH & Co., Witten,Germany) which monitors the ratio of nitrogen,carbon dioxide and oxygen gases up to 3 bar (absolute)and a vacuum application down to 0.07 bar in themixer headspace during mixing. The gas flow rateis controlled by an adjustable flowmeter. The speedsensor (2) is a home-built unit comprising an opticalencoder sensor, a frequency to voltage converterunit and a power unit (National Semiconductor,Farnell Electronic Components Ltd, Leeds, UK).The optical encoder sensor senses rotational speedfrom the reflective tapes on the mixer shaft givingtwo pulses per revolution. The signal sensing by theoptical encoder sensor was checked to make surethat the pulses are square and equal using Picoscopesoftware (Pico Technology Ltd, St Neots, UK). The12 V frequency to voltage converter unit, which hasa built-in comparator, converts the frequency signalsfrom the optical encoder sensor into voltage whichis read by the speed indicator (7) (ADP15-RTL,Amber Instruments Ltd., Chesterfield, UK). Thetorque transducer (3) (EEL Limited, UK) measuresthe torque on the mixer blade. The 0.37 kW motor(4) (Brown Pestell Ltd, Chatham, UK) is connected tothe mixer shaft and powered through a speed controller(5) (Eurotherm Ltd, Worthing, UK), a frequencyinverter designed for speed control of standard phaseinduction motors. The power indicator (6) (ADP15-DIV, Amber Instruments Ltd, Chesterfield, UK) is asupplement unit used as a dual-input module thathas two non-isolated inputs (0–10 V) which takereadings from the speed (7) and torque (8) indicatorsfor calculation of power in watts. The speed indicator(7) operates as a passive indicator displaying in realengineering units (rpm). It is an analogue to digitalconverter that provides a continuous display of aninput variable and gives full digital linearisationand scaling of input variables. The torque indicator(8) (ADW15, Amber Instruments Ltd, Chesterfield,UK) is connected to the strain gauges in the torquetransducer and displays in real engineering units (Nm).A DC analogue output with full scaling over anydesired range and inversion is available if necessary.The ADC11 (9) (Pico Technology Ltd, St Neots,UK) is a 12-bit medium-speed analogue to digitalconverter with 11 analogue input channels and one
J Sci Food Agric 85:2184–2193 (2005) 2187

NL Chin, GM Campbell
1.Tweedy 1 mixer
3.Torquetransducer
6. Power indicator
7. Speed indicator
8. Torque indicator
5.Speed
controller
Powersource
9.ADC
10. PC
2. Optical encodersensor
Data acquisition
Vacuumsource
Compressed air /gas panel
4. Motor
Frequencyto voltageconverter
Powerunit
Figure 1. Schematic diagram of the data acquisition system to read work input during dough mixing in the Tweedy 1 mixer.
digital output. It has an input range of 0–2.5 V. AVisual Basic 6 program was written for the ADC’sdriver software in the computer (10) to collect andanalyse data from the indicators.51 Matching channelnumbers in the Visual Basic 6 program with the outputchannels of the ADC11 enables real-time relay oftorque and speed data, which then allows calculationof the instantaneous specific power (ISP) and totalspecific energy (TSE):
ISP = torque × rotational speeddough mass
(1)
TSE =∫ tm
0ISP · dt ≈
∑n
i=1(ISP)i · �t (2)
where tm is the total mixing time in seconds, �t is1 s and n is tm/�t. The bread dough formulation isentered into the program, allowing the ISP and TSE tobe reported per unit kg of dough. The program allowszeroing out of the no-load torque when the mixer isrun empty. The bearing resistance torque was checkedto ensure negligible effect of the mixing pressure on theno-load torque measurements by running the mixer atvarious pressures, either empty or filled with water.
Calibration and control of the systemTo check the torque recording system, a lever armwas fixed perpendicularly from the centre of the mixershaft. A pulley system with minimal resistance wasused to apply weights of known mass. The torqueexerted at the shaft was calculated and programmed
into the calibration for the torque indicator. Usingdifferent known weights, torque was created to obtaina correlation between the torque and digital voltageoutput signals read by the ADC. No hysteresis inthe output voltage was detected on increasing andthen decreasing the applied torque. The correlationwas included in the Visual Basic 6 program, whichrecords torque in Nm. The correlation between speedsread using a hand tachometer (RS Components Ltd,Stockport, UK) with the digital voltage output readby the ADC was used in the Visual Basic 6 program,which records the speed in rad s−1. The torque andspeed indicators were adjusted to enable amplificationof the response of torque and speed signals within theresolution limits and appropriate to the ranges studiedin the Tweedy 1 mixer.
Dough formulation and mixingDoughs from two flours with distinctively differentmixing characteristics, strong (President White) andweak (Soft Patent), both obtained from Nelstrop& Co Ltd (Stockport, UK), were prepared usingthe formulation given in Table 1. The three mixingspeeds were low, medium and high, corresponding toapproximately 40, 55 and 70 rad s−1, respectively. Themixing pressures were 0.07 or 0.17 bar (high vacuum),1 bar (atmospheric) and 2 bar (high pressure).
Table 2 shows the characteristics of flours usedbased on the standard analytical chemical tests bythe Approved Methods of the American Associationof Cereal Chemists.65 The moisture content was
2188 J Sci Food Agric 85:2184–2193 (2005)
Effects of mixing speed and headspace pressure on bread dough
Table 1. Dough formulation based on 400 g flour loading
Ingredient % on flour weight
Flour 100Water 60Salt 1.875Improver (Diamond)a 1.100
a full-fat soya flour, emulsifier E472e, dextrose, vegetable oil,flour treatment agent E300 and ascorbic acid (Arkady Craigmillar,Bromborough, UK).
Table 2. Characterization of the flours used in this study
Analysis Strong Weak
Moisture content (wet basis) (%) 11.95 11.80Ash (dry basis) (%) 0.58 0.93Protein (dry basis) (%) 14.3 7.8Farinograph peak (min) 4.5 3.0Farinograph absorption (%) 60.23 56.01Falling number (s) 360 420
determined using the oven drying method (Method44-15A), the ash content was determined using theLeco Ash, Moisture and Volatiles Analyser MAC-400(Leco Corporation, USA), the protein content (N ×5.75) was determined following the total Kjeldahlnitrogen method by Nessler,66 the Farinograph peakand flour water absorption were measured in theBrabender Farinograph at a consistency of 500 BUfollowing Method 54-21 and the falling numberfollowing Method 56-81B.
Peak dough development analysisThe recorded torque versus mixing time data wereanalysed following methods used by Hwang andGunasekaran.32 The peak torque point and thecorresponding time were determined using a 20 smoving-average data analysis function in MicrosoftExcel. The total number of mixer blade revolutionsrequired was calculated from the total time takento achieve peak torque multiplied by the averagerotational speed; the total number of blade revolutionsto the end of mixing was calculated similarly, but usingthe total time taken to achieve a work input (TSE) of40 kJ kg−1 of dough.
Error bars were calculated from replicate runs.Owing to the nature of the experimental design,which involved mixing doughs to different total workinputs (as described fully in Part 2 of this series67),different numbers of replicate data sets were availablefor each condition. Thus, in the case of the high andmedium mixing speeds, the reported peak values (oftorque, time to peak, number of revolutions to peakand work input at the peak) are averaged from fivereplicate runs, and the corresponding end values fromthree replicate runs. For the low mixing speed, peakvalues are averaged from three replicate runs, whileend values are from a single run. In nearly all cases,error bars were similar in size to or smaller than the
(a)
0
1
2
3
4
0 50 100 150 200
Time (s)
Tor
que
(Nm
)
0
20
40
60
80
Spe
ed (
rad
s−1 )
Torque (original trace)
Torque (20 s moving average)Speed
(b)
0
100
200
300
400
0 50 100 150 200Time (s)
Inst
anta
neou
s sp
ecifi
c po
wer
, IS
P (
W k
g−1 )
0
15
30
45
60
Tot
al s
peci
fic e
nerg
y, T
SE
(kJ
kg−
1 )
ISPTSE
Figure 2. Example of recorded (a) torque and speed, and (b) ISP andTSE of a dough mixing trial at high speed and atmospheric pressureusing the strong flour.
symbols used on the graphs, and have therefore beenomitted for clarity.
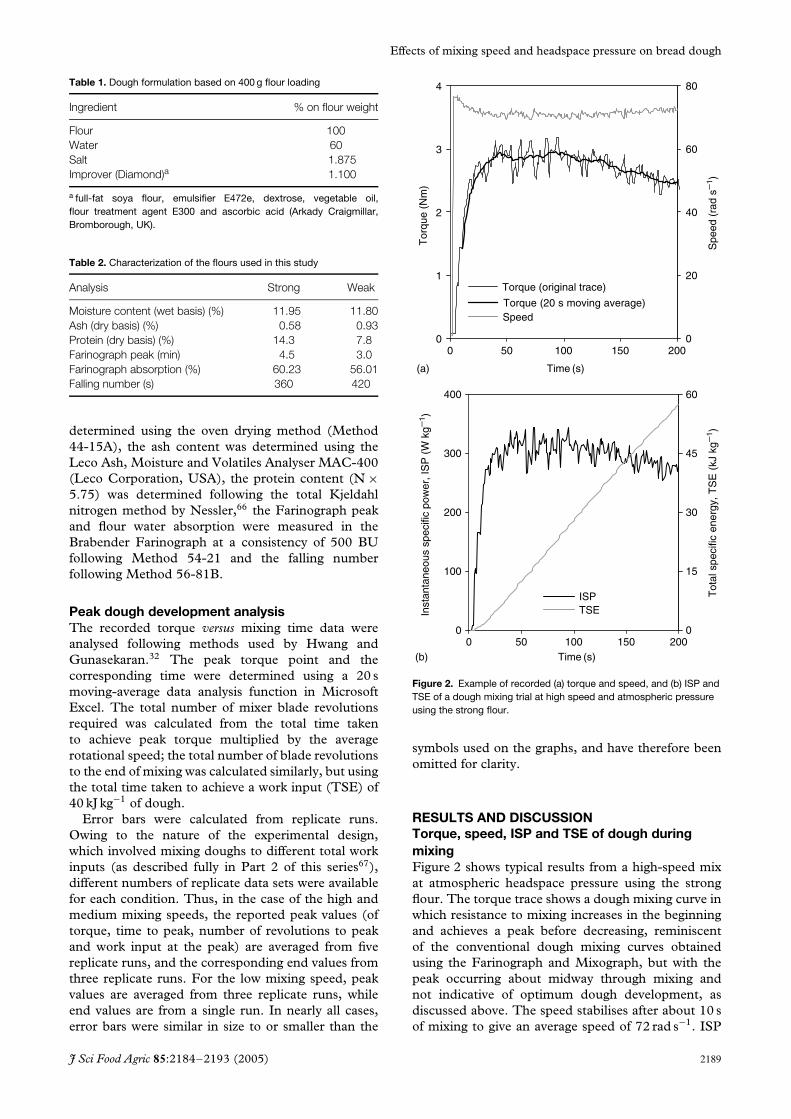
RESULTS AND DISCUSSIONTorque, speed, ISP and TSE of dough duringmixingFigure 2 shows typical results from a high-speed mixat atmospheric headspace pressure using the strongflour. The torque trace shows a dough mixing curve inwhich resistance to mixing increases in the beginningand achieves a peak before decreasing, reminiscentof the conventional dough mixing curves obtainedusing the Farinograph and Mixograph, but with thepeak occurring about midway through mixing andnot indicative of optimum dough development, asdiscussed above. The speed stabilises after about 10 sof mixing to give an average speed of 72 rad s−1. ISP
J Sci Food Agric 85:2184–2193 (2005) 2189

NL Chin, GM Campbell
changes following the pattern of torque with a range of210–300 W kg−1, and about 2.7 min is required to mixthe dough to a TSE of 40 kJ kg−1. The torque trace isless constant than Wilson et al54 imply, and the pointat which the peak occurred has therefore been used inthe following analysis, along with the end of mixing, asa basis for comparing dough development under thedifferent conditions of mixing speed and pressure. Wenote once again that the point of peak torque does notcorrespond to optimum development in this design ofmixer, but it does indicate changes in the interactionbetween the dough mass and the mixing blade whichresult from dough development, so is a useful basis fordetecting effects.
Effect of mixing speed and pressure on peak andend torqueFigure 3 shows the peak and end torque values fordoughs mixed from the two flours at various speeds.The peak torque increased with mixing speed andpressure for both flours. The effect of increasingmixing pressure on the increased peak torque ismore prominent for the weak flour doughs, possiblyreflecting the greater aeration exhibited by weakflour doughs,41,68 and is greater at faster mixingspeeds, reflecting the greater aeration as mixing speedincreases.41,68 The end torque also increased with
(a)
42 56 70
Speed (rad s−1)
0
1
2
3
4
End
tor
que
(Nm
)
0
1
2
3
4
42 56 70
Speed (rad s−1)
Pea
k to
rque
(N
m)
(b)
42 56 70
Speed (rad s−1)
0
1
2
3
4
End
tor
que
(Nm
)
0
1
2
3
4
42 56 70
Speed (rad s−1)
Pea
k to
rque
(N
m)
Figure 3. Peak and end torques for (a) strong and (b) weak flourdoughs developed at various mixing speeds at high vacuum (�),atmospheric (°) and high pressure (�).
mixing speed, but the effect of mixing pressure wasno longer so evident. Further studies are needed toelucidate the full details of the contribution of mixingpressure to dough development, but it is evident thataeration of the dough affects development, particularlyin the early stages of mixing. The contribution ofaeration is in part due to the availability of oxygenmixed into the dough, but may also reflect the physicalpresence of bubbles in the dough affecting its bulkrheology.
Effect of mixing speed and pressure on totalmixing time and number of mixer bladerevolutionsFigure 4 shows the total mixing time to the peak torqueand to the end of mixing. The total time to reach thepeak stage decreased with increasing mixing speed andpressure. The decrease in mixing time with increasingmixing speed is obvious and expected, but the effectof mixing pressure is again evident and less expected.Anderssen et al58 encouraged the use of number ofrevolutions to a particular datum, rather than mixingtime, to characterize the effects of mixing speed.Figure 5 shows that the total number of revolutionsrequired to achieve peak torque also decreased withincreasing mixing speed and pressure. Hence, the totalnumber of mixer blade revolutions required for doughdevelopment to the peak is clearly not rate independentover the range of speeds tested in this work. This is in
(a)
(b)
42 56 70
Speed (rad s−1)
0
200
400
600
800
Tot
al m
ixin
g tim
e to
end
tor
que
(s)
0
100
200
300
400
42 56 70
Speed (rad s−1)
Tot
al m
ixin
g tim
e to
pea
k to
rque
(s)
42 56 70
Speed (rad s−1)
0
200
400
600
800
Tot
al m
ixin
g tim
e to
end
tor
que
(s)
0
100
200
300
400
42 56 70
Speed (rad s−1)
Tot
al m
ixin
g tim
e to
pea
k to
rque
(s)
Figure 4. Total mixing time taken to achieve peak and end torquesfor (a) strong and (b) weak flour doughs mixed at various mixingspeeds at high vacuum (�), atmospheric (°) and high pressure (�).
2190 J Sci Food Agric 85:2184–2193 (2005)

Effects of mixing speed and headspace pressure on bread dough
(a)
42 56 70
Speed (rad s−1)
0
1200
2400
3600
4800
Tot
al n
umbe
r of
rev
olut
ions
to e
nd to
rque
0
600
1200
1800
2400
42 56 70
Speed (rad s−1)
Tot
al n
umbe
r of r
evol
utio
ns
to p
eak
torq
ue
(b)
42 56 70
Speed (rad s−1)
0
1200
2400
3600
4800
Tot
al n
umbe
r of
rev
olut
ions
to e
nd to
rque
0
600
1200
1800
2400
42 56 70
Speed (rad s−1)
Tot
al n
umbe
r of r
evol
utio
ns
to p
eak
torq
ue
Figure 5. Total number of mixer blade revolutions needed to achievepeak and end torques for (a) strong and (b) weak flour doughs mixedat various mixing speeds at high vacuum (�), atmospheric (°) andhigh pressure (�).
contrast with the findings of Anderssen et al58 whenusing a Mixograph. Figure 5 also indicates that peaktorque was achieved with fewer blade revolutions forthe weak flour dough, and that increasing mixingpressure reduced the number of blade revolutions topeak torque. Again, the aeration of the dough clearlyinfluenced the mechanical development of the dough’srheological structure.
Figures 4 and 5 also show the time and total numberof revolutions, respectively, to the end of mixing.As for peak torque, both parameters decreased withincreasing mixing speed, but the effect of headspacepressure was again not so evident. The decrease in thetotal number of revolutions to deliver the full workinput is in agreement with Skeggs and Kingswood,30
who concluded that mixing at faster speeds wasmore efficient (imparted more work to the doughper revolution of the mixer blade).
Effect of mixing speed and pressure on TSE atpeak torqueAll doughs were mixed to a final work input of40 kJ kg−1, but the proportion of this that was deliveredby the time the mixer blade registered peak torquevaried. Figure 6 shows that the TSE (or work input)achieved at peak torque increased with mixing speedbut decreased with mixing pressure, again highlightingthe point that aeration, as affected by headspacepressure, affects dough development.
The strong flour took more time (Fig 4) and totalnumber of revolutions (Fig 5) to produce a higher
42 56 70
Speed (rad s−1)
5
15
25
35
TS
E a
t pea
k to
rque
(kJ
kg−
1 )
5
15
25
35
42 56 70
Speed (rad s−1)
TS
E a
t pea
k to
rque
(kJ
kg−
1 )
Strong Weak
Figure 6. TSE at peak torque for strong and weak flour doughsmixed at various mixing speeds at high vacuum (�), atmospheric (°)and high pressure (�).
TSE (Fig 6) at the peak torque than the weakflour. This agrees with previous results on strongflour doughs which needed more energy for doughdevelopment.53,58,63 Strong flour doughs require morework for optimum development than doughs preparedfrom medium-strength flours when mixing in bothlow-speed28 and high-speed mixers.69
From Fig 6, the decrease in the work input achievedat peak torque with increasing mixing pressure againdemonstrates the effect of aeration on the doughrheology as it appears within the mixer. Mixing athigher pressures causes a higher peak torque andcauses peak torque to be achieved earlier, but resultsin a lower work input at peak torque. These effectsundoubtedly reflect the additional oxygen availabilitycontributing to dough development at higher mixingpressures, and may also reflect a different apparentrheology of the dough caused by the physical presenceof greater numbers of bubbles when mixed at higherpressures.42 The effects of aeration appear to be greatermidway through mixing, as indicated by the largeeffects on the point of peak torque, than by the endof mixing, possibly reflecting oxygen availability in theearly stages of mixing and depletion by the end, suchthat differences by the end of mixing were reduced.Further work, described in Part 3 of this series,70
was carried out under a pure nitrogen atmosphere toascertain whether the observed effects are solely as aresult of increased oxygen availability at higher mixingpressures, or whether the physical presence of bubbleshas an independent effect. Dough development issensitive to the nature and magnitude of shear andextensional strains experienced by the dough withinthe mixer. The different apparent viscoelasticity ofthe dough when bubbles are present may resultin different strain patterns and hence affect thedough development. It is well established that doughrheology affects aeration during mixing; this work nowdemonstrates the reciprocal effect, that aeration of thedough during mixing clearly affects dough rheologicaldevelopment.
J Sci Food Agric 85:2184–2193 (2005) 2191
NL Chin, GM Campbell
CONCLUSIONSThese results demonstrate that, as well as mixingspeed, mixing pressure also affects mechanical doughdevelopment. Increasing mixing speed increases thepeak torque but reduces the total mixing time andnumber of mixer blade revolutions to peak torqueand to the end of mixing. Increasing mixing pressureincreases the peak torque but reduces the total time,number of mixer blade revolutions and work inputat peak torque during dough mixing in the Tweedy1 mixer. Thus, dough aeration during mixing has adirect effect on the apparent dough rheology and thedough development process.
ACKNOWLEDGEMENTSThe authors thank Dr Frank Thompson from theDepartment of Electrical Engineering and Electronicsat UMIST for his help in setting up the Tweedy1’s data acquisition system, and Dr Peter Martinfor valuable comments on the manuscript, andacknowledge the Satake Corporation of Japan forsupport in establishing the activities of the SCGPE,and University Putra Malaysia for financial support toNL Chin’s course at UMIST.
REFERENCES1 Baker JC, The structure of the gas cell in bread dough. Cereal
Chem 18:34–41 (1941).2 Baker JC and Mize MD, The origin of the gas cell in bread
dough. Cereal Chem 18:19–34 (1941).3 Baker JC and Mize MD, Gas occlusion during dough mixing.
Cereal Chem 23:39–51 (1946).4 Bernardin JE and Kasarda DD, The microstructure of wheat
protein fibrils. Cereal Chem 50:735–745 (1973).5 Junge RC, Hoseney RC and Varriano-Marston E, Effect of
surfactants on air incorporation in dough and the crumbgrain of bread. Cereal Chem 58:338–342 (1981).
6 MacRitchie F, Physicochemical processes in mixing, in Chem-istry and Physics of Baking (Materials, processes and products),No 56, ed by Blanshard JMV, Frazier PJ and Galliard T. TheRoyal Society of Chemistry Special Publication, London,pp 132–146 (1985).
7 Eliasson A and Larsson K, Dough, in Cereals in Breadmaking, aMolecular Colloidal Approach. Marcel Dekker, Inc, New York,pp 261–324 (1993).
8 Wall JS and Beckwith AC, Relationship between structure andrheological properties of gluten proteins. Cereal Sci Today14:16–21 (1969).
9 Tschoegl NW, Rinde JA and Smith TL, Rheological propertiesof wheat flour doughs. II. Dependence on large deformationand rupture properties in simple tension on time, temperature,and water absorption. Rheol Acta 9:223–238 (1970).
10 Rasper VF and Danihelkova H, Alveography in fundamentaldough rheology, in Fundamentals of Dough Rheology, ed byFaridi H and Faubion JM. American Association of CerealChemists Inc, Minnesota, pp 169–180 (1987).
11 Bagley EB, Christianson DD and Martindale JA, Uniaxialcompression of a hard wheat flour dough: Data analysisusing the upper convected Maxwell model. J Texture Stud19:289–305 (1988).
12 Weipert D, The benefits of basic rheometry in studying doughrheology. Cereal Chem 67:311–317 (1990).
13 van Vliet T, Janssen AM, Bloksma AH and Walstra P, Strainhardening of dough as a requirement for gas retention. JTexture Stud 23:439–460 (1992).
14 Dobraszczyk BJ and Roberts CA, Strain hardening and doughgas cell-wall failure in biaxial extension. J Cereal Sci20:265–274 (1994).
15 Hibberd GE, Dynamic viscoelastic behaviour of wheat flourdoughs. II. Effect of water content in the linear region. RheolActa 9:497–500 (1970).
16 Hibberd GE, Dynamic viscoelastic behaviour of wheat flourdoughs. III. The influence of starch granules. Rheol Acta9:501–505 (1970).
17 Hibberd GE and Parker NS, Measurement of the fundamentalrheological properties of wheat-flour doughs. Cereal Chem52:1r–23r (1975).
18 Navickis LL, Anderson RA, Bagley EB and Jasburg BK, Vis-coelastic properties of wheat flour doughs: Variation ofdynamic moduli with water in protein content. J TextureStud 13:249–259 (1982).
19 Faubion JM, Dreese PC and Diehl KC, Dynamic rheologicaltesting of wheat flour doughs, in Rheology of Wheat Products,ed by Faridi H. American Association on Cereal ChemistsInc, Minnesota, pp 91–116 (1985).
20 Menjivar JA, Fundamental aspects of dough rheology, in DoughRheology and Baked Product Texture, ed by Faridi HA andFaubion JM. Van Nostrand Reinhold, New York, pp 1–28(1989).
21 Amemiya JL and Menjivar JA, Comparison of small and largedeformation measurements to characterize the rheology ofwheat flour doughs. J Food Eng 16:91–108 (1992).
22 Janssen AM, van Vliet T and Vereijken JM, Fundamental andempirical rheological behaviour of wheat flour doughs andcomparison with bread making performance. J Cereal Sci23:43–54 (1996).
23 Muller HG, Rheology and conventional bread and biscuitmaking process. Cereal Chem 52:89r–105r (1975).
24 Dobraszczyk BJ and Morgenstern MP, Review: Rheology andthe breadmaking process. J Cereal Sci 38:229–245 (2003).
25 Baker JC and Mize MD, Mixing doughs in vacuum and in thepresence of various gases. Cereal Chem 14:721–734 (1937).
26 Spooner TF, Controlled atmosphere. Baking and Snack Febru-ary:96–102 (1999).
27 Tschoegl NW, Rinde JA and Smith TL, Rheological propertiesof wheat flour doughs. I. Method for determining the largedeformation and rupture properties in simple tension. J SciFood Agric 21:65–70 (1970).
28 Stamberg OE and Bailey CH, Relationship of mixing speed todough development. Cereal Chem 15:739–748 (1938).
29 Kilborn RH and Tipples KH, Factors affecting mechanicaldough development. I. Effect of mixing intensity and workinput. Cereal Chem 49:34–47 (1972).
30 Skeggs PK and Kingswood KK, Mechanical dough develop-ment—Pilot scale studies. Cereal Chem 58:256–260 (1981).
31 Mani K, Eliasson A, Lindahl L and Tragardh C, Rheologicalproperties and breadmaking quality of wheat flour doughsmade with different dough mixers. Cereal Chem 69:222–225(1992).
32 Hwang CH and Gunasekaran S, Determining wheat doughmixing characteristics from power consumption profile ofa conventional mixer. Cereal Chem 78:88–92 (2001).
33 Chamberlain N, Collins TH and Elton GAH, The Chorley-wood Bread Process. Baker’s Dig 36:52–53 (1962).
34 Chamberlain N, Collins TH and Elton GAH, The mechanicaldevelopment of bread doughs, in Recent Advances in ProcessingCereals. Society of Chemical Industry, London, pp 173–195(1962).
35 Burth ND, Dough development by ultra-high speed mixing.Baker’s Dig 2:46–48 (1971).
36 French FD and Kemp DR, Automated mixing using Tweedyhigh-speed mixer. Cereal Foods World 30:344–346 (1985).
37 Chamberlain N, Advances in breadmaking technology, inBread: Social, Nutritional and Agricultural Aspects of WheatenBread, ed by Spicer A. Applied Science Publishers, London,pp 259–272 (1975).
2192 J Sci Food Agric 85:2184–2193 (2005)

Effects of mixing speed and headspace pressure on bread dough
38 Chamberlain N and Collins TH, The Chorleywood BreadProcess: The role of oxygen and nitrogen. Baker’s Dig53:18–24 (1979).
39 Campbell GM, The aeration of bread dough during mixing.PhD Thesis, Department of Chemical Engineering, Univer-sity of Cambridge, UK (1991).
40 Campbell GM, Rielly CD, Fryer PJ and Sadd PA, The mea-surement of bubble size distribution in an opaque food fluid.Trans Inst Chem Engrs, Part C: Food and Bioproducts Processing69:67–76 (1991).
41 Campbell GM, Rielly CD, Fryer PJ and Sadd PA, Measure-ment and interpretation of dough densities. Cereal Chem70:517–521 (1993).
42 Campbell GM, Rielly CD, Fryer PJ and Sadd PA, Aeration ofbread dough during mixing: Effect of mixing dough at reducedpressure. Cereal Foods World 43:163–167 (1998).
43 Campbell GM, Herrero-Sanchez R, Payo-Rodriguez R andMerchan ML, Measurement of dynamic dough density andthe effect of surfactants and flour type on aeration duringmixing and gas retention during proofing. Cereal Chem78:272–277 (2001).
44 Cauvain SP, New mixer for variety bread production. Eur FoodDrink Rev Autumn: 51–53 (1994).
45 Cauvain SP, Whitworth MB and Alava JM, The evolution ofbubble structure in bread doughs and its effect on breadstructure, in Bubbles in Food, ed by Campbell GM, Webb C,Pandiella SS and Niranjan K. Eagan Press, Minnesota,pp 85–88 (1999).
46 Gan Z, Angold RE, Williams MR, Ellis PR, Vaughan JG andGalliard T, The microstructure and gas retention of breaddough. J Cereal Sci 12:15–24 (1990).
47 Gan Z, Ellis PR and Schofield JD, Mini review: Gas cellstabilisation and gas retention in wheat bread dough. J CerealSci 21:215–230 (1995).
48 Whitworth MB and Alava JM, The imaging and measurementof bubbles in bread doughs, in Bubbles in Food, Edby Campbell GM, Webb C, Pandiella SS and Niranjan K.Eagan Press, Minnesota, pp 221–231 (1999).
49 Whitworth MB, Development of bubble structure in breaddough. Grain Feed Milling Technol 112:10–11 (2002).
50 Dobraszczyk BJ, Campbell GM and Gan Z, Bread: A uniquefood, in Cereals and Cereal Products: Chemistry and Technology,ed by Dendy DAV and Dobraszczyk BJ. Aspen PublishersInc, Maryland, pp 182–232 (2001).
51 Chin NL, Bread dough aeration and rheology during mixing.PhD Thesis, Chemical Engineering, UMIST, UK (2003).
52 Chamberlain N, Collins TH and Elton GAH, The ChorleywoodBread Process: Effect of rate of dough mixing. FMBRA ReportNo 1, Flour Millers and Bakers Research Association,Chorleywood, UK (1967).
53 Zounis S and Quail KJ, Predicting test bakery requirementsfrom laboratory mixing tests. J Cereal Sci 25:185–196 (1997).
54 Wilson AJ, Wooding AR and Morgenstern MP, Comparison ofwork input requirement on laboratory-scale and industrial-scale mechanical dough development mixers. Cereal Chem74:715–721 (1997).
55 Hlynka I, Influence of temperature, speed of mixing, and salton some rheological properties of dough in the Farinograph.Cereal Chem 39:286–303 (1962).
56 Baig MM and Hoseney RC, Effects of mixer speed, doughtemperature, and water absorption on flour-water Mixograms.Cereal Chem 54:605–615 (1977).
57 Oliver JR and Allen HM, The prediction of bread bakingperformance using the Farinograph and Extensograph. JCereal Sci 15:79–89 (1992).
58 Anderssen RS, Gras PW and MacRitchie F, The rate-independence of the mixing of wheat flour dough to peakdough development. J Cereal Sci 27:167–177 (1998).
59 Heaps PW, Webb T, Eggitt PWR and Coppock JBM, Studieson the mechanical factors affecting dough development. JFood Technol 2:37–43 (1967).
60 Kilborn RH and Tipples KH, Factors affecting mechanicaldough development. III. Mechanical efficiency of laboratorydough mixers. Cereal Chem 50:50–69 (1973).
61 Frazier PJ, Daniels NWR and Eggitt PWR, Rheology and thecontinuous breadmaking process. Cereal Chem 52:106r–130r(1975).
62 Tipples KH and Kilborn RH, ‘Unmixing’—The disorientationof developed bread doughs by slow speed mixing. Cereal Chem52:248–262 (1975).
63 Wilson AJ, Morgenstern MP and Kavale S, Mixing responseof a variable speed 125g laboratory scale mechanical doughdevelopment mixer. J Cereal Sci 34:151–158 (2001).
64 Kilborn RH and Tipples KH, Factors affecting mechanicaldough development. II. Implications of mixing at aconstant rate of energy input. Cereal Chem 49:48–53(1972).
65 AACC, Approved Methods of the American Association ofCereal Chemists. 9th Edition. AACC Inc, Minnesota(1995).
66 Berigari MS, Determination of total protein in plant tis-sues from nitrogen analysis by a modified Kjeldahl diges-tion and Nesslerization method, in Argonne NationalLaboratory Radiological and Environmental Research Divi-sion Annual Report, January–December 1974. ANL75-3(Pt3). Argonne National Laboratory, Argonne, pp 62–68(1975).
67 Chin NL and Campbell GM, Dough aeration and rheology:Part 2. Effects of flour type, mixing speed and total workinput on aeration and rheology of bread dough. J Sci FoodAgric 85:2194–2202 (2005).
68 Chamberlain N, Collins TN and Redman BI, The ChorleywoodBread Process: Effect of reduced pressure during mixing. FMBRAReport No 40, Flour Millers and Bakers Research Association,Chorleywood, UK (1970).
69 Wooding AR, Kavale S, MacRitchie F and Stoddard FL, Link-ing between mixing requirements and dough strength. CerealChem 76:800–806 (1999).
70 Chin NL, Martin PJ and Campbell GM, Dough aeration andrheology: Part 3. Effect of the presence of gas bubbles in breaddough on measured bulk rheology and work input rate. J SciFood Agric 85:2203–2212 (2005).
J Sci Food Agric 85:2184–2193 (2005) 2193