Chromatographic methods for biogenic amines determination in foods of animal origin
945 (2002) 195–209Journal of Chromatography A,www.elsevier.com/ locate /chroma
Development of a static headspace gas chromatographic procedurefor the routine analysis of volatile fatty acids in wastewaters
a a , a b*J.A. Cruwys , R.M. Dinsdale , F.R. Hawkes , D.L. HawkesaSchool of Applied Sciences, University of Glamorgan, Pontypridd, RCT, CF37 1DL Wales, UK
bSchool of Technology, University of Glamorgan, Pontypridd, RCT CF37 1DL Wales, UK
Received 12 June 2001; received in revised form 6 November 2001; accepted 13 November 2001
Abstract
An optimised procedure has been developed for the routine analysis of volatile fatty acids in wastewater matrices, usingstatic headspace gas chromatography with flame ionisation detection. Factors such as sample volume, sample pre-treatmentand the time and temperature of sample equilibration have been included in an optimisation model designed to providemaximum detector response for acetic, propionic, iso- and n-butyric and iso- and n-valeric acids in the concentration range0–1000 mg/ l. Optimal headspace conditions were observed when equilibrating at 85 8C for 30 min, using a 2.0 ml samplevolume with the addition of 1.0 ml of NaHSO (62%, w/v) into standard 22.3 ml vials. 2-Ethylbutyric acid was used as an4
internal standard. The suitability of ordinary least squares regression and weighted least squares regression models for thepurposes of calibration and quantification were investigated. A weighted least squares linear regression model applied to theheteroscedastic data provided lower detection limits, e.g. 3.7 and 3.3 mg/ l for acetic and propionic acids. 2002 ElsevierScience B.V. All rights reserved.
Keywords: Headspace analysis; Wastewater analysis; Environmental analysis; Regression analysis; Weighted least-squaresanalysis; Volatile fatty acids; Volatile organic compounds
1. Introduction acids. The presence of VFAs in a sample matrix isoften indicative of bacterial activity. VFA analysis is
Low-molecular-mass carboxylic acids (in this of significance in studies of health and disease in thepaper aliphatic short chain C –C ) are important intestinal tract [1]. VFA measurements are required2 5
intermediates and metabolites in biological pro- to monitor the operation of landfills and biologicalcesses. Known as volatile fatty acids (VFAs) and wastewater treatment plants carrying out anaerobicshort-chain fatty acids (SCFAs) these homologues digestion, phosphorus removal or denitrificationand corresponding structural isomers include acetic, [2,3].propionic, iso- and n-butyric and iso- and n-valeric Many wastewater treatment and environmental
applications require detection of VFA concentrationsin the range 1–5000 ppm and involve a variety of*Corresponding author. Tel.: 144-1443-48-2227; fax: 144-matrices. These matrices often contain components1443-48-2285.
E-mail address: [email protected] (R.M. Dinsdale). that can result in the degradation of sensitive equip-
0021-9673/02/$ – see front matter 2002 Elsevier Science B.V. All rights reserved.PI I : S0021-9673( 01 )01514-X
945 (2002) 195–209196 J.A. Cruwys et al. / J. Chromatogr. A
ment such as those used in gas chromatography during the fiber absorption process [12], and by the(GC) and high-performance liquid chromatography use of derivatisation techniques.(HPLC). Traditionally, the VFA content of waste- Quantitative analysis of headspace samples iswaters has been analysed by titrimetric methods and often carried out using gas chromatographic tech-direct injection GC or GC preceded by solvent niques. Kolb and Ettre [13] discuss the variousextraction. More recently, ion chromatography [4,5] calibration options available to chromatographers.and HPLC [6] have been applied to VFA analysis. The most suitable method for a given application is
These procedures suffer from a number of dis- largely dependent on the time available for analysisadvantages. Titrimetric procedures including the and the nature of the sample matrix. For high samplefive-point method proposed by Lahav and Loewenth- throughput the methods of standard addition andal [7], cannot determine particular species of VFA calibration procedures associated with multiple head-and results are commonly reported as total VFA space extraction (MHE) are not appropriate. In suchcontent. HPLC and ion chromatography procedures cases a choice between traditional internal andoften require extensive sample clean up and the use external standardisation is required. However, accur-of derivatisation techniques or agents to suppress ate reproduction of the sample matrix should beinterference from coeluting ions, to reach acceptable performed for both calibration procedures, a processlimits of detection. The most commonly used method that is rarely possible in the analysis of unknownof VFA analysis, GC–flame ionisation detection wastewater samples. Chen et al. [14] adopted an(FID), has sufficient detection capability without external standard (ES) approach for the analysis ofderivatisation. VFAs have been analysed using direct malodorous compounds including VFAs in swineaqueous injection [1]. However, such methods – wastewaters, validating their results by direct aque-though rapid – can lead to contamination of the GC ous GC injections. No indication of matrix matchinginjection port and column with sample matrix com- and few details of the calibration procedure wereponents that interfere with analysis and degrade given. Due to the highly complex and variablechromatographic performance, and hence increase matrix found in human faecal samples, Stansbridgethe incidence of maintenance [8]. Sample clean up et al. [15] incorporated 2-ethylbutyric acid as anby solvent extraction can prevent the introduction of internal standard (IS) in a standard addition cali-sample matrix components and has been used exten- bration method for the VFA analysis of faeces.
´ ´sively in the analysis of wastewaters. A number of Authors including Drozd and Vodakova [16] havedisadvantages of this method are commonly quoted drawn attention to problems associated with theand include the extended sample preparation times composition of the sample matrix and the possibleand costly disposal of used solvent. Manni and shortcomings of the I.S. calibration method, sug-Caron [9] highlighted potential problems associated gesting that unless careful consideration is given towith the quantitative transfer of acetic and propionic the nature of the I.S., it cannot account for the effectsacid from the aqueous phase into diethyl ether, of matrix components.which could effect the reproducibility of extractions In analytical chemistry, calibration curves describ-and the calibration of the procedure. Automated ing the relationship between factors and response areheadspace gas chromatography (HS-GC) techniques often determined by application of ordinary leastavoid these problems and offer relatively rapid and squares (OLS) regression models. Replicate mea-solvent-free analyses. Headspace solid-phase micro- surements taken at various predictor levels canextraction (HS-SPME) techniques for VFA analysis, sometimes show increasing variance (heteroscedas-first described by Pan et al. [10] and extended by ticity) with increasing concentration of standard. In
´other authors including Abalos and Bayona [11], such cases application of OLS can cause gross errorsoffer similar advantages to HS-GC, including sol- in the calibration model [17] and the use of avent-free sample preparation and sufficient detection weighted least squares (WLS) regression model maycapability for the determination of volatile acids in be appropriate. Heteroscedasticity should also bewastewater. HS-SPME calibration procedures can be accounted for when calculating detection and quanti-complicated by the introduction of a third phase fication limits [18].
945 (2002) 195–209 197J.A. Cruwys et al. / J. Chromatogr. A
Various authors have described the analysis of septa and patented closures each from Perkin–Elmer.volatile fatty acids using static headspace techniques The temperatures of the HS 40XL oven, needle andin faeces [15], for bacterial identification [19], and in transfer line were set at 85, 105 and 135 8C, respec-wastewaters [14]. To the knowledge of the authors tively. The HS 40XL unit also controlled the opti-no single paper has described in detail an optimi- mised vial thermostatting time of 30 min, vialsation procedure for the direct HS-GC analysis of pressurisation time of 3 min and sample injectionVFAs in wastewaters, and provided a discussion of period of 0.10 min. The HS 40XL sample shaker wasthe problems of calibration particular to HS-GC. used throughout the study. The GC injection portThis paper investigates techniques to minimise sam- was operated in flow mode (split flow 5.0 ml /min)ple carry-over and procedures for calibration in and maintained at 200 8C. The GC column used wasroutine high-throughput analysis of wastewaters. a free fatty acid phase (FFAP) fused-silica capillary
(30 m30.25 mm I.D., film thickness 0.25 mm) fromPerkin–Elmer. The GC system was programmed to
2. Experimental heat the column from 60 to 190 8C at 10 8C/min; thetemperature was held at 190 8C for 1 min. Analyses
2.1. Chemicals and materials were carried out using a flame ionisation detector setat 250 8C. Because of the overlapping function of the
Acetic (99.99%), propionic (99.5%), isobutyric HS 40XL unit, the rate-limiting step in the analysis(99%), n-butyric (99%), isovaleric (99%), n-valeric procedure was the GC cycle time, not the equilibra-(99%) and 2-ethylbutyric (99.5%, internal standard) tion time.acids were purchased from Aldrich (Gillingham,UK). Formic acid (99.9%) suitably low in acetic acid 2.4. Headspace optimisation strategy(0.04%) was also obtained from Aldrich. All stan-dards were used as received. The inorganic salts VFA concentration was treated as a fixed variableNaCl and NaHSO used for the optimisation stage in the entire optimisation procedure. The number of4
were acquired from Fisher Scientific (Loughborough, trials that could be conducted in one session wasUK) as was analytical-grade concentrated HCl. All limited by the 40-vial carousel capacity of the HSHS-GC analyses were performed using standard 22.3 40XL headspace sampler and also by the inclusion ofml glass vials, PTBE septa and patented closures wash cycles to reduce the influence of analyte carry-each from Perkin–Elmer (Beaconsfield, UK). over. The effects of sample volume and sample
pre-treatment were evaluated at a fixed equilibration2.2. Standard and sample preparation time of 30 min, chosen after initial range finding
trials. It was not possible to change the temperatureStandards used for linearity trials and for the of equilibration during a 40-vial HS sequence; hence
calibration procedures were prepared from a stock this factor was included as a blocking variable.solution containing 2500 mg/ l each of acetic, propi- The optimisation trials were conducted at fouronic, isobutyric, n-butyric, isovaleric and n-valeric volumes, at three temperatures and using four sampleacids. Appropriate dilution of the stock solution matrices: one prepared in ultrapure water and threeusing certified glassware throughout produced VFA matrices of comparable ionic strength prepared usingstandards in the range 1000–1 mg/ l. NaCl and NaHSO . Four standards containing 2504
mg/ l each of acetic, propionic, isobutyric, n-butyric,2.3. Instrumentation isovaleric and n-valeric acids were prepared in four
different matrices: (1) ultrapure water, (2) 9.7%Headspace chromatographic analysis was per- (w/v) NaCl, (3) 9.7% (w/v) NaCl with sufficient
formed using a HS 40XL automatic headspace HCl added to lower the pH to 1.0, and (4) 20%sampler connected to an Autosystem XL GC system, (w/v) NaHSO . Four sample volumes (13 ml, 0.5 ml4
both from Perkin–Elmer. All HS-GC analyses were 3.0 ml, 9.0 ml) were selected in order to assess theperformed using standard 22.3 ml glass vials, PTBE effect of changing the phase ratio, b, on FID signal
945 (2002) 195–209198 J.A. Cruwys et al. / J. Chromatogr. A
response. Each of the three VFA standards was of 3.0 ml of ultrapure water in order to ascertain theanalysed in duplicate using the four sample volumes. percentage carry-over between runs. This processFor the optimisation process the use of two 3.0 ml was repeated using washes containing 3.0 ml of 12%ultrapure water washes in between sample analysis (w/v) NaCl and also for a 10% (w/v) solution ofwas sufficient to reduce the effect of carry-over. The formic acid (low in low acetic acid content, 0.04%,trials were conducted on consecutive days at vial w/v).equilibration temperatures of 45, 65, and 85 8C. Aseparate extended volume study was conducted using 2.6. Calibration procedurea total vaporisation volume (13 ml), a full evapora-tion volume (20 ml) and also using 0.1, 0.2, 0.5, 1.0, The VFA stock solution was diluted in a suitable3.0, 5.0, 7.0 and 9.0 ml volumes at the optimum manner to produce nine calibration standards (1000,equilibration temperature (85 8C) for all six VFAs. 500, 250, 100, 50, 25, 10, 5 and 1 mg/ l named levelsThe extended volume study was completed using 1–9, respectively). All standard solutions weretwo matrices: an ultrapure-based matrix and a 20% equilibrated at 20 8C prior to preparation and use.(w/v) NaHSO -based matrix for comparison, both The internal standard (99%, w/v, 2-ethylbutyric4
containing 250 mg/ l each of acetic, propionic, acid) was prepared at a concentration of 1800 mg/ l.isobutyric, n-butyric, isovaleric and n-valeric acids. For the calibration procedure 2.0 ml of VFA stan-
Following the work of Heitefuss et al. [20] the use dard was added to 1.0 ml of NaHSO (62%, w/v)4
of the acidic salt sodium hydrogensulphate was together with 100 ml of the I.S. solution into a glassinvestigated for the salting out process. Addition of vial, using the open vial technique. Ten replicatessuch a hygroscopic salt in pure form to individual were analysed each separated by three wash vialsvials proved to be a laborious task, not well suited to containing 3.0 ml of ultrapure water, to reduce theroutine wastewater analysis. Five standard VFA 250 effect of VFA carry over. A method blank solutionmg/ l solutions with varying concentrations of was prepared by adding 1.0 ml of NaHSO (62%,4
NaHSO (0, 5, 10, 20, 25%, w/v) were prepared for w/v) to 2.1 ml of ultrapure water. Ten replicate4
a NaHSO salt concentration effect study. Four blank solutions were analysed. It was necessary to4
duplicate analyses were performed for each con- separate the calibration procedure into two distinctcentration using a sample volume of 3.0 ml. All blocks, high calibration values (1000–100 mg/ l) andsamples were analysed using the optimised HS-GC low calibration values (50–1 mg/ l) to avoid accen-procedure. The final concentration and amount of tuating the carry-over problem by sequentiallysalt added to the sample was investigated using analysing low and high values. The analyses werevarious sample /salt volume ratios. carried out in two blocks under a Latin square
Finally, in order to ensure that the optimised design, in an attempt to reduce possible systematicmethod represented a liquid–vapour equilibrium errors.process, the effect of varying the sample equilibra- Particular care was taken to follow the guidelinestion time was investigated in the range 10, 20, 30, of MacTaggart and Farwell [22] and Baumann [23]40, 50, 60 and 120 min. with regards to the application of linear regression to
the calibration data and validation of the proposed2.5. Carry-over study models. As a starting point ordinary least squares
linear regression was applied to the data obtained forA carry-over evaluation study was undertaken the six acids, for both external and internal stan-
following the work of Van Eeaeme et al. [21]. A 3.0 dardisation. The analysis of variance (ANOVA) lackml volume of a 1000 mg/ l standard solution of of fit test suggested by Draper and Smith [24] wasacetic, propionic and isobutyric acids made up in used to check the adequacy of the linear models.12% (w/v) NaCl was introduced into a headspace Data were checked for departure from normality byvial and analysed under optimal HS conditions application of the Shapiro–Wilk test and by inspec-(85 8C, 30 min). This sample was followed by tion of normal probability plots. The homogeneity ofanalysis of nine blank runs (washes) each consisting the variance of the error terms at the various
945 (2002) 195–209 199J.A. Cruwys et al. / J. Chromatogr. A
concentration levels was investigated using the stock solution (2500 mg/ l) to produce six artificialLevene test statistic, and also by inspection of a plot wastewater standards across a concentration rangeof the raw residuals against the response variable representative of the BA range encountered in an-values predicted by the chosen model. aerobic digesters. Standards containing hydrogencar-
A separate study was conducted to evaluate per- bonate alkalinities of 0, 1000, 2000, 3000, 4000 andformance characteristics of the method that provide 5000 mg/ l CaCO were analysed with the optimised3
an indication of its detection and quantification HS-GC method for VFAs. Internal and externalcapability. The VFA stock solution was diluted in a standard calibration procedures were applied to thesuitable manner to produce seven limit of detection data, using both OLS and WLS regression for thestandards (10.0, 7.5, 5.0, 2.5, 1.0, 0.5, and 0.1 mg/ l). purpose of comparison.The in-vial standard solutions were prepared as A trial was conducted to test the repeatability ofdescribed in the previous paragraph. Ten replicate the HS-GC method using a sample taken from ananalyses were run for each standard using the expanded granular sludge bed (EGSB) anaerobicoptimised HS-GC method. Estimates of the detection digester fed on a mineral medium containing 1%capabilities of the calibration procedures, namely the (w/v) glucose as the main carbon source, aftercritical value, L and the detection limit, L , which Cohen et al. [25]. Approximately 25 ml of an EGSBC D
are defined by Curie [18] as a value used to reactor liquor sample was divided into ten 2.0 mldistinguish a chemical signal from background noise aliquots. To each vial 1.0 ml of a NaHSO solution4
and a measure of the inherent detection capability of (62%, w/v) and 100 ml of a 1800 mg/ l I.S. solutiona method, respectively, were obtained for the OLS was added and the mixtures were analysed using theand WLS models. The detection limit was also optimised HS-GC method.estimated using the classical 3s approach, i.e. The authors suggest that readers wishing to useblank
calculation of L through analysis of the standard this VFA method for wastewater treatment samples,D
deviation of blank measurements. A procedural check the time required for equilibration prior toblank was obtained by mixing 2.0 ml of ultrapure routine real sample analysis, i.e. whether a 30 minwater with 1.0 ml of 20% (w/v) NaHSO . A value equilibration time will produce the required level of4
of s (the standard deviation of the estimated net repeatability.blank
signal of the procedural blank) was obtained byanalysing 20 replicates of the signal obtained usingthe blank solution and multiplying the result by a 3. Resultsfactor, k53.
3.1. Selection of optimum headspace parameters2.7. Analysis of artificial and real samples
Both general method development and a strategyThe chosen calibration model was subsequently aimed at optimising VFA concentration in the head-
applied to the analysis of artificial and real waste- space above aqueous samples followed the guide-water samples. An artificial wastewater matrix was lines outlined by Kolb and Ettre [13]. Trials wereprepared based on a mineral medium proposed by conducted with the primary goal of maximising theCohen et al. [25] and commonly used as a feedstock headspace concentration of acetic, propionic andin laboratory-scale anaerobic digesters. The effect of isobutyric acids since these acids are of particularincreasing the hydrogencarbonate alkalinity (BA), importance in the monitoring of wastewater pro-which is a measure of the buffering capacity of cesses that include anaerobic digestion. Emphasiswastewater treatment systems, on the FID response was also placed on high sample throughput as thefor the six VFAs was investigated. The feedstock procedure was to be designed for routine wastewatersolution contained 8.4 g / l of NaHCO , which is the analysis.3
molar equivalent of a 5000 mg/ l CaCO solution on Variables considered to be significant in maximis-3
which the BA scale is traditionally measured. The ing the response of the procedure (peak area countsfeedstock was used in conjunction with the VFA of the VFAs) included sample volume and con-
945 (2002) 195–209200 J.A. Cruwys et al. / J. Chromatogr. A
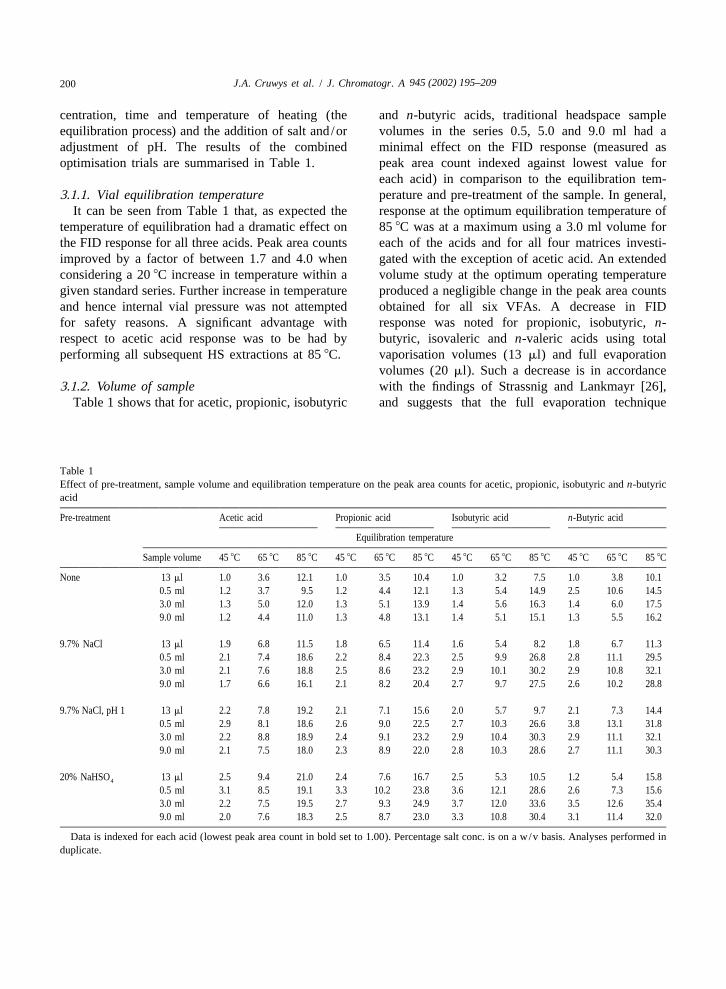
centration, time and temperature of heating (the and n-butyric acids, traditional headspace sampleequilibration process) and the addition of salt and/or volumes in the series 0.5, 5.0 and 9.0 ml had aadjustment of pH. The results of the combined minimal effect on the FID response (measured asoptimisation trials are summarised in Table 1. peak area count indexed against lowest value for
each acid) in comparison to the equilibration tem-3.1.1. Vial equilibration temperature perature and pre-treatment of the sample. In general,
It can be seen from Table 1 that, as expected the response at the optimum equilibration temperature oftemperature of equilibration had a dramatic effect on 85 8C was at a maximum using a 3.0 ml volume forthe FID response for all three acids. Peak area counts each of the acids and for all four matrices investi-improved by a factor of between 1.7 and 4.0 when gated with the exception of acetic acid. An extendedconsidering a 20 8C increase in temperature within a volume study at the optimum operating temperaturegiven standard series. Further increase in temperature produced a negligible change in the peak area countsand hence internal vial pressure was not attempted obtained for all six VFAs. A decrease in FIDfor safety reasons. A significant advantage with response was noted for propionic, isobutyric, n-respect to acetic acid response was to be had by butyric, isovaleric and n-valeric acids using totalperforming all subsequent HS extractions at 85 8C. vaporisation volumes (13 ml) and full evaporation
volumes (20 ml). Such a decrease is in accordance3.1.2. Volume of sample with the findings of Strassnig and Lankmayr [26],
Table 1 shows that for acetic, propionic, isobutyric and suggests that the full evaporation technique
Table 1Effect of pre-treatment, sample volume and equilibration temperature on the peak area counts for acetic, propionic, isobutyric and n-butyricacid
Pre-treatment Acetic acid Propionic acid Isobutyric acid n-Butyric acid
Equilibration temperature
Sample volume 45 8C 65 8C 85 8C 45 8C 65 8C 85 8C 45 8C 65 8C 85 8C 45 8C 65 8C 85 8C
None 13 ml 1.0 3.6 12.1 1.0 3.5 10.4 1.0 3.2 7.5 1.0 3.8 10.10.5 ml 1.2 3.7 9.5 1.2 4.4 12.1 1.3 5.4 14.9 2.5 10.6 14.53.0 ml 1.3 5.0 12.0 1.3 5.1 13.9 1.4 5.6 16.3 1.4 6.0 17.59.0 ml 1.2 4.4 11.0 1.3 4.8 13.1 1.4 5.1 15.1 1.3 5.5 16.2
9.7% NaCl 13 ml 1.9 6.8 11.5 1.8 6.5 11.4 1.6 5.4 8.2 1.8 6.7 11.30.5 ml 2.1 7.4 18.6 2.2 8.4 22.3 2.5 9.9 26.8 2.8 11.1 29.53.0 ml 2.1 7.6 18.8 2.5 8.6 23.2 2.9 10.1 30.2 2.9 10.8 32.19.0 ml 1.7 6.6 16.1 2.1 8.2 20.4 2.7 9.7 27.5 2.6 10.2 28.8
9.7% NaCl, pH 1 13 ml 2.2 7.8 19.2 2.1 7.1 15.6 2.0 5.7 9.7 2.1 7.3 14.40.5 ml 2.9 8.1 18.6 2.6 9.0 22.5 2.7 10.3 26.6 3.8 13.1 31.83.0 ml 2.2 8.8 18.9 2.4 9.1 23.2 2.9 10.4 30.3 2.9 11.1 32.19.0 ml 2.1 7.5 18.0 2.3 8.9 22.0 2.8 10.3 28.6 2.7 11.1 30.3
20% NaHSO 13 ml 2.5 9.4 21.0 2.4 7.6 16.7 2.5 5.3 10.5 1.2 5.4 15.84
0.5 ml 3.1 8.5 19.1 3.3 10.2 23.8 3.6 12.1 28.6 2.6 7.3 15.63.0 ml 2.2 7.5 19.5 2.7 9.3 24.9 3.7 12.0 33.6 3.5 12.6 35.49.0 ml 2.0 7.6 18.3 2.5 8.7 23.0 3.3 10.8 30.4 3.1 11.4 32.0
Data is indexed for each acid (lowest peak area count in bold set to 1.00). Percentage salt conc. is on a w/v basis. Analyses performed induplicate.
945 (2002) 195–209 201J.A. Cruwys et al. / J. Chromatogr. A
pioneered by Markelov and Guzowski [27] is not 7 ml, respectively. The lowering of pH and additionsuitable for the analysis of these VFAs if low of salt resulted in mean increases in response acrossconcentrations are expected. the temperature range of 1.7, 1.5 and 1.5 for the
same volume levels. Hence, the change of pH to 1.0had a minimal effect for acetic acid. A similar
3.1.3. Effect of changing the activity coefficient of pattern was evident for propionic and isobutyricthe analyte acids.
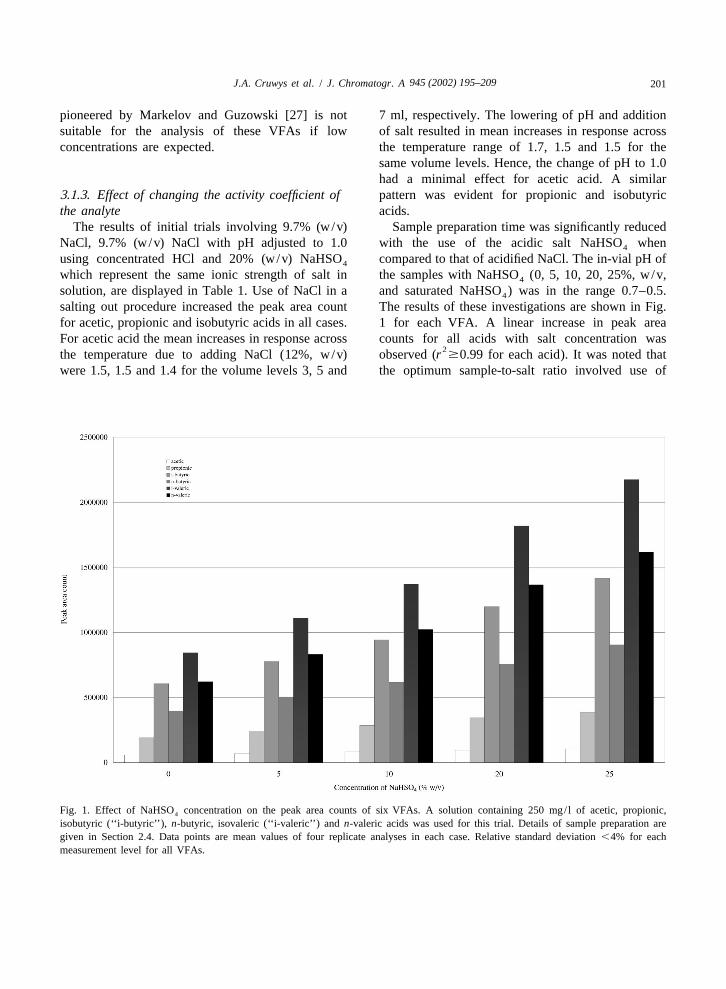
The results of initial trials involving 9.7% (w/v) Sample preparation time was significantly reducedNaCl, 9.7% (w/v) NaCl with pH adjusted to 1.0 with the use of the acidic salt NaHSO when4
using concentrated HCl and 20% (w/v) NaHSO compared to that of acidified NaCl. The in-vial pH of4
which represent the same ionic strength of salt in the samples with NaHSO (0, 5, 10, 20, 25%, w/v,4
solution, are displayed in Table 1. Use of NaCl in a and saturated NaHSO ) was in the range 0.7–0.5.4
salting out procedure increased the peak area count The results of these investigations are shown in Fig.for acetic, propionic and isobutyric acids in all cases. 1 for each VFA. A linear increase in peak areaFor acetic acid the mean increases in response across counts for all acids with salt concentration was
2the temperature due to adding NaCl (12%, w/v) observed (r $0.99 for each acid). It was noted thatwere 1.5, 1.5 and 1.4 for the volume levels 3, 5 and the optimum sample-to-salt ratio involved use of
Fig. 1. Effect of NaHSO concentration on the peak area counts of six VFAs. A solution containing 250 mg/ l of acetic, propionic,4
isobutyric (‘‘i-butyric’’), n-butyric, isovaleric (‘‘i-valeric’’) and n-valeric acids was used for this trial. Details of sample preparation aregiven in Section 2.4. Data points are mean values of four replicate analyses in each case. Relative standard deviation ,4% for eachmeasurement level for all VFAs.
945 (2002) 195–209202 J.A. Cruwys et al. / J. Chromatogr. A
1.00 ml of the NaHSO stock (60%, w/v) added to washes (10%, w/v) for acetic, propionic acid and4
2.00 ml of standard /sample. isobutyric acids (1000 mg/ l in 12%, w/v, NaClsolution) in which the carry-over peak areas are
3.1.4. Effect of equilibration time represented as the cumulative percentage of theResults of the equilibration trials demonstrated initial analyte peak area. No significant difference
that liquid–vapour equilibrium at 85 8C with 1.00 ml was observed between the eluting capability ofof the NaHSO stock (60%, w/v) added to 2.00 ml ultrapure water and 12% NaCl (w/v in ultrapure4
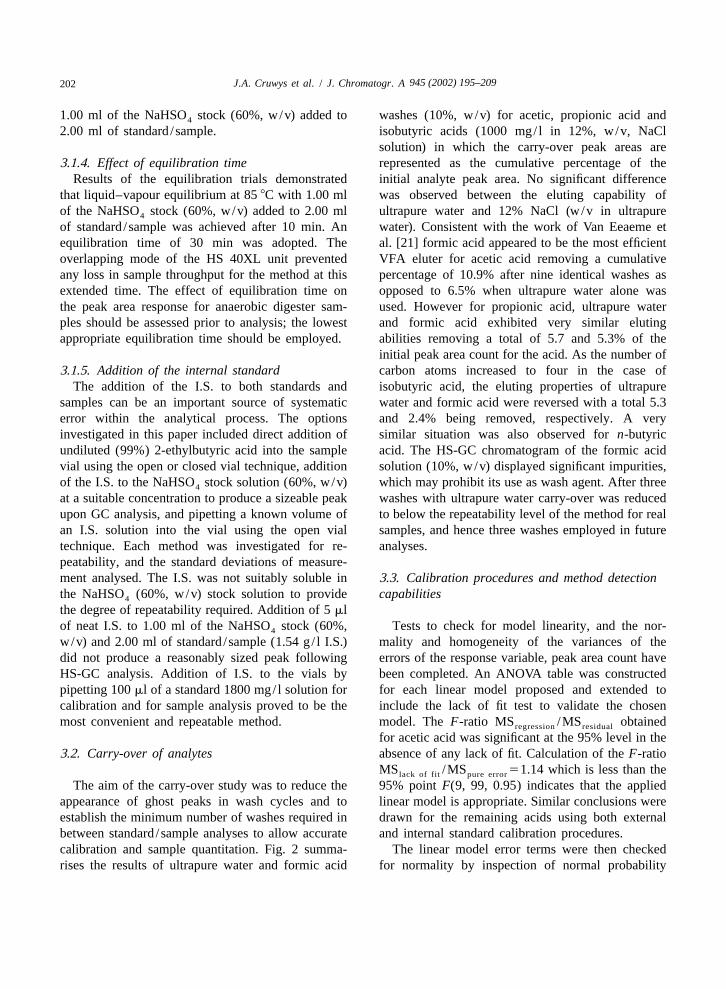
of standard /sample was achieved after 10 min. An water). Consistent with the work of Van Eeaeme etequilibration time of 30 min was adopted. The al. [21] formic acid appeared to be the most efficientoverlapping mode of the HS 40XL unit prevented VFA eluter for acetic acid removing a cumulativeany loss in sample throughput for the method at this percentage of 10.9% after nine identical washes asextended time. The effect of equilibration time on opposed to 6.5% when ultrapure water alone wasthe peak area response for anaerobic digester sam- used. However for propionic acid, ultrapure waterples should be assessed prior to analysis; the lowest and formic acid exhibited very similar elutingappropriate equilibration time should be employed. abilities removing a total of 5.7 and 5.3% of the
initial peak area count for the acid. As the number of3.1.5. Addition of the internal standard carbon atoms increased to four in the case of
The addition of the I.S. to both standards and isobutyric acid, the eluting properties of ultrapuresamples can be an important source of systematic water and formic acid were reversed with a total 5.3error within the analytical process. The options and 2.4% being removed, respectively. A veryinvestigated in this paper included direct addition of similar situation was also observed for n-butyricundiluted (99%) 2-ethylbutyric acid into the sample acid. The HS-GC chromatogram of the formic acidvial using the open or closed vial technique, addition solution (10%, w/v) displayed significant impurities,of the I.S. to the NaHSO stock solution (60%, w/v) which may prohibit its use as wash agent. After three4
at a suitable concentration to produce a sizeable peak washes with ultrapure water carry-over was reducedupon GC analysis, and pipetting a known volume of to below the repeatability level of the method for realan I.S. solution into the vial using the open vial samples, and hence three washes employed in futuretechnique. Each method was investigated for re- analyses.peatability, and the standard deviations of measure-ment analysed. The I.S. was not suitably soluble in 3.3. Calibration procedures and method detectionthe NaHSO (60%, w/v) stock solution to provide capabilities4
the degree of repeatability required. Addition of 5 mlof neat I.S. to 1.00 ml of the NaHSO stock (60%, Tests to check for model linearity, and the nor-4
w/v) and 2.00 ml of standard /sample (1.54 g/ l I.S.) mality and homogeneity of the variances of thedid not produce a reasonably sized peak following errors of the response variable, peak area count haveHS-GC analysis. Addition of I.S. to the vials by been completed. An ANOVA table was constructedpipetting 100 ml of a standard 1800 mg/ l solution for for each linear model proposed and extended tocalibration and for sample analysis proved to be the include the lack of fit test to validate the chosenmost convenient and repeatable method. model. The F-ratio MS /MS obtainedregression residual
for acetic acid was significant at the 95% level in the3.2. Carry-over of analytes absence of any lack of fit. Calculation of the F-ratio
MS /MS 51.14 which is less than thelack of fit pure error
The aim of the carry-over study was to reduce the 95% point F(9, 99, 0.95) indicates that the appliedappearance of ghost peaks in wash cycles and to linear model is appropriate. Similar conclusions wereestablish the minimum number of washes required in drawn for the remaining acids using both externalbetween standard /sample analyses to allow accurate and internal standard calibration procedures.calibration and sample quantitation. Fig. 2 summa- The linear model error terms were then checkedrises the results of ultrapure water and formic acid for normality by inspection of normal probability
945 (2002) 195–209 203J.A. Cruwys et al. / J. Chromatogr. A
Fig. 2. Cumulative carry-over effect for acetic, propionic and isobutyric acids using two wash strategies. VFA standard containing 1000mg/ l acetic, propionic, isobutyric and n-butyric acid (not plotted) in 12% (w/v) NaCl using ultrapure water.
plots and by application of the Shapiro–Wilks test were subsequently fitted to the calibration data sets.using SPSS 10.0. The Shapiro–Wilks statistic was As a first order approach to dealing with hetero-not significant for each of the VFAs at all calibration scedastic data, weights were assigned as the inverselevels. Probability plots of the calibration data sets of the peak area count variance at each calibrationdisplayed no major deviations from normality. level after Burdge et al. [29]. The calibration co-
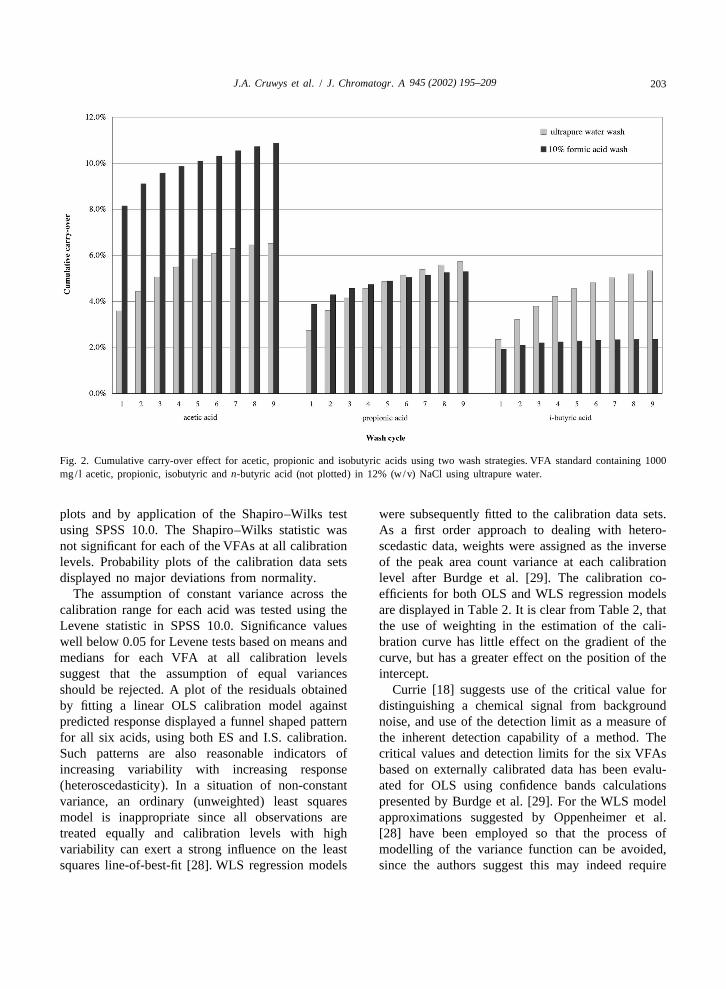
The assumption of constant variance across the efficients for both OLS and WLS regression modelscalibration range for each acid was tested using the are displayed in Table 2. It is clear from Table 2, thatLevene statistic in SPSS 10.0. Significance values the use of weighting in the estimation of the cali-well below 0.05 for Levene tests based on means and bration curve has little effect on the gradient of themedians for each VFA at all calibration levels curve, but has a greater effect on the position of thesuggest that the assumption of equal variances intercept.should be rejected. A plot of the residuals obtained Currie [18] suggests use of the critical value forby fitting a linear OLS calibration model against distinguishing a chemical signal from backgroundpredicted response displayed a funnel shaped pattern noise, and use of the detection limit as a measure offor all six acids, using both ES and I.S. calibration. the inherent detection capability of a method. TheSuch patterns are also reasonable indicators of critical values and detection limits for the six VFAsincreasing variability with increasing response based on externally calibrated data has been evalu-(heteroscedasticity). In a situation of non-constant ated for OLS using confidence bands calculationsvariance, an ordinary (unweighted) least squares presented by Burdge et al. [29]. For the WLS modelmodel is inappropriate since all observations are approximations suggested by Oppenheimer et al.treated equally and calibration levels with high [28] have been employed so that the process ofvariability can exert a strong influence on the least modelling of the variance function can be avoided,squares line-of-best-fit [28]. WLS regression models since the authors suggest this may indeed require
945 (2002) 195–209204 J.A. Cruwys et al. / J. Chromatogr. A
Table 2Regression constant estimates and estimates of the detection capability parameters for ordinary and weighted least squares models
VFA Regression Estimated parameter
a b S x S x x (3s )C C D D D bl
Acetic OLS 2105.3 128.4 344.2 3.5 716.7 6.4 41.1WLS 21.9 120.6 102.2 0.7 427.6 3.7 39.2
Propionic OLS 273.8 456.6 1341.6 3.1 2711.3 6.1 37.7WLS 17.7 446.6 170.7 0.3 1474.5 3.3 36.0
Isobutyric OLS 2174.4 1565.0 6085.6 4.0 12 189.1 7.9 36.1WLS 23.1 1540.0 348.1 0.2 1444.9 0.9 34.4
n-Butyric OLS 259.6 1007.9 3871.2 3.9 7802.0 7.8 38.6WLS 16.5 992.6 69.9 0.1 267.4 0.3 37.4
Isovaleric OLS 2185.3 2374.3 9549.4 4.1 19 284.0 8.2 15.1WLS 13.9 2325.2 287.0 0.1 1585.7 0.7 14.5
n-Valeric OLS 290.3 1765.8 7326.1 4.2 14 742.4 8.4 35.5WLS 39.5 1736.7 74.9 0.0 470.3 0.3 33.4
OLS and WLS represent ordinary least squares and weighted least squares linear regression, respectively. Estimates of the regressioncoefficients are given by: a (the intercept estimate) and b (the gradient estimate). Estimates of the detection capabilities are given by: S theC
signal domain Critical Level, x the concentration domain Critical Level, S the signal domain Detection Limit, and x the concentrationC D D
domain Detection Limit. The classical concentration domain Detection Limit is included for comparison x (3s ). Units in the concentrationD bl
domain and signal domain are mg/ l and peak area count, respectively.
more information than the calibration process itself. 3.4. Analysis of artificial and real samplesThe estimated parameters are presented in Table 2together with values obtained using the traditional The results of the analysis of artificial wastewatermethod of three times the standard deviation of the samples are displayed in Table 3 using both internalblank measurement for the purpose of comparison. It and external OLS and WLS calibration models foris clear that the application of WLS regression acetic acid. In both cases an attempt has been madeprocedures present lower values for the critical level to provide accurate 95% prediction intervals for theand detection limit than those obtained using OLS individual measurements using formulae suggestedfor the heteroscedastic data. Weighted analysis uses a by Baumann [23]. The response variable valuesmore appropriate estimate of the variability that estimated by the individual regression models to-reflects the situation at lower concentrations [28]. gether with estimated 95% prediction intervals wereTable 2 also shows that for WLS treatment of the plotted against concentration for each acid. Suchcalibration data, the traditional 32s values for plots can also be used to determine approximate 95%blank
the detection limits are considerably larger than those prediction intervals for estimated analyte concen-obtained using the regression approach for each trations [23]. The intervals produced for acetic acidVFA. Detection limits in the concentration domain using WLS are narrower than those predicted usingusing the WLS procedure were 3.7, 3.3, 0.9, 0.3, 0.7 OLS at the concentration analysed (250 mg/ l) andand 0.3 mg/ l for acetic, propionic, isobutyric, n- provide a more realistic representation of the esti-butyric, isovaleric and n-valeric acids, respectively. mated quantity. Estimated concentrations for aceticA typical chromatogram produced on analysis of the acid using the internal standard calibration method250 mg/ l VFA standard is displayed in Fig. 3a. appear to be higher and closer to the expected value
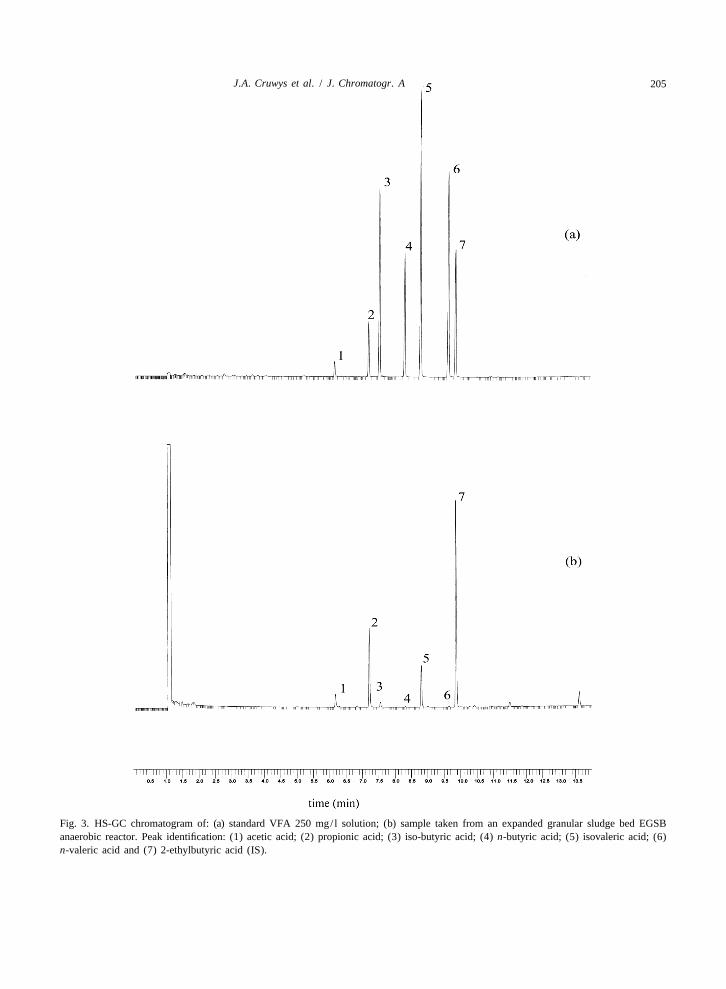
945 (2002) 195–209 205J.A. Cruwys et al. / J. Chromatogr. A
Fig. 3. HS-GC chromatogram of: (a) standard VFA 250 mg/ l solution; (b) sample taken from an expanded granular sludge bed EGSBanaerobic reactor. Peak identification: (1) acetic acid; (2) propionic acid; (3) iso-butyric acid; (4) n-butyric acid; (5) isovaleric acid; (6)n-valeric acid and (7) 2-ethylbutyric acid (IS).
945 (2002) 195–209206 J.A. Cruwys et al. / J. Chromatogr. A
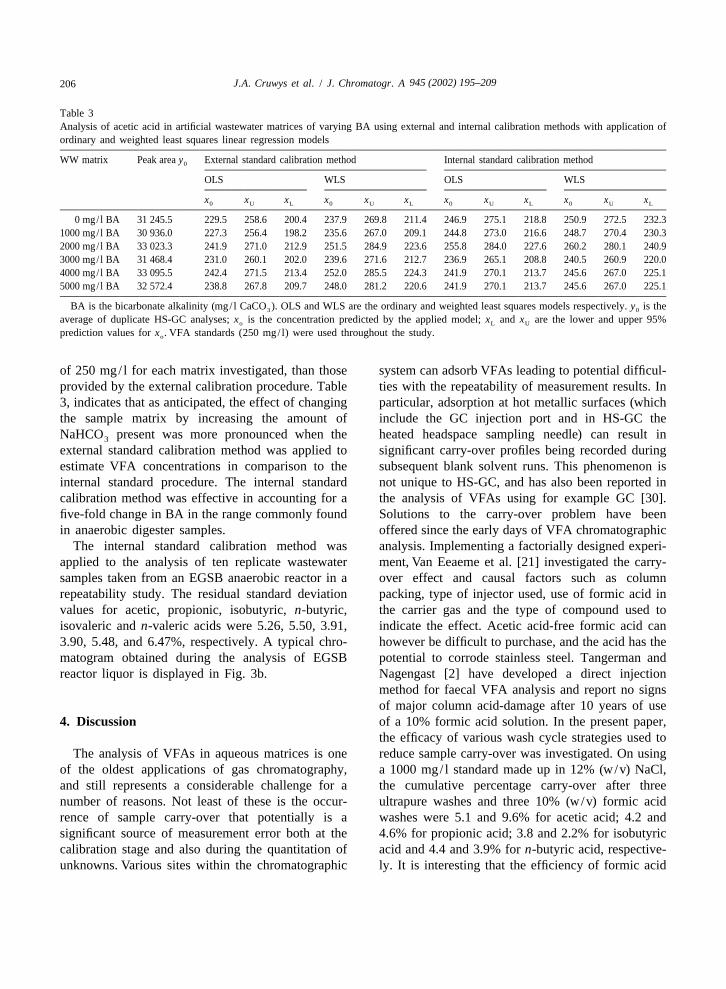
Table 3Analysis of acetic acid in artificial wastewater matrices of varying BA using external and internal calibration methods with application ofordinary and weighted least squares linear regression models
WW matrix Peak area y External standard calibration method Internal standard calibration method0
OLS WLS OLS WLS
x x x x x x x x x x x x0 U L 0 U L 0 U L 0 U L
0 mg/ l BA 31 245.5 229.5 258.6 200.4 237.9 269.8 211.4 246.9 275.1 218.8 250.9 272.5 232.31000 mg/ l BA 30 936.0 227.3 256.4 198.2 235.6 267.0 209.1 244.8 273.0 216.6 248.7 270.4 230.32000 mg/ l BA 33 023.3 241.9 271.0 212.9 251.5 284.9 223.6 255.8 284.0 227.6 260.2 280.1 240.93000 mg/ l BA 31 468.4 231.0 260.1 202.0 239.6 271.6 212.7 236.9 265.1 208.8 240.5 260.9 220.04000 mg/ l BA 33 095.5 242.4 271.5 213.4 252.0 285.5 224.3 241.9 270.1 213.7 245.6 267.0 225.15000 mg/ l BA 32 572.4 238.8 267.8 209.7 248.0 281.2 220.6 241.9 270.1 213.7 245.6 267.0 225.1
BA is the bicarbonate alkalinity (mg/ l CaCO ). OLS and WLS are the ordinary and weighted least squares models respectively. y is the3 0
average of duplicate HS-GC analyses; x is the concentration predicted by the applied model; x and x are the lower and upper 95%o L U
prediction values for x . VFA standards (250 mg/ l) were used throughout the study.o
of 250 mg/ l for each matrix investigated, than those system can adsorb VFAs leading to potential difficul-provided by the external calibration procedure. Table ties with the repeatability of measurement results. In3, indicates that as anticipated, the effect of changing particular, adsorption at hot metallic surfaces (whichthe sample matrix by increasing the amount of include the GC injection port and in HS-GC theNaHCO present was more pronounced when the heated headspace sampling needle) can result in3
external standard calibration method was applied to significant carry-over profiles being recorded duringestimate VFA concentrations in comparison to the subsequent blank solvent runs. This phenomenon isinternal standard procedure. The internal standard not unique to HS-GC, and has also been reported incalibration method was effective in accounting for a the analysis of VFAs using for example GC [30].five-fold change in BA in the range commonly found Solutions to the carry-over problem have beenin anaerobic digester samples. offered since the early days of VFA chromatographic
The internal standard calibration method was analysis. Implementing a factorially designed experi-applied to the analysis of ten replicate wastewater ment, Van Eeaeme et al. [21] investigated the carry-samples taken from an EGSB anaerobic reactor in a over effect and causal factors such as columnrepeatability study. The residual standard deviation packing, type of injector used, use of formic acid invalues for acetic, propionic, isobutyric, n-butyric, the carrier gas and the type of compound used toisovaleric and n-valeric acids were 5.26, 5.50, 3.91, indicate the effect. Acetic acid-free formic acid can3.90, 5.48, and 6.47%, respectively. A typical chro- however be difficult to purchase, and the acid has thematogram obtained during the analysis of EGSB potential to corrode stainless steel. Tangerman andreactor liquor is displayed in Fig. 3b. Nagengast [2] have developed a direct injection
method for faecal VFA analysis and report no signsof major column acid-damage after 10 years of use
4. Discussion of a 10% formic acid solution. In the present paper,the efficacy of various wash cycle strategies used to
The analysis of VFAs in aqueous matrices is one reduce sample carry-over was investigated. On usingof the oldest applications of gas chromatography, a 1000 mg/ l standard made up in 12% (w/v) NaCl,and still represents a considerable challenge for a the cumulative percentage carry-over after threenumber of reasons. Not least of these is the occur- ultrapure washes and three 10% (w/v) formic acidrence of sample carry-over that potentially is a washes were 5.1 and 9.6% for acetic acid; 4.2 andsignificant source of measurement error both at the 4.6% for propionic acid; 3.8 and 2.2% for isobutyriccalibration stage and also during the quantitation of acid and 4.4 and 3.9% for n-butyric acid, respective-unknowns. Various sites within the chromatographic ly. It is interesting that the efficiency of formic acid
945 (2002) 195–209 207J.A. Cruwys et al. / J. Chromatogr. A
as a wash agent rapidly decreases after acetic acid in dependent, the temperature of equilibration has athe VFA series acetic acid, propionic acid and large effect on the value of C which is proportionalG
isobutyric acid, as shown in Fig. 2, whereas the to the peak area count, A, of the analyte. Thisefficiency of ultrapure water remains reasonably situation is clearly borne out for the six VFAs in thisconstant for each acid in comparison. A more study on inspection of Table 1. If, on the other handcomprehensive carry-over study, which is beyond the b 4 K then (K 1 b ) → b, and C is influenced byG
scope of this paper, would need to be conducted in 1/b. The phase ratio, b, is not highly dependent onorder to validate any theories proposed with regard temperature and hence increasing equilibration tem-to differences in the behaviour of ultrapure water and peratures have little effect on the analyte headspaceformic acid wash strategies. The decline in elution concentration C and therefore its correspondingG
efficacy together with the presence of impurity peaks peak area count. This is not the case for VFAs. It canin formic acid across the retention time window for also be shown that at a constant temperature, chang-VFAs, prevented its future use. Three ultrapure ing the b value for compounds with a high partitionwashes were included in the optimised method since coefficient value, K, has a minimal effect on C andG
the benefits of increasing to four proved to minimal hence on the peak area count. Indeed, as in the casewith regard to cumulative elution. of the extended volume trials, the difference in peak
Eq. (1) describes the relationship between the area counts for volumes in the range 0.1 to 5.0 mloriginal analyte concentration (C ) and the concen- will be difficult to distinguish from those obtained0
tration of the analyte C in the headspace of a closed during repeatability trials of identical volumes. ThisG
vial, for example, after liquid–vapour equilibrium situation may have important implications for VFAhas been achieved: analysis if MHE is applied at the calibration and
quantitation stages, or if MHE and also the phaseC0]] ratio variation (PRV) method after Ettre et al. [32]A ~ C 5 (1)G K 1 b
are to be used for the determination of K values,where K is the partition coefficient of the analyte and since both MHE and the PRV method are rely onb is the phase ratio, i.e. the ratio of the volume of peak area differences obtained from analysis ofthe analyte headspace vapour to the volume of the samples with differing phase ratio values. Anothersample in the liquid phase at equilibrium. (Eq. (1) procedure described by Kolb et al. [33] known as theassumes that the volume of the sample phase at vapour phase calibration (VPC) method, can be usedequilibrium equals the volume of the sample before for the determination of K values using HS-GC. Thethe equilibration process is initiated). Ioffe [31] VPC method compares the response, A , obtainedC
suggests that the largest K values may be the result from analysis of a vapour calibration standard pre-of the formation of specific solvent–solute interac- pared using total vaporisation technique (TVT)tions, such as the formation of stable hydrogen bonds volumes of pure analyte to the response, A , of aG
and establishment of acid–base equilibria. Both sample containing the same volume of analyte spikedinteractions can occur in the case of VFA–water into a known volume of blank sample matrix. Forsolutions and have important implications in the analytes with a high partition coefficient problemsanalysis of VFAs particularly in the evaluation of K can also be encountered using the VPC method whenvalues as will be described in the following para- determining K. In particular, it is possible that peakgraph. area values are hence at opposite extremes of
Kolb and Ettre [13] use Eq. (1) to describe the measurement for the analyte, i.e. A <A such thatG C
effects of temperature and sample volume (or b the value of A is outside the linear range of theG
value) on the equilibrium headspace concentration method. From experiment, this appears to be the caseC , and introduce two extreme cases in which either for VFAs and therefore the K value were notG
K 4 b or b 4 K. In the case K 4 b, it follows obtainable using the VPC technique under optimumthat (K 1 b ) → K and at constant initial analyte conditions.concentration, C , the headspace concentration is As outlined in the previous paragraph, validation0
strongly influenced by 1/K. Since K is temperature of the use of 2-ethylbutyric acid as an internal
945 (2002) 195–209208 J.A. Cruwys et al. / J. Chromatogr. A
standard by comparison of accurate K values for the masses of the analyte and I.S. originally in themI.S. and the VFAs in a given matrix, across the sample; f and f are the mass response factors ofs i
concentration range of the calibration procedure, can the analyte and I.S.; K and K are the partitions i
prove to be difficult using either VPC or PRV coefficients of the analyte and I.S.; V is the volumeg
methods, particularly if K is large. If this is the case, of the gaseous phase and V is the volume of thel
as in this paper, alternative more empirical methods liquid phase. This added expression describes theof validation should be sought. These methods can effect of the matrix components on the concentrationinclude variation of the ionic strength of the waste- of analyte and I.S. in the headspace sample. Inwater matrix, and subsequent application of I.S. general the value of the quotient does not equal unitycalibration. and hence should be multiplied by the gradient of the
Calibration is defined by Danzer and Currie [34] calibration curve obtained to allow for accurateas the operation that determines the functional quantitation. In the present paper the authorsrelationship between measured values, and analytical attempted to obtain values for the partition coeffi-quantities characterising types of analytes and their cients of the analytes, K and of the I.S., K usingi s
amount. In the case of linear regression and the both the VPC and PRV methods. Since the othermethod of least squares a number of conditions must factors within the expression are constant for a givenhold if the model is to be applied correctly, and analysis, and the analytes and I.S. show a highshould be checked during method development. degree of chemical similarity, it was envisaged thatMacTaggart and Farwell [22] and Tranter [35] list they will be affected in a similar manner by matrixthe main assumptions. Chen et al. [14] employed an components and hence share closely related K valuesexternal standard calibration method for the analysis and therefore the value of K /K would be constants i
of the volatile components of swine wastewater across the concentration range investigated. Theusing static HS-GC. This method of quantifying value of the quotient in Eq. (2) would then approachcomponents such as VFAs requires accurate matrix unity. Both the VPC and PRV methods rely onmatching of standards and samples particularly if differences in peak area counts obtained from analy-severe matrix effects are expected. Such procedures sis of varying volumes of sample. As mentionedare not always desirable or indeed feasible when previously the b value and hence the volume ofcomplex matrices are to be analysed whose exact sample does not have a great influence on thecomposition may not be known. Alternatively, the headspace concentration, C , and hence on the peakG
method of internal standardisation can be used. For area count, A. Values for the partition coefficient forheadspace analysis in particular, the internal standard VFAs using OLS linear regression as outlined by(IS) should be as chemically similar to the analyte(s) Kolb and Ettre [13] were difficult to obtain with theas possible. If components within the sample matrix required degree of accuracy.are suspected or known to influence the headspace It is the intention of the authors to present aconcentration of the analyte (the so-called matrix method that balances a vigorous calibration andeffect) then in theory both the analyte(s) and I.S. quantification procedure with the ability to analyse ashould encounter similar changes to their solvent– large quantity of wastewater samples, particularlysolute interactions within the sample. Drozd and from wastewater treatment systems, in a given
´ ´Vodakova [16] derived an expression describing the period. If, following spiking experiments, severeuse of an I.S. in HS-GC that differed from conven- sample matrix effects become apparent that cannottion by the inclusion of a quotient shown enclosed in be accounted for by a method that uses an internalparenthesis in Eq. (2) below: standard calibration, a standard addition procedure
should be employed. Use of FET or TVT methodsV 1 K VA m f may be complicated by the difficulties in obtainingg s li io s
] ]] ]]]5 ? (2)m S D representative and repeatable microlitre aliquots fromA V 1 K Vm fs g i lso iwastewater and wastewater treatment system sam-
where A and A are the peak area counts for the ples, particularly when they have a high particulatei s
analyte and I.S. respectively; m and m are the content.io so
945 (2002) 195–209 209J.A. Cruwys et al. / J. Chromatogr. A
[4] P.v. Zumbusch, T. Meyer-Jens, G. Brunner, H. Markl, Appl.5. ConclusionMicrobiol. Biotechnol. 42 (1994) 140.
[5] D.A.C. Manning, A. Bewsher, J. Chromatogr. A 770 (1997)An optimised HS-GC method for the routine 203.
analysis of VFAs in wastewater matrices has been [6] D. Albert, C. Martens, Mar. Chem. 56 (1997) 27.presented utilising 2-ethylbutyric acid as an internal [7] O. Lahav, R.E. Loewethal, Water. SA 26 (2000) 389.
[8] Y. Seto, J. Chromatogr. A 674 (1994) 25.standard. Addition of the acidic salt NaHSO in-4[9] G. Manni, F. Caron, J. Chromatogr. A 690 (1995) 237.creased the analyte headspace concentration by
[10] L. Pan, M. Adams, J. Pawliszyn, Anal. Chem. 67 (1995)reducing sample pH and through its salting out 4396.action. Optimal headspace conditions were observed ´[11] M. Abalos, J.M. Bayona, J. Chromatogr. A 891 (2000) 287.when equilibrating at 85 8C for 30 min, using a 2.0 [12] B. Kolb, J. Chromatogr. A 842 (1999) 163.
[13] B. Kolb, L.S. Ettre, Static Headspace-Gas Chromatography,ml sample volume with the addition of 1.0 ml ofWiley–VCH, New York, 1997.NaHSO (62%, w/v) into standard 22.3 ml vials.4 [14] A. Chen, P.H. Liao, K.V. Lo, Bioresource Technol. 49 (1994)
Internal standard and salt introduction methods have 83.been optimised and the problem of sample carry-over [15] E.M. Stansbridge, G.A. Mills, V. Walker, J. Chromatogr. 621has been accounted for, thus allowing a high degree (1993) 7.
´ ´[16] J. Drozd, Z. Vodakova, J. Chromatogr. 518 (1990) 1.of repeatability of measurement to be obtained.[17] J.S. Garden, D.G. Mitchell, W.N. Mills, Anal. Chem. 52Analysis of real wastewater samples yielded residual
(1980) 2310.standard deviation values of 5.26, 5.50, 3.91, 3.90, [18] L.A. Currie, Anal. Chim. Acta 391 (1999) 105.5.48, and 6.47% for acetic, propionic, isobutyric, [19] K.E. Cundy, L.J. Willard, C.J. Valeri, J. Shanholtzer, L.R.n-butyric, isovaleric and n-valeric acids, respective- Singh, J. Peterson, J. Clin. Microbiol. 29 (1991) 260.
[20] S. Heitefuss, A. Heine, H.S.H. Seifert, J. Chromatogr. 532ly. The procedure has been designed to provide a(1990) 374.balance between high sample throughput and re-
[21] C. Van Eeaeme, J.M. Bienfait, O. Lambot, A. Pondant, J.liability of the quantitation process, by employing Chromatog. Sci. 12 (1974) 398.internal standard calibration with WLS regression, [22] D.L. MacTaggart, S.O. Farwell, J. AOAC Int. 75 (1992) 594.over a wide (0–1000 mg/ l) and linear concentration [23] K. Bauman, Process Contr. Qual. 10 (1997) 75.
[24] N.R. Draper, H. Smith, Applied Regression Analysis, 3rdrange. The calibration method is able to account foredition, Wiley, New York, 1998.changes in the sample matrix commonly encountered
[25] A. Cohen, A.M. Breure, J.G. van Andel, A. van Deusen,in wastewater treatment processes, and does not Water Res. 14 (1980) 1439.involve the complication of a third phase as in the [26] S. Strassnig, E.P. Lankmayr, J. Chromatogr. A 849 (1999)case of SPME methods. Use of WLS on hetero- 629.
[27] M. Markelov, J.P. Guzowski, J. Anal. Chim. Acta 276 (1993)scedastic calibration data provides lower VFA de-235.tection limits than those obtained using OLS, which
[28] L. Oppenheimer, T.P. Capizzi, R.M. Weppelman, H. Mehta,are comparable to those reported in SPME–GC–FID Anal. Chem. 55 (1983) 638.methods, for example 3.7, 3.3, 0.9, 0.3, 0.7 and 0.3 [29] J.R. Burdge, D.L. MacTaggart, S.O. Farwell, J. Chem. Educ.mg/ l for acetic, propionic, isobutyric, n-butyric, 76 (1999) 434.
[30] E.D. Smith, A.B. Gosnell, Anal. Chem. 34 (1962) 647.isovaleric and n-valeric acids, respectively.[31] B.V. Ioffe, Head-Space Analysis and Related Methods in Gas
Chromatography, Wiley–Interscience, New York, 1984.[32] L.S. Ettre, C. Welter, B. Kolb, Chromatographia 35 (1993)
References 73.[33] B. Kolb, C. Welter, C. Bichler, Chromatographia 34 (1992)
235.[1] A. Tangerman, F.M. Nagengast, Anal. Biochem. 236 (1996)[34] K. Danzer, L.A. Currie, Pure Appl. Chem. 70 (1998) 993.1.[35] R.L. Tranter (Ed.), Design and Analysis in Chemical Re-[2] R. Sedlak (Ed.), Phosphorus and Nitrogen Removal from
search, Sheffield Academic Press, Sheffield, 2000.Municipal Wastewater, Lewis Publishers, New York, 1991.[3] R.E. Speece (Ed.), Anaerobic Biotechnology, Archea Press,
Nashville, 1996, p. 74.
Copyright © 2022 FDOKUMEN