Mass Spectrometric Inverse Gas Chromatography: Investigation of Polymeric Phase Transitions
11
Mass Spectrometric Inverse Gas Chromatography: Investigation of Polymeric Phase Transitions S. Panda, Q. Bu, B. Huang, R. R. Edwards, Q. Liao, K. S. Yun, and J. F. Parcher* Chemistry Department, University of Mississippi, University, Mississippi 38677 An improved inverse gas chromatographic method involv- ing the use of a mass-specific detector for the determina- tion of the glass transition temperature of polymeric materials is described. The new method allows the use of several probe solutes simultaneously with an auto- mated, closed-loop injector and stepped temperature programming. The result is a single continuous chro- matogram for each probe solute over a range of temper- atures encompassing the glass transition temperature, T g . Several different methods for the exact determination of T g from the chromatogram were investigated, including the classical van’t Hoff-type plots with retention volumes calculated from both the peak maximum and first moment values of the elution peaks. Two new methods are also proposed for the evaluation of T g from either the temper- ature dependence of the second moments of the elution peaks for probe solutes or simple inspection of the variation of elution peak height (width) with temperature. All four methods for the determination of T g are evaluated with three probe solutes and four different polymers, viz., poly(methyl methacrylate), poly(ethylene terephthalate), polycarbonate, and two batches of polystyrene with dif- ferent molecular weights and T g values. Three phenom- enological models were used to interpret the chromato- graphic retention mechanisms of the solute probes in glassy and rubbery polymers. These are (i) the classical adsorption/absorption model for glass and rubber poly- mers, (ii) the single absorption mechanism model, and (iii) a dual-mode model previously used to explain the sorption of gases, such as CO 2 , in glassy polymers. It is concluded that no single approach is adequate to interpret the experimental results for all of the systems, although each model is adequate for some individual solute/ polymer combinations. The onset of segmental motion in a polymer with increasing temperature often gives rise to a glassfrubber transition char- acterized by a glass transition temperature, T g . Glass transition temperatures can be altered and manipulated by the use of polymer blends or plasticizers including liquids, soluble vapors, or compressible fluids, such as CO 2 . Such experimental manipu- lation has many technological implications and commercial ap- plications. Control and manipulation of the glass transition temperature of polymers has become significant in such areas as the separation and fractionation of polymers, polymer fabrication, impregnation of polymers with additives and removal of unwanted impurities. However, practical measurement of the glass transition temperature of polymers plasticized with a low molecular weight, perhaps volatile, component is experimentally difficult yet critically important to the development of novel polymeric materials with well-controlled physical and chemical properties. There are several different experimental approaches to the detection of a glass transition in polymeric media. These include the classical calorimetric methods, spectroscopic techniques, elastic modulus measurements and chromatographic techniques. Each of these methods has unique advantages as well as concomitant disadvantages; however, the use of volatile liquids or compressible fluids as plasticizers severely restricts the choice of experimental techniques for measuring T g . Nevertheless, one of the calorimetric methods, differential scanning calorimetry (DSC) has been used to estimate the effect of dissolved CO 2 on the glass transition temperature of poly(methyl methacrylate). 1 Also, an elastic modulus method, viz., creep compliance, has been used 2,3 to determine the glass transition temperature of a polymer as a function of the pressure of carbon dioxide in contact with the polymer. Ideally, when volatile plasticizers are used, the exact composition of the diluent-polymer mixture should be deter- mined in order to provide a correlation between the glass transition temperature and the composition of such mixtures. However, no classical experimental method has yet been devel- oped which can simultaneously measure both the uptake of a diluent by a polymer and the effect of such sorption on T g . To date, no chromatographic method has been applied to the measurement and investigation of such complex, multicomponent polymer systems. Some chromatographic methods, in particular inverse gas chromatography (IGC), 4-6 have been shown to provide accurate information about the phase transitions of pure polymers 7-11 as well as the degree of crystallinity, 8,12,13 molecular diffusion coefficients, 14-21 and the strength of molecular interactions. 22-25 (1) Chiou, J. S.; Barlow, J. W.; Paul, D. R. J. Appl. Polym. Sci. 1985, 30, 2633- 2642. (2) Condo, P. D.; Paul, D. R.; Johnston, K. P. Macromolecules 1994, 27, 365- 371. (3) Condo, P. D.; Johnston, K. P. J. Polym. Sci., Polym. Phys. Ed. 1994, 32, 523-533. (4) Conder, J. R.; Young, C. L. Physicochemical Measurement by Gas Chroma- tography; John Wiley & Sons Ltd.: New York, 1979. (5) Inverse Gas Chromatography; Lloyd, D. R., et al., Eds.; ACS Symposium Series 391: American Chemical Society: Washington, DC, 1989. (6) Munk, P. In Macromolecules 1992; Kahovec, J., Ed.; VSP-BH: Zeist, The Netherlands, 1993; pp 185-206. (7) Braun, J. M.; Lavoie, A.; Guillet, J. E. Macromolecules 1975, 8, 311-315. (8) Braun, J. M.; Guillet, J. E. Macromolecules 1977, 10, 101-106. (9) Braun, J. M.; Guillet, J. E. Macromolecules 1976, 9, 340-344. (10) Braun, J. M.; Guillet, J. E. Macromolecules 1975, 8, 882-888. (11) Deshpande, D. D.; Tyagi, O. S. Macromolecules 1978, 11, 746-751. (12) Guillet, J. E.; Stein, A. N. Macromolecules 1970, 3, 102-105. (13) Dexi, W.; et al. Chem. Mater. 1989, 1, 357-362. (14) Hattam, P.; Munk, P. Macromolecules 1988, 21, 2083-2090. Anal. Chem. 1997, 69, 2485-2495 S0003-2700(96)00848-7 CCC: $14.00 © 1997 American Chemical Society Analytical Chemistry, Vol. 69, No. 13, July 1, 1997 2485
Transcript of Mass Spectrometric Inverse Gas Chromatography: Investigation of Polymeric Phase Transitions

Mass Spectrometric Inverse Gas Chromatography:Investigation of Polymeric Phase Transitions
S. Panda, Q. Bu, B. Huang, R. R. Edwards, Q. Liao, K. S. Yun, and J. F. Parcher*
Chemistry Department, University of Mississippi, University, Mississippi 38677
An improved inverse gas chromatographic method involv-ing the use of a mass-specific detector for the determina-tion of the glass transition temperature of polymericmaterials is described. The new method allows the useof several probe solutes simultaneously with an auto-mated, closed-loop injector and stepped temperatureprogramming. The result is a single continuous chro-matogram for each probe solute over a range of temper-atures encompassing the glass transition temperature, Tg.Several different methods for the exact determination ofTg from the chromatogram were investigated, includingthe classical van’t Hoff-type plots with retention volumescalculated from both the peak maximum and first momentvalues of the elution peaks. Two new methods are alsoproposed for the evaluation of Tg from either the temper-ature dependence of the second moments of the elutionpeaks for probe solutes or simple inspection of thevariation of elution peak height (width) with temperature.All four methods for the determination of Tg are evaluatedwith three probe solutes and four different polymers, viz.,poly(methyl methacrylate), poly(ethylene terephthalate),polycarbonate, and two batches of polystyrene with dif-ferent molecular weights and Tg values. Three phenom-enological models were used to interpret the chromato-graphic retention mechanisms of the solute probes inglassy and rubbery polymers. These are (i) the classicaladsorption/absorption model for glass and rubber poly-mers, (ii) the single absorption mechanism model, and(iii) a dual-mode model previously used to explain thesorption of gases, such as CO2, in glassy polymers. It isconcluded that no single approach is adequate to interpretthe experimental results for all of the systems, althougheach model is adequate for some individual solute/polymer combinations.
The onset of segmental motion in a polymer with increasingtemperature often gives rise to a glassfrubber transition char-acterized by a glass transition temperature, Tg. Glass transitiontemperatures can be altered and manipulated by the use ofpolymer blends or plasticizers including liquids, soluble vapors,or compressible fluids, such as CO2. Such experimental manipu-lation has many technological implications and commercial ap-plications. Control and manipulation of the glass transitiontemperature of polymers has become significant in such areas asthe separation and fractionation of polymers, polymer fabrication,impregnation of polymers with additives and removal of unwantedimpurities. However, practical measurement of the glass transitiontemperature of polymers plasticized with a low molecular weight,
perhaps volatile, component is experimentally difficult yet criticallyimportant to the development of novel polymeric materials withwell-controlled physical and chemical properties.
There are several different experimental approaches to thedetection of a glass transition in polymeric media. These includethe classical calorimetric methods, spectroscopic techniques,elastic modulus measurements and chromatographic techniques.Each of these methods has unique advantages as well asconcomitant disadvantages; however, the use of volatile liquidsor compressible fluids as plasticizers severely restricts the choiceof experimental techniques for measuring Tg. Nevertheless, oneof the calorimetric methods, differential scanning calorimetry(DSC) has been used to estimate the effect of dissolved CO2 onthe glass transition temperature of poly(methyl methacrylate).1
Also, an elastic modulus method, viz., creep compliance, has beenused2,3 to determine the glass transition temperature of a polymeras a function of the pressure of carbon dioxide in contact with thepolymer. Ideally, when volatile plasticizers are used, the exactcomposition of the diluent-polymer mixture should be deter-mined in order to provide a correlation between the glasstransition temperature and the composition of such mixtures.However, no classical experimental method has yet been devel-oped which can simultaneously measure both the uptake of adiluent by a polymer and the effect of such sorption on Tg. Todate, no chromatographic method has been applied to themeasurement and investigation of such complex, multicomponentpolymer systems.
Some chromatographic methods, in particular inverse gaschromatography (IGC),4-6 have been shown to provide accurateinformation about the phase transitions of pure polymers7-11 aswell as the degree of crystallinity,8,12,13 molecular diffusioncoefficients,14-21 and the strength of molecular interactions.22-25
(1) Chiou, J. S.; Barlow, J. W.; Paul, D. R. J. Appl. Polym. Sci. 1985, 30, 2633-2642.
(2) Condo, P. D.; Paul, D. R.; Johnston, K. P. Macromolecules 1994, 27, 365-371.
(3) Condo, P. D.; Johnston, K. P. J. Polym. Sci., Polym. Phys. Ed. 1994, 32,523-533.
(4) Conder, J. R.; Young, C. L. Physicochemical Measurement by Gas Chroma-tography; John Wiley & Sons Ltd.: New York, 1979.
(5) Inverse Gas Chromatography; Lloyd, D. R., et al., Eds.; ACS Symposium Series391: American Chemical Society: Washington, DC, 1989.
(6) Munk, P. In Macromolecules 1992; Kahovec, J., Ed.; VSP-BH: Zeist, TheNetherlands, 1993; pp 185-206.
(7) Braun, J. M.; Lavoie, A.; Guillet, J. E. Macromolecules 1975, 8, 311-315.(8) Braun, J. M.; Guillet, J. E. Macromolecules 1977, 10, 101-106.(9) Braun, J. M.; Guillet, J. E. Macromolecules 1976, 9, 340-344.
(10) Braun, J. M.; Guillet, J. E. Macromolecules 1975, 8, 882-888.(11) Deshpande, D. D.; Tyagi, O. S. Macromolecules 1978, 11, 746-751.(12) Guillet, J. E.; Stein, A. N. Macromolecules 1970, 3, 102-105.(13) Dexi, W.; et al. Chem. Mater. 1989, 1, 357-362.(14) Hattam, P.; Munk, P. Macromolecules 1988, 21, 2083-2090.
Anal. Chem. 1997, 69, 2485-2495
S0003-2700(96)00848-7 CCC: $14.00 © 1997 American Chemical Society Analytical Chemistry, Vol. 69, No. 13, July 1, 1997 2485

The chromatographic methods have the advantages of speed,simplicity, and (with a mass-specific detection system) solutespecificity.26 Probably the greatest advantage of the chromato-graphic approach, however, is the ability to investigate solute/polymer mixtures with the solute present at infinite dilution, i.e.,with essentially pure polymer.
Unfortunately, however, there are several fundamental prob-lems and experimental uncertainties in the current IGC methodol-ogy that must be addressed. The significant weak points of IGCinclude both the uncertainty of retention mechanism(s) andassumptions regarding the thermodynamic validity of commonlyused chromatographic retention parameters at temperatures closeto or below Tg. The latter problem is evidenced by an experi-mentally observed flow rate dependence of the specific retentionvolume measured from the retention time of the maximum pointof an elution peak at temperatures close to Tg.10,11,20,24,27,28 Thiscombination of multiple retention mechanisms and uncertainequilibrium conditions means that the results obtained from agiven IGC experiment may depend on the chemical and physicalproperties of the probe solute as well as those of the polymer.9,29-31
In addition to these fundamental problems, further experimentaland mathematical problems exist as well. The experimentalproblems include the preparation of a packed or capillary GCcolumn with a precisely known amount of polymer as thestationary phase. Another difficulty is the “batch mode” methodof operation in which a single solute is studied at one temperatureto produce one retention volume datum. This requirement is oftenimposed by the nonspecific detectors, e.g., FID or TCD, commonlyused for IGC experiments. Data analysis also presents someunique problems because of the indirect nature of the IGCexperiment. That is, changes in the polymer morphology aredetected only by their secondary effect on the solubility and/ordiffusion of a volatile probe solute in a given polymer. Theexperimentally observed changes in probe retention with tem-perature are often ill-defined and may vary for different solutes,and the experimental elution peaks are often asymmetric, thusaugmenting the difficulties of generating valid thermodynamicinformation.
Asymmetric elution peaks for infinite dilution probe solutesare characteristic of polymeric stationary phases which are in orclose to their glassy states. In this case, the maximum point onan elution peak may not be an accurate measure of the firstmoment of that peak, and it is the first moment that is the
thermodynamically valid parameter. For example, in 1989, Wangand Charlet32 suggested that the classical S-shaped van’t Hoff plotscommonly used to determine the glass transition temperaturefrom IGC data were artifacts caused by the use of peak maximumretention times rather than first moment values. Their workshowed that a plot of ln Vg
0 vs 1/T was linear and independent offlow rate for chloroform with polystyrene if the specific retentionvolume, Vg
0, was calculated from the first moment rather thanthe peak maximum. In that case, the van’t Hoff plot no longerwould serve as a viable tool for the determination of Tg. Theirresults suggested a single absorption mechanism for both theglassy and rubbery polymer, and thus the classical dual (absorp-tion/adsorption) retention mechanism model was of questionablevalidity, at least for this particular system. However, these authorsalso suggested that the temperature dependence of the secondmoment of the elution peaks could be used to distinguish apolymer in a glassy state from that in a rubbery state. Thisobservation could form the basis for the estimation of Tg fromsecond moment data for systems which do not show a sharptransition in the reciprocal temperature van’t Hoff-type plots.Unfortunately, the application of statistical moment analysis in IGCstudies is extremely difficult and uncertain because of the myriadproblems encountered in the measurement of the first andespecially the second moments of asymmetric chromatographicpeaks.33-36
The present investigation was designed to develop an improvedexperimental procedure for the IGC determination of glasstransition temperatures by directly addressing some of theproblems cited previously. The described method involves theuse of (i) an off-line vapor injector for repetitive, automatedinjections of probe solutes, (ii) a mass-specific detection systemto allow the use of multiple probes in a single experiment, (iii)stepped temperature programming operation to produce a singlechromatogram for an IGC experiment over a broad temperaturerange, i.e., to eliminate batch mode operations, and (iv) informa-tion regarding the shape of elution peaks as well as the specificretention volume to determine the exact Tg value for a givenpolymer. The proposed technique is designed specifically to allowthe determination of glass transition temperatures for plasticizedpolymers in which the plasticizing agent is a volatile liquid orsupercritical fluid.
EXPERIMENTAL SECTIONMaterials. The IGC instrumentation and injection system are
shown in Figure 1, where the closed-loop injector37 is shown inbold. Briefly, the off-line injector was operated as follows: theisolation valve (9) was switched to allow a gas to sweep the injectorloop; the loop was then filled with a gas, such as neon, whichserved as a dead timer marker; the isolation valve was returnedto the position shown in the figure (9) to form a closed loop; andthen a mixture of probe solutes in liquid form was injected intothe packed column injection port (10) and vaporized at 250 °C inthe valve oven (12). The closed loop then acted as a samplereservoir for subsequent injections from the gas sampling valve(11). The capillary injection port for the mass detector (5),
(15) Xie, L. Q. Polymer 1993, 34, 4579-4584.(16) Romansky, M.; Guillet, J. E. Polymer 1994, 35, 584-589.(17) Pawlisch, C. A.; Macris, A.; Laurence, R. L. Macromolecules 1987, 20, 1564-
1578.(18) Romdhane, I. H.; Danner, R. P.; Duda, J. L. Ind. Eng. Chem. Res. 1995, 34,
2833-2840.(19) Arnould, D.; Laurence, R. L. Ind. Eng. Chem. Res. 1992, 31, 218-228.(20) Qin, R. Y.; Schreiber, H. P. Langmuir 1994, 10, 4153-4156.(21) Faridi, N.; Duda, J. L.; Danner, R. P. Rubber Chem. Technol. 1996, 69, 234-
244.(22) Du, Q.; Hattam, P.; Munk, P. J. Chem. Eng. Data 1990, 35, 367-371.(23) El-Hibri, M. J.; Cheng, W.; Munk, P. Macromolecules 1988, 21, 3458-3463.(24) Lichtenthaler, R. N.; Liu, D. D.; Prausnitz J. M. Macromolecules 1974, 7,
565-570.(25) Smidsrod, O.; Guillet, J. E. Macromolecules 1969, 2, 272-277.(26) Parcher, J. F.; Bell, M. L.; Lin, P. J. In Advances in Chromatography; Giddings,
J. C., Ed.; Marcel Dekker: New York, 1984.(27) Tyagi, O. S.; Deshpande, D. D. J. Appl. Polym. Sci. 1987, 34, 2377-2388.(28) Mukhopadhyay, P.; Schreiber, H. P. Macromolecules 1993, 26, 6391-6396.(29) Etxeberria, A.; et al. Macromolecules 1995, 28, 7188-7195.(30) Olabisi, O. Macromolecules 1975, 8, 316-322.(31) Robard, A.; Patterson, D. Macromolecules 1977, 10, 1021-1025.
(32) Wang, J. Y.; Charlet, G. Macromolecules 1989, 22, 3781-3788.(33) Yau, W. W.; Kirkland, J. J. J. Chromatogr. 1991, 556, 111-118.(34) Yau, W. W.; et al. J. Chromatogr. 1993, 630, 69-77.(35) Anderson, D. J.; Walters, R. R. J. Chromatogr. Sci. 1984, 22, 353-359.(36) Foley, J. P.; Dorsey, J. G. Anal. Chem. 1983, 55, 730-737.(37) Panda, S.; et al. J. Chromatogr. 1995, 715, 279-285.
2486 Analytical Chemistry, Vol. 69, No. 13, July 1, 1997

capillary column (14), and mass-specific detector were part of acommercial GC/MS system, viz., a Hewlett Packard 5971A MSDinstrument. The MSD capillary column was replaced by an empty200 µm i.d. fused silica tube which acted only as a transfer linefor the solutes from the packed column to the detector. Thepacked column injection port, packed column, isolation and gassampling valves, pressure sensors, and flow controllers wereadded to the instrument. Flow into the MSD was controlled viathe normal inlet splitter (5) and electronic pressure controller ofthe GC/MS system. The MSD was operated in the selected ionmonitor mode to enhance sensitivity and allow the use of trulyinfinite dilution samples. The MSD also allowed the determinationof accurate retention times of multiple probe solutes, even whenthe solutes were not chromatographically resolved, which wasoften the case at higher temperatures.
The IGC experiments were carried out in a stepped mode bymaintaining the temperature of the GC oven (15) containing thepacked column constant for a certain period of time to allow aninjected peak to elute. After elution of the peak, the temperature
was quickly ramped before the next injection. The molar flowrate of the carrier gas was maintained constant throughout anyrun by the flow regulators. The volumetric flow rate at columnconditions varied with the column temperature and pressureduring a stepped temperature-programmed experiment. Thevolumetric flow rates were calculated from the ideal gas law forthe helium carrier gas. Neon was used as a dead time marker.
The polymers used for this investigation, shown in Table 1,were polystyrene and poly(methyl methacrylate), supplied byPolysciences, Inc., and poly(ethylene terephthalate) and polycar-bonate, supplied by Aldrich. The molecular weights listed areMw values. The glass transition temperature for the low molecularweight polystyrene was determined by differential scanningcalorimetry. The Tg values for the other polymers were takenfrom the cited references.
(38) Bovey, F. A. Macromolecules: An Introduction to Polymer Science; AcademicPress: New York, 1979.
(39) Aldrich Catalog/Handbook of Fine Chemicals; Aldrich Chemical Co., Inc.:Milwaukee, WI, 1996.
Figure 1. Mass spectrometric IGC instrumentation. 1, Carrier gas (He); 2, instrument flow controller; 3, flow regulator; 4, pressure sensor; 5,capillary injector; 6, electronic pressure controller; 7, vent; 8, sweep gas (Ne); 9, isolation valve (closed position); 9′, isolation valve (sweepmode); 10, analytical column injector; 11, gas sampling valve (load); 11′, gas sampling valve (injection mode); 12, valve oven; 13, analyticalcolumn; 14, fused silica tube; 15, GC oven; 16, mass-specific detector.
Table 1. Structure and Physical Properties of the Polymers
polymer average MW Tg (°C) structure of repeat unit
polystyrene 190 000 11038 CHCH2
polystyrene (low MW) 50 000 65poly(methyl methacrylate) 100 000 10538 CH3
C
COOCH3
CH3
polycarbonate resin 64 000 15039
C
CH3
CH3
O CO
O
poly(ethylene terephthalate) 18 000 8139
C
O
C
O
OCH2CH2O
Analytical Chemistry, Vol. 69, No. 13, July 1, 1997 2487

The chromatographic columns were prepared by dissolvingthe pure polymers in a suitable solvent, mixing with DMCS-treatedChromosorb W, and subsequently evaporating off the solvent. Thestationary phase was packed in 1/4 in. o.d. copper columns. Thepercent coating was determined by combustion of the polymerfrom the solid support. The polymer loadings varied from 3 to13%.
Calculations. The first and second statistical moments of theelution peaks, µ1 and µ2, respectively, were calculated from thedetector response, h(t) as a function of time, t, by the equations
The GC/MS system was operated in a selected ion monitor modewith a cycle time, ∆t, of 100-200 ms. Thus, for a typical elutionpeak with a width of 30 s, the number of data points used for themoment calculations would be in the range of several hundred.
Theoretical Models. There are two principal models for theinterpretation of the chromatographic retention data of probesolutes with polymers in the glass and rubber states. The primarydifference between the models is the relative significance of therole of adsorption on the bulk surface or on the inner surface ofmicrovoids within the polymer in the postulated retention mech-anism for the probe solutes. The earliest and most commonlyaccepted model10,11,40-44 posits absorption (partition) as the domi-nant retention mechanism for temperatures above Tg but surfaceadsorption as the primary retention process at lower temperatures.The change in retention mechanism is manifest as an abruptchange of slope in a plot of retention volume vs reciprocaltemperature, i.e., a van’t Hoff-type plot. The glass transitiontemperature is taken as the temperature at which the retentiondata first show a deviation from linearity at temperatures belowTg.7,10,28,42 The peak asymmetry observed for solutes adsorbedon glassy polymers can probably be attributed to nonlinearadsorption isotherms or slow adsorption kinetics. This model hasbeen discussed extensively in the literature and used successfullyto interpret many published IGC investigations of polymericmaterials.
Recently, however, an alternative, but not necessarily contra-dictory, theory has been used to interpret certain systems. Thismodel14,45,46 postulates a single absorption process (retentionmechanism) for polymers in both glassy and rubbery states. Asmentioned previously, several authors18,32 have suggested that theclassical S-shaped form of the van’t Hoff plots for polymers in theregion of a glassTrubber transition is an artifact caused by theuse of the retention time of the maximum point of an elution peak
for the calculation of retention volumes. These authors showedthat van’t Hoff plots are linear for some probe solutes withpolystyrene over a wide temperature range encompassing Tg ifthe retention volumes were calculated from the first moment of theelution peak rather than from the peak maximum. A linear van’tHoff plot for a polymer in both glassy and rubbery states wouldindicate a single retention mechanism. The observed peakasymmetry for solutes partitioning in the glassy polymer ispurportedly caused by slow diffusion processes within the bulkof the polymer.
Along with these two chromatographic models, a dual-modesorption model has been proposed47-49 to account for the unusualsorption behavior of light gases in glassy polymers. This modelpostulates that the sorption of gases in glassy polymers consistsof two separate contributions. One is simple dissolution of thegases in the polymer described by Henry’s law. The other isadsorption of the gases on the inner surface of microvoids (holefree volume) within the polymer. Such adsorption can bedescribed by the Langmuir equation. The overall uptake of thegas at any pressure and temperature (below Tg) is the sum of thetwo independent mechanisms. At temperatures above Tg, theadsorption mechanism diminishes, and Henry’s law behavior isobserved.
The experimental results reported in the current investigationwill be used to assess the validity and applicability of these threetheoretical models to each of the particular systems studied herein.
RESULTS AND DISCUSSIONTo minimize the time required for a complete IGC experiment
covering a range of temperatures, probe solutes which eluted veryrapidly were selected. Thus, overlapping chromatographic peakswere frequently observed, and a mass specific detector wasrequired. The mass resolution of chromatographically unresolvedelution peaks is illustrated in Figure 2 for two probe solutes(pentane and isooctane) and a dead time marker (neon). Part Aof Figure 2 depicts the response obtained from the MSD, whileparts B and C show the responses that would have been obtainedwith flame ionization and thermal conductivity detectors, respec-tively.
Four polymers were selected for investigation because theyhad glass transitions in the experimentally accessible range andwere otherwise suitable for chromatographic studies. Threesolute probes, chloroform, benzene, and decane, were used tocover a range of chemical types and solvent strength for theapplicable polymers. A typical chromatogram is shown in Figure3, which also illustrates the temperature programming techniquefor both negative and positive 10 °C steps. The stepped lines inthe figure illustrate the temperature increments, referenced to theright-hand scale, and the time intervals used for the experiment.These particular experiments were carried out to determinewhether or not there were any hysteresis effects that couldinfluence the chromatographic results. Such hysteresis had beenobserved with continuous programming techniques.
The chromatogram shown in Figure 3 has a unique pattern ofpeak heights even though the amount of solute injected at eachtemperature, and thus the peak area, was essentially constant,
(40) Guillet, J.; et al. In Inverse Gas Chromatography; Lloyd, D., et al., Eds.;American Chemical Society: Washington, DC, 1989; pp 20-32.
(41) Braun, J. M.; Guillet, J. E. Macromolecules 1976, 9, 617-621.(42) Braun, J. M.; Guillet, J. E. J. Polym. Sci., Polym. Chem. Ed. 1976, 14, 1073-
1081.(43) Courval, G. J.; Gray, D. G. Macromolecules 1975, 8, 916-920.(44) Courval, G.; Gray, D. G. Macromolecules 1975, 8, 326-331.(45) Pawlisch, C. A.; Bric, J. R.; Laurence, R. L. Macromolecules 1988, 21, 1685-
1698.(46) Edwards, T. J.; Newman, J. Macromolecules 1977, 10, 609-615.
(47) Barrer, R. M.; Barrie, J.; Slater, J. J. Polym. Sci. 1958, 27, 177-197.(48) Kamiya, Y.; et al. J. Polym. Sci., Polym. Phys. Ed. 1986, 24, 535-547.(49) Kamiya, Y.; et al. J. Polym. Sci., Polym. Phys. Ed. 1989, 27, 879-892.
µ1 ) ∑th(t) ∆t
∑h(t) ∆t(1)
µ2 ) ∑(t - µ1)2h(t) ∆t
∑h(t) ∆t(2)
2488 Analytical Chemistry, Vol. 69, No. 13, July 1, 1997

with only a slight (∼3%) loss per injection due to dilution of thesample reservoir with carrier gas.37 Significantly, the elution peakheights do not reflect this constant loss; instead, there is a localmaximum in the peak heights at an intermediate temperatureclose to 100 °C for both temperature programming directions.
The heights of the elution peaks are controlled by the peakdispersion mechanisms operative in a given system; however, theclassical method for the chromatographic determination of Tg isbased on a measure of the retention of a solute, not peakdispersion. The retention data are usually reported in the formof a van’t Hoff-type plot of the log of the specific retention volumevs the reciprocal temperature, and Tg is determined graphicallyas the first point of deviation from linearity in the plot at lowtemperatures, i.e., at temperatures where the polymer is in a glassystate. The specific retention volumes can be calculated fromretention times measured at the maximum point of the elutioncurves or from the calculated first moment of the peaks. Thesetwo parameters will give different retention volumes for elutionpeaks which are asymmetric, such as those observed for mostsolutes with glassy polymers. The results for these calculationswith one solute, benzene, and four different polymers are shownin Figure 4. This figure illustrates some of the basic difficultieswith IGC investigations of polymers, because each of the van’tHoff plots is distinct from the others. As previously observed byWang and Charlet32 for chloroform, the first moment plots forbenzene with both batches of polystyrene are linear and distinctfrom the peak maximum plots. On the other hand, neither of
those observations is true for the other three polymers. Thus,the statement by Wang and Charlet32 that S-shaped van’t Hoff plotsare an artifact caused by the use of peak maxima retentionvolumes rather than first moment seems to hold for only a singlepolymer, polystyrene. For PMMA, both plots are nonlinear; forPET, the first moment plot is nonlinear, while the peak maximaplot is linear; and for PCR, the first moment and peak maximaare equivalent, and the plots are linear with a very obvious changein slope at Tg. In every case, the first moment and peak maximadata coincide at high temperatures, where the polymer is a rubber.
The van’t Hoff plots for chloroform with the four polymers wereidentical in shape with those for benzene. Thus, only theexperimental results for benzene will be discussed herein.
Benzene and chloroform are relatively good solvents for mostof the polymers. Completely different results are observed,however, for the van’t Hoff plots for different probe solutes, suchas n-decane, which is not a good solvent for any of the polymers.The results for this probe solute are shown in Figure 5. In thiscase, the plots for polystyrene are both nonlinear with the classicalS-shape. The same is true for PMMA; however, in this case, thetwo plots coincide for temperatures where the polymer is a glass,and the same is true for PET. PCR shows coincidence at hightemperatures, with a linear but broken first moment plot and anS-shaped peak maxima plot. Linear van’t Hoff plots indicate thata single retention mechanism, usually partition, is dominant,whereas an S-shaped plot indicates that multiple, concurrentmechanisms, such as adsorption and absorption, exist and therelative significance of the contribution to retention of eachmechanism depends on the temperature.
This lack of consistency has proven to be a major problem forthe determination of Tg from chromatographic retention data. Thecommonly accepted method for determining Tg for van’t Hoff
Figure 2. Comparison of MSD selected ion response (A) to thehypothetical response for flame ionization (B) and thermal conductivity(C) detectors.
Figure 3. Chromatograms for repetitive injections of n-decane withpolystyrene. Top panel, temperature increments of -10 °C; bottompanel, temperature increments of +10 °C.
Analytical Chemistry, Vol. 69, No. 13, July 1, 1997 2489

plots7,10,28,42 is to specify Tg as the temperature at which the peakmaxima data deviate from linearity at low temperatures. Thesepoints can be compared with the Tg values, which are markedwith arrows in Figures 4 and 5. The assignments are valid forboth solutes with PS and PCR. The PET polymer shows no clearbreak with either solute. PMMA gives a correct value with thealkane probe but a very anomalous value with the benzene probe.It is possible that benzene, which is a very good solvent forPMMA, could plasticize the polymer and lower the Tg value. Totest this hypothesis, the sample size was decreased to the lowestlimits detectable by the GC/MS system operated in the SIM mode;however, no change in the van’t Hoff plot was observed.
In addition to changes in solubility caused by the glasstransition in polymers, there is a secondary, but often significant,change in the rate of diffusion of the probe solute in the bulkpolymer or adsorption of the solute on the polymer surface ormicrovoids. This change is reflected in the dispersion of the
elution peaks rather than the retention volume. Wang andCharlet32 first measured the second moments of the elution peaksfor chloroform with polystyrene in the glassy and rubbery states.The parameter actually used was a dimensionless second momentwhich is the reciprocal of the number of theoretical plates, N:
Wang and Charlet32 suggested that Tg could be determined froma plot of 1/N vs temperature as a sharp increase in 1/N withdecreasing temperature at the glass transition temperature. Thissuggestion was predicated on the assumption50 that the diffusioncoefficient of the probe solute in the glassy polymer would bemuch smaller than that in the rubbery polymer, which would
(50) Gray, D. G.; Guillet, J. E. Macromolecules 1974, 7, 244-247.
Figure 4. Van’t Hoff plots for benzene with four polymers. The ordinate for the high molecular weight polystyrene data is on the right-handside of the plot. O, first moment; b, peak maxima.
1/N ) µ2/µ12 (3)
2490 Analytical Chemistry, Vol. 69, No. 13, July 1, 1997

result in a sudden increase in dispersion, i.e., a sudden decreasein the efficiency of the column expressed as the number oftheoretical plates, N. To test this hypothesis with the current data,retention volume data for each system were plotted in the formof 1/N vs temperature. The plot for one system, viz., chloroformwith PSsthe same system studied by Wang and Charletsis shownin Figure 6, with the arrow drawn at the position suggested byWang and Charlet32 to indicate the glass transition temperature.In fact, the current experimental study was extended to lowertemperatures than studied previously,32 so a second abrupt changein slope could be observed at 100 °C, which is actually the glasstransition point. The decrease in 1/N at low temperatures is duemore to an increase in the retention time, µ1, rather than adecrease in µ2. Thus, the use of a dimensionless second momentsomewhat obscures the changes in peak shape imposed by achange in diffusion coefficient. Nevertheless, the sharp changein the dimensionless second moment at Tg suggests a means fordetermining the glass transition temperature from statisticalmoment data from even asymmetric elution peaks.
Figure 6. Plot of the dimensionless second moment of chloroformwith polystyrene.
Figure 5. Van’t Hoff plots for n-decane with four polymers.
Analytical Chemistry, Vol. 69, No. 13, July 1, 1997 2491

Several investigators have shown17,18,45 that, under certain ratherrigorous conditions, the diffusion coefficient, Ds, of a probe solutein a polymer can be measured from the statistical moments ofthe elution peaks using the relationship
where df is the thickness of the polymer film and t0 is the retentiontime of a solute which is insoluble in the polymeric stationaryphase, i.e., the dead time of the system. The necessary conditionsare discussed in the original references17,18,45 and are somewhatdifficult to achieve, especially with packed columns. However,the function (µ1 - t0)/µ2 should be at least proportional to Ds ifpartition is the dominant retention mechanism and resistance tomass transfer in the polymer is the predominant dispersion mecha-nism for the probe solute. In other words, in some cases, thisfunction will have more physical significance than the dimension-less second moment or 1/N.
The temperature dependence of the diffusion coefficient foran infinitely dilute solute (1) in a polymer (2) has been shown18,51
to follow a free volume expression given by eq 5,
where D0 is a constant, E is the activation energy for diffusion, γis an overlap factor, V̂2* is the specific hole free volume of thepolymer, and ê is the ratio of the critical molar volumes of jumpingunits for the polymer and solvent, i.e.,
Here, Mj,i is the molecular weight of a jumping unit of componenti. K12 and K22 are the free volume parameters of the polymer,
(51) Vrentas, J. S.; Duda, J. L. J. Appl. Polym. Sci. 1978, 22, 2325-2339.
Figure 7. Moment ratio plots for benzene with four polymers.
Ds )2df
2
3 {µ1 - t0
µ2} (4)
D1 ) D0 exp( ERT) exp{ -γV̂2*ê
K12[K22 + λ(T - Tg)]} (5)
ê )Mj,1V̂1*Mj,2V̂2*
(6)
2492 Analytical Chemistry, Vol. 69, No. 13, July 1, 1997

and Tg is the glass transition temperature of the pure polymer.The parameter λ ) 1 for rubbery polymers, and λ ) 0.2-0.3 forglassy polymers.18 The Arrehenius form of eq 5 indicates that aplot of log D1 vs 1/T should be reasonably linear, with a changeof slope at the point where the value of λ changes, i.e., at Tg. Thesame logic should hold for the moment ratio, (µ1 - t0)/µ2.
Such plots for benzene are shown in Figure 7. Except for PCR,the plots show a clear change in the function at the glass transitiontemperature and an upper limit of approximately 100 min-1 at hightemperatures. The upper limit is really a lower limit on µ2 imposedby the finite volume of the sampling loop in the injector. That is,the peak width cannot be smaller than the width of the injectedpulse. The PMMA polymer shows an anomalous temperaturedependence of the moment ratio for benzene at low temperatures,i.e., the function decreases with increasing temperature, indicatingthat the diffusion is not the dominant dispersion mechanism andthat eq 4 is not valid for this system. This conclusion is supported
by the observation that the first moment van’t Hoff plots for thissystem are nonlinear and multiple mechanisms contribute to boththe dispersion and retention of benzene in PMMA. Surprisingly,the break in the moment ratio plot for benzene with PMMA occursvery close to Tg, unlike the first deviation from linearity (Figure4), which is far too low. The PCR polymer shows no change inthe moment ratio for benzene at the glass transition temperature,indicating that the retention mechanism for benzene is the samefor both rubbery and glassy PCR polymer.
While partition is the dominant retention mechanism forbenzene with polystyrene and probably PET as well, adsorptionis an important mechanism for long-chain alkanes such asn-decane. The moment ratio results for this probe solute withthe same four polymers are shown in Figure 8. In each case,there is a break in the moment ratio plot at or close to the glasstransition temperature, and the moment ratio decreases withincreasing temperature at temperatures below Tg, indicating that
Figure 8. Moment ratio plots for n-decane with four polymers.
Analytical Chemistry, Vol. 69, No. 13, July 1, 1997 2493
simple partition is not the dominant retention mechanism.Calculation of the second moments of asymmetric peaks is difficultand unreliable; however, the moment ratio provides an auxiliarymethod for the determination of Tg from IGC experiments forsystems in which the van’t Hoff plots are unsatisfactory.
The moment ratio and van’t Hoff plots for decane can beinterpreted with the classical model of surface adsorption attemperatures below Tg along with bulk partition well above Tg.The intermediate temperature region showing the reversedtemperature dependence of the retention volumes represents atransition region in which two retention mechanisms operateconcurrently, with the relative significance of each mechanismdependent on the system temperature and the physical state ofthe polymer. The effects of this retention mechanism change onthe shape and retention time of the elution peaks for n-decanewith polystyrene are illustrated in Figure 3. The chromatogramsfor benzene and decane with the other polymers are shown inFigures 9 and 10, where the Tg points are marked with a dot.The patterns of the peak heights (widths) correspond with andreflect the shapes of the van’t Hoff plots, even though the twodata analysis schemes measure completely different phenomena,viz., peak dispersion and retention of the solute probe. If the van’tHoff plot shows an endothermic region, where the retentionvolume increases with increasing temperature, a maximum isobserved in the peak heights, with the first decline in heightoccurring at the glass transition temperature. This is observedfor all three probe solutes with PS and PMMA, although thetransition temperature with benzene and PMMA is low (∼70 °C),as shown in the van’t Hoff plot (Figure 4). On the other hand, ifthe van’t Hoff plots do not show such temperature reversal, thenthe IGC chromatograms do not show a maximum in the peakheights. This is the case for all three solutes with PET and PCR.In Figure 10, there is some scatter in the peaks heights observedfor decane at higher temperatures, but no systematic variation isevident.
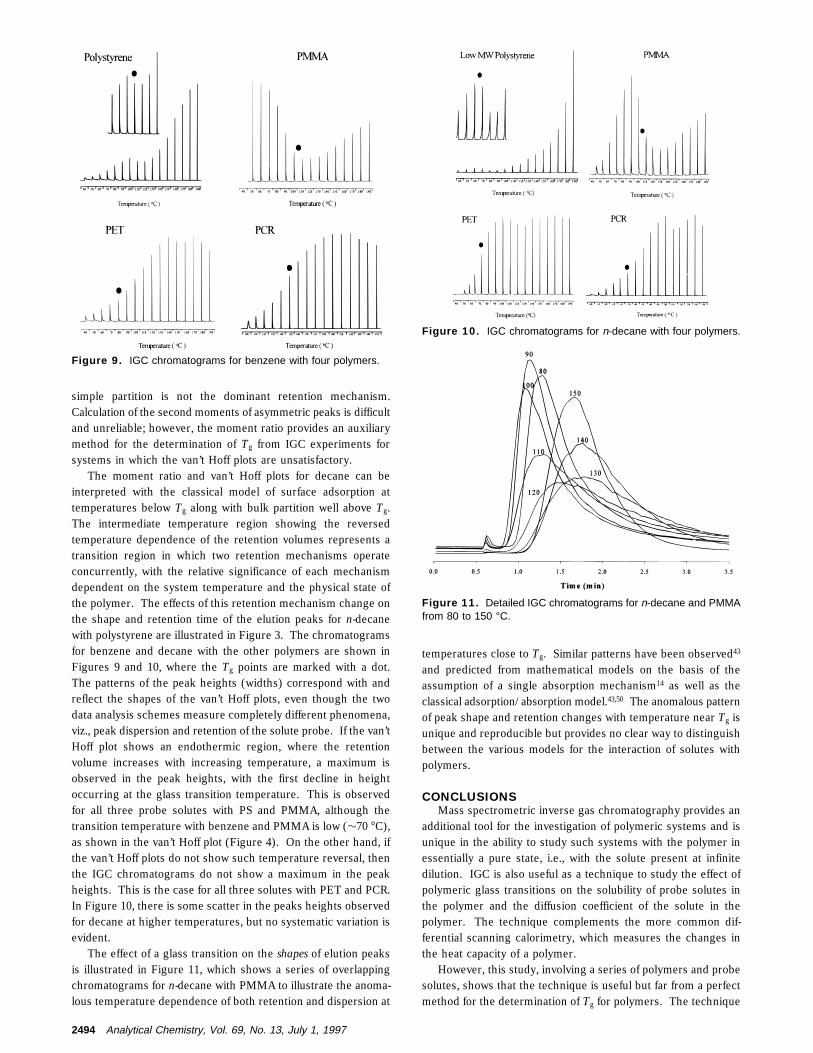
The effect of a glass transition on the shapes of elution peaksis illustrated in Figure 11, which shows a series of overlappingchromatograms for n-decane with PMMA to illustrate the anoma-lous temperature dependence of both retention and dispersion at
temperatures close to Tg. Similar patterns have been observed43
and predicted from mathematical models on the basis of theassumption of a single absorption mechanism14 as well as theclassical adsorption/absorption model.43,50 The anomalous patternof peak shape and retention changes with temperature near Tg isunique and reproducible but provides no clear way to distinguishbetween the various models for the interaction of solutes withpolymers.
CONCLUSIONSMass spectrometric inverse gas chromatography provides an
additional tool for the investigation of polymeric systems and isunique in the ability to study such systems with the polymer inessentially a pure state, i.e., with the solute present at infinitedilution. IGC is also useful as a technique to study the effect ofpolymeric glass transitions on the solubility of probe solutes inthe polymer and the diffusion coefficient of the solute in thepolymer. The technique complements the more common dif-ferential scanning calorimetry, which measures the changes inthe heat capacity of a polymer.
However, this study, involving a series of polymers and probesolutes, shows that the technique is useful but far from a perfectmethod for the determination of Tg for polymers. The technique
Figure 9. IGC chromatograms for benzene with four polymers.
Figure 10. IGC chromatograms for n-decane with four polymers.
Figure 11. Detailed IGC chromatograms for n-decane and PMMAfrom 80 to 150 °C.
2494 Analytical Chemistry, Vol. 69, No. 13, July 1, 1997

is indirect, and the effect of a phase transition on the solubilityand diffusion coefficient of a probe solute often varies from onepolymer or one probe to another. Under carefully controlledconditions, the glass transition temperature may be determinedfrom a van’t Hoff plot, the heights of elution peaks in a chromato-gram, or a moment ratio plot. The latter two methods are newand are presented for the first time in this investigation. In mostcases, at least one of these data analysis schemes will provideaccurate data for Tg; however, the results from any individualscheme may be unsatisfactory. For example, the van’t Hoff and/or moment ratio plots may not show a clear break at Tg, or thechromatograms may not show a maximum in the peak height atTg. The major problem is the multiplicity of processes contribut-ing to the chromatographic retention of a solute with a glassypolymeric stationary phase. These mechanisms vary with eachpolymer and probe, the physical state of the polymer, and thetemperature of the system. IGC is, however, one of the fewexperimental methods available to investigate such complexpolymeric systems.
With regard to the three possible models for sorption anddispersion of the IGC probe solutes, the data presented herein
are inadequate to establish a single dominant mechanism for allpolymer/solute systems. To the contrary, it is most probable thatdifferent probes are retained in different glassy polymers bymultiple processes which may change dramatically with temper-ature and/or the physical state of the polymer. Nonetheless, itis possible to determine Tg for many polymeric systems by thistechnique, and the methodology should be applicable to theinvestigation of the plasticization effects of volatile gases or vaporson the glass transition temperature of common polymers.
ACKNOWLEDGMENTThis research was supported by a grant from the National
Science Foundation. The authors also wish to express theirappreciation to the Hewlett Packard Co. for the donation of the5971 MSD system.
Received for review August 20, 1996. Accepted April 24,1997.X
AC960848Z
X Abstract published in Advance ACS Abstracts, June 1, 1997.
Analytical Chemistry, Vol. 69, No. 13, July 1, 1997 2495