POLYMERIC MATERIALS FOR CORROSION PROTECTION ...
88
POLYMERIC MATERIALS FOR CORROSION PROTECTION IN GEOTHERMAL SYSTEMS by JENNIFER C. ESPARTERO Submitted in partial fulfillment of the requirements For the degree of Master of Science Thesis Advisor: Dr. Rigoberto C. Advincula Department of Macromolecular Science and Engineering CASE WESTERN RESERVE UNIVERSITY May 2015
-
Upload
khangminh22 -
Category
Documents
-
view
0 -
download
0
Transcript of POLYMERIC MATERIALS FOR CORROSION PROTECTION ...
i
POLYMERIC MATERIALS FOR CORROSION PROTECTION IN
GEOTHERMAL SYSTEMS
by
JENNIFER C. ESPARTERO
Submitted in partial fulfillment of the requirements
For the degree of Master of Science
Thesis Advisor: Dr. Rigoberto C. Advincula
Department of Macromolecular Science and Engineering
CASE WESTERN RESERVE UNIVERSITY
May 2015
ii
CASE WESTERN RESERVE UNIVERSITY
SCHOOL OF GRADUATE STUDIES
We hereby approve the thesis/dissertation of
JENNIFER C. ESPARTERO
For the degree of Master of Science
Committee Chair
Dr. Rigoberto C. Advincula
Committee Member
Dr. David Schiraldi
Committee Member
Dr. Alexander Jamieson
Date of Defense
March 20, 2015

i
TABLE OF CONTENTS
LIST OF FIGURES ..........................................................................................................................................iv
LIST OF TABLES ............................................................................................................................................vi
LIST OF SCHEMES....................................................................................................................................... vii
Acknowledgement ..................................................................................................................................... viii
ABSTRACT ....................................................................................... Error! Bookmark not defined.
I. BACKGROUND OF THE STUDY ............................................................................................................ 1
A. Geothermal Energy .........................................................................................................................1
1. What is geothermal energy? ...................................................................................................1
2. Geothermal in the Philippines ...............................................................................................1
B. Problems encountered in geothermal setting ....................................................................4
1. Scaling ...............................................................................................................................................4
2. Corrosion .........................................................................................................................................5
C. Current solutions .............................................................................................................................7
1. Maintenance schedule/Monitoring ...................................................................................7
2. Use of Inhibitors/pH Modification ......................................................................................8
D. New Technologies to venture ....................................................................................................9
1. High Performance Material of construction ...................................................................9
2. High performance polymers ............................................................................................... 11
E. Promoting silica scale deposition as anti-corrosion film........................................... 16
1. Silica Chemistry ......................................................................................................................... 17
2. Silica Behavior in geothermal setting ............................................................................. 17
3. Utilization of Silica in other industries as anti-corrosion agent ........................ 18
4. Possible Methods of Promoting Silica for corrosion solutions in geothermal
setting ...................................................................................................................................................... 20
F. Objective ............................................................................................................................................ 22
G. Scope and Limitations................................................................................................................. 23
II. INVESTIGATION OF POLYVINYLPYRROLIDONE (PVP) AS A SUITABLE INHIBITOR
IN PROTECTING CARBON STEEL FROM THE AGGRESSIVE CORROSION OF ACIDIC
SIMULATED GEOTHERMAL BRINE ................................................................................................... 24
A. Introduction ..................................................................................................................................... 24

ii
B. Materials and Methodology ..................................................................................................... 26
1. Substrate Preparation ............................................................................................................ 26
2. Immersion Study ...................................................................................................................... 26
3. Weight Loss Analysis .............................................................................................................. 26
4. Instrumentation ........................................................................................................................ 27
C. Results and Discussion ............................................................................................................... 28
1. Selection of concentrations to be tested ....................................................................... 28
2. Evaluating the effect of MW of PVP in corrosion inhibition ................................ 29
3. Determining the effect of immersion time to the inhibition efficiency of
varying concentration of 360K PVP .......................................................................................... 34
4. Effect of temperature .............................................................................................................. 43
5. INHIBITION MECHANISM OF PVP ................................................................................... 45
III.POLYMER/CLAY NANOCOMPOSITE: A VIABLE ANTI-CORROSION COATING FOR
GEOTHERMAL APPLICATIONS ............................................................................................................ 46
A. Introduction ..................................................................................................................................... 46
B. Methodology .................................................................................................................................... 49
1. Materials ....................................................................................................................................... 49
2. Substrate Preparation ............................................................................................................ 49
3. Synthesis of Benzoxazine Monomer ................................................................................ 49
4. Organic Modification of MMT ............................................................................................. 50
5. Preparation of Coatings ......................................................................................................... 50
6. Instrumentation ........................................................................................................................ 51
C. RESULTS AND DISCUSSION ..................................................................................................... 53
1. XRD .................................................................................................................................................. 53
2. UV-VIS ............................................................................................................................................ 54
3. FT-IR ............................................................................................................................................... 55
4. TGA and DSC ............................................................................................................................... 55
5. Mechanical Test ......................................................................................................................... 57
6. Electrochemical tests .............................................................................................................. 59
7. SEM .................................................................................................................................................. 62
8. Effect of Temperature ............................................................................................................ 63

iii
IV.CONCLUSION ........................................................................................................................................... 67
V.RECOMMENDATION ............................................................................................................................. 69
VI.REFERENCES ........................................................................................................................................... 70
iv
LIST OF FIGURES
Figure I-1. Schematic diagram of a geothermal production system. (adapted from
EDC Annual Report 2013) ..................................................................................................................2
Figure I-2 EDC's geothermal site location and corresponding installed power
capacity. (adapted from EDC Annual Report 2013) ...............................................................3
Figure I-3 Schematic Diagram of a simple geothermal system showing problems
encountered in its components. ....................................................................................................4
Figure 1-I-4 Basic corrosion process and their corresponding redox reactions . ..........6
Figure II-1Varing concentration of PVP (10, 20, 50, 100, 200, 300, 400, 500, and
1000 ppm) for solubility testing and the corresponding result of the Tyndall
effect test. .............................................................................................................................................. 29
Figure II-2 Corrosion rate and inhibition efficiencies of varying MW and
concentration of PVP in brine solution. .................................................................................. 30
Figure II-3 FT-IR spectra of increasing MW of PVP relating to its effect on the
amount of silica formed at 1068 cm-1 ...................................................................................... 32
Figure II-4 FT-IR spectra of increasing PVP relating to its effect on the carbon-
nitrogen adsorption at 1290 cm-1 ............................................................................................ 33
Figure II-5 FT-IR spectra of increasing MW of PVP relating to its carboxyl group
absorption at 1660 cm-1 ................................................................................................................ 34
Figure II-6 Corrosion rate of varying concentration of PVP in geothermal brine with
respect to immersion time. ........................................................................................................... 35
Figure II-7 Corrosion rate of CS immersed in varying concentration of PVP for 14
and 30 days ........................................................................................................................................... 36
Figure II-8 Optical images of carbon steel immersed in varying concentration of PVP
in geothermal time at different immersion times .............................................................. 39
Figure II-9 SEM images of carbon steel immersed for one month: a) top layer in
blank geo brine b) top layer in 5 ppm PVP c) top layer in 10 ppm PVP d) top
layer in 15 ppm PVP e) bottom layer in blank geo brine f) bottom layer in 5 ppm
PVP g) bottom layer in 10 ppm PVP h) bottom layer in 15 ppm PVP ...................... 40
Figure II-10 ATR IR image of carbon steel immersed in a) synthetic geothermal brine
and b) with PVP focused at wavenumber 1065 (Si-O) .................................................... 41
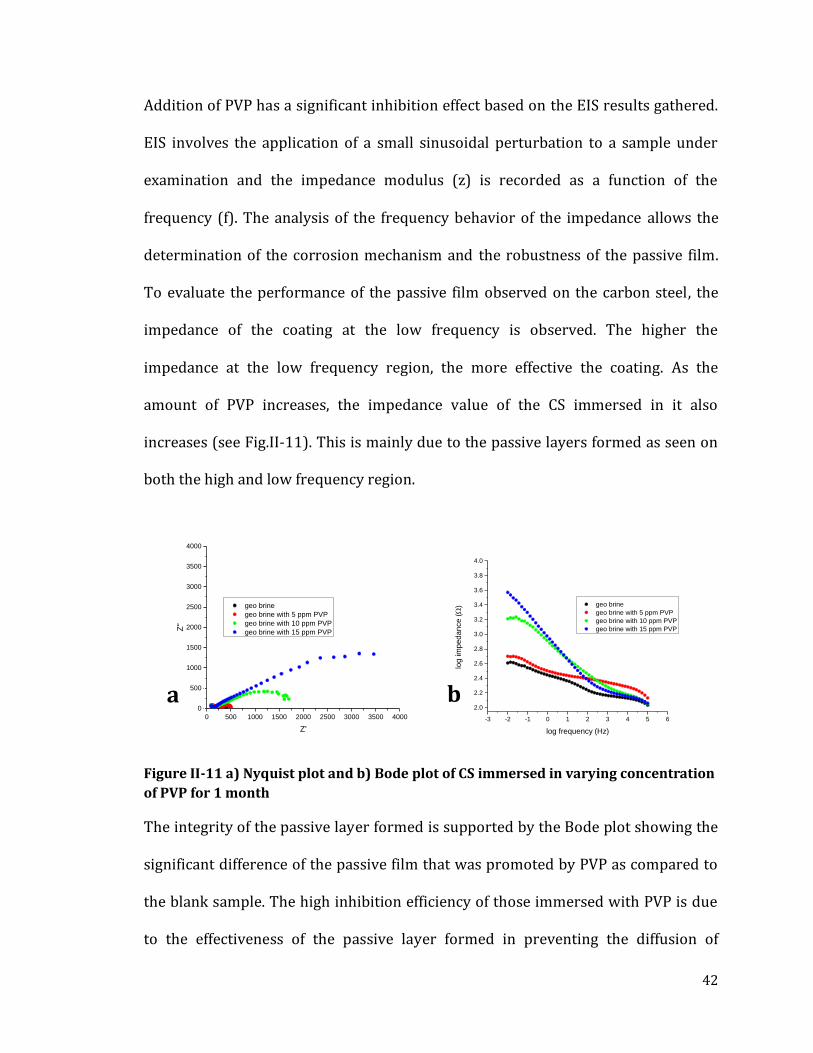
Figure II-11 a) Nyquist plot and b) Bode plot of CS immersed in varying
concentration of PVP for 1 month ............................................................................................. 42
II-12 Corrosion rates of CS immersed in varying concentration of PVP at room and
line temperature (180°C) .............................................................................................................. 44
Figure II-13 Inhibition mechnism of PVP by promoting silica.............................................. 45
Figure III-1 Structure of Montmorillonite13 ................................................................................... 48
Figure III-2 ASTM Scale for Adhesion test. ..................................................................................... 52

v
Figure III-3 Characterization of polymer/nanoclay composite using (a) XRD (b) UV-
VIS (c) FT-IR ......................................................................................................................................... 54
Figure III-4 Thermogravimetric properties of PBZ-R and PBZ-R-M .................................. 56
Figure III-5 a)Nyquist plot and b) Bode plot of polymer/nanocomposite coated CS
steel immersed in simulated geothermal brine for 7 days ............................................ 61
Figure III-6 SEM images of a) bare carbon steel b) PBZ-R c) PBZ-R-5MMT before
immersion in geothermal brine, d) bare steel immersed in NaCl, e)bare steel f)
PBZ-R g)PBZ-R-5MMT immersed in geothermal brine for 7 days, and optical
images of PBZ-R-5MMT h)before immersion i) after immersion in simulated
geothermal brine for 7 days. ........................................................................................................ 63
Figure III-7 Nyquist plot of samples coated by varying amount of MMT immersed in
hot acidic geothermal brine. ......................................................................................................... 65
Figure III-8 Bode plot of PBZ-R coating with varying loading of oMMT immersed in
hot acidic geothermal brine. ......................................................................................................... 65
Figure III-9 Protection mechanism of clay nanoparticles dispersed in a polymer
matrix. ..................................................................................................................................................... 66

vi
LIST OF TABLES
Table I-1 Reported inhibition system applied in various EDC's geothermal sites. ........8
Table III-1 Hardness and Adhesion tests results ......................................................................... 58
Table III-2 Corrosion protection efficiency of polymer/nanoclay composite coatings
immersed in geothermal brine ................................................................................................... 59
Table III-3 Corrosion rate and protection efficiency of coated samples with varying
oMMT in high temperature ........................................................................................................... 64

vii
LIST OF SCHEMES
Scheme II-1 Deposition of monomeric silica at low pH on a solid surface. .................... 37
Scheme III-1 Coating preparation of polymer/nanoclay composite.................................. 51

viii
Acknowledgement
I would like to take this opportunity to thank the significant people whom without
them, this study will not be possible. But first, I would just like to thank my
company, EDC, for giving me this great opportunity to turn my dream of earning a
Master's degree into reality. I am always grateful each day to work in a company
who shares the same vision and ethics as mine.
Next, I would like to thank Dr. Rigoberto C. Advincula for the academic supervision
and guidance. I am honored to be your student and will be forever grateful for
accepting and welcoming me into your group.
To the members of Advincula group, thank you all for the support and camaraderie.
There was never a dull moment in the lab because of all of you. We may come from
different places and of different character, but we all worked cohesively. To my
mentor, the award winner, Al de Leon, saying thank you is not enough to show how I
greatly appreciate all the help and teaching that you did. You were there in every
step I took in this academic journey and pushed me to pick up myself every time I
fall. To the Clingy Friends Society, Ms. Kat Pangilinan, Joey Mangadlao, and Sir Al, I
would not achieve what I have now without all your help, support, and clinginess.
You made my stay here a fun and memorable experience and I will take those clingy
moments that we had wherever life takes me. Special thanks are in order as well to
Ate Jenny Pyles for all the unlimited and genuine care and love. I will never forget all
the help you extended to me. You all had been my home away from home.
To my ever supportive friends and family, I can't thank you all enough for all the
support and prayers you have given me. I feel so lucky to have good friends and a
caring family. To my parents, I dedicate this achievement for all the love you gave
and the sacrifices you made to ensure a better future for me. Thank you Nanay and
Pops.
To the love of my life, thank you for constantly inspiring me to become a better
person each and every day. I feel so blessed having you in my life. Thank you for the
enduring love and your patient heart.
Last but most importantly, to the almighty God, for all the blessings you have
showered upon me, I dedicate this all to you.

ix
Polymeric Materials for Corrosion Protection in
Geothermal Systems
Abstract
by
JENNIFER C. ESPARTERO
Geothermal technology has gained wide attention as a new source of renewable
energy but its optimum utilization is limited by accelerated corrosion. Solutions for
this problem are often reactive such as regular preventive maintenance and
replacement for corrosion affected components. A proactive way to solve this
problem is by utilizing anti-corrosion polymers designed for geothermal brine
chemistry. In this study, two different types of polymer application, an inhibitor and
a coating, were evaluated for the corrosion protection of carbon steel in acidic
geothermal brine. Polyvinylpyrrolidone(PVP) was used as a corrosion inhibitor
while a nanocomposite composed of Polybenzoxazine, rubber, and montmorillonite
(PBZ-R-MMT) was synthesized for coating application. Various characterization
techniques such as Scanning Electron Microscopy (SEM), X-ray Photoelectron
Spectroscopy(XPS),Fourier Transform-Infrared ( FT-IR), X-ray Diffraction(XRD),
Thermal Gravimetric Anaysis(TGA), and Differential Scanning Calorimetry(DSC)
were done to determine the applicability and effect of these polymers to carbon
steel immersed in simulated acidic geothermal brine. The anti-corrosion properties
of both the inhibitor and the coating were further tested using electrochemical
techniques.

1
I. BACKGROUND OF THE STUDY
A. GEOTHERMAL ENERGY
1. WHAT IS GEOTHERMAL ENERGY?
Renewable energy resources have been gaining a lot of attention due to increasing
environmental awareness and initiative to decrease society's dependence on fossil
fuels. An example of these resources is geothermal energy. The word geothermal
(GT) comes from the Greek words geo, which means earth and therme, which means
heat. Geothermal energy consists of the thermal energy stored in the Earth's crust.
The most active geothermal resources are usually found along the Pacific Ring of
Fire, a major plate boundaries where earthquakes and volcanoes are concentrated.
Geothermal energy is mostly used for direct use and district heating, geothermal
pumps, and electricity generation.
2. GEOTHERMAL IN THE PHILIPPINES
The Philippines is the world's second largest producer of geothermal energy for
power generation, with an installed capacity of 1.9 GW for a running capacity of
about 1.8 GW, accounting for 12% of the nation's total electric power supply. The
relatively high availability of the geothermal plants resulted in the delivery of about
10 TWh of generation, 17% of the nation's electricity production1 . The Philippine
geothermal industry has grown from addressing the 1970's oil crisis to paving the
way for renewable energy in the country. Fig. I.1 shows the basic geothermal energy
system flow which starts from extracting hot geothermal fluid from production

2
wells going to the powerplant turbine which then produce electricity and be
distributed to local electric cooperatives through the transmission lines.
Figure I-1. Schematic diagram of a geothermal production system. (adapted from EDC
Annual Report 2013)
Energy Development Corporation (EDC), the world's largest vertically integrated
geothermal company, is primarily engaged in the exploration, development,
operation, and optimization of geothermal steam fields and power generation. It
owns 12 integrated geothermal power stations in Leyte, Bicol, Southern Negros, and
North Cotabato, with an installed total capacity of 1,164 MW as shown in Fig. I.2.
EDC’s operations are in seven geothermal steam fields in five contract areas where
the company has exclusive rights to geothermal exploration, development, and

3
utilization through Geothermal Renewable Energy Service Contracts with the
Philippine Government's Department of Energy.
Figure I-2 EDC's geothermal site location and corresponding installed power capacity.
(adapted from EDC Annual Report 2013)

4
B. PROBLEMS ENCOUNTERED IN GEOTHERMAL SETTING
Harnessing the full potential of geothermal fluids are hindered by two recurring
problems, corrosion and scaling. These processes affect the operating efficiency and
cause economic losses. They have a significant impact on the infrastructure starting
from the wellbore of the production well to the powerplant turbine until to the
pipes handling the condensates and spent brine going to the reinjection well. Below
is the schematic diagram of a typical geothermal powerplant and the common
problems associated with it.
1. SCALING
It is innate in geothermal fluids to contain dissolved minerals. At reservoir
conditions, the surrounding rocks and the fluid present are in equilibrium with each
Figure I-3 Schematic Diagram of a simple geothermal system showing problems
encountered in its components.
Scaling
affected
Corrosion
affected
Scaling and
corrosion
affected
COOLING
TOWER
CONDENSER
SEPARATOR
VESSEL
TURBINE
GENERATOR
GEOTHERMAL RESERVOIR
PRODUCTION WELL REINJECTION WELL

5
other. There is water rock interaction, thus, the minerals present in the rocks get
dissolved in the surrounding brine. When this fluid get extracted for their heat,
there is a change in pressure and temperature. The change of these conditions
trigger the supersaturation of the dissolved minerals, causing them to be deposited
along the pipelines and other components. This phenomenon is usually referred to
as scaling and has an adverse effect on the power generation capability.
The common mineral deposition are calcite, silica, and sulfides. Out of these three,
silica scaling is considered to be the main obstacle in high temperature
hydrothermal system. Silica in geothermal brine is very soluble but after the
flashing process the fluid cools off and the solubility of silica decreases, inducing the
formation of silica scale2 .
2. CORROSION
Corrosion is the destructive attack of a metal by chemical or electrochemical
reaction of its environment. For corrosion to initiate, it needs three elements: a
cathode, an anode, and an electrolyte medium. With the absence of one factor,
corrosion will not occur. In cases where corrosion has already started, retarding
either the anodic and cathodic reactions can reduce the corrosion rate, thus impede
further propagation. There are several methods used in corrosion control. One way
is to condition the metal by either coating or alloying the metal. Another method is
by modifying the corrosive environment. This is usually done by removing oxygen
or by employing corrosion inhibitors. Electrochemical control can also be used to
manage the rate of corrosion by using the concept of cathodic and anodic protection

6
where current is impressed on the metal to increase the cathodic reaction rate and
increase the potential, respectively. Both of which will result in preventing
corrosion to persist.
Figure I-4 Basic corrosion process and their corresponding redox reactions .
Due to the complexity of the corrosion reaction of the metallic components of the GT
infrastructure, an in depth investigation by a specialized engineering team is
required that is capable of performing detailed diagnostics of the deterioration of
metals and recommendations for appropriate methods of prevention and control.
The corrosion behavior of geothermal fluid in the well and downstream pipelines,
results from their chemical composition. This composition is related directly to the
geological formations with which the fluids interact and percolate as they rise
through the well3. Corrosion behavior of geothermal fluid is enhanced by its high
electrical conductivity brought about by the dissolved minerals, which in turn favors
the electrochemical corrosion process. Corrosion is also affected by temperature –
wherein, the increase in temperature also increases the rates of chemical reactions

7
and diffusion. Another important factor is the activity or concentration of H+ ions
that plays a major role in the corrosion of iron. Acidic fluids are sometimes
encountered in shallow production wells, which are typically cased with carbon
steels and are considered un-exploitable because of the risk of corrosion.
C. CURRENT SOLUTIONS
1. MAINTENANCE SCHEDULE/MONITORING AND SCHEDULED COMPONENT
REPLACEMENT
In Southern Negros, a technical and cost assessment of silica deposition was
conducted. Based from the result of their study, a cost comparison of these remedial
measures with respect to the actual operating cost of the project indicates that it
comprises only about 7%, and has been considered operationally tolerable4.
Alternative options have been reviewed to improve the cost and operational
efficiency of dealing with this problem. Some options, however, such as system
modification to generate additional steam is restricted due to the risk of silica
deposition from the supersaturated waste liquid. For this case, application of
chemical inhibitors might address this constraint. The only remedial measures
adopted so far are limited to mechanical de-scaling of brine lines, construction of
redundant reinjection lines, and work-over and acid injection using a drilling rig, in
the case of reinjection wells5.

8
2. USE OF INHIBITORS/PH MODIFICATION
Organic corrosion inhibitors have been used successfully for many years to protect
infrastructure carrying oil and gas. Typically, the use of the appropriate inhibitor
can facilitate the use of lower grade carbon steel for pipeline construction as
opposed to high grade alloys that add significant capital costs to a project6.
For each production site, a different type of inhibition system were used depending
on the significant problem that needs addressing. Table I-1 summarizes the type of
inhibition system used for each specific site.
Table I-1 Reported inhibition system applied in various EDC's geothermal sites.
Production field Inhibition System employed
BGBU (Bicol) Silica Inhibition7-8
LGBU (Leyte) Calcite Scale Inhibition9
NIGBU(Southern Negros)
Corrosion Inhibition10
Silica inhibition by pH modification10
MAGBU (Kidapawan)
Calcite Scale Inhibition11
In Palinpinon, Southern Negros, an inhibition testing was conducted to prevent
silica deposition, organic silica inhibitor and pH modification techniques are
employed to delay silica polymerization until brine reaches the wellbore formation.
However, organic silica inhibitors are quite expensive and an in-depth cost-benefit
ratio is needed. For pH modification, it could induce corrosion problems along the

9
line since pH reduction could increase the rate of material degradation by
electrochemical corrosion process. Pilot testing are usually set-up to test the
efficiency of commercial products before the actual site application10.
The success of chemical inhibition depends mainly on the thermal stability of the
inhibitor. The choice of suitable inhibitor should not be based only on the cost but
on its effectiveness as well at the expected subsurface temperature and pressure of
the reservoir. Field and laboratory testing is recommended prior to actual
application to determine the inhibition property and thermal stability of the
inhibitor11.
D. NEW TECHNOLOGIES TO VENTURE
Due to the harsh conditions of a geothermal condition, high performance
materials are desired to lessen the frequency or even eliminate maintenance
cleaning of surface components and to prolong the service life of wellbore pipes that
are critically affected by erosion-corrosion phenomenon. These materials may be
classified into two: 1) high performance metals that are specifically developed to a
specific need 2) high performance polymers (both as a coating and an inhibitor) that
could be tailored into any environment.
1. HIGH PERFORMANCE MATERIAL OF CONSTRUCTION
Carbon steel is the metal of choice for both wellbore and surface pipes in the
geothermal setting. It has good mechanical properties, cheap, and widely available.
It's also proven to have an acceptable service life of 25 years given a corrosion rate

10
of 0.1 mm/yr. However, under special conditions of an acid-bearing production well,
the corrosion rate can be several times higher than the allowable corrosion rate.
More often or not, the pipes on these type of wells corrode very quickly especially if
there are also solids suspended on the steam component. This poses a safety risk of
a well blow out due to degradation of the wellbore casing which served as its main
structural foundation. This could warrant an earlier shut-off of the well or even
cement-plug it for safety purposes. This would incur a significant financial loss.
Thus, there’s a need for a sturdier, more robust, and well-adapted type of material
for these conditions. Various studies were conducted to determine applicability of
newly developed materials of construction to high temperature, high pressure, and
highly corrosive environment such as in oil and gas industries12 . Components made
of titanium alloy and stainless steel commonly are employed for dealing with these
problems13. However, another major consideration in using these materials is the
susceptibility of their corrosion-preventing passive oxide layers that develop on
their outermost surface sites to react with brine-induced scales, such as silicate,
silica, and calcite. This reaction leads to the formation of strong interfacial bonds
between the scales and oxide layers, inducing unwanted scaling which impairs the
plant component’s function and efficiency. In addition, a substantial amount of time
and resources are entailed in removing the formed scales. If inexpensive carbon
steel components could be coated and lined with cost-effective high-hydrothermal
temperature stable, anti-corrosion, oxidation, and fouling materials, this would
improve the power plant’s economic factors by decreasing operation and
maintenance cost14.

11
2. HIGH PERFORMANCE POLYMERS
There are various inhibitor studies conducted at various geothermal sites in the
Philippines. However, despite of the numerous studies on high performance
polymer coatings which demonstrate high thermal stability, improved mechanical
properties, good chemical resistance, and special attributes such as
superhydrophobic and self-healing capabilities, there is no reported study on the
effective use of anti-corrosion coatings in any of the geothermal sites of EDC. The
use of polymer coatings, however, is limited due to their visco-elastic nature and
inability to withstand high temperatures. Modern coating technology is focused to
the need of developing high performance polymeric materials possessing superior
mechanical, thermal, and anticorrosive characteristics to overcome the adverse
environmental conditions. The fusion of organic and inorganic functionalities into a
single polymer offers a unique combination of distinctive properties of both
constituents such as good processability, improved toughness, flexibility, chemical
resistance and some other properties like weatherability, UV resistance and thermo-
oxidative stability. These hybrid polymers are already available in the market but
haven't been tested in EDC's geothermal sites due to their high cost and difficulty of
coating of components that are already installed. Polymer hybrids are discussed
below for this possible application.

12
a) High performance coatings
Polymer nanocomposites consist of nanoparticles or nanofillers dispersed in a
polymer matrix. Various process for preparation of polymer-based nanoparticle
nanocomposites have been reported, leading to improvement in mechanical,
thermal and electrical properties. When designing nanocomposites, it is important
to remember that it is difficult to increase all of the desired properties at the same
time so one must focus on which type of property needs the most improvement.
Polymer/clay nanocomposite has been attracting a lot of interest due to the
improved material properties at optimum clay loading. The improvement of
mechanical properties and corrosion performance, and increase in thermal stability
is dependent on the intercalation of organoclay with the polymer matrix15-19.
Conducting polymers (CPs) such as polyaniline (PANI), polypyrrole (PPy), and
polythiophene (PTh) are used for the corrosion protection of metals and metal
alloys. Several groups have reported diverse views about the corrosion protection
by CPs and hence various mechanisms have been suggested to explain anticorrosion
properties of CPs. These include anodic protection, controlled inhibitor release as
well as barrier protection mechanisms. De leon et. al. was able to electrodeposit
superhydrophobic conducting polythiophene coating to effectively protect the
underlying steel substrate from corrosion attack: by first preventing water from
being absorbed onto the coating, thus preventing the corrosive chemicals and
corrosion products from diffusing through the coating, and second by causing an
anodic shift in the corrosion potential as it galvanically couples to the metal

13
substrate. Results showed a protection efficiency of greater than 95%. One of the
advantages of the process developed in this study is that the coating is simple and
easy to coat to any metallic surface20.
b) Inhibitors
Scaling phenomenon is a costly problem to industries that handle underground
water. For the past years, various polymeric inhibitors were studied and developed
to control and inhibit unwanted scaling in hypersaline solution like that of a
geothermal brine.
For the retardation of scaling of calcite, numerous inhibitors were tested and
developed using maleic anhydride (MA) and styrene p-sulfonic sodium (SSS) as
monomers. One study introduced a novel terpolymerscale inhibitor β-
cyclodextrin(CD)–MA–SSS based on β-CD–MA and styrene p-sulfonic sodium (SSS)
as monomers, water as solvent, and ammonium persulfate as initiator by the free-
radical polymerization. Calcite scale was reduced up to 99.9% due to strong
inhibition action20. Another study made use ofpalygorskite instead of cyclodextrin. It
also showed very good inhibition efficiency21. The study was later modified by
adding chitosan. A scale inhibitor copolymer modification with chitosan was
prepared from maleic anhydride, styrene sulfonic sodium, acrylic amide and
chitosan. The conditions of preparing scale inhibitor were optimized. The chemical
structure and thermal property were investigated. Using the static experiment
method, the influences of the copolymer concentration, temperature, time, Ca2+
concentration, HCO3- concentration of the system on the inhibition efficiency were

14
investigated. The experimental results showed that the polymer was excellent
calcium carbonate scale inhibition and the resistance rate of calcium carbonate scale
up to 95.62%. All of these inhibitors were reported to be applicable in systems of
high temperature and high hardness water22. In addition, Acrylic acid (AA) and
maleic acid (MA) polymers were also found to inhibit the precipitation of calcium
carbonate and gypsum from supersaturated solutions to extents exceeding 90% at
concentrations as low as 2ppm. The molecular weight (MW) was an important
parameter in determining the activity of the tested inhibitors. Lower MW polymers
(ca. 2000) proved to be more efficient than higher MW polymers. A similar trend
was exhibited for the dispersion ability of the hematite particles. AA and MA
copolymers in which functional groups were introduced (pyrrole, sulfono and amide
groups) were efficient precipitation inhibitors and dispersion agents, but the
efficiency depended strongly on the co-polymer architecture. Copolymers
containing sulfono groups improved inhibitory activity and dispersion ability and
showed higher calcium ion tolerance23. Addition of anionic vinylic monomers, vinyl
phosphonic, vinyl sulfonic, acrylic acid, maleic acid and aconitic acid, to hyper-
branched polyethyleneimines produced a series of polymers which have been
investigated for their performance as scale inhibitors to prevent the deposition of
calcium carbonate and barium sulfate. All the new inhibitors exhibited both
carbonate and sulfate scale inhibition, the best performance being for the aconate-
derived polymer on carbonate scale and the phosphonate-derived polymers on
sulfate scale24.

15
There are also several studies focusing in controlling silica scale formation. One
study demonstrated the stabilization of mono- and disilicic acids by using a cationic
polymeric chemical additive, polyethyleneimine (PEI), in supersaturated silica
solutions at pH = 7. The PEI polymeric system contains an excess of amine groups
(~25% primary amines, ~50% secondary amines and ~25% tertiary amines) that
become protonated at circum-neutral pH, hence charging the molecules positively.
PEI was found to be efficient as a silica scale inhibitor only at the low dosage of 10
ppm. Its inhibitory activity was found to drop as its concentration increased. It was
hypothesized that PEI is entrapped into the colloidal silica matrix and deactivated.
Thus, one way to maintain its activity was to create blends of PEI and anionic
polymers. Anionic polyelectrolytes that were tested included polyacrylic acid (PAA),
phosphonatedpolyacrylic acid (PAA(PO3H2)2), carboxymethylinulin (CMI),
poly(acrylamide-co-acrylic acid) (PAM-coAA), phosphonomethylated chitosan
(PCH) are also studied for their silica scale inhibition efficiency25. It is observed that
the silica inhibitory activity of PEI was improved upon its combination with anionic
polyelectrolytes26.
NALCO has also reported their newly- developed inhibitors. The silica inhibitor they
used is a copolymer of acrylic acid and PEG methacrylate. The major active
component of the co-polymer has a structure where the repeating unit in PEG varies
between 5-10 with improved scaling protection compared to existing inhibitors-
slope of the mass uptake on the crystal was found to be lower than during periods of
time when the old treatment was in use. The new calcium carbonate inhibitor is
Polyaminopolyethermethylenephosphonate(PAPEMP). One of the particular

16
advantages of the PAPEMP molecule is its exceptional calcium tolerance. Calcium
tolerance is a measure of a chemical compound’s ability to remain soluble in the
presence of calcium ions (Ca2+) under both high pH and high temperature, such as in
geothermal brines. As pH and temperature increases, calcium tolerance decreases
rapidly for traditional CaCO3 threshold inhibitors27.
As for systems encountering both scaling and corrosion problems, a PVA hydrogel
based inhibitor was developed for controlled release of solid corrosion and scale
inhibitor. Liquid inhibitors are usually not satisfactory due to the high cost of fluid
dosing system and the bad performance during the mixing process. These problems
can be perfectly solved by solid corrosion and scale inhibitor which will be slowly
released under control. As a release controller, polyvinyl alcohol (PVA) has been
widely used in medical fields. In addition, it can be easily prepared. Results of the
study showed an excellent performance in terms of controlled-release and
corrosion-scale inhibition28.
E. PROMOTING SILICA SCALE DEPOSITION AS ANTI-CORROSION FILM
Most of the studies conducted in corrosion and scaling are independent of each
other. There are only very few studies conducted which show the possible
relationship of scaling of silica and corrosion in the geothermal setting.
A study by Mundhenk et al. present corrosion and scaling as interrelated
phenomena in an operating geothermal power plant. Though there are many
corrosion studies published, these results are site-specific and only give an overview

17
of the corrosion behaviors of various materials. And though they may help in
material selection, these studies doesn't usually incorporate long term experiments
and the effect of scaling on the corrosion behavior- low predictive power29.
1. SILICA CHEMISTRY
In order to determine the participation of silica in the corrosion protection, its
chemistry must be well understood. Silica is naturally present in nature and can be
found almost anywhere. Due to its importance in geological and industrial
processes, the oligomerization and precipitation of silica is well studied. Monosilicic
acid, Si(OH)4, is the simplest form where at ambient temperature it begins to
condense to form disilicic acid. It then continues to builds up by monomer addition
forming trisilicic acid and tetrasilicic acid30. The general rule of silica
oligomerization is to minimize the uncondensed Si(OH) bonds and form Si-O-Si
bonds. And at alkaline condition of pH>8, the aggregation rate is increased.
Despite the numerous silica studies conducted, only few studies were conducted to
explain the polymerization of silica in acidic system. This is due to the fact that most
of the industrial processes involving the use of silica is at basic condition.
2. SILICA BEHAVIOR IN GEOTHERMAL SETTING
Silica scaling in various components in a water-dominated geothermal system has
adverse effects in production activities and process efficiencies. Due to the huge
economic losses of this process, it is a well studied matter in the geothermal
community in the hope of preventing/eliminating the deposition. Precipitation of

18
silica is strongly dependent on the temperature and pH. Kinetics also play a role on
the preferential location where scaling is most likely to occur. It is considered to be
a major problem in any geothermal field because of the inability to control its
deposition.
However, in other industries, silica is used as solution to corrosion-related
problems. This is due to the fact that SiO2 coating known for its protection of metals
against oxidation and acid corrosion even at T> 300° C. It is also known to impart
superhydrophobic properties when added to coating surfaces.
3. UTILIZATION OF SILICA IN OTHER INDUSTRIES AS ANTI-CORROSION
AGENT
There are various studies conducted regarding the use of inorganic silica films as a
superior film against corrosion. These films are usually formed using the sol-gel
method, an environment-friendly technique that could replace the toxic methods of
coating metals for anti-corrosion. Due to its high heat and chemical resistance, SiO2
is known to improve oxidation and acidic corrosion resistance of metals under
different temperatures. One study showed that enhancement was made on the
corrosion protection by mixing 10 and 50 nm silica nanoparticles by sol-gel method
by delaying the diffusion of corrosive species through the film31. Another way to
enhance silica films by sol-gel method is by doping it with different kinds of
corrosion inhibitors. The structure of the silica film plays a vital role on the
effectiveness of decreasing the corrosion rate. Thus, it is important to take into
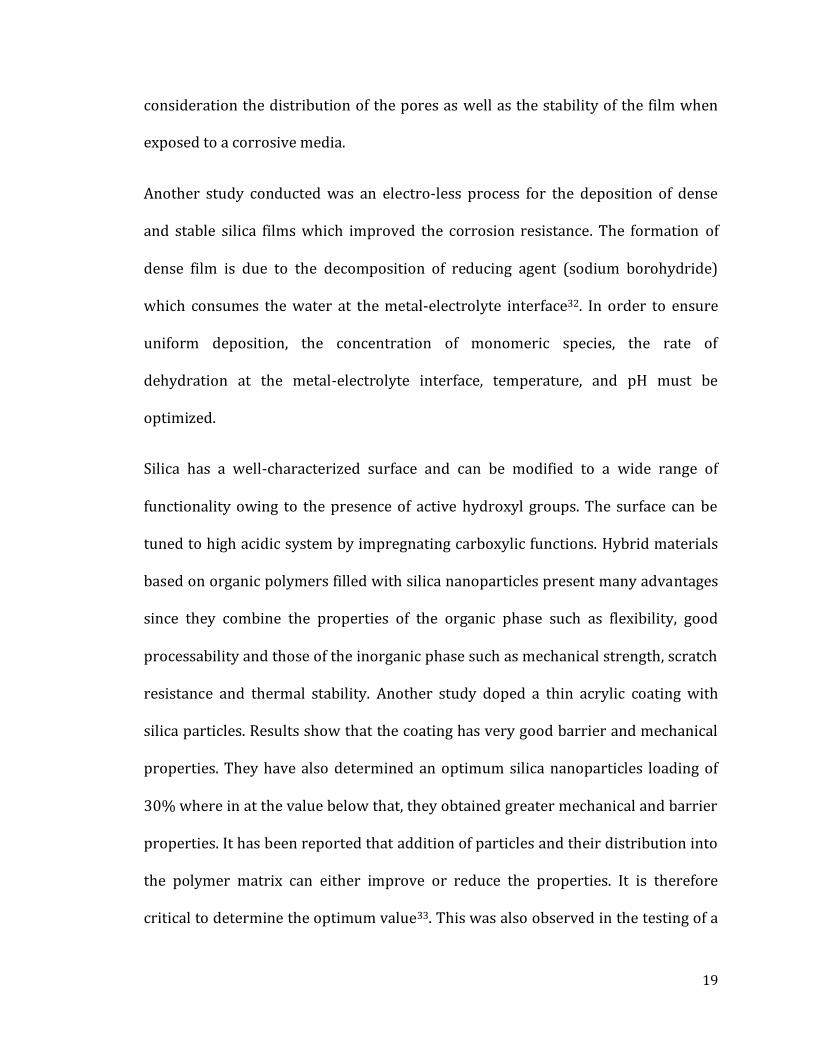
19
consideration the distribution of the pores as well as the stability of the film when
exposed to a corrosive media.
Another study conducted was an electro-less process for the deposition of dense
and stable silica films which improved the corrosion resistance. The formation of
dense film is due to the decomposition of reducing agent (sodium borohydride)
which consumes the water at the metal-electrolyte interface32. In order to ensure
uniform deposition, the concentration of monomeric species, the rate of
dehydration at the metal-electrolyte interface, temperature, and pH must be
optimized.
Silica has a well-characterized surface and can be modified to a wide range of
functionality owing to the presence of active hydroxyl groups. The surface can be
tuned to high acidic system by impregnating carboxylic functions. Hybrid materials
based on organic polymers filled with silica nanoparticles present many advantages
since they combine the properties of the organic phase such as flexibility, good
processability and those of the inorganic phase such as mechanical strength, scratch
resistance and thermal stability. Another study doped a thin acrylic coating with
silica particles. Results show that the coating has very good barrier and mechanical
properties. They have also determined an optimum silica nanoparticles loading of
30% where in at the value below that, they obtained greater mechanical and barrier
properties. It has been reported that addition of particles and their distribution into
the polymer matrix can either improve or reduce the properties. It is therefore
critical to determine the optimum value33. This was also observed in the testing of a
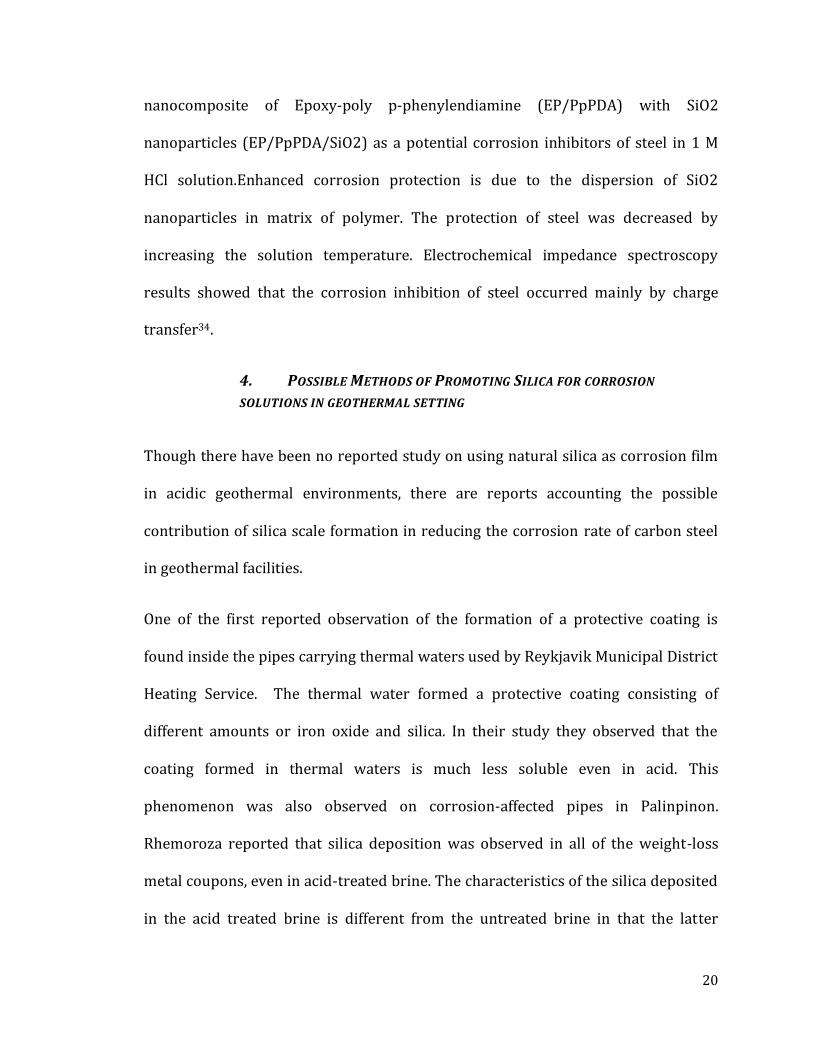
20
nanocomposite of Epoxy-poly p-phenylendiamine (EP/PpPDA) with SiO2
nanoparticles (EP/PpPDA/SiO2) as a potential corrosion inhibitors of steel in 1 M
HCl solution.Enhanced corrosion protection is due to the dispersion of SiO2
nanoparticles in matrix of polymer. The protection of steel was decreased by
increasing the solution temperature. Electrochemical impedance spectroscopy
results showed that the corrosion inhibition of steel occurred mainly by charge
transfer34.
4. POSSIBLE METHODS OF PROMOTING SILICA FOR CORROSION
SOLUTIONS IN GEOTHERMAL SETTING
Though there have been no reported study on using natural silica as corrosion film
in acidic geothermal environments, there are reports accounting the possible
contribution of silica scale formation in reducing the corrosion rate of carbon steel
in geothermal facilities.
One of the first reported observation of the formation of a protective coating is
found inside the pipes carrying thermal waters used by Reykjavik Municipal District
Heating Service. The thermal water formed a protective coating consisting of
different amounts or iron oxide and silica. In their study they observed that the
coating formed in thermal waters is much less soluble even in acid. This
phenomenon was also observed on corrosion-affected pipes in Palinpinon.
Rhemoroza reported that silica deposition was observed in all of the weight-loss
metal coupons, even in acid-treated brine. The characteristics of the silica deposited
in the acid treated brine is different from the untreated brine in that the latter

21
deposits are hard, adherent and brittle whereas in the former the silica deposits are
soft and can easily be removed35.
Speller made an observation that silica-bearing waters were less corrosive than
those in which the silica content was low. For almost a century ago, the addition of
sodium silicate has been used as protection against corrosion in water systems. This
was first proposed by Thresh(1922) where he noted that corrosion of ferrous
materials were reduced upon addition of sodium silicate. The process was further
developed by Speller(1925), Texter (1923), and Russel (1926) where they were able
to show that addition of sodium silicate to hot water was able to form self-healing
protective coatings36.
This was also observed by the studies conducted by Lehrman and Shuldener. They
showed that the coatings formed on the metal mainly consist of metal oxide and
silica. The formation of the film in dilute silica solution is dependent on the presence
of small quantities of corrosion products on the metal surface. They also examined
the films produced over time and microscopically showed that there are two layers
present with silica as the major component of the top layer exposed to the aqueous
medium. When the hydrous metallic oxide film has been covered with a silica layer,
further deposition is stopped, which accounts for the observed fact that prolonged
exposure to silicate solutions does not build up thick films and that the thin films
when mechanically damaged are self-healing. The attraction of positively charged
corrosion-products and negatively charged silica is therefore assumed to be part of
the mechanism37.

22
F. OBJECTIVE
The objective of this study is to be able to demonstrate the application of polymeric
materials as better alternative solution to the challenging corrosion problems
encountered in geothermal industries. The study comprises of two parts. First is the
investigation of the corrosion inhibition of Polyvinylpyrrolidone(PVP) on carbon
steel immersed in acidic geothermal brine by promoting silica layer formation. The
objectives of this part of the study are as follow:
1. Determine the inhibitor concentration at which the PVP is soluble in the
acidic geothermal fluid
2. Measure the corrosion rate of carbon steel in acidic geothermal fluid in
the presence of varying molecular weight of polymeric inhibitor.
3. Determine the real time change in the corrosion rate of carbon steel in
acidic geothermal fluid in the presence of varying concentration of the
polymeric inhibitor.
4. Determine the effect of temperature on the corrosion rate of carbon
steel in acidic geothermal fluid in the presence of varying concentration of
the polymeric inhibitor.
5. Propose a possible mechanism of corrosion inhibition action of the
polymeric inhibitor
The second part of this study is the synthesis and evaluation of a polymer/clay
nanocomposite as a suitable anti-corrosion coating for geothermal system
23
components that are heavily affected by corrosion with the following specific
objectives:
1. Exfoliate MMT by cationic exchange between sodium and an organic
surfactant
2. Prepare a toughened nanocomposite coating system composed of PBZ,
rubber, and oMMT.
3. Investigate the applicability of the nanocomposite coating for
geothermal applications.
4. Determine the corrosion protection efficiency of the nanocomposite
coating with varying oMMT loading on carbon steel immersed in acidic
geothermal fluid.
5. Propose a possible mechanism on the enhancement of the protection
efficiency of toughened PBZ coating after adding oMMT
G. SCOPE AND LIMITATIONS
In order to ensure the same chemistry of the immersion fluid, the geothermal brine
used in the studies conducted was simulated based on the brine chemistry of an
acidic geothermal well. The immersion studies done were only static which does not
incorporate the effect of fluid dynamics. Due to the possibility that oxygen may
intrude to any geothermal process, no method was done to remove the dissolve
oxygen present on the simulated brine used and that dissolved oxygen at
temperatures below 100° C is low.
24
II. INVESTIGATION OF POLYVINYLPYRROLIDONE (PVP) AS A SUITABLE
INHIBITOR IN PROTECTING CARBON STEEL FROM THE AGGRESSIVE
CORROSION OF ACIDIC SIMULATED GEOTHERMAL BRINE
A. INTRODUCTION
The use of inhibitors is considered to be one of the most economical and practical
corrosion technology solutions37-39. However, this technology is still under utilized
in EDC's geothermal fields. This is mainly due to the complexity of the geothermal
brine which makes it difficult to find a compatible inhibitor available in the market.
A good geothermal corrosion inhibitor should be able to control the corrosion rate
at the acceptable level without causing any significant change to the brine chemistry
that could lead to unwanted mineral scaling. Another factor to consider is the
thermal stability of the inhibitor to be used since the process temperature of a
geothermal system is between 160-350°C. In addition, inhibiting agents are effective
only if their solubility in the corrosive environment is optimal. Very low solubility
of inhibitor leads to lack of active agent at the metal interface and consequently to
weak inhibition. If the solubility is too high, the substrate will be protected, but only
for a relatively short time since the inhibitor will be rapidly leached out from the
coating40. Due to the dissolved minerals in any given geothermal brine, its ionic
strength is high. This would limit the use of polymers that are not stable at high
ionic medium. Instead of dissolving, they precipitate out from the solution. Because
the pH of each geothermal well is different, the use of pH sensitive polymers may
also not be suitable for the application. The pH range at which the inhibitor is
soluble should be broad so that it has a wide scope of application and for it to be

25
economical and practical. In addition, a good corrosion inhibitor should satisfy the
following requirements: a) it should easily oxidize the metal surface to form an
impervious and compact film b) it should have highly disposable sites for
chemisorption to take place onto the metal surface c) the barrier film must be able
to cover a large area of the metal surface d) it should be polymeric in nature or be
able to polymerize on the surface of the metal e) eco-friendly, low cost, safe in
handling, and readily available 41-44.
Based on the evaluation conducted, the polymer that possess the recommended
properties as a suitable corrosion inhibitor in acidic geothermal system is
Polyvinylpyrrolidone (PVP). PVP has kept attracting great attention in the field of
colloid and interface science because it was found that various stable oxide or metal
colloids could be attained with PVP addition. It is generally agreed that PVP exhibits
mesomeric structures. The structures make it possible for PVP molecules to form
hydrogen bond or coordination linkage with various oxides or metals (Fe, Mn, Co,
Zn, and Ni)45. Another advantage of using PVP is it has been reported to promote
deposition of silica46. It is widely reported that films formed by silica are good anti-
corrosion coating47-49. Despite the abundance of silica in geothermal brine, it is not
easily deposited in low pH conditions since it is present in solution as silicic acid,
which is very soluble in the brine and tends to be well dissolved in solutions. If the
deposition of silica could be promoted by PVP, it could act not only as a corrosion
inhibitor but can also add as an additional barrier from the corrosive species
present in the brine.

26
B. MATERIALS AND METHODOLOGY
Polyvinylpyrrolidone(PVP) purchased from Aldrich chemicals with varying
molecular weights( 10K, 40K, and 360K ) were used as received.
1. SUBSTRATE PREPARATION
The carbon steel(CS) sheets were first cut into1.5 x 2.0 cm pieces and were
prepared according to the ASTM G1 standard. They were then sonicated in acetone
for 15-20 min, dried, and kept under vacuum prior to use.
2. IMMERSION STUDY
Polished CS were immersed in 100 ml of simulated geothermal brine in a Nalgene
container with cover at varying MW(10K, 40K,and 360K), varying concentrations (5
ppm, 10 ppm, and 15 ppm), varying duration (2 days, 7 days, 14 days, 30 days, and
60 days), and varying temperature (25°C and 180°C).
3. WEIGHT LOSS ANALYSIS
The carbon steel specimens were weighed on an analytical laboratory scale
(precision 10-4g) and completely immersed vertically in the simulated acidic
geothermal brine for 2 and 4 weeks at room temperature. After immersion, the
corrosion products were first removed mechanically using a paper towel and a
nonmetallic bristle brush. Then, chemical cleaning was followed in an ultrasonic
bath with coupons immersed in the solution specifically designed to remove the
corrosion products with minimal dissolution of the base metal. For this study, an
aqueous solution of 250 ml/L HCl containing 3.5g hexamethylenetatramine was

27
used for pickling the surface of carbon steel. The coupons were weighed on the
same analytical scale.
4. INSTRUMENTATION The FT-IR spectroscopy was done with Cary 600 Series FTIR Spectrometer (Agilent
Technologies) and scanned between 4000 and 400 cm−1. All spectra were recorded
with nominal spectral resolution of 2 cm−1 and 128 scans were collected and
averaged for each spectrum.
Electrochemical measurements for the evaluation of anti-corrosion property were
done using Autolab PGSTAT 12 Potentiostat (MetroOhm, Inc.), with platinum as the
counter electrode, Ag/Ag+ in 0.5 M NaCl as the reference electrode, and the carbon
steel substrates as the working electrodes. Potentiodynamic polarization scan (PPS)
was performed by scanning from −0.025 to +0.025 V vs Ag/Ag+ reference electrode
(0.5 M NaCl) about the open circuit potential (OCP) while electrochemical
impedance spectroscopy (EIS) was performed for seven frequency decades from 10
mHz to 100 kHz with an amplitude of 10 mV with respect to the OCP.
Scanning electron microscopy (SEM) analysis was done using JEOL JSM-6510LV
SEM. X-Ray Photoelectron Spectrometer (XPS) analysis was done using PHI
Versaprobe 5000 Scanning (XPS).
28
C. RESULTS AND DISCUSSION
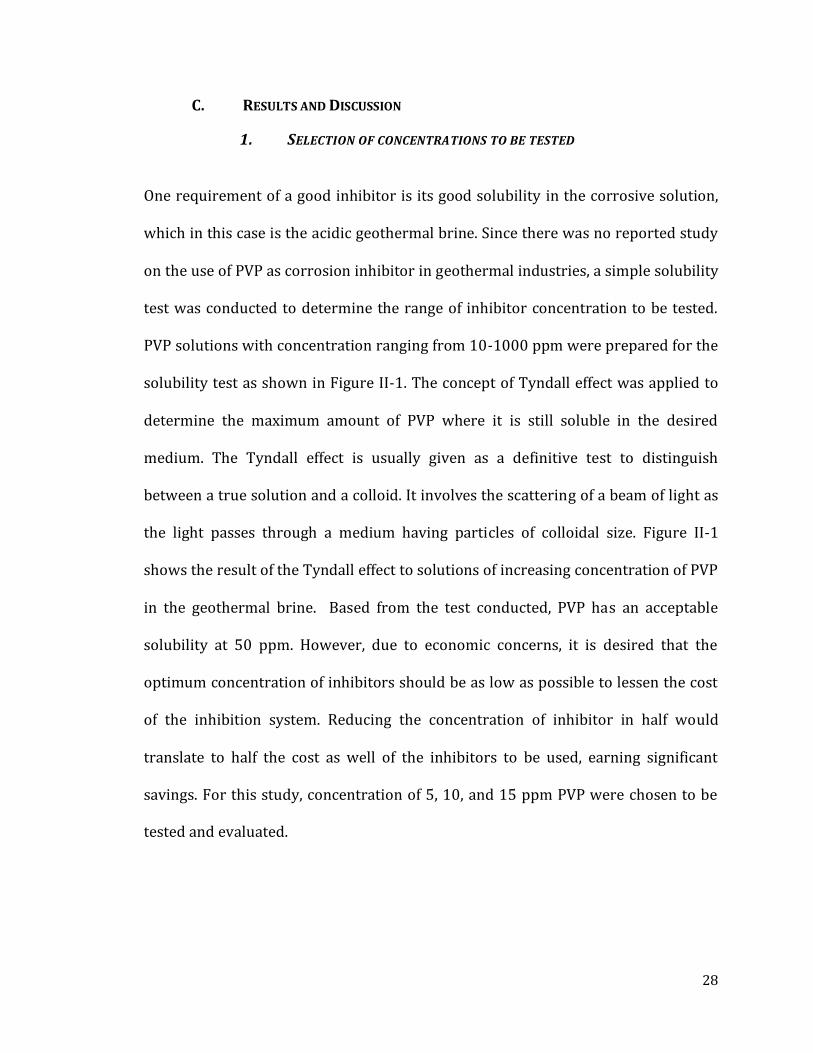
1. SELECTION OF CONCENTRATIONS TO BE TESTED
One requirement of a good inhibitor is its good solubility in the corrosive solution,
which in this case is the acidic geothermal brine. Since there was no reported study
on the use of PVP as corrosion inhibitor in geothermal industries, a simple solubility
test was conducted to determine the range of inhibitor concentration to be tested.
PVP solutions with concentration ranging from 10-1000 ppm were prepared for the
solubility test as shown in Figure II-1. The concept of Tyndall effect was applied to
determine the maximum amount of PVP where it is still soluble in the desired
medium. The Tyndall effect is usually given as a definitive test to distinguish
between a true solution and a colloid. It involves the scattering of a beam of light as
the light passes through a medium having particles of colloidal size. Figure II-1
shows the result of the Tyndall effect to solutions of increasing concentration of PVP
in the geothermal brine. Based from the test conducted, PVP has an acceptable
solubility at 50 ppm. However, due to economic concerns, it is desired that the
optimum concentration of inhibitors should be as low as possible to lessen the cost
of the inhibition system. Reducing the concentration of inhibitor in half would
translate to half the cost as well of the inhibitors to be used, earning significant
savings. For this study, concentration of 5, 10, and 15 ppm PVP were chosen to be
tested and evaluated.

29
Figure II-1Varing concentration of PVP (10, 20, 50, 100, 200, 300, 400, 500, and 1000
ppm) for solubility testing and the corresponding result of the Tyndall effect test.
2. EVALUATING THE EFFECT OF MW OF PVP IN CORROSION INHIBITION
To determine the optimum concentration of PVP, varying MW of PVP were tested
using Electrochemical Impedance Spectroscopy(EIS) and Potentiodynamic
Polarization Scan (PPS) tests. The inhibition efficiency of the CS immersed for one
month in varying MW of PVP were determined using the Tafel analysis. This is done
by varying the potential about the OCP and plotting the logarithm of the resulting
current against the applied potential. Corrosion currents (Icorr) and corrosion
potentials (Ecorr) were then determined by numerically fitting the resulting Tafel
plots to the Butler-Volmer Equation. Icorr and Ecorr are extracted via a computer
routine by specifying the cathodic and anodic branches and using non-linear least
square fitting method of Levenberg/Marquardt. The corrosion rates are calculated
using the equation:
Inhibition Effficiency (IE) =Icorr ,bare −Icorr ,coated
Icorr ,bare× 100%
Studies suggest that MW of polymeric inhibitors can have an effect on the inhibition
properties due to the repulsive lateral interactions between neighboring molecules
or steric effects that could hinder the adsorption of films50. A low (10K), mid (40K),
and high (360K) MW of PVP were tested to determine the most suitable MW of PVP
30
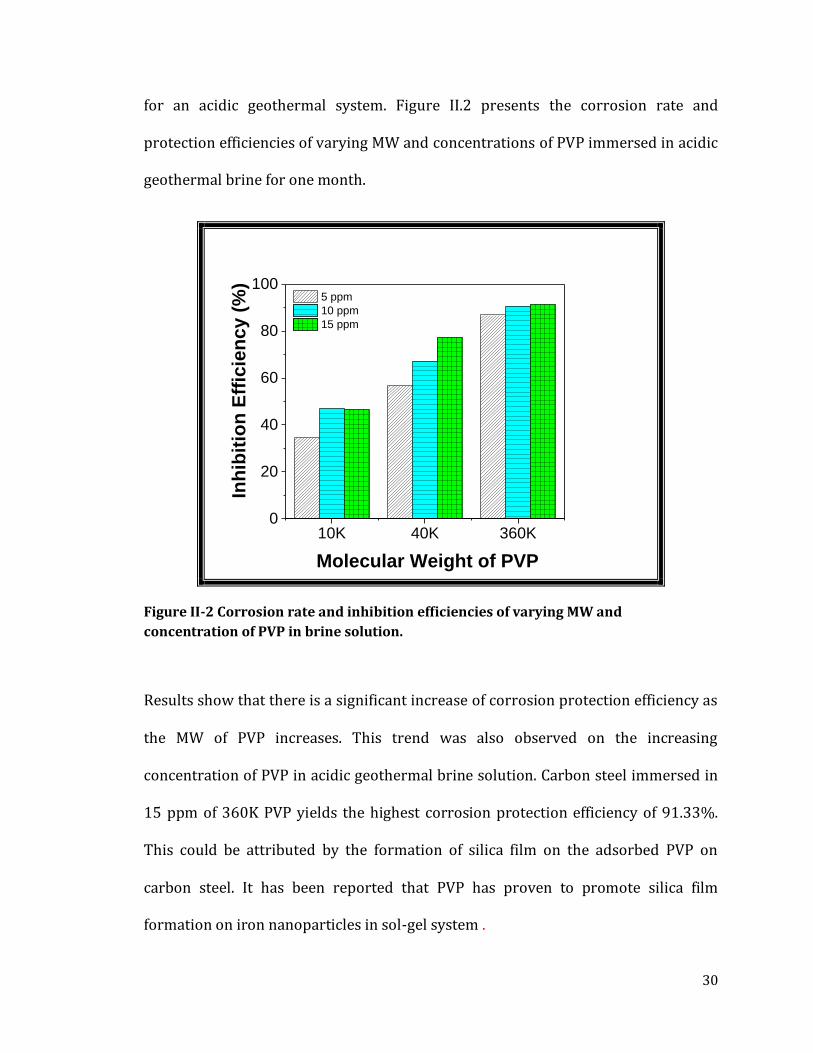
for an acidic geothermal system. Figure II.2 presents the corrosion rate and
protection efficiencies of varying MW and concentrations of PVP immersed in acidic
geothermal brine for one month.
10K 40K 360K0
20
40
60
80
100
Molecular Weight of PVP
5 ppm
10 ppm
15 ppm
Inh
ibit
ion
Eff
icie
nc
y (
%)
Figure II-2 Corrosion rate and inhibition efficiencies of varying MW and
concentration of PVP in brine solution.
Results show that there is a significant increase of corrosion protection efficiency as
the MW of PVP increases. This trend was also observed on the increasing
concentration of PVP in acidic geothermal brine solution. Carbon steel immersed in
15 ppm of 360K PVP yields the highest corrosion protection efficiency of 91.33%.
This could be attributed by the formation of silica film on the adsorbed PVP on
carbon steel. It has been reported that PVP has proven to promote silica film
formation on iron nanoparticles in sol-gel system .

31
FT-IR spectra were obtained to determine the effect of MW by comparing the
amount of silica film formed on the surface by examining the stretching of Si-O bond
at 1068 cm-1. As observed on Fig. II-3, there is a direct relationship on the increasing
MW to the silica found on the surface of the immersed carbon steel. Higher amount
of PVP in solution would increase the quantity of PVP formed while higher MW
would ensure more coverage of the film form on the metal surface. This trend was
observed in the study conducted by Al Juhaiman, et.al. where the degree of
protection increased with increasing PVP concentration due to the higher degree of
surface coverage, which resulted from enhanced inhibitor adsorption. Steric
hindrance only begins to dominate in the solution when the highest concentration of
PVP is reached51. Since the immersion study done was in a static condition, there
was no additional amount of PVP was added to the solution. This observation,
however, may stand true when the study is to be conducted at flowing conditions. A
separate evaluation must be conducted since increased concentration of the
polymer would also lead to an increase in the viscosity which would make the
transfer of polymer chains from the solution to the metal surface become more
difficult.

32
3000 2000 1000
0
5
10
15
20
25
30
35
40
45
50
55
60
65
70
75
80
Ab
so
rpti
on
(a
.u.)
Wavenumber(cm-1)
Blank geo brine
10K-15 ppm PVP
40K- 15 ppm PVP
360K-15 ppm PVP
Figure II-3 FT-IR spectra of increasing MW of PVP relating to its effect on the amount
of silica formed at 1068 cm-1
Another important data that could be derived from the FTIR spectra is the
interaction of the PVP to the surface metal. As discussed by Salehi, et.al., PVP has a
carboxyl group characteristic absorption at 1660 cm-1 and a carbon-nitrogen
adsorption at 1290 cm-1. The presence of a peak at 1293 cm-1, shown in Fig.II-4, of
all samples immersed with PVP and none with the blank suggests that PVP is
present at the CS surface. It is also apparent that as the MW of PVP increases, the
intensity of the absorbance also increases which supports the result of the previous
discussion.

33
1310 1305 1300 1295 1290 1285 1280
Blank
10K MW PVP
40K MW PVP
360K MW PVP
Ab
so
rban
ce (
a.u
.)
Wavenumber (cm-1)
Figure II-4 FT-IR spectra of increasing PVP relating to its effect on the carbon-
nitrogen adsorption at 1290 cm-1
It was also observed that there is a shift of the C=O absorption band of PVP from
1660 to 1630 as shown in Fig.II-5. The shift, as reported by Qiu et al, was due to the
interaction of the metal surface with the PVP's carbonyl group. This could be
attributed by either the reaction of the carbonyl oxygen with the metal via donation
of electron pairs or the complexation of the five-membered nitrogen with the
metal52. These findings suggest that there is a strong interaction between the PVP
and the metal surface.

34
1700 1650 1600 1550
0
5
10
15
20
Ab
so
rpti
on
(a
.u.)
Wavenumber(cm-1)
Blank geo brine
10K-15 ppm PVP
40K- 15 ppm PVP
360K-15 ppm PVP
Figure II-5 FT-IR spectra of increasing MW of PVP relating to its carboxyl group
absorption at 1660 cm-1
3. DETERMINING THE EFFECT OF IMMERSION TIME TO THE INHIBITION
EFFICIENCY OF VARYING CONCENTRATION OF 360K PVP
To further investigate the effect of concentration to the inhibition efficiency of PVP
at its optimum MW, carbon steel samples were immersed in 5, 10,and 15 ppm PVP
for 2, 7, 14, 30, and 60 days. PPS measurements were conducted to determine
corrosion rate. Results were tabulated in Figure II-6.
35
0 ppm 5 ppm 10 ppm 15 ppm0
20
40
60
80
100
Immersion Time (days)
Concentration of PVP
2 days
7 days
14 days
30 days
60 days
Pro
tecti
on
Eff
icie
ncy (
%)
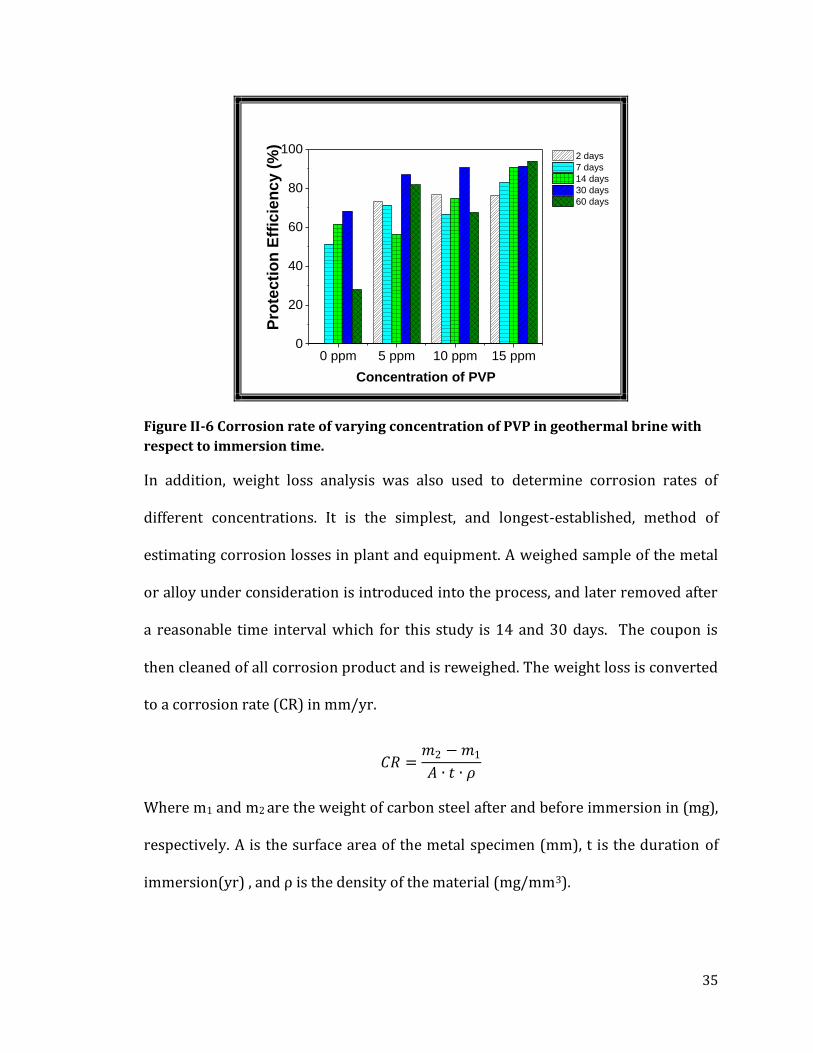
Figure II-6 Corrosion rate of varying concentration of PVP in geothermal brine with
respect to immersion time.
In addition, weight loss analysis was also used to determine corrosion rates of
different concentrations. It is the simplest, and longest-established, method of
estimating corrosion losses in plant and equipment. A weighed sample of the metal
or alloy under consideration is introduced into the process, and later removed after
a reasonable time interval which for this study is 14 and 30 days. The coupon is
then cleaned of all corrosion product and is reweighed. The weight loss is converted
to a corrosion rate (CR) in mm/yr.
𝐶𝑅 =𝑚2 −𝑚1
𝐴 ∙ 𝑡 ∙ 𝜌
Where m1 and m2 are the weight of carbon steel after and before immersion in (mg),
respectively. A is the surface area of the metal specimen (mm), t is the duration of
immersion(yr) , and ρ is the density of the material (mg/mm3).

36
Figure II-7 Corrosion rate of CS immersed in varying concentration of PVP for 14 and
30 days
5 ppm 10 ppm 15 ppm0
10
20
30
40
PVP Concentration
14 days
30 days
Pro
tec
tio
n E
ffic
ien
cy
(%
)
Results of the weight loss analysis in Fig. II-7 generally show a relatively lower
protection efficiency as compared to the results obtained from the immersion
studies. This is due to the fact that the corrosion rates of the samples have
infinitesimal difference due to a short time of immersion. To be able to get a
representative of the actual corrosion rate in real systems, the duration of weight
loss analysis should be set longer. However, the results of the 30 day immersion
show similar trend on the effect of the concentration of PVP to the protection
efficiency obtained using the electrochemical analysis.
The decreasing trend of CR (and increasing inhibition efficiency) is attributed to the
gradual formation of a passive film of silica. In low pH conditions, silica kinetics is
slow since at this condition it favors to be dispersed in solution in its monomeric
form Si(OH)4 as reported by Iler. For it to be precipitated out of the solution, it

37
needs to react to the surface. Si(OH)4 can condense with any pre-existing solid
surface that bears OH groups with which it can react like SiOH or any MOH surface
where M is a metal that will form a silicate. In actual industrial systems, silica has
never been found to precipitate on clean metal, but always a corrosion-product first
for it to form. In this case, oxidation of metal and/or formation of PVP film on the
metal should occur first before a silica film can be formed53. Another factor which
may delay the formation of silica layer is that polymer units or particles formed at
low pH bear no charge and aggregation begins to occur soon after polymeric
particles are formed, not only because of the lack of charge on the particles, but also
because the particles are extremely small and cease to grow after they reach a
diameter of 2-3 nm. Since the rate of aggregation depends mainly on the number of
particles per unit volume and less on their size, aggregation occurs even at low silica
concentrations. Once a receptive surface is covered the condensation of Si(OH)4 ,
further deposition is silica on silica, building up a film54.
Optical and SEM images of carbon steel immersed in different time duration support
the premise of gradual build-up of silica as seen on Figures II- 8 and 9.
= +Si(OH)4 Metal
O
H
O
H
H
O
O
H Si
O O
Metal
Scheme II-1 Deposition of monomeric silica at low pH on a solid
surface.

38
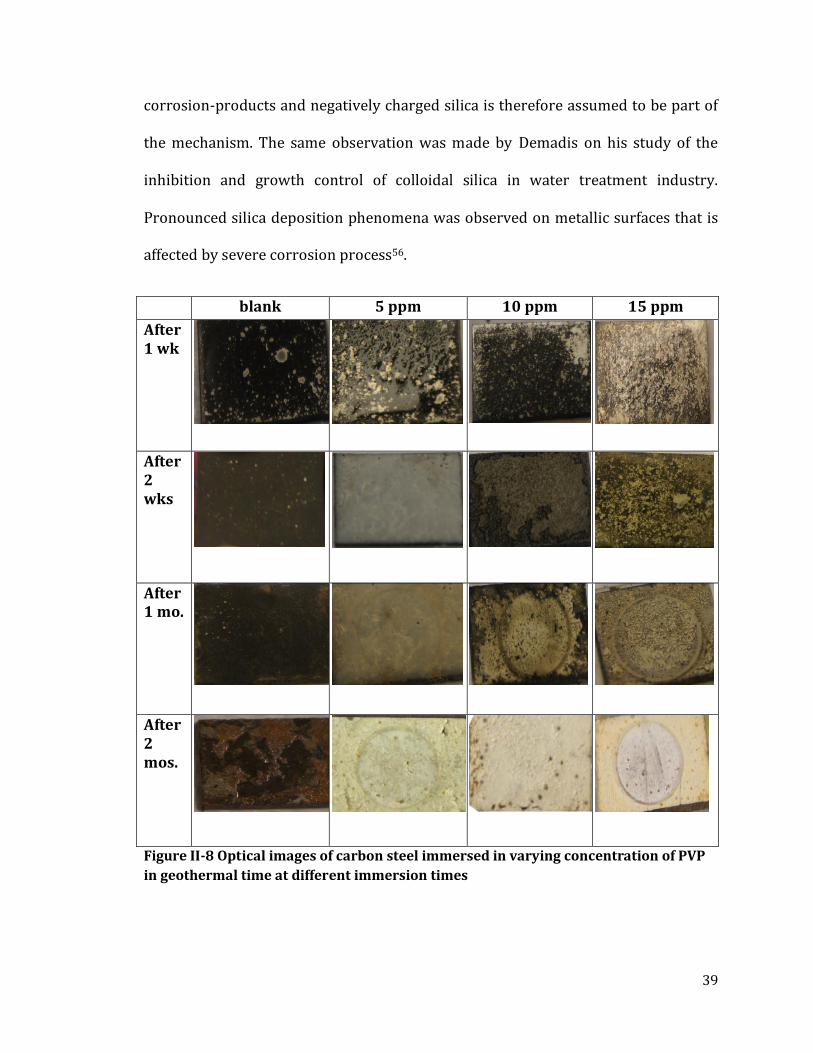
For samples immersed for two weeks, a thin layer is formed. However, after two
weeks, it was observed that the there is a gradual build up of the film. This was
supported by the IR image taken of a samples immersed in blank brine solution and
with PVP shown in Fig. II-9. Compared to the sample in geothermal brine alone, the
sample immersed with PVP has almost uniform deposition on the surface. For
coupons immersed in solution with PVP in one month, a two-layer film was
observed where the top layer is flaky, loose and porous while the layer underneath
it is compact and dense. This was also observed by Remoroza et.al. on the coupons
inserted in the production lines in Palinpinon which are exposed to low pH brine. it
was observed that silica formation in carbon steel under acidic brine yields
corrosion films that consist of two layers of silica, a thin and dense basal layer that is
attached to corrosion products and an overlying porous, thicker layer of globular
silica dendrites55.
This was also observed by the studies conducted by Lehrman and Shuldener. They
showed that the coatings formed on the metal mainly consist of metal oxide and
silica. The formation of the film in dilute silica solution is dependent on the presence
of small quantities of corrosion products on the metal surface. They also examined
the films produced over time and microscopically showed that there are two layers
present with silica as the major component of the top layer exposed to the aqueous
medium. When the hydrous metallic oxide film has been covered with a silica layer,
further deposition is stopped, which accounts for the observed fact that prolonged
exposure to silicate solutions does not build up thick films and that the thin films
when mechanically damaged are self-healing. The attraction of positively charged
39
corrosion-products and negatively charged silica is therefore assumed to be part of
the mechanism. The same observation was made by Demadis on his study of the
inhibition and growth control of colloidal silica in water treatment industry.
Pronounced silica deposition phenomena was observed on metallic surfaces that is
affected by severe corrosion process56.
blank 5 ppm 10 ppm 15 ppm
After 1 wk
After 2 wks
After 1 mo.
After 2 mos.
Figure II-8 Optical images of carbon steel immersed in varying concentration of PVP
in geothermal time at different immersion times

40
a b c d
e f g h Figure II-9 SEM images of carbon steel immersed for one month: a) top layer in blank
geo brine b) top layer in 5 ppm PVP c) top layer in 10 ppm PVP d) top layer in 15 ppm
PVP e) bottom layer in blank geo brine f) bottom layer in 5 ppm PVP g) bottom layer
in 10 ppm PVP h) bottom layer in 15 ppm PVP
Based on the SEM images shown in Fig.II-9, for the top layer of CS samples
immersed in varying concentration of PVP, there is no apparent changes on the film
formed. The top layer of all samples exhibit a compact film of silica. However, the
surface of the bottom layer of these samples exhibit a significant change in terms of
morphology and composition. in Fig. II.9.e shows the bottom layer of the carbon
steel immersed in geo brine without PVP where metal dissolution is evident and no
film was observed. Unlike in the case of carbon steel samples immersed in geo brine
with PVP. A passive film is still observable and as the concentration of PVP
increases, the more compact the film appears to be.
a b c d
e f g

41
0
0.2
50 μm
a
b
Figure II-10 ATR IR image of carbon steel immersed in a) synthetic geothermal brine and b) with PVP focused at wavenumber 1065 (Si-O)
42
Addition of PVP has a significant inhibition effect based on the EIS results gathered.
EIS involves the application of a small sinusoidal perturbation to a sample under
examination and the impedance modulus (z) is recorded as a function of the
frequency (f). The analysis of the frequency behavior of the impedance allows the
determination of the corrosion mechanism and the robustness of the passive film.
To evaluate the performance of the passive film observed on the carbon steel, the
impedance of the coating at the low frequency is observed. The higher the
impedance at the low frequency region, the more effective the coating. As the
amount of PVP increases, the impedance value of the CS immersed in it also
increases (see Fig.II-11). This is mainly due to the passive layers formed as seen on
both the high and low frequency region.
0 500 1000 1500 2000 2500 3000 3500 4000
0
500
1000
1500
2000
2500
3000
3500
4000
geo brine
geo brine with 5 ppm PVP
geo brine with 10 ppm PVP
geo brine with 15 ppm PVPZ"
Z'
-3 -2 -1 0 1 2 3 4 5 6
2.0
2.2
2.4
2.6
2.8
3.0
3.2
3.4
3.6
3.8
4.0
geo brine
geo brine with 5 ppm PVP
geo brine with 10 ppm PVP
geo brine with 15 ppm PVP
log
im
pe
da
nce
(
)
log frequency (Hz)
Figure II-11 a) Nyquist plot and b) Bode plot of CS immersed in varying concentration
of PVP for 1 month
The integrity of the passive layer formed is supported by the Bode plot showing the
significant difference of the passive film that was promoted by PVP as compared to
the blank sample. The high inhibition efficiency of those immersed with PVP is due
to the effectiveness of the passive layer formed in preventing the diffusion of
b a
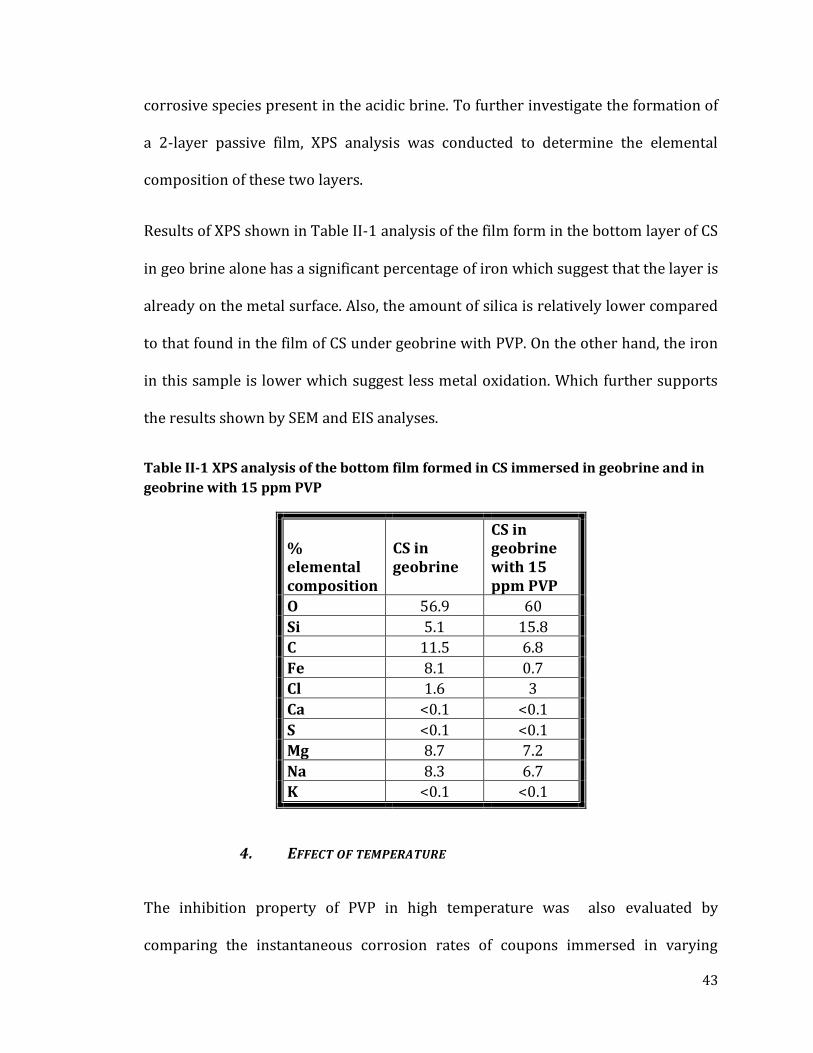
43
corrosive species present in the acidic brine. To further investigate the formation of
a 2-layer passive film, XPS analysis was conducted to determine the elemental
composition of these two layers.
Results of XPS shown in Table II-1 analysis of the film form in the bottom layer of CS
in geo brine alone has a significant percentage of iron which suggest that the layer is
already on the metal surface. Also, the amount of silica is relatively lower compared
to that found in the film of CS under geobrine with PVP. On the other hand, the iron
in this sample is lower which suggest less metal oxidation. Which further supports
the results shown by SEM and EIS analyses.
Table II-1 XPS analysis of the bottom film formed in CS immersed in geobrine and in
geobrine with 15 ppm PVP
% elemental composition
CS in geobrine
CS in geobrine with 15 ppm PVP
O 56.9 60
Si 5.1 15.8
C 11.5 6.8
Fe 8.1 0.7
Cl 1.6 3
Ca <0.1 <0.1
S <0.1 <0.1
Mg 8.7 7.2
Na 8.3 6.7
K <0.1 <0.1
4. EFFECT OF TEMPERATURE
The inhibition property of PVP in high temperature was also evaluated by
comparing the instantaneous corrosion rates of coupons immersed in varying

44
solutions of PVP at room and actual line process temperature (160-180°C). The
increase in the inhibition efficiency with the increase in temperature suggest that
PVP is still thermally stable at high temperature and was able to adsorb on the metal
surface. A physisorption mechanism was proposed by Umoden et.al. by considering
the fact that PVP could interact with the corroding metal surface via the protonated
N atom, which can be adsorbed at cathodic sites and hinder the hydrogen evolution
reaction, with possible contributions from the lone pair of the electrons on the
oxygen atom. This may be facilitated by the presence of the vacant d-orbitals of
iron. The adsorption of PVP creates a barrier for mass and charge transfers.
5 ppm 10 ppm 15 ppm0
10
20
30
40
50
60
70
PVP Concentration
Room Temp
High Temp
Pro
tec
tio
n E
ffic
ien
cy
(%
)
II-12 Corrosion rates of CS immersed in varying concentration of PVP at room and
line temperature (180°C)
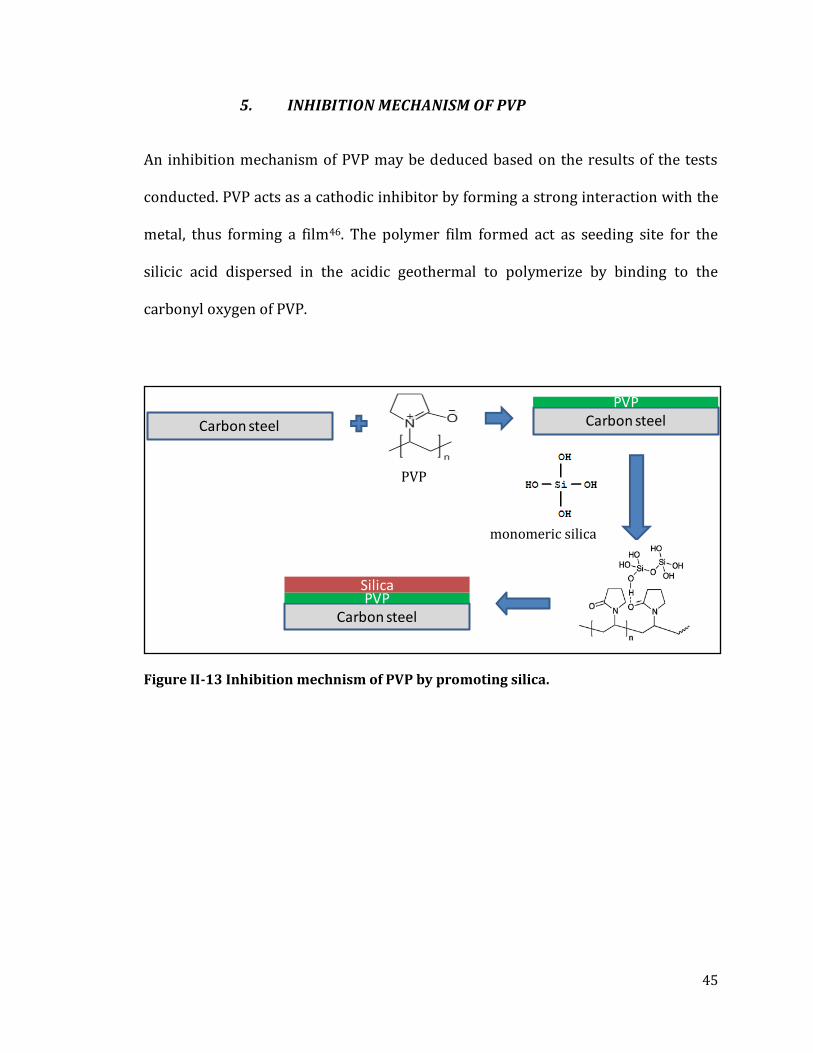
45
5. INHIBITION MECHANISM OF PVP
An inhibition mechanism of PVP may be deduced based on the results of the tests
conducted. PVP acts as a cathodic inhibitor by forming a strong interaction with the
metal, thus forming a film46. The polymer film formed act as seeding site for the
silicic acid dispersed in the acidic geothermal to polymerize by binding to the
carbonyl oxygen of PVP.
Figure II-13 Inhibition mechnism of PVP by promoting silica.
Carbon steel Carbon steelPVP
Carbon steelPVP
Silica
PVP
monomeric silica

46
III. POLYMER/CLAY NANOCOMPOSITE: A VIABLE ANTI-
CORROSION COATING FOR GEOTHERMAL APPLICATIONS
A. INTRODUCTION
One of the most common cited anticorrosion solution in geothermal industry is by
pH modification by NaOH dosing which has been reported to be effective by various
geothermal sites58-59. Though not widely used in geothermal plants, another way of
retarding the effects of corrosion is by application of coatings. Due to the relatively
high temperature demand of geothermal process, coatings to be applied must have
good thermal stability and resistance to chemical attack. The issue of hardness and
adhesion also needs to be considered in choosing the right material since
geothermal fluid does not only contain corrosive agents but may contain high
amounts of suspended solids. These high velocity solids will impinge on the walls of
the pipe, eroding the metal. Erosion together with corrosion would have a
synergistic effect on the rate of metal dissolution, making it a critical factor to
consider in operating under highly erosive and corrosive environment.
Polymer modification has been attracting the attention of scientific community due
to its process of combining attractive properties of different materials and fusing it
into a hybrid high performance material. These properties will very much like to
depend on the type of environment and its application. For this study,
polybenzoxazine(PBZ) was chosen for modification on the coating application of
typical acidic geothermal well. PBZ has excellent properties that fit the
requirements such as near-zero shrinkage upon polymerization, low surface free
energy, low water absorption, good thermal stability, and good mechanical
properties60. Zhou et al reported that although there has been few studies
conducted regarding the use of PBZ for anticorrosion, polybenzoxazines have the
potential to apply as corrosion protective coating due to their unique properties
such as low water absorption , low surface free energy, near-zero shrinkage , and
excellent dielectric properties , which are superior to those of epoxy resins and
conventional phenolics61. However, PBZ alone is brittle which needs to be modified
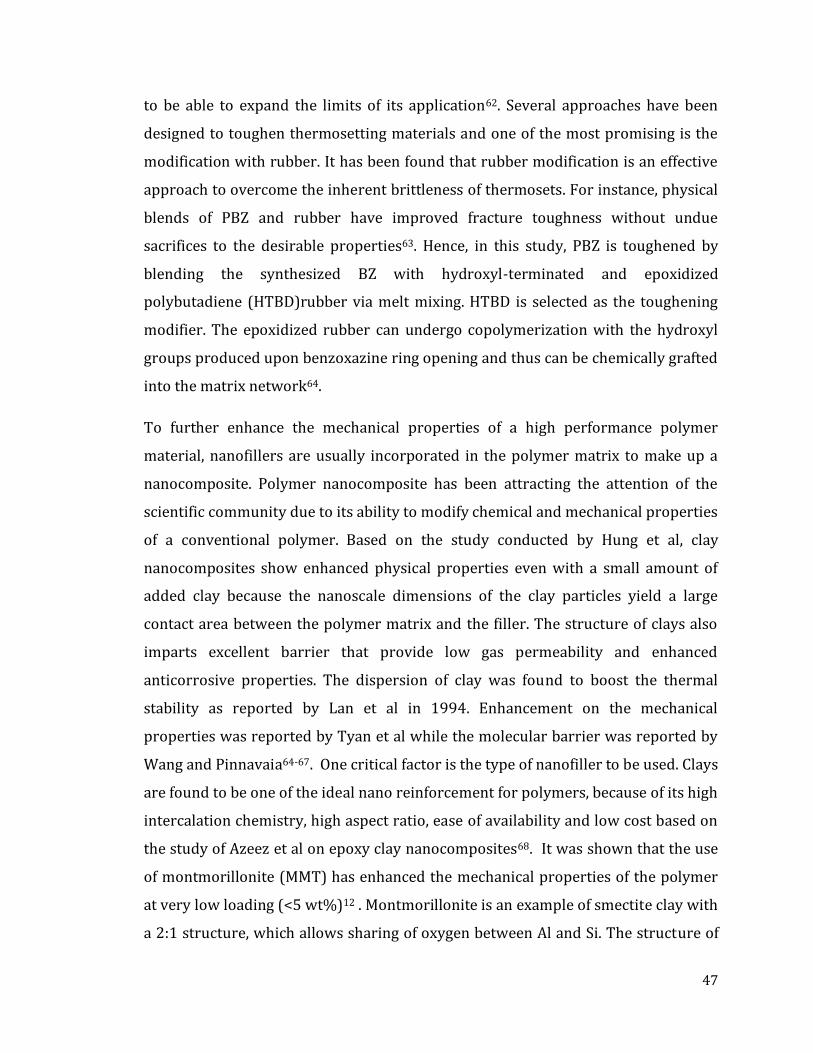
47
to be able to expand the limits of its application62. Several approaches have been
designed to toughen thermosetting materials and one of the most promising is the
modification with rubber. It has been found that rubber modification is an effective
approach to overcome the inherent brittleness of thermosets. For instance, physical
blends of PBZ and rubber have improved fracture toughness without undue
sacrifices to the desirable properties63. Hence, in this study, PBZ is toughened by
blending the synthesized BZ with hydroxyl-terminated and epoxidized
polybutadiene (HTBD)rubber via melt mixing. HTBD is selected as the toughening
modifier. The epoxidized rubber can undergo copolymerization with the hydroxyl
groups produced upon benzoxazine ring opening and thus can be chemically grafted
into the matrix network64.
To further enhance the mechanical properties of a high performance polymer
material, nanofillers are usually incorporated in the polymer matrix to make up a
nanocomposite. Polymer nanocomposite has been attracting the attention of the
scientific community due to its ability to modify chemical and mechanical properties
of a conventional polymer. Based on the study conducted by Hung et al, clay
nanocomposites show enhanced physical properties even with a small amount of
added clay because the nanoscale dimensions of the clay particles yield a large
contact area between the polymer matrix and the filler. The structure of clays also
imparts excellent barrier that provide low gas permeability and enhanced
anticorrosive properties. The dispersion of clay was found to boost the thermal
stability as reported by Lan et al in 1994. Enhancement on the mechanical
properties was reported by Tyan et al while the molecular barrier was reported by
Wang and Pinnavaia64-67. One critical factor is the type of nanofiller to be used. Clays
are found to be one of the ideal nano reinforcement for polymers, because of its high
intercalation chemistry, high aspect ratio, ease of availability and low cost based on
the study of Azeez et al on epoxy clay nanocomposites68. It was shown that the use
of montmorillonite (MMT) has enhanced the mechanical properties of the polymer
at very low loading (<5 wt%)12 . Montmorillonite is an example of smectite clay with
a 2:1 structure, which allows sharing of oxygen between Al and Si. The structure of
48
MMT is shown in Fig.III.1. It is known to have a good high-aspect ratio, high surface
area, and environment friendly. However, it is hydrophilic in its natural state which
makes it difficult to be dispersed in most polymers and could easily aggregate. In
order for it to be used as a nanofiller, its layered silicates should be organically
modified first. This is usually done by exchanging the cations present at the silicate
surfaces of MMT with long chain alkyl ammonium cation making it organophilic
which will be now compatible with most polymers.
Figure III-1 Structure of Montmorillonite70
The objective of this study is to synthesize a polymer/clay nanocomposite coating
that is designed for application in acidic geothermal well pipeline components and
test its corrosion protection efficiency and mechanical stability under harsh
geothermal conditions.

49
B. METHODOLOGY
1. MATERIALS
Impact-resistant carbon steel sheets (Type A516) were obtained from McMaster
Carr and was used as the substrates. The steel sheets had thickness of 0.0625 in. and
composition of 0.27-0.31% C, 0.79-1.30% Mn, 0.13-0.45% Si, 0.035% P, 0.035% S,
and Fe making up the remaining percentage by weight. Pro grade advanced
sandpapers, used in polishing the substrates, were purchased from 3M.
99%-purity phenol and potassium permanganate (KMnO4) crystals were purchased
from EMD Chemicals, Inc, while paraformaldehyde (reagent grade) and HTBD were
all purchased from Sigma-Aldrich. 1,12-diaminododecane with 98% puritywas
bought from TCI. Chloroform (99.8% purity) was obtained from Acros, whereas,
H2SO4 (96.2% w/w), 99.9% HPLC grade tetrahydrofuran (THF), and acetone
(99.7% purity) were all obtained from Fisher-Scientific.1 N NaOH solution was
prepared by dissolving NaOH pellets (Fisher-Scientific, 99.4%) in Milli-Q water
(18.2 MΩ cm resistivity).99.2%-purity crystalline NaCl (Fisher-Scientific) was used
to prepare 0.5 M NaCl aqueous solution. All chemicals involved were used as
received without further purification, unless otherwise specified.
2. SUBSTRATE PREPARATION
The carbon steel sheets were first cut into1.5 x 2.0 cm pieces, and polished with
increasing grades (400, 600, and 1200) of sandpapers. They were then sonicated in
acetone for 15-20 min, dried, and kept under vacuum prior to use.
3. SYNTHESIS OF BENZOXAZINE MONOMER
The difunctional linear diamine-based benzoxazine monomer was synthesized (via a
modification of the solventlessmethod21), through the Mannich reaction of
stoichiometric quantities (2:4:1) of phenol, paraformaldehyde, and 1,12-
diaminododecane. The reactants were dry mixed and refluxed in chloroform for 16
h at a concentration of 5 mL solvent per gram of reactants. After cooling to room
temperature, the crude monomer solution product was washed several times with 1
N NaOH solution and then rinsed with Milli-Q water until neutral. The washed
50
products were dried over anhydrous sodium sulfate overnight and filtered.
Chloroform was then removed by rotary evaporation, and the obtained benzoxazine
monomer was refrigerated until use.
4. ORGANIC MODIFICATION OF MMT
Modification organically of MMT was done by using dodecyl ammonium chloride.
Dodecyl ammonium chloride solution was prepared by mxing of 834 mg of
concentrated HCl (12.1 N) and 1482 mg of dodecylamine in 200 mL distilled water.
The mixture was stirred at 80oC until a clear solution was obtained. To this solution
of dodecyl ammonium chloride, a suspension of 4000 mg of MMT in 200 mL of
distilled water was added with mechanical stirring at 80oC. The stirring was
continued for 5 h. The resultant white precipitate was collected by suction
filtration. The precipitate was suspended in hot distilled water with mechanical
stirring for 1 h to remove the adsorbed salts. This process was repeated several
times until no chloride was detected in the filtrate when adding 0.1 N AgNO3. The
precipitate was dried in a vented oven at 100oC for 3 days and then at 110oC under
vacuum for 24 h.
5. PREPARATION OF COATINGS
Preparation of the PBZ-R-oMMT coatings was performed by following the
subsequent steps. Firstly, HTBD/BZ solution was prepared by melt mixing 20% by
weight of the polybutadiene rubber with the BZ monomer under vigorous
mechanical stirring at 100oC for 2 h. Secondly, HTBD/BZ solution was mixed with
varying amounts of oMMT (0, 1, 3, 5,7 weight percent, with corresponding
nomenclatures of PBZ-R, PBZ-R-1MMT, PBZ-R-3MMT, PBZ-R-5MMT, PBZ-R-7MMT,
respectively) dissolved in THF solvent: specifically, this is done by first dispersing
MMT in THF assisted by ultrasonication; HTBD/BZ solution was added afterwards,
and mechanically stirred and ultrasonically mixed for 15 min each before use. In all
coatings prepared, 3 g of combined weight of mmt and HTBD/BZsolution were
mixed per 5 mL of the solvent THF. Thirdly, the polished substrates were dip-coated

51
into the different coatings for uninterrupted five times with a withdraw speed of
100 mm per minute. The substrates remained in the solution for 1 minute every
time. Finally, the THF solvent was evaporated by drying in an oven at 60oC for 1 h
followed by curing of the coated substrates at 200oC for 2 h.
Scheme III-1 Coating preparation of polymer/nanoclay composite
6. INSTRUMENTATION
The FT-IR spectroscopy was done with Cary 600 Series FTIR Spectrometer (Agilent
Technologies) and scanned between 4000 and 400 cm−1. All spectra were recorded
with nominal spectral resolution of 2 cm−1 and 128 scans were collected and
averaged for each spectrum. Thermal stability of the nanocomposites was studied
using a TGA 2050 Thermogravimetric Analyzer (TA Instruments)under a
continuous nitrogen or air purge (nitrogen, 70 mL/min; air, 40 mL/min). Weight
loss was monitored as 5-10 mg samples of the nanocomposites were heated at a
rate of 10oC/min to a maximum temperature of 700oC.
Put in oven at 200 C for 2 hrs
100 C @ 2 h
PBZ-R mixing
PBZ-R –OMMT mixing
Coating
100 mm/min (5x)
Ca2+, Mg2+, SiO2, Fe2+, Cl-, SO42-, K+ ,F,- Na+, NH4
Geothermal brine @ pH 3

52
Adhesion test measurement was performed according to the ASTM standard test
method D-3359 for measuring the adhesion strength by tape test. A blade handle
equipped with a four-tooth 2.4-mm spacing coarse blade was used to make the
cross-cut configuration through the coatings. The coating was brushed lightly with a
soft brush after each cut to remove any debris, detached flakes, or ribbons of
coatings from the surface. Scotch tape 51596 was placed on the cut surface and
rubbed with the eraser on the end of a pencil to ensure good contact with the film
and then removed rapidly after 90s. The grid areas were inspected for possible
removal of the coating from the substrate and rated the adhesion strength in
accordance with the scale provided by the ASTM as shown below.
Figure III-2 ASTM Scale for Adhesion test.
Hardness Test measurement was performed using a pencil hardness tester which
meets the ASTM standard D 3363. For this test, pencils of increasing hardness
values are moved over the surface in a precisely defined way until one damages the
surface. Sufficient pressure must be applied to either cut or damage the coating or to

53
crush the lead pencil point. Repeat the test as many as possible until a definite
observation is made. If scratching or damage of the surface occurs, proceed with the
next softer pencil grade and repeat the testing process until a pencil lead grade is
found which crushes and does not damage the coating. If crushing of the hardest
lead should occur, the coating is therefore extremely hard and beyond the
measuring range of this test.
Electrochemical measurements for the evaluation of anti-corrosion property were
done using AutolabPGSTAT 12 Potentiostat (MetroOhm, Inc.), with platinum as the
counter electrode, Ag/Ag+ in 0.5 M NaClas the reference electrode, and the carbon
steel substrates as the working electrodes. Potentiodynamic polarization scan (PPS)
was performed by scanning from −0.025 to +0.025 V vs Ag/Ag+ reference electrode
(0.5 M NaCl) about the open circuit potential (OCP) while electrochemical
impedance spectroscopy (EIS) was performed for seven frequency decades from 10
mHz to 100 kHz with an amplitude of 10 mV with respect to the OCP. Lastly,
scanning electron microscopy (SEM) analysis was done using JEOL JSM-6510LV
SEM.
C. RESULTS AND DISCUSSION
1. XRD
One of the most critical process in ensuring optimal properties of PBZ-R-oMMT
nanocomposite is the modification of the cations at the silicates interlayer spacing
by cationic exchanged with long-chain alkyl ammonium cation. XRD was conducted
to determine the swelling of the nanoclay by calculating the d-spacing of the natural
MMT and the organically modified MMT(oMMT). Fig III.2.a shows the XRD spectra
of MMT and oMMT. By using the spectra result and Bragg's law, d-spacing of MMT
and oMMT are calculated to be 9.93 Å and 13.97 Å, respectively. The increase in d-
spacing from the native MMT to the modified one suggests that there is expansion in
the clay galleries due to the exchange of a larger molecule . This also creates a steric
stabilization of the nanoclay in the polymer matrix which prevents agglomeration
and lowers the surface energy. This ,in turn, will enable the oMMT to disperse well
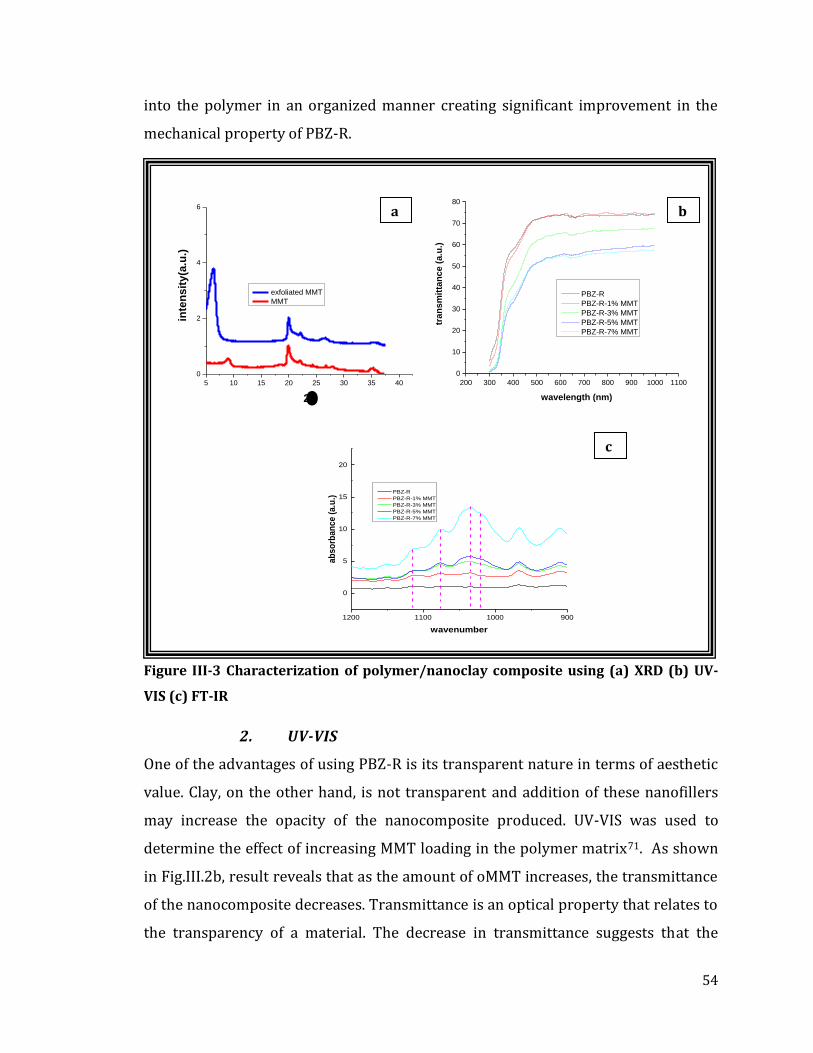
54
900100011001200
0
5
10
15
20
ab
so
rba
nc
e (
a.u
.)
wavenumber
PBZ-R
PBZ-R-1% MMT
PBZ-R-3% MMT
PBZ-R-5% MMT
PBZ-R-7% MMT
into the polymer in an organized manner creating significant improvement in the
mechanical property of PBZ-R.
Figure III-3 Characterization of polymer/nanoclay composite using (a) XRD (b) UV-
VIS (c) FT-IR
2. UV-VIS
One of the advantages of using PBZ-R is its transparent nature in terms of aesthetic
value. Clay, on the other hand, is not transparent and addition of these nanofillers
may increase the opacity of the nanocomposite produced. UV-VIS was used to
determine the effect of increasing MMT loading in the polymer matrix71. As shown
in Fig.III.2b, result reveals that as the amount of oMMT increases, the transmittance
of the nanocomposite decreases. Transmittance is an optical property that relates to
the transparency of a material. The decrease in transmittance suggests that the
5 10 15 20 25 30 35 40
0
2
4
6
inte
nsit
y(a
.u.)
2
exfoliated MMT
MMT
200 300 400 500 600 700 800 900 1000 1100
0
10
20
30
40
50
60
70
80
tra
ns
mit
tan
ce (
a.u
.)
wavelength (nm)
PBZ-R
PBZ-R-1% MMT
PBZ-R-3% MMT
PBZ-R-5% MMT
PBZ-R-7% MMT
a b
a
c
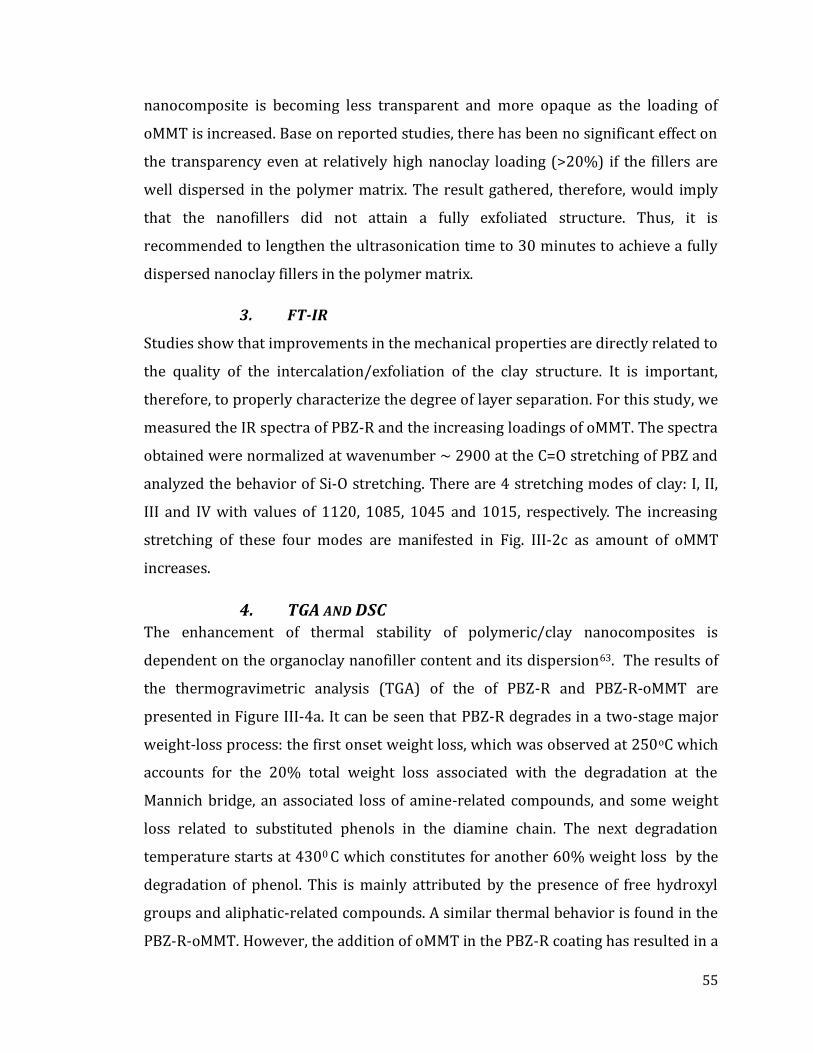
55
nanocomposite is becoming less transparent and more opaque as the loading of
oMMT is increased. Base on reported studies, there has been no significant effect on
the transparency even at relatively high nanoclay loading (>20%) if the fillers are
well dispersed in the polymer matrix. The result gathered, therefore, would imply
that the nanofillers did not attain a fully exfoliated structure. Thus, it is
recommended to lengthen the ultrasonication time to 30 minutes to achieve a fully
dispersed nanoclay fillers in the polymer matrix.
3. FT-IR
Studies show that improvements in the mechanical properties are directly related to
the quality of the intercalation/exfoliation of the clay structure. It is important,
therefore, to properly characterize the degree of layer separation. For this study, we
measured the IR spectra of PBZ-R and the increasing loadings of oMMT. The spectra
obtained were normalized at wavenumber ~ 2900 at the C=O stretching of PBZ and
analyzed the behavior of Si-O stretching. There are 4 stretching modes of clay: I, II,
III and IV with values of 1120, 1085, 1045 and 1015, respectively. The increasing
stretching of these four modes are manifested in Fig. III-2c as amount of oMMT
increases.
4. TGA AND DSC
The enhancement of thermal stability of polymeric/clay nanocomposites is
dependent on the organoclay nanofiller content and its dispersion63. The results of
the thermogravimetric analysis (TGA) of the of PBZ-R and PBZ-R-oMMT are
presented in Figure III-4a. It can be seen that PBZ-R degrades in a two-stage major
weight-loss process: the first onset weight loss, which was observed at 250oC which
accounts for the 20% total weight loss associated with the degradation at the
Mannich bridge, an associated loss of amine-related compounds, and some weight
loss related to substituted phenols in the diamine chain. The next degradation
temperature starts at 4300 C which constitutes for another 60% weight loss by the
degradation of phenol. This is mainly attributed by the presence of free hydroxyl
groups and aliphatic-related compounds. A similar thermal behavior is found in the
PBZ-R-oMMT. However, the addition of oMMT in the PBZ-R coating has resulted in a

56
slight increase in thermal stability, as seen in the case of PBZ-R-5% oMMT, which is
shown as a representative of the nanocomposite. At around 700oC, the PBZ-R has
completely degraded while the nanocomposite with oMMT has a remaining weight
of about 5%. This constitute the nanoclay added in the polymer matrix which has a
very high temperature degradation.
Figure III-4 Thermogravimetric properties of PBZ-R and PBZ-R-M
Aside from TGA, Differential Scanning Calorimetry(DSC) has been widely applied in
the investigation of numerous phenomena occurring during the thermal heating of
polymer/clay nanocomposites involving glass transition(Tg), melting,
100 125 150 175 200 225 250 275 300
-2.0
-1.5
-1.0
-0.5
0.0
0.5
1.0
Heat
Flo
w
temperature (0C)
PBZ-R-5% MMT
PBZ-R (uncured)
0 100 200 300 400 500 600 700
0
20
40
60
80
100
weig
ht
%
temperature (0C)
PBZ-R
PBZ-R-5% MMT
a
b

57
crsytallization and curing. DSC of PBZ-R that is uncured and the cured PBZ-R-oMMT
was taken to determine the effect of nanofillers on the possible changes concerning
Tg and curing temperature. Results of the DSC, as shown in Fig II-4.b, highlight the
significant enhancement of the Tg of PBZ-R-oMMT as compared to the PBZ-R. Based
on the DSC curve, the PBZ-R starts to phase change at 2000C and degrades
thereafter. On the other hand, PBZ-R-oMMT is at its stable phase until around 2500C
where it starts to undergo a phase change. This appreciable improvement is due to
the confinement of intercalated polymers within the silicate galleries that prevents
the segmental motions of the polymer chains72 .
Geothermal industry operates at relatively higher temperature(~180-2000C). The
degradation temperatures of the fabricated nanocomposite are of the utmost
importance since this would limit the application of the coating. Based on the results
of TGA and DSC analysis, the nanocomposite is still in its stable form at the
temperature of the intended application with no degradation or phase change.
5. MECHANICAL TEST
Many studies reported the improvement of mechanical properties of nanocomposite
by addition of clay nanofillers at very moderate loadings (1-5 wt%). This
improvement, however, can also be achieved by other particulate fillers like mica or
talc but they need to be incorporated in the polymer matrix in a higher filler
loadings (30-60%). To determine if this phenomenon also occurs in PBZ-R polymer
matrix, hardness and adhesion test were conducted. Results show that even without
the incorporation of clay, PBZ-R has a good mechanical property. But the addition of
oMMT further improves the hardness of the nanocomposite as shown in Table III-1.
The intercalation and exfoliation of MMT in the polymer matrix might have played a
role in improving the tensile strength. However, addition of higher loading of oMMT
could impart drawbacks due to agglomeration and difficulty of dispersion of the
nanofillers. This is manifested by the decrease of hardness of the nanocomposite
with 7% oMMT.

58
Table III-1 Hardness and Adhesion tests results
HARDNESS ADHESION
PBZ-R 8H
5B
PBZ-R-1% MMT 9H
5B
PBZ-R-3%MMT 9H
5B
PBZ-R-5% MMT 8H
5B
PBZ-R-7% MMT 4H
5B
It is believed that clay does not actually play a role in terms of adhesion since it's the
unbound hydroxyl group of PBZ-R that interacts with the metal surface73. However,
it is also in a good note to know if the presence of clay could hinder the interaction
of these free hydroxyl groups with the metal surface. Based on the results of the
adhesion test, there is no significant change on the adhesion of PBZ-R alone and
with increasing loadings of oMMT. The mechanical tests conducted, however, just
present a preview on the improved properties since the basis of the ratings are

59
based optically. It is suggested to do an in depth mechanical testing involving
different stress/strain tests to further verify and accurately deduce the effect of
addition of oMMT fillers. Its importance is mainly due to the fact that in actual
geothermal systems, presence of suspended solids in the gas phase can exacerbate
the corrosiveness of the brine by eroding the protective coating. A good coating, in
this case, must not only be chemically-resistant and heat-resistant but has
mechanical strength that could withstand the impingement of high velocity
suspended particles.
6. ELECTROCHEMICAL TESTS
Table III-2 Corrosion protection efficiency of polymer/nanoclay composite coatings immersed in geothermal brine
1 day immersion
Corrosion rate % protection
(mm/yr) efficiency
7 day immersion
Corrosion rate % protection
(mm/yr) efficiency
blank 1.03 --- 0.37 64
PBZ-R 0.16 84 0.02 98
PBZ-R-1%MMT 0.03 97 0.02 98
PBZ-R-3%MMT 0.06 94 0.03 97
PBZ-R-5%MMT 0.04 96 0.01 99
PBZ-R-7%MMT 0.03 97 0.01 99
To test the corrosion efficiency of the PBZ-R-oMMT nanocomposite, Electrochemical
Impedance Spectroscopy(EIS) and Potentiodynamic Polarization Scan (PPS) tests
were conducted. The corrosion rates of the polymer matrix PBZ-R and its varying
loading were determined using the Tafel analysis after 1 day and 7 day immersion.
This is done by varying the potential about the OCP and plotting the logarithm of the
resulting current against the applied potential. Corrosion currents (Icorr) and
corrosion potentials (Ecorr) were then determined by numerically fitting the
resulting Tafel plots to the Butler-Volmer Equation. Icorr and Ecorr are extracted via
a computer routine by specifying the cathodic and anodic branches and using non-

60
linear least square fitting method of Levenberg/Marquardt. The corrosion rates are
calculated using the equation:
PE =Icorr ,bare − Icorr ,coated
Icorr ,bare× 100%
Table III-2 summarizes the protection efficiency of samples with increased loadings
of oMMT in the PBZ-R matrix. Based from the results, even without the addition of
oMMT, the corrosion protection efficiency of PBZ-R is high. But with the addition of
oMMT, the efficiency increases with the 7% oMMT loading the highest after one day
immersion in geothermal brine. The immersion test is further extended up to 7 days
to determine the prolonged exposure of the coating in geothermal brine. Clay and
rubber have a tendency to swell because of the uptake of water. This swelling will
cause the coating to fail since water might infiltrate the polymer matrix and reach
the metal surface which, due to its aggresive chemistry as a geothermal brine, will
corrode the metal. Under the film corrosion can occur even if the coating looks
intact. But based on the results, the corrosion protection efficiencies increased even
at longer immersion with both 5% and 7% oMMT loading being the most resistant
to acid geothermal brine. The corrosion efficiency of the bare metal steel was
increased because of the formation of a passive layer that retards the effect of
corrosion. This is the same true for the coated samples. This passive layer could be
the formation of silica film. In acidic condition, silica is in its monomeric form and
does not usually precipitate out of the solution. However, given an ample enough
time and the hydroxyl group of the corroded metal, monomeric silica will deposit on
the corroded surface of the metal. With the protection efficiencies alone, it seems
that there is no significant difference from the varying loadings of oMMT in the
polymer matrix.

61
To further investigate this, EIS test was conducted. EIS involves the application of a
small sinusoidal perturbation to a sample under examination and the impedance
modulus (z) is recorded as a function of the frequency (f). The analysis of the
frequency behavior of the impedance allows the determination of the corrosion
mechanism and the robustness of the coating. To evaluate the performance of the
coating, the impedance of the coating at the low frequency is observed. The higher
the impedance at the low frequency region, the more effective the coating. The semi-
circle shape of the curves shown in the Nyquist plot(Fig III-5a) suggests that the PBZ
coatings are all both capacitive and resistive. The diameter of the semicircle gives
the charge-transfer resistance at the electrode/electrolyte interface from which the
double-layer capacitance can be calculated. As seen on the plot, the diameter of
semicircle increases with increasing MMT content which implies that the charge-
transfer resistance increases with the MMT loading but only up to an optimum
amount after which it decreases again. For this case, the optimum loading of MMT is
at 5%. The Bode and Nyquist plots shown in Fig.III-5 supports the result of the
corrosion rates with the 5% oMMT having the highest impedance at the low
frequency region. Despite the insignificant difference of the corrosion rate results of
the EIS, the plots of Bode and Nyquist show that there is a significant difference of
the impedance values of the varying amount of oMMT in the polymer
nanocomposite. Also evidenced by the results is that there is an optimum loading of
-3 -2 -1 0 1 2 3 4 5 6
1.0
1.5
2.0
2.5
3.0
3.5
4.0
4.5
5.0
5.5
Blank
PBZ-R
PBZ-R-1% MMT
PBZ-R-3% MMT
PBZ-R-5% MMT
PBZ-R-7% MMT
log
Z
log f
0 20000 40000 60000 80000 100000 120000
0
20000
40000
60000
80000
100000
120000
Blank
PBZ-R
PBZ-R- 1% MMT
PBZ-R- 3% MMT
PBZ-R- 5% MMT
PBZ-R- 7% MMT
Z" (c
m2)
Z' (cm2)
2000 4000 6000 8000 10000
2000
4000
Z"
(c
m2)
Z' (cm2)
Figure III-5 a)Nyquist plot and b) Bode plot of polymer/nanocomposite coated CS steel immersed in
simulated geothermal brine for 7 days
a b

62
oMMT in the nanocomposite. At 7% oMMT loading, the corrosion protection
efficiency decreases. This is due to the possible start of the coating failure as shown
by the steep decline of the impedance values as compared to the 5% oMMT. This
optimum value of oMMT loading is also shown by other studies on polymer/clay
nanocomposite. Studies showed that addition of oMMT does enhance the
mechanical properties of the polymer. However, there is an optimum amount such
that adding more than that could cause agglomeration of the fillers which in turn
could defeat the purpose of adding the nanofillers.
7. SEM
Scanning Electron Microscopy (SEM) images were taken (Fig.III.5) to determine the
morphology of the coating prior to immersion and to further verify the integrity of
the coatings after 7-day immersion as shown in the figure below. Though the
samples are immersed in simulated geothermal brine, a carbon steel sample in
immersed in 0.5 M NaCl is also shown here to illustrate how extensive corrosion in
geo brine is. There is an apparent difference on the morphology of the metal where
there is obvious metal dissolution but at the same time a film deposition on the
surface. This observation supports the explanation offered beforehand regarding
the increase of the protection efficiency as immersion time is increased. This
however should further be validated using XPS or EDX to determine if it is indeed
silica that passivate the immersed samples. Before immersion, the PBZ-R and PBZ-
R-5MMT coatings are almost indistinguishable having smooth surface. But after 7
day immersion, the one with 5%MMT has retained its smooth surface with no
visible sign of damage or corrosion. The PBZ-R coating has shown damage and signs
of corrosion. There is also signs of deposition or presence of corrosion products
which should be verified by XPS or EDX studies. These observations have further
verify the results of electrochemical tests conducted.

63
Figure III-6 SEM images of a) bare carbon steel b) PBZ-R c) PBZ-R-5MMT before immersion in geothermal brine, d) bare steel immersed in NaCl, e)bare steel f) PBZ-R g)PBZ-R-5MMT immersed in geothermal brine for 7 days, and optical images of PBZ-R-5MMT h)before immersion i) after immersion in simulated geothermal brine for 7 days.
8. EFFECT OF TEMPERATURE
Since the composite coating is intended to be coated on geothermal components
affected by severe corrosion, the integrity of the composite is evaluated under high
temperature condition by electrochemical study. The samples were immersed
separately in acidic geothermal brine in a HT/HP vessel from room temperature up
to 300°C for 3 hours.
a b c
d e f
g h i
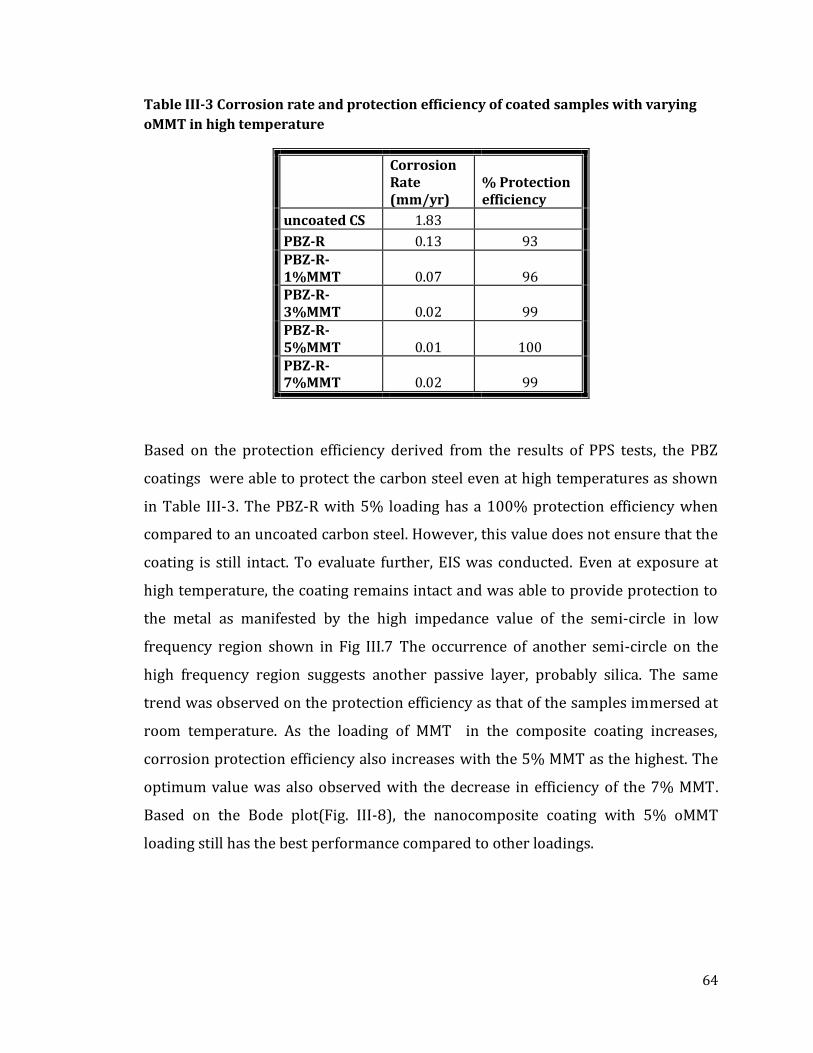
64
Table III-3 Corrosion rate and protection efficiency of coated samples with varying
oMMT in high temperature
Corrosion Rate (mm/yr)
% Protection efficiency
uncoated CS 1.83 PBZ-R 0.13 93
PBZ-R-1%MMT 0.07 96 PBZ-R-3%MMT 0.02 99 PBZ-R-5%MMT 0.01 100 PBZ-R-7%MMT 0.02 99
Based on the protection efficiency derived from the results of PPS tests, the PBZ
coatings were able to protect the carbon steel even at high temperatures as shown
in Table III-3. The PBZ-R with 5% loading has a 100% protection efficiency when
compared to an uncoated carbon steel. However, this value does not ensure that the
coating is still intact. To evaluate further, EIS was conducted. Even at exposure at
high temperature, the coating remains intact and was able to provide protection to
the metal as manifested by the high impedance value of the semi-circle in low
frequency region shown in Fig III.7 The occurrence of another semi-circle on the
high frequency region suggests another passive layer, probably silica. The same
trend was observed on the protection efficiency as that of the samples immersed at
room temperature. As the loading of MMT in the composite coating increases,
corrosion protection efficiency also increases with the 5% MMT as the highest. The
optimum value was also observed with the decrease in efficiency of the 7% MMT.
Based on the Bode plot(Fig. III-8), the nanocomposite coating with 5% oMMT
loading still has the best performance compared to other loadings.

65
0 20000 40000 60000 80000 100000
0
5000
10000
15000
PBZ-R
PBZ-R-1MMT
PBZ-R-3MMT
PBZ-R-5MMT
PBZ-R-7MMT
Z"
Z'
Figure III-7 Nyquist plot of samples coated by varying amount of MMT immersed in
hot acidic geothermal brine.
-3 -2 -1 0 1 2 3 4 5 6
2.4
2.6
2.8
3.0
3.2
3.4
3.6
3.8
4.0
4.2
4.4
4.6
4.8
5.0
5.2 PBZ-R
PBZ-R-1MMT
PBZ-R-3MMT
PBZ-R-5MMT
PBZ-R-7MMT
log
Z
log frequency
Figure III-8 Bode plot of PBZ-R coating with varying loading of oMMT immersed in hot
acidic geothermal brine.

66
The mechanism of improved corrosion protection by the addition of clay
nanoparticles is due to the tortous path they create which delays the diffusion of
corrosive species through the coating towards the metal surface as illustrated by the
figure below.
Figure III-9 Protection mechanism of clay nanoparticles dispersed in a polymer
matrix.
Corrosive medium
Metal surface

67
IV. CONCLUSION
Geothermal technology has gained wide attention as a new source of renewable
energy that would decrease the dependence on fossil fuels and is more environment
friendly. Its optimum utilization, however, is limited by massive scaling and
accelerated corrosion. Solutions for these problems are often reactive such as
regular preventive maintenance and replacement for scaling and corrosion affected
components, respectively. A proactive way to solve these problems is by utilizing
polymers designed for geothermal brine chemistry. In this study, two different
types of polymer application, an inhibitor and a coating, were applied for the
corrosion protection of carbon steel in acidic geothermal brine.
Polyvinylpyrrolidone(PVP) was used as a corrosion inhibitor while a
nanocomposite composed of Polybenzoxazine, rubber and organically modified
montmorillonite (PBZ-R-oMMT) was synthesized to be used as a coating.
This study was able to determine the inhibitor concentration at which the PVP is
soluble in the acidic geothermal fluid by a simple solubility technique using Tyndall
effect. The corrosion rate of carbon steel in acidic geothermal fluid in the presence
of varying molecular weight of polymeric inhibitor was determined and evaluated.
For this study, inhibition efficiency increases as MW increases since it is only
dependent on the surface area of the metal covered by the PVP. The real time
change in the corrosion rate of carbon steel in acidic geothermal fluid in the
presence of varying concentration of the polymeric inhibitor was observed. The
decrease in the corrosion rate as immersion time is prolonged is due to the gradual

68
formation of silica layer as promoted by the PVP formed on the metal surface. The
effect of temperature on the corrosion rate of carbon steel in acidic geothermal fluid
in the presence of varying concentration of the polymeric inhibitor was also
considered to determine the applicability of PVP in actual geothermal systems.
Evem at high temperature and pressured conditions, PVP was still able to inhibit the
corrosion process. A possible mechanism of corrosion inhibition action of the
polymeric inhibitor is proposed based on the results of the analysis made
throughout the course of the study.
Successful fabrication of a polymer nanocomposite coating of PBZ modified with
rubber with varying amounts of oMMT was made. The enhancement of the
mechanical properties of PBZ-R by addition of MMT by its intercalation/exfoliation
into the polymer matrix was supported by XRD, thermogravimetric tests, hardness
test, and adhesion tests. Results of electrochemical measurements showed that the
nanocomposite coatings exhibited good anti-corrosion property. PBZ-R alone
offered corrosion protection to the carbon steel in acidic geothermal brine. This is
due to the low water absorption capability of PBZ which prevents the corrosive fluid
to penetrate into the coating. Addition of oMMT further increased the corrosion
protection of the nanocomposite coating with an optimum loading of 5 % MMT.
Addition of more than this amount would lead to agglomeration of nanofillers that
would in turn negatively affect the mechanical properties of the nanocomposite as
manifested by the hardness test. The stability and the protection efficiency was also
evaluated under high temperature and high pressure. Based on the result, the PBZ-
R-MMT nanocomposite was proven to be effective in protecting the steel even at

69
HT/HP conditions. This is due to the stability of the coating at the tested condition
as supported by the thermal tests conducted.
V. RECOMMENDATION
Despite the satisfactory results obtained from the studies conducted, it is still
recommended to extend the study to dynamic conditions to simulate the actual line
condition. Kinetics play a major role in various processes in the geothermal
industry. It could have a significant effect on the inhibition and protection
efficiencies of the tested polymeric materials.
A longer immersion time is also recommended to obtain a more accurate corrosion
rates, especially in conducting weight loss analysis.
Comparative study of the performance of the nanocomposite synthesized with
available coatings in the market is also recommended to further justify its
application in acidic geothermal environment.

70
VI. REFERENCES
1. Bertani, R. (2010). Geothermal Power Generation in the World 2005-2010 Update
Report. World Geothermal Congress 2010. Bali, Indonesia.
2. Valdez, B., Schorr, M., Quintero, M., Carillo, M., Zlatev, R., Stoytcheva, M., et al.
(2009). Corrosion and scaling at Cerro Prieto geothermal field. Anti-corrosion
Methods and Materials , 28-34.
3. Casper, L.A. and Pinchback, T.R., (eds.), 1980, Geothermal scalingand corrosion:
Philadelphia, American Society for Testing and Materials, 262 p. (ASTM, 1916 Race
St., Philadelphia, PA 19103)
4. Jordan, O., Borromeo, C., Reyes, R., & Ferrolino, S. (2000). A Technical and Cost
Assessment of Silica deposition in the Palinpinon-I geothermal field, Philippines,
over 16 years of production and reinjection. World Geothermal Congress. Kyushu-
Tohoku, Japan.
5. See, F. S. (2010). Silica Inhibitor Hot Injection Test at Bacman Geothermal
Production Field, Botong, Philippines. World Geothermal Congress. Bali, Indonesia.
6. Horsup, D., Clark, J., Binks, B., Fletcher, P., & Hicks, J. (2007). I Put it in, But where
does it go?"- The fate of corrosion inhibitors in multiphase systems. NACE Corrosion
Conference and Expo. Houston, Texas: NACE
7. Panopio, A., Solis, R., & Fragata, J. (2008). F3680 Silica Inhibitor Testing in Botong
Sector, Bacon-Manito Geothermal Production Field, Philippines. GRC Transactions,
(pp. 231-236).
8. Mejorada, S., & Garcia, A. (2001). Geogard SX: A Silica Scale Inhibitor for
Geothermal Brine. Geothermal Resources Council Transactions , 15-21.
9. Siega, F., Herras, E., & Buning, B. (2005). Calcite Scale Inhibition: The Case of
Mahanagdong Wells in Leyte Geothermal Production Field, Philippines. World
Geothermal Congress. Antalya, Turkey.
10. Remoroza, A., Doroodchi, E., & Moghtaderi, B. (2010). Corrosion Inhibition of
Acid-Treated Geothermal Brine- results from Pilot Testing in Southern Negros,
Philippines. World Geothermal Congress 2010. Bali, Indonesia.
11. Ramos-Candelaria, M. N. (2000). Calcite Inhibition Field Trials at MIndanao
Geothermal Production Field (MGPF). World Geothermal Congress.

71
12. Arthur, D., Jonathan, A., Ameh, P., & Anya, C. (2013). A review on the assessment
of polymeric materials used as corrosion inhibitor if metals and alloys. International
Journal of Industrial Chemistry , 1-9.
13. Nogara, J., & Zarrouk, S. (2014). Evaluation of corrosion resistant alloys as
construction material for acidic geothermal wells. New Zealand Geothermal
Workshop 2014 Proceedings, (pp. 1-14). Auckland.
14. Amend, B., & Yee, J. (2013). Selective application of corrosion resistant alloys
mitigates corrosion in pH-modified geothermal fluids. Corrosion Conference and
Expo.
15. Wang, L., Wang, K., Chen, L., Zhang, Y.,He, C.(2006) Preparation,morphology and
thermal/mechanical properties of epoxy/nanoclay composite. Composites A,
37:(11)1890–1896
16. Sancaktar,E. Kuznicki J.(2011) Nanocomposite adhesives: mechanical behavior
with nanoclay.International Journal of Adhesion and Adhesives, 31:(5)286–300,
17. Keyoonwong,W., Kubouchi, M., Sakai,T., Aoki, S. (2009) Preparation of exfoliated
epoxy/clay nanocomposite and its thermal & mechanical properties. Proceedings of
the International Symposium on Engineering, Energy and Environment (ISEEE09 ’09),
pp. 158–163, Rayong, Thailand.
18. Abacha, N., Sakai,T., Tsuda, K.,Kubouchi,M.(2007) Preparation and performance
under corrosive environment of epoxynanocomposite. Key Engineering Materials,
353–358:(3)2167–2170
19. Yeh,J., Huang, H., Chen, C., Su, W.,Yu,Y. (2006) Siloxane-modified epoxy resin-
clay nanocomposite coatings with advanced anticorrosive properties prepared by a
solution dispersion approach. Surface and Coatings Technology, 200:( 8) 2753–2763,
2006.
20. de Leon, A., Pernites, R., & Advincula, R. (2012). Superhydrophobic Colloidally
Textured Polythiophene Film as Superior Anticorrosion Coating. Applied Materials
and Interfaces , 4: 3169−3176.
21. Gu, X., & Qiu, F. (2013). Synthesis and application of terpolymer scale inhibitor in
the presence. Journal of Petroleum Science and Engineering , 109:177-186.
22. Guo, X., Qiu, F., Dong, K., Rong, X., He, K., Xu, J., et al. (2014). Preparation and
application of copolymer modified with the palygorskite. Applied Clay Science ,
99:187-193.

72
23. Guo, X., Qiu, F., Dong, K., XZhou, X., Qi, J., Zhou, Y., et al. (2012). Preparation,
characterization and scale performance of scale inhibitor copolymer modification
with chitosan. Journal of Industrial and Engineering Chemistry , 18:2177-2183.
24. Amjad, Z., & Koutsoukos, P. (2014). Evaluation of maleic acid based polymers as
scale inhibitors. Desalination , 335:55-63.
25. Jensen, M., & Kelland, M. (2012). A new class of hyperbranched polymeric scale
inhibitors. Journal of Petroleum Science and Engineering , 95: 66-72.
26. Spinthaki, A., Stathoulopoulou, A., & Demadis, K. (2015). The interplay between
cationic polyethyleneimine and anionic polyelectrolytes for the control of silica scale
formation in process waters. International Journal of Corrosion and Scale Inhibition ,
2:125-138.
27. Gill, J. S. (2008). Scale Control in Geothermal Brines. Transactions of Geothermal
Resources Council 2008 Annual meeting.
28. Gu, T., Liu, X., Chai, W., Li, B., & Sun, H. (2014). A preliminary research on
polyvinyl alcohol hydrogel: A slowly-released anti-corrosion and scale inhibitor.
Journal of Petroleum Science and Engineering , 122:453-457.
29. Mundhenk, H., Sanjua, B., Kohl, S., & Zorn, R. (2013). Corrosion and scaling as
interrelated phenomena in an operating geothermal power plant. Corrosion Science ,
17-28.
30. Iler, R. (1979). The Chemistry of Silica; Solubility, Polymerization, Colloid and
Surface Properties and Biochemistry of Silica. John Wiley & Sons.
31. Kim, H., & Hwang, T. (2012). Corrosion protection enhancement effect by mixed
silica nanoparticles of different sizes incorporated in a sol-gel silica film. . J Sol-Gel
Sci Technol , 63:563-568.
32. Kumaraguru, S., Veeraraghavan, B., & Popov, B. (2006). Development of an
Electroless Method to Deposit Corrosion-Resistant Silicate Layers on Metallic
Substrates. Journal of the Electrochemical Society , 153:253-259.
33. Khelifa, F., Druart, M., Habibi, Y., Benard, F., Leclere, P., Olivier, M., et al. (2013).
Sol-gel incorporation of silica nanofillers for tuning the anti-corrosion protection of
acrylate-based coatings. Progress in Organic Coatings , 76: 900-911.
34. Emamgholizadeha, A., Rostamia, A., Omrania, A., & Rostamib, A. (2015).
Performance of EP/PpPDA and EP/PpPDA/SiO2 nanocomposite on corrosion

73
inhibition of steel in hydrochloric acid solution. Progress in organic Coatings , 82: 7-
16
35. Remoroza, A., Mejorada, A., & Salazar, A. (2008). Field Testing of pH Modification
Silica Inhibition with Chemical Corrosion Inhibition. Thiry-Third Workshop on
Geothermal Reservoir Engineering. Stanford, California.
36. Hermannsson, S. (1970). Corrosion of Metals and the Forming of a Protective
Coating on the Inside of Pipes Carrying Thermal Waters Used by the Reykjavik
Municipal Distrcit Heating Service. Geothermics , 2:1602-1612.
37. Lehrman, L., & Shuldener, H. (1952, August). Action of sodium silicate as a
corrosion inhibitor in water piping. Industrial and Engineering Chemistry ,
44(8):1765- 1769.
38. Arthur, D., Jonathan, A., Ameh, P., & Anya, C. (2013). A review on the assessment
of polymeric materials used as corrosion inhibitor if metals and alloys. International
Journal of Industrial Chemistry , 1-9.
39. Antonijevic, M., & Petrovi, M. (2008). Int.J.Electrochem.Sci , 1.
40. El-Maksuod, S. (2008). Int.J.Electrochem.Sci, 3 , 275.
41. Zheludkevich, Sachukin, & Yasakav. (2007). Anticorrosionn coatings with self-
healing effect based on Nanocontainers impregnated with corrosion inhibitor.
Chemistry of materials , 3: 402-411.
42. Thomas, G. (1981). Some new fundamental aspects in corrosion inhibition. 5th
Euro. SYmp. Corr. Inhibitors, (p. 453). Ferrara, Italy.
43. Umoren, S., Ogbobe, O., Igwe, I., & Ebenso, E. (2008). Inhibition of Mild steel
corrosion in acidic medium using synthetic and naturally occuring polymers and
synergistic halide additives. Corr.Sci.,50(7) , 1998-2006.
44. Manimaran, N., Rajendran, S., Manivanan, M., & John Mary, S. (2012). Corrosion
Inhibition of Carbon Steel By polyacrylamide. Res.J.Chem.Sci , 2(3), 52-57.
45. Finsgar, M., & Jackson, J. (2014). Application of corrosion inhibitors for steels in
acidic media for the oil and gas industry: A review. Corr.Sci. , 86, 17-41.
46. Jing, C., & Hou, J. (2007). Sol-Gel derived Alumina/PVP hybrid nanocomposite
film on metal for corrosion resistance. Journal of Apllied Polymer Science , 105: 697-
705.

74
47. Graf, C., Vossen, D., Imhof, A., & van Blaaderen, A. (2003). A general method to
coat colloidal particles with silica. Langmuir , 19: 6693-6700.
48. Lopez, A., Urena, A., & Rams, J. (2009). Surf Coat Technol , 203:1474-1480.
49. Pech, D., Steyer, P., & Millet, J. (2008). Corros Sci , 50:1492-1497.
50. Kim, H., & Hwang, T. (2012). Corrosion protection enhancement effect by mixed
silica nanoparticles of different sizes incorporated in a sol-gel silica film. . J Sol-Gel
Sci Technol , 63:563-568.
51. Daouadji, M. M., & Chelali, N. (2003). Influence of Molecular weight of Poly(otho-
ethoxyaniline) on the corrosion inhibition efficiency of mild steel in acidic media.
Journal of Applied Polymer Science , 91: 1275-1284.
52. Al Juhaiman, L., Mustafa, A., & Mekhamer, W. (2012). Int.J.Electrochem.Sci.,7 ,
8578-8596.
53. Salehi, M., Nasr-Esfahani, M., Sharifian-Esfahani, A., & Ekramian, E. (2011).
Magnetite/Polyvinylpyrrolidone Nanocomposite: Green Simple Fabrication and
Characterization. 2nd International Conference on Chemistry and Chemical
Engineering (pp. 174-177). Singapore: IACSIT Press.
54. Hermannsson, S. (1970). Corrosion of Metals and the Forming of a Protective
Coating on the Inside of Pipes Carrying Thermal Waters Used by the Reykjavik
Municipal Distrcit Heating Service. Geothermics , 2:1602-1612.
55. Iler, R. (1979). The Chemistry of Silica; Solubility, Polymerization, Colloid and
Surface Properties and Biochemistry of Silica. John Wiley & Sons.
56. Remoroza, A., Mejorada, A., & Salazar, A. (2008). Field Testing of pH Modification
Silica Inhibition with Chemical Corrosion Inhibition. Thiry-Third Workshop on
Geothermal Reservoir Engineering. Stanford, California.
57. Demadis, K., & Neofotistiu, E. (2004). Inhibition and Growth Control of Colloidal
Silica: Designed Chemical Approaches. Materials Performance , 38-41.
58. Sanchez, D., Herras, E., Siega, F., S. N., Nogara, J., & Sambrano, B. Evaluation of
NaOH Injection into Acid Wells of Leyte Geothermal Production Field and MIndanao 1
Geothermal Project: The Case of MG9D and KN2D Wells. Makati: EDC.

75
59. Vallejos-Ruiz, O., S.-R. E., & Gonzalez-Vargas, C. (2005). Reservoir Management in
the Miravalles Geothermal Field, Costa Rica. Proceedings Geothermal World Congress
(pp. 1-8). Antalya: International Geothermal Association.
60. Ishida, H., Agag, T., Eds. Handbook of Benzoxazine Resins; Elsevier, 2011
61. Zhou, C., Lu, X., Xin, Z., & Liu, J. (2013). Corrosion resistance of novel silane-
functional polybenzoxazine coating on steel. Corrosion Science , 70, 145-151.
62. Ishida, H.; Allen, D. J.. J. Polym. Sci, Part B: Polym. Phys.1996,34, 1019-1030.
63. Jang, J., & Yang, H. (2000). Toughness improvement of carbon-
fibre/polybenzoxazine composites by rubber modification. Composites Science and
Technology , 60 (3), 457-463.
64. Hung, W.,Chang,K., Chang,,Y.,Yeh,J. (2011). Advanced anticorrosive coatings prepared from polymer-clay nanocomposite materials, in: B. Reddy (Ed.), Advances in Nanocomposites—Synthesis, Characterization and Industrial Applications, InTech, ISBN: 978-953-307-165-7 65. Lan, T.; Kaviratna, P. D. & Pinnavaia, T. (1994). On the Nature of Polyimide-Clay Hybrid Composites. J. Chem. Mater.. 6, 573-575. 66. Tyan, H. -L.; Liu, Y. -C. & Wei, K. -H. (1999). Thermally and Mechanically Enhanced Clay/Polyimide Nanocomposite via Reactive Organoclay. Chem. Mater. 11, 1942- 1947. 67.Wang, K. H.; Choi, M. H.; Koo, C. M.; Choi, Y. S. & Chung, I. J. (2001). Synthesis and characterization of maleated polyethylene/clay nanocomposites. Polymer, 42, 9819- 9826. 68. Azeez,A., Rhee,K., Park, S., Hui,D.(2012). Epoxy clay nanocomposites- processing, properties and applications: A review. Composites Part B 69. Manias, E, A Touny, L Wu, K Strawhecker, B Lu, and C Chung. Chem.Mater., 2001:
13:3516-3523.
70. Alexander, M., & Dubois, P. (2000). Polymer-layered silicate nanocomposites:
preparation, properties, and uses of a new class of materials. Materials Science
Engineering , 28, 1-63.
71. Karickhoff, S., & Bailey, G. (1973). Clays and Clay Minerals , 21:59-70. 72. Corcione, C., & Frigione, M. (2012). Materials , 5:2960-2980.

76
73. Yang, K. K.; Wang, X. L. & Wang, Y. Z. (2007). Progress in nanocomposite of biodegradable polymer. J. Ind. Eng. Chem. 13, 485-500. BIBLIOGRAPHY \l 1033 Allen, D., & Ishida, H. (2009). Effect of phenol substitution
on the network structure and properties of linear aliphatic diamine-based
benzoxazines. Polymer , 50 (2), 613-626.
74. Allen, D., & Ishida, H. (2006). Physical and Mechanical Properties of Flexible
Polybenzoxazine Resins: Effect of Aliphatic Diamine Chain Length. Journal of Applied
Polymer Science , 101, 2798-2809.
75. Antonijevic, M., & Petrovi, M. (2008). Int.J.Electrochem.Sci , 1.
76. Jang, J., & Yang, H. (2000). Toughness improvement of carbon-
fibre/polybenzoxazine composites by rubber modification. Composites Science and
Technology , 60 (3), 457-463.
77. Lee, Y., Allen, D., & Ishida, H. (2006). Effect of Rubber Reactivity on the
Morphology of Polybenzoxazine Blends Investigated by Atomic Force Microscopy
and Dynamic Mechanical Analysis. Journal of Applied Polymer Science , 100, 2443-
2454.
78. Liu, H., Su, W., & Liu, Y. (2011). Self-assembled benzoxazine-bridged
polysilsesquioxanes exhibiting ultralow-dielectric constants and yellow-light
photoluminescent emission. J. Mater. Chem. , 21, 7182-7187.
79. Lopez, A., Urena, A., & Rams, J. (2009). Surf Coat Technol , 203:1474-1480.
80. Malik, M., Ali Hashim, M., Nabi, F., & AL-Thabait, S. (2011). Int.J.Electrochem.Sci.,
6 , 1927-1948.
81. Sperling, L. H. (2006). Introduction to physical polymer science (Fourth ed.). John
Wiley & Sons, Inc.
82. Strehblow, H., & Marcus, P. (2012). Fundamentals of corrosion. In P. Marcus,
Corrosion mechanisms in theory and practice. Taylor and Francis Group.
83. Swift, G., Carraher, C., & Bowman, C. (1997). Polymer modification. Springer.
84. Takeichi, T., Kano, T., & Agag, T. (2005). Synthesis and thermal cure of high
molecular weight polybenzoxazine precursors and the properties of the thermosets.
Polymer , 46, 12172-12180.

77
85. Wang, C., Su, Y., Kuo, S., Huang, C., Sheen, Y., & Chang, F. (2006). Low-surface-
free-energy materials based on polybenzoxazines. Angew. Chem. Int. Ed. , 45, 2248-
2251