Understanding Corrosion Protection Requirements for ... - DTIC
169
SERDP-WP-2144 ● SEPTEMBER 2016 Strategic Environmental Research and Development Program Understanding Corrosion Protection Requirements for Adhesive Bond Primers WP-2144 Diane Kleinschmidt Naval Air Warfare Center, Aircraft Division Patuxent River, MD 20670 DISTRIBUTION STATEMENT A. Approved for public release; distribution is unlimited.
-
Upload
khangminh22 -
Category
Documents
-
view
1 -
download
0
Transcript of Understanding Corrosion Protection Requirements for ... - DTIC

SERDP-WP-2144 ● SEPTEMBER 2016
Strategic Environmental Research and Development Program
Understanding Corrosion Protection Requirements for Adhesive Bond Primers
WP-2144 Diane Kleinschmidt Naval Air Warfare Center, Aircraft Division Patuxent River, MD 20670 DISTRIBUTION STATEMENT A. Approved for public release; distribution is unlimited.

Disclaimers
The findings in this report are not to be construed as an official Department of the Defense position unless so designated by other authorized documents. Use of Government drawings, specifications, or other data included in this document does not in any way obligate the U.S. Government. Citation of manufacturer’s or trade names does not constitute an official endorsement or approval of the use thereof. This report is published in the interest of scientific and technical information exchange and its publication does not constitute the Government’s approval or disapproval of its ideas or findings. DESTRUCTION NOTICE—For classified documents, follow the procedures in DOD 5220.22-M, National Industrial Security Program Operating Manual, Chapter 5, Section 7, or DOD 5200.1-R, Information Security Program Regulation, C6.7. For unclassified, limited documents, destroy by any method that will prevent disclosure of contents or reconstruction of the document.

SERDP-WP-2144 ● JULY 2016
Strategic Environmental Research and Development Program
Understanding Corrosion Protection Requirements for Adhesive Bond Primers
WP-2144 by Diane Kleinschmidt Naval Air Warfare Center, Aircraft Division
James Mazza / Kevin Tienda Air Force Research Laboratory, Materials and Manufacturing Directorate
Robert Jensen Weapons and Materials Research Directorate, US Army Research Laboratory
John Stropki / Vinay Gadkari Battelle Memorial Institute
Mark Jaworowski / Weilong Zhang United Technologies Research Center
Kay Blohowiak / Eileen Kutscha Boeing Company DISTRIBUTION STATEMENT A. Approved for public release; distribution is unlimited.

ii
REPORT DOCUMENTATION PAGE Form Approved OMB No. 0704-0188
Public reporting burden for this collection of information is estimated to average 1 hour per response, including the time for reviewing instructions, searching existing data sources, gathering and maintaining the data needed, and completing and reviewing the collection information. Send comments regarding this burden estimate or any other aspect of this collection of information, including suggestions for reducing the burden, to Department of Defense, Washington Headquarters Services, Directorate for Information Operations and Reports (0704-0188), 1215 Jefferson Davis Highway, Suite 1204, Arlington, VA 22202-4302. Respondents should be aware that notwithstanding any other provision of law, no person shall be subject to any penalty for failing to comply with a collection of information if it does not display a currently valid OMB control number. PLEASE DO NOT RETURN YOUR FORM TO THE ABOVE ADDRESS.
1. REPORT DATE (DD-MM-YYYY)
15-07-2017
2. REPORT TYPE
SERDP Final Report3. DATES COVERED (From - To)
March 2011 – March 2016 4. TITLE AND SUBTITLE
Understanding Corrosion Protection Requirements for Adhesive Bond Primers WP-2144
5a. CONTRACT NUMBER
5b. GRANT NUMBER
5c. PROGRAM ELEMENT NUMBER
6. AUTHOR(S)
Diane Kleinschmidt, James Mazza, Robert Jensen, Mark Jaworowski, Weilong Zhang, John Stropki, Vinay Gadkari, Kevin Tienda, Kay Blohowiak, and Eileen Kutscha
5d. PROJECT NUMBER
5e. TASK NUMBER
5f. WORK UNIT NUMBER
7. PERFORMING ORGANIZATION NAME(S) AND ADDRESS(ES)
Naval Air Warfare Center, Aircraft Division Patuxent River, MD 20670-1908
8. PERFORMING ORGANIZATION REPORTNUMBER
9. SPONSORING/MONITORING AGENCY NAME(S) AND ADDRESS(ES)
Strategic Environmental Research and Development Program (SERDP) 4800 Mark Center Drive, Suite 17D08 Alexandria, VA 22350-3605
10. SPONSOR/MONITOR'S ACRONYM(S)
11. SPONSOR/MONITOR'S REPORT NUMBER(S)
12. DISTRIBUTION/AVAILABILITY STATEMENT
DISTRIBUTION STATEMENT A. Approved for public release; distribution is unlimited.
13. SUPPLEMENTARY NOTES
14. ABSTRACT
Based on tests conducted in this project, hexavalent chromium corrosion inhibitors in adhesive bond primers were found to have less significance than expected for adhesive bondline environmental durability. Cytec BR 6747-1 (chromated) and BR 6747-1NC (noninhibited) were the basis primers for testing and analysis. Additional tests using 3M EW-5000 (chromated), 3M EW-5000ET (non-chromate inhibitor), and EW-5000-NC (experimental, noninhibited) primers served to validate results. Test configurations included aluminum wedge crack extension and double cantilever beam specimens bonded with epoxy film adhesives, which were exposed to long-term marine atmospheric and accelerated indoor corrosion environments. Samples also underwent mechanical and electrochemical stress cycles and were subsequently post-analyzed for failure mode, moisture ingress, and corrosion. Many of the traditional and novel tests conducted during the effort did not show significant differences between chromated and nonchromated bond primers in adhesive bondlines. Though certain rigorous tests used to qualify materials and processes for bonded joints did show chromated primers provide a positive contribution to environmental durability, even these tests revealed surface preparation is the dominant factor for aluminum bonded joint environmental durability performance. 15. SUBJECT TERMS
Adhesive, adhesive bond primer, hexavalent chromium, chromate, environmental durability, aluminum, bonding
16. SECURITY CLASSIFICATION OF:17. LIMITATION
OF
ABSTRACT
18. NUMBER
OF PAGES
19a. NAME OF RESPONSIBLE PERSON
Diane Kleinschmidt a. REPORT
Unclassified
b. ABSTRACT
Unclassified
c. THIS PAGE
Unclassified
19b. TELEPHONE NUMBER (Include area code)
301-342-8094Standard Form 298 (Rev. 8/98)
Prescribed by ANSI Std. Z39.18
169
WP-2144
WP-2144
WP-2144

iii
Table of Contents
Table of Contents ........................................................................................................................... iii
List of Figures ................................................................................................................................ iv
List of Tables ............................................................................................................................... xiii
1 Abstract ...................................................................................................................................1 1.1 Objectives ......................................................................................................................1 1.2 Technical Approach .......................................................................................................1 1.3 Results ............................................................................................................................2 1.4 Benefits ..........................................................................................................................2
2 Objective .................................................................................................................................3
3 Background .............................................................................................................................3
4 Materials and Methods ............................................................................................................8 4.1 Materials ........................................................................................................................9 4.2 Methods..........................................................................................................................9
4.2.1 Bonded Joint Test Analysis ................................................................................9
4.2.2 Environmental Analysis ...................................................................................10
4.2.3 Electrochemical Analysis .................................................................................12 4.3 Results and Discussion ................................................................................................12
4.3.1 Bonded Joint Testing ........................................................................................12
4.3.2 Electrochemical Analysis .................................................................................56
4.3.3 Bondline System Element Analysis .................................................................87
5 Conclusions and Implications for Future Research/Implementation ....................................88 5.1 Requirements development and documentation ..........................................................88
5.1.1 Common requirements and test protocol ..........................................................88
5.1.2 Relevance of beyond bondline application testing/requirements .....................89
5.1.3 B-CRAT ............................................................................................................89
5.1.4 B-CRAT Concept Demonstration ....................................................................90
5.1.5 Transition path to non-chromate/noninhibited primers ....................................94
Appendix A ....................................................................................................................................96
In-Service Bondline Failures .........................................................................................................96
A.1 Identify/Characterize in-service applications and bondline failures ............................96 A.1.1 In-service applications .......................................................................................96 A.1.2 Honeycomb Core ...............................................................................................97
Appendix B ..................................................................................................................................103
WCET and DCB Assembly Procedures ......................................................................................103 B.1 WCET Specimen Fabrication ....................................................................................103 B.2 DCB Specimen Fabrication .......................................................................................104
Appendix C ..................................................................................................................................110
Scope of bond primer usage – OEM and repair ...........................................................................110
iv
Appendix D ..................................................................................................................................112
Supplemental WCET and DCB Multivariate Analysis Results ...................................................112 D.1 WCET Analysis – Crack growth versus crack growth rate .......................................112 D.2 WCET Response Screening Model – Crack Growth vs Crack Growth Rate ............112 D.3 WCET Analysis – Crack Growth vs Crack Growth Rate (Cytec and 3M Primers) ..114D.4 WCET Response Screening Model – Crack Growth vs Crack Growth Rate (Cytec and
3M Primers) ...............................................................................................................116 D.5 WCET Analysis – Crack Growth vs Crack Growth Rate (GBSG/Abrasive Pad) .....123 D.6 DCB Marine Atmospheric Exposure – Surface Preparation .....................................125 D.7 DCB Results (Laboratory Testing) ............................................................................126 D.8 DCB Bivariate, Primer and Surface Preparation (Indoor Conditioning) ...................128 D.9 DCB PAA vs Grit Blasting (Laboratory Conditioning) ............................................128 D.10 DCB PAA vs Grit Blasting (Laboratory Temp-Humidity Conditioning) .................132 D.11 DCB PAA vs Grit Blasting (Indoor Neutral Salt Fog Conditioning) ........................134
Appendix E ..................................................................................................................................138
Bondline – Corrosion Risk Assessment Tool (B-CRAT) Development .....................................138 E.1 Original B-CRAT Concept/Framework .....................................................................138 E.2 Modification of the B-CRAT Concept/Framework ...................................................140
Appendix F...................................................................................................................................142
Bondline System Element Analysis .............................................................................................142 F.1 PAA Post-Treatment ..................................................................................................142 F.2 Relative Moisture Uptake of Adhesives ....................................................................144
Acknowledgements ......................................................................................................................148
List of Symbols, Abbreviations, and Acronyms ..........................................................................149
References ....................................................................................................................................151
List of Figures
Figure 1. Wedged Crack Extension Specimen per ASTM D3762 ................................................10
Figure 2. DCB specimen and modified crack extension method ...................................................10
Figure 3: Prohesion (ASTM G85 Annex 5) WCET results (7-wk) crack extension chart ............14
Figure 4: Elevated temp/wet (ASTM D2247) WCET results (9-wk) crack extension chart .........15
Figure 5: Cyclic Salt Spray (SAE J2334) WCET results (9-wk) crack extension chart ................15
Figure 6: Neutral Salt Fog, 95ºF (ASTM B117)WCET results (9-wk) crack extension chart .....15
Figure 7: Neutral Salt Fog, 140ºF (ASTM B117) WCET results (9-wk) crack extension chart ...16
Figure 8: Images of selected panels for failure mode evaluation after wedge test ........................17
Figure 9. PAA oxide images for 15% (left) and 100% (right) chromated primer panels .............17
Figure 10: WCET results with variable chromate loading ............................................................18
Figure 11: Indoor WCET specimens, initial Cytec primer screening (BR 6700-1, BR 6747-1, and BR 6747-1NC), all surface treatments, all environmental conditioning factors ...............19

v
Figure 12: YMean (crack growth) versus False Data Rate LogWorth (FDR LogWorth) for initial Cytec primer WCET datasets (BR 6700-1, BR 6747-1, and BR 6747-1NC). R2 = 0.003005, R2 Adjusted = -0.04231, Root Mean Square Error = 5.45162, Mean of Response = 7.8613, Observations (or Sum Wgts) = 24 ...........................................................20
Figure 13: WCET Response Screening Model distribution rankings of the indoor conditioning factor relative to the frequency of FDR LogWorth (with standard error) ..........21
Figure 14: WCET Response Screening Model distribution rankings of the surface preparation relative to the frequency of FDR LogWorth (with standard error) ..........................................21
Figure 15: WCET Response Screening Model distribution rankings of the primer relative to the frequency of FDR LogWorth (with standard error) ...........................................................22
Figure 16 WCET failure surfaces for initial indoor Cytec primer samples (BR 6700-1, BR 6747-1, and BR 6747-1NC), all surface treatments, all environmental conditioning factors. Legibility of identification tags is not critical; figure provides relative condition/failure mode for primer/condition set. .....................................................................23
Figure 17: Exposure Sites at Whidbey Island NAS, WA (a, b) and Canaveral AFS, FL (c, d) ....25
Figure 18: Wet Candle Exposure Fixtures at Whidbey NAS (left) and Canaveral AFS (right) ....25
Figure 19: DCB specimens in environmental chamber .................................................................26
Figure 20. Total crack length data over exposure time at Canaveral for EA 9696 samples fabricated at NAVAIR .............................................................................................................31
Figure 21. Total crack length data over exposure time at Whidbey for EA 9696 samples fabricated at NAVAIR .............................................................................................................32
Figure 22: Total crack length data over exposure time at Canaveral for FM 73M samples fabricated at NAVAIR .............................................................................................................32
Figure 23: Total crack length data over exposure time at Whidbey for FM 73M samples fabricated at NAVAIR .............................................................................................................33
Figure 24: Initial visual mode-of-failure assignments for the DCB marine atmospheric exposure samples. ....................................................................................................................33
Figure 25: Failure mode over exposure period at Canaveral for FM 73M specimens fabricated at NAVAIR .............................................................................................................35
Figure 26: Failure mode over exposure period at Canaveral for EA 9696 specimens fabricated at NAVAIR .............................................................................................................35
Figure 27: Failure mode over exposure period at Whidbey for FM 73M specimens fabricated at NAVAIR ..............................................................................................................................35
Figure 28: Failure mode over exposure period at Whidbey for EA 9696 specimens fabricated at NAVAIR ..............................................................................................................................36
Figure 29: Experimental AMS3695 double cantilever beam sample ............................................36
Figure 30: Fracture energy (GIscc) versus crack length (a) ............................................................37
Figure 31 Outdoor DCB; percent fracture energy lost versus crack growth (Mode-of-failure = cohesive, time = 6 months). 82 samples, average GIscc lost = 6.4% (+/- 4.9%), average crack growth = 21.8mm (+/- 13.8mm) ....................................................................................38

vi
Figure 32 Outdoor DCB; percent fracture energy lost versus crack growth (Mode-of-failure = mixed-mode, time = 6 months). 72 samples, average GIscc lost = 14.9% (+/- 16.9%), average crack growth = 38.4mm (+/- 17.4mm) .......................................................................38
Figure 33 Outdoor DCB; percent fracture energy lost versus crack growth (Mode-of-failure = adhesive, time = 6 months). 95 samples, average GIscc lost = 82.3% (+/- 51.0%), average crack growth = 81.6mm (+/- 21.4mm) .......................................................................39
Figure 34: Outdoor DCB; percent fracture energy lost versus crack growth (Primer = Cytec BR 127 Cr (VI) corrosion inhibiting primer, time = 6 months). Average GIscc lost = 8.1% (+/- 10.1%), average crack growth = 24.7mm (+/- 15.8mm), mode-of failure: sample not observed = 43, cohesive = 77, mixed-mode = 8, adhesive = 0 ................................................39
Figure 35: Outdoor DCB; percent fracture energy lost versus crack growth (Primer = Cytec BR 6747-1 chromate corrosion inhibiting water based primer, time = 6 months). Average GIscc lost = 52.4% (+/- 47.7%), average crack growth = 61.3mm (+/- 32.4mm), mode-of-failure: sample not observed = 48, cohesive = 4, mixed-mode = 32, adhesive = 44 ...............40
Figure 36: Percent fracture energy lost versus crack growth (Primer = Cytec BR 6747-1 NC non-chromate water based primer, time = 6 months). Average GIscc lost = 50.8% (+/- 56.1%), average crack growth = 60.6mm (+/- 28.0mm), mode-of-failure: sample not observed = 44, cohesive = 1, mixed-mode = 32, adhesive = 51 ..............................................40
Figure 37: Percent fracture energy lost versus crack growth (Bivariate with respect to primer and surface preparation, time = 6 months) ..............................................................................41
Figure 38: YMean (% GIscc lost) versus False Data Rate LogWorth (FDR LogWorth) for BR 6747-1 and BR 6747-1NC datasets. R2 = 0.343475, R2 Adjusted = 0.321591, Root Mean Square Error = 20.76483, Mean of Response = 60.97746, Observations (or Sum Wgts) = 32 42
Figure 39 Response Screening Model distribution rankings of the marine atmospheric conditioning sites relative to the frequency of FDR LogWorth (with standard error) ............44
Figure 40 Response Screening Model distribution rankings of the aluminum grade relative to the frequency of FDR LogWorth (with standard error) .......................................................44
Figure 41 Response Screening Model distribution rankings of the GBSG surface preparation process relative to the frequency of FDR LogWorth (with standard error) .........45
Figure 42 Response Screening Model distribution rankings of the bonding primer relative to the frequency of FDR LogWorth (with standard error) ...........................................................45
Figure 43 Response Screening Model distribution rankings of the adhesive relative to the frequency of FDR LogWorth (with standard error) .................................................................46
Figure 44 YMean (% GIscc lost) versus False Data Rate LogWorth (FDR LogWorth) for PAA/BR 127 datasets. R2 = 0.136826, R2 Adjusted = 0.075171, Root Mean Square Error = 5.545829, Mean of Response = 24.68266, Observations (or Sum Wgts) = 16 ...........46
Figure 45 Response Screening Model distribution rankings of the fabrication sites and marine atmospheric conditioning sites relative to the frequency of FDR LogWorth (with standard error) ..........................................................................................................................47
Figure 46 Response Screening Model distribution rankings of the aluminum grade and adhesive relative to the frequency of FDR LogWorth (with standard error) ...........................47

vii
Figure 47 YMean (% GIscc lost) versus False Data Rate LogWorth (FDR LogWorth) for all PAA and Grit Blast datasets (assume constant primer response). R2 = 0.51998, R2 Adjusted = 0.498161, Root Mean Square Error = 18.32931, Mean of Response = 48.87919, Observations (or Sum Wgts) = 24 ..........................................................................48
Figure 48: Response Screening Model distribution rankings of the aluminum grade and adhesive type relative to the frequency of FDR LogWorth (with standard error) ...................48
Figure 49: Response Screening Model distribution rankings of the surface preparation and marine atmospheric conditioning site relative to the frequency of FDR LogWorth (with standard error) ..........................................................................................................................49
Figure 50: Cyclic Stress Durability Stress Wave ...........................................................................54
Figure 51 Cyclic Stress Test Apparatus ........................................................................................55
Figure 52: Cyclic Stress Durability Test Results for EA 9696 ......................................................56
Figure 53:Cyclic Stress Durability Test Results for FM 73 ..........................................................56
Figure 54: EIS spectra (Bode modulus plot), 1BX and 3BX Al samples exposed to 3.5 wt % NaCl solution at OCP...............................................................................................................58
Figure 55: EIS spectra of 3BX film of BR 6747-1 (chromated) Al 7076-T5 sample (E3-1.3BX); Bode plots of impedance modulus (a) and phase angle (b) before and after two individual EC stress steps in 3.5 wt% NaCl solution...............................................................58
Figure 56: EIS spectra of 3BX-primed (BR 6747-1NC, nonchromated) Al 7076-T5 sample (E3-1NC-1.3BX); Bode plots of impedance modulus (a) and phase angle (b) before and after two individual EC stress steps in 3.5wt% NaCl solution. ...............................................58
Figure 57: 3D-optical surface profiler showing non-uniform (discontinuous) (a), and (b) about 0.0002” thick BR 6747-1 bond primer. ..........................................................................60
Figure 58: SVET surface voltage mapping (a), and (b) surface voltage line profile of BR 6747-1 bond primer after ~65 hrs exposure to 350 ppm NaCl solution under open circuit condition. .................................................................................................................................60
Figure 59: Diagram of SVET concept and dimensions .................................................................60
Figure 60: SVET surface potential maps (scan areas 6x6 to 8x8 mm) of different primed Al samples when exposed to 100 to 350 ppm NaCl environment: 1BX nonchromated E3-1NC.1BX (a), 1BX chromated E3-1.1BX (b), UTRC 0% Cr(VI) (c), UTRC 15.85% Cr(VI) (d), UTRC Mixed-100% Cr(VI) (e). ............................................................................63
Figure 61. Post-SVET surface by (a) interferometry and (b) line profile .....................................64
Figure 62. SVET surface potential maps (scan area 3x3-mm) for 1BX-primed sample (E3-1NC.1BX) with exposure time in DI water. ............................................................................64
Figure 63: Post-SVET test coat sample surface (a), and SVET surface potential maps (scan area 6x6-mm) for 1BX chromated primed sample (BR 6747-1, E3-1.1BX) with exposure time in diluted NaCl (~ 350 ppm). ...........................................................................................65
Figure 64: Dynamic SVET surface potential maps (scan area 1x1-mm) for UTRC lab prepared -15.86%Cr(VI) chromated primed sample with exposure time in diluted NaCl (~ 350 ppm). .................................................................................................................................65

viii
Figure 65: SVET surface potential maps (scan area 10x10-mm) for a WCET specimen GBSG/BR 6700 sample exposed to different concentration NaCl environment: (1) 0 ppm, (2) 10 ppm, (3) 20 ppm, and (4) 100 ppm. ..............................................................................66
Figure 66: SVET surface potential maps (scan area 12x12-mm) for a WCET specimen PAA/BR 6747-1NC sample exposed to different concentration NaCl environment: (a) 1-2 ppm, (2) 100 ppm. ....................................................................................................................67
Figure 67: Effect of tip/surface distance Z on SVET maps (10x10-mm) for GBSG/BR 6700 specimen in 100ppm NaCl .......................................................................................................67
Figure 68: Effect of surface prep on SVET maps GBSG/BR 6700 (left) and (b) PAA/BR 6700 (right) in 100ppm NaCl ...................................................................................................68
Figure 69: Effect of time on SVET maps (scan area scan area 10x10 mm) for GBSG/BR6700 specimen in 100ppm NaCl at tip/surface distance “Z” from surface (a-e). ...68
Figure 70: Exposure time effect on PAA/BR 6700-1 SVET maps @ 100ppm NaCl and distance “Z” from surface (a-c) ................................................................................................68
Figure 71: Capacitance of (cracked) samples exposed to 60 oC-100%RH conditions ..................70
Figure 72. Capacitance of as-bonded (un-cracked) samples; 60 oC-100%RH or 60 oC water immersion ................................................................................................................................71
Figure 73: Cyclic galvanic test to characterize structure and corrosion inhibition of bond primers .....................................................................................................................................72
Figure 74: Main effects plot for relative impedance decay due to EC-Stress cycles ....................73
Figure 75: Net effect of Cr(VI) loading on primer durability under cyclic galvanic exposure .....74
Figure 76: EA 9396 Topcoat Panel Assembly ..............................................................................75
Figure 77. Impedance decay response with surface preparation ...................................................76
Figure 78: Scatterplot of Impedance decay response with pre-treatment ......................................76
Figure 79: Main Effects plot for EC data .......................................................................................77
Figure 80: Main effects plot for Rct decay ....................................................................................77
Figure 81: Scribe corrosion response: primer chromate loading in primer-only Al7075/GBSG panels after 48 hours in NSF(left); primer chromate loading in primer-only Al7075/PAA panels after 48 hours in NSF (right) ........................................................................................79
Figure 82: Scribe corrosion response to primer Cr(VI) loading in adhesive-coated Al7075/GBSG panels after 672 hours NSF (left); Scribe corrosion response to primer Cr(VI) loading in coated Al7075/PAA panels after 672 hours in NSF (right) ........................79
Figure 83: Main Effects plot for scribed uncoated NSF panels .....................................................80
Figure 84: Specimens preparation and set-up for in-situ galvanic bond wedge crack growth test: (a) Schematic of bond wedge crack tip electrodes; (b) Masking lacquer on the bond wedge crack edges; (c) Heat shrink tubing for enclosure of the wedge crack tip; (d) Experimental set-up for electrochemical impedance measurement on both adherends exposed to 3.5% NaCl under a cyclic EC-stress @OCP+100 mV. .........................................81

ix
Figure 85: Impedance decay of both adherends (Top part of the Figure labeled as side 0 and 1) as results of EC-stress cycles, and X-sectioning of adhesively bonded wedge crack Al2024 /PAA/BR 6747-1NC (Bottom) ...................................................................................81
Figure 86: Impedance decay of both adherends (Top part of the Figure labeled as side 0 and 1) as results of EC-stress cycles, and X-sectioning of adhesively bonded wedge crack Al2024 /PAA/BR 6747-1 (Bottom) .........................................................................................82
Figure 87: Three X-Z plane X-sectioning of adhesively bonded wedge crack (left side of the Figure, three locations labeled as side , middle, and side-2) after about 36 hr long EC-stress cycles @ OCP+100mV, and a X-Z plane image of bonded wedge crack sample (right side). ...............................................................................................................................82
Figure 88: Wedge Crack Exposure Methods: (a) Method A – razor knife in adhesive parallel to bondline; (b) Method B – nanoindenter within adhesive bondline; (c) Method C – razor scribes perpendicular to bondline (prior to removal of lacquer coating) .................................83
Figure 89: Method A, Cross-sectional images of bondline sections after one cycle .....................84
Figure 90: Galvanic corrosion testing of bondline edges. .............................................................85
Figure 91: Bondline edge attack measured with chromated and nonchromated primers (Methods A+B) ........................................................................................................................85
Figure 92: Maskant undercutting from scribing operations: (a) using Method A, (b) using Method B, (c) using Method C ................................................................................................86
Figure 93: Nano-indented bondline defect (Method B) EC-Stress using Al2024/PAA/EW-5000-NC Primer .......................................................................................................................86
Figure 94: Clockwise from top left: Metallographic mount arrangement, bond line edge corrosion in chromate-primed samples BR6767-1 (10 cycles), EW-5000 (5 cycles Left side) and EW-5000 (right side) ................................................................................................87
Figure 95: Typical T-45 Rudder flight control surface; note the two upper and lower hinge fitting areas...............................................................................................................................90
Figure 96: Photograph illustrating T-45 Rudder spar attachment area with significant spar corrosion adjacent to the fitting linkage. ..................................................................................91
Figure 97: Photograph illustrating T-45 Rudder lower fitting attachment area with significant spar corrosion in the fitting attachment areas. .........................................................................91
Figure 98: Lap-shear strength of FM-94 film epoxy used to bond Ti (6Al-4V). Adherends were environmentally conditioned in an “open” state after the surface preparation process and prior to bonding. ................................................................................................................93
Figure 99: Damaged area on F/A-18 leading edge of vertical stabilator. ......................................97
Figure 100: (a-e) Two Al honeycomb structures for cross-sectioning analysis. Damaged part with obvious skin penetration and areas assigned for cross-sectioning (a-b); undamaged part and corresponding areas for cross-sectioning (c-d); and schematic of cross-sectioning preparation (e). .........................................................................................................................98
Figure 101 (a-d) Optical micrographs of Area-0 cross-sectioned from damaged honeycomb structure. Adhesive disbond (a-b) from composite skin, node bond failure (b, c), and heavily corroded Al core underneath skin area with no visible surface damage (d). ..............99

x
Figure 102 (a-b). SEM images and EDS spectra of two selected node bond areas. No visible corrosion and presence of SrCrO4-containing particles within node bond areas (a), and heavily corroded node bond area with almost no SrCrO4 presence (b) as indicated by EDS semi-quantitative analysis table .....................................................................................100
Figure 103 (a-f). SEM/EDS mappings within Al honeycomb core node bond areas. Node bond areas (a), showing SrCrO4 needle-like pigments (b), element distribution of Sr (c), Cr (d) and O (e), and semi-quantitative analysis result (f). ...................................................100
Figure 104 (a-d). SEM images of Al core corrosion in form of thick Al oxide scale (damaged honeycomb); EDS spectrum of the thick Al oxide scale (d). ................................................101
Figure 105 (a-e). SEM and optical images localized corrosion from undamaged honeycomb structure of Al core corrosion in the form of pits (a-b), exfoliation (c-d) .............................101
Figure 106. DCB Assembly ........................................................................................................104
Figure 107: Vacuum Bag Layup ..................................................................................................105
Figure 108: UTF-1 Fixture...........................................................................................................108
Figure 109: UTF-2 Fixture...........................................................................................................109
Figure 110: Crack growth versus crack growth rate for indoor WCET specimens, initial Cytec primer screening, all surface treatments, all environmental conditioning factors .......112
Figure 111: YMean (Crack growth) versus False Data Rate LogWorth (FDR LogWorth) for initial Cytec primer WCET datasets ......................................................................................112
Figure 112 Response Screening Model distribution rankings of the indoor conditioning factor relative to the frequency of FDR LogWorth (with standard error) ........................................113
Figure 113 Response Screening Model distribution rankings of the surface preparation relative to the frequency of FDR LogWorth (with standard error) ........................................113
Figure 114 Response Screening Model distribution rankings of the primer relative to the frequency of FDR LogWorth (with standard error) ...............................................................114
Figure 115: Indoor WCET specimens, initial Cytec primer screening, and second screening of Cytec and 3M primers all surface treatments, all environmental conditioning factors .....115
Figure 116 YMean (Crack growth) versus False Data Rate LogWorth (FDR LogWorth) for initial and second Cytec primer WCET datasets and 3M primer sets. ..................................116
Figure 117: Response Screening Model distribution rankings of the indoor conditioning factor relative to the frequency of FDR LogWorth (with standard error) .............................117
Figure 118: Response Screening Model distribution rankings of the surface preparation relative to the frequency of FDR LogWorth (with standard error) ........................................117
Figure 119: Response Screening Model distribution rankings of the primer inhibitor relative to the frequency of FDR LogWorth (with standard error) .....................................................118
Figure 120: Base Response Screening Model distribution rankings WCET crack growth versus crack growth rate showing the simultaneous influence of environmental conditioning, surface preparation, and the influence of chromated primer inhibitor relative to the frequency of FDR LogWorth (with standard error). .......................................118
Figure 121: Response Screening Model distribution ranking contributions of WCET crack growth versus crack growth rate showing the simultaneous influence of environmental

xi
conditioning and the chromated primer inhibitor relative to the frequency of FDR LogWorth at a constant PAA surface preparation. ................................................................119
Figure 122: Response Screening Model distribution ranking contributions of WCET crack growth versus crack growth rate showing the simultaneous influence of the chromated primer inhibitor relative to the frequency of FDR LogWorth at a constant PAA surface preparation and constant salt spray (fog), 140°F environmental conditioning. .....................120
Figure 123: Response Screening Model distribution ranking contributions of WCET crack growth versus crack growth rate showing the simultaneous influence of the chromated primer inhibitor relative to the frequency of FDR LogWorth at a constant PAA surface preparation and constant 100% relative humidity, 140°F environmental conditioning. .......120
Figure 124: Response Screening Model distribution ranking contributions of WCET crack growth versus crack growth rate showing the simultaneous influence of environmental conditioning and the chromated primer inhibitor relative to the frequency of FDR LogWorth at a constant GBSG (50 micron) surface preparation. .........................................121
Figure 125: Response Screening Model distribution ranking contributions of WCET crack growth versus crack growth rate showing the simultaneous influence of the chromated primer inhibitor relative to the frequency of FDR LogWorth at a constant GBSG (50 micron) surface preparation and constant salt spray (fog), 140°F environmental conditioning. ..........................................................................................................................121
Figure 126: Response Screening Model distribution ranking contributions of WCET crack growth versus crack growth rate showing the simultaneous influence of the chromated primer inhibitor relative to the frequency of FDR LogWorth at a constant GBSG (50 micron) surface preparation and constant 100% relative humidity, 140°F environmental conditioning. ..........................................................................................................................122
Figure 127: WCET crack growth versus crack growth rate for PAA, GBSG (50 micron), and GBSG (50 micron w/abrasive pad) surface preparation and inhibitor combinations exposed to 100% relative humidity, 140°F environmental conditioning. .............................123
Figure 128: WCET crack growth versus crack growth rate for PAA, GBSG (50 micron), and GBSG (50 micron w/abrasive pad) surface preparation and inhibitor combinations exposed to salt spray (fog), 140°F environmental conditioning. ...........................................124
Figure 129: Percent fracture energy lost versus crack growth (PAA pretreated samples, time = 6 months) ............................................................................................................................125
Figure 130: Percent fracture energy lost versus crack growth (300 micron grit blast pretreated samples, time = 6 months) .....................................................................................................125
Figure 131: Percent fracture energy lost versus crack growth (50 micron grit blast pretreated samples, time = 6 months) .....................................................................................................126
Figure 132: Indoor exposure DCB results showing average crack growth and average % GIscc lost (all samples and all indoor conditions, standard deviations not shown) .........................127
Figure 133: Percent fracture energy lost versus crack growth (Bivariate with respect to primer and surface preparation, time = 672 hours (1 month)) ...............................................128
Figure 134: YMean (% GIscc lost) versus False Data Rate LogWorth (FDR LogWorth) for all PAA and Grit Blast datasets (assume constant primer response, indoor exposure time = 1 month) ....................................................................................................................................129

xii
Figure 135: Response Screening Model distribution rankings of the indoor conditioning standard relative to the frequency of FDR LogWorth (with standard error) .........................129
Figure 136: Response Screening Model distribution rankings of the aluminum grade relative to the frequency of FDR LogWorth (with standard error) .....................................................130
Figure 137: Response Screening Model distribution rankings of the surface preparation relative to the frequency of FDR LogWorth (with standard error) ........................................130
Figure 138: Response Screening Model distribution rankings of the adhesive relative to the frequency of FDR LogWorth (with standard error) ...............................................................131
Figure 139: YMean (% GIscc lost) versus False Data Rate LogWorth (FDR LogWorth) for all PAA and Grit Blast datasets (assume constant primer response, indoor temp-humidity exposure time = 1 month) ......................................................................................................132
Figure 140: Response Screening Model distribution rankings of the aluminum grade relative to the frequency of FDR LogWorth (with standard error) .....................................................133
Figure 141: Response Screening Model distribution rankings of the surface preparation relative to the frequency of FDR LogWorth (with standard error) ........................................133
Figure 142: Response Screening Model distribution rankings of the adhesive relative to the frequency of FDR LogWorth (with standard error) ...............................................................134
Figure 143: YMean (% GIscc lost) versus False Data Rate LogWorth (FDR LogWorth) for all PAA and Grit Blast datasets (assume constant primer response, indoor neutral salt-fog exposure time = 1 month) ......................................................................................................135
Figure 144: Response Screening Model distribution rankings of the aluminum grade relative to the frequency of FDR LogWorth (with standard error) .....................................................135
Figure 145: Response Screening Model distribution rankings of the surface preparation relative to the frequency of FDR LogWorth (with standard error) ........................................136
Figure 146: Response Screening Model distribution rankings of the adhesive relative to the frequency of FDR LogWorth (with standard error) ...............................................................136
Figure 147 B-CRAT Risk Categories and material selection tool. .............................................138
Figure 148 Risk rating framework will be supported by comprehensive risk evaluation criteria that helps assign the risk probability ratings. ............................................................139
Figure 149 Based on the Risk Probability Number (RPN), the failure modes will fall into the Low (1), Medium (3), or High (5) risk category which will show up on the Tool. ...............139
Figure 150 B-CRAT Signal Chart. .............................................................................................140
Figure 151 Revised B-CRAT Framework ..................................................................................141
Figure 152: Phosphoric acid anodizing and post treatment process ............................................143
Figure 153 FIB-HRSEM images and EDS analysis of plain view and cross-sections of a PAA-only panel (left) and PAA-NTMP panel (right) ...........................................................143
Figure 154: FIB-HRSEM and EDS analyses of plain view and cross-section of PAA with TCP-NP post treatment ..........................................................................................................144
Figure 155: Neat Resin Plaque Vacuum Bag Assembly .............................................................145

xiii
Figure 156: Ultrasonic and Optical Microscopy Results for (a) EA 9696 and (b) FM 73 Neat Resin Plaques .........................................................................................................................146
Figure 157: Gravimetric moisture uptake results for FM 73 and EA 9696 cured adhesive plaques by immersion in water and a 5% NaCl aqueous solution at 140°F ..........................147
List of Tables
Table 1: General Test Method Details ...........................................................................................13
Table 2: WCET Test Matrix for Environmental Conditioning ......................................................14
Table 3: Primer chromate concentrations ......................................................................................16
Table 4 Average crack growth (CG (mm)), crack growth rate (R (mm/hour)) for initial indoor Cytec primer WCET samples (BR 6700-1, BR 6747-1, and BR 6747-1NC), all surface treatments, all environmental conditioning factors .....................................................22
Table 5: DCB Environmental Durability Test Matrix ...................................................................24
Table 6: Chloride ion deposition collection results .......................................................................26
Table 7: DCB Elevated Temperature Neutral Salt Fog Lab Results, EA 9696 Adhesive .............29
Table 8: DCB Elevated Temperature Neutral Salt Fog Lab Results, FM 73M Adhesive .............29
Table 9: DCB Elevated Temperature / Humidity Lab Results, EA 9696 Adhesive ......................29
Table 10: DCB Elevated Temperature / Humidity Lab Results, FM 73M Adhesive ....................30
Table 11. Average Crack Growth Results for Marine Atmospheric Environment DCBs Bonded with EA 9696 ..............................................................................................................30
Table 12. Average Crack Growth Results for Marine Atmospheric Environment DCBs Bonded with FM 73 .................................................................................................................32
Table 13. Failure Mode Results for DCBs Fabricated by NAVAIR ............................................34
Table 14 Average GIscc lost, crack growth, and mode-of-failures for bivariate primer and surface preparation conditions (time = 6 months). “Sample-not-observed” is in reference to mode-of-failure observations. All samples were include in the reported average GIscc lost and crack growth values. .............................................................................41
Table 15 Response Screening Model results for outdoor exposure testing of DCB samples ranked by FDR LogWorth. ........................................................................................43
Table 16. GBSG Surface Preparation Evaluation (DCBs) “Round 1” ..........................................49
Table 17. GBSG Surface Preparation Evaluation (DCBs) “Round 2” ..........................................50
Table 18. DCB “Round 1” Results ................................................................................................52
Table 19. Failure Mode Results for Round 1 DCBs ......................................................................52
Table 20. DCB “Round 2” Results ...............................................................................................53
Table 21. Failure Mode Results for Round 2 DCBs .....................................................................53
Table 22: Cyclic Stress Durability Test Matrix .............................................................................54

xiv
Table 23: Cyclic Stress Durability Test Results ............................................................................55
Table 24: Primed panel candidates for EIS....................................................................................57
Table 25 Overview of Bond Primer Surface Potential Characterization by SVET ......................63
Table 26: Effect of solution conductivity and tip/surface distance on SVET surface voltage output...........................................................................................................................66
Table 27: WCET samples tested for hydration ..............................................................................69
Table 28: Bond primer samples with different chromate loading for EC/EIS test ........................73
Table 29: Analysis of Variance ......................................................................................................74
Table 30: Cure Cycle for EA 9396 Adhesive Topcoat .................................................................75
Table 31: Cytec and 3M bond primed Al alloy panels coated with EA9636 adhesive layer for EIS characterization ...........................................................................................................75
Table 32: Scribe Evaluation Criteria ..............................................................................................78
Table 33: Bondline Crevice Corrosion Results, Methods A and B ...............................................84
Table 34: Summary of bond line edge galvanic stress test by Method C ......................................86
Table 35: T45FST/NAVAIR Approved panel assembly manufacture and construction materials ...................................................................................................................................91
Table 36: T45FST/NAVAIR Required coupon tests for demonstration article panel assemblies ................................................................................................................................92
Table 38: Al core surface composition by XPS analysis and normal composition of Al 5052 ......................................................................................................................................99
Table 39 Indoor and marine atmospheric exposure DCB results showing average crack growth and average % GIscc lost (all samples and all conditions, standard deviations not shown) ..............................................................................................................................127
Table 40: Cure Cycles for EA 9696 and FM 73 Neat Resin Plaques ..........................................145
Table 41: Gravimetric moisture uptake results for FM 73 and EA 9696 cured adhesive plaques by immersion in water and a 5% NaCl aqueous solution at 140°F for 70 days .......147

1
1 Abstract
1.1 Objectives The primary objectives of this project were to understand the function and performance of adhesive bond primers and the rationale and quantified need for corrosion inhibitors in current metal adhesive bonding applications. Chromated inhibitors (those containing hexavalent chromium) have been assumed to reduce the possibility of corrosion along the primer-substrate interface in bonded joints, which could lead to premature structural failures when the bondline is subjected to corrosive environmental stresses induced by exposure to moisture, atmospheric contaminants, salt air, and elevated temperatures. To determine the validity of these assumptions, the efforts in this project focused on qualitative and quantitative evaluation of bonded joint designs, assessment of corrosion and bondline degradation reactions occurring in fielded parts compared to model laboratory specimens, interactions between joint components (alloy, surface preparation, primer, adhesive), and performance differences between chromated bond primer systems and those containing nonchromated corrosion inhibitors or no inhibitors. Testing was conducted under both laboratory and marine atmospheric corrosive environmental conditions. The project focused on aluminum alloys bonded with 250°F-cure toughened epoxy film adhesives.
1.2 Technical Approach Aluminum adherends were prepared with phosphoric acid anodize (PAA) and Cytec Solvay Group (Cytec) BR 127 primer or grit-blast/sol-gel (GBSG) treatment with two Cytec primers, BR 6747-1 and BR 6747-1NC. PAA/BR 127 represents a baseline, high-performance treatment with a chromated, solvent-based bond primer widely used throughout the aerospace industry. BR 6747-1 (chromate inhibited) and BR 6747-1NC (noninhibited) are waterborne primer systems with nearly identical resin components compatible with the GBSG surface preparation commonly used for on-aircraft repair bonding applications. BR 6747-1 and BR 6747-1NC primers were used to compare performance against the baseline system and evaluate the effect of chromates in the bond primer. Results were validated using 3M EW-5000 (chromated), 3M EW-5000ET (non-chromate inhibitor), and EW-5000NC (experimental, noninhibited) primers.
A multidisciplinary team from across government and industry assessed the bond primer variants using several established and novel test techniques to gain insight into the role of bond primer inhibitors. The team conducted indoor exposure mechanical testing using the wedge crack extension test (WCET) per ASTM D37621 in a variety of static and dynamic corrosive environments, including hot/humid environments per ASTM D22472 (140°F with >98% relative humidity (RH)), cyclic corrosion per ASTM G853, and neutral salt fog per ASTM B1174 (140°F in addition to 95°F). Additional testing utilized the double cantilever beam (DCB) test per ASTM D34335 modified to be consistent with Boeing specification BSS72086. DCB specimens were exposed to marine atmospheric environments (Canaveral Air Force Station, FL, and Whidbey Island NAS, WA), as well as two laboratory environments, which were consistent with the WCET test environments. Multivariate statistical analyses were performed on data generated by laboratory and marine atmospheric exposure of WCET and DCB specimens.
Test methods to probe the hydration of the primer coatings, electrochemical performance, moisture transport mechanisms, permeation properties, and surface characteristics that could query any corrosion protection functions of corrosion inhibitors were investigated. Specific electrochemical methods used for evaluation included: 1) Electrochemical Impedance

2
Spectroscopy (EIS) and Scanning Vibrating Electrode Technique (SVET) used to obtain electrochemical properties of surfaces of interest, 2) accelerated corrosion via exposure to static or dynamic electrochemical anodic stress (EC Stress), and 3) capacitance and dielectric loss measurements used to quantify moisture absorption levels in bonded joints EC properties of primed aluminum samples by Scanning Vibrating Electrode Technique (SVET) alone and in combination with accelerated EC Stress. Several of these methods were also used for more complex analysis of cohesive and adhesive failure surfaces. These include EC Stress of bonded joints, characterizing corrosion reactions ahead of and behind crack tips, and assessment of corrosion potential at undamaged bondline edges.
1.3 Results The project’s primary finding suggests chromated corrosion inhibitors in adhesive bond primers are less critical for bonded joint environmental durability than previously believed. Many of the traditional and novel tests conducted during the effort did not show significant differences between chromated and nonchromated bond primers in adhesive bondlines. Though certain rigorous tests used to qualify materials and processes for bonded joints did show chromated primers provide a positive contribution to environmental durability, even these tests revealed surface preparation is the dominant factor for aluminum bonded joint environmental durability performance. Results for bonded joint testing and electrochemical analysis are summarized at the beginning of their respective sections.
1.4 Benefits There is now greater understanding of the correlation of bond primer properties to environmental response and, consequently, a high level of confidence chromates play a smaller role in bondline environmental durability than previously believed. Aluminum surface preparations, and even key individual steps in these processes, appear to be more critical to bondline environmental durability than bond primer corrosion inhibition. Bond primers may be selected for evaluation irrespective of their corrosion inhibitor content and should be as assessed together with all other components that comprise the bonding system by current test methodologies using all materials and processes proposed for the application. Desired performance, the tests required to assess that performance and the level of acceptable risk are all critical considerations. A Bondline-Corrosion Risk Assessment Tool (B-CRAT) was conceptualized to assist in identifying potential risk factors associated with implementing nonchromated bond primers in applications for which chromate inhibitors were originally assumed to be necessary to provide required bondline corrosion protection.
Sufficient confidence was generated to warrant exploration of nonchromated bond primers for future field demonstrations of adhesive bonding applications on noncritical Department of Defense (DoD) assets to help initiate a shift toward more environmentally friendly manufacturing and repair practices. Use of a noninhibited bond primer (BR 6747-1NC) for the T-45 aircraft rudder is proposed based on structural requirements, damage tolerance, andeconomic risk potential for repair and maintenance. Use of the same noninhibited bond primerfor Navy depot-level installation of an aluminum F/A-18D aircraft doubler is supported as is apotential Army use of the bond primer for improved out-life/shelf life of ground supportequipment and armor prior to bonding. The Air Force plans to install bonded patches on C-5aircraft using BR 6747-1NC bond primer near similar bonded repairs conducted with BR 6747-1to assess any in-service performance differences between these noninhibited and chromatedvariants of Cytec’s waterborne primer chemistry.

3
2 Objective
The primary objectives of this Strategic Environmental Research and Development Program (SERDP) project WP-2144 were to understand the function and performance of adhesive bond primers and the rationale and quantified need for corrosion inhibitors in current bonded joint applications. Hexavalent chromium inhibitors were assumed to reduce the possibility of corrosion along the primer-substrate interface in bonded joints, which could lead to premature structural failure when the bondline is subjected to environmental stresses (i.e. moisture, atmospheric contaminants, salt air, and elevated temperatures). To determine if these assumptions were correct, the efforts and tasks in this project focused on qualitative and quantitative evaluation of bonded joint designs, assessment of corrosion and bondline degradation reactions occurring in fielded parts compared to lab specimens, interactions between joint components (alloy, surface preparation, primer, adhesive), and performance differences between bond primer systems containing chromate and new or existing non-chromate inhibited or noninhibited bond primer systems in both the lab and field. The project focused on aluminum alloy substrates, bonded with 250°F-curing toughened epoxy film adhesive systems.
This report encompasses data collected on current bonded joint applications as well as test methods and technical progress in evaluation of in-service part corrosion. Work included defining physical/chemical reactions in current environmental durability test specimens including exposures to more aggressive environments, exploration of alternative analysis methodologies and specimen design, assessment of the impact of chromate levels on corrosion performance beyond and within a bondline, and results in the isolation of primer corrosion mitigation properties through post-treatment of surface preparations. A summary of how this information feeds development of a B-CRAT and a preliminary tool design approach has also been provided.
A unique opportunity for this project was the availability of a chromated primer (Cytec’s BR 6747-1) and a noninhibited primer (Cytec’s BR 6747-1NC) that are based on the same resin chemistry and, according to their manufacturer, virtually identical other than the corrosion inhibitor. Their performance characteristics were compared throughout the project to determine the value of the inhibitor. Their common resin system also allowed blending of the primers to achieve variable chromate loading used to assess changes relative to incremental increases in inhibitor. To validate the test methods, results of analysis, and conclusions afforded by the Cytec primers, 3M provided a chromated primer (EW-5000), nonchromated primer (EW-5000-ET), and an experimental noninhibited primer (EW-5000-NC); all 3M primers were formulated with the same base resin chemistry.
3 Background
SERDP’s efforts to pursue solutions for DoD’s need to reduce current and future environmental liabilities without sacrificing the sustainability of weapons systems have resulted in a significant amount of research in recent decades to reduce dependence on the corrosion-inhibiting benefits of hexavalent chromium, which is well understood as an environmental, health, and safety risk. While SERDP and others have funded efforts for understanding and evaluating use of chromates and the performance of nonchromated corrosion inhibitors in inorganic metal surface treatments and primers for exterior coating systems, much less effort has been focused on evaluating the

4
performance of these inhibitor systems in bonded joints for load-carrying structural applications. For these structural bonding applications, often safety-of-flight-critical, requirements are very stringent since the risks of compromised corrosion protection and subsequent degradation of performance and longevity are high (DoD systems can require 40+ years of service). The need for improved worker and environmental safety must be balanced with the systems safety needs of the structure. The default position has been no unpredictable degradation in properties can be tolerated. Without thorough understanding of the requirements with regard to corrosion performance, nonchromated primers that do not provide equivalent performance to baseline chromated products are not used, and the baselines are specified for new structure as the default. For the bonded joints of interest, the primer is the only element containing corrosion inhibitors and is assumed to provide any necessary in-service protection. In the interest of reducing chromate use and waste related to structural adhesive bonding, this report summarizes the effort to investigate the influence and performance of corrosion inhibitors in these structural adhesive bond primers.
To accomplish the goals of this project and advance understanding of the materials and processes that influence environmental degradation of a bonded joint (physical, electrochemical, and mechanical), there were two primary areas of focus: 1) develop an understanding of the film and corrosion inhibiting properties of bond primers and 2) develop and validate test methods for both primer and system-level performance. Also proposed was development of a B-CRAT format or concept to facilitate practical use of the information gathered during the project.
A multidisciplinary team from across government and industry assessed the bond primer variants; the team members and their roles are briefly described below.
Naval Air Warfare Center, Aircraft Division, Aerospace Materials Division (NAVAIR),Patuxent (PAX) River prepared test specimens (DCB, scribe panels, variably loaded primer),performed environmental exposures (neutral salt fog (NSF)) for primer loading specimens,documented Navy in-service primer use and bonded joint corrosion issues, and identifieddemonstration articles.
Materials Integrity Branch of the Air Force Research Laboratory’s Materials andManufacturing Directorate (AFRL/RXSA) with support from the University of DaytonResearch Institute (UDRI) prepared test specimens (DCB, WCET, scribe panels), installedand monitored DCB specimens at Canaveral Air Force Station (AFS), documented Air Forcein-service primer use and bonded joint corrosion issues, and identified demonstration articles.
Weapons and Materials Research Directorate, US Army Research Laboratory (ARL)documented Army in-service primer use (shelters, armor, ground equipment) and bondedjoint corrosion issues, disassembled and documented DCB specimen results, and performedmultivariate analysis of WCET and DCB specimens.
United Technologies Research Center (UTRC) performed all electrochemical analysis(Electrochemical Impedance Spectroscopy (EIS), Scanning Vibrating Electrode Technique(SVET)) of in-service and test specimens (WCET, DCB, primed panels, honeycomb core),performed durability data analysis, and developed novel techniques for in-situ corrosionmonitoring of WCET specimens.
Battelle Memorial Institute performed WCET specimen exposures in multiple acceleratedcorrosion environments and led B-CRAT development.

5
Boeing coordinated installation and monitoring of DCB specimens at Whidbey Island Naval Air Station (NAS).
All participants supported data review, interpretation of results, discussion/conclusions, and reporting.
1) Develop understanding of the film and corrosion inhibiting properties of bond primers
To understand the progression of corrosion reactions in fielded parts with bonded joints, an early task was identification and evaluation of in-service bondline failures. Analysis of these failures was anticipated to influence lab evaluations by either driving specimen configuration or localized exposure environments. As structural bonded joint applications and failure/repair areas were documented, it became clear the most prevalent involved metal or composite skins bonded to aluminum honeycomb core. There was general concurrence core bonded joint failure was initially due at least as much to moisture ingress from maintenance-induced skin damage or compromised seals/sealant as it was to environmental attack of perimeter bondlines. Once moisture penetrates to the core, the thin metallic structure experiences corrosion (pitting, exfoliation, oxide scale), accelerated in some areas by moisture-absorbing core splice adhesives, and degradation proceeds until it is identified by periodic inspections or until structural integrity is compromised. Moisture and salts in an 8000 flight-hour undamaged F/A-18 vertical stabilator initiated the same corrosion mechanisms as a stabilator with heavy skin penetrations. Honeycomb core joints cannot be ignored but, early in this project, it was concluded they could not be the project’s primary focus since failures tend to involve the core itself and are not usually associated with a bond primer applied to facesheets. A summary of this work is found in

6
Appendix A.
Since the available failed parts did not provide significant insight into the role of chromates in progression of corrosion in critical, highly loaded structural bonded joints, lab and marine atmospheric exposure specimens were used to understand the fundamental behavior of adhesive bond joints exposed to corrosive conditions and the criticality of corrosion inhibition. A wide variety of test methods were reviewed to determine which would provide the most useful information regarding performance of bondline inhibitors relevant to highly loaded field applications. While not novel, the ASTM D3433 DCB specimen was chosen based on its use in earlier bondline durability testing7 and because it provides quantitative information on the adhesive beyond what is available from the more common ASTM D3762 WCET specimen. Sufficient DCB specimens were prepared at two locations (NAVAIR and AFRL/RXSA) for two marine atmospheric and two laboratory evaluations (Section 4.3.1.3). Selection of lab environments for DCB specimens was based on results from WCET specimen testing in five different environments (Section 4.3.1.1). These included three static environments: neutral salt fog (NSF) per ASTM B117 at 95°F, NSF per ASTM B117 but conducted at 140°F, and hot/wet at 140°F and >98% RH), as well as two cyclic environments: ASTM G85 Annex 5 (Prohesion) and SAE J23348. The environments tested yielded widely different crack growth, failure mode, and corrosion results for chromated, nonchromated, and noninhibited primers but did not significantly differentiate between these primers. Based on the WCET results, ASTM B117 (140°F) and ASTM D2247 (140°F/100% RH) were selected as conditioning environments for lab DCB specimens. Elevated-temperature NSF was very aggressive but was selected so the only difference between the conditioning environments would be the presence of sodium chloride (NaCl). Differences in GBSG surface preparation procedures for DCB specimens prepared by NAVAIR and AFRL/RXSA overwhelmed durability performance comparisons of bondline system elements. Surface preparation (PAA compared to GBSG) was still the primary driver in long-term durability of the adhesively bonded joints but the DCB specimens did identify a contribution arising from the addition of a chromated inhibitor to the primer package.
Multivariate analyses of the DCB and WCET results, including the relative influence of substrate alloys, surface preparations, primers, and adhesives on bondline degradation in corrosive environments, is covered in Sections 4.3.1.2.1 and 4.3.1.3.1. Additional work on understanding the impact on durability of surface preparation alternatives and combinations used in preparing the DCB specimens is covered in Section 4.3.1.4.
Several typical test methods for films were explored to understand bond primers, but characterizing the physical properties (permeability, moisture transport) of primers applied at ~0.2 mil thickness (nominal in-service value) proved more difficult than for aircraft topcoats applied at thicknesses closer to 1.0 mil or more. Evaluating barrier properties using multiple coats to obtain complete films without porosity and/or voids that disable traditional mechanical and electrochemical techniques was avoided since results would be non-representative of service applications. Results using EIS and EC stress prior to EIS evaluation in Section 4.3.2.1 and Scanning Vibrating Electrode Technique (SVET) in Section 0 in conjunction with surface characterization by white light interferometry (Section 4.3.2.2.1) focused on evaluating the role of surface defects and porosity in the representative thin coats of primer on film and corrosion reaction properties. Scribes were used to introduce artificial defects in primed surfaces to evaluate real-time corrosion reactions. EC stress, particularly the use of a cathodic polarized stress for surface disbond formation in a de-aerated diluted salt environment, was performed on

7
primed surfaces with and without an epoxy topcoat. Primers with variable chromate loadings (Section 4.3.2.6), generated from blends of chromated and noninhibited primers of the same base resin, were also exposed to NSF per ASTM B117 to compare the corrosion behavior using both visual, EC stress EIS, and SVET techniques. SVET was also used to further explore the corrosion behavior at the crack tip (Section 4.3.2.10) and adhesive/cohesive failure boundaries of WCET specimens (Section 4.3.2.4.1). Reference saturations of the two bondline adhesive films used for WCET and DCB specimens were generated (Appendix F) using water and salt water since their bulk properties, at thicknesses almost 100X that of primers, were expected to have a greater influence on moisture transport.
When unprotected from the environment by bondline materials (i.e. outside of a bondline), there were expected differences in corrosion protection properties between chromated and both non-chromate inhibited and noninhibited primers. SVET identified electrochemical differences between chromated and noninhibited primers; the strongest measured effect of the chromate was inhibition of the cathodic effects in primer defects/pores exposed to the environment. EC stress followed by EIS evaluation using scribed primed panels with and without an epoxy coating identified increased surface hydration and disbond formation with nonchromated primer. In the task where BR 6747-1 (chromated) and the noninhibited BR 6747-1NC primers, manufactured from the same resin base, were blended to produce varying levels of chromate inhibitor, primers with full chromate loading (i.e. not blended with noninhibited primer) inhibited corrosion formation in the scribe and field areas of panels exposed to NSF. WCET results with the variable chromate loadings were consistent independent of the primer blend ratio. Corrosion activity in the failure regions of WCET specimens evaluated via SVET after exposure to various corrosive environments consistently indicated primarily cathodic activity in the cohesive failure regions and intense anodic activity in the adhesive failure regions. The adhesive failure regions correlated with basic electrochemical differences between the chromated and noninhibited primers. No link was established between these corrosion processes and adhesion loss or cohesive crack propagation. Results of water and salt water uptake of the adhesive films demonstrated slight differences (less than 1% by weight) between the materials, with less absorption occurring with the salt solution. While a clear effect of chromate was witnessed with exposed primer specimens, the effect of chromates, if any, in the mass-transfer-limited environment of a bondline interior is still not fully understood.
2) Develop and validate test methods for both primer and system level performance
With clear electrochemical differences between environmentally exposed chromated and non- chromated primers but no statistical contribution from chromated inhibitors in cracked/opened WCET and the initial 6-month marine atmospheric-exposed DCB specimens, investigation into the role of chromates at the edges of an uncompromised bondline was explored. Since all initial testing was performed primarily on one primer resin chemistry, validation of the test methods and findings using alternative bond primers was also necessary.
In order to understand the differences in bondline crevice corrosion growth kinetics between chromated and nonchromated primers, WCET specimens with unopened/intact bondline edges damaged via several methods were subjected to EC stress cycles followed by metallographic cross-sectioning to determine corrosion depth (Section 4.3.2.11). None of the damage methods established any relationship between the magnitude of bondline galvanic corrosion attack and the presence of a chromate corrosion inhibitor in the adhesive bond primer.

8
Initial testing was performed almost exclusively on Cytec’s BR 6747-1 (chromated) and BR 6747-1NC (noninhibited) primers because of their apparently identical resin chemistry. Because they only differed by the presence or absence of corrosion inhibitors, they were ideal candidates for studying the effect of chromates on bondline durability performance. To validate the lack of significance of chromates found in any of the bonded joint configurations and exposures tested, 3M provided three primers: EW-5000 (chromated), EW-5000ET (non-chromate inhibited), and EW-5000NC (noninhibited). The EW-5000 and EW-5000ET primers were commercial products; the EW-5000NC was sampled as a complement to BR 6747-1NC (i.e. with same resin system as EW-5000 chromated primer but absent any inhibitor). WCET testing (Section 4.3.2.8) in the down-selected corrosion environments (140°F and >98% RH and 140°F NSF) led to the same conclusions found for the Cytec primers: insignificance of the chromate inhibitors with respect to bondline environmental durability. While the WCET edge corrosion test method should be further refined before drawing firm conclusions on the results, from the testing performed there were no significant differences in crevice corrosion depth between any of the 3M primers.
3) Develop a Bondline Corrosion Risk Assessment Tool (B-CRAT) format/concept
The Bondline-Corrosion Risk Assessment Tool (B-CRAT) was conceptualized as a means to help identify risk factors in applications where chromate inhibitors were assumed to provide required bondline corrosion protection and nonchromated products were anticipated to be inferior in this respect. Risk associated with the expected reduction in corrosion protection was to be assessed by B-CRAT considering several factors, such as the metal alloy, criticality of the component, location of the component on the vehicle and its accessibility to environmental stressors, etc. However, in most test configurations, environments, and methods of inquiry used throughout this project, there was little evidence of statistically significant differences between chromated and nonchromated primers. Without a clear driver for risk, B-CRAT development was no longer considered useful to capture the output of this project. Though a framework for the B-CRAT was drafted (Appendix E), detailed work to finalize the tool was not accomplished for two reasons: 1) lack of clear differences in primer corrosion inhibition performance and 2) many variables within the proposed tool which would require input and decisions from competencies beyond the Materials community. Even without an overwhelming technical driver for retention of chromate in bond primers, risks for transitioning new products still exist and are similar to those for all materials substitutions. Not all nonchromated or even chromated primers would be acceptable for all applications. A thorough understanding of requirements along with sufficient data, including mechanical (static, dynamic), environmental (thermal, corrosive, etc.), and material inter-compatibility, is required for all user levels when substituting any element of a structural adhesive bondline (i.e. substrate, surface treatment, primer, or adhesive). Given the criticality of bonded structural joints and the difficulty in correlating accelerated test conditions to in-service loading and environmental exposure, on-aircraft performance data will be necessary before transition to nonchromated primers can be complete.
4 Materials and Methods
In order to assess the role of chromates in bonded joints, the effects of specimen type, test method, and environmental exposure conditions were all considered. For aluminum bonded joints, the most prevalent metal-bonded joints on aircraft, moisture is the most critical

9
environment since nearly all failures in aluminum adhesive bonded joints in aircraft have been initiated by moisture9. Bond primers have been considered important in bonded joints for resisting the effects of moisture and increasing environmental durability. Since corrosion is an electrochemical reaction, galvanic effects, loading or thermal considerations, and methods to drive to an accelerated response were evaluated. Where possible, specimens were exposed and evaluated in both laboratory and marine atmospheric environments to determine the role of chromates in current chromate-based primers compared to the available non-chromate-based and/or noninhibited bond primers. Bonded specimens utilized aluminum adherends and relevant modified epoxy film adhesives.
4.1 Materials
Using chromated bond primers as controls, the project evaluated both nonchromated and noninhibited primers using electrochemical and mechanical test methods. A unique opportunity for analysis on the effect of chromates in this project was the commercial availability of a chromated primer (BR 6747-1) and a noninhibited primer (BR 6747-1NC) with the same chemistry except for the presence of the chromate inhibitor. BR 6700-1 was Cytec’s non-chromate inhibited primer used in testing. Two commercially available 3M primers: EW-5000 (chromated) and EW-5000ET (non-chromate inhibited) as well as a sampled product, EW-5000NC, with the same resin system as EW-5000 but with no inhibitors were used in the final validation tasks for the project. Substrates and adherends were aluminum alloys (2024-T3 and 7075-T6); surface preparations were PAA and GBSG and the two 250°F-cure toughened epoxy film adhesive systems used were Cytec’s FM 73 and Henkel’s Loctite EA 9696.
4.2 Methods
4.2.1 Bonded Joint Test Analysis
A literature search of existing structural bonded joint test standards was conducted to determine if the methods used for structural assessments either have been or could be considered for evaluating bondline environmental durability. The methods were also reviewed considering in-service bonded joint applications to determine whether more service-relevant specimen configurations might provide more meaningful durability results. A search was also conducted to determine if any alternative test methods had proved more valuable than the current WCET, which is commonly used for bondline environmental durability studies. This test has not been quantitatively correlated with in-service performance and could even be too severe for typical applications. An understanding of the corrosion protection requirements for adhesive bond primers would potentially point to tests that could be more meaningful for assessing bond primers and perhaps more useful than the WCET for predicting service life.

10
The WCET specimen is created when an aluminum or steel wedge is driven into the bondline joining two adherends (see Figure 1). The wedge creates tensile stress in the crack tip region and crack growth is measured over time. At the completion of the test, final crack length is recorded, adherends are separated, and failure mode is recorded. Use of the WCET in a hot/wet environment (120°F to 140°F and >95% RH) has been widely used to accelerate the effects of moist environments for evaluating new bondline materials and processes. Although the test does not introduce realistic loads experienced by in-service bonded applications, it does serve as an accelerated test for moisture durability of bonded joints by aggressively attacking the polymer-metal interface. The WCET simulates in a qualitative manner the forces and effects at the metal-primer interface and generally correlates with in-service environmental response better than lap shear and peel tests for aluminum bonding10. With hot/wet conditioning, moisture is present at the crack tip while it is under stress, making the WCET more severe than tests such as lap shear that require moisture to diffuse into the bondline from specimen edges9. While the WCET has successfully identified performance deficiencies with a number of nonchromated primers, prior to this SERDP project a noninhibited primer (BR 6747-1NC) had performed well in this test, exhibiting the desired cohesive failure modes within the adhesive with only limited crack growth. This was a strong indicator primer resin chemistry plays an important role in bonded joint environmental durability and other factors may be more significant than the primer inhibitor package. With an extensive database of laboratory and marine atmospheric environment exposure data gathered for the WCET and its wide acceptance within the adhesive community, it was maintained as a method for this effort and warranted deeper investigation into whether it could provide useful information specifically on the performance of chromates.
The DCB test specimen (Figure 2), similar to the WCET but with thicker (0.50 inch vs 0.125 inch) adherends, was incorporated into this project when it became apparent failed in-service parts with known pedigrees were not available for analysis. The DCB specimen, modified
consistent with Boeing specification BSS 7208, had been used in earlier outdoor/marine atmospheric exposure testing used to qualify materials and processes for bonded joints and was expected to provide more quantifiable information on environmental effects than the WCET. DCB specimens were exposed to two marine atmospheric environments (Canaveral AFS, FL and Whidbey Island NAS, WA) as well as two lab environments down-selected from five WCET specimen conditioning environments.
4.2.2 Environmental Analysis
Figure 1. Wedged Crack Extension Specimen per ASTM D3762
Figure 2. DCB specimen and modified crack extension method

11
In addition to adhesive test methods, a review of corrosion/durability test methods was performed to identify a discriminating test for bonded joints with chromated and nonchromated bond primers. Accelerated corrosion testing has been used by many aerospace material disciplines. Of interest to this project were the cyclic corrosion tests such as ASTM G85, Annex 5 (“Prohesion”) and SAE J2334 (Laboratory Cyclic Corrosion Test). Both of these methods utilize wet and dry times as well as heat during cycling, which is more consistent with natural weather cycles than traditional hot/wet (120°F or 140°F and >95%RH) conditioning used for most bondline durability studies.
The cyclic corrosion tests (ASTM G85 Annex 5 and SAE J2334) were used as alternative lab exposures with WCET specimens for comparison to more conventional tests including 95°F neutral salt fog and typical 140°F and >95%RH environments. Neutral salt fog conditioning at 140°F (vs. 95°F per ASTM B117) was also performed to directly compare the neutral salt fog and humidity environments. The above five test environments with WCET specimens were also used to down-select two lab environments for comparison to two marine atmospheric environments to which DCB specimens were exposed.
As a means to examine the effect of chromate loading on durability performance, compatible chromated and noninhibited primers (BR 6747-1 and BR 6747-1NC) were blended and applied to aluminum panels. Assessments of bondline durability via the WCET specimen and beyond bondline durability via neutral salt fog exposure were performed.
Cyclic stress durability testing was also utilized in an attempt to discriminate between the environmental durability of aluminum bonded joints using chromated and nonchromated primers.

12
4.2.3 Electrochemical Analysis
A variety of electrochemical test methods were developed to interrogate the corrosion resistance of adhesive bondline and understand the mechanisms that lead to failure of bonded joints exposed to corrosive environments. Testing focused on hydration of organic coatings, electrochemical performance of films, moisture transport mechanisms and permeation properties, and the evaluation of surface characteristics using both closed (uncompromised, un-cracked) joints as well as broken or cracked joints.
Specific electrochemical techniques investigated and used for evaluation included: 1) corrosion evaluation of primed aluminum samples by EIS accelerated by EC stress, 2) surface profiling (defect/porosity) relative to electrochemical performance, 3) EC properties of primed aluminum samples by SVET and in combination with accelerated EC stress, and 4) hydration of bonded aluminum WCET specimens analyzed using a capacitance method. Several of these methods were also used for more complex analyses of cohesive and adhesive failure surfaces, EC stress of bonded joints, characterizing corrosion reactions ahead of and behind WCET specimen crack tips, and assessment of corrosion potential at undamaged bondline edges.
4.3 Results and Discussion
4.3.1 Bonded Joint Testing
The effect of chromates on the environmental durability of bonded joints was explored through environmental conditioning of WCET and DCB specimens, as well as low cycle fatigue testing of cyclic single-lap-joints in an environmentally controlled chamber. Specimens were exposed to a variety of laboratory conditions and two marine atmospheric environments with the belief significant differences in performance between primers with and without chromate inhibitors would emerge. Although most testing involved the use of commercially available bond primer systems, a select set of WCET specimens was evaluated using custom-mixed primers with varying levels of chromate inhibitors to assess the performance over the range of inhibitor loadings. Multivariate statistical analysis was performed on the resulting DCB and WCET data to help discern relative importance of specimen construction and exposure variables.
As a result of this work, it was concluded chromate inhibitors within the bondline are less significant than previously anticipated. Surprisingly subtle changes to steps within the surface preparation processes had a much greater impact on environmental durability than bond primer corrosion inhibitor. Changes to the abrasion method, grit removal process, and even grit sizes used in the GBSG procedure reduced the environmental durability to unacceptable levels by driving failure to the metal-primer interface and increasing crack growth. Despite the heavy influence of surface preparation on durability, chromates did contribute to bonded joint durability in DCB specimens. Analysis of DCB specimens fabricated by NAVAIR, which were treated with a better-performing GBSG surface preparation than the initial specimens fabricated by AFRL/RXSA, shows chromated BR 6747-1 outperformed nonchromated BR 6747-1NC after 9 months of marine atmospheric environmental exposure. These results were corroborated with higher fidelity on additional DCB specimens fabricated using a refined GBSG process which indicated differences in durability performance were significant after 6 months in the marine atmospheric environment.

13
The significance of chromate inhibitor was not identified until the latter portion of the program and is contrary to findings from a multivariate analysis conducted earlier on a large number of specimens. The reason for the discrepancy is due to multiple factors: the overwhelming effects on environmental durability caused by the variability in the GBSG process used to fabricate the project’s initial DCB specimens that masked other factors; difficulty determining DCB crack tip location caused by a polyurethane topcoat used to protect the exterior of the earlier specimens; and restriction of the analysis to the 6-month data for the DCB specimens exposed to the marine atmospheric environments.
4.3.1.1 Wedge Crack Extension Test
In order to determine if the exposure environment might discern more discrete differences between chromated, nonchromated, and noninhibited primers and highlight the role of chromates in the bondline, several alternative environments were used along with ASTM D2247 typical hot/wet (140°F/>95%RH) exposure to condition WCET specimens. The cyclic corrosion tests (ASTM G85 Annex 5 and SAE J2334 Laboratory Cyclic Corrosion Test) were selected based on their use in corrosion efforts for many other materials. ASTM B117 NSF at 95°F and a more aggressive NSF at 140°F were also selected. The elevated temperature (140°F) NSF was performed to directly explore the effect of salt compared to the 140°F humid environment. These tests with WCET specimens were used to down-select lab environments for comparison to the two marine atmospheric environments to which DCB specimens were exposed. Results of the DCB tests are provided in Section 4.3.1.3.
Table 1 identifies the key characteristics/differences between the specifications used for exposure and
* Prohesion is a method of cyclic accelerated corrosion testing that may relate more closely to outdoor exposure than
conventional salt fog testing. The term “Prohesion” is a shortened form of “Protection is Adhesion”, (Reference: https://www.corrosionpedia.com/definition/1356/prohesion).
Table 1: General Test Method Details
Details ASTM G85
Annex 5 Prohesion*
ASTM B117 Neutral Salt
Fog, 95ºF
ASTM B117 Neutral Salt Fog, 140ºF
SAE J2334 Cyclic Salt
Spray
ASTM D2247 Elevated Temp
w/Humidity Specimen Orientation
Flat on rack, wedge parallel to rack
Flat on rack, wedge parallel to rack
Flat on rack, wedge parallel to rack
Flat on rack, wedge parallel to rack
Flat on rack, wedge parallel to rack
Salt Solution
0.05 % NaCl + 0.35 % (Na4)2SO4 in DI
water (by wt)
5% NaCl in DI water (by wt)
5% NaCl in DI water (by wt)
0.5% NaCl + 0.1% CaCl2 + 0.075% NaHCO3 in DI water (by wt)
N/A
Solution pH
5.0 to 5.4 (as atomized and
collected)
6.5 – 7.2 (as atomized and
collected)
6.5 – 7.2 (as atomized and
collected)
7.2 to 7.5 (as atomized and
collected) N/A
Chamber Conditions
Varied / Cyclic 95°F
>98%RH; 140°F
>98%RH; Varied / Cyclic
140°F >98%RH;
Mode Cyclic Continuous Continuous Cyclic Continuous
Cycle Description
1 hour @ 77°F w/salt mist 1 hour @
95°F/50% RH
N/A N/A
6 hours @ 122°F/100% RH 17.75 hours @ 140°F/50% RH
N/A

14
Table 2 contains the test matrix including materials, number of specimens, and exposure times. All GBSG specimens were prepared using 50 micron grit blasting media (Appendix B). After removal from the environmental chambers and completion of the final crack extension reading, the specimens were disassembled, photographed, and evaluated for failure mode. The WCET crack length measurements as a function of exposure time are presented in Figure 3 through Figure 7. Images depicting the typical WCET failure mode were also reported and documented (see Figure 16). Specimens were exposed for 9 weeks with the exception of the Prohesion specimens which, due to equipment issues, were only exposed for 7 weeks.
Table 2: WCET Test Matrix for Environmental Conditioning
Specimen Construction Specimens per Environment
Specimen Removal
Crack Extension Readings
Al2024-T3/PAA/BR 6747-1/EA 9696 5
2 at 4 wks 3 at 9 wks
Initial, 1 hour, 24 hour, Weekly
Al2024-T3/GBSG/BR 6747-1/EA 9696 5 Al2024-T3/PAA/BR 6747-1NC/EA 9696 5 Al2024-T3/GBSG/BR 6747-1NC/EA 9696 5 Al2024-T3/PAA/BR 6700-1/EA 9696 5 Al2024-T3/GBSG/BR 6700-1/EA 9696 5
Figure 3: Prohesion (ASTM G85 Annex 5) WCET results (7-wk) crack extension chart
0.90
1.00
1.10
1.20
1.30
1.40
1.50
0 100 200 300 400 500 600 700 800 900 1000 1100
Cra
ck L
eng
th (
in)
Hours
GBSG/BR6700-1
GBSG/BR6747-1
GBSG/BR6747-1NC
PAA/BR6700-1
PAA/BR6747-1
PAA/BR6747-1NC

15
Figure 4: Elevated temp/wet (ASTM D2247) WCET results (9-wk) crack extension chart
Figure 5: Cyclic Salt Spray (SAE J2334) WCET results (9-wk) crack extension chart
Figure 6: Neutral Salt Fog, 95ºF (ASTM B117)WCET results (9-wk) crack extension chart
0.90
1.00
1.10
1.20
1.30
1.40
1.50
1.60
1.70
1.80
1.90
2.00
0 100 200 300 400 500 600 700 800 900 1000 1100
Cra
ck L
eng
th (
in)
Hours
GBSG/BR6700-1
GBSG/BR6747-1
GBSG/BR6747-1NC
PAA/BR6700-1
PAA/BR6747-1
PAA/BR6747-1NC
0.90
1.00
1.10
1.20
1.30
1.40
1.50
1.60
1.70
1.80
1.90
2.00
0 100 200 300 400 500 600 700 800 900 1000 1100 1200 1300
Cra
ck L
eng
th (
in)
Hours
GBSG/BR6700-1
GBSG/BR6747-1
GBSG/BR6747-1NC
PAA/BR6700-1
PAA/BR6747-1
PAA/BR6747-1NC
Note: after 504 hrs themeasurements were very hard to read due to

16
Figure 7: Neutral Salt Fog, 140ºF (ASTM B117) WCET results (9-wk) crack extension chart
Neutral salt fog at 140ºF produced the largest difference in crack extension for WCET specimens bonded with BR 6747-4 and BR 6747-1NC. Consequently, the test was selected for further screening of DCBs in Section 4.3.1.3. The elevated temperature/humidity test was also down-selected due to the large amount of existing industry-generated data.
4.3.1.2 WCET Testing – Variably Loaded Primer
Strontium chromate-inhibited Cytec BR 6747-1 adhesive bond primer (“100 %” SrCrO4 loading) was mixed with Cytec BR 6747-1NC adhesive bond primer (“0 %” SrCrO4 loading) to produce a series of logarithmically proportioned intermediate corrosion inhibitor loaded model primers. To justify this approach, the two base primers were compared by FTIR and GC-MS and found to be indistinguishable in terms of their resin and solvent chemistries.
Table 3 shows the weight percentage of chromate primer, BR 6747-1 blended with BR 6747-1NC noninhibited primer. The weight percent was referred to as the chromate content since the exact chromate concentration in BR 6747-1 was unknown. These loadings were used for all test methods.
Table 3: Primer chromate concentrations
Mix # Primer Percentage % BR 6747-1
1 0.00 2 2.52 3 6.31 4 15.75 5 39.81 6 100.00
For the WCET evaluation, UTRC prepared four aluminum panels (2024-T3, 6”x 6”) for each primer loading (to make two bonded panels, one for each adhesive). The panels were PAA treated in accordance with ASTM D393311 and primed within the same day of anodizing to prevent degradation of the surface oxides from moisture. The primers were air dried for 30 minutes then cured at 250ºF for 1 hour. The primed aluminum panels were bonded using two adhesives (FM 73 and EA 9696) following procedures described in ASTM D376212. The two adhesives were employed in the evaluation of bond durability since they were used in other tasks and are well characterized through other test programs.
The bonded panels were machined to prepare five 1”x 6” samples for each primer/adhesive combination. The samples were tested for bond durability in a humidity chamber at 140°F and 95%RH following ASTM D3762 protocol. The panels were inspected and recorded for crack extension at specified time intervals. The FM 73 specimens were exposed to 2 days at 140°F and >95%RH, followed by 24 days at 95°F/>95%RH, followed by 5 days at 140°F/>95%RH (the interruption in 140°F and >95%RH conditioning was caused by equipment failure). EA 9696 specimens were exposed for 7 days at 140°F and >95%RH.
After exposure to elevated temperature/humidity, all WCET specimens were split open to evaluate the failure mode. Figure 8 shows the images of opened panels prepared with primers containing 39.81% and 100% BR 6747-1 (chromated primer). All panels failed cohesively except for those containing 100% BR 6747-1 primer. This exception was likely caused by

17
reprocessing of these particular panels, where the previous PAA layer was incompletely removed as detailed below.
Figure 8: Images of selected panels for failure mode evaluation after wedge test In order to understand the PAA oxides in these reprocessed specimens, Focused Ion Beam High Resolution Scanning Electron Microscopy (FIB-HRSEM) was used to characterize the PAA oxide layer. Figure 9 shows the PAA oxides with 15% and 100% BR 6747-1 primers. The panel with 100% BR 6747-1 primer contained a smooth layer of oxide on the cellular PAA oxide network likely generated during the reprocessing of the prior PAA surface. This smooth layer significantly reduced the bonding strength between the epoxy and aluminum metal surface. No smooth oxide layer was observed in the 15% BR 6747-1 primed sample. The porous PAA oxide network bonds very strongly to epoxy, resulting cohesive failure.
Figure 9. PAA oxide images for 15% (left) and 100% (right) chromated primer panels
WCET data for humidity exposure is summarized in Figure 10. The data shows an apparent difference in crack extension rate between the EA 9696 and FM 73 adhesives. This difference is

18
likely caused by different adhesive properties. While EA 9696 absorbed slightly more moisture than FM 73 during saturation testing (Appendix F, Table 40), EA 9696 has higher strength and maintains its properties in the hot/wet environment better than FM 73 creating higher stress in the wedged EA 9696 samples which results in a larger crack extension during test. No significant differences were observed as a result of chromate loading below 100%. Figure 10 shows the abnormally high crack extension of the 100% BR 6747-1 primer specimens of both adhesives due to the PAA reprocessing. No smooth oxide layer was observed in the 15% BR 6747-1 primed sample that exhibited cohesive failure. The porous PAA oxide network bonds very strongly to epoxy resulting in cohesive failure.
A dhesiv e
Primer % SrC rO 4 Loading
Time, hours at 140 F 95 % RH
FM73
E A 9696
100.0
039
.8115
.756.31
2.51
0.00
100.0
039
.8115
.756. 31
2.51
0.00
168482410
168482410
168482410
168482410
168482410
168482410
168482410
168482410
168482410
168482410
168482410
168482410
2.0
1.5
1.0
0.5
0.0
Crac
k ex
tens
ion,
in
Interval Plot of Crack extension95% CI for the Mean
Figure 10: WCET results with variable chromate loading
4.3.1.2.1 WCET Multivariate Analysis
Response screen modeling is a multivariate analysis technique that involves fitting numerical Y versus X data while considering multiple categorical variable inputs. This categorical variable consideration allows for the relative weighting of the factors, which allows for ranking their significance in driving the Y versus X response. JMP Statistical Discovery software is provided standard with a response screening modeling analysis option, which was used for this research.
Unlike the DCB specimen with 0.50” thick adherends, WCET aluminum adherends (0.125” thick) yield during loading which negates a beam mechanics approach to deriving fracture energy. The WCET measured data is limited to the initial crack length and crack growth as a function of time. For the response screening analysis the yielding was ignored and it was assumed a shorter initial crack length at constant opening displacement (wedge height) would result in greater loading prior to environmental exposure, if linear beam mechanics applies.

19
Therefore, shorter initial crack lengths (higher initial loading) were assumed to result in greater crack growth during environmental exposure.
Figure 11 shows a plot of crack growth versus initial crack length for all of the WCET samples, which includes all categorical combinations of primer, surface preparation, and environmental conditioning factors. The majority of the data points appear to validate the assumption of decreased crack growth with increasing crack length, but there are a large number of outliers with increased crack growth at increased initial crack lengths. This perspective provides a qualitative estimate as to the sensitivity and relative scatter in the WCET results which needs to be considered in assigning significance to results beyond screening interpretations in the subsequent description of the response screening model results. Yielding in WCET aluminum adherends most likely invalidates initial crack length assumptions.
Crack growth versus initial crack length for all of the WCET samples was fit to a response screen model using JMP Statistical Discovery 11.2.0. Input data includes all WCET datasets and all conditioning environments; no exclusions. The specific JMP algorithm order used was Analyze > Modeling > Response Screening > Fit Y Response (crack growth) as a function of X (initial crack length) with consideration for categorical variable grouping (conditioning, surface preparation, and primer). The response screen model output is represented graphically in Figure 12 by Ymean (crack growth) versus FDR LogWorth. The False Discovery Rate (FDR) p-value is determined using the Benjamini-Hochberg technique and is considered the best statistic for measuring statistical significance.13 P-values less than 0.05 are considered significant. Note that the sum of the frequency variable is factored into the overall count, which influences the moment statistics. The response screening model results for the WCET results indicate a weakly negative correlation of decreasing crack growth with increasing FDR LogWorth, with a large amount of scatter in the fit.
Figure 11: Indoor WCET specimens, initial Cytec primer screening (BR 6700-1, BR 6747-1, and BR 6747-1NC), all surface treatments, all environmental conditioning factors

20
To determine the relative weighting of the categorical inputs (conditioning, surface preparation, and primer) YMean (crack growth) is analyzed as a distribution in JMP by using FDR LogWorth as the frequency, which “weights” the ranking bias of any categorical variables. For example, if two categorical variables are being directly compared, no preference in weighting bias in will result with a probability (p) of 0.5 which can be interpreted as the categorical variable being equally distributed in the response screen model ranking. For three categorical variables in direct comparison p = 0.33 indicates no weighting bias. The sum of the frequency variable is factored into the overall count, which influences the moment statistics.
Figure 12: YMean (crack growth) versus False Data Rate LogWorth (FDR LogWorth) for initial Cytec primer WCET datasets (BR 6700-1, BR 6747-1, and BR 6747-1NC). R2 = 0.003005, R2 Adjusted = -0.04231, Root Mean Square Error = 5.45162, Mean of Response = 7.8613, Observations (or Sum Wgts) = 24
Figure 13 through Figure 15 show the response screening model probability distributions for categorical variable comparisons of environmental conditioning, surface preparation, and primer, respectively. From response screening model shown in Figure 12 an increase in FDR LogWorth correlates to a decrease in crack growth, therefore higher probabilities in the categorical distributions correlate to decreased crack growth.
Table 4 is a summary of the averages for crack growth and crack growth rate for each of the Cytec primers at each of the conditioning environments. The standard error is high due to the low sample populations with only five samples per condition. These results do not indicate a statistical difference in WCET crack growth response between the chromate-inhibited BR 6747-1, non-chromate inhibited BR 6700-1, and non-inhibited BR 6747-1NC primers. Mode-of-failure images are shown in Figure 16 and appear to slightly favor BR 6747-1NC. Note: The specimen identification labels in the figure are not critical to interpretation of the images.

21
Figure 13: WCET Response Screening Model distribution rankings of the indoor conditioning factor relative to the frequency of FDR LogWorth (with standard error)
Figure 14: WCET Response Screening Model distribution rankings of the surface preparation relative to the frequency of FDR LogWorth (with standard error)
p = 0.48 count = 1
p = 0.52 count = 1
p = 0.28 count = 1
p = 0.27 count = 1
p = 0.25 count = 1
p = 0.20 count = 0

22
Figure 15: WCET Response Screening Model distribution rankings of the primer relative to the frequency of FDR LogWorth (with standard error) Table 4 Average crack growth (CG (mm)), crack growth rate (R (mm/hour)) for initial indoor Cytec primer WCET samples (BR 6700-1, BR 6747-1, and BR 6747-1NC), all surface treatments, all environmental conditioning factors
100% RH (140°F) Cyclic corrosion Salt spray (fog) 95°F Salt spray (fog) 140°F
R 6
700-
1
50 micron GBSG CG = 5.2 (+/- 8.2%) R = 3.7 x 10⁻³ (+/- 16.0%) PAA CG = 2.5 (+/- 20.9%) R = 2.8 x 10⁻³ (+/- 32.6%)
50 micron GBSG CG = 9.9 (+/- 3.4%) R = 7.2 x 10⁻³ (+/- 16.2%) PAA CG = 4.3 (+/- 14.8%) R = 9.2 x 10⁻³ (+/- 7.3%)
50 micron GBSG CG = 8.2 (+/- 15.4%) R = 6.1 x 10⁻³ (+/- 27.6%) PAA CG = 4.3 (+/- 21.2%) R = 4.4 x 10⁻³ (+/- 12.1%)
50 micron GBSG CG = 18.3 (+/- 14.8%) R = 13.2 x 10⁻³ (+/- 3.9%) PAA CG = 10.5 (+/- 5.5%) R = 12.9 x 10⁻³ (+/- 18.9%)
BR
674
7-1
50 micron GBSG CG = 4.6 (+/- 20.0%) R = 3.9 x 10⁻³ (+/- 28.2%) PAA CG = 2.6 (+/- 22.4%) R = 6.8 x 10⁻³ (+/- 6.9%)
50 micron GBSG CG = 7.5 (+/- 6.2%) R = 7.3 x 10⁻³ (+/- 13.4%) PAA CG = 5.9 (+/- 7.3%) R = 13.1 x 10⁻³ (+/- 5.7%)
50 micron GBSG CG = 9.7 (+/- 12.3%) R = 5.5 x 10⁻³ (+/- 4.3%) PAA CG = 3.3 (+/- 14.0%) R = 12.1 x 10⁻³ (+/- 16.6%)
50 micron GBSG CG = 24.9 (+/- 12.2%) R = 15.1 x 10⁻³ (+/- 18.9%) PAA CG = 9.0 (+/- 16.5%) R = 27.0 x 10⁻³ (+/- 22.0%)
BR
674
7-1
NC
50 micron GBSG CG = 4.3 (+/- 14.4%) R = 6.6 x 10⁻³ (+/- 14.9%) PAA CG = 3.0 (+/- 36.3%) R = 5.0 x 10⁻³ (+/- 8.7%)
50 micron GBSG CG = 7.5 (+/- 11.2%) R = 10.2 x 10⁻³ (+/- 5.7%) PAA CG = 4.9 (+/- 11.3%) R = 10.4 x 10⁻³ (+/- 10.2%)
50 micron GBSG CG = 9.4 (+/- 12.8%) R = 14.0 x 10⁻³ (+/- 11.5%) PAA CG = 4.0 (+/- 7.3%) R = 12.5 x 10⁻³ (+/- 17.0%)
50 micron GBSG CG = 14.7 (+/- 10.4%) R = 36.2 x 10⁻³ (+/- 13.3%) PAA CG = 10.4(+/- 15.8%) R = 19.9 x 10⁻³ (+/- 10.5%)
p = 0.19 count = 0
p = 0.36 count = 1
p = 0.45 count = 1

23
Figure 16 WCET failure surfaces for initial indoor Cytec primer samples (BR 6700-1, BR 6747-1, and BR 6747-1NC), all surface treatments, all environmental conditioning factors. Legibility of identification tags is not critical; figure provides relative condition/failure mode for primer/condition set.

24
4.3.1.3 Double Cantilever Beam
As previously noted, DCB specimens were used in this project in lieu of available highly loaded corroded in-service parts for analysis. The specimens were exposed to two marine atmospheric environments as well as two lab environments down-selected from the five WCET test lab environments described in the previous section.
Testing was performed on DCB specimens fabricated in accordance with Boeing Specification, BSS 7208. Three aluminum adherend treatments were evaluated: PAA with Cytec’s BR 127 primer and GBSG with two Cytec primers, BR 6747-1 and BR 6747-1NC. PAA/BR 127 represents a baseline, high-performance treatment with a chromated, solvent-based bond primer widely used throughout the aerospace industry. BR 6747-1 and BR 6747-1NC are waterborne primer systems compatible with the GBSG surface preparation commonly used for on-aircraft repair applications. The BR 6747-1 (chromate-inhibited) and BR 6747-1NC (noninhibited) primers were used to compare performance against the baseline system and evaluate the effect of chromates in the bond primer on the environmental durability of the bonded joint. The DCB testing was performed using FM 73 and EA 9696 adhesives with 2024-T351 or 7075-T651 aluminum plate adherends, and the three aluminum surface treatments. Duplicate sets of specimens were prepared for testing; one set was prepared at NAVAIR and the other at AFRL/RXSA. Differences in the surface preparation procedures performed at the two fabrication sites are detailed in Appendix B. The complete test matrix is detailed in Table 5.
Table 5: DCB Environmental Durability Test Matrix
Exposure Condition
Surface Prep Adhesive Number of Specimens per Alloy
2024-T351 7075-T651 NAVAIR AFRL NAVAIR AFRL
Canaveral AFS, FL
PAA / BR 127 FM 73 4 4 4 4
EA 9696 4 4 4 4
GBSG / BR 6747-1 FM 73 4 4 4 4
EA 9696 4 4 4 4
GBSG / BR 6747-1NC FM 73 4 4 4 4
EA 9696 4 4 4 4
Whidbey Island NAS,
WA
PAA / BR 127 FM 73 4 4 4 4
EA 9696 4 4 4 4
GBSG / BR 6747-1 FM 73 4 4 4 4
EA 9696 4 4 4 4
GBSG / BR 6747-1NC FM 73 4 4 4 4
EA 9696 4 4 4 4
140°F and >98% RH
(Lab)
PAA / BR 127 FM 73 4 4 4 4
EA 9696 4 4 4 4
GBSG / BR 6747-1 FM 73 4 4 4 4
EA 9696 4 4 4 4
GBSG / BR 6747-1NC FM 73 4 4 4 4
EA 9696 4 4 4 4
140°F Salt Fog
(Lab)
PAA / BR 127 FM 73 4 4 4 4
EA 9696 4 4 4 4
GBSG / BR 6747-1 FM 73 4 4 4 4
EA 9696 4 4 4 4
GBSG / BR 6747-1NC FM 73 4 4 4 4
EA 9696 4 4 4 4

25
Outdoor exposure specimens were placed at one of two marine atmospheric exposure sites: Whidbey Island NAS, WA, or Canaveral AFS, FL. The specimens were oriented with the bondline/crack perpendicular to the rack surface (i.e. facing ‘up’) and the bolted/cracked end was oriented downward on the slanted rack. Photographic images of the exposure sites showing specimen orientation are presented in Figure 17. Testing was performed independently by AFRL/RXSA and Boeing at the Canaveral AFS and Whidbey Island NAS exposure sites, respectively. The Canaveral AFS exposure site was located relatively further from the ocean compared to the Whidbey Island NAS location. The Canaveral AFS site was approximately 270 feet from the high tide zone compared to approximately 75 feet at the Whidbey Island NAS exposure site. Crack growth measurements were performed after approximately 6, 9, 12, 15, 18, and 24 months of exposure. A sampling of four specimens was removed from the marine atmospheric exposure sites after the 6, 9, 12, and 24 month exposures.
(a) (b) (c)
(d) Figure 17: Exposure Sites at Whidbey Island NAS, WA (a, b) and Canaveral AFS, FL (c, d)
Chloride ion concentration was measured periodically at both marine atmospheric exposure sites during the 2-year test period. The ion concentration was measured using a wet candle titration method following procedures detailed in ASTM G 14014. The wet candles contained a mixture of 30 percent by volume glycerol to 70 percent by volume deionized (DI) water with approximately 1 part per million (ppm) of octanoic acid added to the solution as a preservative. The chloride ion concentration was calculated from the average titration results from two candles. The wet candle holding fixture initially deployed at the Canaveral AFS site is depicted in Figure 18, and Table 6 lists the wet candle collection results. Additional environmental data were collected at this site by the US Army Tank Automotive Research Development Engineering Center (TARDEC) including temperature, humidity, leaf wetness (time of wetness), rainfall, and solar radiation.
Figure 18: Wet Candle Exposure Fixtures at Whidbey NAS (left) and Canaveral AFS (right)

26
The chloride deposition results indicate significant differences between the two exposure sites. The average deposition rate at Whidbey Island NAS was 272 mg/m2/day with a maximum of 542 mg/m2/day while the average deposition rate for the Canaveral site was 32 mg/m2/day with a maximum rate of 47 mg/m2/day. Although this is not the only factor influencing corrosivity of an environment, the large difference, likely due to the water proximity differences, was used to help draw crack growth rate and failure mode comparisons between the marine atmospheric and laboratory exposures.
Table 6: Chloride ion deposition collection results
Sample Location Installation Date Removal Date Exposure (days) Chlorides (mg/m2/day) Canaveral AFS 9/12/2013 1/13/2014 123 46.8 Whidbey NAS 11/8/2013 3/10/2014 122 434.0 Canaveral AFS 1/13/2014 4/1/2014 78 34.3 Whidbey NAS 3/10/2014 5/22/2014 73 542.0 Canaveral AFS 4/1/2014 7/9/2014 99 41.5 Whidbey NAS 5/22/2014 8/14/2014 84 188.1 Canaveral AFS 7/9/2014 10/13/2014 96 19.0 Whidbey NAS 8/14/2014 1/21/2015 160 137.6 Canaveral AFS 10/13/2014 1/28/2015 107 27.8 Canaveral AFS 1/28/2015 4/15/2015 77 29.0 Whidbey NAS 1/21/2015 4/22/2015 91 291.7 Whidbey NAS 4/22/2015 7/31/2015 100 207.1 Canaveral AFS 4/15/2015 9/22/2015 160 39.5 Whidbey NAS 7/31/2015 11/4/2015 96 103.1
Based on the results of WCET specimen testing in five accelerated corrosion test environments, laboratory-exposed DCB specimens were also conditioned in a humidity cabinet at 140°F and 98% RH or ASTM B117 neutral salt fog at 140°F. All laboratory testing was performed by Battelle at their facility in Columbus, OH. Figure 19 shows the general configuration and position of the specimens within the chambers.
After completion of environmental exposure, DCB specimens were separated using an MTS or Instron load frame equipped with a 1000 lbf capacity force transducer (MTS model 2525-805). The specimens were loaded in tension at a displacement rate of 1 inch/minute. The peak load and failure mode were recorded for each specimen; failure mode areas were limited to the test region bounded by the initial and final crack locations. The percent cohesive failure (within the adhesive layer) was identified along with the location of any failures occurring on the specimens outside of the bondline.
Differences in the NAVAIR and AFRL/RXSA GBSG procedures for the DCB environmental durability test matrix resulted in large differences in crack growth rates, ultimate crack extensions, and modes of failure.
Figure 19: DCB specimens in
environmental chamber

27
Table 7 through

28
Table 10 record the average crack length results for the lab-exposed specimens.

29
Table 7: DCB Elevated Temperature Neutral Salt Fog Lab Results, EA 9696 Adhesive A
lloy
Surface Prep
Fab Site Average Crack Length (in)
Initial 24 hrs 1 wk 2 wk 3 wk 4 wk 5 wk 6 wk 7 wk 8 wk
2024
-T35
1
PAA / BR 127
NAVAIR 2.95 3.23 3.29 3.29 3.47 3.56 3.57 3.63 3.78 3.74 AFRL 2.95 3.19 3.28 3.27 3.38 3.46 3.59 3.60 3.67 3.81
GBSG / BR 6747-1
NAVAIR 3.09 3.36 3.41 3.43 3.58 3.78 3.85 3.84 3.88 3.97 AFRL 3.28 6.17 6.61 6.98 7.44 7.54 7.28 7.31 7.38 7.50
GBSG / BR 6747-1NC
NAVAIR 3.01 3.28 3.36 3.80 4.21 4.67 4.91 4.94 5.05 4.89 AFRL 3.20 3.65 4.32 5.35 4.90 4.97 4.95 5.02 5.03 5.16
7075
-T65
1
PAA / BR127
NAVAIR 3.13 3.54 3.67 3.72 3.79 3.87 3.98 4.04
AFRL 3.13 3.53 3.63 3.70 3.81 3.91 3.98 4.08 4.13 4.13 GBSG / BR 6747-1
NAVAIR 3.05 3.49 3.63 3.70 3.69 3.75 3.84 3.97
AFRL 3.18 7.84 8.23 8.42 8.57 8.98 9.64 9.70 9.73 9.76 GBSG / BR 6747-1NC
NAVAIR 3.2 3.57 3.74 4.00 4.46 5.00 6.13 6.61
AFRL 3.09 5.75 7.42 7.63 7.38 7.44 7.50 7.54 7.60 7.68
Table 8: DCB Elevated Temperature Neutral Salt Fog Lab Results, FM 73M Adhesive
All
oy
Surface Prep
Fab Site Average Crack Length (in)
Initial 24 hrs 1 wk 2 wk 3 wk 4 wk 5 wk 6 wk 7 wk 8 wk
2024
-T35
1
PAA / BR 127
NAVAIR 3.38 3.67 3.72 3.73 4.06 4.12 4.18 4.20 4.33 4.47 AFRL 3.61 3.98 4.19 4.27 4.40 4.48 4.49 4.86 4.93 4.98
GBSG / BR 6747-1
NAVAIR 3.30 3.54 3.63 3.74 3.87 4.09 4.20 4.30 4.30 4.41 AFRL 3.44 5.40 6.34 6.74 6.69 6.72 7.26 7.28 7.28 7.33
GBSG / BR 6747-1NC
NAVAIR 3.36 3.65 3.72 3.77 4.00 4.19 4.23 4.51 4.71 4.96 AFRL 3.63 4.06 5.35 5.73 6.16 6.29 6.49 6.85 6.88 7.08
7075
-T65
1
PAA / BR 127
NAVAIR 3.42 3.96 4.20 4.30 4.32 4.39 4.48 4.55
AFRL 3.67 4.12 4.31 4.40 4.44 4.55 4.65 4.69 4.73 4.75 GBSG / BR 6747-1
NAVAIR 3.44 3.92 4.48 4.79 5.19 5.42 4.51 4.67
AFRL 3.77 5.11 5.93 6.67 7.56 7.80 8.21 8.33 8.48 8.49 GBSG / BR 6747-1NC
NAVAIR 3.39 3.92 4.08 4.32 4.46 4.66 4.69 4.95
AFRL 3.50 4.22 5.98 7.18 7.06 7.39 7.60 7.62 7.72 7.76
Table 9: DCB Elevated Temperature / Humidity Lab Results, EA 9696 Adhesive
Allo
y Surface Prep
Fab Site Average Crack Length (in)
Initial 24 hrs 1 wk 2 wk 3 wk 4 wk 5 wk 6 wk 7 wk 8 wk
2024
-T35
1
PAA / BR 127
NAVAIR 2.81 3.05 3.10 3.17 3.24 3.38 3.54 3.63 3.78 3.82 AFRL 3.03 3.29 3.40 3.45 3.48 3.62 3.67 3.79 3.93 3.91
GBSG / BR 6747-1
NAVAIR 2.798 3.12 3.26 3.35 3.43 3.61 3.70 3.82 3.86 3.98 AFRL 3.22 5.77 5.83 5.87 6.05 6.17 6.44 6.50 6.42 6.75
GBSG / BR 6747-1NC
NAVAIR 2.794 3.10 3.18 3.24 3.26 3.42 3.52 3.66 3.68 4.01 AFRL 3.13 3.56 3.69 3.78 3.89 3.92 3.97 4.04 4.22 4.47
7075
-T65
1
PAA / BR 127
NAVAIR 2.83 3.16 3.35 3.46 3.51 3.62 3.71 3.78
AFRL 3.01 3.44 3.57 3.78 3.94 4.14 4.32 4.62 4.48 4.49 GBSG / BR 6747-1
NAVAIR 2.89 3.23 3.50 3.61 3.65 3.79 3.91 3.94
AFRL 3.17 7.77 8.05 8.14 8.18 8.19 8.73 8.87 9.59 9.60 GBSG / BR 6747-1NC
NAVAIR 2.94 3.26 3.57 3.72 3.81 3.92 3.93 4.01
AFRL 3.10 5.48 5.62 5.71 5.87 6.07 6.37 7.02 7.05 7.09

30
Table 10: DCB Elevated Temperature / Humidity Lab Results, FM 73M Adhesive A
lloy Surface
Prep Fab Site
Average Crack Length (in)
Initial 24 hrs 1 wk 2 wk 3 wk 4 wk 5 wk 6 wk 7 wk 8 wk
2024
-T35
1
PAA / BR 127
NAVAIR 3.19 3.53 3.79 3.75 3.90 4.08 4.13 4.30 4.56 4.45 AFRL 3.56 3.98 4.27 4.31 4.35 4.45 4.43 4.54 4.61 4.70
GBSG / BR 6747-1
NAVAIR 3.05 3.59 3.84 3.90 3.99 4.16 4.10 4.29 4.36 4.44 AFRL 3.44 4.36 4.62 4.74 4.90 5.08 5.02 5.11 5.06 5.26
GBSG / BR 6747-1NC
NAVAIR 3.07 3.45 3.54 3.64 3.70 3.81 4.04 4.25 4.14 4.16 AFRL 3.42 3.83 4.15 4.28 4.32 4.45 4.63 4.48 4.88 5.09
7075
-T65
1
PAA / BR 127
NAVAIR 3.2 3.59 3.81 4.05 4.46 4.83 5.07 5.32 AFRL 3.53 3.92 4.13 4.31 4.40 4.67 4.77 4.96 5.09 5.22
GBSG / BR 6747-1
NAVAIR 3.15 3.59 3.96 4.37 4.62 4.79 5.18 5.28 AFRL 3.50 5.22 5.79 5.94 6.47 6.59 7.50 7.61 8.31 8.35
GBSG / BR 6747-1NC
NAVAIR 3.12 3.60 3.91 4.11 4.62 4.67 4.85 5.09 AFRL 3.62 4.38 4.71 4.92 5.12 5.26 5.32 5.49 6.28 6.41
Table 11 and Table 12 record average crack growth and average cohesive failure mode results for the marine atmospheric-exposed specimens; Figure 20 through Figure 23 plot crack length over the 24-month exposure period.
Table 13 records failure mode results for marine atmospheric-exposed specimens and Figure 25
Table 11. Average Crack Growth Results for Marine Atmospheric Environment DCBs Bonded with EA 9696
EA 9696
Exp
osu
re
Loc
atio
n
Allo
y Surface Preparation
Fabrication Site In
itia
l C
rack
[in
.]
Average Crack Growth [in.] Average Failure
Mode (Std. Dev) [% Coh.]1
6 Mo.
9 Mo.
12 Mo.
15 Mo.
18 Mo.
24 Mo.
Can
aver
al
2024
-T35
1
PAA / BR 127
NAVAIR 3.02 0.28 0.17 0.20 0.23 0.23 0.23 98 (3) AFRL 2.98 0.28 0.29 0.35 0.39 0.39 0.34 -
GBSG / BR 6747-1
NAVAIR 3.01 0.32 0.28 0.31 0.29 0.34 0.30 91 (13) AFRL 3.12 2.93 2.50 2.64 1.66 1.75 1.75 -
GBSG / BR 6747-1NC
NAVAIR 3.03 0.92 1.38 2.02 2.30 2.63 3.35 17 (20) AFRL 3.12 3.21 3.79 4.61 5.25 5.51 5.81 -
7075
-T65
1
PAA / BR 127
NAVAIR 3.01 0.37 0.33 0.34 0.22 0.22 0.22 100 (0) AFRL 3.16 0.24 0.32 0.20 0.10 0.10 0.10 -
GBSG / BR 6747-1
NAVAIR 3.41 0.38 0.52 0.48 0.58 0.71 0.66 51 (39) AFRL 3.15 5.06 4.59 4.91 4.21 4.21 4.21 -
GBSG / BR 6747-1NC
NAVAIR 3.36 0.83 1.06 1.61 2.35 2.99 3.73 28 (20) AFRL 3.12 5.84 6.40 7.00 6.82 7.60 8.04 -
Whi
dbey
2024
-T35
1
PAA / BR 127
NAVAIR 3.19 0.23 0.50 0.48 0.32 0.42 0.51 96 (4) AFRL 3.35 0.24 0.29 0.32 0.26 0.50 0.50 -
GBSG / BR 6747-1
NAVAIR 3.22 0.25 0.31 0.39 0.37 0.72 0.65 72 (29) AFRL 3.32 1.58 1.94 2.25 2.51 2.80 2.85 -
GBSG / BR 6747-1NC
NAVAIR 3.22 0.35 0.83 1.21 0.98 1.40 1.55 23 (17) AFRL 3.20 1.98 2.82 3.35 3.58 3.16 3.08 -
7075
-T65
1
PAA / BR 127
NAVAIR 3.30 0.13 0.22 0.35 0.27 0.38 0.43 98 (5) AFRL 3.43 0.25 0.28 0.37 0.38 0.45 0.47 -
GBSG / BR 6747-1
NAVAIR 3.34 0.28 0.33 0.53 0.31 0.41 0.56 82 (25) AFRL 3.41 4.08 4.17 4.24 3.90 3.82 3.98 -
GBSG / BR 6747-1NC
NAVAIR 3.24 0.17 0.34 0.66 0.78 1.35 1.37 39 (20) AFRL 3.34 4.23 5.93 6.23 6.93 8.25 8.14 -
Notes: 1Average of 8 specimens removed and characterized after 6, 9, 12, and 24 months of exposure

31
through Figure 28 plot failure mode results. Failure mode data from the AFRL DCB specimens is not displayed in the following tables and crack extension data was not plotted due to the discovery of surface treatment process anomalies generating very high crack extensions and low percentage cohesive failure mode; only the NAVAIR results are presented in the following figures. Multivariate analysis of the data is covered in Section 4.3.1.3.1.
As noted in Table 6, the chloride deposition rate was significantly higher at Whidbey Island NAS compared to Canaveral AFS. It is interesting to note that the Whidbey Island NAS environment generated higher crack growth than Canaveral only for chromated specimens (BR 127 and BR 6747-1); crack growth was generally lower at Whidbey Island for noninhibited BR 6747-1NC. With the high standard deviation in failure mode (percent cohesive failure), differences in specimen performance cannot be attributed to differences in exposure sites.
Figure 20. Total crack length data over exposure time at Canaveral for EA 9696 samples fabricated at NAVAIR
0.00
0.50
1.00
1.50
2.00
2.50
3.00
3.50
4.00
Crack Length (inches)
Canaveral / EA 9696 / NAVAIR
6 mo
9 mo
12 mo
15 mo
18 mo
24 month
0.00
0.50
1.00
1.50
2.00
2.50
3.00
3.50
Crack Length (inches)
Whidbey / EA 9696 / NAVAIR
4 mo
6.5 mo
9.3 mo
14.6 mo
17.6 mo
21 mo
24 month

32
Figure 21. Total crack length data over exposure time at Whidbey for EA 9696 samples fabricated at NAVAIR Table 12. Average Crack Growth Results for Marine Atmospheric Environment DCBs Bonded with FM 73
FM 73
Exp
osu
re
Loc
atio
n
Allo
y
Su
rfac
e P
rep
arat
ion
Fab
rica
tion
S
ite
Init
ial
Cra
ck [
in.]
Average Crack Growth [in.] Average Failure
Mode (Std. Dev) [% Coh.]1
6 Mo.
9 Mo.
12 Mo.
15 Mo.
18 Mo.
24 Mo.
Can
aver
al
2024
-T35
1
PAA / BR 127
NAVAIR 3.50 0.27 0.17 0.18 0.04 0.04 0.04 100 (0) AFRL 3.47 0.32 0.19 0.19 0.30 0.30 0.30 -
GBSG / BR 6747-1
NAVAIR 3.34 0.41 0.46 0.52 0.78 0.83 0.90 54 (29) AFRL 3.52 3.87 3.46 3.99 3.98 3.98 4.40 -
GBSG / BR 6747-1NC
NAVAIR 3.28 0.62 0.97 1.30 1.75 2.08 2.71 26 (24) AFRL 3.47 1.06 1.88 1.69 1.17 1.74 2.39 -
7075
-T65
1
PAA / BR 127
NAVAIR 3.47 0.21 0.17 0.20 0.14 0.14 0.14 99 (2) AFRL 3.56 0.26 0.01 0.14 0.17 0.17 0.09 -
GBSG / BR 6747-1
NAVAIR 3.53 1.25 1.03 1.39 0.64 0.74 0.97 33 (36) AFRL 3.65 4.06 3.87 4.66 3.93 3.99 4.06 -
GBSG / BR 6747-1NC
NAVAIR 3.40 1.01 1.37 1.86 2.31 2.61 3.16 14 (12) AFRL 3.57 4.16 4.76 5.32 5.01 5.13 5.79 -
Whi
dbey
2024
-T35
1
PAA / BR 127
NAVAIR 3.58 0.23 0.37 0.39 0.24 0.63 0.52 89 (15) AFRL 3.55 0.22 0.27 0.39 0.17 0.22 0.25 -
GBSG / BR 6747-1
NAVAIR 3.35 0.15 0.37 0.47 0.60 1.23 1.30 57 (30) AFRL 3.53 2.52 2.72 3.12 3.47 4.05 4.14 -
GBSG / BR 6747-1NC
NAVAIR 3.38 0.14 0.47 0.61 0.67 1.34 1.29 30 (20) AFRL 3.55 0.55 1.09 1.79 3.10 4.20 4.13 -
7075
-T65
1
PAA / BR 127
NAVAIR 3.47 0.17 0.23 0.35 0.23 0.21 0.19 99 (2) AFRL 3.51 0.11 0.15 0.26 0.19 0.25 0.26 -
GBSG / BR 6747-1
NAVAIR 3.41 1.10 1.22 1.07 1.28 0.50 0.50 45 (22) AFRL 3.52 3.05 3.66 3.50 3.59 3.51 3.50 -
GBSG / BR 6747-1NC
NAVAIR 3.48 0.24 0.62 1.06 1.53 2.15 2.12 19 (13) AFRL 3.63 1.34 2.60 4.12 3.50 3.12 2.94 -
Notes: 1Average failure mode of 8 specimens removed and characterized after 6, 9, 12, and 24 months
Figure 22: Total crack length data over exposure time at Canaveral for FM 73M samples fabricated at NAVAIR
0.00
0.50
1.00
1.50
2.00
2.50
3.00
3.50
Crack Length (inches)
Canaveral / FM 73M / NAVAIR
6 mo
9 mo
12 mo
15 mo
18 mo
24 month

33
Figure 23: Total crack length data over exposure time at Whidbey for FM 73M samples fabricated at NAVAIR
Initial mode-of-failure consideration consisted of a visual inspection and assignment of either “cohesive,” “mixed-mode,” or “adhesive” failure mode. “Cohesive” was defined as 100% failure within the adhesive layer, which is typically desirable for surface preparation and primer evaluations since it indicates the prepared/primed interface between the adherend and adhesive is stronger (or more durable) than the adhesive itself. “Adhesive” was defined as 100% interfacial failure between the adhesive and adherend, with no consideration to failure within the surface treatment or primer layer. “Mixed-mode” was defined as any combination of adhesive/cohesive failure modes regardless of mix percentage. This simplified mode-of-failure assignment scheme, with examples shown in Figure 24, proved useful for screening large numbers of samples for trends.
It was later learned this approach was not ideal when AFRL/RXSA prepared additional DCB specimens during the latter part of the project using improved GBSG surface preparation procedures to more closely examine the effects of individual surface preparation steps. Evaluation of these specimens discovered trends after 6 months of marine environmental exposure (see Section 4.3.1.5) indicating greater cohesive failure percentages in specimens using
0.000.501.001.502.002.503.003.50
Crack Length (inches)
Whidbey / FM 73M / NAVAIR
4 mo
6.5 mo
9.3 mo
14.6 mo
17.6 mo
21 mo
24 month
Figure 24: Initial visual mode-of-failure assignments for the DCB marine atmospheric exposure samples.

34
chromated primer. The original DCB specimens were then inspected using the same approach and more quantitative failure mode assessments were made. Trends showing improved performance using chromated primer not identified with the simplified scheme were noted, as shown in failure mode figures below. With only 2 specimens pulled for disassembly and failure mode inspection per exposure interval, the standard deviation was high for several specimen sets but overall trends and comparison between surface preparation/primer/adhesive systems were evaluated. Despite evaluation of only two specimens per exposure interval, failure mode trends in response to variations in sample preparation were pronounced, particularly over the full 24-month exposure. Differences in performance between primer systems, particularly with EA 9696 adhesive specimens, were not evident in many of the data sets until after 6 months of exposure.
Table 13. Failure Mode Results for DCBs Fabricated by NAVAIR
NAVAIR Specimens
Exp
osu
re
Loc
atio
n
Ad
hes
ive
Alloy Surface Preparation Average Failure Mode (Std. Dev) [% Coh.]1
6 Mo. 9 Mo. 12 Mo. 24 Mo.
Can
aver
al EA
969
6
2024-T351
PAA / BR 127 100 (0) 98 (4) 98 (4) 98 (4) GBSG / BR 6747-1 98 (4) 78 (25) 95 (0) 93 (4)
GBSG / BR 6747-1NC 60 (0) 18 (4) 13 (4) 0 (0)
7075-T651
PAA / BR 127 100 (0) 100 (0) 100 (0) 100 (0) GBSG / BR 6747-1 95 (0) 38 (4) 73 (4) 0 (0)
GBSG / BR 6747-1NC 55 (7) 25 (7) 25 (7) 5 (0)
FM
73
2024-T351
PAA / BR 127 100 (0) 100 (0) 100 (0) 100 (0) GBSG / BR 6747-1 68 (39) 75 (7) 53 (4) 20 (28)
GBSG / BR 6747-1NC 60 (14) 18 (18) 25 (7) 3 (4)
7075-T651
PAA / BR 127 100 (0) 98 (4) 100 (0) 98 (4) GBSG / BR 6747-1 55 (57) 50 (42) 25 (7) 0 (0)
GBSG / BR 6747-1NC 15 (7) 10 (0) 30 (14) 3 (4)
Whi
dbey
EA
969
6
2024-T351
PAA / BR 127 98 (4) 95 (7) 98 (4) 93 (4) GBSG / BR 6747-1 53 (53) 88 (11) 93 (4) 55 (14)
GBSG / BR 6747-1NC 35 (21) 35 (14) 8 (4) 13 (11)
7075-T651
PAA / BR 127 93 (11) 100 (0) 100 (0) 100 (0) GBSG / BR 6747-1 60 (49) 98 (4) 95 (0) 75 (14)
GBSG / BR 6747-1NC 65 (7) 33 (18) 38 (4) 23 (18)
FM
73
2024-T351
PAA / BR 127 95 (0) 75 (28) 100 (0) 85 (7) GBSG / BR 6747-1 78 (4) 85 (7) 50 (0) 15 (7)
GBSG / BR 6747-1NC 55 (7) 25 (7) 35 (7) 5 (0)
7075-T651
PAA / BR 127 98 (4) 100 (0) 100 (0) 98 (4) GBSG / BR 6747-1 35 (35) 53 (18) 33 (25) 60 (0)
GBSG / BR 6747-1NC 40 (0) 20 (7) 18 (18) 10 (0) 1Average failure mode of 2 specimens removed and characterized after 6,9,12, and 24 months
Differences in surface preparation methods employed by NAVAIR and AFRL/RXSA to fabricate the DCB specimens resulted in gross differences in both the crack propagation rate and relative percentage of cohesive failure observed within the test region. Details on surface preparation procedural differences are covered in Appendix B, but the effects of pretreatment prior to grit blasting (with or without Scotch-Brite™ abrasion), grit blasting media (50 micron vs. 54 grit (300 micron)), and grit removal procedures (dry wiping vs. nitrogen blast) were determined, based on a subsequent series of DCB marine atmospheric exposures (Section 4.3.1.4), to be most influential on crack growth and failure mode differences. Assessment of the

35
relative effect of primer inhibitor for these specimens was performed after segregation of the different surface preparation specimens.
Figure 25: Failure mode over exposure period at Canaveral for FM 73M specimens fabricated at NAVAIR
Figure 26: Failure mode over exposure period at Canaveral for EA 9696 specimens fabricated at NAVAIR
Figure 27: Failure mode over exposure period at Whidbey for FM 73M specimens fabricated at NAVAIR
0102030405060708090100
Failu
re M
ode (% Cohesive)
Canaveral / FM 73M / NAVAIR
6 Mo
9 Mo
12 Mo
24 Mo
0
20
40
60
80
100
Failu
re M
ode (% Cohesive)
Canaveral / EA 9696 / NAVAIR
6 Mo
9 Mo
12 Mo
24 Mo
0
20
40
60
80
100
Failu
re M
ode (% Cohesive)
Whidbey / FM 73M / NAVAIR
6.5 Mo
9.3 Mo
12 Mo
24 Mo

36
Figure 28: Failure mode over exposure period at Whidbey for EA 9696 specimens fabricated at NAVAIR
4.3.1.3.1 DCB Multivariate Analysis
Multivariate analysis response screening models were applied to the DCB marine atmospheric (outdoor) exposure (6 month data only) and laboratory (indoor) exposure specimens. ARL’s Material Selection and Analysis Tool (MSAT) relational database was used to consistently categorize 2079 experimental data points (multiple primers, indoor and outdoor conditions, and multiple surface preparations) as consistently formatted categorical and numerical variables for multivariate statistical analysis input. Response screening modeling was used to analyze the simultaneous influences of adhesive, aluminum grade, surface preparation, environmental conditioning, and chromate primer inhibitor to a variety of crack extension durability tests. Response screening provided a means to determine practical differences in response between multiple factors, as previously explained for the indoor WCET multivariate analysis.
Figure 29 shows a DCB test specimen used to calculate Environmental Crack Extension Force (GIscc). GIscc is determined at a constant loading tip displacement (y) by measuring the crack length (a) as a function of time.
223
2232
6.016
6.03
ahha
hhaEhyGIscc
Equation 1: Environmental Crack Extension Force
0102030405060708090100
Failu
re M
ode (% Cohesive)
Whidbey / EA 9696 / NAVAIR
6.5 Mo
9.3 Mo
12 Mo
24 Mo
Figure 29: Experimental AMS3695 double cantilever beam sample

37
Equation 1 shows the energy based approach used to derive GIscc, which is the adhesive Mode I opening fracture energy. This is a DCB configuration,
where: y = opening displacement, specified at 0.100 in (2.54 mm) E = Young’s modulus h = height of one beam b = width of one beam (not shown, specified as 1.00 inches) a = crack length measured from the point of load application
Crack growth may then be converted to GIscc by Equation 1using a sample width of 1.00 inch (25.4 mm), h = 0.50 inches (12.7 mm), and E = 10600 ksi† (73.1 GPa) for 2024 aluminum.
While the DCB configuration represents the ideal configuration for deriving the pure Mode I opening fracture energy of adhesively bonded joint, due to the exponential nature of the energy balance derivation the test is highly sensitive to both opening displacement (y) and initial crack length (a). Per Equation 1, the energy driving crack growth is very high at short crack lengths and decreases rapidly as the crack length increases. Furthermore, by setting y as a constant value the initial crack length is allowed to vary, which introduces each individual DCB specimen to environmental exposure with varying initial loads. Figure 30 shows a plot of GIscc versus crack length, which can be seen to significantly vary in the region of opening crack lengths ranging for 75 mm to 100 mm and portrays a representative example of the variations in opening fracture energy for the DCB batch samples.
To minimize the variations in initial opening fracture energy evident in the specimens for subsequent multivariate statistical analysis, the opening fracture energy variations were normalized by defining the percentage Environment Crack Extension Force lost during the marine atmospheric exposure testing as follows in Equation 2:
1006
InitialG
monthsGInitialGLostG
Iscc
IsccIsccIscc
Equation 2: Percentage Environment Crack Extension Force lost during the outdoor exposure testing
The fracture energy lost was normalized to 6 months as data for all 384 samples was available for multivariate analysis prior to removing limited numbers samples for periodic mode-of-failure inspections as time progressed. Furthermore, as the fracture energy is biased towards higher loading at shorter crack lengths, the trends in response to variations in sample preparation were clearly and consistently discernable at 6 months, as shown in the data plots below. To assist with
† E = 10400 ksi (71.7 GPa) for 7075 aluminum
Figure 30: Fracture energy (GIscc) versus crack length (a)

38
plot interpretation, data points aligned on the lower portion of the curve (lower extension force lost during exposure) indicate better bond performance. Data points on the upper portion of the curve indicate poorer bond performance.
Figure 31 through Figure 33 show the plots of % GIscc lost versus crack growth as a function of mode-of failure for all 6-month specimens, including both adhesives. As expected, cohesive failure results in significantly less % GIscc lost in comparison to adhesive mode-of-failure.
Figure 31 Outdoor DCB; percent fracture energy lost versus crack growth (Mode-of-failure = cohesive, time = 6 months). 82 samples, average GIscc lost = 6.4% (+/- 4.9%), average crack growth = 21.8mm (+/- 13.8mm)
Figure 32 Outdoor DCB; percent fracture energy lost versus crack growth (Mode-of-failure = mixed-mode, time = 6 months). 72 samples, average GIscc lost = 14.9% (+/- 16.9%), average crack growth = 38.4mm (+/- 17.4mm)
% GI
scc l
ost
% GI
scc l
ost

39
Figure 33 Outdoor DCB; percent fracture energy lost versus crack growth (Mode-of-failure = adhesive, time = 6 months). 95 samples, average GIscc lost = 82.3% (+/- 51.0%), average crack growth = 81.6mm (+/- 21.4mm)
Figure 34, Figure 35, and Figure 36 show plots of % GIscc lost versus crack growth for DCB samples primed with Cytec BR 127 chromated solvent-based, Cytec BR 6747-1 chromated water-based corrosion inhibited, and Cytec BR 6747-1NC noninhibited water-based primer, respectively, with both adhesives. Upon first impression, the Cytec BR 127 chromated primer appears to offer superior performance in terms of minimizing % GIscc lost and total crack growth, but these plots do not portray the influence of surface preparation, aluminum alloy, adhesive, or conditioning site. Multivariate analysis techniques must be used to assign relevance to these additional experimental factors.
Figure 34: Outdoor DCB; percent fracture energy lost versus crack growth (Primer = Cytec BR 127 Cr (VI) corrosion inhibiting primer, time = 6 months). Average GIscc lost = 8.1% (+/- 10.1%), average crack growth = 24.7mm (+/- 15.8mm), mode-of failure: sample not observed = 43, cohesive = 77, mixed-mode = 8, adhesive = 0
% GI
scc l
ost
% GI
scc l
ost

40
Figure 35: Outdoor DCB; percent fracture energy lost versus crack growth (Primer = Cytec BR 6747-1 chromate corrosion inhibiting water based primer, time = 6 months). Average GIscc lost = 52.4% (+/- 47.7%), average crack growth = 61.3mm (+/- 32.4mm), mode-of-failure: sample not observed = 48, cohesive = 4, mixed-mode = 32, adhesive = 44
Figure 36: Percent fracture energy lost versus crack growth (Primer = Cytec BR 6747-1 NC non-chromate water based primer, time = 6 months). Average GIscc lost = 50.8% (+/- 56.1%), average crack growth = 60.6mm (+/- 28.0mm), mode-of-failure: sample not observed = 44, cohesive = 1, mixed-mode = 32, adhesive = 51
The first measure taken in obtaining a multivariate perspective is to simply re-plot % GIscc lost versus crack growth using a bivariate grouping by primer and surface preparation, as shown in Figure 37 and summarized in Table 14. As can be seen, the PAA/ BR 127 primer combination was mutually exclusive. The BR 6747-1 and BR 6747-1NC primers were not used with PAA surface treatment and BR 127 primer was not used with the grit blast/sol-gel surface treatment. Considering only the BR 6747-
% GI
scc l
ost
% GI
scc l
ost

41
1 and BR 6747-1NC primers, differences in GIscc lost versus crack growth was more apparent with respect to surface preparation than primer.
Figure 37: Percent fracture energy lost versus crack growth (Bivariate with respect to primer and surface preparation, time = 6 months)
Table 14 Average GIscc lost, crack growth, and mode-of-failures for bivariate primer and surface preparation conditions (time = 6 months). “Sample-not-observed” is in reference to mode-of-failure observations. All samples were include in the reported average GIscc lost and crack growth values.
300 micron grit blast 50 micron grit blast PAA
BR
127
Not tested Not tested
GIscc lost = 8.1% (+/- 10.1%) Crack growth = 24.7mm (+/- 15.8mm) Sample not observed = 43 Cohesive = 77 Mixed-mode = 8 Adhesive = 0
BR
674
7-1
GIscc lost = 14.5% (+/- 23.2%) Crack growth = 32.9mm (+/- 19.6mm) Sample not observed = 26 Cohesive = 4 Mixed-mode = 31 Adhesive = 3
GIscc lost = 90.2% (+/- 33.9%) Crack growth = 89.7mm (+/- 9.6mm) Sample not observed = 22 Cohesive = 0 Mixed-mode = 1 Adhesive = 41
Not tested
BR
674
7-1
NC
GIscc lost = 17.8% (+/- 9.4%) Crack growth = 47.3mm (+/- 17.5mm) Sample not observed = 24 Cohesive = 0 Mixed-mode = 25 Adhesive = 15
GIscc lost = 83.8% (+/- 63.7%) Crack growth = 74.0mm (+/- 30.2mm) Sample not observed = 20 Cohesive = 1 Mixed-mode = 7 Adhesive = 36
Not tested

42
To determine the influence of the chromate the analysis was then restricted to the BR 6747-1 and BR 6747-1NC, as these were both pretreated by variations of a grit blast/sol-gel process. Percent GIscc lost (Y) versus crack growth (X) was fit to a response screen model using JMP Statistical Discovery 11.2.0., with consideration for categorical variable grouping (conditioning, substrate material, surface preparation, primer, adhesive). The fundamentals of the response screening model are described in the WCET multivariate analysis (Section 4.3.1.2.1). The PAA/BR 127 datasets were hidden and excluded from the analysis protocol. The results of the response screen model are plotted as Ymean (GIscc lost) versus FDR LogWorth, as shown in Figure 38. Percent GIscc lost (Ymean) decreases with increasing FDR LogWorth. From Table 15 there is a distinct segregation of samples pretreated with 300 micron grit blast medium towards decreased percent GIscc lost (Ymean) and increasing values of FDR LogWorth.
Figure 38: YMean (% GIscc lost) versus False Data Rate LogWorth (FDR LogWorth) for BR 6747-1 and BR 6747-1NC datasets. R2 = 0.343475, R2 Adjusted = 0.321591, Root Mean Square Error = 20.76483, Mean of Response = 60.97746, Observations (or Sum Wgts) = 32
The summarized statistical output from the response screening model shown in Table 15 is simultaneously tracking multiple categorical experimental factors including environmental conditioning, substrate material, surface preparation, primer, and adhesive. While there is an obvious shift of the samples pretreated with 300 micron grit blast medium towards decreased percent GIscc lost (Ymean) and increasing values of FDR LogWorth, the relative weightings of the remaining categorical variables are more difficult to visualize. This can be facilitated in JMP by performing a distribution analysis of the values in Table 15 using the categorical variables as the Y columns and FDR LogWorth as the frequency, as shown in Figure 39 through Figure 43. These distribution plots clearly show surface preparation dominates the marine atmospheric exposure DCB response. Aluminum grade, adhesive, conditioning site, and primer categorical variables were not statistically different after 6 months of exposure. However, as discussed in Section 4.3.1.3 and shown in Figure 20 through Figure 23, when the surface preparation variables are removed and when exposure goes beyond 6 months, the presence of chromate inhibitors in the primers clearly contributed to better durability performance.
20
30
40
50
60
70
80
90
100
YMea
n
1.5 2 2.5 3 3.5 4 4.5 5 5.5 6FDR LogWorth

43
Table 15 Response Screening Model results for outdoor exposure testing of DCB samples ranked by FDR LogWorth. E
xpos
ure
Sit
e
Alu
min
um
A
lloy
Gri
t si
ze
(mic
ron
)
Pri
mer
Ad
hes
ive
Cou
nt
Y M
ean
P V
alue
FD
R
Log
Wor
th
Ran
k
Fra
ctio
n
R S
qu
are
CC 2024 300 6747-1 EA 9696 8 29.06 1.64E-07 5.580 0.0625 0.992 WI 7075 300 6747-1 EA 9696 8 26.80 1.17E-07 5.580 0.03125 0.993 WI 7075 300 6747-1NC EA 9696 8 27.50 4.07E-07 5.362 0.09375 0.989 WI 7075 300 6747-1NC FM 73 8 42.67 1.74E-06 4.857 0.125 0.982 CC 7075 300 6747-1NC FM 73 8 60.53 5.14E-06 4.499 0.15625 0.975 WI 7075 300 6747-1 FM 73 8 43.36 5.95E-06 4.499 0.1875 0.973 CC 2024 300 6747-1 EA 9696 8 32.81 1.02E-05 4.495 0.28125 0.968 CC 2024 300 6747-1NC FM 73 8 44.63 8.20E-06 4.495 0.25 0.970 CC 2024 300 6747-1 FM 73 8 59.13 1.08E-05 4.495 0.3125 0.968 CC 7075 300 6747-1NC EA 9696 8 31.30 7.86E-06 4.495 0.21875 0.971 WI 2024 300 6747-1NC FM 73 8 35.71 1.10054E-05 4.495 0.34375 0.967 CC 7075 50 6747-1NC EA 9696 8 97.87 0.00001503 4.397 0.375 0.964 WI 2024 300 6747-1NC EA 9696 8 54.31 1.79037E-05 4.356 0.40625 0.962 WI 2024 300 6747-1 EA 9696 8 28.07 1.99876E-05 4.340 0.4375 0.960 WI 2024 50 6747-1 EA 9696 8 79.98 2.29E-05 4.311 0.46875 0.958 CC 7075 300 6747-1NC EA 9696 8 53.87 2.50692E-05 4.300 0.5 0.957 WI 2024 300 6747-1 FM 73 8 29.61 3.23327E-05 4.216 0.53125 0.953 CC 7075 50 6747-1NC FM 73 8 75.95 3.93948E-05 4.155 0.5625 0.950 CC 7075 50 6747-1 EA 9696 8 96.98 5.60958E-05 4.025 0.59375 0.944 WI 2024 50 6747-1NC FM 73 8 52.40 0.000147763 3.626 0.625 0.923 WI 7075 50 6747-1 FM 73 8 87.83 0.000158258 3.618 0.65625 0.921 CC 2024 50 6747-1 EA 9696 8 88.71 3.12E-04 3.344 0.6875 0.901 WI 7075 50 6747-1 EA 9696 8 94.51 3.72E-04 3.286 0.71875 0.895 CC 7075 300 6747-1NC EA 9696 8 42.35 4.40E-04 3.249 0.78125 0.890 WI 7075 50 6747-1 FM 73 8 96.68 0.000423277 3.249 0.75 0.891 CC 2024 50 6747-1 FM 73 8 93.05 5.65E-04 3.157 0.8125 0.880 WI 2024 50 6747-1 FM 73 8 84.41 0.000695728 3.084 0.84375 0.872 WI 2024 50 6747-1NC EA 9696 8 72.49 1.03E-03 2.929 0.875 0.854 CC 7075 50 6747-1 FM 73 8 92.45 0.001069311 2.928 0.90625 0.852 CC 2024 50 6747-1NC FM 73 8 49.13 1.35E-03 2.842 0.9375 0.841 CC 2024 50 6747-1NC EA 9696 8 85.70 9.23E-03 2.021 0.96875 0.704 WI 7075 50 6747-1NC FM 73 8 61.44 1.18E-02 1.928 1 0.680

44
Figure 39 Response Screening Model distribution rankings of the marine atmospheric conditioning sites relative to the frequency of FDR LogWorth (with standard error)
Figure 40 Response Screening Model distribution rankings of the aluminum grade relative to the frequency of FDR LogWorth (with standard error)
Cape Canaveral Air Force Station
NAS Whidbey Island
0 20 40 60Count
0.10 0.30 0.50Probability
aluminum 2024 T3
aluminum 7075
0 20 40 60Count
0.10 0.30 0.50Probability
p = 0.50 count = 64
p = 0.50 count = 62
p = 0.49 count = 62
p = 0.51 count = 64

45
Figure 41 Response Screening Model distribution rankings of the GBSG surface preparation process relative to the frequency of FDR LogWorth (with standard error)
Figure 42 Response Screening Model distribution rankings of the bonding primer relative to the frequency of FDR LogWorth (with standard error)
GBSG (300 micron)
GBSG (50 micron)
0 20 40 60 80Count
0.10 0.30 0.50Probability
Cytec BR 6747-1 Bonding Primer
Cytec BR 6747-1NC Bonding Primer
0 20 40 60Count
0.10 0.30 0.50Probability
p = 0.58 count = 73
p = 0.42 count = 53
p = 0.51 count = 64
p = 0.49 count = 62

46
Figure 43 Response Screening Model distribution rankings of the adhesive relative to the frequency of FDR LogWorth (with standard error)
To confirm that fabrication site, conditioning site, aluminum grade, and adhesive as categorical variables were not statistically significant to the response of the 6-month DCB specimens, the response screen model was re-run for the PAA/BR 127 datasets only, with BR 6747-1 and BR 6747-1NC data excluded. The output plot of Ymean (GIscc lost) versus FDR LogWorth for the PAA/BR 127 datasets is shown in Figure 44.
The corresponding distribution analysis of the response screening model outputs for the PAA/ BR 127 datasets, shown in Figure 45 and Figure 46, confirm that within each categorical variable that there was statistically no difference in DCB response due to variations in fabrication site, conditioning site, aluminum grade, and adhesive.
FM 73
Hysol EA9696
0 20 40 60Count
0.10 0.30 0.50Probability
Figure 44 YMean (% GIscc lost) versus False Data Rate LogWorth (FDR LogWorth) for PAA/BR 127 datasets. R2 = 0.136826, R2 Adjusted = 0.075171, Root Mean Square Error = 5.545829, Mean of Response = 24.68266, Observations (or Sum Wgts) = 16
15
20
25
30
35
40
YMea
n
2 3 4 5 6 7 8FDR LogWorth
p = 0.48 count = 60
p = 0.52 count = 66

47
Whi
dbey
Isl
and
NA
S
Cap
e C
anav
eral
AF
S
Figure 45 Response Screening Model distribution rankings of the fabrication sites and marine atmospheric conditioning sites relative to the frequency of FDR LogWorth (with standard error)
Figure 46 Response Screening Model distribution rankings of the aluminum grade and adhesive relative to the frequency of FDR LogWorth (with standard error)
AFRL
NAVAIR
0 10 20 30 40 50Count
0.10 0.30 0.50Probability
aluminum 2024 T3
aluminum 7075
0 10 20 30 40 50Count
0.10 0.30 0.50Probability
FM 73
Hysol EA9696
0 10 20 30 40 50Count
0.10 0.30 0.50Probability
p = 0.49 count = 48
p = 0.51 count = 50
p = 0.48 count = 46
p = 0.52 count = 51
p = 0.47 count = 46
p = 0.53 count = 51
p = 0.53 count = 51
p = 0.47 count = 46

48
The response screen model was further analyzed by assuming no statistical difference in performance between BR 127, BR 6747-1, and BR 6747-1NC and categorical variable grouping for conditioning, substrate material, surface preparation, and adhesive, with plotted results shown in Figure 47.
Figure 47 YMean (% GIscc lost) versus False Data Rate LogWorth (FDR LogWorth) for all PAA and Grit Blast datasets (assume constant primer response). R2 = 0.51998, R2 Adjusted = 0.498161, Root Mean Square Error = 18.32931, Mean of Response = 48.87919, Observations (or Sum Wgts) = 24
Figure 48 and Figure 49 show the response screening model distribution rankings for the aluminum grade, adhesive, surface preparation, and conditioning site (BR 127, BR 6747-1, and BR 6747-1NC assumed equivalent). Higher counts and probabilities correlate to decreased DCB average GIscc lost versus crack growth response. Surface preparation dominates the marine atmospheric exposure DCB response, with PAA outperforming 280 micron GBSG and GBSG (300 micron) outperforming GBSG (50 micron).
Figure 48: Response Screening Model distribution rankings of the aluminum grade and adhesive type relative to the frequency of FDR LogWorth (with standard error)
10
20
30
40
50
60
70
80
90
100
YMea
n
4 6 8 10 12 14 16FDR LogWorth

49
Aluminum grade, adhesive, and conditioning site categorical variables were not statistically different. Further evidence of the significance of surface preparation in durability performance were the influence of elimination of a pre-grit blast sanding step and the unanticipated influence of the cloth wipe used in the DCB specimens before and after the 50 micron processing, respectively.
Figure 49: Response Screening Model distribution rankings of the surface preparation and marine atmospheric conditioning site relative to the frequency of FDR LogWorth (with standard error)
4.3.1.4 Additional DCB Testing – Surface Preparation Analysis
In response to the large differences in crack growth and failure mode results between NAVAIR and AFRL/RXSA DCB specimens, two additional DCB test matrices were executed. All specimens were prepared by AFRL/RXSA/UDRI using combinations of materials and methods that were anticipated to help assess the differences found in the original matrix. The first test matrix, identified as “Round 1,” included the variables that were identified as being primarily responsible for the differences in the original DCB test results. The second test matrix, identified as “Round 2,” expanded testing to include both chromated and nonchromated primer systems. Both test matrices were limited to 7075-T651 aluminum adherends only. The specimens were placed at the Canaveral AFS exposure site and monitored by AFRL/RXSA. Crack growth measurements were performed in approximately 3 month intervals. The test matrices are detailed in Table 16 and Table 17.
Table 16. GBSG Surface Preparation Evaluation (DCBs) “Round 1”
Surface Preparation ID Primer Number of Specimens
No Abrasion / GB(50 μm, Std) / Duralace / SG (AB)
BR 6747-1
10 No Abrasion / GB (50 μm, Std) / N2 / SG (AB) 10 Scotch-Brite HP / GB (50 μm, Std) / N2 / SG (AB) 10 Roloc / GB (50 μm, Std) / N2 / SG (AB) 10 Roloc / GB (50 μm, AG) / N2 / SG (AB) 10 NAVAIR GBSG Process 10 Roloc / GB (54 Grit, Std) / N2 / SG (FB) 10 PAA 10 PAA BR 6747-1NC 10 PAA None 10

50
Table 17. GBSG Surface Preparation Evaluation (DCBs) “Round 2”
Surface Preparation ID Primer Number of Specimens
Roloc / GB (50 μm, Std) / N2 / SG (AB) BR 6747-1 10 BR 6747-1 NC 10
Roloc / GB (50 μm, Std) / Duralace / SG (AB) BR 6747-1 10 BR 6747-1 NC 10
No Abrasion / GB (50 μm, Std) / N2 / SG (AB) BR 6747-1 10 BR 6747-1 NC 10
No Abrasion / GB (50 μm, Std) / Duralace / SG (AB) BR 6747-1 10 BR 6747-1 NC 10
Roloc / GB (54 Grit, Std) / N2 / SG (AB) BR 6747-1 10 BR 6747-1 NC 10
Roloc / GB (54 Grit, Std) / N2 / SG (FB) BR 6747-1 10 BR 6747-1 NC 10
Roloc / GB (54 Grit, Std) / Duralace / SG (AB) BR 6747-1 10 BR 6747-1 NC 10
The specimens were fabricated, machined, and evaluated following the procedures in Appendix B with several modifications. The polyurethane topcoat previously used to protect the aluminum surfaces of the DCB outside of the bondline was omitted, opting instead to rely solely on the nonchromated primer (Deft 02GN084) to protect the exterior surfaces. This modification was made to mitigate the difficulties involved with locating the crack tip on the edge of the specimen; a procedure that vastly complicated by the polyurethane topcoat in the previous set of DCBs. The bolts used to open the specimens were the same type used previously except for the addition of a recessed feature to the end of one of the bolts. The recessed feature of the modified bolt formed a ball-and-socket coupling at the mid-plate of the specimen. With this modification, Mode III opening, the sideways torque generated by slippage of the flat fastener heads against each other in the original DCB specimens, was virtually eliminated since the bolts did not slide past each other as they were tightened. The UTF-2 fixture (see Appendix B, Figure 109) was used to locate crack tips for the Round 1 and Round 2 evaluations.
The surface preparations for these evaluations are identified in the above tables using the format “Pretreatment process / Grit-blast process / Sol-gel process / Grit removal process” to identify the process variables. The only exceptions are the specimens labeled “NAVAIR GBSG Process” and “PAA,” which were fabricated using the NAVAIR GBSG and PAA processes detailed in Appendix B. Specific details for the remaining processes are detailed below.
Pretreatment All adherends were wiped clean with acetone-moistened Duralace® 9404 wipes until no discoloration appeared on the surface of a clean wipe. The adherends were then exposed to one of three different pretreatment processes: “Roloc,” “No Abrasion,” and “Scotch-Brite HP.” The details for each pretreatment process are described below.
“Roloc” Process: The bonding surface of each adherend was abraded using Scotch-Brite™ VFN Roloc™ surface conditioning discs on a high-speed, 90-degree grinder (Dotco®) powered by clean, dry nitrogen. A new Roloc disc was used for each set of adherends or when the abrasive finish was visibly worn. Abrasion debris was removed by successive wiping of the surface with clean acetone-moistened Duralace 9404 wipes until no discoloration appeared on the surface of a new wipe. The final wiping pass was performed using a double-wipe method in which the acetone-

51
moistened wipe was immediately followed by a dry wipe to ensure debris removal prior to acetone evaporation.
“No Abrasion” Process: No further pretreatment process was performed after solvent wiping. The specimens were taken directly to the grit-blast process.
“Scotch-Brite HP” Process: The bonding surface of each adherend was manually abraded using Scotch-Brite 7447 hand pads (HPs). Abrasion debris was removed by successive wiping of the surface with clean acetone-soaked Duralace 9404 wipes until no discoloration appeared on the surface of a clean wipe. Final wiping was performed using the double-wipe method.
Grit-Blast All adherends were grit blasted immediately after pretreatment per one of the processes detailed above. Two grit-blast (GB) variables were investigated: grit size and the standoff distance of the nozzle from the surface of the adherend. Grit sizes were varied between 50 µm and 305 µm (54 grit) while standoff distances varied between aggressive (AG), approximately 1-inch standoff, and standard (Std), approximately 6-inch standoff. The grit-blast variables are presented within parentheses after “GB” in the Surface Preparation ID columns in Table 18 through Table 21. For example, a grit-blast process using 54 grit with a 6-inch standoff would have the ID “GB (54 grit, Std).” The grit sizes were selected to reflect the differences between the NAVAIR and AFRL/RXSA materials and processes. Standoff distance was varied to determine the inherent sensitivity of the grit-blast process. All grit-blasting processes were performed in an enclosed chamber using approximately 70 psig of clean, dry nitrogen to propel the grit.
Grit Removal Grit was removed from the blasted surfaces of the adherends by wiping with clean, dry Duralace 9404 wipes or blowing the surface with approximately 35 psig clean, dry nitrogen. The two techniques are presented in the Surface Preparation ID columns of the tables as “Duralace” or “N2.”
Sol-Gel Application Two variables were controlled for the sol-gel (SG) application process to assess the differences between the AFRL/RXSA and NAVAIR methods. The sol-gel solution was applied using either a 0.5-inch wide acid brush (AB) or a 3-inch wide foam brush (FB). Acid brush application follows the AFRL/RXSA process with AC-130-2 solution applied to a flat (horizontal) specimen. Consequently, the sol-gel solution pools on the surface before being drained off, which may result in the insufficient removal of residual grit. Conversely, the NAVAIR foam brush application process applied the sol-gel solution to surfaces of adherends angled at approximately 60 degrees. The angle of the adherend causes sol-gel to wash across the surface and requires frequent reapplication of sol-gel to maintain a wetted surface; the constant flow of sol-gel solution may help to remove residual grit.
4.3.1.5 Results – Additional DCB Testing – Surface Preparation Analysis
The results for the “Round 1” and “Round 2” DCBs are presented in Table 18 through Table 21. The average failure modes reported in Table 18 and Table 20 are the average of all specimens,

52
regardless of when they were removed from the exposure site and characterized. Conversely, failure mode data presented in
Table 19 and Table 21 are the average for the specimens removed from the exposure site at specific intervals. The following observations can be made:
Removal of specimens from the dataset led to anomalous average crack growth results; crack length for a set of DCBs may appear to decrease with progressively longer exposure time
The grit removal process was the most significant factor contributing to the large disparity in crack growth between the NAVAIR and AFRL/RXSA DCBs in Section 4.3.1.3
− Removal of residual grit from the adherend surface with a dry Duralace wipe drove joint failure to adhesive failure at the interface between the primer and aluminum adherend and increased the crack length
The “Round 2” DCB specimens prepared with a standard GBSG process [Roloc / GB (50 µm, Std) / N2 / SG (AB)] indicated that BR 6747-1 outperformed BR 6747-1NC in both failure mode and crack growth
− Specimen sets with known “bad” or poor-performing surface preparations produced erratic test results without clear trends between the chromated and noninhibited primers
Table 18. DCB “Round 1” Results
Surface Preparation ID Primer Initial Crack [in.]
Average Crack Growth [in.] Average Failure Mode
[% Coh.]1
3 Mo.
8 Mo.
12 Mo.
15 Mo.
22 Mo.
No Abrasion/GB(50 μm, Std)/Duralace/SG (AB)
BR 6747-1 2.88 5.03 5.07 5.13 4.85 5.30 7
No Abrasion / GB (50 μm, Std) / N2 / SG (AB)
BR 6747-1 2.81 0.80 1.18 1.13 0.76 0.82 9
Scotch Brite HP / GB (50 μm, Std) / N2 / SG (AB)
BR 6747-1 2.80 0.19 0.30 0.38 0.36 0.49 81
Roloc / GB (50 μm, Std) / N2 / SG (AB) BR 6747-1 2.86 0.14 0.27 0.24 0.21 0.21 91 Roloc / GB(50 μm, AG) / N2 / SG (AB) BR 6747-1 2.91 0.08 0.23 0.39 0.38 0.42 86
NAVAIR GBSG Process BR 6747-1 2.86 0.11 0.17 0.31 0.23 0.23 96 Roloc / GB(54 Grit, Std) / N2 / SG (FB) BR 6747-1 2.88 2.32 2.66 2.95 2.69 3.01 2
PAA None 2.90 0.11 0.13 0.11 0.08 0.08 100 PAA BR 6747-1 2.89 0.05 0.17 0.20 0.20 0.20 99 PAA BR 6747-1NC 2.87 0.10 0.14 0.21 0.32 0.35 100
1Average of 10 specimens removed and characterized for crack growth after 8, 12, and 22 months of exposure
Table 19. Failure Mode Results for Round 1 DCBs
Surface Preparation ID Primer Average Failure Mode (Std. Dev) [% Coh.]
3 Mo.
8 Mo.1 12 Mo.2 15 Mo.
22 Mo.3
No Abrasion / GB(50 μm, Std) / Duralace / SG (AB) BR 6747-1
No
data
0 (0) 17 (24)
No
data
5 (0)
No Abrasion / GB (50 μm, Std) / N2 / SG (AB) BR 6747-1 5 (9) 5 (4) 17 (6)
Scotch Brite HP / GB (50 μm, Std) / N2 / SG (AB) BR 6747-1 91 (2) 75 (4) 78 (14)
Roloc / GB (50 μm, Std) / N2 / SG (AB) BR 6747-1 90 (6) 93 (2) 90 (7)
Roloc / GB(50 μm, AG) / N2 / SG (AB) BR 6747-1 86 (2) 95 (0) 78 (20)
NAVAIR GBSG Process BR 6747-1 99 (2) 95 (0) 93 (5)
Roloc / GB(54 Grit, Std) / N2 / SG (FB) BR 6747-1 0 (0) 0 (0) 5 (4)
PAA None 100 (0) 100 (0) 100 (0)
PAA BR 6747-1 100 (0) 100 (0) 98 (2)
PAA BR 6747-1NC 99 (2) 100 (0) 100 (0)

53
1Average of 4 specimens 2Average of 3 specimens 3Average of 3 specimens
Table 20. DCB “Round 2” Results
Surface Preparation ID Primer Initial Crack [in.]
Average Crack Growth [in.] Average Failure Mode
[% Coh.]1
3 Mo.
6 Mo.
9 Mo.
12 Mo.
Roloc / GB (50 μm, Std) / N2 / SG (AB) BR 6747-1 2.70 0.07 0.14 0.19 0.35 89
BR 6747-1 NC 2.70 0.09 0.43 1.23 3.32 55
Roloc / GB (50 μm, Std) / Duralace / SG (AB) BR 6747-1 2.69 0.50 0.89 1.17 1.22 13
BR 6747-1 NC 2.75 0.41 1.01 1.56 4.22 39
No Abrasion / GB (50 μm, Std) / N2 / SG (AB) BR 6747-1 2.81 0.63 0.99 0.78 1.24 12
BR 6747-1 NC 2.76 0.69 2.54 3.03 5.73 19
No Abrasion / GB (50 μm, Std) / Duralace / SG (AB)
BR 6747-1 2.77 5.21 5.53 5.31 6.05 6 BR 6747-1 NC 2.83 4.34 5.97 5.94 6.64 4
Roloc / GB (54 Grit, Std) / N2 / SG (AB) BR 6747-1 2.77 0.10 0.14 0.19 0.33 76
BR 6747-1 NC 2.80 0.34 2.09 3.06 4.33 18
Roloc / GB (54 Grit, Std) / N2 / SG (FB) BR 6747-1 2.85 0.08 0.03 0.16 0.25 89
BR 6747-1 NC 2.87 0.68 0.49 4.66 5.09 28
Roloc / GB (54 Grit, Std) / Duralace / SG (AB) BR 6747-1 2.72 0.25 0.57 0.63 0.97 18
BR 6747-1 NC 2.80 0.21 1.37 2.52 3.81 25 1Average of 10 specimens removed and characterized for crack growth after 3, 6, 9, and 12 months of exposure
Table 21. Failure Mode Results for Round 2 DCBs
Surface Preparation ID Primer Avg Failure Mode (Std. Dev) [%Coh.]
3 Mo.1 6 Mo.2 9 Mo.3 12 Mo.4
Roloc / GB (50 μm, Std) / N2 / SG (AB) BR 6747-1 95 (5) 96 (2) 85 (14) 80 (0)
BR 6747-1 NC 100 (0) 73 (25) 40 (14) 8 (4)
Roloc / GB (50 μm, Std) / Duralace / SG (AB) BR 6747-1 33 (25) 3 (3) 8 (4) 8 (4)
BR 6747-1 NC 67 (15) 35 (52) 50 (64) 5 (0)
No Abrasion / GB (50 μm, Std) / N2 / SG (AB) BR 6747-1 10 (0) 12 (0) 18 (0) 8 (4)
BR 6747-1 NC 23 (6) 8 (3) 40 (28) 5 (0)
No Abrasion / GB (50 μm, Std) / Duralace / SG (AB) BR 6747-1 0 (0) 12 (3) 5 (0) 5 (0)
BR 6747-1 NC 0 (0) 5 (0) 5 (0) 5 (0)
Roloc / GB (54 Grit, Std) / N2 / SG (AB) BR 6747-1 77 (23) 92 (3) 90 (7) 45 (7)
BR 6747-1 NC 48 (41) 12 (6) 5 (0) 8 (4)
Roloc / GB (54 Grit, Std) / N2 / SG (FB) BR 6747-1 100 (0) 99 (1) 95 (0) 63 (18)
BR 6747-1 NC 87 (10) 13 (3) 8 (4) 5 (0)
Roloc / GB (54 Grit, Std) / Duralace / SG (AB) BR 6747-1 62 (38) 3 (3) 8 (4) 0 (0)
BR 6747-1 NC 63 (38) 18 (3) 10 (0) 10 (7)
Notes: 1Average of 3 specimens 2Average of 3 specimens 3Average of 2 specimens 4Average of 2 specimens
4.3.1.6 Single-Lap-Joint Cyclic Stress Durability (CSD)
A cyclic stress durability test was evaluated as a potential method for discriminating between the environmental durability of aluminum bonded joints using chromated and nonchromated primers.

54
Single lap joint (lap shear) specimens were exposed to 140°F and >98% RH environmental conditioning and cyclically loaded in tension, thereby, generating a shear stress in the adhesive bondline. The square wave stress cycle induced a tensile load between 0 and 1500 psi within a 30 minute period; an example of the stress wave is depicted in Figure 50. All specimens were tested to failure and the number of cycles to failure and failure mode were recorded. Specimens were fabricated using 2024-T3 and 7075-T6 aluminum adherends in accordance with ASTM D100215 guidelines. Both FM 73 and EA 9696 adhesives were evaluated. The four adhesive-adherend combinations were fabricated using three surface preparations: PAA with BR 127 primer and GBSG with both BR 6747-1 and BR 6747-1NC. Lap shear panels were fabricated using 0.063-inch thick adherends. Bonded panels were machined into 1.0-inch wide specimens, and the edges of the specimens were sanded to remove metal smear within the bondline. Bondline thickness measurements were performed with the aid of an optical microscope. The complete test matrix is presented in Table 22. A picture of the test apparatus is presented in Figure 51.
Figure 50: Cyclic Stress Durability Stress Wave
Table 22: Cyclic Stress Durability Test Matrix
Surface Preparation / Primer
Adhesive Number of Specimens per Alloy 2024-T3 7075-T6
PAA/BR 127 FM 73 5 5
EA 9696 5 5
GBSG/BR 6747-1 FM 73 5 5
EA 9696 5 5
GBSG/BR 6747-1NC FM 73 5 5
EA 9696 5 5

55
Figure 51 Cyclic Stress Test Apparatus
The results for the cyclic stress durability tests are presented in Table 23, Figure 52, and Figure 53. The following conclusions were made:
EA 9696 was more durable than FM 73. Virtually no difference in performance was observed due to bond primer, surface
preparation, or alloy. For the most part, BR 6747-1 and BR 6747-1NC performed as well as BR 127 except in
the case of EA 9696 on 7075-T6 aluminum where the BR 6747-1 survived an average of 30% fewer cycles to failure.
Table 23: Cyclic Stress Durability Test Results
Surface Preparation / Primer Adhesive Average Cycles to Failure ± Std. Dev1
2024-T3 7075-T6
PAA / BR 127 FM 73 454 ± 31c 531 ± 70c
EA 9696 2313 ± 159m 2885 ± 221m
GBSG / BR 6747-1 FM 73 517 ± 44c 443 ± 87c
EA 9696 2430 ± 200m 1682 ± 138m
GBSG / BR 6747-1NC FM 73 517 ± 38c 504 ± 47c
EA 9696 1897 ± 288m 1992 ± 235m
Notes: 1Test environment 140°F/ 95-100% RH c Cohesive failure within the adhesive a Adhesive (interfacial) failure m Mix of cohesive and adhesive failure

56
Figure 52: Cyclic Stress Durability Test Results for EA9696 Figure 53:Cyclic Stress Durability Test Results for FM 73
4.3.2 Electrochemical Analysis
In this section, electrochemical (EC) properties of bond primer systems were assessed for various specimen configurations exposed to a variety of corrosive environments in an attempt to correlate the results to the environmental durability of bonded joints. Early testing focused on characterization of the EC barrier properties for bond primer coated aluminum substrates using EIS. However, testing was unable to provide barrier property results for the specimens with a primer thickness within the range consistently used for adhesive bonding applications. Consequently, various alternative techniques were developed to interrogate corrosion protection properties. SVET allowed localized scanning and higher spatial resolution for mapping and quantifying corrosion activity (anodic/cathodic regions) than EIS and was used with and without exposure to galvanic stress via static or cyclic electrical potential applied to the system (EC stress). Unique tests were also developed to assess corrosion protection provided by the primer system on bonded assemblies using in-situ electrochemical testing of WCET specimens. All EC testing was performed on either PAA or GBSG prepared surfaces primed with commercially available bond primer systems.
The EC data indicated chromated bond primers provide significantly better corrosion protection than the nonchromated or noninhibited bond primers tested when applied at relevant thicknesses on exposed surfaces of aluminum substrates. Within the SVET parameters studied, nonchromated and noninhibited primers experienced dynamic anodic/cathodic electrochemical activity indicating increasing corrosion response over time while chromate inhibited primers exhibited only minor surface potential map changes indicating surface passivation. This passivation and added corrosion protection provided by chromates in applications not within the bondline is invaluable for protecting aluminum parts awaiting bonding operations. Surfaces treated using PAA also provided a more uniform and electrochemically passivated surface resulting in additional corrosion protection over GBSG-treated surfaces for surfaces exposed to corrosive environments outside the bondline. However, the greater protection PAA treatment provided was not sufficient to overcome the need for chromate inhibitors in exposed bond primers. Experimental electrochemical procedures developed to assess the corrosion protection provided by the bond primer within a bonded specimen were unable to discern differences in the performance of chromated and nonchromated bond primers. However, any configuration

57
resulting in exposure of the primer, even if that exposure was caused by noncohesive failure within a joint, exhibited corrosion responses consistent with the electrochemical performance of the exposed primer.
4.3.2.1 EC Stress and EIS
EC stress followed by EIS analysis has been adapted to assess the structural and corrosion resistance characteristics of bond primer films under accelerated environmental test conditions. EC stress includes anodic polarization to induce pitting corrosion in the substrate or cathodic polarization to generate an alkaline environment in order to stimulate delamination of the film. The work in this effort was limited to the use of anodic EC stress coupled with EIS measurements. This testing consisted of three steps: (1) an EIS curve was generated to establish the initial condition of the primer coating at open circuit potential (OCP); (2) the sample was anodically polarized (with respect to a saturated calomel reference electrode (SCE)) to generate localized corrosion and stimulate pitting; and (3) a new EIS curve was generated to assess the condition of the primer coating after pitting. Steps 2 and 3 were repeated to apply additional stress to the sample when desired.
Table 24 identifies the candidates used for this testing and indicates average primer thicknesses. All panels were 7075-T6 aluminum and surface preparation was PAA. To evaluate the barrier properties of the primers, panels were prepared with one, two, or three box (BX) coats (1BX, 2BX, or 3BX) of primer. A box coat was defined as one pass of the primer spray in each of two perpendicular directions.
Table 24: Primed panel candidates for EIS
Primer BR 6747-1 BR 6747-1NC Panel ID Thickness
(mil) ID Thickness
(mil) 1 E3-1.1BX 0.14 E3-1NC.1BX 0.28 2 E4-1.1BX 0.13 E4-1NC.1BX 0.24 3 E3-1.2BX 0.58 E3-1NC.2BX 0.74 4 E4-1.2BX 0.42 E4-1NC.2BX 0.68 5 E3-1.3BX 0.75 E3-1NC.3BX 0.75 6 E4-1.3BX 0.75 E4-1NC.3BX 0.85
Figure 54 shows a set of EIS curves (Bode modulus plots) initially measured for 1BX and 3BX primed aluminum samples exposed to 3.5 wt% NaCl electrolyte at OCP. The sample area exposed was approximately 15cm2. The EIS curves demonstrate several features of bond primer coatings: (1) 3BX primer coatings (both E3-1.3BX and E3-1NC.3BX) exhibit mainly capacitive behavior with a linear slope in absolute impedance |Z| vs. frequency at high frequency ranges and (2) 1BX primers (E3-1.1BX and E3-1NC.1BX) were not observed to exhibit capacitive behavior and behaved mostly like bare aluminum, suggesting electrolyte had already penetrated the coatings. Based on the three-dimensional (3D) surface profiler results presented in the next section of this report, this penetration is likely due to the non-uniform, discontinuous surface coverage inherent in such a thin coating. The results in Figure 54 also imply chromated BR 6747-1 primer may not provide any barrier advantage over nonchromated BR 6747-1NC when very thin coatings are applied, although it is generally expected to offer better corrosion protection due to the presence of chromate. Both 3BX primed samples were further assessed by the EC-EIS method and the results are summarized in Figure 55 and Figure 56 for chromated and nonchromated samples, respectively. It was noted the nonchromated primer had lower coating

58
resistance, and a greater volume of hydrogen was evolved during the EC stress step. Overall, both primer coatings started to degrade after a 16-hrs OCP +200 mV anodic stress step and lost their corrosion protection after the 5hr -600 mV vs. SCE anodic stress step. However, the chromated primer had overall superior barrier properties compared to the nonchromated primer.
Figure 54: EIS spectra (Bode modulus plot), 1BX and 3BX Al samples exposed to 3.5 wt % NaCl solution at OCP
Figure 55: EIS spectra of 3BX film of BR 6747-1 (chromated) Al 7076-T5 sample (E3-1.3BX); Bode plots of impedance
modulus (a) and phase angle (b) before and after two individual EC stress steps in 3.5 wt% NaCl solution.
Figure 56: EIS spectra of 3BX-primed (BR 6747-1NC, nonchromated) Al 7076-T5 sample (E3-1NC-1.3BX); Bode plots of
impedance modulus (a) and phase angle (b) before and after two individual EC stress steps in 3.5wt% NaCl solution.
EC stress identified basic electrochemical differences between chromated and noninhibited bond primers with regard to barrier properties, wetting of metal interface, and charge transfer resistance but only at thicknesses inconsistent with recommended application parameters. At

59
typical 1BX application thicknesses (~ 0.2 mil), chromated and nonchromated bond primers exhibited non-uniform, discontinuous surface coverage and the chromate-inhibited primer provided no barrier property advantage over the nonchromated primer. At thicker films (3BX, ~0.7 mil), barrier property differences emerged; the nonchromated primer had lower coating resistance, greater hydration of the interface, and greater hydrogen evolution during the anodic stress step. Both primer coatings started to degrade after a 16-hour OCP+200 mV anodic stress step and lost their corrosion protection after the 5hr-600 mV vs SCE anodic polarization.
EC stress testing offered fast and detailed analysis of changes in primer characteristics throughout the corrosion process. However, it was not possible to differentiate the location of small local anodes (e.g. pits) and cathodes on the primer surface since a rather larger surface area was exposed for the EIS measurements. This necessitated more localized scanning techniques with higher spatial resolution such as the SVET in order to evaluate localized electrochemical activities on the microscale. Additional work with EC stress was performed using primed panels that were coated with an epoxy adhesive topcoat which allowed visibility into the performance of the primer without being overwhelmed by the signal from exposed substrate resulting from the native porosity in the bond primer thin films. This testing was conducted concurrently with the investigation using primers with variable chromate loading covered in Section 4.3.1.2.
4.3.2.2 Surface Profiles / Electrochemical Performance
In order to assist in characterization of the physical and electrochemical properties of primer film thickness (~0.2 mil) consistent with in-service applications, testing was performed to develop a correlation between surface defect and local (anodic/cathodic in nature) electrochemical behavior. White light interferometry was used to develop a 3D surface topography map of a primer applied to a thickness of approximately 0.2 mil and a similar panel was used to generate an SVET surface voltage map and line profile in a diluted (350 ppm) salt water environment under OCP.
4.3.2.2.1 Results: Surface Profiles / Electrochemical Performance
As shown in Figure 57 and Figure 58, both 3D surface mapping and SVET showed features of non-uniform, discontinuous surface coverage and non-uniform electrochemical features for the primers. From the 3D mapping, at thickness of 0.1 to 0.2 mil, regular pores existed in the bond primer films. Electrochemical impedance measurements indicated bare metal was exposed in 15 cm2 survey area until approximately 0.3 mil thickness was reached. The scanning vibrating probe instrument revealed porosity and electrochemical activity in defects (pores and voids) in bond primer films produced at 0.1 - 0.2 mil thickness.

60
Figure 57: 3D-optical surface profiler showing non-uniform (discontinuous) (a), and (b) about 0.0002” thick BR 6747-1 bond primer.
Figure 58: SVET surface voltage mapping (a), and (b) surface voltage line profile of BR 6747-1 bond primer after ~65 hrs exposure to 350 ppm NaCl solution under open circuit condition.
4.3.2.3 Scanning Vibrating Electrode Technique (SVET) and EC Stress
The objective of this work was to develop and demonstrate SVET methods to detect, characterize, and quantify corrosion processes occurring at the surface of an aluminum substrate underneath bond primer coatings. The principle of SVET is use of a non-intrusive scanning and mechanical vibrating probe (i.e. a micro insulated Platinum/Iridium (Pt/Ir) wire) for mapping the electric field generated in a plane near the surface of an electrochemically active sample in solution. Akin to Atomic Force Microscopy, the SVET allows for mapping and quantifying (by calibration) highly localized corrosion activities (oxidation) in the form of potential gradients within the electrolyte solution which allow monitoring of coating surface defects in real time.16,17,18,19,20 Figure 59 illustrates the measurement schematic and Equation 3 is used for calculating and, ultimately, mapping the local impedance values. Unlike EIS, this technique allows visibility into the electrochemical properties of the bond primers at thicknesses consistent with application recommendations.
Figure 59: Diagram of SVET concept and dimensions
i ∆V
http://research.shu.ac.uk/espnet/ESP.htm

61
Equation 3: Local Ionic Corrosion Current Density
Where: ilocal = localized ionic corrosion current density, ΔVprobe is the measured potential difference between low and high points (amplitude) of the probe, ρ is the solution conductivity, and d is the distance (vibration amplitude) between the two points of the probe.
This testing was performed at UTRC using using a VersaSCAN SVET system (from AMETEK) with detection sensitivity in nanoVolts; spatial resolution of approximately 50μm; Pt/Ir microelectrode with a 30 to 50 μm diameter tip; and vibration amplitude of 40μm.
4.3.2.3.1 Materials and Methods – SVET Primer Evaluation
The experiments were conducted using a 200 μm diameter Pt/Ir electrode with tip diameter of about 30 to 50 μm, vibrated at an 80 Hz frequency in an x-y plane perpendicular to the sample surface at 40 μm amplitude. A graphite bar was used as a bath ground electrode. The normal distance (Z) between the Pt/Ir probe and sample surface was set about 50 to 100 μm. Unless specified, most SVET measurements were performed at OCP in a cell containing ~10 ml diluted 100 – 350 ppm NaCl solution.
Primed specimens used were prepared with both PAA and GBSG surface preparations, performed in accordance with Appendix B on both 7075-T6 and 2024-T3 aluminum panels similar to the EC stress panels. The SVET method maps localized anodic and cathodic regions of the primed surface which allowed testing at application-relevant primer thicknesses and without an epoxy topcoat to eliminate the overwhelming alloy response with EIS testing.
4.3.2.3.2 Results – SVET Primer Evaluation
Figure 60 shows typical SVET surface potential maps collected in a dilute NaCl environment (100 – 350 ppm) for different primers including the nonchromated BR 6747-1NC, chromated BR 6747-1, and blended primer systems containing varying amounts of chromate; details regarding formulation of the blended primer system are provided in Section 4.3.1.2. The SVET measures the surface potential gradients generated ohmically by the ionic current flux passing through the electrolyte from the studied surface; the measured potential is therefore proportional to local ionic current density in the direction of probe vibration which, for this work, was only in the Z direction. The surface potential is measured in 3D, but maps are shown in 2D color-coded projections; higher surface potentials (red regions or peaks if shown in a 3D map) represent the anodic sights and lower potentials (pink regions or troughs) represent the cathodic sights.
The 0% chromate primer (BR 6747-1NC) standard showed a few cathodic spots on a rather large anodic surface. The BR 6747-1NC one box coat panel (E3-1NC.1BX) had many such local cathodic spots in the areas with both strong and weak anodic surface activities. It appears that use of a lower conductive electrolyte, as shown in Figure 62 helps to reveal local surface electrochemical activities.

62
Table 25 summarizes differences in electrochemical activity between chromated, nonchromated, and noninhibited primers by SVET evaluation.
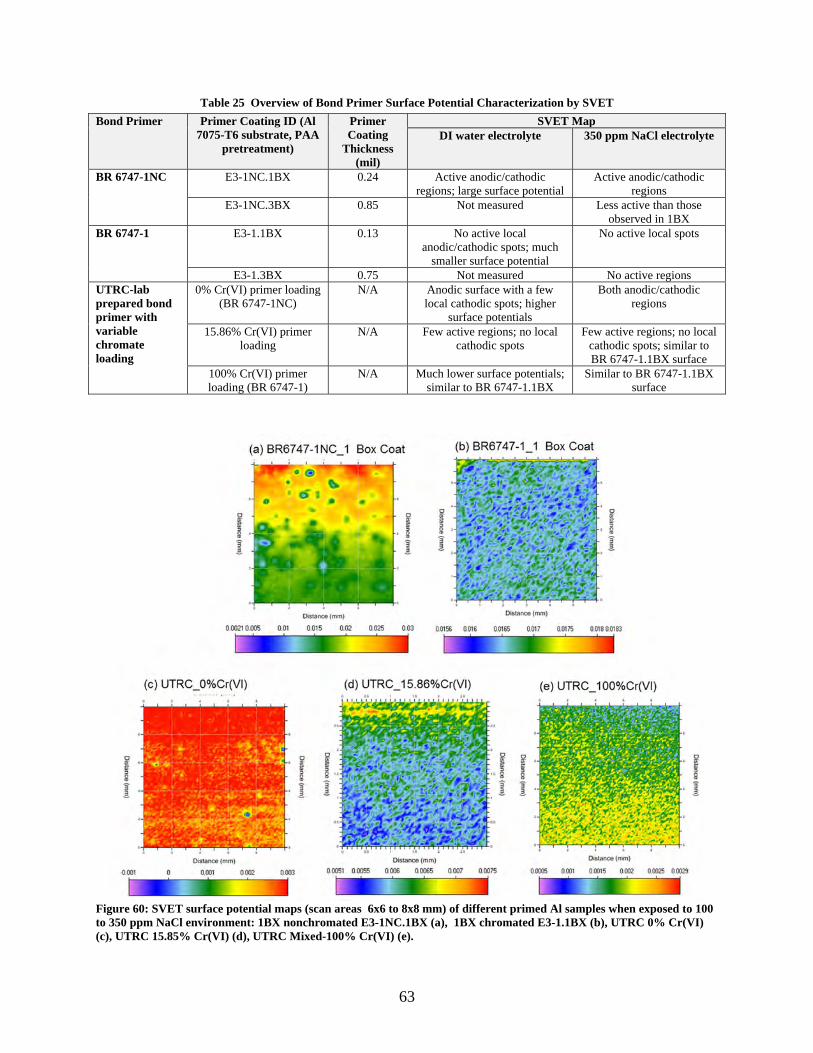
63
Table 25 Overview of Bond Primer Surface Potential Characterization by SVET
Bond Primer Primer Coating ID (Al 7075-T6 substrate, PAA
pretreatment)
Primer Coating
Thickness (mil)
SVET Map DI water electrolyte 350 ppm NaCl electrolyte
BR 6747-1NC E3-1NC.1BX 0.24 Active anodic/cathodic regions; large surface potential
Active anodic/cathodic regions
E3-1NC.3BX 0.85 Not measured Less active than those observed in 1BX
BR 6747-1 E3-1.1BX 0.13 No active local anodic/cathodic spots; much
smaller surface potential
No active local spots
E3-1.3BX 0.75 Not measured No active regions UTRC-lab prepared bond primer with variable chromate loading
0% Cr(VI) primer loading (BR 6747-1NC)
N/A Anodic surface with a few local cathodic spots; higher
surface potentials
Both anodic/cathodic regions
15.86% Cr(VI) primer loading
N/A Few active regions; no local cathodic spots
Few active regions; no local cathodic spots; similar to BR 6747-1.1BX surface
100% Cr(VI) primer loading (BR 6747-1)
N/A Much lower surface potentials; similar to BR 6747-1.1BX
Similar to BR 6747-1.1BX surface
Figure 60: SVET surface potential maps (scan areas 6x6 to 8x8 mm) of different primed Al samples when exposed to 100 to 350 ppm NaCl environment: 1BX nonchromated E3-1NC.1BX (a), 1BX chromated E3-1.1BX (b), UTRC 0% Cr(VI) (c), UTRC 15.85% Cr(VI) (d), UTRC Mixed-100% Cr(VI) (e).

64
Figure 61 shows a profile comparison of a post-SVET surface by interferometry (a) and line profile (b) methods indicating little direct correlation between the primer surface defects and electrochemical activity. Figure 62 shows a series of SVET surface potential maps (scan area from 3x3 mm) with exposure time for a 1 box coat nonchromated primer sample (E3-1NC.1BX) in DI water. The data suggest the primer coating had dynamic localized electrochemical activities where the initially strong anodic surface was weakening with exposure time. One possible explanation for this is corrosion products that precipitated within the coatings, causing progressively fewer local cathodic spots and surface defects to support the anodic dissolution processes.
In contrast, the chromated primed surface has different electrochemical features with exposure time. Figure 63 shows SVET surface potential maps (scan area 6x6 mm) with exposure time up to 65 hrs for 1BX chromated primer sample (E3-1.1BX) in diluted 350 ppm NaCl. Unlike the above results for the nonchromated primer, there are no strong local anodic or cathodic activity spots. The entire chromated coating sample showed relatively uniform electrochemical activity across its surface although this activity changed dynamically with exposure time. The similar electrochemical feature was also confirmed in a panel primed at UTRC using 15.86% chromate primer as shown in Figure 64 where a small surface area 1x1 mm was selected for SVET scan with exposure time.
Figure 61. Post-SVET surface by (a) interferometry and (b) line profile
Figure 62. SVET surface potential maps (scan area 3x3-mm) for 1BX-primed sample (E3-1NC.1BX) with exposure time in DI water.

65
Figure 63: Post-SVET test coat sample surface (a), and SVET surface potential maps (scan area 6x6-mm) for 1BX chromated primed sample (BR 6747-1, E3-1.1BX) with exposure time in diluted NaCl (~ 350 ppm).
Figure 64: Dynamic SVET surface potential maps (scan area 1x1-mm) for UTRC lab prepared -15.86%Cr(VI) chromated primed sample with exposure time in diluted NaCl (~ 350 ppm). In summary, nonchromated BR 6747-1NC (equivalent to UTRC-0% chromate) primer surfaces showed dynamic anodic/cathodic electrochemical activities with exposure time indicating increasing corrosion response, while chromated primers, including BR 6747-1 (equivalent to UTRC-100% chromate) and UTRC-15.85% chromate primer surfaces, all showed only minor surface potential map changes in pattern and time-resolved behavior in diluted (-350 ppm) NaCl indicating passivation of the surface.
4.3.2.4 SVET and EC Stress WCET Specimen
SVET technique was also used to identify electrochemical differences in WCET specimen failure areas. Both local adhesive and cohesive failure areas of WCET specimens that had been exposed to room temperature B117, elevated temperature (140°F) B117, and 140°F and 95%RH conditions, and disassembled were analyzed to understand how chromated and nonchromated inhibitors or the absence of inhibitors impacted bondline durability performance.
4.3.2.4.1 Materials and Methods – SVET and EC Stress WCET Specimen
Unlike primer-only samples, post exposure WCET samples often had rather rough surfaces where the fibers from the adhesive layer interfered with the probe tip scan when the SVET operated at a standard recommended tip/surface distance Z (~100 um). In addition, due to residual surface contamination from WCET exposure, the SVET voltage output was also likely influenced by varying solution conductivity from different level contaminated WCET sample

66
surfaces. Therefore, the effects of both tip/surface distance Z and NaCl concentration (0 to 350 ppm level) on surface SVET voltage output were addressed.
4.3.2.4.2 Results – SVET and EC Stress WCET Specimen
The WCET specimen GBSG/BR 6700-1-11 with cohesive failure after exposure to 140ºF/ and >95%RH was selected for the effects of both tip/surface distance Z and NaCl concentration. As summarized in Table 26, the solution conductivity increased with increasing NaCl concentration, the SVET voltage output appeared to lower from a positive 0.01 mv for 0 to 1 ppm NaCl solution to about -0.01 mV for 100 ppm NaCl when the probe was kept at the same distance Z (~ 200 to 300 um above the WCET surface). In Figure 65, all have a similar SVET map pattern showing key features of both local anodic and cathodic activities. This was confirmed in another WCET PAA/BR 6747-1NC. Figure 66 shows SVET maps (scan area 12x12 mm) for a WCET specimen PAA/BR 6747-1NC in 1-2 and 100 ppm NaCl, respectively when tip/surface was kept at the same distance Z. Therefore, the SVET map is mainly determined by the WCET surface electrochemical property, and it is unlikely that the SVET map is greatly affected by different diluted NaCl solution in the 0 to 350 ppm range. For the effect of tip/surface distance Z on SVET map, a 100 ppm NaCl solution was used for the rest of the SVET evaluations.
Table 26: Effect of solution conductivity and tip/surface distance on SVET surface voltage output.
No. NaCl (ppm) Solution Conductivity (µS/cm)
Probe/surface Distance, Z (µm)
SVET Surface Voltage Output Range (mV)
1 0~1 2.8 ~ 3.1 Same Z -0.025 to 0.01 2 10 39.1 ~ 39.6 Same Z -0.025 to -0.01 3 20 78.6 ~ 81.2 Same Z -0.025 to -0.01 4 100 116.2 ~ 117.5 Same Z -0.025 to -0.015
4-1 100 116.2 ~ 117.5 Z – 100 µm -0.040 to -0.0135 4-2 100 116.2 ~ 117.5 Z + 100 µm -0.043 to -0.0159 4-3 100 116.2 ~ 117.5 Z + 300 µm -0.043 to -0.0155 4-4 100 116.2 ~ 117.5 Z + 500 µm -0.039 to -0.0148 4-5 100 116.2 ~ 117.5 Z + 700 µm -0.037 to -0.0154 5 350 687 ~ 689 Z + 700 µm -0.036 to -0.0133
Figure 65: SVET surface potential maps (scan area 10x10-mm) for a WCET specimen GBSG/BR 6700 sample exposed to
different concentration NaCl environment: (1) 0 ppm, (2) 10 ppm, (3) 20 ppm, and (4) 100 ppm.
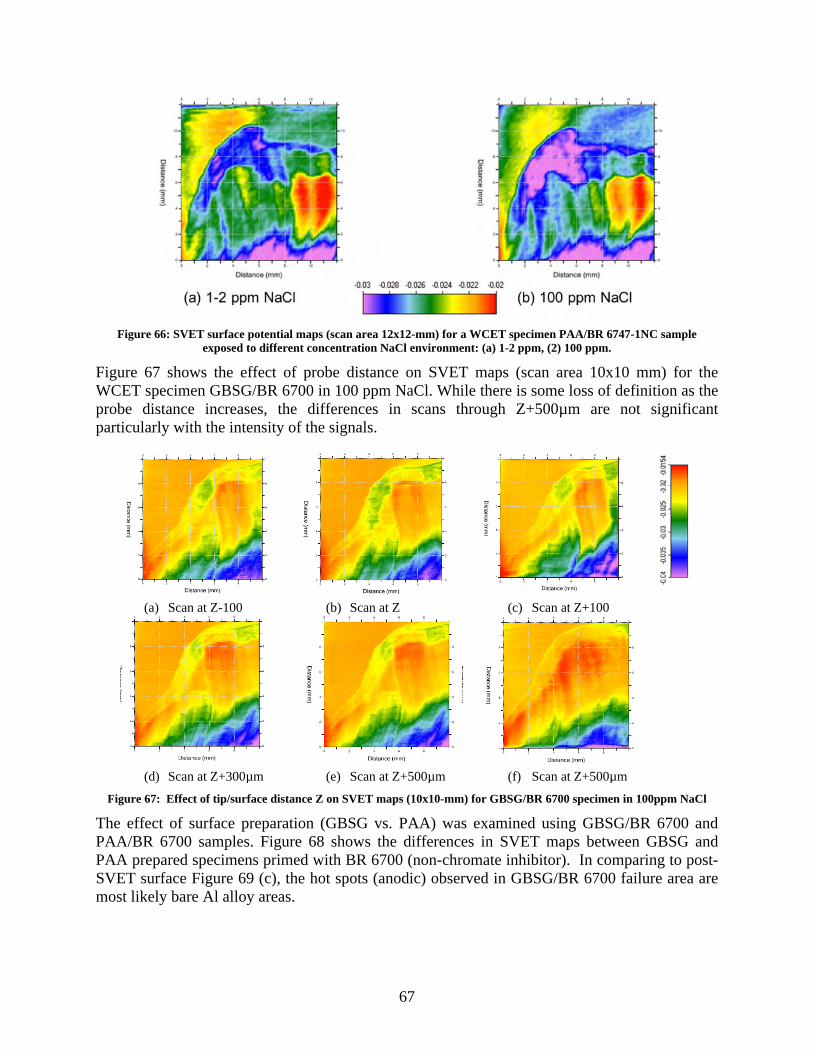
67
Figure 66: SVET surface potential maps (scan area 12x12-mm) for a WCET specimen PAA/BR 6747-1NC sample
exposed to different concentration NaCl environment: (a) 1-2 ppm, (2) 100 ppm.
Figure 67 shows the effect of probe distance on SVET maps (scan area 10x10 mm) for the WCET specimen GBSG/BR 6700 in 100 ppm NaCl. While there is some loss of definition as the probe distance increases, the differences in scans through Z+500µm are not significant particularly with the intensity of the signals.
(a) Scan at Z-100 (b) Scan at Z (c) Scan at Z+100
(d) Scan at Z+300µm (e) Scan at Z+500µm (f) Scan at Z+500µm
Figure 67: Effect of tip/surface distance Z on SVET maps (10x10-mm) for GBSG/BR 6700 specimen in 100ppm NaCl
The effect of surface preparation (GBSG vs. PAA) was examined using GBSG/BR 6700 and PAA/BR 6700 samples. Figure 68 shows the differences in SVET maps between GBSG and PAA prepared specimens primed with BR 6700 (non-chromate inhibitor). In comparing to post-SVET surface Figure 69 (c), the hot spots (anodic) observed in GBSG/BR 6700 failure area are most likely bare Al alloy areas.

68
Figure 68: Effect of surface prep on SVET maps GBSG/BR 6700 (left) and (b) PAA/BR 6700 (right) in 100ppm NaCl
(a) 1st scan at Z (b) 3rd scan at Z (c) 5th scan at Z
Figure 69: Effect of time on SVET maps (scan area scan area 10x10 mm) for GBSG/BR6700 specimen in 100ppm NaCl
at tip/surface distance “Z” from surface (a-e).
(d) 1st scan at Z (e) 10th scan at Z (f) 20th scan at Z
Figure 70: Exposure time effect on PAA/BR 6700-1 SVET maps @ 100ppm NaCl and distance “Z” from surface (a-c)

69
Figure 69 and Figure 70 show the effect of exposure time on the SVET surface potential maps (scan area 10x10 mm) with exposure time for both GBSG/BR 6700-1 and PAA/BR 6700-1 in diluted 100 ppm NaCl. Clearly, the WCET GBSG/BR 6700-1 has dynamic anodic/cathodic behavior with exposure while PAA/BR 6700-1 shows much less heterogeneous features. In summary, the SVET offers another approach to characterize electrochemical differences in WCET specimen failure areas. The hot spots (anodic in nature) observed in SVET maps are most likely due to the presence of bare Al alloy surfaces in failure areas. It appears there is much less effect of probe/surface distance and diluted NaCl on WCET surface voltage. PAA treated surfaces showed a much less heterogeneous SVET map while GBSG surface showed a less stable SVET map with exposure time. PAA/BR 6747-1 surface has much lower surface potential than PAA/BR 6747-1NC.
4.3.2.5 Bonded Joint Hydration
The use of capacitance measurements to investigate hydration and water uptake in adhesive bonds is based on the assumption that change in capacitance of two metal-to-adhesive bonded interfaces can be attributed to the ingress of moisture into the interface. Since the dielectric constant (e) of water is ~80 at 25oC and the dielectric constant of organic materials is typically ~2 – 4, the significant difference in e results in the increase in capacitance when water penetrates into the interface.
Sample capacitance was calculated from EIS measurements at a fixed frequency of 100 KHz. At such a high frequency the sample can be represented by a simple equivalent circuit consisting of a resistance R in parallel with a capacitance (C) determined by Equation 4 below:
)"'(2
"22 ZZf
ZC
Equation 4: Capacitance calculated from EIS measurements
where Z’ and Z” are the real and imaginary parts of impedance measured at a fixed frequency of 100 KHz.
Table 27 identifies the as-bonded (uncracked) and open (cracked) WCET specimens prepared with PAA (using 7075-T6), GB (using 2024-T3), or GBSG (using 2024-T3) surface preparations, BR 6747-1 primer, and EA 9696 adhesive were used for bondline hydration testing. In order to facilitate moisture ingress into the bondline, additional specimens were prepared eliminating primer application.
Table 27: WCET samples tested for hydration
Sample ID Sample Test Configuration GBP-1 Grit blast, no sol-gel, primed Wedge inserted GBP-3 Grit blast, no sol-gel, primed As-bonded GBN-3 Grit blast, no sol-gel, no primer Wedge inserted GBN-7 Grit blast, no sol-gel, no primer As-bonded GBSG-4 Grit blast, sol-gel As-bonded GBSG-5 Grit blast, sol-gel As-bonded GBSG-7 Grit blast, sol-gel Wedge inserted PAA-1 PAA Wedge inserted PAA-5 PAA As-bonded

70
Figure 71 and Figure 72 show some typical changes in capacitance with exposure time for both cracked wedge crack samples and un-cracked samples, respectively. Both PAA and GBSG surface treated samples, whether tested in the uncracked (i.e. PAA-5 and GBSG-4), or tested cracked (i.e. PAA-1 and GBSG-7) state showed negligible changes in their capacitance with exposure time. This implies that the amount water ingress into the bonded samples was too little (< 1%) to be detected by capacitance changes. Noteworthy is that the GBSG-5 sample continued to show no meaningful change in its capacitance even after 54 days of immersion in 60oC water following humidity conditioning. This indicates that the capacitance method is not sensitive enough to measure bond primer hydration even though the technique is widely used for water uptake measurement in primers used for organic top-coats.21,22,23,24,25,26,27
The results for samples with poor surface preparation were slightly more complicated, with respect to the change in capacitance with exposure time. As shown in Figure 71, the cracked samples, such as GBP-1 and GBN-3, had about a 20% reduction in their capacitance after a 60-day exposure to 60 oC-100%RH. The reduction is most likely due to the reduced bonded interface generated by crack growth with exposure time. It was also noted that the cracked samples had about a 30% reduction in their initial capacitance due to the initial reduction in their bonded interface area. Similar to the PAA and GBSG samples with good surface preparation, the un-cracked samples with primer but poor surface preparation such as GBP-3 (Figure 72) showed no capacitance changes up to 60-day exposure while the unprimed/poor surface preparation sample (GBN-7) saw little change during the first week but a significant reduction (~80%) compared to initial capacitance. Duplicate measurements were made but the results were similar leading to the conclusion that the capacitance method is not sensitive enough to evaluate bond primer hydration and water uptake.
Figure 71: Capacitance of (cracked) samples exposed to 60 oC-100%RH conditions
2.0E‐10
3.0E‐10
4.0E‐10
5.0E‐10
6.0E‐10
7.0E‐10
8.0E‐10
9.0E‐10
‐10 0 10 20 30 40 50 60 70
Cap
acitan
ce (F)
Exposure time (days)
PAA‐1
GBSG‐4
GBP‐1
GBP‐1 (Prior to Wedged)
GBN‐3
GBN‐3 (Prior to Wedged)

71
Figure 72. Capacitance of as-bonded (un-cracked) samples; 60 oC-100%RH or 60 oC water immersion
4.3.2.6 Environmental Analysis Using Variable Chromate Loading
As noted in Section 4.3.1.2, Cytec’s BR 6747-1 (chromate inhibitor) and BR 6747-1NC (no inhibitor) primers were sufficiently similar in terms of their formulation to be mixed, in order to generate primers with variable levels of chromate inhibitors. The cyclic EC-stress EIS and SVET testing demonstrated electrochemical differences between primers with different chromate concentrations. The objective of this task was to evaluate the effect of chromate concentrations on the corrosion inhibiting performance of a bond primer and on the environmental durability of adhesive bonded aluminum surfaces. To better understand the role of chromates at locations interior, exterior, and peripheral to bonded joints, testing included EIS evaluation after EC-Stress; corrosion testing of scribed panels by neutral salt fog in accordance with ASTM B117, and bond durability testing through the WCET using two adhesives.
Cyclic stress durability testing using single lap shear specimens was also evaluated as a potential discrimination test between the environmental durability of bonded metal-to-metal joints using chromated and nonchromated primers.
For electrochemical and corrosion (scribe) tests, the blended model resins were spray-applied using the NAVAIR PAA and GBSG processes (Appendix B, 54-grit) with 0.063-inch thick 2024-T3 and 7075-T6 test panels. Primer film thicknesses varied from 0.1 to 0.23 mils typical of the reproducibility of the spray process and within the desired range. The primers were air-dried for 30 minutes followed by a one hour cure at 250ºF. In order to allow electrochemical evaluation via EIS and minimize accelerated corrosion attack on the base metal exposed at pores in the primer layer, half of the primed samples were top-coated with a layer of EA 9636 adhesive.
The adhesive topcoat thickness was controlled by the application of 0.005 inch thick Mylar tape to the long (6 inch) sides of the panels as shims for drawing adhesive over the primed panel
0.0E+00
1.0E‐10
2.0E‐10
3.0E‐10
4.0E‐10
5.0E‐10
6.0E‐10
7.0E‐10
8.0E‐10
9.0E‐10
1.0E‐09
0 20 40 60 80 100 120
Cap
acitan
ce (F)
Exposure time (days)
GBP‐3
GBN‐7
PAA‐5
GBSG‐5 (60C‐100%RH)
GBSG‐5 (60C‐water)

72
surface. The panels were lightly wiped with AMS381928, Class A wipes dampened with acetone and dried thoroughly just prior to application of adhesive. Adhesive was applied to the panel using a clean, dry foam brush leaving a slight excess of adhesive near the top of the panel. A metal straight edge was used to draw the adhesive along the taped edges and to smooth the adhesive into a uniform layer/coating. Due to the short tack time of this adhesive, this operation was performed with a single pass of the draw tool. The adhesive-coated panels were placed in a preheated 150°F (66°C) oven for one hour to cure the adhesive and then removed and allowed to cool to room temperature. Total cured adhesive and primer thickness was measured at four locations approximately 0.5 inch from the taped edges on the panels using a calibrated eddy current probe. Coating thickness ranged from 0.5 to 2.5 mils. EIS results were normalized for coating thickness to remove the influence of this variability.
4.3.2.7 Electrochemical Evaluation
A cyclic galvanic stress test was used to measure the integrity and base metal corrosion protection of bond primer films when exposed to challenging but physically relevant corrosive conditions. The test was conducted by exposing a controlled surface area (15 cm2) of primed metal surface (with an adhesive layer, see Table 28) to a 3.5 weight percent solution of sodium chloride in deionized water using a Gamry instruments PYC1 paint cell. Testing was conducted by equilibrating primed samples for two hours in the cell and then repeating an alternating measurement / exposure cycle twenty times. The measurement portion of the cycle included recording the initial OCP and measuring the potentiostatic electrochemical impedance spectrum of the sample using a 5 millivolt sinusoid varied over the frequency range of 30 kHz – 0.01 Hz. This measurement was followed by exposing the sample to a +100mv (vs the open circuit potential) anodic bias for one hour. The sample was allowed to relax at its open circuit for one hour prior to repeating the measurement / exposure cycle. This cycle and the equivalent circuit model for the porous bond primer film are shown in Figure 73.
Figure 73: Cyclic galvanic test to characterize structure and corrosion inhibition of bond primers
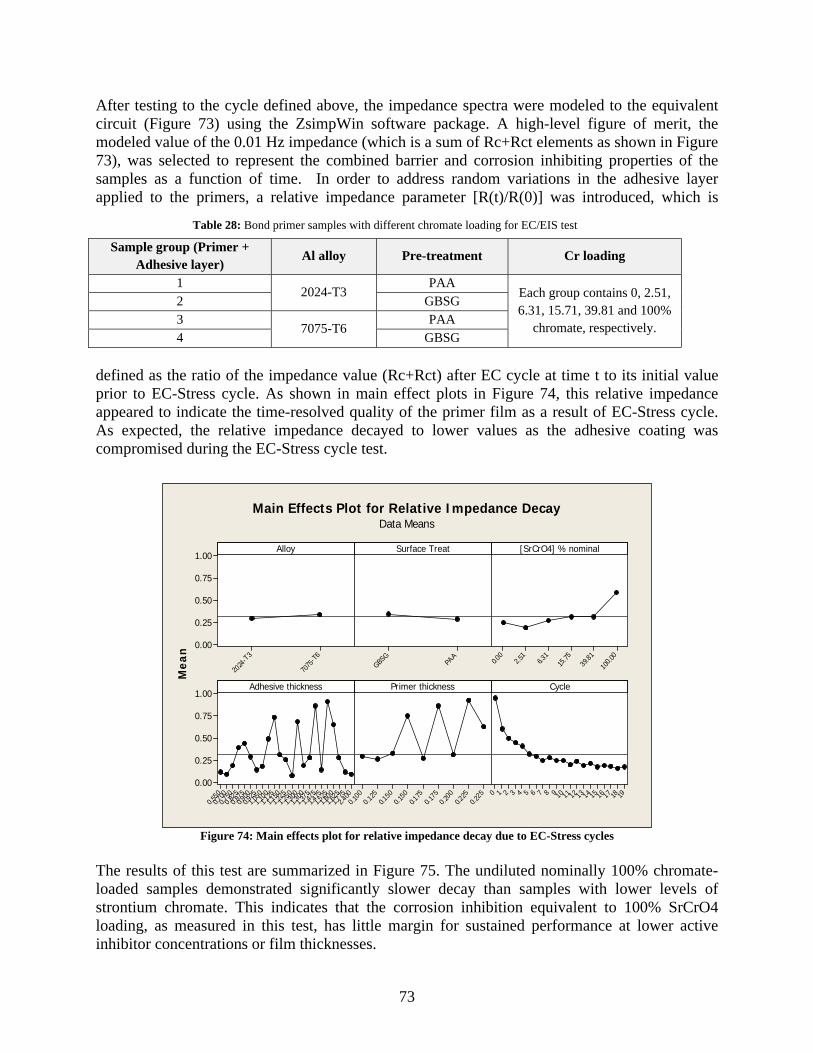
73
After testing to the cycle defined above, the impedance spectra were modeled to the equivalent circuit (Figure 73) using the ZsimpWin software package. A high-level figure of merit, the modeled value of the 0.01 Hz impedance (which is a sum of Rc+Rct elements as shown in Figure 73), was selected to represent the combined barrier and corrosion inhibiting properties of the samples as a function of time. In order to address random variations in the adhesive layer applied to the primers, a relative impedance parameter [R(t)/R(0)] was introduced, which is
defined as the ratio of the impedance value (Rc+Rct) after EC cycle at time t to its initial value prior to EC-Stress cycle. As shown in main effect plots in Figure 74, this relative impedance appeared to indicate the time-resolved quality of the primer film as a result of EC-Stress cycle. As expected, the relative impedance decayed to lower values as the adhesive coating was compromised during the EC-Stress cycle test.
Figure 74: Main effects plot for relative impedance decay due to EC-Stress cycles
The results of this test are summarized in Figure 75. The undiluted nominally 100% chromate-loaded samples demonstrated significantly slower decay than samples with lower levels of strontium chromate. This indicates that the corrosion inhibition equivalent to 100% SrCrO4 loading, as measured in this test, has little margin for sustained performance at lower active inhibitor concentrations or film thicknesses.
7075-T
6
2024-T
3
1.00
0.75
0.50
0.25
0.00
PAA
GBSG
100.0
039.
8115.
756.31
2.51
0.00
2.400
1.775
1.625
1.600
1.525
1.475
1.475
1.375
1.300
1.300
1.250
1.225
1.150
1.125
1.100
1.050
0.925
0.900
0.875
0.825
0.750
0.700
0.550
1.00
0.75
0.50
0.25
0.00
0.225
0.225
0.200
0.175
0.175
0.150
0.150
0.125
0.100 191817161514131211109876543210
Alloy
Mea
n
Surface Treat [SrCrO4] % nominal
Adhesive thickness Primer thickness Cycle
Main Effects Plot for Relative Impedance DecayData Means
Table 28: Bond primer samples with different chromate loading for EC/EIS test
Sample group (Primer + Adhesive layer)
Al alloy Pre-treatment Cr loading
1 2024-T3
PAA Each group contains 0, 2.51, 6.31, 15.71, 39.81 and 100%
chromate, respectively.
2 GBSG 3
7075-T6 PAA
4 GBSG

74
20151050
1.0
0.8
0.6
0.4
0.2
0.0
Cycle
Rel
ativ
e im
peda
nce
deca
y
0.002.516.31
15.7539.81
100.00
% nominal[SrCrO4]
Relative Impedance Decay vs SrCrO4 Loading
Figure 75: Net effect of Cr(VI) loading on primer durability under cyclic galvanic exposure
An analysis of variance, shown in Table 29, shows that the most powerful factors influencing impedance decay are the number of test cycles, followed by strontium chromate concentration, and followed by bond primer thickness. The small difference due to alloy types and surface treatment methods are also statistically significant, with the greatest decay produced by alloy 2024-T3 and the GBSG surface preparation. Adhesive coating thickness is not a significant factor in this analysis, which is partially explained by the normalization approach used to account for random variation in the adhesive coating. However, given the powerful effects of strontium chromate concentration and primer thickness, the electrochemical stress test is believed to be strongly predictive of the active corrosion inhibition characteristics of the coating system, and less sensitive to changes in the barrier properties brought about in the test.
Table 29: Analysis of Variance
Powerful effects
Significant effects
No effects
4.3.2.8 Additional Primers – Electrochemical Evaluation
An additional set of bond primed Al alloy panels using additional primer sets was prepared by UDRI to validate electrochemical differences between chromated and nonchromated primers and assess their impact on corrosion protection outside of a bonded joint. In this test matrix, both Cytec and 3M bond primers were evaluated. Henkel’s Loctite EA9396 paste adhesive was

75
applied as a 5-mil topcoat to allow EIS and EC-stress evaluation given the inherent porosity in the thin primers. This was accomplished by shimming the periphery of the primed panel with a 5-mil, adhesively-backed Teflon film; the adhesive was applied to the primed surface and the panel was covered with an aluminum caul plate with a nonporous Teflon release ply (Figure 76). The panel was cured in a miniclave with using the cure cycle shown in Table 30. The full test matrix is shown in Table 31. The thickness of the adhesive topcoat was difficult to control, which resulted in the high variability. The panels were tested using the same cyclic stress cycle described as above (Figure 73) for comparison of chromate and non-chromate inhibited primers.
Figure 76: EA 9396 Topcoat Panel Assembly
Table 30: Cure Cycle for EA 9396 Adhesive Topcoat
Step Cure Process 1 Apply full vacuum (> 22 in Hg) 2 Apply 40 psig positive pressure 3 Vent vacuum 4 Ramp at 4°F/minute to 250°F 5 Hold at 250°F and 40 psig for 1 hour 6 Cool to ambient no faster than 10°F per minute 7 Release pressure
Table 31: Cytec and 3M bond primed Al alloy panels coated with EA9636 adhesive layer for EIS characterization
Surface Prep Al Alloy Primer Inhibitor EA9396
Thickness (mil) Notes
PAA
7075-T6 EW-5000 Chromate 1.1
UDRI
EW-5000-ET Non-chromate 0.8 EW-5000-NC No inhibitor 2.2
2024-T3
EW-5000 Chromate 2.7 EW-5000-ET Non-chromate 0.7 EW-5000-NC No inhibitor 2.4 BR 6747-1NC No inhibitor 0.9
NAVAIR BR 6747-1 Chromate 0.8
GBSG
7075-T6 EW-5000 Chromate 2.5
UDRI
EW-5000-ET Non-chromate 2.7 EW-5000-NC No inhibitor 1.0
2024-T3
EW-5000 Chromate 0.7 EW-5000-ET Non-chromate 1.7 EW-5000-NC No inhibitor 2.5 BR 6747-1NC No inhibitor 1.7
NAVAIR BR 6747-1 Chromate 1.8
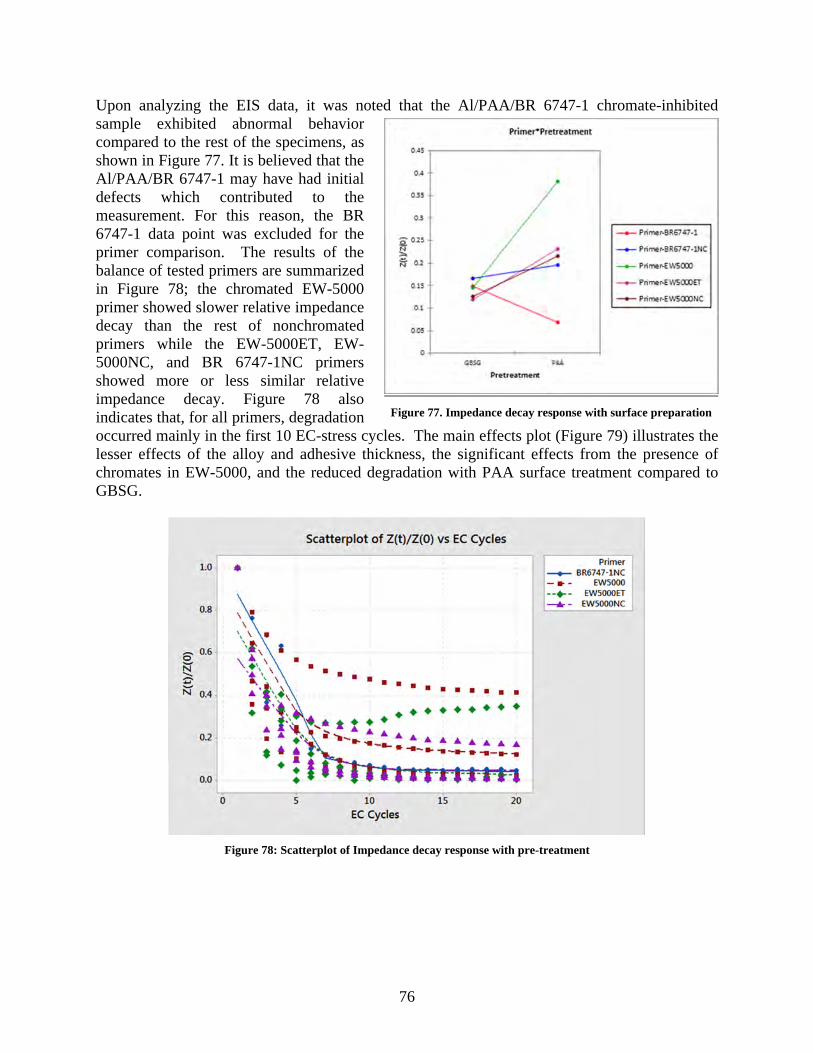
76
Upon analyzing the EIS data, it was noted that the Al/PAA/BR 6747-1 chromate-inhibited sample exhibited abnormal behavior compared to the rest of the specimens, as shown in Figure 77. It is believed that the Al/PAA/BR 6747-1 may have had initial defects which contributed to the measurement. For this reason, the BR 6747-1 data point was excluded for the primer comparison. The results of the balance of tested primers are summarized in Figure 78; the chromated EW-5000 primer showed slower relative impedance decay than the rest of nonchromated primers while the EW-5000ET, EW-5000NC, and BR 6747-1NC primers showed more or less similar relative impedance decay. Figure 78 also indicates that, for all primers, degradation occurred mainly in the first 10 EC-stress cycles. The main effects plot (Figure 79) illustrates the lesser effects of the alloy and adhesive thickness, the significant effects from the presence of chromates in EW-5000, and the reduced degradation with PAA surface treatment compared to GBSG.
Figure 78: Scatterplot of Impedance decay response with pre-treatment
Figure 77. Impedance decay response with surface preparation

77
Figure 79: Main Effects plot for EC data
In addition to using relative impedance decay for comparison, each primer charge resistance (Rct) was extracted from EIS model fitting as a function of cycles, which led to a similar performance ranking: EW-5000>EW-5000ET~EW-5000NC ~ BR 6747-1NC as shown in Figure 80.
Figure 80: Main effects plot for Rct decay
20101
1.000.750.500.250.00
7075
2024
PAA
GBSG
1.000.750.500.250.00
EW50
00NC
EW50
00ET
EW500
0
BR67
47-1N
C
BR67
47-1
EC Cycles
Mea
n
Al alloy
Pretreatment Primer
Main Effects Plot for Rct decayData Means

78
4.3.2.9 Corrosion Testing (Scribe)
For the scribed panel evaluation, five (5) aluminum panels (2024-T3 and 7075-T6, 4”x 6”) were prepared for each primer loading. The panel preparation method, primer concentration, and adhesive topcoat application details are the same as described in the previous section. The conditioning environment for this test was ASTM B117 neutral salt fog (NSF).
Prior to installation in the environmental chamber, half of each primed or primed and adhesive-coated specimen surfaces were scribed with an “X” using a Fowler scribe tool. The scribe was maintained approximately 0.5 inch from the edge tape. The coated and primer-only specimens were segregated and randomized within their group for exposure.
All specimens were conditioned in the same environmental chamber and at the same time using a 15 degree exposure angle with the scribed section at the top. Based on performance in preliminary testing, the primer-only specimens were removed after 48 hours and coated specimens were removed at 672 hours. After removal from the chamber the specimens were rinsed with deionized water, drained and dried. The scribe areas of the specimens were visually examined using up to 30X magnification and categorized according to the inspection criteria listed in Table 32 to evaluate and record the effects of inhibitor concentration in the bond primer.
Table 32: Scribe Evaluation Criteria Severity Scribe Corrosion,
% corrosion 5 0-10% 4 10-25% 3 25-50% 2 50-90% 1 >90%
For both adhesive-coated and primer-only specimens, there was little difference in performance between the aluminum alloys in the dependence on the level of chromate in the primer. The most consistent effects on corrosion performance relative to chromate level were related to surface preparation. The PAA specimens performed consistently better than GBSG-prepared specimens particularly with the scribed adhesive-coated panels and scribe areas of primer-only specimens. Figure 81 illustrates the differences in dependence on chromate level between the surface preparation methods for the primer-only specimens. With GBSG preparation, independent of alloy, corrosion performance improved as the chromate level increased; with PAA, there was some variability in performance but the chromate level had less influence on corrosion severity.

79
Figure 81: Scribe corrosion response: primer chromate loading in primer-only Al7075/GBSG panels after 48 hours in NSF(left); primer chromate loading in primer-only Al7075/PAA panels after 48 hours in NSF (right)
Primed specimens prepared with the adhesive topcoat also demonstrated clear performance differences between surface treatments (PAA or GBSG) but generally demonstrated lower dependence on the level of chromate than the primer-only specimens. Figure 82 illustrates the general differences.
Missing data points due to insufficient initial scribe depth
Figure 82: Scribe corrosion response to primer Cr(VI) loading in adhesive-coated Al7075/GBSG panels after 672 hours NSF (left); Scribe corrosion response to primer Cr(VI) loading in coated Al7075/PAA panels after 672 hours in NSF (right)
A Main Effects plot of all the results is shown in Figure 83. As indicated, the effects of the adhesive topcoat, surface preparation, and the level of chromate inhibitor all played a significant part in scribe corrosion protection.
0
1
2
3
4
5C
orro
sion
Sev
erit
y
Primer/Cr(VI) loading - increasing0
1
2
3
4
5
Cor
rosi
on S
ever
ity
Primer/Cr(VI) loading - increasing
0
1
2
3
4
5Severity5=best
Primer/Cr(VI) loading - increasing0
1
2
3
4
5Severity5=best
Primer/Cr(VI) loading - increasing

80
Figure 83: Main Effects plot for scribed uncoated NSF panels
4.3.2.10 Electrochemical methods – in-situ WCET
Although adhesively bonded wedge crack growth rates and failure modes showed differences when tested in a neutral 3.5 weight percent NaCl salt fog environment compared to those tested in an elevated temperature/high relative humidity environment, it is not clear whether the presence of chromate inhibitor in bond primers provides any inhibition to corrosion activity (if found) in vicinity of wedge crack tips during wedge crack growth. Due to limited access to the crack tip within a WCET specimen, no method is available to directly measure the corrosion activity in the wedge crack interior. An experimental in-situ electrochemical impedance test, in combination with post-test cross-sectioning for bond wedge crack propagation was conducted to assess any corrosion protection provide by the chromate inhibitors in the vicinity of the crack.
For this test, as shown in Figure 84, a standard WCET specimen was modified for in-situ electrochemical impedance monitoring during wedge crack growth. After being coated with masking lacquer along the bond edges to minimize crevice effect on the impedance measurement (Figure 84 (b)), the sample was later wrapped with a heat shrink tubing to form a wedge crack tip cell where a 3.5 weight % sodium chloride solution was introduced, and a small Ag/AgCl reference electrode was positioned, with the two Al alloy adherends acting as two individual working electrodes. A cyclic galvanic stress test was used to electrochemically accelerate crack growth by exposing both Al alloy adherends to a +100mv (vs the open circuit potential) anodic bias for eight hours. AC impedance spectra of both adherends were recorded over the frequency range of 30k Hz – 0.01 Hz before and after each galvanic stress cycle. After 4 cycles with total 36 hour long exposure, each wedge crack sample was further cross-sectioned to assess the level of corrosion damage in the vicinity of the crack tip region.

81
Figure 84: Specimens preparation and set-up for in-situ galvanic bond wedge crack growth test: (a) Schematic of bond wedge crack tip electrodes; (b) Masking lacquer on the bond wedge crack edges; (c) Heat shrink tubing for enclosure of the wedge crack tip; (d) Experimental set-up for electrochemical impedance measurement on both adherends exposed to 3.5% NaCl under a cyclic EC-stress @OCP+100 mV.
Both chromate (BR 6747-1) and non-chromate (BR 6747-1NC) bond primed Al-2024 with PAA treatment wedge crack samples were evaluated using this method. As shown in Figure 85 and Figure 86 (top part of the pictures), both adhesively bonded wedge samples exhibited significant impedance decay in either one side (in the case of Al2024/PAA/BR 6747-1NC) or on both sides (Al2024/PAA/BR 6747-1) as a result of the 36 hour long cyclic EC-stress exposure. Although impedance decay tracked with crack growth, decay was faster and greater in the case of the specimen treated with the nonchromated (BR 6747-1NC) primer. From the cross sectioned images, the differences are interpreted as the chromate inhibitor likely protecting exposed metal behind the advancing crack tip.
Figure 85: Impedance decay of both adherends (Top part of the Figure labeled as side 0 and 1) as results of EC-stress cycles, and X-sectioning of adhesively bonded wedge crack Al2024 /PAA/BR 6747-1NC (Bottom)

82
Figure 86: Impedance decay of both adherends (Top part of the Figure labeled as side 0 and 1) as results of EC-stress cycles, and X-sectioning of adhesively bonded wedge crack Al2024 /PAA/BR 6747-1 (Bottom)
Another noteworthy difference between the chromate BR 6747-1, and non-chromate BR 6747-1NC primer, as shown in Figure 85 and Figure 86, is that the chromate BR 6747-1 had about 10-100 X greater initial impedance than the non-chromate BR 6747-1NC as measured by in-situ electrochemical impedance.
Figure 87: Three X-Z plane X-sectioning of adhesively bonded wedge crack (left side of the Figure, three locations labeled as side , middle, and side-2) after about 36 hr long EC-stress cycles @ OCP+100mV, and a X-Z plane image of bonded wedge crack sample (right side).
As shown in Figure 87, the samples from this test were mounted in colored epoxy in the X-Z plane cross section to enable polishing and inspection for corrosion in the vicinity of the wedge crack tips. Three locations (side 1, middle, and side-2) were sectioning for each primer. Typical cross sectioning images of post-tested wedge crack are shown in Figure 85 and Figure 86 (lower

83
images) for both chromate and non-chromate bond primers, respectively. There was no evidence for corrosion activity found in the vicinity of the crack tips. Impedance decay behavior is therefore likely to be governed by the reactivity of exposed metal behind the crack tip. The higher impedance measurements indicate that the chromate inhibitor is most likely protecting exposed metal behind the advancing crack tip.
4.3.2.11 Electrochemical methods – Edge Scribe Evaluation
Although the interior of the adhesive bond joint is protected from the external environment, bond line edges are susceptible to exposure and potentially to the effects of galvanic corrosion from adjoining conductive materials. A bond line edge protection test was developed to test the sensitivity of adhesive bond joints to this mode of damage, and used to assess the amount of protection against such damage provided by chromate inhibited primers. Three different methods, shown in Figure 88, of creating a defect in the adhesive through a protective lacquer coating were used to drive localized ingress of moisture into the bondline and assess subsequent corrosion.
Method A Method B Method C
Figure 88: Wedge Crack Exposure Methods: (a) Method A – razor knife in adhesive parallel to bondline; (b) Method B – nanoindenter within adhesive bondline; (c) Method C – razor scribes perpendicular to bondline (prior to removal of lacquer coating)
For all of methods used to create defects, bonded wedge crack samples were masked with electroplater’s tape on the front and back faces and with masking lacquer on the bond edges. For the first method tested, Method A (Figure 88 (a)), the lacquer over the bond line was cut by hand with a razor knife parallel to the bond line to expose the adhesive system to the test conditions while avoiding exposure of the metallic substrate. This method was used for initial testing of samples primed with BR 6747-1 and BR 6747-1NC. A particular issue with this method was the difficulty of obtaining a consistent hand scribe across bondlines less than 0.010 inch wide without locally exposing the metal faces of the adherends. For this reason, other methods were also investigated. One of these made use of a nanoindenter, Method B (Figure 88 (b)) to generate a “+” shaped defect in the bondline. This method was used to evaluate BR 6747-1, BR 6747-1NC and several other primer systems. However, given the complexity of this approach and the need for specialized equipment, a third method, Method C (Figure 88(c)) was evaluated whereby three sets of four scribes were made perpendicular to the bondline and spaced 1.5inches apart. This approach consistently exposed the metal edges of the samples to the corrosive conditions so

84
that variability in bondline protection in the presence of nearby bare metal attack could be measured.
All samples were tested in a 3.5 % weight sodium chloride water solution in Pyrex beakers with provision for incrementally withdrawing the samples to enable exposure of multiple test regions in each sample to varying numbers of electrochemical stress cycles. Separate beakers were used for each bond primer. Galvanic corrosion attack was simulated by cyclic polarization of each sample to +100 mv from its open circuit potential (OCP) for 60 minutes, then removing the applied potential to allow the sample to return to a stable OCP, and measuring the impedance spectrum of the sample. This cycle was repeated for 5, 10, 20, and 40 times.
Following cyclic galvanic exposure, the samples were evaluated for bond edge corrosion by serial metallography. The lacquer coating and masking materials were removed and cross-section metallographic mounts were prepared to allow for measurement of the bond edge corrosion by serial metallography.
The deepest instances of attack recorded for each sample region tested by Methods A and B are tabulated in Table 33. Figure 89 illustrates the cross-section of two specimens using Method A in which both sides had significant impedance decay after the first cycle (OCP + 100mV, 5 hours). However, the metallographic cross-section showed an approximate 500 µm depth of edge attack on one side only. As shown in the individual corrosion rate traces for Methods A and B in Figure 90 and in the composite of responses shown in Figure 91, these tests did not establish a relationship between the magnitude of bondline galvanic corrosion attack and the presence of a chromate corrosion inhibitor in the adhesive bond primer.
Al 7075/PAA/BR 6747-1 Specimen Al 7075/GBSG/BR 6747-1 Specimen
Figure 89: Method A, Cross-sectional images of bondline sections after one cycle
Table 33: Bondline Crevice Corrosion Results, Methods A and B
EC-Stress Cycle
@OCP +100mV
Bondline Crevice Corrosion Depth (µm) Al2024/PAA/Primer Al7075/PAA/Primer
BR 6747-1 BR 6747-1NC BR 6747-1 EW-5000 EW-5000-NC EW-5000-ET Razor Razor Razor Indenter Indenter Indenter
5 ND ND ND ND ND ND 10 ND ~180 ND ND ~250-270 ND 20 ~203 ~202 ~257 ND ~312 ND 40 ND ~2411 ~270 ND ~388 ND
ND = Not detected 1Measured at 36 EC-Stress cycles

85
Figure 90: Galvanic corrosion testing of bondline edges.
Figure 91: Bondline edge attack measured with chromated and nonchromated primers (Methods A+B)
As shown in Figure 92 (a), varying amounts of corrosion were detected on the masked faces of the wedge crack samples tested by Method A (parallel razor scribe). This was presumed due to the difficulty in the hand scribe operation which may have locally exposed the metal faces. No face corrosion was detected using Method B (nanoindenter) and Method C test conditions produced visible surface corrosion (Figure 92 (b)) in most, but not all, of the scribed regions in the samples. Because some of the samples showed extensive surface corrosion on one, but not both, sides of the bond line, it is assumed that variations in maskant scribe depth and the extent of scribe edge chipping are responsible for the varying levels of surface corrosion. Surface corrosion manifesting at a distance greater than 1 mm from the bond line is not believed to be affected by the presence of corrosion inhibitor in the adhesive bond primer.
CyclesChromated?
402010501010101010
400
300
200
100
0
Crev
ice
dept
h, u
01
Chromated?
Interval Plot of Crevice depth, uBars are One Standard Error from the Mean

86
(a) Method A (b)Method B (c) Method C
Figure 92: Maskant undercutting from scribing operations: (a) using Method A, (b) using Method B, (c) using Method C As shown in Figure 93, electrochemical impedance monitoring of the wedge crack samples during cyclic galvanic exposure using Method B (nanoindenter) indicated that progressive galvanic corrosion was induced at the bondline by this method.
Figure 93: Nano-indented bondline defect (Method B) EC-Stress using Al2024/PAA/EW-5000-NC Primer
The results obtained using Method C are tabulated in Table 34. Figure 94 depicts several cross-section images of specimens (prepared using Method C) showing corrosion adjacent to the adhesive bond primer at the bond line edge. A total of eight scribes, four per side, were evaluated for each exposure interval of each primer. Galvanic pitting was detected in a total of four scribes at depths ranging from 43 to 94 microns.
Table 34: Summary of bond line edge galvanic stress test by Method C
EC-Stress cycle @OCP+100mV
Side Post-Test Bondline Attack Depth (µm)
BR 6747-1 BR 6747-1NC EW-5000 EW-5000-NC EW-5000-ET
EC-5 Section Right ND/Mod ND/Heavy ~69.7/Mod ND ND Left ND/Heavy ND/Heavy ~94.09/Mod ND/Heavy ND
EC-10 Section Right ~51.77 ND/Heavy ND ND ND/Heavy Left ND/Mod ND/Heavy ND ND ND/Heavy
EC-20 Section Right ND/Heavy ND/Heavy ND/Mod ND ND/Heavy Left ND ND/Heavy ND/Heavy ND ND/Heavy
EC-40 Section Right ND ND/Heavy ND ND/Heavy ND/Heavy Left ND ND/Heavy ~43.34/Heavy ND/Mod ND/Heavy
ND = No bondline corrosion detected; Mod = Moderate surface corrosion; Heavy = Heavy surface corrosion

87
As expected, there was no correlation between surface corrosion of the edge faces and instances of bond line corrosion. There also appears to be no correlation between the number of electrochemical stress cycles and the frequency or depth of bond line corrosion attack. However, all four of the instances of detectable bond line corrosion occurred with primers containing chromate inhibitors.
Figure 94: Clockwise from top left: Metallographic mount arrangement, bond line edge corrosion in chromate-primed samples BR6767-1 (10 cycles), EW-5000 (5 cycles Left side) and EW-5000 (right side) Although each of these test methods exhibited some sensitivity to sample preparation (i.e., scribing, nano-indentation location, lacquer defects, etc.) which led to variations in test response, none of the results obtained indicated that adhesive bond primers without chromate corrosion inhibitors created an increased risk of bond edge attack. Additional work in development of a consistent, repeatable method for evaluating the response of bondline edges to environmental attack may be useful for further understanding the susceptibility of bonded structures to moisture ingress and corrosion.
4.3.3 Bondline System Element Analysis
Bonded joints must ultimately be evaluated as a system. System element performance, whether it is substrates, surface treatments, primers, or adhesives cannot be fully understood without consideration of the final material stack-up. The goal of this task was to advance, develop, and refine system concepts to be screened by mechanical and corrosion testing to confirm they mitigate bondline decay and improve system reliability. Results of an assessment of the effects of phosphoric acid anodize (PAA) post-treatments surface treatments directed at adhesion promotion and interface layer stabilization to isolate the effects of the inhibitor/primer on the properties of the system can be found in Appendix F. Testing of the relative moisture uptake (water and salt water) of adhesives was performed to inform what effect the adhesive layer may have on the durability of a bonded joint; these results are also located in Appendix F.

88
As laboratory-scale PAA and post treatment processes developed at UTRC progressed, it became apparent that further optimization and understanding of the processes was necessary to fully characterize the impact on the panel surface structure. Due to the secondary nature of this task towards meeting the project objective, no further work was performed on this task. There were differences between the two adhesives used in this project, however, investigation into the epoxy adhesive chemistry (crosslink density/cure state, diffusion rate, material degradation, etc.) and/or scrim cloth which may have affected these relative responses to immersion was not the primary focus of this test. These variations, along with individual adhesive chemistry properties, contribute to the necessity of testing a complete bonded system (substrates, surface treatments, primer, and adhesive) in assessing durability.
5 Conclusions and Implications for Future Research/Implementation
5.1 Requirements development and documentation
5.1.1 Common requirements and test protocol
Much effort and discussion was put into selection of the test methods and test environments and their relevance to in-service parts. Getting the ‘right test’ to best assess the role of chromates in bondline durability versus empirically testing alternative primers in various bondline stack-ups drove the progression of tasks and selection of methods. As noted throughout this report, most tests that queried corrosion inhibition in an aluminum alloy bondline resulted in little or no statistical significance in the effect of chromates on environmental durability.
Electrochemical tests identified basic differences between chromated and nonchromated primers when primed specimens were exposed to corrosive environments. Differences between the primers were seen in WCET specimens where the metal surface was exposed due to failure at the aluminum-primer interface but the presence of chromates did not significantly influence corrosion performance adjacent to or beyond those failed or exposed regions. The DCB specimens exposed at Canaveral AFS and Whidbey Island NAS appeared to show significant differences in performance between BR 6747-1 and BR 6747-1NC primers, with chromated primer specimens showing better results (less crack growth and greater cohesive failure mode) than the noninhibited primer. Differences were not apparent until after 6 months of exposure but significant trends became obvious with continued exposure over the 24-month test. An additional set of specimens created to verify original data, as well as clarify the impact of various surface preparation steps, were exposed for 12 months with similar trends in chromated and nonchromated primer performance. Final specimens were collected and evaluated at the end of the project (well after all other data were collected and the final In Progress Review was held).
Long-term exposure of DCB specimens to a marine environment provided a test method that can differentiate chromated and nonchromated primer durability performance. As with other accelerated environmental durability tests, the DCB tests cannot be quantitatively correlated with bonded joint service life so the degree to which they represent actual bonded structures is uncertain. It is possible the test is quite stringent compared to many actual service applications. However, unlike some test methods, DCB test specimens are configured like realistic bonded joints, even though mechanical loading and exposures differ from reality in order to accelerate

89
the effects of environment. Both DCB and WCET specimens have been used for qualification of materials and processes used in bonded joints for many years. Whether either or both are required to assess bond primers for a given application depends on the requirements for that application, including the level of risk those responsible are willing to incur. For this reason, reliance on the DCB test would more likely occur for highly loaded or safety-of-flight critical aircraft bonded joint structures. Less critical applications with relatively low loads and/or less severe environmental exposures would be better candidates for initial transition of nonchromated adhesive bond primers. On-aircraft performance data is also needed to validate the test results generated during this project, and many organizations would require this prior to implementing nonchromated structural adhesive bond primers.
5.1.2 Relevance of beyond bondline application testing/requirements
Adhesive bond primers on metal surfaces, when openly exposed to moist, corrosive environments, react much like other coatings/primers. Their electrochemical behavior is consistent with the protective features of hexavalent chrome inhibitors with chromated inhibited primers providing significantly more corrosion protection than noninhibited primers. Protection provided by even chromate-inhibited primers is limited by the very low application thicknesses – often an order of magnitude thinner (0.2 mil) than most paint primers (2 mil). With such thin films, the presence of voids and porosity has been characterized both by white light interferometry and SVET electrochemical mapping (Section 4.3.2.2.1). Bond primers are not typically used as stand-alone corrosion protection but there are limited applications for which this is the case, and they are used for protection of parts during storage prior to assembly in aircraft manufacture. A part may have surface treatments applied, be primed within established time limits, and then be able to sit, relatively unprotected, for months or even years prior to use. Given the basic electrochemical differences between chromated and nonchromated primers, use of nonchromated primers may compromise this ability to protect corrosion-susceptible surfaces for extended times. Further exploration of the limits of protection for nonchromate primed parts for which corrosion protection is required outside of a bondline was not part of this project but should be performed and understood prior to replacing chromated bond primers with nonchromated alternatives for those applications.
5.1.3 B-CRAT
The original proposal for this SERDP project was based on the hypothesis chromated adhesive bond primers play a critical role in reducing corrosion on surfaces of bonded aluminum substrates that can lead to premature structural failures along the interface between the substrate and the adhesive. Use of nonchromated bond primers was expected to result in reduced environmental durability for most applications. When developed, the B-CRAT would be used by engineers and management to assess the corrosion risk associated with their adhesive bond primer selection and make informed decisions on selecting the system appropriate for their application. Comparisons between chromated and nonchromated primers during this effort were expected to generate data to feed the B-CRAT tool. The project’s determination that adhesive bond primer inhibitor packages are less critical for environmental durability of bondlines than originally assumed and less significant than surface preparation is a finding that may reduce risk for some applications.

90
The B-CRAT tool, as it was originally proposed, turned out to have many factors outside of the scope of material/process decision-making. Appendix E follows the development and functionalization of the B-CRAT. While not a direct application of the tool, the concept of utilizing the material selection factors populated in the tool is demonstrated in the examples below. In selection of the demonstration articles, factors of Material Selection, Damage Tolerance, Environmental Severity, Human Factors, Durability Measurement, and Risk Tolerance were considered.
5.1.4 B-CRAT Concept Demonstration
5.1.4.1 T-45 Rudder
In response to a lack of available RFI rudder assets for usage on T-45 aircraft, NAVAIR authorized the limited manufacture of T-45 Goshawk Training System rudder panel assemblies and the reconditioning of in-service rudder assembly assets to allow return to a serviceable supply condition.
From the experimental test data collected during the SERDP project (WP-2144), it became apparent the presence of chromates contained within the adhesive bond primer was not as critical as previously believed and did not have a significant effect on the failure mode observed for most test coupons used to evaluate the adhesive bond primers and structural adhesive systems used during the project. Fleet Readiness Center (FRC) Southeast has experienced extensive corrosion failures on T-45 Rudder assemblies (reference FRC Southeast Material Engineering Services Requests 2013JX00569 and 2012JX02866). Since corrosion failures were not located where bond primer inhibitors would have a significant effect, a decision was made to consider inclusion of noninhibited adhesive bond primers during the proposed overhaul and repair of the rudder assembly based on SERDP project results and the ability to use highly reliable surface treatment (PAA). An image depicting a typical T-45 Rudder assembly is shown in Figure 95.
Figure 95: Typical T-45 Rudder flight control surface; note the two upper and lower hinge fitting areas.
Extensive corrosion on the T-45 rudder was typically observed around and near the metallic hinge fittings and close out spars. Images depicting this typical corrosion are shown in Figure 96 and Figure 97 below.
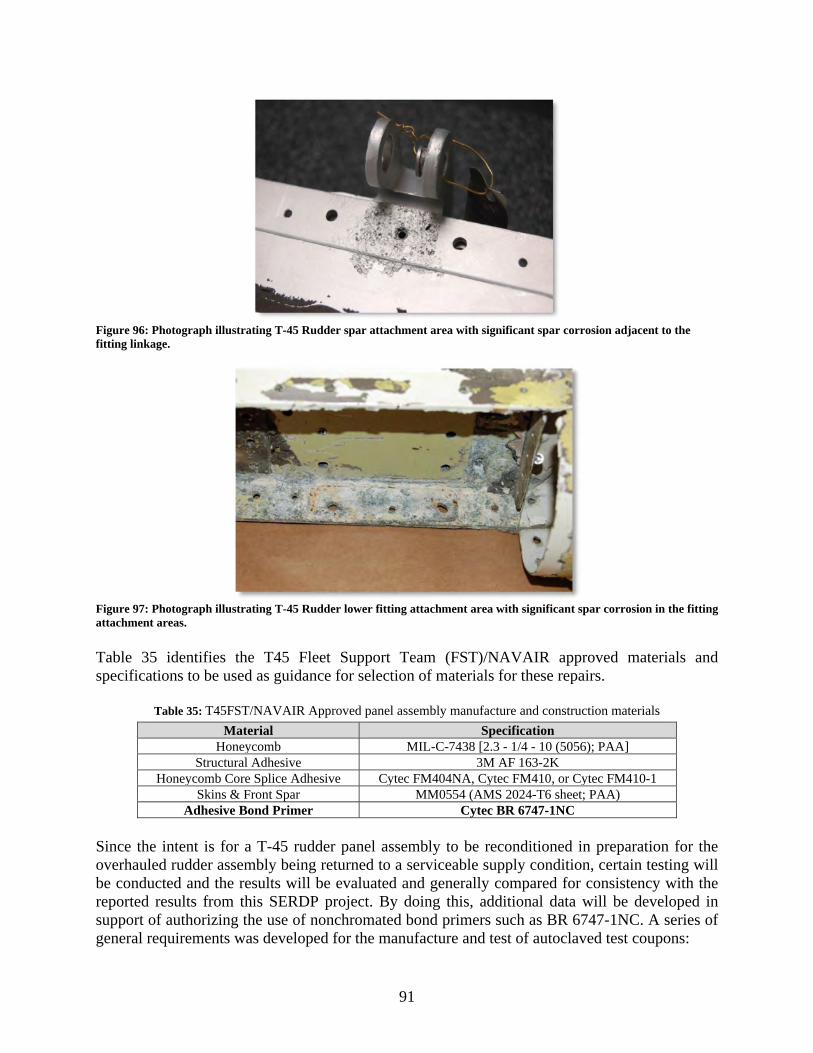
91
Figure 96: Photograph illustrating T-45 Rudder spar attachment area with significant spar corrosion adjacent to the fitting linkage.
Figure 97: Photograph illustrating T-45 Rudder lower fitting attachment area with significant spar corrosion in the fitting attachment areas.
Table 35 identifies the T45 Fleet Support Team (FST)/NAVAIR approved materials and specifications to be used as guidance for selection of materials for these repairs.
Table 35: T45FST/NAVAIR Approved panel assembly manufacture and construction materials
Material Specification Honeycomb MIL-C-7438 [2.3 - 1/4 - 10 (5056); PAA]
Structural Adhesive 3M AF 163-2K Honeycomb Core Splice Adhesive Cytec FM404NA, Cytec FM410, or Cytec FM410-1
Skins & Front Spar MM0554 (AMS 2024-T6 sheet; PAA) Adhesive Bond Primer Cytec BR 6747-1NC
Since the intent is for a T-45 rudder panel assembly to be reconditioned in preparation for the overhauled rudder assembly being returned to a serviceable supply condition, certain testing will be conducted and the results will be evaluated and generally compared for consistency with the reported results from this SERDP project. By doing this, additional data will be developed in support of authorizing the use of nonchromated bond primers such as BR 6747-1NC. A series of general requirements was developed for the manufacture and test of autoclaved test coupons:

92
− All measurements and test result records shall be made and retained. Any and all testing maybe witnessed by the representatives of the T45 FST or NAVAIR community.
− The structural adhesive bonding system (structural adhesive & adhesion promoting primer) and adherend surface preparation shall be evaluated together.
− All witness coupons shall be processed simultaneously in the same autoclave with each respective rudder.
− The surface preparation for the coupons tested shall be PAA (Phosphoric Acid Anodize) per specification ASTM D3933.
In addition, Table 36 identifies the coupon tests required for each Panel Assembly manufactured for Demonstration Test Articles; testing results shall be submitted to T45 FST/NAVAIR for review/approval.
Table 36: T45FST/NAVAIR Required coupon tests for demonstration article panel assemblies
Test Method Min # of
specimens Specimen conditioning/Test temperature
ASTM D1002 (Lap Shear)
5 Condition at room temperature; test at room temperature
5 Condition 30 days IAW ASTM B117 using a 95 °F neutral salt fog (5% NaCl); test at room temperature
5 Condition 30 minutes at 200Fimmediately prior to testing at 200F
5 Condition 30 days IAW ASTM B117 using a 95 °F neutral salt fog (5% NaCl); condition 30 minutes at 200F immediately prior to testing at 200F
ASTM D1781 (Climbing Drum Peel)
5 Utilizing the identical rudder bonding materials (per Table 1), condition at room temperature; test at room temperature
ASTM D3762 (Wedge Crack)
5 Condition 400 hours IAW ASTM B117 using a 95 °F neutral salt fog (5% NaCl)
For purpose of Follow-On Production, the only requirement will be to perform room temperature ASTM D1002 (Lap Shear Test) using a minimum of five (5) room temperature coupons for each Panel Assembly manufactured.
5.1.4.2 F/A-18 Airframe
In order to assess the performance of a nonchromated bond primer on a fielded Navy asset, the F/A-18 FST, in collaboration with the FRC Southwest Materials Engineering Code 43440, has planned installation of an aluminum doubler on a door of an F/A-18D aircraft using Cytec BR 6747-1NC primer. The door will be modified at FRC Southwest by the installation of a 5.0 inch diameter circular doubler on the outer surface. To ensure traceability, the inner surface of the modified door will be marked to indicate that the door is part of a test program. If permanent removal or replacement of the door is required, squadron will notify F/A-18 FST point of contact.
The installed doubler will be periodically evaluated by Code 43440 personnel to include visual inspection and tap-test evaluation. Evaluations will be performed approximately every 300 flight hours or 6 months, subject to squadron availability. In the event of an aircraft transfer, evaluations will be coordinated with the new squadron. Evaluations will be directed by the F/A-18 FST. At the conclusion of the test program, the Code 43440 will take ownership of the door

93
for further evaluation including destructive testing. The door will be returned to the Code 43440 following approximately 1,000 flight hours or three years and a replacement part will be provided by the F/A-18 FST to the squadron, if required. The field trial began in March 2016.
5.1.4.3 Army Ground Vehicle Armor Applications
The results of this project indicate surface preparation is the primary driver for long-term environmental durability of adhesively bonded joints. Inadequate surface preparation led to poor environmental durability test results regardless of corrosion inhibitor content (chromate or not) in the subsequently applied adhesive bond primer. The positive effects of chromated bond primers were only seen in long-term DCB tests and not in the other tests conducted. The surface preparations studied for this project (PAA, 50 micron GBSG, and 300 micron GBSG) are all are all far superior to those used in ground vehicle bonding processes, which can be as simple as solvent wiping. Single-lap-joint testing of GBSG (300 micron) using an armor grade adhesive showed higher strengths than typical armor processing surface preparations and improved performance using the nonchromated BR 6747-1NC bonding primer. The armor application may benefit greatly from improved surface preparation used with nonchromated BR 6747-1NC, and the added improvement that might be gained by using a chromate primer would likely be minimal.
ARL’s position is that a bonding primer’s main function is to protect and preserve the fragile surface preparation from humidity and contamination in the manufacturing environment prior to adhesive bonding to extend the acceptable open exposure time between surface preparation and bonding. Figure 98 illustrates the improvement in open exposure time when the nonchromated primer is used for protection. Considering the results of this project, the Army’s perspective on bond primer will be shifted further toward how well it preserves the integrity of the surface preparation prior to bonding rather than focusing on what the primer is doing (or not doing) for subsequent environmental durability after bonding.
Figure 98: Lap-shear strength of FM-94 film epoxy used to bond Ti (6Al-4V). Adherends were environmentally conditioned in an “open” state after the surface preparation process and prior to bonding.29
0
1000
2000
3000
4000
5000
6000
0 250 500 750 1000
Lap
-sh
ea
r st
ren
gth
(p
si)
Open exposure time @ 140°F, 95% R.H. prior to bonding (hours)
GPS silane with BR 6747-1 primer
GPS silane pretreatment only

94
5.1.5 Transition path to non-chromate/noninhibited primers
The results of this project can be summarized with respect to the following: primer applications beyond the bondline (i.e. not in bonded joint), bonded joints with failure occurring, and bonded joints with no failure. While there was obvious protection from chromated inhibitors at exposed metal areas of cracked joints (sites of metal-primer interfacial failure) and non-bonded areas where exposure to the environment occurred, most tests showed little evidence of inhibitor benefits or corrosion inhibition in a bondline. However, since the long-term marine atmospheric exposure DCB tests conducted late in the project did show improved performance when using a chromated primer, it is possible or even likely chromates are beneficial in some bondline situations.
Unfortunately, the DCB (and other current tests) cannot be quantitatively correlated with service life, so the extent the test is meaningful for real-world applications is unknown. The DCB tests may be too extreme to be applicable or they may simply indicate, in a rather short term, the performance to be expected in service after many years. Understanding the role of chromates in bond primers was expected to guide development of more meaningful test methods. However, many of the traditional and novel tests conducted during this project did not show significant differences between chromated and nonchromated bond primers in adhesive bondlines, so these tests were not helpful in determining the role of chromates in a bondline. Late in the effort, the ability of DCB specimens to differentiate between chromated and nonchromated bond primers was realized, but the means by which chromates improved DCB bondline performance was not determined. Development of improved and well-correlated accelerated tests is still a research need for bonded joints, as well as many other nonmetallic material applications.
Test results from this project, including all DCB tests, lead to the conclusion corrosion inhibitors in adhesive bond primers are less critical for bonded joint environmental durability than previously believed. Surface preparation prior to primer application dominates environmental durability performance. It is probable, given proper surface preparation, nonchromated bond primers could perform adequately in many applications. Transition and implementation of these primers still must follow the same path taken by other structural materials, which includes testing for specific applications and assessment of results by cognizant engineering authorities based on needs for each application. Given the importance of surface preparation and interactions with other materials in a bonded joint, blanket qualifications of adhesive bond primers cannot occur. However, promising test results and implementation for some applications will lead to greater consideration of nonchromated products and reduced testing for new applications. Obtaining in-service data will be critical to implementing nonchromated adhesive bond primers on a large scale. Ideally, nonchromated and chromated versions would be put into service in similar applications for comparison, with all other factors, such as surface preparation and adhesive, kept constant as much as possible. A likely approach would be to use the primers for repair bonding of noncritical structure that requires multiple repairs in close proximity. This scenario can be found on C-5 aircraft, and the application of such repairs is now under consideration for this aircraft.
The path forward for implementing chromate-free adhesive bond primers will likely be a stepwise process involving targeting low-risk applications first. Below is list of substrates in order of low to high risk:
titanium and other corrosion-resistant alloys, such as stainless steel and nickel

95
aluminum with PAA or similar surface preparation aluminum with GBSG surface preparation
Adhesive bond primer intended to provide corrosion protection outside of a bondline would represent a higher risk. Of course, the actual application defines risk more so than simply the substrate. For instance, safety-of-flight critical titanium bonded joints could be higher risk than a noncritical aluminum bonded component using GBSG surface preparation. Other factors for consideration of risk include ease of access for inspection and replacement frequency.
Adhesive bond primers can easily be added to a material specification based on their performance on a specific set of prescribed tests. However, each weapons system application is unique and must be validated by some type of laboratory testing and possibly flight testing. The types tests required and their acceptance criteria will vary based on the organization involved, the criticality of the application, and the level of risk acceptable to the decision makers. For implementation on a targeted component, the substrates, surface preparations and other processing parameters must be defined and data generated to ensure the entire bonding system will function as required for the length of time desired in the service environment.
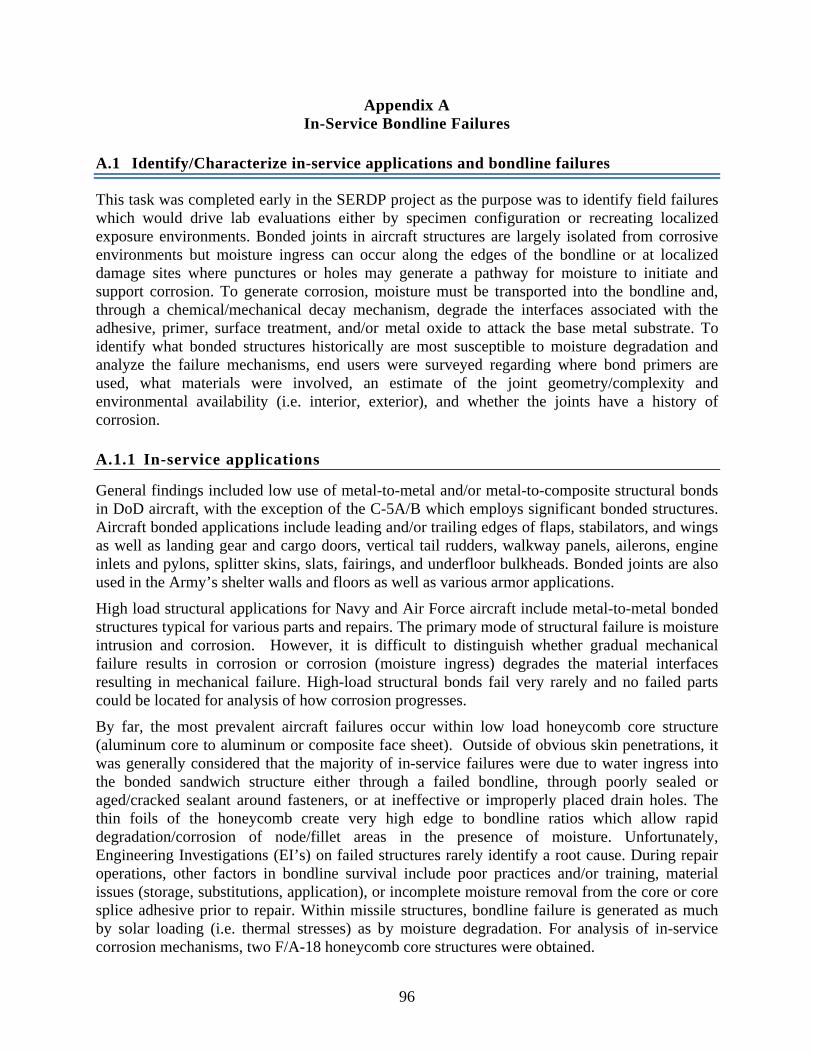
96
Appendix A In-Service Bondline Failures
A.1 Identify/Characterize in-service applications and bondline failures
This task was completed early in the SERDP project as the purpose was to identify field failures which would drive lab evaluations either by specimen configuration or recreating localized exposure environments. Bonded joints in aircraft structures are largely isolated from corrosive environments but moisture ingress can occur along the edges of the bondline or at localized damage sites where punctures or holes may generate a pathway for moisture to initiate and support corrosion. To generate corrosion, moisture must be transported into the bondline and, through a chemical/mechanical decay mechanism, degrade the interfaces associated with the adhesive, primer, surface treatment, and/or metal oxide to attack the base metal substrate. To identify what bonded structures historically are most susceptible to moisture degradation and analyze the failure mechanisms, end users were surveyed regarding where bond primers are used, what materials were involved, an estimate of the joint geometry/complexity and environmental availability (i.e. interior, exterior), and whether the joints have a history of corrosion.
A.1.1 In-service applications
General findings included low use of metal-to-metal and/or metal-to-composite structural bonds in DoD aircraft, with the exception of the C-5A/B which employs significant bonded structures. Aircraft bonded applications include leading and/or trailing edges of flaps, stabilators, and wings as well as landing gear and cargo doors, vertical tail rudders, walkway panels, ailerons, engine inlets and pylons, splitter skins, slats, fairings, and underfloor bulkheads. Bonded joints are also used in the Army’s shelter walls and floors as well as various armor applications.
High load structural applications for Navy and Air Force aircraft include metal-to-metal bonded structures typical for various parts and repairs. The primary mode of structural failure is moisture intrusion and corrosion. However, it is difficult to distinguish whether gradual mechanical failure results in corrosion or corrosion (moisture ingress) degrades the material interfaces resulting in mechanical failure. High-load structural bonds fail very rarely and no failed parts could be located for analysis of how corrosion progresses.
By far, the most prevalent aircraft failures occur within low load honeycomb core structure (aluminum core to aluminum or composite face sheet). Outside of obvious skin penetrations, it was generally considered that the majority of in-service failures were due to water ingress into the bonded sandwich structure either through a failed bondline, through poorly sealed or aged/cracked sealant around fasteners, or at ineffective or improperly placed drain holes. The thin foils of the honeycomb create very high edge to bondline ratios which allow rapid degradation/corrosion of node/fillet areas in the presence of moisture. Unfortunately, Engineering Investigations (EI’s) on failed structures rarely identify a root cause. During repair operations, other factors in bondline survival include poor practices and/or training, material issues (storage, substitutions, application), or incomplete moisture removal from the core or core splice adhesive prior to repair. Within missile structures, bondline failure is generated as much by solar loading (i.e. thermal stresses) as by moisture degradation. For analysis of in-service corrosion mechanisms, two F/A-18 honeycomb core structures were obtained.

97
A.1.2 Honeycomb Core
In an effort to identify the requirements for bonded joint applications and to better understand how moisture transport results in corrosion and failure, a damaged section of an F/A-18C vertical stabilator (Figure 99) scrapped due to un-repairable corrosion of the honeycomb core, was procured from FRC-SW (Jacksonville). A corresponding section of an undamaged stabilator, scrapped because of high (8000) flight hours was provided by FRC-SW (North Island). Various analytical techniques were employed in an attempt to characterize environmental degradation of the surfaces, identify the failure interface, and determine the chemical composition of corrosion products and/or any degraded adhesive materials. The F/A-18 honeycomb sections were constructed of graphite epoxy composite skins (no bond primer) adhered to the aluminum core (suspected, but not confirmed to be Hexcel CRIII, commonly used in F/A-18 production) with a film adhesive containing a scrim cloth ply for thickness control and galvanic isolation.
Figure 99: Damaged area on F/A-18 leading edge of vertical stabilator.
Honeycomb Core - Testing
Sample locations prepared for cross-sectioning are identified in Figure 100. Each sample was prepared by mounting in an epoxy adhesive (fluorescent epoxy adhesive when needed to distinguish from adhesives used in the honeycomb structure) back filling mount and cured prior to cross-sectioning to minimize mechanical damage followed by non-aqueous polishing to avoid any additional corrosion during the preparation. The prepared samples were first examined under an optical microscope for general bonded structure damage assessment and later moved to a high resolution Scanning Electron Microscope equipped with an Energy Dispersive Spectrometer (SEM/EDS) for more detailed analysis. XPS was also used to confirm the SEM/EDS elemental analysis results. As illustrated in Figure 100, five corresponding sample areas in the second undamaged honeycomb structure were prepared for similar cross-sectioning analysis.
The durability of the honeycomb structure largely relies on the effective use of adhesive bonds and sealants to prevent water (moisture) from entering the structure. Service experience has shown that even barely noticeable impact damage to skin can increase the effective transport rate of moisture by about two orders of magnitude compared to an undamaged one, leading to corrosion of the Al core and degradation of the adhesive bonds.30,31,32

98
Figure 100: (a-e) Two Al honeycomb structures for cross-sectioning analysis. Damaged part with obvious skin penetration and areas assigned for cross-sectioning (a-b); undamaged part and corresponding areas for cross-sectioning (c-d); and schematic of cross-sectioning preparation (e).
Through cross-sectioning and analysis, typical adhesive bond failure modes for the damaged honeycomb structure were observed included: 1) skin-to-adhesive disbond as a result of degradation of the interfacial bond between the composite skin and adhesive fillet bond, 2) adhesive fillet bond pull-out (beyond obviously damaged section) as a result of failure of the interfacial bond between al core and the adhesive fillet bond, 3) aluminum (Al) core corrosion damage and buckling due to corrosion reaction and external force impact, and 4) Al core node bond failure because of Al corrosion, as well as degradation of adhesive bonds at the honeycomb core nodes.
Cross-section analysis of samples from damaged Areas-1, -4, and -5 revealed similar failure mode and corrosion damage. It was expected that severe internal corrosion of the Al core and degradation of the adhesive bond would be observed under the damaged skin. To investigate the progression of corrosion through the core, Area-0 in Figure 100 with no visible skin surface damage was cross-sectioned for analysis; Figure 101 (a-d) show representative optical micrographs obtained from Area-0 samples.

99
Figure 101 (a-d) Optical micrographs of Area-0 cross-sectioned from damaged honeycomb structure. Adhesive disbond (a-b) from composite skin, node bond failure (b, c), and heavily corroded Al core underneath skin area with no visible surface damage (d).
Surprisingly, all four types of failure modes were observed under the undamaged Area-0. To further investigate, honeycomb structure from the undamaged stabilator was cross-sectioned for analysis. To analyze core corrosion and node bond failure, higher resolution SEM was used to detail these failures. X-Ray Photoelectron Spectroscopy (XPS) analysis results in Table 37 suggested that the core was manufactured from aluminum alloy 5052 (used in CRIII core) and indicated the surface was treated with a chromate conversion coating (CCC) since the core surface contained a significant amount of Chromium and Fluorine, both of which could come from a typical CCC process. SEM/EDS mapping (Figure 102) confirmed the presence of SrCrO4 needle-like pigments in Al core node bond areas which were not corroded across the honeycomb structure but, as shown in Figure 102, almost no SrCrO4 was present within the heavily corroded node area. This suggests the possibility of chromate leaching as a result of the presence of water coincident with the heavy corrosion of Al core. Figure 103 shows typical corrosion damage observed from the heavily damaged Al honeycomb structure at the cross-sectioned Areas-1, -4, and -5 identified in Figure 100 (b).
Table 37: Al core surface composition by XPS analysis and normal composition of Al 5052 Element (Bare surface) Atomic % (by XPS) 5052 Al (w%)
Oxygen (O) 55.2 Aluminum (Al) 16.7
Carbon ( C) 10.3 Chromium (Cr) 7.1 0.15-0.35
Magnesium (Mg) 6.1 2.2-2.8 Fluorine (F) 3.3
Calcium (Ca) 1.3

100
Figure 102 (a-b). SEM images and EDS spectra of two selected node bond areas. No visible corrosion and presence of SrCrO4-containing particles within node bond areas (a), and heavily corroded node bond area with almost no SrCrO4 presence (b) as indicated by EDS semi-quantitative analysis table
Figure 103 (a-f). SEM/EDS mappings within Al honeycomb core node bond areas. Node bond areas (a), showing SrCrO4 needle-like pigments (b), element distribution of Sr (c), Cr (d) and O (e), and semi-quantitative analysis result (f).

101
Figure 104 (a-d). SEM images of Al core corrosion in form of thick Al oxide scale (damaged honeycomb); EDS spectrum of the thick Al oxide scale (d).
Figure 105 (a-e). SEM and optical images localized corrosion from undamaged honeycomb structure of Al core corrosion in the form of pits (a-b), exfoliation (c-d)

102
To better understand whether the damaged skin was directly responsible for internal corrosion damage of Al core bond structures, the same area of the undamaged stabilator was cross-sectioned and analyzed. Figure 105 shows typical corrosion damage observed from the undamaged structure Al honeycomb at the cross-sectioned Areas-0, -1, -4 and -5 identified in Figure 100 (d). As expected, the undamaged honeycomb structure showed much less corrosion damage compared to the damaged structure. However, Al core corrosion damage was still manifested in the same forms including pits, exfoliation, and other localized corrosion. Honeycomb Core - Conclusions
Since honeycomb core corrosion was identified as the primary bonded joint corrosion issue for in-service aircraft, testing of the core structures was performed to determine the role of chromates. While the analyzed core sections displayed the presence of strontium chromate at non-corroded core node bonds and apparent washout of chromates where corrosion was present, indicating that the corrosion inhibitor provided protection of the bond, core material selection is outside of DoD control. The issue of moisture ingress into core, whether by frequently occurring mechanical damage or eventual transmission through seams, joints, or even composite skins ensures that corrosion will occur and node bond failures will degrade the low load structural properties of such structures. The only corrosion protection within DoD/OEM control is the application of a bond primer during assembly of the skin to core; while current primers contain chromated corrosion inhibitors, corrosion of the core is the weak link in the structure. Additional non-honeycomb metal-to-metal bonded parts were not analyzed further for the impact of chromated bond primers; instead, the lab and marine atmospheric exposure specimens underway for other tasks were used to further understand the fundamental behavior of adhesive bond joints exposed to corrosive conditions and the specific criticality of corrosion inhibition. Without the availability of failed highly loaded aircraft bonded aircraft structure parts for analysis and an understanding that part environmental pedigree would be impossible to track, the DCB specimen was chosen for lab and marine atmospheric exposures and subsequent corrosion analysis.

103
Appendix B WCET and DCB Assembly Procedures
B.1 WCET Specimen Fabrication
WCET test specimens were fabricated according to ASTM D3762. Bonded panels were fabricated from 6.5-inch wide by 6.5-inch long by 0.12-inch thick 2024-T3 aluminum adherends. The wedge-insertion ends of the adherends were chamfered to form a “v” notch at the top of the bonded panel for easier wedges insertion in the machined specimens. The adherends were prepared for bonding following the PAA and GBSG surface preparation procedure detailed below.
Phosphoric Acid Anodize Procedure for WCET Specimens
PAA was conducted in accordance with ASTM D3933. Adherends were degreased by wiping with acetone-moistened, lint-free Duralace 9404 wipes and then soaked in MacDermid’s Isoprep 44™ alkaline cleaner solution, mixed with a ratio of 0.435 lbs Isoprep 44 per gallon of tap water, for 10 minutes at 140 ± 5°F. This was followed by spray rinsing with ambient temperature tap water for 10 minutes. Deoxidation of the adherend surfaces was conducted using the phosphoric acid deoxidation (PAD) process immersion in a 20 ± 2 percent (by weight) phosphoric acid solution at 85 ± 5°F for 10 minutes while applying 7±1 volts. Adherends were spray rinsed with tap water for 10 minutes after the completion of the PAD process and were then anodized in a 9-12 percent (by weight) phosphoric acid solution by applying 15 ± 1 volts over a 20 minute span at 77 ± 5°F. Adherends were spray rinsed with tap water for 10 minutes after the completion of the PAA process then dried in an air-circulating over at 120°F for 15 minutes. Bond primer was applied within 24 hours.
Grit-Blast/Sol-Gel Surface Preparation for WCET Specimens
a. Adherends were degreased using clean, acetone-moistened Duralace 9404 wipes. Wiping continued until no discoloration was present on a new wipe.
b. Cleaned adherends were grit-blasted with 50 m aluminum oxide media in an enclosed blast chamber using 70 psig of clean, dry nitrogen to propel the grit. The grit-blast process was performed until a uniform, matte finish was obtained.
c. Residual grit debris was removed using clean, dry 0.5-inch acid brushes and clean, dry Duralace 9404 wipes. Wiping continued until there was no further evidence of discoloration on a clean cloth after wiping.
d. The adherends were laid flat and AC-130-2 sol-gel solution, mixed per the manufacturer’s instructions, was applied using a clean acid brush. Surfaces were kept wet for 3-4 minutes. The AC-130-2 solution was applied within 30 minutes of grit removal.
e. Adherends were drained vertically for 5 – 10 minutes to remove excess solution and then air dried at ambient conditions for a minimum of 60 minutes.
f. Bond primer was applied within 120 minutes after the adherends were wetted with the sol-gel solution.
Primer and Adhesive Application for WCET Specimens
After the completion of the surface preparation, bond primers were applied with a nominal thickness of 0.2 mil using a Binks® (Model 115) spray gun pressurized with clean, dry nitrogen.

104
Primers were dried at ambient laboratory conditions for 30 minutes and subsequently cured in an air-circulating oven for 60 minutes at 250°F (- 0°F, + 10°F). The primed and cured panels were shimmed with 5-mil thick adhesive-backed Teflon film for bondline control. A single ply of adhesive EA 9696 was sandwiched between two adherends and the assembly was cured in a miniclave at 250°F for 1 hour with 40 psig of positive pressure. Once the adhesive was cured, wedge test panels were machined into 1.0-inch wide specimens, the ends containing shimming material were discarded, and the edges of the specimens were polished so adhesive bondline thicknesses could be measured with the aid of an optical microscope.
B.2 DCB Specimen Fabrication
AFRL/RXSA cut aluminum plates consisting of 0.500 ± 0.030 inch thick 7075-T651 or 2024-T351 aluminum for both AFRL/RXSA and NAVAIR specimens to bulk dimensions of 12 inches by 14.0 ± 0.1 inches. AFRL/RXSA and NAVAIR each fabricated DCB specimens and tested according to Boeing specification BSS 7208 (specimen Type II).
Specimens were machined from bonded aluminum plates consisting of 0.500 ± 0.030 inch thick 7075-T651 or 2024-T351 aluminum with bulk dimensions of 12 inches by 14.0 ± 0.1 inches. The rolling direction of the aluminum plates was parallel to the 14-inch edge. The adherends were prepared for bonding according to the procedures detailed in the subsections below, and were subsequently bonded with one ply of EA 9696 or FM 73 epoxy film. During the assembly process, a 1.250 ± 0.250-inch wide by 12-inch long, adhesive-backed Teflon® separator film was placed between the adherends at the top of the bonded panel (Figure 106). The adhesive film was applied to the surface of the adherend to form a butt joint with the Teflon separator film. The DCBs were placed in a vacuum bag assembly (Figure 107) and cured in an ASC Econoclave (AFRL/RXSA) or Thermal Equipment Corporation autoclave (NAVAIR). The autoclave temperature cycle was controlled using the lowest thermocouple (TC) reading. Two TCs were placed on the autoclave tool and a minimum of one TC was placed on top of the bag-side adherend for each DCB in the vacuum bag assembly. All TC tips were electrically isolated from exposed metal using Kapton® tape.
Teflon Separator Film
Adhesive Film
Aluminum Adherends
Figure 106. DCB Assembly

105
Individual bonded specimens were cut from the bulk panel and machined to final dimensions of 14.0 ± 0.1 inches (length) by 1.00 ± 0.03 inch (width). Coolant was not used in the machining process. The end of the specimen was drilled and tapped 0.5 inch from the side of the specimen and 0.5 inch from the top edge. The top edge was defined as the region of the specimen with the Teflon separator film. All holes were tapped to receive a ¼ - 28 bolt.
Figure 107: Vacuum Bag Layup
Phosphoric Acid Anodize
At AFRL/RXSA and NAVAIR, PAA was conducted in accordance with ASTM D3933. Adherends were degreased by wiping with acetone-moistened, lint-free Duralace 9404 (AFRL/RXSA) or Purewipe V-100 (NAVAIR) wipes. AFRL/RXSA then soaked panels in MacDermid’s Isoprep 44™ alkaline cleaner solution, mixed with a ratio of 0.435 lbs Isoprep 44 per gallon of tap water, for 10 minutes at 140 ± 5°F followed by spray rinsing with ambient temperature tap water for 10 minutes. NAVAIR immersed panels in Turco 6849 for 5 minutes at 135 ± 5°F followed by a double 140°F hot water rinse. Deoxidation of the adherend surfaces at AFRL/RXSA was conducted using the phosphoric acid deoxidation (PAD) process by immersion in a 20 ± 2 percent (by weight) phosphoric acid solution at 85 ± 5°F for 10 minutes while applying 7±1 volts. Adherends were spray rinsed with tap water for 10 minutes after the completion of the PAD process. Deoxidation processing at NAVAIR used a 5 minute Turco Smutgo NC immersion followed by a double rinse. Both AFRL/RXSA and NAVAIR adherends were anodized in a 9-12 percent (by weight) phosphoric acid solution by applying 15 ± 1 volts over a 20 minute span at 77 ± 5°F. Adherends were spray rinsed with tap water for 10 minutes after the completion of the PAA process then dried in an air-circulating over at 120°F for 15 minutes. Bond primer was applied within 24 hours after the completion of the PAA process.
Grit-Blast/Sol-Gel Surface Preparation
Both AFRL/RXSA and NAVAIR GBSG surface preparation procedures were intended to be essentially identical, with any procedural differences minor enough to be negligible with respect to impact on bonded joint performance. In fact, the materials and processes for the two GBSG preparations unintentionally deviated, as noted in the process descriptions below, to an extent that resulted in significant bond performance differences. This led to additional GBSG surface preparation evaluations, described in Section 4.3.1.4, that formed a significant part of the AFRL/RXSA effort under the SERDP project.

106
Details for the AFRL/RXSA GBSG process are as follows:
a. Adherends were degreased using clean, acetone-moistened Duralace 9404 wipes. Wiping continued until no discoloration was present on a new wipe.
b. Cleaned adherends were grit-blasted with 50 m aluminum oxide media in an enclosed blast chamber using 70 psig of clean, dry nitrogen to propel the grit. The grit-blast process was performed until a uniform, matte finish was obtained.
c. Residual grit debris was removed using clean, dry 0.5-inch wide acid brushes and clean, dry Duralace 9404 wipes. Wiping continued until there was no further evidence of discoloration on a clean cloth after wiping.
d. The adherends were laid flat and AC-130-2 sol-gel solution, mixed per the manufacturer’s instructions, was applied using a clean acid brush. Surfaces were kept wet for 3-4 minutes. The AC-130-2 solution was applied within 30 minutes of grit removal.
e. Adherends were drained vertically for 5 – 10 minutes to remove excess solution and then air dried at ambient conditions for a minimum of 60 minutes.
f. Bond primer was applied within 120 minutes after the adherends were wetted with the sol-gel solution.
The NAVAIR GBSG process details are as follows:
a. Adherends were cleaned using acetone-moistened, lint-free wipes (American Fiber & Finishing, Purewipe® V-100). Wiping continued until no discoloration was present on a new wipe.
b. The bonding surface of the adherends was deoxidized using a pneumatic 90-degree die grinder equipped with a 3-inch Brite Star 8403507 alumina/nylon abrasive pad. The die grinder was operated with shop-quality compressed air.
c. Cleaned adherends were grit-blasted with 54 grit (280 m) aluminum oxide media in an enclosed chamber using clean, dry nitrogen to propel the grit. The grit-blast process was performed until a uniform sparkly finish was obtained.
d. Residual grit debris was removed by blasting the surface with 90 psig of clean, dry nitrogen.
e. The adherends were angled at approximately 60 degrees and AC-130-2 sol-gel solution, mixed per the manufacturer’s instructions, was applied using a 3-inch foam brush. Surfaces were kept wet for 3-4 minutes. AC-130-2 was applied within 30 minutes of grit removal.
f. Adherends were drained vertically for 5-10 minutes to remove excess solution and then air dried at ambient conditions for a minimum of 60 minutes.
g. Bond primer was applied within 120 minutes after the adherends were wetted with the sol-gel solution.
Specimen Labeling
Specimens were labeled and tracked using a standard nomenclature to refer to the alloy type, surface preparation, adhesive, and fabrication site. The specimen ID is presented in the following form:

107
Where;
Al = 2 = 2024-T3 alloy7 = 7075-T6 alloy
- /Sol-Gel surface preparation
Pr=S=BR127primerWB=BR6747‐1primerNC=BR6747‐1NCprimer
3 73 6 9696
For example, a DCB specimen fabricated by NAVAIR using 2024-T3 adherends, PAA surface treatment, BR 6747-1NC primer, and FM 73 adhesive would be identified as 2PGNC3XN. The same specimen fabricated by AFRL/RXSA would be 2PGNC3N.
Coating and Crack Initiation of DCB Specimens
The exteriors of the individual specimens were manually deoxidized using 3M Scotch-Brite™ 7447 hand pads and distilled water (DI). Abrasion debris was removed using acetone-moistened, lint-free wipes (Chicopee®, Duralace™ 9404 (AFRL/RXSA); Purewipe® V-100 (NAVAIR)) until no discoloration was observed on the surface of a clean wipe. Next, the specimens were treated with 3M’s AC-130-2 sol-gel (AFRL/RXSA) or AC-131 (NAVAIR) solution. The specimens were then coated with a primer/topcoat system composed of a nonchromated primer (Deft 02GN084, praseodymium oxide inhibitor) and a MIL-PRF-85285 urethane topcoat in gloss white color. Primer and topcoat were applied using an HVLP spray gun, air dried for 1 hour, and force cured in an air-circulating oven at 120°F for 45 minutes.
Topcoated DCB specimens were partially opened using bullnosed ¼” - 28 UNF bolts to separate the adherends. The bolts were mated at the centerlines of the DCBs and sequentially turned, in ¼ turn increments, to drive the crack into the adhesive. The DCBs were opened until a 0.10-inch gap was achieved at the centerlines of the bolt (Figure 2). A precision-machined feeler-gage was used to verify the gap separation criterion was met. The exposed bolts were coated with a chemical maskant (AC products Inc., AC-850-CH-Toluene) to mitigate corrosion during environmental exposure. It was noted many specimens exhibited some degree of Mode III fracture (out-of-plane shear) as opposed to purely Mode I fracture (opening mode with tensile stress normal to the plane of the crack) intended for the DCBs. This was particularly true for those bonded using EA 9696 adhesive since it had greater strength, making the process of opening the specimens (fracturing the bond between the adherends) more difficult. The bull-nosed fasteners tended to become offset as they were turned due to the resistance of the adhesive to fracture.
The cracks were allowed a minimum of 12 hours to equilibrate prior to measurement of initial crack lengths. Crack length was measured from the centerline of the bolt to the crack tip using a scale with 1/100 inch graduations. The crack tip is typically defined as visual separation between the adherends; however, the polyurethane coating did not fracture in the same manner

108
as the adhesive resulting in a thin film of coating which masked the visual location of the crack tip. Consequently, location of the crack tip in the adhesive bondline was aided with one of two ultrasonic (UT) fixtures developed by AFRL/RXSA and equipped with an Endetek (formerly Krautkramer) USN-52 ultrasonic flaw detector. The first UT fixture (UTF-1) used flat, 0.25-inch diameter, 7 MHz Krautkramer transducers (P/N B OOCOVP) and gel coupling medium (Ultra Gel II). The second UT fixture (UTF-2) used a roller probe with a 0.375-inch diameter by 0.750-inch length from Olympus NDT incorporated (P/N DCR-584). The design of the UTF-2 transducers allowed for better surface contact with the specimens and relied on a thin film of water rather than a gel for a coupling medium. In both cases, the UT through-transmission signal was monitored as the DCB was passed through the fixture starting at the bonded end of the specimen. The crack tip was identified and marked on the specimen when the UT signal dropped below 20 percent of the full-scale signal. Images of the UT fixtures along with the USN-52 parameters and sample UT signals are presented in Figure 108 and Figure 109.
Figure 108: UTF-1 Fixture

109
Figure 109: UTF-2 Fixture

110
Appendix C Scope of bond primer usage – OEM and repair
As part of the fleet survey task the scope of chromated bond primer use within the Air Force and Navy was assessed. The Army, except for their similar aircraft applications, does not currently use the epoxy-based chromated bond primers for ground vehicles and shelters. Their primary involvement in this project is to define primer corrosion protection requirements in order to avoid default use of chromated primers as they transition from chromated surface treatments. The information collected from this assessment provides reference data for determining exposure pathways and waste streams that are generated during the use of these primer materials, as well as the waste stream generated by alternative materials and processes.
Data includes an estimation of the (1) quantity used at point-of-application, (2) total volume for all applications, (3) bondline areas (square footage), (4) application locations and their ability to control primer use, and (5) exposure to both primer and other waste generated during use (i.e., wipe cloths, applicators, and other consumables). One set of bondline primer application data that was recovered from a single Navy repair operation that was conducted on a repair that had an approximate surface area of 60 inch2 confirms the following:
(1) Wet primer thickness of ~0.0005 inch required the use of ~0.07 ounces of liquid bond primer
(2) A single repair generated ~0.13 pounds of hazardous solid wastes (i.e., cups, brushes, rags, vacuum bag material, gloves, Tyvek suits, etc.) and 0.34 pounds or ~6 ounces of liquid (unused primer) waste.
(3) Single repair information equates to ~1,000 pounds of hazardous waste per gallon of chromated bond primer
While bond primer consumption rates are low in comparison to paint primers the exposure risks and hazardous waste volumes generated by contaminated consumables, particularly for repairs where one gallon of primer can be used for hundreds of applications, is much greater.
Bond primer usage data has been collected from secured databases (Air Force Total Ownership Cost (AFTOC)) and discussions with Air Force and Navy representatives. The predominant primer used by the Air Force and Navy is still Cytec’s solvent-borne, chromated BR 127. Primary user sites for the Air Force are Tinker and Hill Air Force Bases as well as Warner-Robbins Aircraft Logistic Center (WR-ALC); primary user sites for the Navy are the three Fleet Readiness Centers (FRC’s) at Jacksonville FL, Cherry Point NC, and San Diego CA. Within the last 5 years, various sites have ordered over 5500 gallons of primer; over 99% of the primer purchased was BR 127 and almost 90% of the primer was purchased by WR-ALC primarily in support of the C-5. Cytec’s water-based primer BR 6747-1 and 3M’s EC-3960 have had minimal usage at any of the Air Force or Navy locations. Some supply and cost numbers collected include:
During the 1998 – 2012 time period: – The Air Force depots and field units procured 18,780 units (quart and gallon kits) of
the BR 127 at a cost of $1.12M During the 2008 – 2012 time period:
– Tinker AFB, Hill AFB and supporting field bases procured 2,548 quarts of BR 127 (NSN 8040-01-325-0738) at a cost of ~$241K

111
– Robins AFB procured 3,913 gallons of BR 127 (NSN 8040-01-197-1696) at a cost of ~$273K
Bond primer usage for Building 169 at WR-ALC during 2012: – Cytec BR 127 (NSN 8040-01-197-1696), 786 gallons ordered through supply – 3M EC-3960, 8 gallons ordered by GPC – Cytec BR 6747-1 (NSN 8040PBR67471), 11 gallons ordered by GPC
Current environmental and human hazards associated with the use of several of the most used commercial chromate-containing bond primers (i.e., BR 127, BR 6700-1, BR 6747-1 and EC 3924B) include:
(1) Carcinogenic due to use of multiple solvents and hexavalent chromium inhibitor (BR 127, BR 6747-1, EC-3960, and EC 3924B)
(2) Solvent odor, flammable and high VOC (BR 127, EC-3960, and EC-3924B) (3) Combustion products include; CO, CO2, and nitrogen oxides (All primers) (4) Eye irritant and potential inhalation/skin hazards (All primers)
As reported in the Material Safety Data Sheets (MSDS) and technical bulletins for the chromated bond primers, workers are required to use chemical resistant gloves, goggles, respirators, and other personal protective equipment (PPE) appropriate for the preparation, application, and disposal of unused primer and masking/clean-up supplies. All unused primer and application and clean-up supplies are considered hazardous wastes. Elimination of chromium from bond primers would eliminate the carcinogenic threat; PPE and many of the hazardous material disposal requirements would still be valid for nonchromated primers.

112
Appendix D Supplemental WCET and DCB Multivariate Analysis Results
D.1 WCET Analysis – Crack growth versus crack growth rate
Use individual crack growth rates to generate 2-dimensional x-y plot needed for response screening model.
Crack growth rates determined using regression analysis in MS Excel. Data analysis add-on package > LINEST function for crack growth versus time. Crack
growth measurements used at 0, 4, 24, 168, 336, 504, and 672 hours.
Figure 110: Crack growth versus crack growth rate for indoor WCET specimens, initial Cytec primer screening, all surface treatments, all environmental conditioning factors
D.2 WCET Response Screening Model – Crack Growth vs Crack Growth Rate
JMP Statistical Discovery 11.2.0 Initial Cytec primer WCET datasets, all conditioning, no exclusions. In JMP, Analyze > Modeling > Response Screening Fit Y Response (Crack growth) as a function of X (Crack growth rate) with consideration for categorical variable grouping (conditioning, surface preparation, and primer).
RSquare 0.02983 RSquare Adj -0.01427 Root Mean Square Error 5.377779 Mean of Response 7.8613 Observations (or Sum Wgts) 24
Figure 111: YMean (Crack growth) versus False Data Rate LogWorth (FDR LogWorth) for initial Cytec primer WCET datasets

113
Figure 112 Response Screening Model distribution rankings of the indoor conditioning factor relative to the frequency of FDR LogWorth (with standard error)
Figure 113 Response Screening Model distribution rankings of the surface preparation relative to the frequency of FDR LogWorth (with standard error)
p = 0.47 count = 15
p = 0.53 count = 17
p = 0.29 count = 9
p = 0.21 count = 7
p = 0.30 count = 10
p = 0.20 count = 6

114
Figure 114 Response Screening Model distribution rankings of the primer relative to the frequency of FDR LogWorth (with standard error)
Error is lower, but data sets are still limited. Number of data sets from the initial indoor WCET testing of the Cytec primers were
limited. Note that observed trends in mode-of-failure (Figure 16) and average values of crack growth and crack growth rate (
Table 4Error! Reference source not found.) are also inconsistent. High standard
deviation from the response screening model of crack growth versus crack growth rate is most likely due to high standard deviation in the experimental input.
Crack growth versus crack growth rate (Figure 110) should provide a reliable input for response screening modelling provided enough data is provided for statistical significance.
D.3 WCET Analysis – Crack Growth vs Crack Growth Rate (Cytec and 3M Primers)
Use individual crack growth rates to generate 2-dimensional x-y plot needed for response screening model.
Crack growth rates determined using regression analysis in MS Excel. Data analysis add-on package > LINEST function for crack growth versus time. Crack
growth used at 0, 4, 24, 168, 336, 504, and 672 hours.
p = 0.35 count = 11
p = 0.28 count = 9
p = 0.37 count = 12

115
Figure 115: Indoor WCET specimens, initial Cytec primer screening, and second screening of Cytec and 3M primers all surface treatments, all environmental conditioning factors
60 unique conditions 6 primers (7 primers considering BR 127 only used for initial WCET samples) 2 surface preparations (GBSG (300 micron) not performed for WCET)
o GBSG (50 micron) also supplemented with abrasive pad cleaning 4 indoor conditioning environments 2 aluminum alloys 8 conditions with 10 samples, 52 conditions with 5 – 7 samples Overall, large set of data, but limited for complete comparisons. Many assumptions must
be made to populate higher sample densities for robust multivariate analysis Assumptions
o From marine atmospheric test results, assume differences between primers are minimal. Categorize 6 specific primer products as either “chromated” – BR 6700-1, BR 6747-1, and EW-5000 “nonchromated” – BR 6747-1NC, EW-5000 NC, and EW-5000 ET
o From marine atmospheric environment test results, minimal difference in crack growth response between 2024 and 7075 aluminum.

116
D.4 WCET Response Screening Model – Crack Growth vs Crack Growth Rate (Cytec and 3M Primers)
JMP Statistical Discovery 11.2.0 Initial Cytec primer WCET datasets, second Cytec, and 3M primer sets, assumed either chromated or nonchromated, exclude cyclic corrosion and salt-fog (non-elevated) conditioning, ignore abrasive pad surface pretreatment. In JMP, Analyze > Modeling > Response Screening Fit Y Response (Crack growth) as a function of X (Crack growth rate) with consideration for categorical variable grouping (conditioning, surface preparation, and primer).
Figure 116 YMean (Crack growth) versus False Data Rate LogWorth (FDR LogWorth) for initial and second Cytec primer WCET datasets and 3M primer sets.
RSquare 0.662685 RSquare Adj 0.606466 Root Mean Square Error 10.01309 Mean of Response 17.10313 Observations (or Sum Wgts) 8
10
20
30
40
50
YMea
n
0 5 10 15 20 25FDR LogWorth

117
Figure 117: Response Screening Model distribution rankings of the indoor conditioning factor relative to the frequency of FDR LogWorth (with standard error)
Figure 118: Response Screening Model distribution rankings of the surface preparation relative to the frequency of FDR LogWorth (with standard error)
100 % Relative Humidity, 140°F
Salt Spray (Fog), 140°F
0 20 40 60Count
0.10 0.30 0.50Probability
GBSG (50 micron)
PAA
0 20 40 60 80Count
0.10 0.30 0.50 0.70Probability
p = 0.73 count = 75
p = 0.27 count = 28
p = 0.66 count = 68
p = 0.34 count = 35

118
Figure 119: Response Screening Model distribution rankings of the primer inhibitor relative to the frequency of FDR LogWorth (with standard error)
Higher normalized count and probability indicate lower crack growths (Ymean). Results follow predicted results, elevated salt spray fog is harsher than 100% relative
humidity, PAA is superior to grit blasting, and the nonchromated primer is beneficial. GBSG (300 micron) surface preparation data was not obtained for the indoor WCET
conditioning. Indoor DCB conditioning showed more comparable performance between PAA and GBSG (300 micron) surface preparations.
Figure 120: Base Response Screening Model distribution rankings WCET crack growth versus crack growth rate showing the simultaneous influence of environmental conditioning, surface preparation, and the influence of chromated primer inhibitor relative to the frequency of FDR LogWorth (with standard error).
chromated primer
non-chromated primer
0 10 30 50Count
0.10 0.30 0.50Probability
chromated primer
non-chromated primer
0 10 30 50Count
0.10 0.30 0.50Probability
p = 0.45 count = 47
p = 0.55 count = 57
Salt Spay (Fog), 140°F
100% Relative Humidity, 140°F
PAA
GBSG (50 micron)
Non-chromated
Chromated

119
Higher counts and probabilities correlate to decreased WCET crack growth versus crack growth rate response.
Comparative results show the salt spray (fog), 140°F (p = 0.34, count = 35) as statistically more severe than the 100% relative humidity, 140°F conditioning (p = 0.66, count = 68)
Comparative results show the PAA surface preparation (p = 0.72, count = 75) results in decreased crack growth versus crack growth rate response in comparison to the GBSG (50 micron) surface preparation (p = 0.27 count = 28)
Decreased crack growth versus crack growth rate was also observed when comparing the nonchromated primers (p = 0.55, count = 57) to the chromated primers (p = 0.45, count = 47).
Absent from the indoor WCET testing were any GBSG (300 micron) surface preparations, which showed improved performance relative to GBSG (50 micron) from the marine atmospheric exposure DCB testing.
GBSG (300 micron) surface preparation data was not obtained for the indoor WCET conditioning. Indoor DCB conditioning showed more comparable performance between PAA and GBSG (300 micron) surface preparations.
Figure 121: Response Screening Model distribution ranking contributions of WCET crack growth versus crack growth rate showing the simultaneous influence of environmental conditioning and the chromated primer inhibitor relative to the frequency of FDR LogWorth at a constant PAA surface preparation.
Higher counts and probabilities correlate to decreased WCET crack growth versus crack
growth rate response. 100% relative humidity appears slightly less severe to the PAA surface preparation in
comparison to the salt spray (fog) environmental conditioning. GBSG (300 micron) surface preparation data was not obtained for the indoor WCET
conditioning. Indoor DCB conditioning showed more comparable performance between PAA and GBSG (300 micron) surface preparations.
chromated primer
non-chromated primer
0 10 30 50Count
0.10 0.30 0.50Probability
Salt Spay (Fog), 140°F
100% Relative Humidity, 140°F
PAA
GBSG (50 micron)
Non-chromated
Chromated
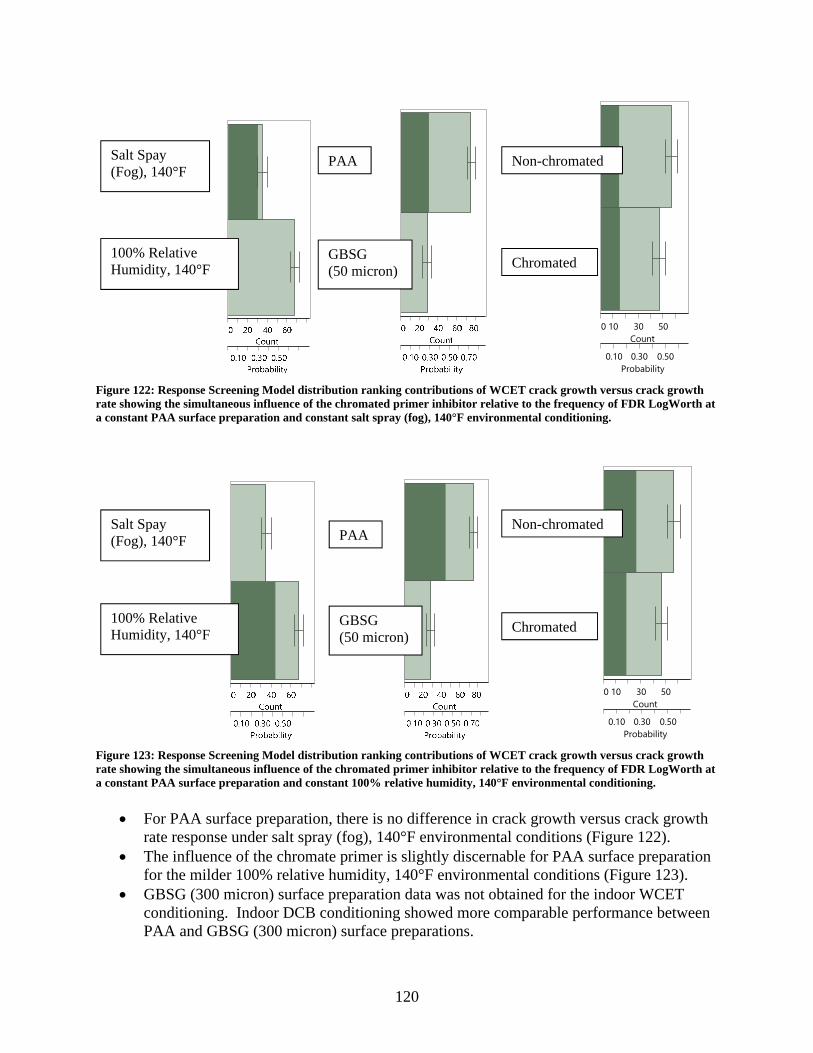
120
Figure 122: Response Screening Model distribution ranking contributions of WCET crack growth versus crack growth rate showing the simultaneous influence of the chromated primer inhibitor relative to the frequency of FDR LogWorth at a constant PAA surface preparation and constant salt spray (fog), 140°F environmental conditioning.
Figure 123: Response Screening Model distribution ranking contributions of WCET crack growth versus crack growth rate showing the simultaneous influence of the chromated primer inhibitor relative to the frequency of FDR LogWorth at a constant PAA surface preparation and constant 100% relative humidity, 140°F environmental conditioning.
For PAA surface preparation, there is no difference in crack growth versus crack growth
rate response under salt spray (fog), 140°F environmental conditions (Figure 122). The influence of the chromate primer is slightly discernable for PAA surface preparation
for the milder 100% relative humidity, 140°F environmental conditions (Figure 123). GBSG (300 micron) surface preparation data was not obtained for the indoor WCET
conditioning. Indoor DCB conditioning showed more comparable performance between PAA and GBSG (300 micron) surface preparations.
chromated primer
non-chromated primer
0 10 30 50Count
0.10 0.30 0.50Probability
chromated primer
non-chromated primer
0 10 30 50Count
0.10 0.30 0.50Probability
Salt Spay (Fog), 140°F
100% Relative Humidity, 140°F
PAA
GBSG (50 micron)
Non-chromated
Chromated
Salt Spay (Fog), 140°F
100% Relative Humidity, 140°F
PAA
GBSG (50 micron)
Non-chromated
Chromated

121
Figure 124: Response Screening Model distribution ranking contributions of WCET crack growth versus crack growth rate showing the simultaneous influence of environmental conditioning and the chromated primer inhibitor relative to the frequency of FDR LogWorth at a constant GBSG (50 micron) surface preparation.
Higher counts and probabilities correlate to decreased WCET crack growth versus crack
growth rate response. GBSG (50 micron) surface preparation enhances the difference in crack growth versus
crack growth response for the environmental conditioning. GBSG (300 micron) surface preparation data was not obtained for the indoor WCET
conditioning. Indoor DCB conditioning showed more comparable performance between PAA and GBSG (300 micron) surface preparations.
Figure 125: Response Screening Model distribution ranking contributions of WCET crack growth versus crack growth rate showing the simultaneous influence of the chromated primer inhibitor relative to the frequency of FDR LogWorth at a constant GBSG (50 micron) surface preparation and constant salt spray (fog), 140°F environmental conditioning.
chromated primer
non-chromated primer
0 10 30 50Count
0.10 0.30 0.50Probability
chromated primer
non-chromated primer
0 10 30 50Count
0.10 0.30 0.50Probability
Salt Spay (Fog), 140°F
100% Relative Humidity, 140°F
PAA
GBSG (50 micron)
Non-chromated
Chromated
Salt Spay (Fog), 140°F
100% Relative Humidity, 140°F
PAA
GBSG (50 micron)
Non-chromated
Chromated
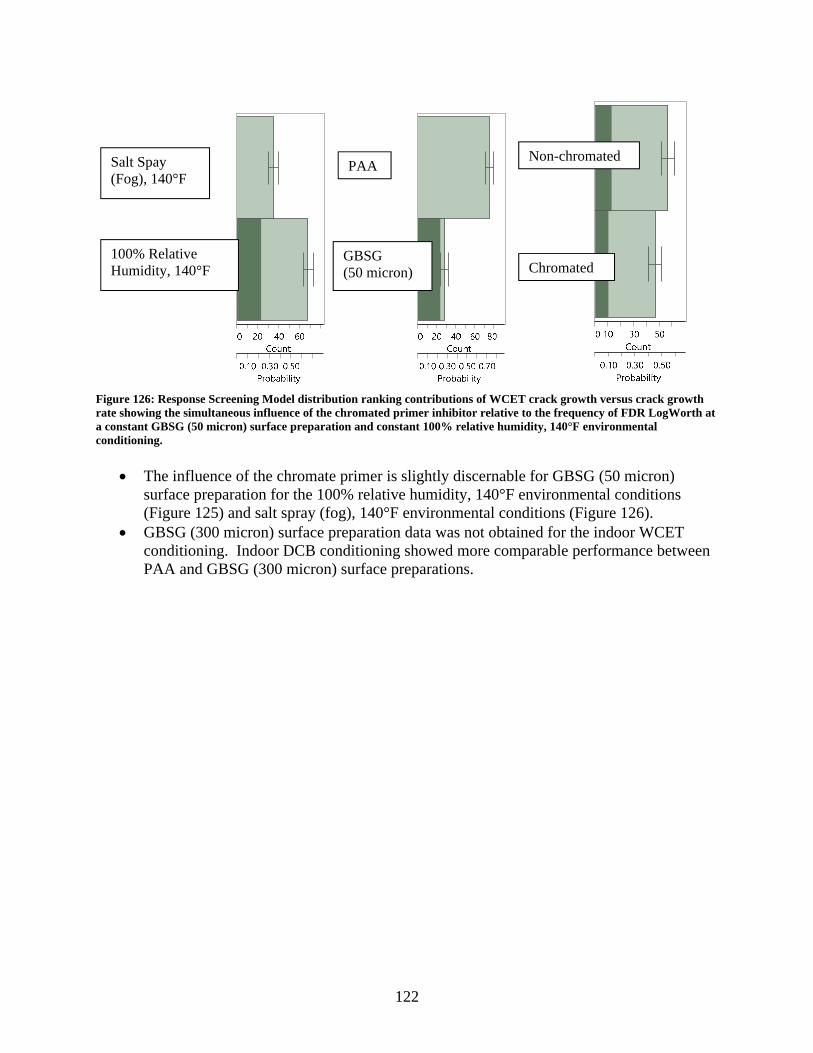
122
Figure 126: Response Screening Model distribution ranking contributions of WCET crack growth versus crack growth rate showing the simultaneous influence of the chromated primer inhibitor relative to the frequency of FDR LogWorth at a constant GBSG (50 micron) surface preparation and constant 100% relative humidity, 140°F environmental conditioning.
The influence of the chromate primer is slightly discernable for GBSG (50 micron)
surface preparation for the 100% relative humidity, 140°F environmental conditions (Figure 125) and salt spray (fog), 140°F environmental conditions (Figure 126).
GBSG (300 micron) surface preparation data was not obtained for the indoor WCET conditioning. Indoor DCB conditioning showed more comparable performance between PAA and GBSG (300 micron) surface preparations.
Salt Spay (Fog), 140°F
100% Relative Humidity, 140°F
PAA
GBSG (50 micron)
Non-chromated
Chromated

123
D.5 WCET Analysis – Crack Growth vs Crack Growth Rate (GBSG/Abrasive Pad)
Figure 127: WCET crack growth versus crack growth rate for PAA, GBSG (50 micron), and GBSG (50 micron w/abrasive pad) surface preparation and inhibitor combinations exposed to 100% relative humidity, 140°F environmental conditioning.
Inhibitor
chromated primer non-chromated primer
Surfa
ce tr
eatm
ent
GBSG
(50 m
icron
w/a
bras
ive p
ad)
05
1015202530354045505560
Crac
k gro
wth (
mm
)
GBSG (50 micron w/abrasive pad)
GBSG
(50 m
icron
)
05
1015202530354045505560
Crac
k gro
wth (
mm
)
GBSG (50 micron)
PAA
05
1015202530354045505560
Crac
k gro
wth (
mm
)
PAA
Surface treatment
0 0.01 0.02 0.03 0.04 0.05 0.06 0.07 0.08 0.09Crack growth rate (mm/hour)
0 0.01 0.02 0.03 0.04 0.05 0.06 0.07 0.08 0.09Crack growth rate (mm/hour)
100% Relative Humidity, 140°F
PA
A
GB
SG
(50
mic
ron)
Non-chromated Chromated
GB
SG
(w
/abr
asiv
e pa
d)

124
Figure 128: WCET crack growth versus crack growth rate for PAA, GBSG (50 micron), and GBSG (50 micron w/abrasive pad) surface preparation and inhibitor combinations exposed to salt spray (fog), 140°F environmental conditioning.
Inhibitor
chromated primer non-chromated primerSu
rface
trea
tmen
t
GBSG
(50 m
icron
w/a
bras
ive p
ad)
05
1015202530354045505560
Crac
k gro
wth (
mm
)
GBSG (50 micron w/abrasive pad)
GBSG
(50 m
icron
)
05
1015202530354045505560
Crac
k gro
wth (
mm
)
GBSG (50 micron)
PAA
05
1015202530354045505560
Crac
k gro
wth (
mm
)
PAA
Surface treatment
0 0.01 0.02 0.03 0.04 0.05 0.06 0.07 0.08 0.09Crack growth rate (mm/hour)
0 0.01 0.02 0.03 0.04 0.05 0.06 0.07 0.08 0.09Crack growth rate (mm/hour)
Salt Spay (Fog), 140°F
PA
A
GB
SG
(50
mic
ron)
Non-chromated Chromated
GB
SG
(w
/abr
asiv
e pa
d)

125
D.6 DCB Marine Atmospheric Exposure – Surface Preparation
Figure 129: Percent fracture energy lost versus crack growth (PAA pretreated samples, time = 6 months)
Average GIscc lost = 8.1% (+/- 10.1%) Average crack growth = 24.7mm (+/- 15.8mm) Sample not observed = 43, cohesive = 77, mixed-mode = 8, adhesive = 0
Figure 130: Percent fracture energy lost versus crack growth (300 micron grit blast pretreated samples, time = 6 months)
Average GIscc lost = 16.2% (+/- 17.7%) Average crack growth = 40.1mm (+/- 19.8mm) Sample not observed = 50, cohesive = 4, mixed-mode = 56, adhesive = 18
% GI
scc l
ost
% GI
scc l
ost

126
Figure 131: Percent fracture energy lost versus crack growth (50 micron grit blast pretreated samples, time = 6 months)
Average GIscc lost = 87.0% (+/- 50.9%) Average crack growth = 81.8mm (+/- 23.7mm) Sample not observed = 42, cohesive = 1, mixed-mode = 8, adhesive = 77
D.7 DCB Results (Laboratory Testing)
Global Laboratory (Indoor) and Marine Atmospheric (Outdoor) Conditioning Comparisons
ASTM Standard B117-11 "Standard Practice for Operating Salt Spray (Fog) Apparatus." ASTM International, West Conshohocken, PA, 2011, DOI: 10.1520/B0117-11, www.astm.org Specimen Orientation – flat on rack, with wedge parallel to rack Salt Solution – 5 % NaCl + Bal DI water (by weight) Solution pH – 6.5 to 7.2 (as atomized and collected) Chamber Temperature – 60 °C (140 °F) Chamber Humidity – 95 to 100 % Chamber Mode – Continuous ASTM Standard D2247-11 "Standard Practice for Testing Water Resistance of Coatings in 100 % Relative Humidity." ASTM International, West Conshohocken, PA, 2011, DOI: 10.1520/D2247-11, www.astm.org Specimen Orientation – flat on rack, with wedge parallel to rack Chamber Temperature - 60 °C (140 °F) Chamber Humidity – >95 % Chamber Mode – Continuous
% GI
scc l
ost
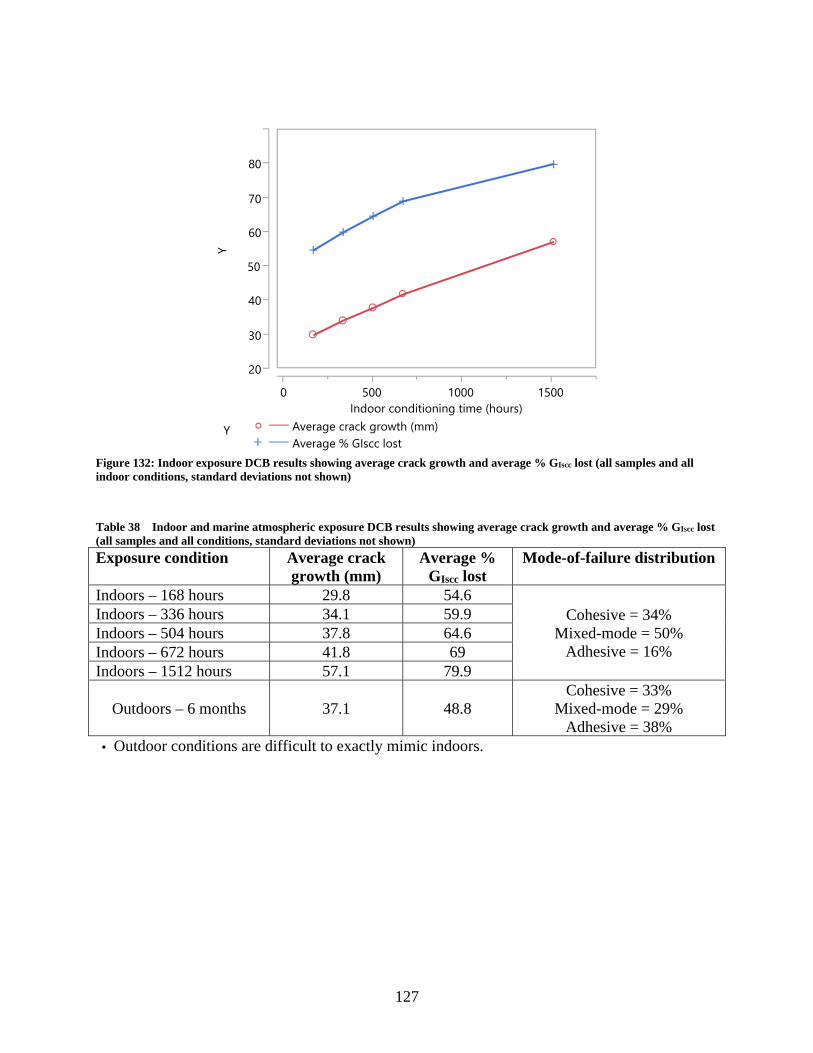
127
Figure 132: Indoor exposure DCB results showing average crack growth and average % GIscc lost (all samples and all indoor conditions, standard deviations not shown)
Table 38 Indoor and marine atmospheric exposure DCB results showing average crack growth and average % GIscc lost (all samples and all conditions, standard deviations not shown)
Exposure condition Average crack growth (mm)
Average % GIscc lost
Mode-of-failure distribution
Indoors – 168 hours 29.8 54.6 Cohesive = 34%
Mixed-mode = 50% Adhesive = 16%
Indoors – 336 hours 34.1 59.9 Indoors – 504 hours 37.8 64.6 Indoors – 672 hours 41.8 69 Indoors – 1512 hours 57.1 79.9
Outdoors – 6 months 37.1 48.8 Cohesive = 33%
Mixed-mode = 29% Adhesive = 38%
• Outdoor conditions are difficult to exactly mimic indoors.
20
30
40
50
60
70
80
Y
0 500 1000 1500 Indoor conditioning time (hours)
Y Average crack growth (mm) Average % GIscc lost

128
D.8 DCB Bivariate, Primer and Surface Preparation (Indoor Conditioning)
Figure 133: Percent fracture energy lost versus crack growth (Bivariate with respect to primer and surface preparation, time = 672 hours (1 month))
• Similar to outdoors, difference in response between primers in negligible difference
between surface preparations more pronounced.
D.9 DCB PAA vs Grit Blasting (Laboratory Conditioning)
JMP Statistical Discovery 11.2.0 • Include PAA/ BR 127 datasets, along with BR 6747-1 and BR 6747-1 NC data. • Assume no statistical difference in performance between BR 127, BR 6747-1, and BR
6747-1 NC, In JMP, Analyze > Modeling > Response Screening Fit Y Response (%GIscc lost) as a function of X (crack growth) with consideration for categorical variable grouping (conditioning, substrate material, surface preparation, and adhesive)
0
20
40
60
80
100
0
20
40
60
80
100
0
20
40
60
80
100
0 50 100 150 200 250 0 50 100 150 200 250 0 50 100 150 200 250
BR127GBSG (300 micron)
Crack growth (mm)
BR6747-1NCGBSG (300 micron)
BR6747-1GBSG (300 micron)
BR6747-1NCGBSG (50 micron)
BR6747-1GBSG (50 micron)
BR6747-1NCPAA
BR6747-1PAA
BR127PAA
BR127GBSG (50 micron)%
GIsc
clos
t
Not Tested
Not Tested Not Tested
Not Tested

129
Figure 134: YMean (% GIscc lost) versus False Data Rate LogWorth (FDR LogWorth) for all PAA and Grit Blast datasets (assume constant primer response, indoor exposure time = 1 month)
RSquare = 0.150014, RSquare Adj = 0.111378, Root Mean Square Error = 13.80567, Mean of Response = 69.17463, Observations (or Sum Wgts) = 24
Figure 135: Response Screening Model distribution rankings of the indoor conditioning standard relative to the frequency of FDR LogWorth (with standard error)
40
50
60
70
80
90
100
YMea
n
2 3 4 5 6 7 8 9FDR LogWorth
Indoor Neutral Salt Fog
Indoor Temp-Humidity
0 20 40 60 80Count
0.10 0.30 0.50Probability
p = 0.39 count = 51
p = 0.61 count = 80

130
Figure 136: Response Screening Model distribution rankings of the aluminum grade relative to the frequency of FDR LogWorth (with standard error)
Figure 137: Response Screening Model distribution rankings of the surface preparation relative to the frequency of FDR LogWorth (with standard error)
aluminum 2024 T3
aluminum 7075
0 20 40 60 80Count
0.10 0.30 0.50Probability
GBSG (300 micron)
GBSG (50 micron)
PAA
0 10 20 30 40 50Count
0.05 0.20 0.35Probability
p = 0.36 count = 47
p = 0.29 count = 38
p = 0.35 count = 45
p = 0.45 count = 58
p = 0.55 count = 72

131
Figure 138: Response Screening Model distribution rankings of the adhesive relative to the frequency of FDR LogWorth (with standard error)
• Higher counts and probabilities correlate to decreased DCB average GIscc lost versus
crack growth response. • Surface preparation and conditioning factors dominates the indoor DCB response. • PAA outperformed GBSG (300 micron). • GBSG (300 micron) outperformed GBSG (50 micron). • However, differences in absolute performance between the surface preparations were not
as pronounced for the indoor DCB testing in comparison to the outdoor results. Error bars overlap for indoor testing.
• The neutral salt fog conditioning was more severe than the relative humidity conditioning.
• Adhesive categorical variable was not statistically different, which was also observed for the outdoor results.
• The indoor results seem to bias 2024 T3 towards slightly improved performance over 7075 aluminum, more so than was observed for the outdoor results. However, the standard error bars still overlap.
FM 73
Hysol EA9696
0 20 40 60Count
0.10 0.30 0.50Probability
p = 0.52 count = 67
p = 0.48 count = 63

132
D.10 DCB PAA vs Grit Blasting (Laboratory Temp-Humidity Conditioning)
JMP Statistical Discovery 11.2.0 • Include PAA/ BR 127 datasets, along with BR 6747-1 and BR 6747-1 NC data, exclude
neutral salt-fog data) • Assume no statistical difference in performance between BR 127, BR 6747-1, and BR
6747-1 NC, In JMP, Analyze > Modeling > Response Screening Fit Y Response (%GIscc lost) as a function of X (crack growth) with consideration for categorical variable grouping (conditioning, substrate material, surface preparation, and adhesive)
Figure 139: YMean (% GIscc lost) versus False Data Rate LogWorth (FDR LogWorth) for all PAA and Grit Blast datasets (assume constant primer response, indoor temp-humidity exposure time = 1 month)
RSquare = 0.411682, RSquare Adj = 0.352851, Root Mean Square Error = 9.955549, Mean of Response = 67.96873, Observations (or Sum Wgts) = 12 In JMP, Analyze > Distribution > Y, Columns (conditioning, surface preparation, and primer) using FDR LogWorth as the frequency. FDR LogWorth is defined as –log10(FDR PValue). The False Discovery Rate (FDR) PValue is determined using the Benjamini-Hochberg technique and is considered the best statistic for measuring statistical significance.‡ P-values less than 0.05 are considered significant. Note that the sum of the frequency variable is factored into the overall count, which influences the moment statistics.
‡ http://www.jmp.com/support/help/Interactive_Effect_Summary.shtml, retrieved 17 February 2016.
50
60
70
80
90
YMea
n
4 5 6 7 8 9FDR LogWorth

133
Figure 140: Response Screening Model distribution rankings of the aluminum grade relative to the frequency of FDR LogWorth (with standard error)
Figure 141: Response Screening Model distribution rankings of the surface preparation relative to the frequency of FDR LogWorth (with standard error)
aluminum 2024 T3
aluminum 7075
0 10 20 30 40 50Count
0.10 0.30 0.50Probability
GBSG (300 micron)
GBSG (50 micron)
PAA
0 5 10 20 30Count
0.05 0.20 0.35Probability
p = 0.36 count = 30
p = 0.29 count = 24
p = 0.35 count = 29
p = 0.56 count = 46
p = 0.44 count = 36

134
Figure 142: Response Screening Model distribution rankings of the adhesive relative to the frequency of FDR LogWorth (with standard error)
Higher counts and probabilities correlate to decreased DCB average GIscc lost versus crack growth response.
PAA and GBSG (300 micron) outperformed GBSG (50 micron). PAA and GBSG (300 micron) are comparable. However, differences in absolute performance between the surface preparations were not
as pronounced for the indoor DCB testing in comparison to the outdoor results. Error bars overlap for indoor testing.
Adhesive categorical variable was not statistically different, which was also observed for the outdoor results.
The indoor results seem to bias 2024 T3 towards slightly improved performance over 7075 aluminum, more so than was observed for the outdoor results. However, the standard error bars still overlap.
D.11 DCB PAA vs Grit Blasting (Indoor Neutral Salt Fog Conditioning)
JMP Statistical Discovery 11.2.0 Include PAA/ BR 127 datasets, along with BR 6747-1 and BR 6747-1 NC data, exclude
temp-humidity data) Assume no statistical difference in performance between BR 127, BR 6747-1, and BR
6747-1 NC, In JMP, Analyze > Modeling > Response Screening
FM 73
Hysol EA9696
0 10 20 30 40Count
0.10 0.30 0.50Probability
p = 0.50 count = 41
p = 0.50 count = 41

135
Fit Y Response (%GIscc lost) as a function of X (crack growth) with consideration for categorical variable grouping (conditioning, substrate material, surface preparation, and adhesive)
Figure 143: YMean (% GIscc lost) versus False Data Rate LogWorth (FDR LogWorth) for all PAA and Grit Blast datasets (assume constant primer response, indoor neutral salt-fog exposure time = 1 month)
RSquare = 0.145079, RSquare Adj = 0.059587, Root Mean Square Error = 16.57514, Mean of Response = 70.38052, Observations (or Sum Wgts) = 12
Figure 144: Response Screening Model distribution rankings of the aluminum grade relative to the frequency of FDR LogWorth (with standard error)
40
50
60
70
80
90
100
YMea
n
3 3.5 4 4.5 5 5.5FDR LogWorth
aluminum 2024 T3
aluminum 7075
0 5 10 15 20 25Count
0.10 0.30 0.50Probability
p = 0.54 count = 26
p = 0.46 count = 22
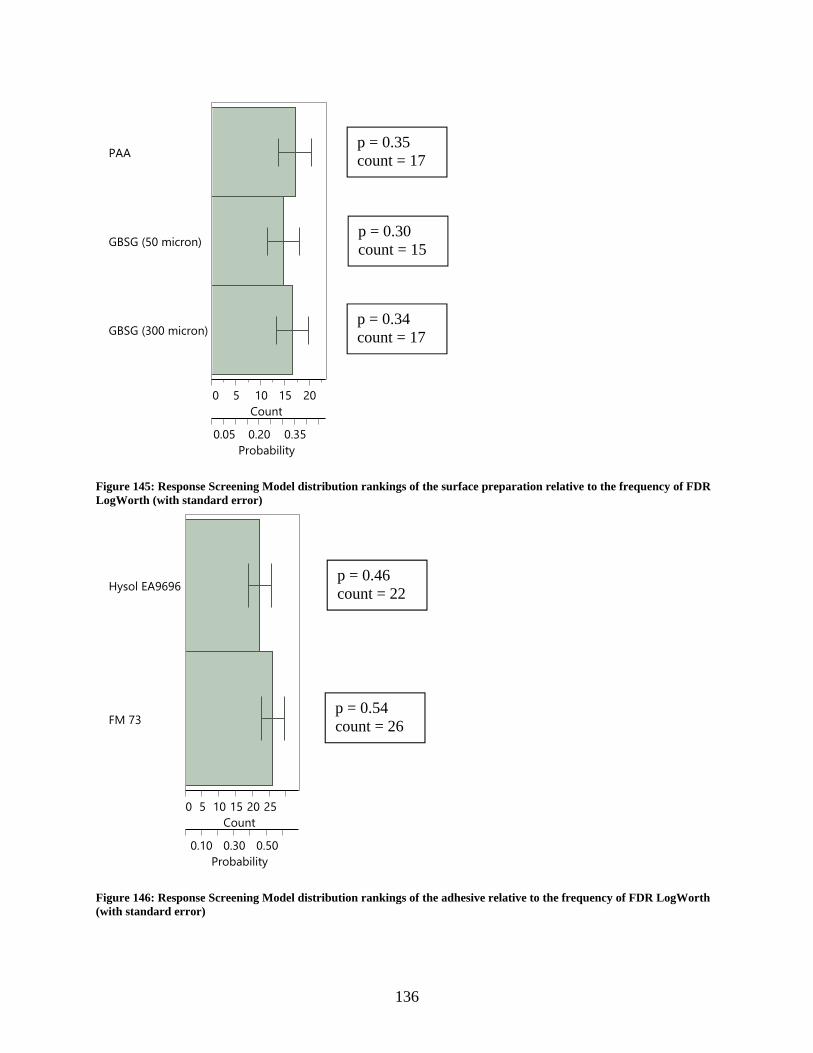
136
Figure 145: Response Screening Model distribution rankings of the surface preparation relative to the frequency of FDR LogWorth (with standard error)
Figure 146: Response Screening Model distribution rankings of the adhesive relative to the frequency of FDR LogWorth (with standard error)
GBSG (300 micron)
GBSG (50 micron)
PAA
0 5 10 15 20Count
0.05 0.20 0.35Probability
FM 73
Hysol EA9696
0 5 10 15 20 25Count
0.10 0.30 0.50Probability
p = 0.54 count = 26
p = 0.46 count = 22
p = 0.35 count = 17
p = 0.30 count = 15
p = 0.34 count = 17

137
• Higher counts and probabilities correlate to decreased DCB average GIscc lost versus crack growth response.
• PAA and GBSG (300 micron) outperformed GBSG (50 micron). • PAA and GBSG (300 micron) are comparable. • However, differences in absolute performance between the surface preparations were not
as pronounced for the indoor DCB testing in comparison to the outdoor results. Error bars overlap for indoor testing.
• FM 73 is shifted towards slightly improved performance, but the standard error bars still overlap with EA 9696.
• The indoor results seem to bias 2024 T3 towards slightly improved performance over 7075 aluminum, more so than was observed for the outdoor results. However, the standard error bars still overlap.

138
Appendix E Bondline – Corrosion Risk Assessment Tool (B-CRAT) Development
E.1 Original B-CRAT Concept/Framework
The original proposal for this SERDP project was based on the hypothesis that chromated adhesive bond primers play a critical role in reducing possibility of corrosion on bonded substrates leading to premature structural failures along the primer/adhesive interface. The B-CRAT was conceptualized to validate the hypothesis by comparisons of the performance between chromated and nonchromated bond primers with the data to be made available from the laboratory and field testing. When developed, the B-CRAT would be used by the aerospace maintainers to assess the corrosion risk associated with their selection of the adhesive bond primer and make informed decisions on selecting the system appropriate for their application.
The B-CRAT was conceptualized to have six risk categories and potential failure modes as identified in Figure 147 below.
Figure 147 B-CRAT Risk Categories and material selection tool.
A comprehensive evaluation framework and criteria supporting the final risk profile assessment was developed. The underlying expectation in conceptualizing the tool was that the risk evaluation criteria will be developed based on available technical data from laboratory tests, OEM, depot- and field-level experiences, etc.
The developed B-CRAT framework was analogous to the standard acceptable Failure Mode Effects Analysis (FMEA) principle commonly used in the industry to rank and prioritize the defects based on their frequency of occurrences, impact severity, and likelihood of detection. For the B-CRAT, the FMEA principle was organized as:
• Defects in a standard FMEA = The six (6) Risk Categories in B-CRAT
• Failure Modes = Key attributes/elements of B-CRAT criteria framework for each of the six (6) risk categories
• Occurrence Probability (O): Likelihood of the failure mode
• Impact Severity (S): Impact from failure
Risk Categories Failure ModesSubstratesSurface Prep, Primer, AdhesiveApplication & Cure
Bondline GeometryWings & Flight ControlsFuselage
Location/OrientationOperational Environment
PersonnelQuality Management
AccessibilityAssessment Techniques
Risk Tolerance Loading (Stress)
Damage Tolerance
Environmental Severity
Human Factors
Durability Measurement
Material Selection

139
• Detection Probability (D): Likelihood that the Bondline failure or the propagation of corrosion on the bonded joint will be detected prior to the Occurrence.
The output of the B-CRAT evaluation framework for the various Failure Modes under the Risk Category – Material Selection is depicted in Figure 148 and Figure 149 below. Note: The assigned risk values in the depiction are derived from the hypothetical the comprehensive risk evaluation criteria structured for different Navy aircraft and for two specific application areas; Wings and Flight Controls and Fuselage. To bring this conceptual framework of the B-CRAT into reality and make it available to the maintainers, the project team needs to spend significant amount of time in evaluating the laboratory, OEM, and field test data to develop the realistic and comprehensive criteria which will provide guidance on the assignment of the risk scores and include the supporting justifications.
Figure 148 Risk rating framework will be supported by comprehensive risk evaluation criteria that helps assign the risk probability ratings.
Figure 149 Based on the Risk Probability Number (RPN), the failure modes will fall into the Low (1), Medium (3), or High (5) risk category which will show up on the Tool.
Aircraft F/A‐18
ApplicationAreaWings&Flight
Controls
OccurrenceProbability(O)
ImpactSeverity(S)
DetectionProbability(D)
RiskProbabilityNumber(RPN)
Rate1‐10(10=HighestProbability)
Rate1‐10(10=MostSevere)
Rate1‐10(10=Lowest
Probability)OxSxD
Substrate Al 2024-T3 8 8 9 576
SurfacePreparationPhosphoric Acid Etch 3 6 8 144
Primer BR6747-1NC 3 4 9 108
Adhesive EA 9696 3 4 9 108
Application&Cure Depot 2 3 3 18
RiskCategory/ProcessName
FailureMode
MaterialSelection
Variables
ImpactSeverity(S) 1‐2 3‐4 5‐6 7‐8 9‐10
Catastrophic(9‐10) 9‐10
Critical(7‐8) 7‐8
Borderline(5‐6) 5‐6
Moderate(3‐4) 3‐4
Low(1‐2) 1‐2
RatingScore5
MediumRisk
RatingScore3
LowRisk
RatingScore1
OccurrenceProbability(O)DetectionProbability
(D)
HighRisk

140
The conceptualized output of the B-CRAT evaluation framework consists of two elements; first, the risk rating framework where the user uses the risk evaluation criteria to assign risk probability ratings of 1 through 10 for Occurrence Probability, Impact Severity, and Detection Probability respectively and generates a Risk Probability Number (RPN) for each of the failure modes, and second, where each of the failure modes will be ‘binned’ to the Low (1), Medium (3), and High (5) risk rating.
Finally, the user interface of the B-CRAT would be a Signal Chart as depicted in Figure 150 below where the user can have a side-by-side assessment of the risk profiles of multiple adhesion bond primers that are available for the selected application area on a single weapon system. Each of the six (6) risk categories are assigned % weight for their overall importance in evaluation of the risk.
Figure 150 B-CRAT Signal Chart.
E.2 Modification of the B-CRAT Concept/Framework
Early results of the laboratory (WCET and DCB) and marine atmospheric environment (DCB) exposure test data were not validating the hypothesis that there were clear and obvious advantages to chromated adhesion primers in preventing the premature failure of bonded structure from corrosion. Since these findings were contrary to the fundamental premise of the conceptualized B-CRAT framework, this led to a significant revision to the B-CRAT concept and approach. The revised B-CRAT concept and framework was significantly simplified as shown in the Figure 151 below. The ‘Failure Modes’ were replaced with ‘Design Factors’ and the Primer was assigned a permanent ‘selection variable’ status. The comprehensive criteria to assign the Low (1), Medium (3), and High (5) values were discussed.
Weight Risk Category Failure Mode Primer
Weapon System
Application Area
Substrates Al 2024-T3
Surface Preparation Chromic Acid EtchPrimer SelectionAdhesive Selection EA 9696Application & Cure Laboratory
Bondline GeometryFuselageWings & Flight Controls
Location/Orientation
Operational Environment
Personnel
Quality Management
Accessibility
Assessment Techniques
20% Risk Tolerance Loading (Stress)
11 1 3 1 11 3 3 5 7 4 2 9
BCRAT Risk (%)
BCR (Bondline Corrosion Risk) Profile100%
BR127 BR6747-1NC BR6700 BR6747-1
F/A-18 F/A-18 F/A-18 F/A-18
3 4 420% Material Selection
1 3 5 4
1
15% Damage Tolerance1 3 3 51 1 1 1
35
5
15%Durability Measurement
3 4
1
15%
15%
5
1 3 5 5
2
5
3 5
Human Factors
5
Fuselage Fuselage Fuselage Fuselage
4 3 1
13
12
33
1 3
5
1 3 4
Environmental Severity 3
1 5
29% 48%
3
1 3 5
4 4
5 3 3
1
50% 53%
The Signal Chart represents the BCRAT User Interface. It allows the user to;1. Assess the risk profile of multiple adhesion bond primers that are available for application on a singleweapon system of interest;
2. Assess the risk profile of a single promoter across multiple weapon system platforms for the six Risk Categories and the identified Failure Modes in those categories.

141
Figure 151 Revised B-CRAT Framework
All Design factors for the five Risk Categories below the Material Selection category are assigned the same risk ratings and they get auto populated (by inserting macros) based on the selected Design Variables which are same for the application area and weapon system. However, by keeping all the other design factors and risk categories on the B-CRAT constant, we are unable to understand and identify the interrelationship and interactions between the Bondline adhesion primers being compared/evaluated and their resulting effects on the Bondline corrosion thereby making the other five risk categories inconsequential to the B-CRAT. As a result, focusing the B-CRAT solely on the Material Selection risk category would be the only area worthy of future investigation or discussion.
Primer
Weapon System
Application Area
Weight Risk Category Design Factor Design Variable
Substrates Al 2024-T3
Surface Preparation Grit Blast/Sol-Gel
Primer Selection Selection Variable
Adhesive Selection EA 9696
Application OEM
Curing Process Co-cure Primer
Ground-based Damage Honeycomb Core
Inflight Damage Non-leading Edges
Location / OrientationClosed Area/Intermittent Exposure
Operational Environment Carrier
Personnel Certified Artisan
Quality Management Other
AccessibilityBondline Visible for Inspection
Assessment TechniquesNDI Technique Not Defined
20% Risk Tolerance Loading (Stress) Medium
6 4 4 4 6 4 4 4 6 4 6 4
3
Risks are allocated as Low (score 1), Medium (3), and High (5)
3
5 5
Human Factors
33
1
5 5 5 5
Environmental Severity
3
10%Durability Measurement
5%
15%
• A low BCRAT percent (%) risk score is desirable. Higher number of Green cells indicate lower risk profile
BCRAT Risk (%)
BCR (Bondline Corrosion Risk) Profile100%
Guidance to BCR Evaluation Matrix: The above Evaluation Matrix allows side-by-side evaluation of Adhesion Promoters for BCR on weapon systems (WS) across Different Application Areas The BCRAT consists of Six (6) Key Categories. The BCR Evaluation Framework and Criteria will be developed ll Six (6) Key Categories are assigned % Weight for evaluation.
2/4/2016
38% 42% 46% 42%
BR-127 SprayBR6747-1NC
SprayBR6700
BR6747-1 Spray
F/A-18 F/A-18 F/A-18 F/A-18
3 5 3
Flight Control Surfaces
Flight Control Surfaces
Flight Control Surfaces
Flight Control Surfaces
Allocation of Risk Rating
1 3
1
3 3
5 5 5
5
3 3 3
5
3
1 1 1
3 3
5 5 5
3
3 3
3
5
1111
Bondline Damage Tolerance
10%
1 1 1 1
5
40% Material Selection
1 1 1
1 5

142
Appendix F Bondline System Element Analysis
The goal of this task was to advance, develop, and refine system concepts to be screened by mechanical and corrosion testing to confirm they mitigate bondline decay and improve system reliability. Bonded joints must ultimately be evaluated as a system. System element performance, whether it is substrates, surface treatments, primers, or adhesives cannot be fully understood without consideration of the final material stack-up. Results on the evaluation of primer characteristics, behavior of corrosion inhibitors in the resin system, and assessment of the effects of phosphoric acid anodize (PAA) post-treatments surface treatments directed at adhesion promotion and interface layer stabilization to isolate the effects of the inhibitor/primer on the properties of the system are reported. Testing of the relative moisture uptake of adhesives was performed to inform what effect the adhesive layer may have on the durability of a bonded joint.
F.1 PAA Post-Treatment
The PAA process produces cellular aluminum phosphate /aluminum oxide network structures on aluminum surface and it is understood that this porous structure facilitates strong bonding between epoxy and aluminum surface. These characteristics make PAA the ideal surface treatment for structural adhesive applications however they also make it susceptible to moisture attack. Formation of a flake like hydroxide33 which exhibits weak interface bonding with the aluminum surface can result in adhesive failure at the aluminum-epoxy interface. The objective of this subtask was to evaluate PAA post-treatments with nitrilotris (methylene) phosphonic acid (NTMP) and Metalast TCP-NP to protect the porous oxide layer from degradation due to moisture attack in ambient air and slow down the rate of degradation in humid environment34,35. NTMP is an organic amino-phosphonate which contains three phosphonic acid groups and one amine group. The phosphonic acid groups bind strongly to aluminum oxide and prevent it from hydrolyzing and its amine group can form chemical bonds with epoxide in epoxy adhesive. TCP-NP is a trivalent chromium conversion coating solution containing NTMP as an additive for corrosion protection. The post-treatments may also improve bondline durability by promoting better interface adhesion between epoxy primer and oxide layers. Relevance of this task to understanding the role of chromates in the bond primer included the possibility that reducing the role of surface preparation as the primary factor in bondline durability would allow more direct assessment of the role of the primer and the presence or absence of chromates.
Aluminum (Al) alloy 2024-T3 was phosphoric acid anodized according to ASTM D3933. Figure 152 shows phosphoric acid anodizing and post treatment processes. NTMP post treatment was conducted by submerge anodized Al coupon in 300 ppm solution for 15 minutes. TCP-NP treatment was conducted by submerging anodized Al coupon in TCP-NP solution for 15 or 5 minutes. NTMP was purchased from Aldrich and TCP-NP sample was from Metalast International, Inc (Minden, NV). Humidity exposure testing was conducted in a humidity chamber at 140°F and 98% RH for 4 hours and 52 hours.

143
Figure 152: Phosphoric acid anodizing and post treatment process
Aluminum panels were anodized at UTRC and post-treatments were conducted with NTMP or TCP-NP solution immediately following the PAA process. As-processed panels were analyzed using Focused Ion Beam – High Resolution Scanning Electron Microscopy (FIB-HRSEM).
The effect of PAA post treatment on the aluminum oxide hydration process was evaluated through accelerated temperature/humidity testing. Aluminum panels after PAA processing and after PAA plus NTMP or TCP-NP post-treatments were exposed in humidity chamber at 140°F and 98% RH for 4 hours to accelerate the hydration process. The panel surfaces were analyzed by FIB-HRSEM after exposure.
Figure 153 (left) shows the FIB-HRSEM images of plain view and cross-sections of the PAA-only panel. Energy Dispersive Spectroscopy (EDS) analysis shows the presence of 0.5wt% of phosphorus on the surface. Figure 153 (right) shows the FIB-HRSEM images and the EDS data of PAA surface post treated with NTMP. The oxide morphology of the surface and cross-section is identical to the PAA surface; the increase in phosphorus content to 0.8 wt% indicates absorption of NTMP. Figure 154 shows the FIB-HRSEM images and corresponding EDS data from PAA post treated with TCP-NP solution. The surface morphology is also similar to the PAA-only surface; some small pore-like defects were observed near the aluminum surface in cross-section view. This could be caused by the TCP post treatment or by incomplete infiltration of epoxy during mounting and polishing. To avoid damage from TCP-NP, a 5 minute infiltration time would be used in the future. In addition, phosphorus content increased to 0.8wt% after TCP-NP treatment. Zr and F were also detected on the surface.
Figure 153 FIB-HRSEM images and EDS analysis of plain view and cross-sections of a PAA-only panel (left) and PAA-NTMP panel (right)

144
Figure 154: FIB-HRSEM and EDS analyses of plain view and cross-section of PAA with TCP-NP post treatment
The FIB-HRSEM analysis of panel surfaces after 140°F and 98% RH for 4 hours revealed no changes in the PAA-only or the PAA plus post-treatment panels. However, humidity exposure at 140F/ 98% RH for 52 hours resulted in changes to the PAA surface oxide structure on all samples. On those substrates subjected to only the PAA process the filament network structure was completely degraded and replace with a porous flake-like structure; this structure may lead to adhesive failures. The PAA/NTMP sample still had some filament network structure visible, however some flake-type structure was also observed. In the PAA/TCP-NP sample a small amount of filament network structure was still visible and the structure showed more nodular morphology containing particulates.
Laboratory-scale PAA and post treatment processes developed at UTRC produced samples of PAA-only and PAA plus NTMP and PAA plus TCP-NP post treatments for analysis. FIB-HRSEM examination of the oxide surfaces confirmed that the porous oxide structure network was preserved and apparently undamaged following the post treatment. Short (4 hour) humidity conditioning (140F/98%RH) showed no differences between the three treatments, however longer term (52-hour) exposures resulted in a change to the morphology of the surface oxide on all samples. Based on the apparent need for optimization and understanding of the post-treatment processes to fully characterize the impact on the panel surface structure and the secondary nature of this task towards meeting the project objective, no further work was performed on this task. Additional work in this area is recommended since increased resistance to hydration within the bondline may improve the durability and further reduce any risks of eliminating chromated corrosion inhibitors.
F.2 Relative Moisture Uptake of Adhesives
Neat resin plaques of FM 73 and EA 9696 adhesives were fabricated by AFRL/RXSA for moisture uptake measurements to be conducted at the Army Research Laboratory (ARL).
The plaques were assembled from 13 plies of adhesive film processed using the cure cycle provided in Table 39 with the vacuum bag assembly shown in Figure 155. Each plaque was ultrasonically evaluated and sectioned for optical microscopy to ensure adequate consolidation was achieved during cure.

145
Table 39: Cure Cycles for EA 9696 and FM 73 Neat Resin Plaques Step Procedure
EA 9696 FM 73 1 Debulk 1 hour (> 28 in Hg) Debulk 1 hour (> 28 in Hg) 2 Apply pressure at 10 psig/min to 180 psig Apply pressure at 10 psig/min to 180 psig 3 Vent vacuum Vent vacuum 4 Heat at 1°F/min to 250°F Heat at 4°F/min to 250°F 5 Hold isothermally for 1 hour Hold isothermally for 1 hour 6 Cool at 5°F/min to ≤150°F Cool at 5°F/min to ≤150°F 7 Vent pressure at 10 psig/min to 0 psig Vent pressure at 10 psig/min to 0 psig
Figure 155: Neat Resin Plaque Vacuum Bag Assembly
After cure, the resin plaques were evaluated to determine their quality, with the presence of porosity being a key concern. Both ultrasonic inspections and microscopy analyses were performed for qualitative purposes only. Typical microscopy images are presented alongside the C-scan (plan-view ultrasonic data format) images in Figure 156. The C-scan images from ultrasonic inspections exhibited slight signal attenuation near the center of the plaques shown by the brown color on the C-scan images. Cross-sectional samples cut from center (brown-colored areas) of the plaques shown in the figure were imaged using an optical microscope. Although porosity was found, the concentration was minimal. The absence of porosity or foreign objects in the cross-section implies ultrasonic signal attenuation was likely due to a slight thickness variation in the sample.

146
Figure 156: Ultrasonic and Optical Microscopy Results for (a) EA 9696 and (b) FM 73 Neat Resin Plaques
The moisture absorption test methods followed for general guidance in this effort included ASTM D5229-12 (Standard Test Method for Moisture Absorption Properties and Equilibrium Conditioning of Polymer Matrix Composite Materials) and ASTM D570-98 (Standard Test

147
Method for Water Absorption of Plastics). In order to assess any differences in absorption relative to the presence of salt, the exposure conditions included immersion for 70 days in deionized water at 140°F, with or without 5% NaCl added by weight.
The gravimetric moisture uptake results are shown in Figure 157 and the averages are reported in Table 40. Recorded data was based on 5 specimens per condition.
Table 40: Gravimetric moisture uptake results for FM 73 and EA 9696 cured adhesive plaques by immersion in water and a 5% NaCl aqueous solution at 140°F for 70 days
Adhesive Percent Uptake Standard Deviation FM 73 3.60 0.05 FM 73 (salt solution) 2.07 0.01 EA 9696 4.02 0.02 EA 9696 (salt solution) 2.94 0.02
Figure 157: Gravimetric moisture uptake results for FM 73 and EA 9696 cured adhesive plaques by immersion in water and a 5% NaCl aqueous solution at 140°F
Although it is apparent that not all of the adhesive plaques reached equilibrium moisture uptake, the results indicate that FM 73 film adhesive absorbs less water (3.6 and 2.1%) than EA 9696 film adhesive (4% and 2.9%) and that both adhesives exhibit smaller weight increases in the 5% salt solution. Investigation into the epoxy adhesive chemistry (crosslink density/cure state, diffusion rate, material degradation, etc.) and/or scrim cloth which may have affected these relative responses to immersion was not the primary focus of this test. The purpose of the testing was to demonstrate the variations in moisture uptake within the “thick” (0.005 – 0.010 inch) adhesive layer which may impact bondline moisture ingress. It was also anticipated to provide additional data to assist in the interpretation of WCET and DCB results in 140°F with >95%RH and NSF conducted at 140°F where the presence of salt was the principle variable. These variations, along with individual adhesive chemistry properties, contribute to the necessity of testing a complete bonded system (substrates, surface treatments, primer, and adhesive) in assessing durability.

148
Bond performance can be attributed to several adhesive properties which can affect the interface between the adhesive and the bond primer. Intuitively, the flow and rheological properties of the adhesive will affect the intermingling of the bond primer resin with the adhesive resin system and thus impact adhesion and bond performance. The fundamental adhesive properties that can be correlated to performance of metal-surface preparation-bond primer-adhesive systems are not totally understood.
It is recommended to further characterize the fundamental properties of adhesives in future work. Some of these properties may include the following:
− Shear Modulus − Elastic Modulus − Poisson’s Ratio − Coefficient of Thermal Expansion − Fracture Properties − Electrical Conductivity
− Thermal conductivity − Thermal analysis (dry & wet glass transition
temperature (Tg), rheology, cure kinetics) − Stress-Free Temperature, Cure Shrinkage − Fluid uptake rate (water, fuel, hydraulic fluid)
Acknowledgements
ARL acknowledges the technical support provided by Mr. Daniel DeSchepper and Mr. David Flanagan. NAVAIR acknowledges the technical support provided by Mr. Jeremy Hill, Dr. Matthew Bucchino, Dr. Alan Grieve, Ms. Hema Manivannan, Ms. Kelsi Jameson, and Mr. Jeremy Mattison at Patuxent River NAS as well as technical and demonstration article support from Mr. Edward Harris of FRC-SW and Mr. Howard Royce, Mr. Sean Ghannadian, and Mr. Stephen Starnes of FRC-SE. AFRL/RXSA acknowledges the technical support provided by Ms. Kara Storage (AFRL/RXSA); Mr. Jeff Smith, Mr. Dan McCray, Mr. Paul Childers, Mr. Scott Lanter, and Ms. Wendy Kessen of UDRI; Mr. Rim Morell, Mr. Lucas Abrahamson, and Mr. Christian Pfledderer of the Southwestern Ohio Council for Higher Education; and Mr. Dennis Gilroy of InDyne, Inc. The team acknowledges the technical support provided by Raymond P. Martina of the Pratt & Whitney Materials and Processes Engineering Advanced Materials Laboratory.

149
List of Symbols, Abbreviations, and Acronyms
3M The 3M Company a DCB crack length measured from the point of load application AFRL U.S. Air Force Research Laboratory AFS Air Force Station ARL U.S. Army Research Laboratory ASTM American Society for Testing and Materials b width of one DCB beam (specified as 1.00 inches) B-CRAT Bondline-Corrosion Risk Assessment Tool BR 127 Solvent dispersed and chromate inhibited Cytec adhesive bond primer BR 6700-1 Water based and non-chromate inhibited Cytec adhesive bond primer BR 6747-1 Water based and chromate inhibited Cytec adhesive bond primer BR 6747-1NC Water based and noninhibited Cytec adhesive bond primer BSS Boeing Specification Support Standard CG Crack growth Cytec Cytec Industries Incorporated DCB Double cantilever beam DI Deionized DoD Department of Defense E Young's modulus EA 9696 Henkel Loctite EA 9696 AERO epoxy film adhesive EC Electrochemical EW-5000 Water based and chromate inhibited 3M adhesive bond primer EW-5000 ET Water based and non-chromate inhibited 3M adhesive bond primer EW-5000 NC Experimental water based and noninhibited 3M adhesive bond primer FDR False Discovery Rate FM 73 Cytec FM 73 epoxy film adhesive FRC Fleet Readiness Center FST Fleet Support Team GB Grit blast GBSG Grit blast sol-gel GIscc Environmental Crack Extension Force h height of one DCB beam JMP JMP statistical discovery software from SAS Institute Incorporated MS Excel Microsoft Excel MSAT Materials Selection and Analysis Tool NAS Naval Air Station NSF Neutral Salt Fog NTMP Nitrilotris (methylene) phosphonic acid NaCl Sodium chloride NAVAIR Naval Air Warfare Center OCP Open Circuit Potential PAA Phosphoric acid anodizing ppm Parts per million R Crack growth rate

150
Rct Charge resistance SAE Society of Automotive Engineers SCE Saturated calomel reference electrode SEM Scanning electron microscope SVET Scanning Vibrating Electrode Technique UNF Uniform National Fine TARDEC Tank Automotive Research Development Engineering Center Tg Glass transition temperature UTRC United Technologies Research Center WCET Wedge Crack Extension Test y DCB crack tip opening displacement
151
References
1 ASTM D3762, Standard Test Method for Adhesive-Bonded Surface Durability of Aluminum (Wedge Test), ASTM International, 2003 (R2010) 2 ASTM D2247, Standard Practice for Testing Water Resistance of Coatings in 100 % Relative Humidity, ASTM International, 2015 3 ASTM G85, Standard Practice for Modified Salt Spray (Fog) Testing, ASTM International, 2011 4 ASTM B117, Standard Practice for Operating Salt Spray (Fog) Apparatus, ASTM International, 2011 5 ASTM D3433, Standard Test Method for Fracture Strength in Cleavage of Adhesives in Bonded Metal Joints, ASTM International, 1999 (R2005) 6 BSS 7208 “Crack Extension Force, Adhesive Evaluation”, Boeing, 19 November1998 7 P.J. Van Voast, “Long Term Durability of Non Chromated Bond Primers” 8 SAE J2334, Laboratory Cyclic Corrosion Test, SAE International, 2003 9 H. Clearfield, D. McNamara, and G. Davis, “Surface Preparation of Metals,” Engineered Materials Handbook Vol 3: Adhesives and Sealants, C. Dostal (Sr. Editor), ASM International, 1990, p. 261 10 ASTM D3762, Standard Test Method for Adhesive-Bonded Surface Durability of Aluminum (Wedge Test), ASTM International, 2003 (R2010), p.1 11 ASTM D3933, Standard Guide for Preparation of Aluminum Surfaces for Structural Adhesives Bonding (Phosphoric Acid Anodizing), ASTM International, 1998 (R2010) 12 ASTM D3762, Standard Test Method for Adhesive-Bonded Surface Durability of Aluminum (Wedge Test), ASTM International, 2003 (R2010) 13 http://www.jmp.com/support/help/Interactive_Effect_Summary.shtml, retrieved 17 February 2016. 14 ASTM G140-02 “Standard Test Method for Determining Atmospheric Chloride Deposition Rate by Wet Candle Method,” ASTM International, 2014 15 ASTM D1002-10, “Standard Test Method for Apparent Shear Strength of Single-Lap-Joint
Adhesively Bonded Metal Specimens by Tension Loading (Metal-to-Metal),” ASTM International, 2010.
16 S. Rossi, M. Fedel, F. Deflorian, M.C. Vadillo, “Localized electrochemical techniques: Theory and practical examples in corrosion studies,” Comptes Rendus Chimie, vol. 11(9), pp. 984-994 (2008) 17 M. Yan, VJ Gelling, BR Hinderliter, et al. “SVET method for characterizing anti-corrosion performance of metal-rich coatings,” Corrosion Science. 52(8):2636-2642 (2010) 18 D.J. Penney, J.H. Sullivan, D.A. Worsley, “Investigation into the effects of metallic coating thickness on the corrosion properties of Zn-Al alloy galvanizing coatings,” Corrosion Sci., vol. 49(3), pp. 1321-1339, (2007) 19 J. Elvins, J.A. Spittle, D.A. Worsley, “Microstructural changes in zinc aluminium alloy galvanising as a function of processing parameters and their influence on corrosion,” Corrosion Sci., vol. 47(11), pp. 2740-2759, (2005)

152
20 J. He, V.J. Gelling, D.E. Tallman, G.P. Bierwagen, “A Scanning Vibrating Electrode Study of Chromated-Epoxy Primer on Steel and Aluminum,” J. Electrochemical Soc., vol. 147(10), pp. 3661-3666, (2000) 21 Z. Kolek, “Characterization of Water Penetration Inside Organic Coatings by Capacitance Measurements”, Progress in Organic Coatings 30, 287 (1997) 22 Rahul Sharma, Cortney Henderson, G. W. Warren, et al., “Study of Electrical Properties of Polymeric Materials Using Electrochemical Impedance Spectroscopy”, Journal of Applied Polymer Science 68, 553 (1998) 23 X.-W. Luo, Ze-Yong Yun, Shan-Jun Li, et al., “Study On The Sorption Of Water Into Epoxy Resins By Means Of Electrochemical Impedance Spectroscopy”, Macromolecular Rapid Communications, 16, 941 (1995) 24 L. V. S. Philippe, S. B. Lyon, C. Sammon, et al., “Validation of Electrochemical Impedance Measurements for Water Sorption into Epoxy Coatings using Gravimetry and Infra-red Spectroscopy”, Corrosion Science 50, 887 (2008) 25 V.N. Nguyen, F.X. Perrin, and J. L. Vernet,” Water Permeability of Organic/inorganic Hybrid Coatings Prepared by Sol–gel Method: A Comparison Between Gravimetric and Capacitance Measurements and Evaluation of Non-Fickian Sorption Models”, Corrosion Science 47, 397 (2005) 26 K. N. Allahar, B. R. Hinderliter, D. E. Tallman, et al., Water Sorption and Diffusional Properties of a Cured Epoxy Resin Measured using Alternating Ionic Liquids/aqueous Electrolytes in Electrochemical Impedance Spectroscopy”, Journal of The Electrochemical Society 155, F201 (2008) 27 F. Bellucci and L. Nicodemo, “Water Transport in Organic Coatings”, Corrosion 49, 235 (1993) 28 AMS3819, Cloths, Cleaning For Aircraft Primary and Secondary Structural Surfaces, SAE International, 2007 29 R. Jensen, A. Forster, L. Holmes, A. Teets, D. Flanagan, A. Bujanda, W. Kosik, D. DeSchepper, S. Ghiorse, S. McKnight “Adhesive bond strength and durability study of composite integral armor constituents”, ARL-TR-3798, May 2006. 30 M. J. Davis, D. A. Bond, "The Importance of Failure Mode Identification in Adhesive Bonded Aircraft Structures and Repairs", presented at the International Conference of Composite Materials 12, Paris, July 5-9, 1999 31 Andrew Rider, “The Durability of Metal-Honeycomb Sandwich Structure Exposed to High Humidity Conditions”, Defense Science & Technology Organization (DSTO), Aeronautical and Maritime Research laboratory, DSTO-TR-1276, Australia, 2002 32 T.C. Radtke, A. Charon and R. Vodicka, “Hot/Wet Environmental Degradation of Honeycomb Sandwich Structure Representative of F/A-18: Flatwise Tension Strength”, Defence Science & Technology Organization (DSTO), Aeronautical and Maritime Research Laboratory, DSTO-TR-0908, Australia, 1999 33 G. D. Davis, T.S. Sun, J.S. Ahearn, J. D. Venables, “Application of Surface Behaviour Diagrams to the Study of Hydration of Phosphoric Acid-Anodized Aluminum”, J. Materials Science, 17(1982) 1807-1818

153
34 John D. Venables, Masher E. Tadros, Brian M. Ditchek, “Durability of Adhesively Bonded Aluminum Structures and Method for Inhibiting the Conversion of Aluminum Oxide to Aluminum Hydroxide”, US 4308079, Dec. 29, 1981 35 J. D. Venables, “Review: Adhesion and Durability of Metal-Polymer Bonds”, J. Materials Science, 19 (1984) 2431-2453