MASS SPECTROMETRIC FRAGMENTATION AND PHARMACOLOGICAL ACTIVITIES OF 1,2,4 TRIAZOLE DERIVATIVES
A
hati(af5fa©
K
1
nAw5Tnap
ttip
0d
Available online at www.sciencedirect.com
Journal of Chromatography A, 1171 (2007) 15–21
Improved cleanup technique for gas chromatographic–mass spectrometricdetermination of alkylphenols from biota extract
Juan Wang a, Meihua Dong a, Won Joon Shim b, Narayanan Kannan b, Donghao Li a,∗a Analysis and Inspection Center, Yanbian University, Park Road 977, Yanji City, Jilin Province, China
b South Sea Institute, Korea Ocean Research and Development Institute, 391, Jangbuk-ri, Jangmok-myon, Geoje-shi 656-834, South Korea
Received 23 May 2007; received in revised form 14 September 2007; accepted 18 September 2007Available online 22 September 2007
bstract
A simple and economical cleanup technique was developed to determine alkylphenols by GC–MS from biological extracts containing relativelyigh lipids. The lipids were successfully removed from bivalve extracts through a two-step cleanup. The new method is a combination of Florisildsorption chromatography and silyl derivatization technique. Low and high (non-polar and highly polar) molecular weight lipids were removed fromhe biota extract with deactivated Florisil column in the first step. And in the second step, middle molecular weight (middle polar) lipids were removedn an activated Florisil column after the alkylphenols were converted to corresponding silyl derivatives with bis(trimethylsilyl)trifluoroacetamideBSTFA). On the basis of the above results, a simple cleanup kit was developed for convenience. The technique was optimized with reference to thectivity of packing materials and polarity of eluting solvents. Only 3 g of Florisil, 25 mL of hexane and 10 mL of dichloromethane were required
or one sample. The recoveries of alkylphenols from spiked samples varied from 88 to 103% with a low relative standard deviation (mean value:.3%) and the recovery was similar or even higher than other methods currently in use. The technique was successfully applied to mussel samplesrom Masan Bay, South Korea. Simultaneous measurement of these compounds in water, sediment and biota; the resulting bio-concentration factornd their relationships confirm previously published works, validating the method applied. 2007 Elsevier B.V. All rights reserved.eeLTi[hrtgts4
eywords: Alkylphenols; Nonylphenols; Biota; Cleanup; Lipids; GC–MS
. Introduction
Alkylphenols (APs) are the degradation products of alkylphe-ol polyethoxylates (APnEOs) during wastewater treatment [1].PnEOs have been widely used in the preparation of detergents,ood preservatives in households and industries. Approximately00,000 t of APnEOs are produced globally each year [2].he main APs used are nonylphenols (NPs) and octylphe-ols (OPs), with nonylphenol polyethoxylates (NPnEOs) takingpproximately 80% of the world market, and octylphenololyethoxylates (OPnEOs) taking the remaining 20% [3].
There are several reports relating to their distribution charac-eristics, persistency, toxicity and estrogenic properties. During
he last several decades, APs such as NPs and OPs were detectedn various matrices such as river water, seawater, suspendedarticles and sediment samples [4–7]. APs are stable in the∗ Corresponding author. Tel.: +86 433 2732040; fax: +86 433 2732207.E-mail address: [email protected] (D. Li).
o[dItwt
021-9673/$ – see front matter © 2007 Elsevier B.V. All rights reserved.oi:10.1016/j.chroma.2007.09.043
nvironment with a half-life of about 2 months in water andven years in sediments [2]. APs are toxic to organisms withC50 values between 50 and 2000 �g/L in different species [8].oxicity may occur when they partition to lipid membranes
n mitochondria, leading to uncoupling of energy production9]. The toxicity of APs usually increases as the length of theydrophobic chain increases [10]. In particular, endocrine dis-upting properties of APs are important. APs structure is similaro that of the natural estrogen 17�-estradiol. APs affect the estro-en receptors in the same way as 17�-estradiol. They influencehe males to have some female characters under long-term expo-ure due to endocrine disruption. Ishibashi et al. reported that-NP adversely affect the reproduction (fecundity and fertility)f adult medaka and accumulated in eggs with adverse effects11]. Human exposure to APs, in particular, can result fromifferent routes, like seafood contamination and water supply.
t is estimated from the seafood intake of Italians that theirotal NPs intake was 12.2 �g day−1 person−1 and OPs intakeas 0.05 �g day−1 person−1 [12]. NPs are found to be ubiqui-ous [13], present in human blood and urine [14,15]. Thus, a
1 atogr
pfoaoap
[wpaimiroloctlesglcegsetTet
bsst(nscs
2
2
4onSt(
NpaLcPub
2
Sumaohf2Qmsrmbqse
Htcw
2
stoewismwhu
2
6 J. Wang et al. / J. Chrom
otential impact on organisms and human health is expectedrom these chemicals. Therefore, a detailed study on the effectf APs is needed. However, our current knowledge on the fatend transport of APs is insufficient to adequately assess the riskf incorporated concentrations of these chemicals in organismsnd their effect on the ecosystem. Hence the analysis of thehenolic compounds in organisms is essential.
Most approaches towards the analysis of APs, utilize HPLC16,17], LC–MS [18,19], and GC–MS [20,21]. GC–MS isidely used for its high sensitivity. However, biological sam-les such as mussel, oyster, and fish are unsuitable for GC–MSnalysis due to the presence of large amount of lipids and othernterferences. These co-extracts will interfere in the final instru-
ental determination if not removed. Obviously, lipids overloadn GC columns deteriorate the chromatographic performanceapidly. Selective cleanup techniques need to be developed tovercome this. But separation of trace amount of APs from aarge portion of lipids is very difficult. There are several meth-ds in use for the removal of co-extracted lipids. Gel permeationhromatography (GPC) [22] is used but the main disadvan-age of the GPC system is the difficulty to completely removeipids, more over it requires large volume of solvent which isxpensive and time consuming [23]. On the other hand, clas-ical column chromatography using absorbents such as silicael, alumina, and Florisil are also applied for the removal ofipids [24,25]. These treatments are tedious, solvent and timeonsuming. Matrix solid-phase dispersion extraction (MSPD) isfficient, time and solvent saving, but the difference in rubbingranularity sizes and priming would change the elution curve,o standardization of the method is difficult [26]. Solid-phasextraction (SPE) is simple and convenient [27], but it is advan-age to liquid samples and its enrichment ability is restricted.hus it is necessary to develop a convenient, economical, highlyfficient and reliable cleanup technique for GC–MS determina-ion of APs for biota samples.
Phenols are amenable to GC analysis without derivatization,ut at lower concentration, peak tailing might occur and give lowensitivity and reproducibility, especially when environmentalamples are analyzed [28,29]. In our previous works, silyl deriva-ization techniques using bis(trimethylsilyl)trifluoroacetamideBSTFA) was successfully applied to the cleanup and determi-ation of phenolic analytes in various environmental water andediment samples [30]. On this basis, we developed an improvedleanup technique for GC–MS determination of APs for biotaamples.
. Experimental
.1. Chemicals and reagents
Alkylphenol standards [4-tert-butylphenol, 4-n-butylphenol,-n-pentylphenol, 4-n-hexylphenol, 4-tert-octylphenol, 4-n-ctylphenol, 4-octylphenols (technical mixture) and 4-
onylphenols (technical mixture)] were purchased from Chemervice (Hatfield, PA, USA) and the purities were higherhan 99%. GC internal standards (I.S.s) [2H10]phenanthrenephenanthrene-d10), surrogate standard (n-heptylphenol) and
wwSf
. A 1171 (2007) 15–21
,O-bis(trimethylsilyl)trifluoroacetamide (BSTFA: 99%) wereurchased from Chem Service (USA). Dichloromethane, hex-ne, acetone and methanol were purchased from Aldrich (St.ouis MO, USA). All solvents were pesticide grade. For sampleleanup, Florisil (LC grade) obtained from Supelco (Bellefonte,A, USA), after activation at 400 ◦C for 12 h, was used for col-mn cleanup. Anhydrous sodium sulfate and all glassware wereurned at 400 ◦C for 12 h and washed with solvent before using.
.2. Instrumental analysis
Target compounds and low polar lipids were separated using ahimadzu GC2010 (Tokyo, Japan) with DB-5MS capillary col-mn (30 m × 0.32 mm i.d.; coated film thickness: 25 �m). Oneicroliter of sample was introduced by splitless mode using
n autoinjector AOC-5000 from Shimadzu. The temperaturef the injection port was 280 ◦C. The oven temperature waseld at 80 ◦C for 2 min, then elevated to 100 ◦C at 20 ◦C/min,rom 100 to 200 ◦C at 10 ◦C/min, and from 200 to 280 ◦C at0 ◦C/min, and finally held at 280 ◦C for 2 min. A ShimadzuPMS 2010 mass spectrometer was interfaced with the chro-atographic system. The interface temperature was 280 ◦C. The
elected ion-monitoring (SIM) mode was used with a samplingate of 0.2 s. Quantification was done by an internal standardethod. The GC internal standards were added to the extract
efore the instrumental analysis. To control the experimentaluality, n-heptylphenol was used as a surrogate standard in realample analysis. Samples were spiked with surrogate beforextraction.
The middle polar lipids were analyzed with a ShimadzuPLC 6A system equipped with gradient pump, 10 �L injec-
ion loops, and a C18 analytical column (250 mm × 4.6 mm). Theonstant flow was kept at 1 mL/min. The solvent compositionas CH3OH:H2O = 85:15.
.3. Preparation of spiked biota extract and real samples
Twenty grams of non-contaminated dry biota samples (mus-el and oyster) were weighed and transferred to a Soxhlethimble. The Soxhlet extraction was performed with 200 mLf dichloromethane for 16 h, then concentrated and solvent wasxchanged to 10 mL of hexane. The phenolic analyte standardsere spiked to the biota extracts according to the level of exper-
mental demand. The spiked biota extracts were vigorouslyhaken and then stored in a freezer at −20 ◦C until use. To deter-ine alkylphenols from real environment, the mussel samplesere taken from Masan Bay, South Korea. The samples wereomogenized and frozen immediately. It was kept at −20 ◦Cntil use.
.4. Extraction
Three grams of wet or 0.5 g of homogenized dry sample was
eighed exactly. Fifty microliters of 5 mg/L surrogate standardas spiked for quality control. Then it was transferred into aoxhlet extractor and extracted with 200 mL of dichloromethaneor 16 h. The extract was collected and rotary-vacuum
J. Wang et al. / J. Chromatogr. A 1171 (2007) 15–21 17
Fig. 1. Schematic diagram of cleanup unit. The Column I* contains 5% deac-tivated Florisil absorbent (2 g). The non-polar and slightly polar solvents wereused as mobile phase. As a result, APs (in slightly polar fraction) were sepa-rated from non-polar lipids (in non-polar fraction) and high polar lipids (retaini #
npi
e0Tibpha
2
sptbgwdo8novataTbtcfs0
kvtcw
3
csm
Fbe
ltaapsadic
v(toas
3
nafiao
n the column). Column II contains fully activated Florisil absorbent (1 g). Onlyon-polar solvent was used as mobile phase. So, only silyl derivatized APs (non-olar) were eluted from the column and middle polar lipids were still retainedn the column.
vaporated to 1 mL at 40 ◦C. To remove water from the extract,.5–2 g of anhydrous sodium sulfate was added to every extract.hen the extract was transferred into an 8 mL glass vial by rins-
ng twice with 1 mL of dichloromethane. It was concentrated toelow 200 �L under a gentle stream of nitrogen at room tem-erature. Then the solvent was exchanged to about 200 �L ofexane. It was subjected to cleanup column or kit, for furthernalysis.
.5. Cleanup and derivatization
The cleanup course contained two steps (Fig. 1). The firsttep was performed in column I. A part of non-polar and higholar lipids were removed through column I. Column I con-ains 2 g of hexane-rinsed Florisil (deactivated with 5% H2O)etween two 1.5 g anhydrous sodium sulfate layers in a 10 mLlass syringe. A standard solution or an extract of biota samplesas added on to the column. Hexane (18 mL) was eluted first andiscarded, and then phenolic analytes were eluted with 10 mLf dichloromethane. The first 2 mL was discarded, and the nextmL was collected, it was concentrated with a gentle stream ofitrogen, and then the solvent was exchanged with about 200 �Lf hexane for column II [20]. The column II contains 1 g of acti-ated Florisil between two anhydrous sodium sulfate layers in10 mL glass syringe. A 0.7 mL aliquot of acetone was added
o the sodium sulfate layer as solvent medium for derivatizationnd then followed by addition of 100 �L of BSTFA (99% in 1%MCS). The sample was added. The derivatization reaction cane completed for 15 s. The analytes (alkylphenol silyl deriva-ives) were eluted with 3 mL of hexane twice. The elute wasoncentrated to below 0.2 mL with a gentle stream of nitrogenollowed by addition of I.S.s (50 �L × 5 mg/L) and then it wasubjected to GC–MS analysis after the final volume was set to.5 mL.
To improve the convenience of a cleanup course, a cleanupit was designed as shown in Fig. 2. An adapter with three-wayalves was used for collection and use of elution, concentra-ion of solvent, derivatization of APs and connection of the twoolumns. On the basis of this kit, a semi-automatic cleanup stepas possible.
. Results and discussion
Extracts of biota samples such as oysters, mussels and fishontain large amount of lipids such as fats, wax, fatty acids,teroids, phospholipids, etc. These lipids affect GC–MS deter-ination of APs. Therefore, it is necessary to separate APs from
ts
i
ig. 2. Semi-automatic cleanup kit assembly for the separation of APs fromiota extracts. *The adapter body was used in collection and concentration ofluting solvents, derivatization of APs and connecting Columns I and II.
ipids before GC–MS analysis. Physical and chemical proper-ies of the lipids are much similar to those of APs due to similarlkyl and hydroxyl groups. As a result, separation of the lipidsnd APs is much more difficult with traditional chromatogra-hy and chemical reaction techniques. Li et al. [20,31] reportedimple and fast APs cleanup techniques and it was successfullypplied to sediment samples. But the technique could not beirectly applied to biota samples due to lipid overload. Thus anmproved cleanup technique combining the Florisil adsorptionhromatography and silyl derivatization was taken up.
OPs were selected as target analytes for optimization ofarious cleanup conditions. It is reported that 4-octylphenols4-OPs) was one of the key APnEOs metabolites [32,33]. Inhis work after acceptable results were obtained from a seriesf experiments using OPs, the same analytical procedure waspplied to other phenolic analytes and also to real environmentalamples.
.1. Remove low and high polar lipids from biota extract
In the liquid absorbent chromatographic separation tech-iques, absorbent and eluting solvents are most importantmongst the various parameters. Lipids were roughly classi-ed as three groups: low (fatty acid, etc.), middle (steroids, etc.)nd high polar lipids (phospholipids, etc.). Based on polarityf lipids and APs, Florisil was selected as an absorbent, and
hen the effects of Florisil activity to the recoveries of OPs weretudied.The OPs standards (1 mL × 1 mg/L) dissolved in hexane werentroduced into the surface of the column containing 2 g of
18 J. Wang et al. / J. Chromatogr
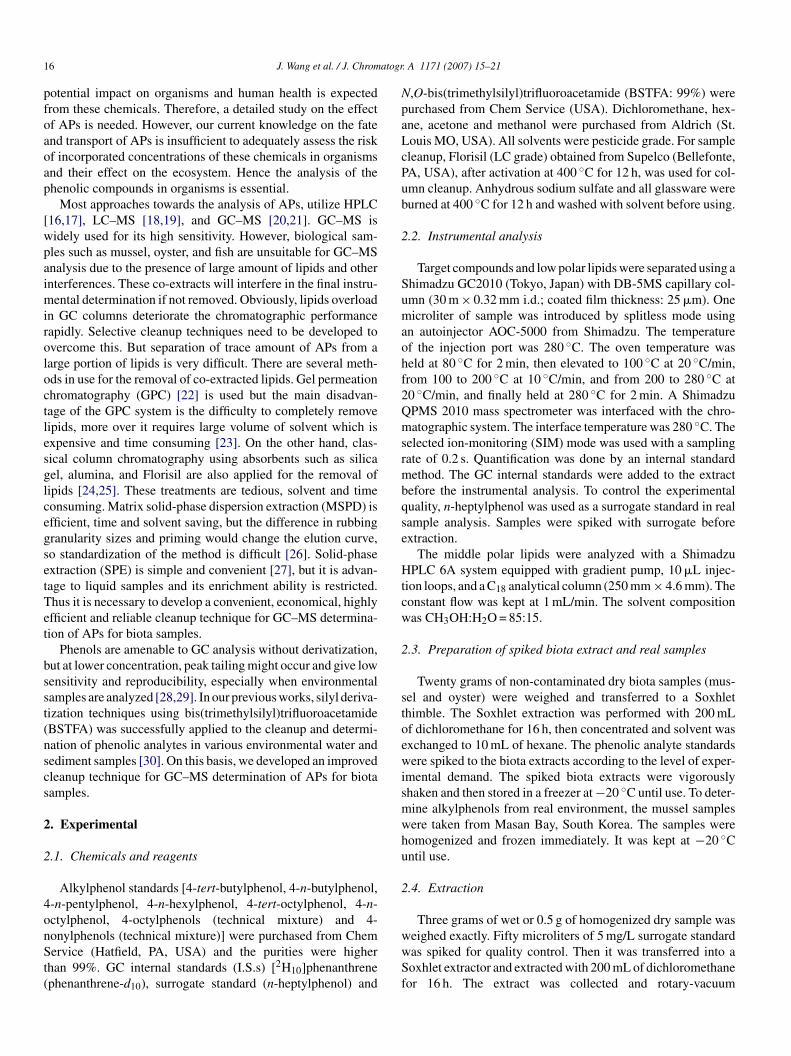
Fig. 3. Comparison of the elution efficiency in Column I with referenceto solvent polarity and activity of florisil (n = 7). (A) Elution efficiencyof 0, 20 and 100% acetone in dichloromethane in Column I packed withfully activated florisil; (B) elution efficiency of 0, 20 and 40% hexane indichloromethane in Column I packed with deactivated (5%) Florisil. OPs stan-dards (1 mL × 1 mg/L) were used. Note: The first 18 mL hexane elution wasdiscarded.
aecitieaphd
wervnw
bTdHa(emMtwd
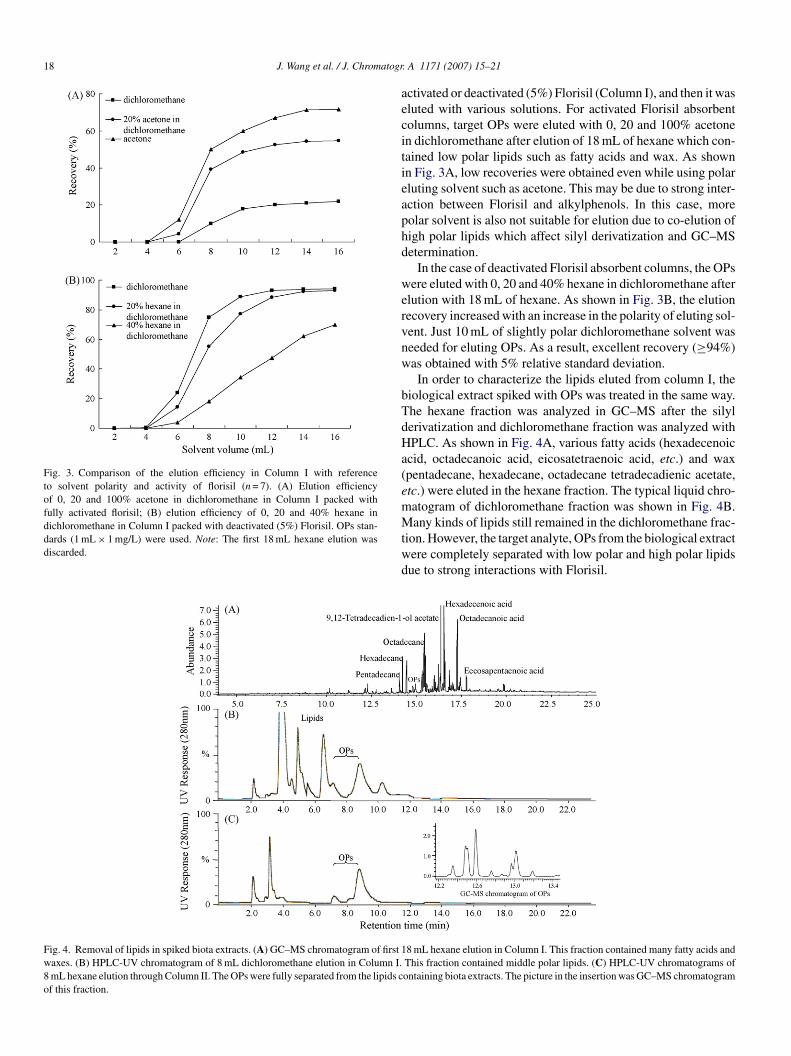
Fig. 4. Removal of lipids in spiked biota extracts. (A) GC–MS chromatogram of first 1waxes. (B) HPLC-UV chromatogram of 8 mL dichloromethane elution in Column I.8 mL hexane elution through Column II. The OPs were fully separated from the lipids cof this fraction.
. A 1171 (2007) 15–21
ctivated or deactivated (5%) Florisil (Column I), and then it wasluted with various solutions. For activated Florisil absorbentolumns, target OPs were eluted with 0, 20 and 100% acetonen dichloromethane after elution of 18 mL of hexane which con-ained low polar lipids such as fatty acids and wax. As shownn Fig. 3A, low recoveries were obtained even while using polarluting solvent such as acetone. This may be due to strong inter-ction between Florisil and alkylphenols. In this case, moreolar solvent is also not suitable for elution due to co-elution ofigh polar lipids which affect silyl derivatization and GC–MSetermination.
In the case of deactivated Florisil absorbent columns, the OPsere eluted with 0, 20 and 40% hexane in dichloromethane after
lution with 18 mL of hexane. As shown in Fig. 3B, the elutionecovery increased with an increase in the polarity of eluting sol-ent. Just 10 mL of slightly polar dichloromethane solvent waseeded for eluting OPs. As a result, excellent recovery (≥94%)as obtained with 5% relative standard deviation.In order to characterize the lipids eluted from column I, the
iological extract spiked with OPs was treated in the same way.he hexane fraction was analyzed in GC–MS after the silylerivatization and dichloromethane fraction was analyzed withPLC. As shown in Fig. 4A, various fatty acids (hexadecenoic
cid, octadecanoic acid, eicosatetraenoic acid, etc.) and waxpentadecane, hexadecane, octadecane tetradecadienic acetate,tc.) were eluted in the hexane fraction. The typical liquid chro-atogram of dichloromethane fraction was shown in Fig. 4B.
any kinds of lipids still remained in the dichloromethane frac-ion. However, the target analyte, OPs from the biological extractere completely separated with low polar and high polar lipidsue to strong interactions with Florisil.
8 mL hexane elution in Column I. This fraction contained many fatty acids andThis fraction contained middle polar lipids. (C) HPLC-UV chromatograms ofontaining biota extracts. The picture in the insertion was GC–MS chromatogram
mato
(pl
3
pctllp
pAcdetfga
ataFphHpdatoaf
sl
3
wpcarTfioseie(t
3
eIkepTfwTT
TR
C
4444444N
A
M
J. Wang et al. / J. Chro
In summary, although the fraction containing OPs carry lipidsmiddle polar lipids), it is possible to separate them from the lowolar and high polar lipids using the traditional Florisil absorbentiquid chromatographic technique.
.2. Removal of middle polar lipids from biota extract
As discussed in the previous section, some lipids (middleolar lipids) were retained in the dichloromethane fraction whichontained OP analytes. The polarities of the lipids are similaro those of OPs, so they showed similar elution behavior in theiquid absorption chromatography. In order to separate OPs ana-ytes from the lipids, it is necessary to make a difference in theirolarity.
It is reported that APs can be easily converted to lowolar silyl derivatives in a medium such as acetone [20].lso alkylphenolic silyl derivatives could improve various gas
hromatographic parameters of APs, such as accuracy, repro-ucibility, sensitivity, and resolution by suppressing tailing andnhancing thermal stability. The mass spectrometric proper-ies of the derivatives could also be improved by producingavorable diagnostic fragmentation patterns for structure investi-ation and characteristic ions for selected ion monitoring in tracenalyses.
The dichloromethane fraction containing middle polar lipidsnd OPs were concentrated and derivatized with BSTFA in ace-one medium. It was concentrated again, and then subjected to
second column separation which contained 1 g of activatedlorisil. The derivatized APs were easily eluted with a non-olar hexane solvent due to their weak polarity. Only 6 mL ofexane was used as an eluting solvent and it was subjected toPLC/UV (Fig. 4C) analysis after concentrating it to an appro-riate volume. As shown in Fig. 4C, the lipids found in theichloromethane fraction from column I disappeared completelyfter a second cleanup. Because 18 mL of hexane was eluted in
he first cleanup step (column I), the hexane fraction in the sec-nd cleanup step (column II) did not contain that part of lipids,nd the recoveries of OPs in the second cleanup step rangedrom 92 to 103% with an average of 97%.b4ot
able 1ecovery of pure chemicals and spiked chemicals from the cleanup kit applied in the
ompounds MDLa (ng/g) 5 ng/ga 25
Standard sample(n = 7)
Spiked sample(n = 7)
St(n
-tert-Butylphenol 1 94.4 ± 5.3 88.0 ± 7.6 93-n-Butylphenol 1 92.6 ± 2.4 90.1 ± 5.9 93-n-Pentylphenol 1 94.2 ± 4.5 92.3 ± 6.3 94-n-Hexylphenol 1 95.8 ± 2.0 94.7 ± 4.5 96-n-Heptylphenol 1 94.3 ± 1.8 91.2 ± 7.4 95-tert-Octylphenol 3 93.2 ± 4.6 93.7 ± 5.2 96-n-Octylphenol 1 94.4 ± 4.3 92.5 ± 4.9 96onylphenol 3 98.6 ± 1.2 103.2 ± 5.6 99
verage 1.5 94.7 ± 3.3 93.2 ± 5.9 95
DL: method detection limit.a Recovery (%) ± RSD (%).
gr. A 1171 (2007) 15–21 19
In summary, it is possible that alkylphenolic analytes could beeparated from low, middle and high polar lipids using combinediquid absorbent chromatography and derivatization techniques.
.3. Preparation of alkylphenols cleanup kit
By using the above experimental results, APs cleanup kitas designed as shown in Fig. 2. The kit consisted of threearts: column I, adapter and column II. The sample collection,oncentration, transfer and derivatization were performed in andapter system including connection to columns I and II. Fab-ication and operation becomes much simpler by using this kit.he experimental procedures were as following. The second
ractions from the column I were collected with the adapter andt was simultaneously evaporated to just dryness using streamf nitrogen. A 0.7 mL of acetone and 100 �L BSTFA was addedequent to the adapter for derivatization. After waiting for sev-ral seconds, the reactant was dropped into column II. And thent was eluted with 6 mL hexane. The cleanup procedure for biotaxtract could be finished within 10–15 min with a high recovery≥90%). In addition, it gives minimum contamination becausehe works were conducted in one continuous system.
.4. Analytical features
A series of experiments were carried out systematically tovaluate the applicability of the kit to environmental samples.nitially, recovery and reproducibility of the cleanup treatmentit, was evaluated using different concentrations of spiked biotaxtract (mussels and oysters), and then the results were com-ared with that of pure standards. The results are given in Table 1.he recoveries and relative standard deviations (R.S.D.) ranged
rom 88 to 103% with an average of 95% and from 0.4 to 7.6%ith an average of 5.3% for spiked biota extract, respectively.he results were very similar to those obtained in the standards.he similarities (recovery from standards/recovery from spiked
iota extract) ranged from 0.93 for 4-n-butylphenol to 1.1 for-n-OP. The recovery was similar or even higher than thosebtained from other methods currently in use [22,26,29]. Theypical mass chromatogram for spiked biota extract is given inseparation of lipids and alkylphenolic analytes in biota extracts
0 ng/ga 1000 ng/ga
andard sample= 7)
Spiked sample(n = 7)
Standard sample(n = 7)
Spiked sample(n = 7)
.5 ± 2.5 90.3 ± 6.8 94.6 ± 1.2 91.4 ± 4.6
.4 ± 2.0 92.4 ± 5.8 91.5 ± 1.0 90.2 ± 5.3
.6 ± 2.5 94.5 ± 4.9 96.8 ± 1.2 92.2 ± 5.1
.5 ± 1.4 96.0 ± 4.9 97.1 ± 0.8 93.5 ± 0.4
.8 ± 0.8 101.1 ± 5.7 95.5 ± 0.8 98.2 ± 5.0
.8 ± 1.2 100.3 ± 5.9 98.2 ± 0.6 96.8 ± 4.5
.2 ± 1.5 97.6 ± 5.3 95.3 ± 1.0 102.1 ± 4.4
.4 ± 0.4 101.5 ± 7.1 98.4 ± 0.7 100.4 ± 3.8
.7 ± 1.5 96.7 ± 5.8 95.9 ± 0.9 95.5 ± 4.1
20 J. Wang et al. / J. Chromatogr. A 1171 (2007) 15–21
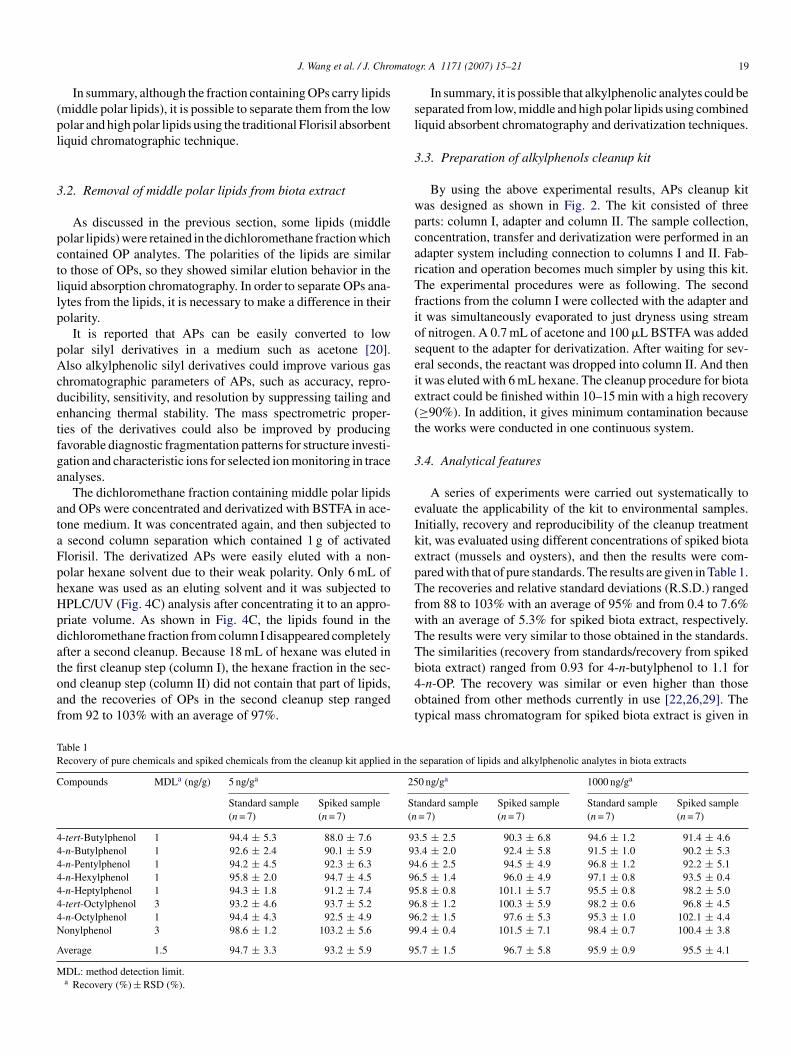
F p kit. (1) 4-tert-Butylphenol (t-BP), (2) 4-n-butylphenol (n-BP), (3) 4-n-pentylphenol( ptylphenol (n-HepP), (7) nonylphenol (NP), and (8) 4-n-octylphenol (4-n-OP).
FTeh
fbdwst
3
fiteaoaics
TCK
S
SSSSS
ss
Fa
sh(l
ig. 5. Chromatogram of phenolic analytes in biota extracts after two steps cleanun-PP), (4) 4-n-hexylphenol (n-HexP), (5) 4-tert-octylphenol (t-OP), (6) 4-n-he
ig. 5. In this chromatogram, few interfering peaks are observed.hus, a simple, fast and economical cleanup for APs in biotaxtract is possible. The advantage of the method is that it isighly sensitive and reproducible.
The method detection limits (MDLs) were also calculatedrom seven replicate samples at 2 ng/g levels using a 0.5 g of dryiota sample and the final volume was set at 0.5 mL. MDL waserived by using the following formula: MDL = SD × t + blank,here t = 3.143 for n = 7 at 98% confidence level and SD is the
tandard deviation. As shown in Table 1, MDLs of NPs and-OPs were 3 ng/g and about 1 ng/g for other six APs.
.5. Application to biota extracts
The method was applied for the analysis of NPs in musselsrom the Masan Bay of Korea. The analytical results are shownn Table 2. NPs were detected in every sample and the concentra-ions determined ranged 50.5–289.2 ng/g dry weight. The recov-ries of heptylphenol (surrogate) are between 85.8 and 97.5%nd the RSD values were lower than 11.3%. The concentrationsf NPs in water and sediment sampled at the same site and time
re also shown in Table 2. The applicability of this technique,ncluding the cleanup kit can be established from measuring theoncentration of NPs in water, sediment and biota, their relation-hips and by calculating the bio-concentration factor (BCF). Asable 2oncentrations of NPs in water, sediments and mussels from the Masan Bay,orea
ites Concentration of nonylphenols
Watera (ng/L) Sediment (ng/g dw) Mussel (ng/g dw)
t1 94 (6.2)b 447 (3.6) 289.2 (8.3)t2 54 (7.4) 364 (5.5) 169.5 (12.3)t3 26 (4.5) 92 (10.2) 76.8 (5.4)t4 22 (3.2) 110 (7.7) 50.5 (6.8)t5 32 (7.6) NA 111.0 (6.5)
a In order to obtain a representative value, concentrations of nonylphenol ineawater, for example St1, St2 and St5 were derived from five, three and fiveampling stations, respectively.b Relative standard deviation (n = 3). NA: not analyzed.
T
B
2iB[Tssc
4
cs
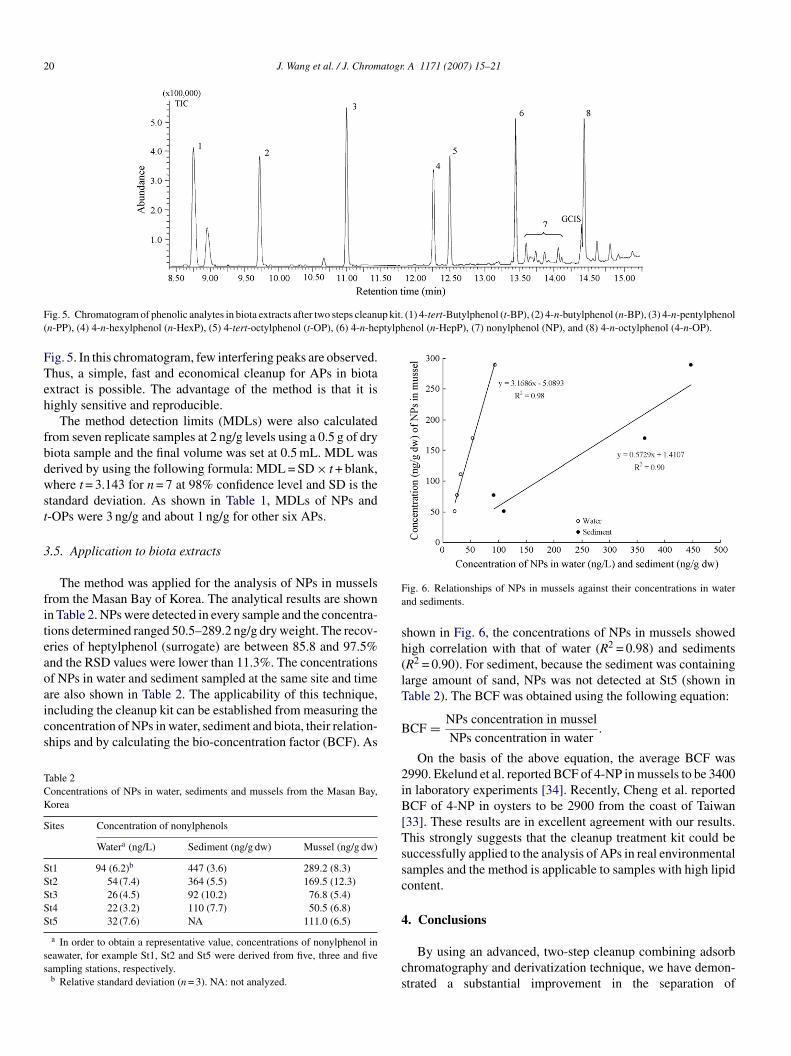
ig. 6. Relationships of NPs in mussels against their concentrations in waternd sediments.
hown in Fig. 6, the concentrations of NPs in mussels showedigh correlation with that of water (R2 = 0.98) and sedimentsR2 = 0.90). For sediment, because the sediment was containingarge amount of sand, NPs was not detected at St5 (shown inable 2). The BCF was obtained using the following equation:
CF = NPs concentration in mussel
NPs concentration in water.
On the basis of the above equation, the average BCF was990. Ekelund et al. reported BCF of 4-NP in mussels to be 3400n laboratory experiments [34]. Recently, Cheng et al. reportedCF of 4-NP in oysters to be 2900 from the coast of Taiwan
33]. These results are in excellent agreement with our results.his strongly suggests that the cleanup treatment kit could beuccessfully applied to the analysis of APs in real environmentalamples and the method is applicable to samples with high lipidontent.
. Conclusions
By using an advanced, two-step cleanup combining adsorbhromatography and derivatization technique, we have demon-trated a substantial improvement in the separation of
mato
alGtta
A
i(fitG
R
[
[
[[
[[
[
[
[[[[[
[
[
[
[[[[
[[[32] J. Zeravik, K. Skryjova, Z. Nevorankova, M. Fraınek, Anal. Chem. 76
J. Wang et al. / J. Chro
lkylphenols from biota extracts containing large amount ofipids, and the alkylphenols may be detected reliably usingC–MS. The proposed method is a time saving and economic
echnique with high precision and sensitivity. Understanding dis-ributions and behaviors of alkylphenols in environmental biotare now possible.
cknowledgements
This study was supported by grants-in-aid from the Min-stry of Environment as a part of Eco-Technopia-21 ProgramGrant No. 120010032). The authors gratefully acknowledgenancial supports from the National Natural Science Founda-
ion of China (No. 20767006), the State High-Tech Programrant (2006AA09Z175).
eferences
[1] W. Giger, P.H. Burnner, C. Schaffer, Science 225 (1984) 623.[2] G.G. Ying, B. Williams, R. Kookana, Environ. Int. 28 (2002) 1.[3] R. White, S.A. Jobling, S.A. Hoare, J.P. Sumpter, M.G. Parker, Endocrinol-
ogy 135 (1994) 175.[4] D. Li, M. Kim, W.J. Shim, U.H. Yim, J.R. Oh, Y.J. Kwon, Chemosphere
56 (2004) 1.[5] U. Bolz, H. Hagenmaier, W. Korner, Envrion. Pollut. 115 (2001) 291.[6] S. Hashimoto, A. Horiuchi, T. Yoshimoto, M. Nakao, H. Omura, Y. Kato,
H. Tanaka, K. Kannan, J.P. Giesy, Environ. Contam. Toxicol. 48 (2005)209.
[7] J.Y. Hu, F. Jin, Y. Wan, M. Yang, L.H. An, A. Tao, Environ. Sci. Technol.39 (2005) 4801.
[8] Ambient aquatic life water quality criteria for nonylphenol, EPA ReportNo. 68-C6-0036, US Environmental Protection Agency (EPA), Duluth,MN, 1997, p. 46.
[9] E. Argese, A. Marcomini, P. Miana, C. Bettiol, G. Perin, Environ. Toxicol.Chem. 13 (1994) 737.
[[
gr. A 1171 (2007) 15–21 21
10] D.W. Mcleese, V. Zitko, D.B. Sergeant, L. Burridge, C.D. Metcalfe,Chemosphere 10 (1981) 723.
11] H. Ishibashi, M. Hirano, N. Matsumura, N. Watanabe, Y. Takao, K. Arizono,Chemosphere 65 (2006) 1019.
12] F. Ferrara, F. Fabietti, M. Delise, E. Funari, Chemosphere 59 (2005) 1145.13] K. Guenther, V. Heinke, B. Thiele, E. Kleist, H. Prast, T. Raecker, Environ.
Sci. Technol. 36 (2002) 1676.14] B.L.L. Tan, M.A. Mohd, Talanta 61 (2003) 385.15] L.S. Mao, C.J. Sun, H. Zhang, Y.X. Li, D.S. Wu, Ana. Chim. Acta 522
(2004) 241.16] T. Tsuda, K. Suga, E. Kaneda, M. Ohsuga, J. Chromatogr. B 746 (2000)
305.17] R.A. Rudel, S.J. Melly, P.W. Geno, G. Sun, J.G. Brody, Environ. Sci.
Technol. 32 (1998) 861.18] P.L. Ferguson, C.R. Iden, B.J. Brownawell, Anal. Chem. 72 (2000) 4322.19] M. Petrovic, D. Barcelo, Anal. Chem. 72 (2000) 4560.20] D. Li, J. Park, J.R. Oh, Anal. Chem. 73 (2001) 3089.21] M. Kojima, S. Tsunoi, M. Tanaka, J. Chromatogr. A 984 (2003) 237.22] S. Meier, J. Klungsøyr, S. Boitsov, T. Eide, A. Svardal, J. Chromatogr. A
1062 (2005) 255.23] J. Hong, H. Kim, I. Baek, D. Kim, J. Seo, B. Chung, H. Pyo, K. Kim, Y.
Kim, Anal. Sci. Technol. 4 (2000) 484.24] T. Tsuda, A. Takino, M. Kojima, H. Harada, K. Muraki, J. Chromatogr. B
723 (1999) 273.25] B. Loganathan, B. Brown, D. Owen, K. Sajwan, Organohalogen Compd.
66 (2004) 2433.26] M. Zhao, F. Van der Wielen, P. de Voogt, J. Chromatogr. A 837 (1999) 129.27] S.N. Pedersen, C. Lindholst, J. Chromatogr. A 864 (1999) 17.28] K.D. Buchholz, J. Pawlizyn, Anal. Chem. 66 (1994) 160.29] H. Kim, J.K. Hong, Y.H. Kim, K.R. Kim, Arch. Pharm. Res. 26 (2003)
697.30] N. Shin, M. Donike, Anal. Chem. 68 (1996) 3015.31] D. Li, J.R. Oh, J. Park, J. Chromatogr. A. 1012 (2003) 207.
(2004) 1021.33] C.Y. Cheng, L.L. Liu, W.H. Ding, Chemosphere 65 (2006) 2152.34] R. Ekelund, A. Bergman, A. Granmo, M. Berggren, Environ. Pollut. 64
(1990) 107.
Copyright © 2022 FDOKUMEN