Experimental characterization of the Clear-PEM scanner spectrometric performance
Upload
independentCategory
view
3download
0
Flow analysis�/hydride generation�/Fourier transform infraredspectrometric determination of antimony in pharmaceuticals
M. Gallignani *, C. Ayala, M.R. Brunetto, M. Burguera, J.L. Burguera
Venezuelan Andean Institute for Chemical Research (IVAIQUIM), Faculty of Science, University of Los Andes, P.O. Box 440, Merida
5101-A, Venezuela
Received 8 July 2002; received in revised form 27 November 2002; accepted 27 November 2002
Abstract
In this work, a flow analysis system with hydride generation and Fourier transform infrared (FTIR) spectrometric
detection has been developed for the determination of antimony in pharmaceuticals. The method is based on the on-line
mineralization/oxidation of the organic antimonials present in the sample and pre-reduction of Sb(V) to Sb(III) with
K2S2O8 and KI, respectively; prior to the stibine generation. The gaseous SbH3 is separated from the solution in a gas
phase separator, and transported by means of a nitrogen carrier into a short pathway (10 cm) IR gas cell, where the
corresponding FTIR spectrum is acquired by accumulating 3 scans in a continuous mode. The 1893 cm�1 band was
used for the quantification of the antimony. The procedure is carried out in a closed system, which reduces sample
handling and makes possible the complete automation of the antimony determination. The figures of merit of the
proposed method (linear range: 0�/600 mg l�1, limit of detection (3s )�/0.9 mg l�1, limit of quantification (10s )�/3
mg Sb l�1, precision (R.S.D.) less than 1% and sample frequency�/28 h�1), are appropriate for the designed
application. Furthermore, precise and accurate results were found for the analysis of different antimonial
pharmaceutical samples, indicating that the methodology developed represents a valid alternative for the determination
of antimony in pharmaceuticals, which could be suitable for the routine control analysis.
# 2003 Elsevier Science B.V. All rights reserved.
Keywords: Antimony determination; Stibine; SbH3; Glucantime; Flow analysis; Hydride generation; Fourier transform infrared
spectrometry
1. Introduction
Although antimony is a potentially significant
element for plants, it does not have known
essential function in animals; on the contrary its
toxicity has been demonstrated [1,2]. However,
systemic antimonial therapy is still recommended
for multiple lesions caused by human leishmaniasis
disease [3,4]. The toxicological and physiological
behavior of this element is dependent on its
oxidation state. Elemental antimony is more toxic
than its salts, and trivalent antimony salts are ten
times more toxic than pentavalent salts [5,6]. At
present, almost all forms of leishmaniasis are
* Corresponding author. Tel.: �/58-274-2401375; fax: �/58-
274-2401286.
E-mail address: [email protected] (M. Gallignani).
Talanta 59 (2003) 923�/934
www.elsevier.com/locate/talanta
0039-9140/03/$ - see front matter # 2003 Elsevier Science B.V. All rights reserved.
doi:10.1016/S0039-9140(02)00648-3
initially treated with tri- and penta-valent anti-monials in the form of sodium stibogluconate
(pentostan ), N -methyl glucamine antimoniate or
meglubine antimoniate (glucantime ). Other anti-
monial compounds such as sodium and potassium
antimonyl-tartrate (emetic tartar) has been used in
the treatment of schistosomiasis, protozoal infec-
tions and an as emetic [7,8].
Molecular absorption spectrophotometry [9,10],fluorimetry [11], atomic fluorescence spectrometry
[12], anodic stripping voltammetry [13] and gra-
phite furnace atomic absorption spectrometry
(AAS) [14] have been reported to be suitable for
antimony determination in different matrixes.
However, the most commonly employed analytical
approach involved hydride generation (HG) inter-
faced with some form of atomic spectroscopy(AS), popularly AAS [15]. HG methods have the
advantage of being simple, rapid and relatively
interferences free.
Fourier transform infrared (FTIR) spectrome-
try is a fast analytical technique that provides very
interesting quantitative information from solid,
liquid and gaseous samples [16]. However, in the
last years, developments in gas phase generation-FTIR spectrometry, based on the on-line genera-
tion of vapor phases from liquid and solid samples
have improved direct determination by FTIR due
to the high transparency of gases, the low back-
ground values achieved and the possibilities of-
fered by using multiple-pass cells to increase the
analytical sensitivity [17,18]. Additionally, and in
the same way that in HG, vapor-phase generationallows an efficient matrix removal, thus reducing
spectral interferences. Various flow injection (FI)-
vapor generation-FTIR methodologies have been
developed for the determination of alcohols (eth-
anol and methanol) in different matrixes [19�/22],
carbonates in liquid and solid samples [18,23�/25];
as well as benzene, toluene and methyl tert -butyl
ether in gasolines [26] and butyl acetate, tolueneand methyl ethyl ether in paint solvents [27].
Most recently Gallignani et al. developed the
flow analysis (FA) with HG and FTIR (FA�/HG�/
FTIR) coupling for the individual and simulta-
neous determination of antimony, arsenic and tin,
via the generation of stibine (SbH3), arsine (AsH3)
and stannane (SnH4) [28]. This hybridized system
enhanced the analytical potentialities of the FTIRinstrumentation, allowing the determination of Sb
by using the medium intense band at 1893 cm�1.
Quality control of pharmaceutical products
demands a continuous development and improve-
ment of new analytical chemical methods. Most
on-line continuous flow and FI manifolds coupled
to different AS detection techniques have been
used for sample pretreatment for the determina-tion of antimony in various types of samples [15].
However, to the best knowledge of the authors, no
work has been reported for the Sb determination
by HG�/FTIR spectrometry with on-line sample
treatment.
The main aim of this work was to evaluate the
possibilities of the FA�/HG�/FTIR spectrometry
for the analysis of antimony in real samples, and inthis way, to develop an alternative methodology
for the determination of antimony in pharmaceu-
ticals which could be suitable for the routine
control analysis.
2. Experimental
2.1. Instrumentation
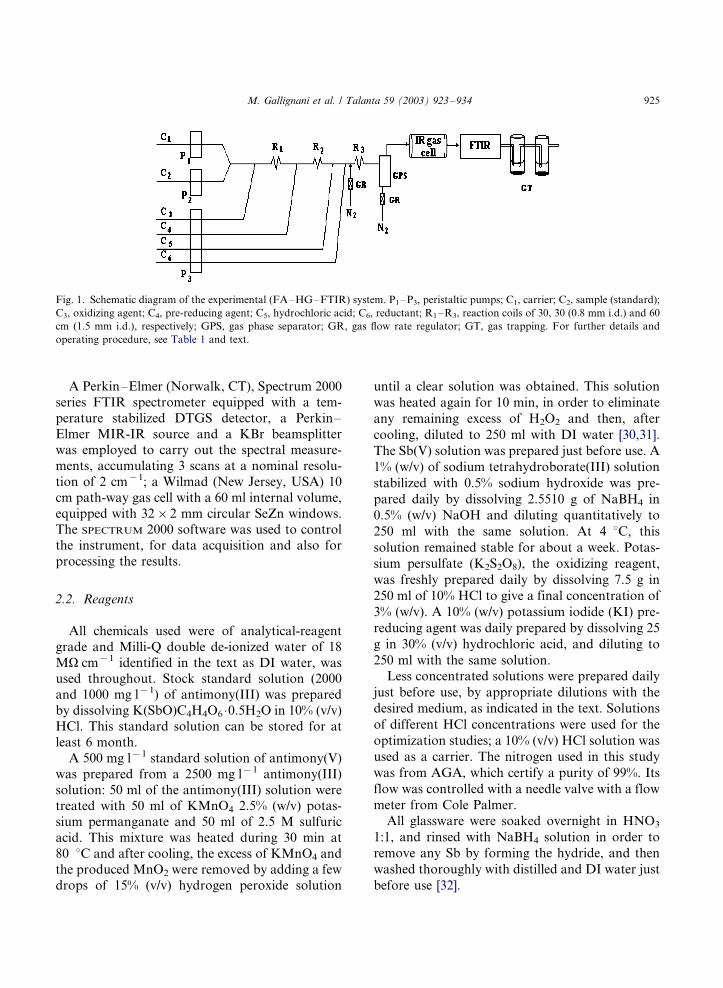
Fig. 1 depicts the schematic diagram of the FA�/
HG�/FTIR manifold used in this work. It consists
of an assembly of three Ismatec (Glattbrugg,
Switzerland) IPC peristaltic pumps (P1�/P3) of
four channels, furnished with Tygon tubes, six
channels for the transport of samples and reagents
(C1�/C6), three PTFE reaction coils (R1�/R3), aVarian (Springvale, Australia) gas�/liquid separa-
tor (GPS), a gas IR cell, a FTIR detector, two
entry of N2 with independent flow rate Cole
Palmer (Illinois, USA) regulators and a home-
made gas trap (GT). The experimental design
includes a simple time-based injection system for
the sequential introduction of sample and carrier.
It was designed using two Ismatec IPC fourchannel programmable peristaltic pumps (P1 and
P2) synchronized in the time, which propelled the
sample and the carrier (water), respectively. De-
tails of the construction and functioning of the
time-based injector were previously described by
Gallignani et al. [28,29].
M. Gallignani et al. / Talanta 59 (2003) 923�/934924
A Perkin�/Elmer (Norwalk, CT), Spectrum 2000
series FTIR spectrometer equipped with a tem-
perature stabilized DTGS detector, a Perkin�/
Elmer MIR-IR source and a KBr beamsplitterwas employed to carry out the spectral measure-
ments, accumulating 3 scans at a nominal resolu-
tion of 2 cm�1; a Wilmad (New Jersey, USA) 10
cm path-way gas cell with a 60 ml internal volume,
equipped with 32�/2 mm circular SeZn windows.
The SPECTRUM 2000 software was used to control
the instrument, for data acquisition and also for
processing the results.
2.2. Reagents
All chemicals used were of analytical-reagent
grade and Milli-Q double de-ionized water of 18
MV cm�1 identified in the text as DI water, wasused throughout. Stock standard solution (2000
and 1000 mg l�1) of antimony(III) was prepared
by dissolving K(SbO)C4H4O6 �/0.5H2O in 10% (v/v)
HCl. This standard solution can be stored for at
least 6 month.
A 500 mg l�1 standard solution of antimony(V)
was prepared from a 2500 mg l�1 antimony(III)
solution: 50 ml of the antimony(III) solution weretreated with 50 ml of KMnO4 2.5% (w/v) potas-
sium permanganate and 50 ml of 2.5 M sulfuric
acid. This mixture was heated during 30 min at
80 8C and after cooling, the excess of KMnO4 and
the produced MnO2 were removed by adding a few
drops of 15% (v/v) hydrogen peroxide solution
until a clear solution was obtained. This solution
was heated again for 10 min, in order to eliminate
any remaining excess of H2O2 and then, after
cooling, diluted to 250 ml with DI water [30,31].
The Sb(V) solution was prepared just before use. A
1% (w/v) of sodium tetrahydroborate(III) solution
stabilized with 0.5% sodium hydroxide was pre-
pared daily by dissolving 2.5510 g of NaBH4 in
0.5% (w/v) NaOH and diluting quantitatively to
250 ml with the same solution. At 4 8C, this
solution remained stable for about a week. Potas-
sium persulfate (K2S2O8), the oxidizing reagent,
was freshly prepared daily by dissolving 7.5 g in
250 ml of 10% HCl to give a final concentration of
3% (w/v). A 10% (w/v) potassium iodide (KI) pre-
reducing agent was daily prepared by dissolving 25
g in 30% (v/v) hydrochloric acid, and diluting to
250 ml with the same solution.
Less concentrated solutions were prepared daily
just before use, by appropriate dilutions with the
desired medium, as indicated in the text. Solutions
of different HCl concentrations were used for the
optimization studies; a 10% (v/v) HCl solution was
used as a carrier. The nitrogen used in this study
was from AGA, which certify a purity of 99%. Its
flow was controlled with a needle valve with a flow
meter from Cole Palmer.
All glassware were soaked overnight in HNO3
1:1, and rinsed with NaBH4 solution in order to
remove any Sb by forming the hydride, and then
washed thoroughly with distilled and DI water just
before use [32].
Fig. 1. Schematic diagram of the experimental (FA�/HG�/FTIR) system. P1�/P3, peristaltic pumps; C1, carrier; C2, sample (standard);
C3, oxidizing agent; C4, pre-reducing agent; C5, hydrochloric acid; C6, reductant; R1�/R3, reaction coils of 30, 30 (0.8 mm i.d.) and 60
cm (1.5 mm i.d.), respectively; GPS, gas phase separator; GR, gas flow rate regulator; GT, gas trapping. For further details and
operating procedure, see Table 1 and text.
M. Gallignani et al. / Talanta 59 (2003) 923�/934 925
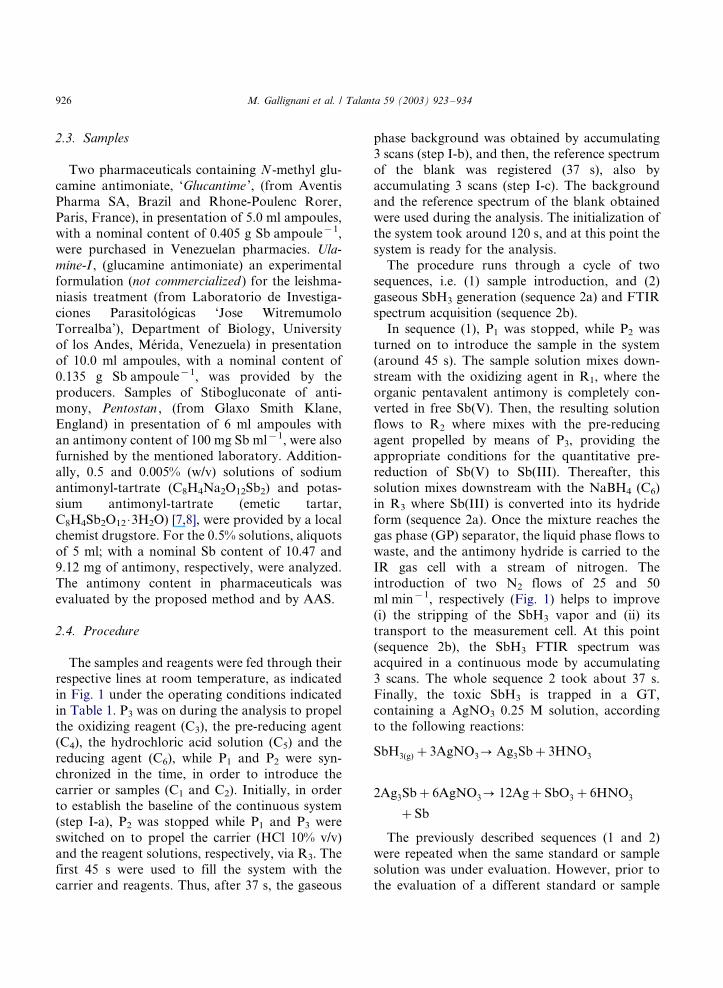
2.3. Samples
Two pharmaceuticals containing N -methyl glu-
camine antimoniate, ‘Glucantime ’, (from Aventis
Pharma SA, Brazil and Rhone-Poulenc Rorer,
Paris, France), in presentation of 5.0 ml ampoules,
with a nominal content of 0.405 g Sb ampoule�1,
were purchased in Venezuelan pharmacies. Ula-
mine-I , (glucamine antimoniate) an experimentalformulation (not commercialized ) for the leishma-
niasis treatment (from Laboratorio de Investiga-
ciones Parasitologicas ‘Jose Witremumolo
Torrealba’), Department of Biology, University
of los Andes, Merida, Venezuela) in presentation
of 10.0 ml ampoules, with a nominal content of
0.135 g Sb ampoule�1, was provided by the
producers. Samples of Stibogluconate of anti-mony, Pentostan , (from Glaxo Smith Klane,
England) in presentation of 6 ml ampoules with
an antimony content of 100 mg Sb ml�1, were also
furnished by the mentioned laboratory. Addition-
ally, 0.5 and 0.005% (w/v) solutions of sodium
antimonyl-tartrate (C8H4Na2O12Sb2) and potas-
sium antimonyl-tartrate (emetic tartar,
C8H4Sb2O12 �/3H2O) [7,8], were provided by a localchemist drugstore. For the 0.5% solutions, aliquots
of 5 ml; with a nominal Sb content of 10.47 and
9.12 mg of antimony, respectively, were analyzed.
The antimony content in pharmaceuticals was
evaluated by the proposed method and by AAS.
2.4. Procedure
The samples and reagents were fed through theirrespective lines at room temperature, as indicated
in Fig. 1 under the operating conditions indicated
in Table 1. P3 was on during the analysis to propel
the oxidizing reagent (C3), the pre-reducing agent
(C4), the hydrochloric acid solution (C5) and the
reducing agent (C6), while P1 and P2 were syn-
chronized in the time, in order to introduce the
carrier or samples (C1 and C2). Initially, in orderto establish the baseline of the continuous system
(step I-a), P2 was stopped while P1 and P3 were
switched on to propel the carrier (HCl 10% v/v)
and the reagent solutions, respectively, via R3. The
first 45 s were used to fill the system with the
carrier and reagents. Thus, after 37 s, the gaseous
phase background was obtained by accumulating3 scans (step I-b), and then, the reference spectrum
of the blank was registered (37 s), also by
accumulating 3 scans (step I-c). The background
and the reference spectrum of the blank obtained
were used during the analysis. The initialization of
the system took around 120 s, and at this point the
system is ready for the analysis.
The procedure runs through a cycle of twosequences, i.e. (1) sample introduction, and (2)
gaseous SbH3 generation (sequence 2a) and FTIR
spectrum acquisition (sequence 2b).
In sequence (1), P1 was stopped, while P2 was
turned on to introduce the sample in the system
(around 45 s). The sample solution mixes down-
stream with the oxidizing agent in R1, where the
organic pentavalent antimony is completely con-verted in free Sb(V). Then, the resulting solution
flows to R2 where mixes with the pre-reducing
agent propelled by means of P3, providing the
appropriate conditions for the quantitative pre-
reduction of Sb(V) to Sb(III). Thereafter, this
solution mixes downstream with the NaBH4 (C6)
in R3 where Sb(III) is converted into its hydride
form (sequence 2a). Once the mixture reaches thegas phase (GP) separator, the liquid phase flows to
waste, and the antimony hydride is carried to the
IR gas cell with a stream of nitrogen. The
introduction of two N2 flows of 25 and 50
ml min�1, respectively (Fig. 1) helps to improve
(i) the stripping of the SbH3 vapor and (ii) its
transport to the measurement cell. At this point
(sequence 2b), the SbH3 FTIR spectrum wasacquired in a continuous mode by accumulating
3 scans. The whole sequence 2 took about 37 s.
Finally, the toxic SbH3 is trapped in a GT,
containing a AgNO3 0.25 M solution, according
to the following reactions:
SbH3(g)�3AgNO30 Ag3Sb�3HNO3
2Ag3Sb�6AgNO30 12Ag�SbO3�6HNO3
�Sb
The previously described sequences (1 and 2)
were repeated when the same standard or sample
solution was under evaluation. However, prior to
the evaluation of a different standard or sample
M. Gallignani et al. / Talanta 59 (2003) 923�/934926
solution, the carrier was introduced by means of
P1 (step I-a), in order to clean the system, and
then, to avoid the memory effect of the previously
introduced solution.
The first derivative spectra were obtained from
the FTIR spectra registered, and then, the peak-to-
valley (1891�/1895 cm�1) measurement of the 1893
cm�1 band were evaluated. Data obtained for
samples were interpolated on the corresponding
calibration graph established for aqueous standard
solutions of Sb(III), introduced in the system
identical to samples.
For comparison analysis, the liquid effluents of
R2 (Fig. 1) adequately diluted with DI water, were
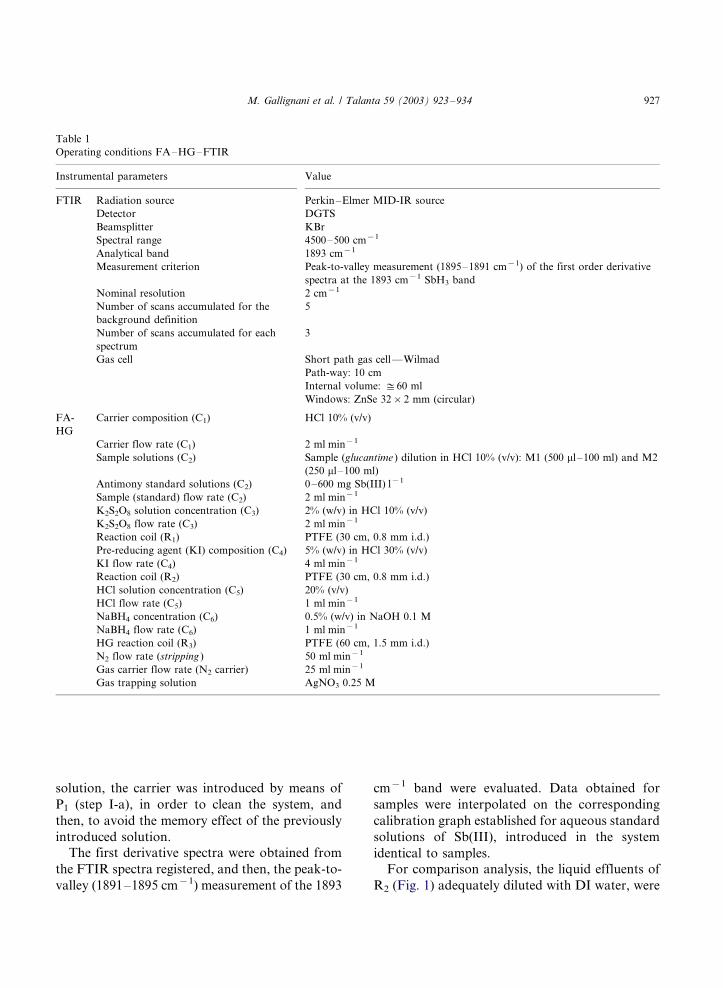
Table 1
Operating conditions FA�/HG�/FTIR
Instrumental parameters Value
FTIR Radiation source Perkin�/Elmer MID-IR source
Detector DGTS
Beamsplitter KBr
Spectral range 4500�/500 cm�1
Analytical band 1893 cm�1
Measurement criterion Peak-to-valley measurement (1895�/1891 cm�1) of the first order derivative
spectra at the 1893 cm�1 SbH3 band
Nominal resolution 2 cm�1
Number of scans accumulated for the
background definition
5
Number of scans accumulated for each
spectrum
3
Gas cell Short path gas cell*/Wilmad
Path-way: 10 cm
Internal volume: $/60 ml
Windows: ZnSe 32�/2 mm (circular)
FA-
HG
Carrier composition (C1) HCl 10% (v/v)
Carrier flow rate (C1) 2 ml min�1
Sample solutions (C2) Sample (glucantime ) dilution in HCl 10% (v/v): M1 (500 ml�/100 ml) and M2
(250 ml�/100 ml)
Antimony standard solutions (C2) 0�/600 mg Sb(III) l�1
Sample (standard) flow rate (C2) 2 ml min�1
K2S2O8 solution concentration (C3) 2% (w/v) in HCl 10% (v/v)
K2S2O8 flow rate (C3) 2 ml min�1
Reaction coil (R1) PTFE (30 cm, 0.8 mm i.d.)
Pre-reducing agent (KI) composition (C4) 5% (w/v) in HCl 30% (v/v)
KI flow rate (C4) 4 ml min�1
Reaction coil (R2) PTFE (30 cm, 0.8 mm i.d.)
HCl solution concentration (C5) 20% (v/v)
HCl flow rate (C5) 1 ml min�1
NaBH4 concentration (C6) 0.5% (w/v) in NaOH 0.1 M
NaBH4 flow rate (C6) 1 ml min�1
HG reaction coil (R3) PTFE (60 cm, 1.5 mm i.d.)
N2 flow rate (stripping ) 50 ml min�1
Gas carrier flow rate (N2 carrier) 25 ml min�1
Gas trapping solution AgNO3 0.25 M
M. Gallignani et al. / Talanta 59 (2003) 923�/934 927

analyzed by conventional flame AAS, at the 217.6nm characteristic absorption line of antimony
[15,30,31].
3. Results and discussion
3.1. Preliminary studies. Gaseous SbH3 FTIR
spectra obtained from standards and samples
The preliminary studies and the optimization of
the proposed method were carried out for the
determination of antimony in glucantime samples.
For this purpose, two glucantime sample dilutions
were prepared: 500 and 250 ml were diluted to a
final volume of 100 ml with HCl 10% (v/v). These
sample dilutions are identified in the text as M1
and M2.Fig. 2A presents the gaseous SbH3 FTIR
spectra, obtained in the proposed system, from:
(a) a standard solution of 500 mg Sb l�1, and (b) a
sample solution (M1). SbH3 shows a medium
intense band at 1893 cm�1, and two less intense
bands localized at 830 and 781 cm�1. The insert in
the figure shows an amplification of the 1893
cm�1 band. At this point, it is important to pointout, that the FTIR spectra of standards and
samples treated in the proposed system are iden-
tical, and provide a way for the determination of
antimony in this kind of pharmaceuticals.
Any of the mentioned bands could be employed
for the determination of antimony. However, in
the present study, the band at 1893 cm�1 was
selected for the quantitative determination of Sb,via the generation of the stibine, because this band:
(i) is strong, (ii) is well resolved for standards and
samples and (iii) appears in a really transparent
zone of the blank. This can be seen in Fig. 2B,
where the behavior of the analytical band obtained
from: (a) a standard solution (250 mg Sb l�1), (b)
a sample solution (M2), (c) a sample solution
fortified with 250 mg Sb l�1 (50 ml of M1�/50 mlof 500 mg Sb l�1), and (d) the blank of the system
are shown.
Different baseline correction can be established
to carry out the quantitative determination at the
1893 cm�1 band. However, in this study the peak-
to-valley (1895�/1891 cm�1) measurement of the
first order derivative spectra was selected as the
analytical signal, in order to automatically correct
the displacement of the spectra with respect to the
base line, and to avoid the associated problems in
the selection of the baseline correction [28]. This
Fig. 2. SbH3(g) FTIR spectra from standard and sample
solutions. (A) Spectra obtained from: (a) standard solution of
500 mg Sb l�1, and (b) sample solution (M1). Insert: amplifica-
tion of the 1893 cm�1 analytical band. (B) FTIR spectra (1893
cm�1 band) from: (a) standard solution (500 mg l�1), (b)
sample solution (M2) and (c) sample solution fortified with 500
mg Sb l�1, (d) blank of the system. (C) Measurement criteria
(a) 1893 cm�1 absorption band of SbH3(g), (b) First derivative
order of the same band. Standard solution [Sb]�/100 mg l�1.
Other experimental conditions as specified in Table 1.
M. Gallignani et al. / Talanta 59 (2003) 923�/934928

behavior can be observed in Fig. 2C, where the1893 cm�1 band, and the corresponding first
order derivate obtained from a 100 mg Sb l�1
solution are shown.
The analytical sensitivity of the system (the
slope of the calibration graph) obtained by using
the derivative measurements is approximately one
half of those obtained by using the absorbance at
1893 cm�1 establishing the baseline correctionbetween 1750 and 2050 cm�1. However, the
related loss in the sensitivity, does not cause
problems, due to the high antimony content of
samples.
3.2. Optimization of the operating conditions
In the proposed procedure, three antimony
species (Sb(V), Sb(III) and organic-Sb (Org-Sb))were involved. For this reason, the optimization of
the parameters related to the chemical reactions
were monitored in all cases from 250 mg l�1
standard solutions of Sb(III) and Sb(V), and
from a sample solution (M2).
It is well established that the stibine is preferably
generated from Sb(III) [15]. However, the anti-
mony in glucantime is present as Org-Sb(V) [8]. Inpreliminary experiments, in absence of K2S2O8
and KI, a very little band was obtained, probably
due to the SbH3 generated from a free pentavalent
antimonial fraction present in the sample solution.
When the oxidizing reagent was added, the 1893
cm�1 band increased, possibly owed to an increase
in the Sb(V) concentration, product of the miner-
alization of the sample solution, followed by thegeneration of SbH3 from Sb(V). Lastly, in pre-
sence of the oxidizing and the pre-reducing agents,
the analytical band strongly increased, due the
quantitative conversion of Org-Sb(V) to Sb(III),
prior to the SbH3 generation reaction.
The FA�/HG�/FTIR method for determination
of antimony proposed in this work, was then
carried out in six steps: (i) oxidation/mineraliza-tion of the sample solution, (ii) pre-reduction of
the Sb(V) to Sb(III), (iii) generation of the gaseous
SbH3, (iv) transport of the gaseous phase to the
measurement cell, (v) acquisition of the FTIR
spectrum, and (vi) treatment of the spectral data.
Instrumental spectroscopic parameters, reagent
concentration and carrier gas flow rate wereoptimized using the univariate method, while other
experimental conditions such as reagent flow rates,
the transfer line length and the reaction coils
length, were previously fixed based on previous
experiences in our laboratory [28,29,33]. However,
before each optimization, the validity of the
previously selected parameters were checked. In
our system, under the reagent flow rates indicatedin Table 1, and by using the Varian GPS, it was
not possible the variation of the N2 stripping flow
rate (Fig. 1), which was fixed at 50 ml min�1.
The sample solutions were prepared in HCl 10%
(v/v), and the same medium was used as a carrier
in order to maintain similar acidic media in the
initialization of the system and during the analysis
(Section 2.4).
3.3. Effect of the instrumental parameters
The effect of the instrumental parameters such
as nominal resolution, number of scans and back-
ground conditions on the quality of the analytical
signal were evaluated using a solution of 250 mg
Sb l�1, unless otherwise stated.
Initially, the influence of the number of scansemployed to establish the background and to
obtain each spectrum was tested from 1 to 25
scans. Referring to the background definition, 5
scans are sufficient to establish a stable and clean
background. On the other hand, the accumulation
of scans in the proposed system does not have a
significant effect on the S/N ratio, probably due to
the very clean background obtained. These resultsare in good agreement with previously obtained
results in our laboratory in HG�/FTIR systems
[28]. Thus, 3 scans were selected for further
studies. Higher values does not improve the
quality of the analytical signal, and deteriorate
the sample throughput.
The nominal resolution (R ), significantly affects
the shape of the FTIR absorption bands. Table 2presents the effect of this parameter, varied from 2
to 32 cm�1, on the 1893 cm�1 absorption band.
An increase in this parameter causes the depres-
sion and the broadening of the analytical band.
This table includes the time required for the
acquisition of 3 scans, which greatly decreases
M. Gallignani et al. / Talanta 59 (2003) 923�/934 929
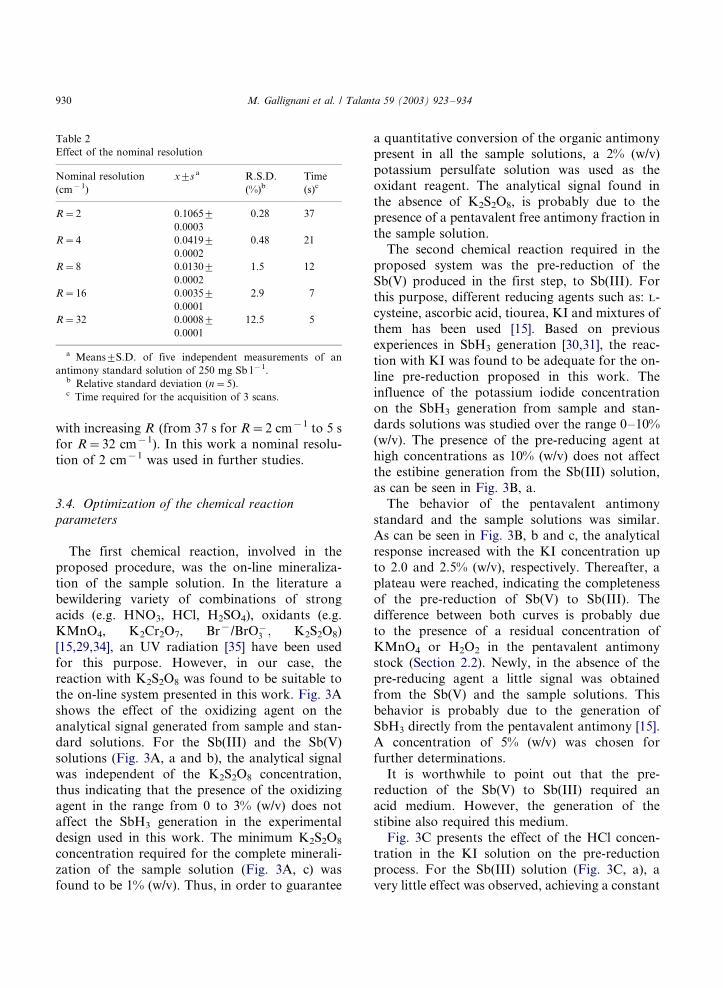
with increasing R (from 37 s for R�/2 cm�1 to 5 s
for R�/32 cm�1). In this work a nominal resolu-
tion of 2 cm�1 was used in further studies.
3.4. Optimization of the chemical reaction
parameters
The first chemical reaction, involved in the
proposed procedure, was the on-line mineraliza-
tion of the sample solution. In the literature a
bewildering variety of combinations of strong
acids (e.g. HNO3, HCl, H2SO4), oxidants (e.g.
KMnO4, K2Cr2O7, Br�/BrO/�3 ; K2S2O8)
[15,29,34], an UV radiation [35] have been used
for this purpose. However, in our case, thereaction with K2S2O8 was found to be suitable to
the on-line system presented in this work. Fig. 3A
shows the effect of the oxidizing agent on the
analytical signal generated from sample and stan-
dard solutions. For the Sb(III) and the Sb(V)
solutions (Fig. 3A, a and b), the analytical signal
was independent of the K2S2O8 concentration,
thus indicating that the presence of the oxidizingagent in the range from 0 to 3% (w/v) does not
affect the SbH3 generation in the experimental
design used in this work. The minimum K2S2O8
concentration required for the complete minerali-
zation of the sample solution (Fig. 3A, c) was
found to be 1% (w/v). Thus, in order to guarantee
a quantitative conversion of the organic antimonypresent in all the sample solutions, a 2% (w/v)
potassium persulfate solution was used as the
oxidant reagent. The analytical signal found in
the absence of K2S2O8, is probably due to the
presence of a pentavalent free antimony fraction in
the sample solution.
The second chemical reaction required in the
proposed system was the pre-reduction of theSb(V) produced in the first step, to Sb(III). For
this purpose, different reducing agents such as: L-
cysteine, ascorbic acid, tiourea, KI and mixtures of
them has been used [15]. Based on previous
experiences in SbH3 generation [30,31], the reac-
tion with KI was found to be adequate for the on-
line pre-reduction proposed in this work. The
influence of the potassium iodide concentrationon the SbH3 generation from sample and stan-
dards solutions was studied over the range 0�/10%
(w/v). The presence of the pre-reducing agent at
high concentrations as 10% (w/v) does not affect
the estibine generation from the Sb(III) solution,
as can be seen in Fig. 3B, a.
The behavior of the pentavalent antimony
standard and the sample solutions was similar.As can be seen in Fig. 3B, b and c, the analytical
response increased with the KI concentration up
to 2.0 and 2.5% (w/v), respectively. Thereafter, a
plateau were reached, indicating the completeness
of the pre-reduction of Sb(V) to Sb(III). The
difference between both curves is probably due
to the presence of a residual concentration of
KMnO4 or H2O2 in the pentavalent antimonystock (Section 2.2). Newly, in the absence of the
pre-reducing agent a little signal was obtained
from the Sb(V) and the sample solutions. This
behavior is probably due to the generation of
SbH3 directly from the pentavalent antimony [15].
A concentration of 5% (w/v) was chosen for
further determinations.
It is worthwhile to point out that the pre-reduction of the Sb(V) to Sb(III) required an
acid medium. However, the generation of the
stibine also required this medium.
Fig. 3C presents the effect of the HCl concen-
tration in the KI solution on the pre-reduction
process. For the Sb(III) solution (Fig. 3C, a), a
very little effect was observed, achieving a constant
Table 2
Effect of the nominal resolution
Nominal resolution
(cm�1)
x9/s a R.S.D.
(%)b
Time
(s)c
R�/2 0.10659/
0.0003
0.28 37
R�/4 0.04199/
0.0002
0.48 21
R�/8 0.01309/
0.0002
1.5 12
R�/16 0.00359/
0.0001
2.9 7
R�/32 0.00089/
0.0001
12.5 5
a Means9/S.D. of five independent measurements of an
antimony standard solution of 250 mg Sb l�1.b Relative standard deviation (n�/5).c Time required for the acquisition of 3 scans.
M. Gallignani et al. / Talanta 59 (2003) 923�/934930
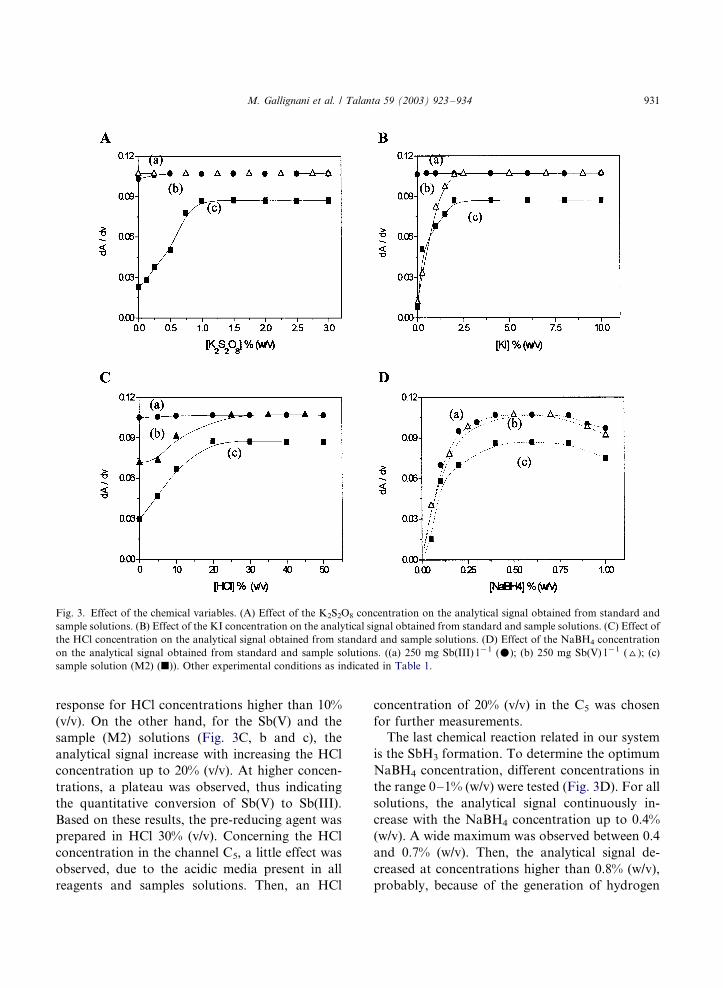
response for HCl concentrations higher than 10%
(v/v). On the other hand, for the Sb(V) and the
sample (M2) solutions (Fig. 3C, b and c), the
analytical signal increase with increasing the HCl
concentration up to 20% (v/v). At higher concen-
trations, a plateau was observed, thus indicating
the quantitative conversion of Sb(V) to Sb(III).
Based on these results, the pre-reducing agent was
prepared in HCl 30% (v/v). Concerning the HCl
concentration in the channel C5, a little effect was
observed, due to the acidic media present in all
reagents and samples solutions. Then, an HCl
concentration of 20% (v/v) in the C5 was chosen
for further measurements.
The last chemical reaction related in our system
is the SbH3 formation. To determine the optimum
NaBH4 concentration, different concentrations in
the range 0�/1% (w/v) were tested (Fig. 3D). For all
solutions, the analytical signal continuously in-
crease with the NaBH4 concentration up to 0.4%
(w/v). A wide maximum was observed between 0.4
and 0.7% (w/v). Then, the analytical signal de-
creased at concentrations higher than 0.8% (w/v),
probably, because of the generation of hydrogen
Fig. 3. Effect of the chemical variables. (A) Effect of the K2S2O8 concentration on the analytical signal obtained from standard and
sample solutions. (B) Effect of the KI concentration on the analytical signal obtained from standard and sample solutions. (C) Effect of
the HCl concentration on the analytical signal obtained from standard and sample solutions. (D) Effect of the NaBH4 concentration
on the analytical signal obtained from standard and sample solutions. ((a) 250 mg Sb(III) l�1 (m); (b) 250 mg Sb(V) l�1 (^); (c)
sample solution (M2) (j)). Other experimental conditions as indicated in Table 1.
M. Gallignani et al. / Talanta 59 (2003) 923�/934 931
and its transfer to the gas cell exceeds the rate offormation of the stibine considerably [32]. A
concentration of 0.5% (w/v) was then used for
further studies.
3.5. Effect of the N2 carrier flow rate
The carrier gas flow rate is a critical parameter
in vapor-phase FTIR spectrometric analysis,
which affects the volatility of the gaseous analytes
and controls the speed of vapor introduction into
the measurement cell [17,28]. Therefore, the effect
of this parameter from 25 to 200 ml min�1, on theanalytical signal of a 250 mg Sb l�1 solution, was
studied. The results obtained: 0.10809/0.0003,
0.07909/0.0002, 0.06119/0.0002, 0.02489/0.0004,
and 0.01369/0.0004 for R�/2, 4, 8, 16 and 32
cm�1, respectively, show that the increase of this
parameter decrease the analytical signal, due to a
hardly dilution effect. In the configuration used in
this work, the use of values lower than 25ml min�1 was not possible. Consequently, a N2
flow rate of 25 ml min�1 was chosen for all further
work. As had been mentioned before, the N2
stripping flow rate was fixed in 50 ml min�1.
3.6. Analytical figures of merit
Under the experimental conditions indicated in
Table 1, the analytical signals obtained in the
proposed system, increased linearly with increas-
ing the antimony concentration from 0 to 600
mg l�1. The equation which describes the simplecalibration line is jdA /dn j�/2�/10�59/0.000426
[Sb] with r�/0.99989, where jdA /dn j is the peak-
to-valley (1895�/1891 cm�1) measurement of the
first order derivative of the SbH3 absorption
spectrum at the 1893 cm�1 band, and [Sb] is
antimony concentration mentioned above.
The precision of the procedure was estimated by
measuring ten replicates of a sample dilution (M2,5:2000) and standard solutions of 250 and 25 mg
Sb(III) l�1 by the recommended procedure, under
the optimum conditions given in Table 1. The
corresponding R.S.D. were 0.3 (0.08509/0.0002),
0.28 (0.10659/0.0003) and 1.8% (0.01069/0.0002),
respectively.
The detection and quantification limits for Sb,defined as three and ten times the S.D. of the blank
(3s , 10s) were 0.9 and 3 mg Sb l�1, respectively;
while the sample frequency of the proposed
method was 28 h�1.
3.7. Interference effects
In order to study the possible matrix effect on
the antimony analytical signal, standard additiongraphs were prepared by adding various amounts
of Sb (from 0 to 250 mg l�1) to 20 and 50 ml of a
sample solution (M1), respectively, and diluting to
a final volume of 100 ml. The equations obtained
for the simple calibration and standard additions
were: jdA /dn j�/2�/10�59/0.000426 [Sb], jdA /
dn j�/0.04309/0.000425 [Sb] and jdA /dn j�/
0.08569/0.000430 [Sb], respectively. These curvesdid not show a significant difference in their slope
(P B/0.0005), which denoted by the link of any
physical or chemical interference matrix effects.
On the other hand, the antimony content obtained
from the standard addition calibration graphs
were 4009/3 and 3989/3 mg ampoule�1, respec-
tively; while the Sb content found from different
sample dilutions: M1, M1(50�/50) and M1(20�/
80), by means of the simple calibration graph were
3989/3, 4019/3 and 3999/4 mg ampoule�1, re-
spectively. Newly, this values did not show sig-
nificant differences and were nearly closed to the
value reported by the producer (405 mg) which
denoted the absence of any kind of interferences.
The accuracy of the proposed procedure was
initially evaluated by spiking two different sampledilutions of glucantime. For this purpose 20 and
50 ml of M1 solution of glucantime were fortified
with known amounts of antimony between 0 and
400 mg Sb l�1, and diluted to a final volume of
100 ml with HCl 10% (v/v). In all cases the
recoveries ranged between 98.2 and 102%, which
again demonstrates the general reliability of the
method. Furthermore, pharmaceutical sampleswere analyzed by the proposed method and by
AAS, and the obtained results show a good
agreement (Table 3). Similar results were obtained
in the standard addition and recovery experiences
carried out with the other samples under evalua-
tion.
M. Gallignani et al. / Talanta 59 (2003) 923�/934932

3.8. Analysis of real samples
Samples described in Section 2 were analyzed by
the proposed method, by using the simple calibra-
tion line. Samples of Glucantime , Pentostan and
Ulamine were diluted off-line 0.5:100, 0.25:100,
and 1:25, respectively, prior the analysis. On the
other hand, sodium and potassium antimonyl-
tartrate samples were previously diluted 1:5, whilethe 0.005% (p/v) solutions were directly analyzed.
The obtained results are summarized in Table 3,
and as can be seen the values found agree with
those reported by the producer, and with those
obtained by AAS, thus indicating that the pro-
posed FA�/HG�/FTIR determination of antimony
provides a fast means of control analysis of this
kind of pharmaceutical formulations.
4. Conclusions
In this work, a novel analytical method based on
the coupling of FA�/HG�/FTIR spectrometry was
developed for the determination of antimony. The
method has been applied to the determination ofthe analyte in pharmaceuticals. The on-line sys-
tem, which included the complete mineralization
and pre-reduction of the sample, prior to the SbH3
generation reaction, reduces sample handling and
makes possible the complete automation of the
antimony determination. On the other hand, the
use of 2% (w/v) K2S2O8 and 5% (w/v) KI solutions,
provide an appropriate medium for the completeoxidation/mineralization and sample pre-reduc-
tion, under soft experimental conditions.
The figures of merit of the proposed method
(limit of detection�/0.9 mg l�1, linear range: 5�/
600 mg l�1, and sample throughput (28
samples h�1) are adequate for the designed appli-
cation. Furthermore, precise and accurate results
were found in the analysis of antimony pharma-ceutical samples, indicating that the methodology
developed is appropriate to solve real analytical
problems. Moreover, it represents an alternative
methodology for the determination of antimony in
pharmaceuticals, which could be suitable for the
routine control analysis.
Table 3
Analysis of real samples
Samplea FA�/HG�/FTIRb Reported AASb
1a 0.4009/0.005
g ampoule�1
0.405
g ampoule�1
0.3989/
0.008
1b 0.3999/0.004
g ampoule�1
0.405
g ampoule�1
0.4029/
0.006
1c 0.3989/0.005
g ampoule�1
0.405
g ampoule�1
0.4039/
0.009
1d 0.3979/0.004
g ampoule�1
0.405
g ampoule�1
0.3959/
0.007
1e 0.3999/0.001
g ampoule�1
0.405
g ampoule�1
0.4009/
0.010
2a 0.4019/0.005
g ampoule�1
0.405
g ampoule�1
�/
2b 0.3969/0.003
g ampoule�1
0.405
g ampoule�1
�/
2c 0.3999/0.003
g ampoule�1
0.405
g ampoule�1
�/
2d 0.3989/0.002
g ampoule�1
0.405
g ampoule�1
�/
2e 0.3989/0.002
g ampoule�1
0.405
g ampoule�1
�/
3a 0.1389/0.001
g ampoule�1
0.135
g ampoule�1
0.1399/
0.005
3b 0.13509/0.0007
g ampoule�1
0.135
g ampoule�1
0.1339/
0.004
3c 0.13709/0.0008
g ampoule�1
0.135
g ampoule�1
0.1389/
0.005
4a 0.5959/0.003
g ampoule�1
0.600
g ampoule�1
0.6039/
0.009
4b 0.6019/0.004
g ampoule�1
0.600
g ampoule�1
0.6089/
0.012
4c 0.5969/0.005
g ampoule�1
0.600
g ampoule�1
0.5909/
0.009
5 10.59/0.01
mg aliquot�1
10.47
mg aliquot�1
�/
6 21.09/0.02
mg aliquot�1
20.94
mg aliquot�1
�/
7 9.109/0.03 mg ml�1 9.12 mg ml�1 �/
8 18.39/0.02 mg ml�1 18.24 mg ml�1 �/
a samples: 1a�/e, Glucantime (Aventis Pharma SA); 2a�/e,
Glucantime (Rhone-Poulenc Rorer); 3a�/c, Ulamine-I ; 4a�/c,
Pentostan ; 5, Sodium antimonyl tartrate-I: 0.5% (w/v) solution
(aliquots of 5 ml); 6, Sodium antimonyl tartrate-II: solution
0.005% (w/v); 7, Potassium antimonyl tartrate-I: 0.5% (w/v)
solution (aliquots of 5 ml); 8, Potassium antimonyl tartrate-II:
solution 0.005% (w/v). Results were obtained under the
experimental conditions specified in Table 1. More details of
sample preparation in Sections 2.4 and 3.8b Means9/S.D. of five measurements.
M. Gallignani et al. / Talanta 59 (2003) 923�/934 933
New studies are under way concerning thedetermination of antimony in other samples and
matrixes.
Acknowledgements
The authors acknowledge the financial support
from the Consejo de Desarrollo Cientıfico, Huma-nıstico y Tecnologico (CDCHT-ULA) of the
University of los Andes, the Consejo Nacional de
Investigaciones Cientıficas y Tecnologicas (CON-
ICIT, Project S1-2000000815) and the BID-CON-
ICIT (Project QF-46).
References
[1] E. Underwood, Trace Elements in Human and Animal
Health Nutrition, fourth ed., Academic Press, New York,
1977.
[2] J.R. Castillo, C. Martinez, P. Chamorro, J.M. Mits,
Mikrochim. Acta 3 (1986) 95.
[3] J.D. Berman, in: K.P. Chang, R.S. Bray (Eds.), Experi-
mental Chemotherapy of Leishmaniasis. A Critical Re-
view, Leishmaniasis, Elsevier, Amsterdam, 1985, p. 111.
[4] WHO, The Leishmaniasis. Report of the Word Health
Organization Expert Committee, WHO Tech. Rep. Ser.
701 (1984) 99.
[5] T.D. Luchey, V. Venugopal, Metal Toxicity in Mammals.
Physiologic and Chemical Basis for Metal Toxicity,
Plenum Press, New York, 1977.
[6] P.D. Marsden, P.D. Jones, in: C.P. Chang, R.S. Bray
(Eds.), Clinical Manifestations, Diagnosis and Treatment
of Leishmaniasis, Leishmaniasis, Elsevier, Amasterdan,
1985, p. 193.
[7] J.D. Berman, in: K.P. Chang, R.S. Bray (Eds.), Experi-
mental Chemotherapy of Leishmaniasis*/a Critical Re-
view, Leishmaniasis, Elsevier, Amsterdam, 1985.
[8] W. Peters, R. Killick-Kendrick, The Leishmaniasis in
Biology and Medicine. Clinical Aspects and Control,
Academic Press, London, 1987.
[9] S. Sato, S. Uchikawa, E. Iwamoto, Y. Yamamoto, Anal.
Lett. 16 (1983) 827.
[10] S. Sato, Talanta 32 (1985) 341.
[11] I.M. Kolthoff, P.J. Elving, E.B. Sandell, Treatise on
Analytical Chemistry, Part II, vol. 7, Wiley Interscience,
New York, 1961.
[12] J.D. Norris, T.S. West, Anal. Chim. Acta 71 (1974) 458.
[13] S. Constantini, R. Giordano, M. Rizzica, F. Benedetti,
Analyst 110 (1985) 1355.
[14] I. Iwamoto, Y. Inoike, Y. Yamamoto, Y. Yahashi,
Analyst 111 (1986) 295.
[15] J. Dedina, D.L. Tsalev, Chemical analysis, in: J.D. Wine-
rfordner (Ed.), Hydride Generation Atomic Absorption
Spectrometry, vol. 130, Wiley, Chichester, 1995.
[16] J.R. Ferraro, L.J. Basile (Eds.), Fourier Transform Infra-
red Spectroscopy. Application to Chemical Systems, Aca-
demic Press, New York, USA, 1978.
[17] E. Lopez-Anreus, S. Garrigues, M. de la Guardia, Anal.
Chim. Acta 308 (1995) 28.
[18] A. Perez-Ponce, S. Garrigues, J.M. Garrigues, M. de la
Guardia, Analyst 123 (1998) 1817.
[19] A. Perez-Ponce, S. Garrigues, M. de la Guardia, Analyst
121 (1996) 923.
[20] A. Perez-Ponce, S. Garrigues, M. de la Guardia, Anal.
Chim. Acta 336 (1996) 123.
[21] J.M. Garrigues, A. Perez-Ponce, S. Garrigues, M. de la
Guardia, Vibr. Spectrosc. 15 (1997) 219.
[22] A. Perez-Ponce, R.F. Rambla, J.M. Garrigues, S. Garri-
gues, M. de la Guardia, Analyst 123 (1998) 1253.
[23] A.R. Casella, R.C. de Campos, S. Garrigues, M. de la
Guardia, A. Rossi, Frezenius J. Anal. Chem. 367 (2000)
556.
[24] A. Perez-Ponce, S. Garrigues, M. de la Guardia, Anal.
Chim. Acta 358 (1998) 235.
[25] A. Perez-Ponce, S. Garrigues, M. de la Guardia, Vibr.
Spectrosc. 16 (1998) 61.
[26] E. Lopez-Anreus, S. Garrigues, M. de la Guardia, Anal.
Chim. Acta 333 (1996) 157.
[27] E. Lopez-Anreus, S. Garrigues, M. de la Guardia, Analyst
123 (1998) 1247.
[28] M. Gallignani, C. Ayala, M.R. Brunetto, J.L. Burguera,
M. Burguera, Analyst 27 (2002) 1705.
[29] M. Gallignani, H. Bahsas, M.R. Brunetto, J.L. Burguera,
M. Burguera, Y. Petit de Pena, Anal. Chim. Acta 369
(1998) 57.
[30] C. Rondon, J.L. Burguera, M. Burguera, M.R. Brunetto,
M. Gallignani, Y. Petit de Pena, Frezenius J. Anal. Chem.
353 (1995) 133.
[31] Y. Petit de Pena, M. Gallignani, M. Burguera, J.L.
Burguera, N. Anez, A. Lugo, J. Braz. Chem. Soc. 1
(1990) 72.
[32] M. Burguera, J.L. Burguera, C. Rivas, P. Carrero, M.R.
Brunetto, M. Gallignani, Anal. Chim. Acta 308 (1995) 339.
[33] M. Gallignani, M. Valero, M.R. Brunetto, J.L. Burguera,
M. Burguera, Y. Petit de Pena, Talanta 52 (2000) 1015.
[34] J.L. Burguera, M. Burguera, C. Rivas, Quımica Analıtica
16 (1997) 165.
[35] M. Goto, T. Shibakawa, T. Arita, D. Ishii, Anal. Chim.
Acta 140 (1982) 179.
M. Gallignani et al. / Talanta 59 (2003) 923�/934934
Copyright © 2022 FDOKUMEN