Mass Spectrometric Characterization of Proteins from the SARS Virus:a Preliminary Report
17
B American Society for Mass Spectrometry, 2011 DOI: 10.1007/s13361-010-0031-6 J. Am. Soc. Mass Spectrom. (2011) 22:440Y456 RESEARCH ARTICLE Mass Spectrometric Characterization of Protein Structure Details Refines the Proteome Signature for Invasive Ductal Breast Carcinoma Claudia Röwer, 1 Cornelia Koy, 1 Michael Hecker, 2 Toralf Reimer, 3 Bernd Gerber, 3 Hans-Jürgen Thiesen, 2 Michael O. Glocker 1 1 Proteome Center Rostock, Department for Proteome Research, Institute of Immunology, Medical Faculty and Natural Science Faculty, University of Rostock, Schillingallee 69, P.O. Box 100 888, Rostock 18055, Germany 2 Institute of Immunology, University of Rostock, and IndyMed GmbH, Rostock, Germany 3 Department of Obstetrics and Gynecology, University of Rostock, Rostock, Germany Abstract Early diagnosis as well as individualized therapies are necessary to reduce the mortality of breast cancer, and personalized patient care strategies rely on novel prognostic or predictive factors. In this study, with six breast cancer patients, 2D gel analysis was applied for studying protein expression differences in order to distinguish invasive ductal breast carcinoma, the most frequent breast tumor subtype, from control samples. In total, 1203 protein spots were assembled in a 2D reference gel. Differentially abundant spots were subjected to peptide mass fingerprinting for protein identification. Twenty proteins with their corresponding 38 differentially expressed 2D gel spots were contained in our previously reported proteome signature, suggesting that distinct protein forms were contributing. In-depth MS/MS measurements enabled analyses of protein structure details of selected proteins. In protein spots that significantly contributed to our signature, we found that glyceraldehyde-3-phosphate dehydro- genase was N-terminally truncated, pyruvate kinase M2 and nucleoside diphosphate kinase A but not other isoforms of these proteins were of importance, and nucleophosmin phosphorylation at serine residues 106 and 125 were clearly identified. Principle component analysis and hierarchical clustering with normalized quantitative data from the 38 spots resulted in accurate separation of tumor from control samples. Thus, separation of tissue samples as in our initial proteome signature could be confirmed even with a different proteome analysis platform. In addition, detailed protein structure investigations enabled refining our proteome signature for invasive ductal breast carcinoma, opening the way to structure-/function studies with respect to disease processes and/or therapeutic intervention. Key words: Mass spectrometry, Peptide mapping, Breast carcinoma, Proteome analysis, Protein expression signature, 2D gel electrophoresis, Western blot validation, Protein structure characterization Introduction A s more and more alternative treatments become available for breast carcinoma, there is a need to stratify patients reliably [1]. Novel cancer biomarkers Received: 10 September 2010 Revised: 30 October 2010 Accepted: 3 November 2010 Published online: 8 February 2011 Electronic supplementary material The online version of this article (doi:10.1007/s13361-010-0031-6) contains supplementary material, which is available to authorized users. Correspondence to: Michael O. Glocker; e-mail: michael.glocker@med. uni-rostock.de
-
Upload
independent -
Category
Documents
-
view
1 -
download
0
Transcript of Mass Spectrometric Characterization of Proteins from the SARS Virus:a Preliminary Report
B American Society for Mass Spectrometry, 2011DOI: 10.1007/s13361-010-0031-6J. Am. Soc. Mass Spectrom. (2011) 22:440Y456
RESEARCH ARTICLE
Mass Spectrometric Characterization of ProteinStructure Details Refines the ProteomeSignature for Invasive Ductal Breast Carcinoma
Claudia Röwer,1 Cornelia Koy,1 Michael Hecker,2 Toralf Reimer,3 Bernd Gerber,3
Hans-Jürgen Thiesen,2 Michael O. Glocker1
1Proteome Center Rostock, Department for Proteome Research, Institute of Immunology, Medical Faculty and NaturalScience Faculty, University of Rostock, Schillingallee 69, P.O. Box 100 888, Rostock 18055, Germany2Institute of Immunology, University of Rostock, and IndyMed GmbH, Rostock, Germany3Department of Obstetrics and Gynecology, University of Rostock, Rostock, Germany
AbstractEarly diagnosis as well as individualized therapies are necessary to reduce the mortality ofbreast cancer, and personalized patient care strategies rely on novel prognostic or predictivefactors. In this study, with six breast cancer patients, 2D gel analysis was applied for studyingprotein expression differences in order to distinguish invasive ductal breast carcinoma, the mostfrequent breast tumor subtype, from control samples. In total, 1203 protein spots wereassembled in a 2D reference gel. Differentially abundant spots were subjected to peptide massfingerprinting for protein identification. Twenty proteins with their corresponding 38 differentiallyexpressed 2D gel spots were contained in our previously reported proteome signature,suggesting that distinct protein forms were contributing. In-depth MS/MS measurementsenabled analyses of protein structure details of selected proteins. In protein spots thatsignificantly contributed to our signature, we found that glyceraldehyde-3-phosphate dehydro-genase was N-terminally truncated, pyruvate kinase M2 and nucleoside diphosphate kinase Abut not other isoforms of these proteins were of importance, and nucleophosmin phosphorylationat serine residues 106 and 125 were clearly identified. Principle component analysis andhierarchical clustering with normalized quantitative data from the 38 spots resulted in accurateseparation of tumor from control samples. Thus, separation of tissue samples as in our initialproteome signature could be confirmed even with a different proteome analysis platform. Inaddition, detailed protein structure investigations enabled refining our proteome signature forinvasive ductal breast carcinoma, opening the way to structure-/function studies with respect todisease processes and/or therapeutic intervention.
Key words: Mass spectrometry, Peptide mapping, Breast carcinoma, Proteome analysis,Protein expression signature, 2D gel electrophoresis, Western blot validation, Protein structurecharacterization
Introduction
As more and more alternative treatments becomeavailable for breast carcinoma, there is a need to
stratify patients reliably [1]. Novel cancer biomarkersReceived: 10 September 2010Revised: 30 October 2010Accepted: 3 November 2010Published online: 8 February 2011
Electronic supplementary material The online version of this article(doi:10.1007/s13361-010-0031-6) contains supplementary material, whichis available to authorized users.
Correspondence to: Michael O. Glocker; e-mail: [email protected]
promise to achieve early diagnosis of cancer subtypes,optimized personalized therapy for individual patients, andassessment of risk factors for recurrence of disease [2].Hereto, markers and/or signatures consisting of multiplemarkers are of need that not only show the molecularspecificities of the tumor subtype, i.e., its enzymatic make-up, but also (genetic) specificities of the individual patientwho is involuntarily hosting the tumor under treatment.
Protein markers for breast carcinoma have been amplysuggested [3–6], and several protein marker candidates havebeen named from proteome analyses [7–15]. Establishedbiomarkers, such as estrogen receptor and progesteronereceptor already play a significant role in the selection ofpatients for endocrine therapy. Human epidermal growthfactor receptor 2 (HER2) is recognized as a strong predictorof response to trastuzumab [16] whereas, more recently, therole of estrogen receptor and HER2 as negative and positiveindicators for chemotherapy has also been explored [17, 18].While tumor subtype-specific markers may suggest whichtarget(s) would be the best ones to tackle in order toeliminate the tumor most efficiently, the (genetic) hostsignature may give indications about individual potentialside effects that have to be considered during therapy.Concern towards the latter is given, e.g., in so-calledresponder/non-responder analyses [19, 20].
In recent publications, emphasis has been placed onsignatures [21–24] rather than single markers for diseasediagnostics [22], prognostics [25], and patient stratification[26, 27]. Signatures of markers have been assembled fromRNA expression profiles, e.g., the Oncotype DX assay [28,29] and the MammaPrint profile [30, 31], which arecurrently used in clinical trials. Recently, investigations withdifferential proteome analysis [26] and immunohistochem-istry [25] have suggested protein-based signatures with highpotential for clinical application.
The reliability of a “proteome signature” in generaldepends on (1) the “ease” with which this signature can bescreened in large(r) cohorts of patients, and (2) whether thesuggested protein expression differences can be observed byusing different technology platforms. When fulfilling theabove mentioned prerequisites, a breast carcinoma proteomesignature that is described in a multiparametric study oughtto be able to reliably differentiate two different tissue statesby predefined means in a robust manner [32, 33]. Butperhaps most importantly, in order to increase the accuracyof a proteome signature, one has to take into considerationthat proteins may be structurally modified upon disease-related insults. Hence, in order to investigate structuraldetails from proteins that are suggested to contribute to ourproteome signature, we analyzed protein spots in 2D gelsusing mass spectrometry.
Here we show that mass spectrometry enabled refining ourproteome signature by identifying distinct isoforms and/ortruncations of proteins as well as determining specificphosphorylation status of proteins that contribute to theproteome signature. We found that the refined proteome
signature [26] can be used as well with 2D gel baseddifferential proteome analysis of protein extracts from tumorand gland tissue. Multiparametric, quantitative monitoring ofprotein expression in breast carcinoma samples shows thateven a set of 20 defined protein entries is capable of separatingtumor samples from control tissue with high accuracy.
ExperimentalHuman Tissues and Samples
The study was approved by the Institutional Review Board.Tumor samples of invasive breast carcinoma and controlsamples, originating from the same breast, were taken fromsix postmenopausal women after modified radical mastec-tomy at the Women’s Hospital, Suedstadt Clinical Center,Rostock, Germany, after informed consent was given. Nopreoperative core biopsy was performed, and axillary lymphnode involvement was detected in three cases. Tumor sizeranged between 14 and 46 mm. All tumor samples had ahistologic grading of 2 or 3. All tumors were classified asinvasive ductal carcinoma (patients A–F); one also containeda tumor of lobular origin (patient E; see Table 1). Tissuepieces were immediately shock-frozen in liquid nitrogen andkept at –80 °C until further work-up.
Protein Extraction and Sample Preparation
Proteins from fresh frozen tissues were extracted asdescribed [34]. Briefly, frozen tissue samples were groundto powder with pestle and mortar and cooled in a liquidnitrogen bath. The powder was mixed with pre-frozen lysisbuffer containing 2 M thiourea, 7 M urea, 4% CHAPS,70 mM DTT, 0.5% Servalyte 3-10 (Serva, Heidelberg,Germany), Complete with EDTA (Roche Diagnostics,Mannheim, Germany) as Protease Inhibitor Cocktail,PMSF/Pepstatin A (Sigma, Munich, Germany), and Phos-phatase Inhibitor Cocktail 1 and 2 (Sigma). Pellet suspen-sions were homogenized with glass beads, sonicated, andstirred six times on ice before centrifugation for 20 min at4 °C and 13,000 rpm. Supernatants were aliquoted andstored at –80 °C for further use. Protein concentration wasdetermined using the Bio-Rad Protein Assay (Bio-Rad,Munich, Germany) [35, 36].
Two-dimensional Gel Electrophoresis and GelImage Analysis
From each sample, two gels were generated. Two-dimen-sional gel electrophoresis was carried out as described [37].In short, 400 μg of protein dissolved in lysis buffer wasmixed at least with 2-fold excess of rehydration buffer (8 Murea, 2% CHAPS, 16 mM DTT, 0.5% IPG buffer (pH 3–10),Complete with EDTA for protease inhibition, PMSF/Pepstatin A, and bromophenol blue) to obtain a final samplevolume of 350 μL, which was loaded onto one strip. The
C. Röwer, et al.: Proteome Signature for Breast Carcinoma 441
first dimension (IEF) was operated on Immobiline Dry strips(pH 3–10, NL) in an IPGphor system (GE Healthcare/Amersham Biosciences, Freiburg, Germany). Before thesecond dimension, strips were first exposed for 15 min in5 mL equilibration buffer (50 mM TRIS HCl, pH 8.8, 6 Murea, 30% glycerol, 2% SDS, bromophenol blue) containing1% (wt/vol) DTT for reduction of disulfide bonds. Sub-sequently, alkylation of free sulfhydryl groups was per-formed for 15 min in equilibration buffer, which wassupplemented with 4% (wt/vol) IAA. For the seconddimension, SDS polyacrylamide gels (12%T) were run for18 h at 100 V in a Hoefer DALT Vertical ElectrophoresisSystem (GE Healthcare/Amersham Biosciences, Freiburg,Germany) applying the Laemmli continuous buffer system[38]. Gels were fixed and stained with colloidal Coomassiebrilliant blue G-250 [39, 40]. Stained gels were scanned withthe Umax Mirage II Scanner (Umax Data Systems, Willich,Germany). Progenesis PG200, ver. 2006 (Nonlinear Dynam-ics Ltd., Newcastle upon Tyne, UK) was used for imageanalysis and matching. After spot detection and matching,the spot volume distributions in each gel were examined.Gels were considered to be of good quality when a Gaussiandistribution was obtained. Only such gels that matched theGaussian spot volume distribution criteria were used fordifferential analysis. Inclusion criteria for differential 2D gelanalysis were set using expression data (spot volumes) andthe number of matched spots from the patients A–C. First,those spots were included that fulfilled the two criteria: (1) atleast 2-fold differentially expressed between tumor (T) andgland (G), and (2) at least three technical replicates (matchedspots) in one of the groups. Second, in the case that a spotdid not fulfill the above mentioned criteria of being at least2-fold differentially expressed, we subtracted the number oftechnical replicates (matched spots) of one group from theother, and a spot was included when the difference of thenumber of matched spots between both groups was at leastthree.
Mass Spectrometric Peptide Fingerprinting
Protein spots of interest were excised automatically using theFlexys Proteomics Picker (Genomic Solutions, Ann Arbor,MI, USA). Excised gel plugs were subjected to in-geldigestion with trypsin (Promega) [41]. Sample preparation ofpeptide mixture was performed on an AnchorChip 600/384target plate [42] using α-cyano-4-hydroxy cinnamic acid(CHCA) as matrix. Peptide mixtures were analyzed with aReflex III MALDI TOF mass spectrometer (Bruker Dalto-nik, Bremen, Germany) equipped with the SCOUT sourceand delayed extraction and operated in positive ion modeusing an acceleration voltage of 20 kV [43]. Spectra wereexternally calibrated using a commercially available PeptideCalibration Standard (Bruker Daltonik), as well as internallyrecalibrated using the following peptide ion signals derivedfrom trypsin autoproteolysis: [M+H]+ 842.51, [M+H]+
1045.54, [M+H]+ 2211.10, [M+H]+ 2807.39. Mass spectrawere further processed and analyzed with the FlexAnalysis2.4 and BioTools 3.0 software. A peak list of singly chargedpeptide ion signals was generated by manual labelingwithout previous smoothing. Database searches were per-formed against an in-house SWALL database (92,353entries, UniProt release 13.6 that consists of Swiss-Protrelease 55.6 and TrEMBL release 38.6) using the Mascotsoftware ver. 2.2.03 (Matrix Science, London, UK) with thefollowing search parameters: taxonomy: homo sapiens,peptide tolerance: 80 ppm, fixed modifications: carbamido-methylation of cysteines, variable modifications: oxidationof methionines, 1 missed cleavage. Signals from trypsinautoproteolysis and matrix as well as tryptic peptides ofcommon keratins were excluded from the search.
Phosphopeptide Enrichment
Phosphorylated peptides were enriched using publishedprotocols [44] with slight modifications [45]. In short,
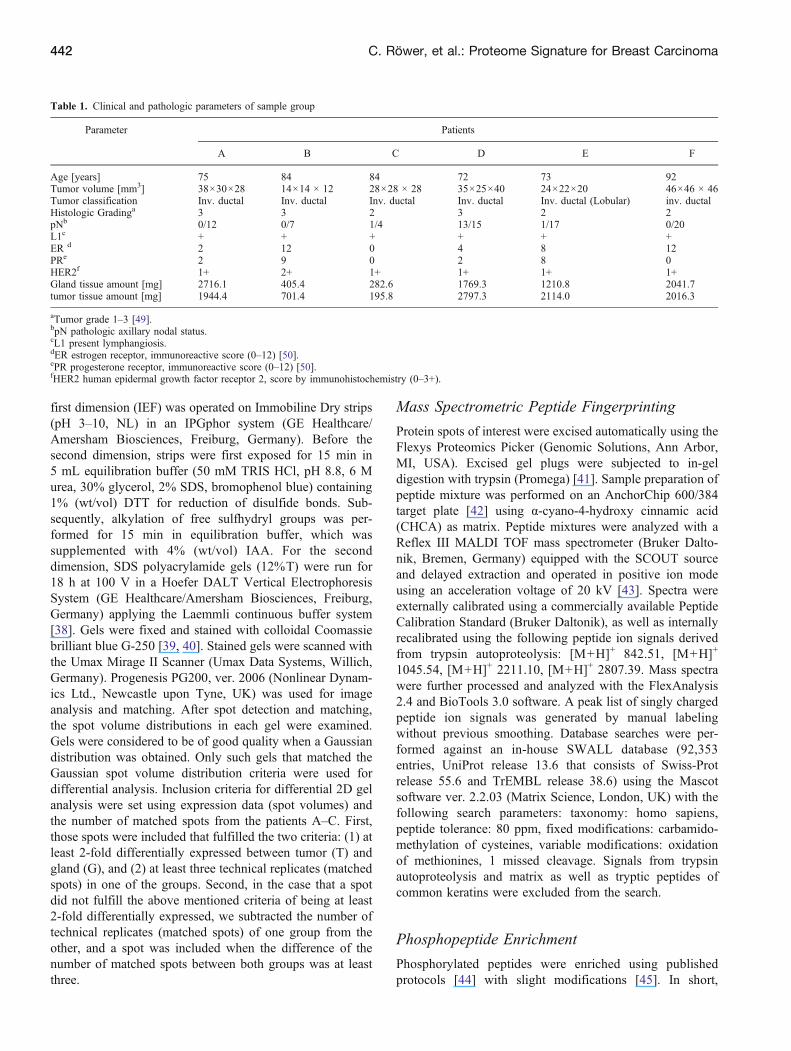
Table 1. Clinical and pathologic parameters of sample group
Parameter Patients
A B C D E F
Age [years] 75 84 84 72 73 92Tumor volume [mm3] 38×30×28 14×14 × 12 28×28 × 28 35×25×40 24×22×20 46×46 × 46Tumor classification Inv. ductal Inv. ductal Inv. ductal Inv. ductal Inv. ductal (Lobular) inv. ductalHistologic Gradinga 3 3 2 3 2 2pNb 0/12 0/7 1/4 13/15 1/17 0/20L1c + + + + + +ER d 2 12 0 4 8 12PRe 2 9 0 2 8 0HER2f 1+ 2+ 1+ 1+ 1+ 1+Gland tissue amount [mg] 2716.1 405.4 282.6 1769.3 1210.8 2041.7tumor tissue amount [mg] 1944.4 701.4 195.8 2797.3 2114.0 2016.3
aTumor grade 1–3 [49].bpN pathologic axillary nodal status.cL1 present lymphangiosis.dER estrogen receptor, immunoreactive score (0–12) [50].ePR progesterone receptor, immunoreactive score (0–12) [50].fHER2 human epidermal growth factor receptor 2, score by immunohistochemistry (0–3+).
442 C. Röwer, et al.: Proteome Signature for Breast Carcinoma
porous titanium dioxide immobilized to the inner surface ofpipette tips (NuTip; Glygen, Columbia, MD, USA) wasconditioned five times with 40% ACN, 0.1% TFA. Five μLof peptide mixture were mixed with 2.5 μL of 60 mg/mL2,5-dihydroxy benzoic acid (DHB) in 80% ACN, 0.1%TFA, and loaded onto the titanium dioxide material by 50times aspiration/dispension. Then, the column was washedonce with 10 μL of 20 mg/mL DHB in 40% ACN, 0.1%TFA and once with 10 μL of 40% ACN, 0.1% TFA. Boundpeptides were eluted in 3 μL of 0.25% NH4OH by 20 timesaspiration and dispension.
Mass Spectrometric Peptide Sequencing
For mass spectrometric peptide sequencing 0.5 μL of thepeptide mixture were prepared on an AnchorChip 600/384target plate using 2.0 μL of DHB as matrix [5 mg/mL DHBin ACN/0.1% TFA in water (33/67 vol/vol)]. MS/MSspectra were acquired on an Axima MALDI QIT TOF massspectrometer (Shimadzu Biotech, Manchester, UK) inpositive ion mode utilizing a 337 nm nitrogen laser, and a3D quadrupole ion trap supplied by a pulsed helium flow forcooling and argon gas to cause collisionally induceddissociation [46]. Spectra were externally calibrated with amanually mixed peptide standard consisting of bradykinin(1-7), [M+H]+ 757.39; angiotensin II, [M+H]+ 1046.53;angiotensin I, [M+H]+ 1296.68; bombesin, [M+H]+
1619.81; N-acetyl renin substrate, [M+H]+ 1800.93; ACTH(1-17), [M+H]+ 2093.08; ACTH (18-39), [M+H]+ 2465.19;somatostatin, [M+H]+ 3147.46; insulin (oxidized β chain),[M+H]+ 3494.64. About 1000 profiles were summed andfurther processing and analysis of the MS/MS spectra wasperformed with the Launchpad software, ver. 2.8.4 (Shi-madzu Biotech).
Western Blot Analysis
Western blotting was performed as previously described[26]. Here, 35 μg of protein in lysis buffer was loadedonto a NuPAGE Novex 12% Bis-Tris Gel (Invitrogen,Carlsbad, CA, USA) and separated by SDS-PAGE.Subsequent to electrophoretic separation of proteins theywere blotted onto a PVDF-membrane (Immobilon; Milli-pore, Schwalbach, Germany) by semi-dry blotting. Blot-ting took place with 1.2 mA per cm2 gel for about 1.5 h.After blocking (TBS, 5% non-fat dry milk powder, 1%BSA, 0.02% thimerosal) for 2 h at room temperature,blotted proteins were probed with monoclonal mouseantibodies against nucleoside diphosphate kinase A(1:100; AbD Serotec, Duesseldorf, Germany), pyruvatekinase isozyme M2 (1:1000; ScheBo Biotech AG,Giessen, Germany), glyceraldehyde 3-phosphate dehydro-genase (1:5000; Abcam, Cambridge, MA, USA), and β-actin (1:4000; Sigma-Aldrich, Munich, Germany) for 15 hat 4 °C, respectively. Washing (TBS, 0.05% Tween 20,0.1% BSA, 0.02% thimerosal) was followed by second
antibody reaction (biotin-SP-conjugated goat anti mouseIgG+IgM (1:20,000; Jackson ImmunoResearch Laborato-ries, Inc., West Grove, PA, USA), for 1 h at roomtemperature. Another washing step and reaction withstreptavidin peroxidase (1:10,000; Jackson ImmunoRe-search Laboratories Inc./Dianova) for 1 h at room temper-ature was carried out. Detection was performed using theSuperSignal West Pico Chemiluminescent Substrate(Thermo Fisher Scientific/Pierce).
Bioinformatic Analysis
Unsupervised principle components analysis (PCA) [47] wasperformed with Matlab ver. 7.3.0 (R2006b), The Math-Works, Inc., Natick, MA, USA, as previously described[26]. Briefly, the log2-transformed normalized values wereused after setting missing values to the smallest detectedconcentration in these cases when a protein was notidentified in the sample. The first two PCs were selected toproject the data into a subspace useful for visualization.Graphical representation was realized using the Originsoftware (ver. 6.1; OriginLab Corporation). Normalizedvalues of selected spots are graphically represented in heatmaps. Hierarchical clustering was performed based on thecomplete linkage method and Spearman's correlation coef-ficient as a measure of similarity. Signal intensities werecentered and scaled row-wise for visualization purposes[48].
ResultsPatients and Samples
Tissue samples from healthy breast (gland) and tumor werecollected from six patients with breast cancer upon fullremoval of the gland. Histologic tumor grade was deter-mined using an established scoring system (Table 1) [49].Patients A–F were diagnosed with invasive ductal carci-noma. Patient E suffered from lobular carcinoma simulta-neously. Patient C showed involved axillary lymph nodeswith an underlying triple-negative tumor [50]. Axillarylymph node involvement was detected also in patients Dand E. Perioperative diagnostic procedures ruled out distantmetastatic disease for all patients.
As tumors were of different sizes at time point ofsurgery, we decided to cut the tissue samples intoapproximately 10 mm3 pieces after pathologic evaluation.Such tissue pieces from tumor and control samples werethen subjected to protein extract preparation using stand-ardized procedures.
Global Proteome Analysis Resultsand Confirmation by Western Blotting
Two dimensional gel analysis of the protein extracts ofpatient samples A–C, the same patient samples that were
C. Röwer, et al.: Proteome Signature for Breast Carcinoma 443
subjected to LC-MSE experiments previously [26], led tothe assignment of 1203 well-reproducing spots in dupli-cate gels per sample (total number of gels was 12). Thesespots were assembled in a reference gel (SupplementalFigure 1, which can be found in the electronic version ofthis article). Next, spots were selected for peptide massfingerprint analysis such that differentially expressed spots(reproducibly differential in at least two patient samplepairs) as well as so-called landmark spots were included.These analyses mounted to 208 non-redundant proteinidentifications which were present in 348 spots (Supple-mental Figure 1, Supplemental Table 1). In selected cases,mass spectrometric partial amino acid sequence analysiswas performed as well (see below).
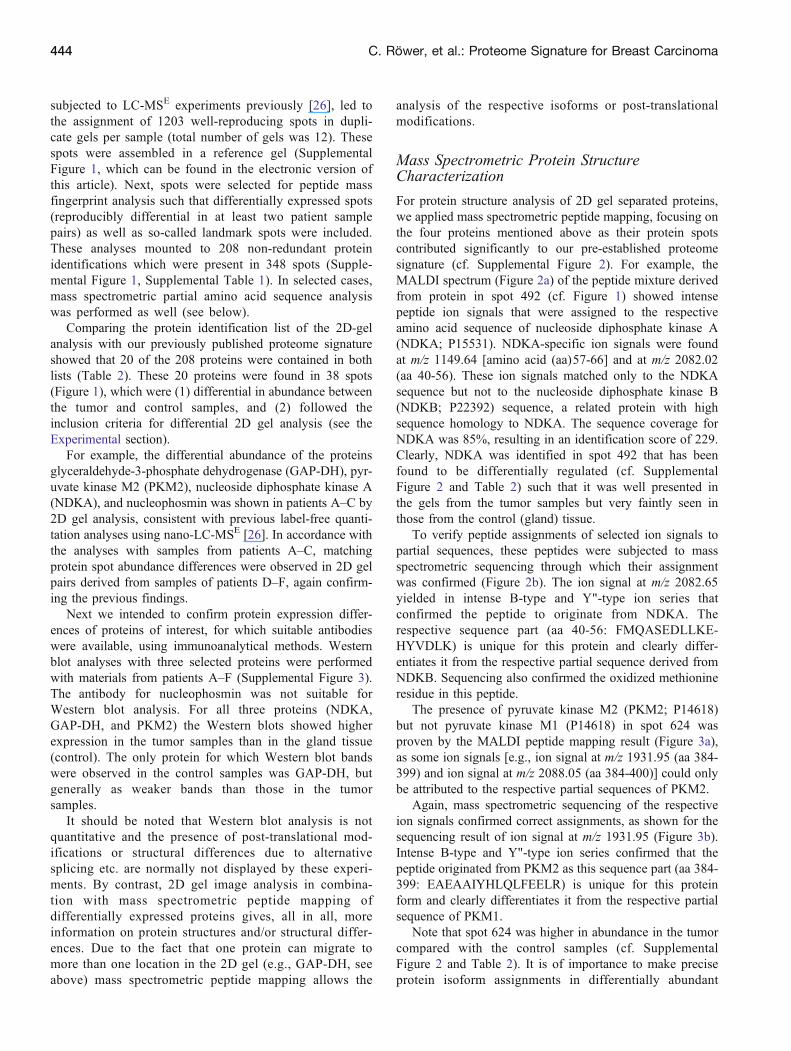
Comparing the protein identification list of the 2D-gelanalysis with our previously published proteome signatureshowed that 20 of the 208 proteins were contained in bothlists (Table 2). These 20 proteins were found in 38 spots(Figure 1), which were (1) differential in abundance betweenthe tumor and control samples, and (2) followed theinclusion criteria for differential 2D gel analysis (see theExperimental section).
For example, the differential abundance of the proteinsglyceraldehyde-3-phosphate dehydrogenase (GAP-DH), pyr-uvate kinase M2 (PKM2), nucleoside diphosphate kinase A(NDKA), and nucleophosmin was shown in patients A–C by2D gel analysis, consistent with previous label-free quanti-tation analyses using nano-LC-MSE [26]. In accordance withthe analyses with samples from patients A–C, matchingprotein spot abundance differences were observed in 2D gelpairs derived from samples of patients D–F, again confirm-ing the previous findings.
Next we intended to confirm protein expression differ-ences of proteins of interest, for which suitable antibodieswere available, using immunoanalytical methods. Westernblot analyses with three selected proteins were performedwith materials from patients A–F (Supplemental Figure 3).The antibody for nucleophosmin was not suitable forWestern blot analysis. For all three proteins (NDKA,GAP-DH, and PKM2) the Western blots showed higherexpression in the tumor samples than in the gland tissue(control). The only protein for which Western blot bandswere observed in the control samples was GAP-DH, butgenerally as weaker bands than those in the tumorsamples.
It should be noted that Western blot analysis is notquantitative and the presence of post-translational mod-ifications or structural differences due to alternativesplicing etc. are normally not displayed by these experi-ments. By contrast, 2D gel image analysis in combina-tion with mass spectrometric peptide mapping ofdifferentially expressed proteins gives, all in all, moreinformation on protein structures and/or structural differ-ences. Due to the fact that one protein can migrate tomore than one location in the 2D gel (e.g., GAP-DH, seeabove) mass spectrometric peptide mapping allows the
analysis of the respective isoforms or post-translationalmodifications.
Mass Spectrometric Protein StructureCharacterization
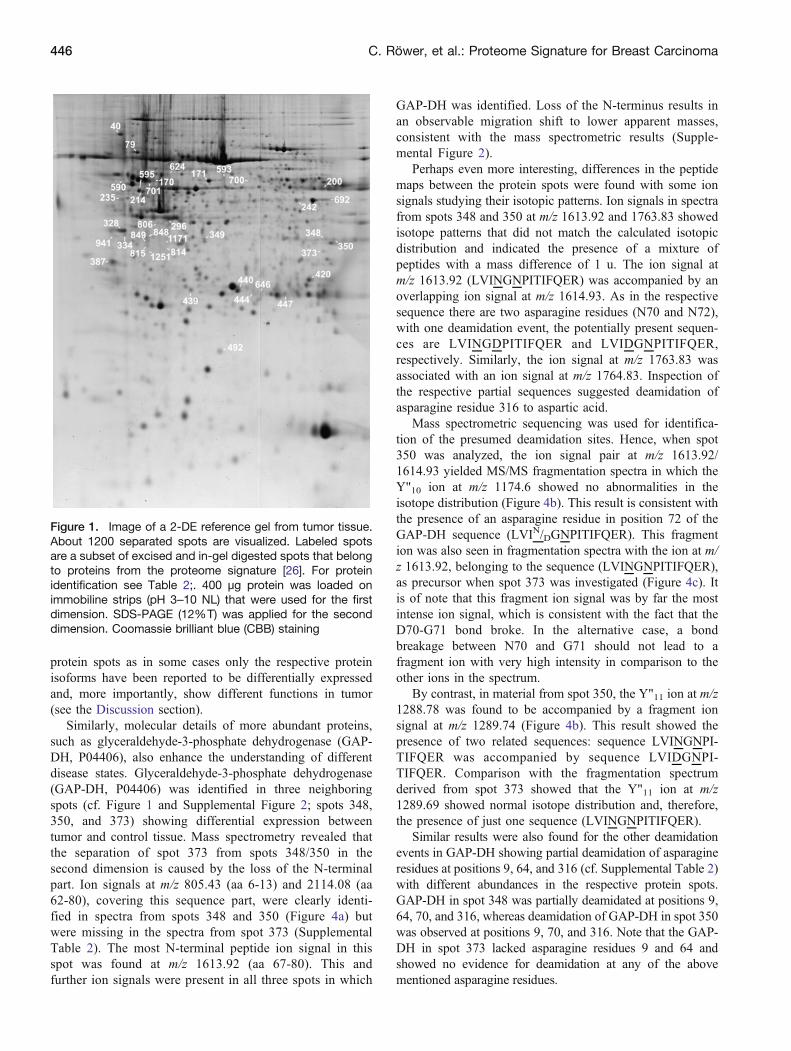
For protein structure analysis of 2D gel separated proteins,we applied mass spectrometric peptide mapping, focusing onthe four proteins mentioned above as their protein spotscontributed significantly to our pre-established proteomesignature (cf. Supplemental Figure 2). For example, theMALDI spectrum (Figure 2a) of the peptide mixture derivedfrom protein in spot 492 (cf. Figure 1) showed intensepeptide ion signals that were assigned to the respectiveamino acid sequence of nucleoside diphosphate kinase A(NDKA; P15531). NDKA-specific ion signals were foundat m/z 1149.64 [amino acid (aa)57-66] and at m/z 2082.02(aa 40-56). These ion signals matched only to the NDKAsequence but not to the nucleoside diphosphate kinase B(NDKB; P22392) sequence, a related protein with highsequence homology to NDKA. The sequence coverage forNDKA was 85%, resulting in an identification score of 229.Clearly, NDKA was identified in spot 492 that has beenfound to be differentially regulated (cf. SupplementalFigure 2 and Table 2) such that it was well presented inthe gels from the tumor samples but very faintly seen inthose from the control (gland) tissue.
To verify peptide assignments of selected ion signals topartial sequences, these peptides were subjected to massspectrometric sequencing through which their assignmentwas confirmed (Figure 2b). The ion signal at m/z 2082.65yielded in intense B-type and Y"-type ion series thatconfirmed the peptide to originate from NDKA. Therespective sequence part (aa 40-56: FMQASEDLLKE-HYVDLK) is unique for this protein and clearly differ-entiates it from the respective partial sequence derived fromNDKB. Sequencing also confirmed the oxidized methionineresidue in this peptide.
The presence of pyruvate kinase M2 (PKM2; P14618)but not pyruvate kinase M1 (P14618) in spot 624 wasproven by the MALDI peptide mapping result (Figure 3a),as some ion signals [e.g., ion signal at m/z 1931.95 (aa 384-399) and ion signal at m/z 2088.05 (aa 384-400)] could onlybe attributed to the respective partial sequences of PKM2.
Again, mass spectrometric sequencing of the respectiveion signals confirmed correct assignments, as shown for thesequencing result of ion signal at m/z 1931.95 (Figure 3b).Intense B-type and Y"-type ion series confirmed that thepeptide originated from PKM2 as this sequence part (aa 384-399: EAEAAIYHLQLFEELR) is unique for this proteinform and clearly differentiates it from the respective partialsequence of PKM1.
Note that spot 624 was higher in abundance in the tumorcompared with the control samples (cf. SupplementalFigure 2 and Table 2). It is of importance to make preciseprotein isoform assignments in differentially abundant
444 C. Röwer, et al.: Proteome Signature for Breast Carcinoma

Tab
le2.
Protein
identificationresults
ofdifferentially
abundant
spotsbelongingto
proteins
from
thepredefined
proteomesignature
Spo
tno
.aProtein
name
pIMass[D
a]Acc.no.
Swiss-ProtID
score
Sequencecov.
[%]
Match/search
sig.
RMS
Foldchange
b
40Endoplasm
in4.76
92696
P14625
ENPL_H
UMAN
195
2924/38
252.7up
inT
7978
kDaglucose-regu
latedprotein
5.07
7240
2P1102
1GRP78
_HUMAN
325
4228
/38
293.7up
inT
170
Tubulin
α-1A
chain
4.94
5078
8Q71
U36
TBA1A
_HUMAN
106
3511
/35
382.4do
wnin
T171
Protein
disulfide-isom
eraseA3
5.98
57146
P30101
PDIA
3_HUMAN
289
5026/38
143.4up
inT
200
ATPsynthase
subunitα,
mito
chondrial
9.16
5982
8P2570
5ATPA_H
UMAN
6519
7/17
172.0do
wnin
T21
4ATPsynthase
subunitβ,
mito
chondrial
5.26
5652
5P0657
6ATPB_H
UMAN
118
3012
/21
219.7up
inT
235
Vim
entin
5.06
5367
6P0867
0VIM
E_H
UMAN
191
3915
/19
453.7up
inT
242
α-Eenolase
7.01
4748
1P0673
3ENOA_H
UMAN
182
4616
/23
215.1up
inT
296
Keratin,type
Icytoskeletal
195.04
4406
5P0872
7K1C
19_H
UMAN
215
5824
/45
231.9up
inT
328
Nucleop
hosm
in4.64
3272
6P0674
8NPM_H
UMAN
101
247/14
2621
.8up
inT
334
Nucleop
hosm
in4.64
3272
6P0674
8NPM_H
UMAN
8725
8/16
338.6up
inT
348
Glyceraldehyd
e-3-ph
osphatedehydrog
enase
8.57
3620
1P0440
6G3P
_HUMAN
6422
5/15
22on
lyin
T34
9L-lactate
dehy
drog
enaseBchain
5.71
3690
0P0719
5LDHB_H
UMAN
6724
8/30
299.2up
inT
350
Glyceraldehyd
e-3-ph
osphatedehydrog
enase
8.57
3620
1P0440
6G3P
_HUMAN
9731
9/19
31on
lyin
T37
3Glyceraldehyd
e-3-ph
osphatedehydrog
enase
8.57
3620
1P0440
6G3P
_HUMAN
182
4614
/22
16on
lyin
T38
7Tropomyo
sinα-4chain
4.67
2848
7P6793
6TPM4_
HUMAN
8624
8/23
384.3up
inT
420
Carbo
nicanhydrase1
6.59
2890
9P0091
5CAH1_HUMAN
138
539/13
2124
.8do
wnin
T43
9Heat-shockproteinβ-1
5.98
2282
6P0479
2HSPB1_
HUMAN
112
387/12
265.7up
inT
440
Heat-shockproteinβ-1
5.98
2282
6P0479
2HSPB1_
HUMAN
148
4210
/20
192.7up
inT
444
Triosepho
sphate
isom
erase
6.45
2693
8P6017
4TPIS_H
UMAN
136
469/16
401.7up
inT
447
Triosepho
sphate
isom
erase
6.45
2693
8P6017
4TPIS_H
UMAN
6625
5/14
29on
lyin
T49
2Nucleosidediph
osph
atekinase
A5.83
1730
9P1553
1NDKA_H
UMAN
229
8517
/21
26on
lyin
T59
0Vim
entin
5.06
5354
5P0867
0VIM
E_H
UMAN
157
3615
/26
28on
lyin
T593
Protein
disulfide-isom
eraseA3
5.98
57146
P30101
PDIA
3_HUMAN
133
2611/14
23only
inT
595
Tubulin
βchain
4.78
5009
5P0743
7TBB5_
HUMAN
9825
13/49
19on
lyin
T62
4Pyruv
atekinase
isozym
eM2
7.96
5847
0P1461
8KPYM_H
UMAN
9923
10/20
221.2up
inT
646
Triosepho
sphate
isom
erase
6.45
2693
8P6017
4TPIS_H
UMAN
129
478/13
30on
lyin
T69
2α-Eno
lase
7.01
4748
1P0673
3ENOA_H
UMAN
114
239/11
508.0up
inT
700
Vim
entin
5.06
5367
6P0867
0VIM
E_H
UMAN
163
3715
/28
33on
lyin
T70
1Vim
entin
5.06
5367
6P0867
0VIM
E_H
UMAN
276
5629
/47
382.0do
wnin
T806
Mim
ecan
(osteoinductivefactor)
5.46
34243
P20774
MIM
E_H
UMAN
6730
5/16
31only
inT
814
Mim
ecan
(osteoinductivefactor)
5.46
34243
P20774
MIM
E_H
UMAN
163
2810/17
2936.4
downin
T815
Mim
ecan
(osteoinductivefactor)
5.46
34243
P20774
MIM
E_H
UMAN
151
3410/15
3334.0
downin
T848
Mim
ecan
(osteoinductivefactor)
5.46
34243
P20774
MIM
E_H
UMAN
153
359/14
164.3downin
T849
Mim
ecan
(osteoinductivefactor)
5.46
34243
P20774
MIM
E_H
UMAN
7714
5/7
305.9downin
T94
1Tropomyo
sinα-4chain
4.67
2861
9P6793
6TPM4_
HUMAN
125
3210
/21
23on
lyin
T1171
Mim
ecan
(osteoinductivefactor)
5.46
34243
P20774
MIM
E_H
UMAN
205
3711/14
34only
inG
1251
Mim
ecan
(osteoinductivefactor)
5.46
34243
P20774
MIM
E_H
UMAN
177
3710/15
30only
inG
a Spotnumbers
asin
2Dreferencegel(see
Figure1).
bCalculatedwith
norm
alized
spot
volumes
ofpatientsA–C
.
C. Röwer, et al.: Proteome Signature for Breast Carcinoma 445
protein spots as in some cases only the respective proteinisoforms have been reported to be differentially expressedand, more importantly, show different functions in tumor(see the Discussion section).
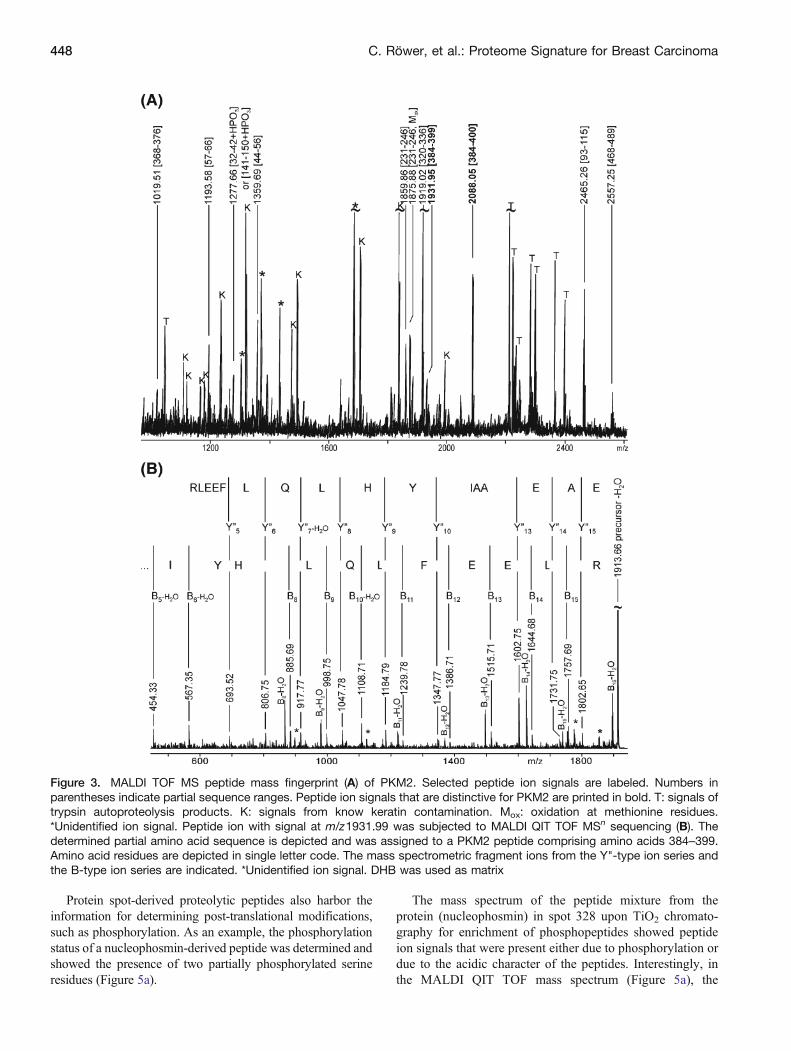
Similarly, molecular details of more abundant proteins,such as glyceraldehyde-3-phosphate dehydrogenase (GAP-DH, P04406), also enhance the understanding of differentdisease states. Glyceraldehyde-3-phosphate dehydrogenase(GAP-DH, P04406) was identified in three neighboringspots (cf. Figure 1 and Supplemental Figure 2; spots 348,350, and 373) showing differential expression betweentumor and control tissue. Mass spectrometry revealed thatthe separation of spot 373 from spots 348/350 in thesecond dimension is caused by the loss of the N-terminalpart. Ion signals at m/z 805.43 (aa 6-13) and 2114.08 (aa62-80), covering this sequence part, were clearly identi-fied in spectra from spots 348 and 350 (Figure 4a) butwere missing in the spectra from spot 373 (SupplementalTable 2). The most N-terminal peptide ion signal in thisspot was found at m/z 1613.92 (aa 67-80). This andfurther ion signals were present in all three spots in which
GAP-DH was identified. Loss of the N-terminus results inan observable migration shift to lower apparent masses,consistent with the mass spectrometric results (Supple-mental Figure 2).
Perhaps even more interesting, differences in the peptidemaps between the protein spots were found with some ionsignals studying their isotopic patterns. Ion signals in spectrafrom spots 348 and 350 at m/z 1613.92 and 1763.83 showedisotope patterns that did not match the calculated isotopicdistribution and indicated the presence of a mixture ofpeptides with a mass difference of 1 u. The ion signal atm/z 1613.92 (LVINGNPITIFQER) was accompanied by anoverlapping ion signal at m/z 1614.93. As in the respectivesequence there are two asparagine residues (N70 and N72),with one deamidation event, the potentially present sequen-ces are LVINGDPITIFQER and LVIDGNPITIFQER,respectively. Similarly, the ion signal at m/z 1763.83 wasassociated with an ion signal at m/z 1764.83. Inspection ofthe respective partial sequences suggested deamidation ofasparagine residue 316 to aspartic acid.
Mass spectrometric sequencing was used for identifica-tion of the presumed deamidation sites. Hence, when spot350 was analyzed, the ion signal pair at m/z 1613.92/1614.93 yielded MS/MS fragmentation spectra in which theY"10 ion at m/z 1174.6 showed no abnormalities in theisotope distribution (Figure 4b). This result is consistent withthe presence of an asparagine residue in position 72 of theGAP-DH sequence (LVIN/DGNPITIFQER). This fragmention was also seen in fragmentation spectra with the ion at m/z 1613.92, belonging to the sequence (LVINGNPITIFQER),as precursor when spot 373 was investigated (Figure 4c). Itis of note that this fragment ion signal was by far the mostintense ion signal, which is consistent with the fact that theD70-G71 bond broke. In the alternative case, a bondbreakage between N70 and G71 should not lead to afragment ion with very high intensity in comparison to theother ions in the spectrum.
By contrast, in material from spot 350, the Y"11 ion at m/z1288.78 was found to be accompanied by a fragment ionsignal at m/z 1289.74 (Figure 4b). This result showed thepresence of two related sequences: sequence LVINGNPI-TIFQER was accompanied by sequence LVIDGNPI-TIFQER. Comparison with the fragmentation spectrumderived from spot 373 showed that the Y"11 ion at m/z1289.69 showed normal isotope distribution and, therefore,the presence of just one sequence (LVINGNPITIFQER).
Similar results were also found for the other deamidationevents in GAP-DH showing partial deamidation of asparagineresidues at positions 9, 64, and 316 (cf. Supplemental Table 2)with different abundances in the respective protein spots.GAP-DH in spot 348 was partially deamidated at positions 9,64, 70, and 316, whereas deamidation of GAP-DH in spot 350was observed at positions 9, 70, and 316. Note that the GAP-DH in spot 373 lacked asparagine residues 9 and 64 andshowed no evidence for deamidation at any of the abovementioned asparagine residues.
Figure 1. Image of a 2-DE reference gel from tumor tissue.About 1200 separated spots are visualized. Labeled spotsare a subset of excised and in-gel digested spots that belongto proteins from the proteome signature [26]. For proteinidentification see Table 2;. 400 μg protein was loaded onimmobiline strips (pH 3–10 NL) that were used for the firstdimension. SDS-PAGE (12%T) was applied for the seconddimension. Coomassie brilliant blue (CBB) staining
446 C. Röwer, et al.: Proteome Signature for Breast Carcinoma
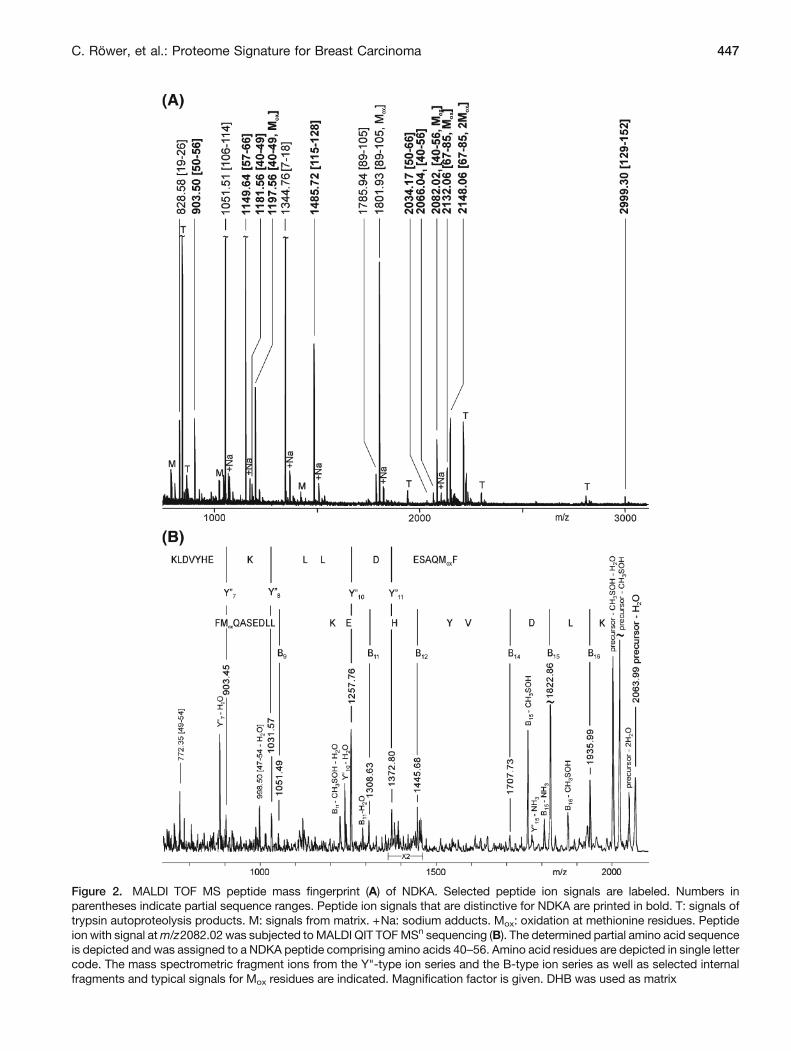
Figure 2. MALDI TOF MS peptide mass fingerprint (A) of NDKA. Selected peptide ion signals are labeled. Numbers inparentheses indicate partial sequence ranges. Peptide ion signals that are distinctive for NDKA are printed in bold. T: signals oftrypsin autoproteolysis products. M: signals from matrix. +Na: sodium adducts. Mox: oxidation at methionine residues. Peptideion with signal atm/z2082.02 was subjected toMALDI QIT TOFMSn sequencing (B). The determined partial amino acid sequenceis depicted and was assigned to a NDKA peptide comprising amino acids 40–56. Amino acid residues are depicted in single lettercode. The mass spectrometric fragment ions from the Y"-type ion series and the B-type ion series as well as selected internalfragments and typical signals for Mox residues are indicated. Magnification factor is given. DHB was used as matrix
C. Röwer, et al.: Proteome Signature for Breast Carcinoma 447
Protein spot-derived proteolytic peptides also harbor theinformation for determining post-translational modifications,such as phosphorylation. As an example, the phosphorylationstatus of a nucleophosmin-derived peptide was determined andshowed the presence of two partially phosphorylated serineresidues (Figure 5a).
The mass spectrum of the peptide mixture from theprotein (nucleophosmin) in spot 328 upon TiO2 chromato-graphy for enrichment of phosphopeptides showed peptideion signals that were present either due to phosphorylation ordue to the acidic character of the peptides. Interestingly, inthe MALDI QIT TOF mass spectrum (Figure 5a), the
Figure 3. MALDI TOF MS peptide mass fingerprint (A) of PKM2. Selected peptide ion signals are labeled. Numbers inparentheses indicate partial sequence ranges. Peptide ion signals that are distinctive for PKM2 are printed in bold. T: signals oftrypsin autoproteolysis products. K: signals from know keratin contamination. Mox: oxidation at methionine residues.*Unidentified ion signal. Peptide ion with signal at m/z1931.99 was subjected to MALDI QIT TOF MSn sequencing (B). Thedetermined partial amino acid sequence is depicted and was assigned to a PKM2 peptide comprising amino acids 384–399.Amino acid residues are depicted in single letter code. The mass spectrometric fragment ions from the Y"-type ion series andthe B-type ion series are indicated. *Unidentified ion signal. DHB was used as matrix
448 C. Röwer, et al.: Proteome Signature for Breast Carcinoma
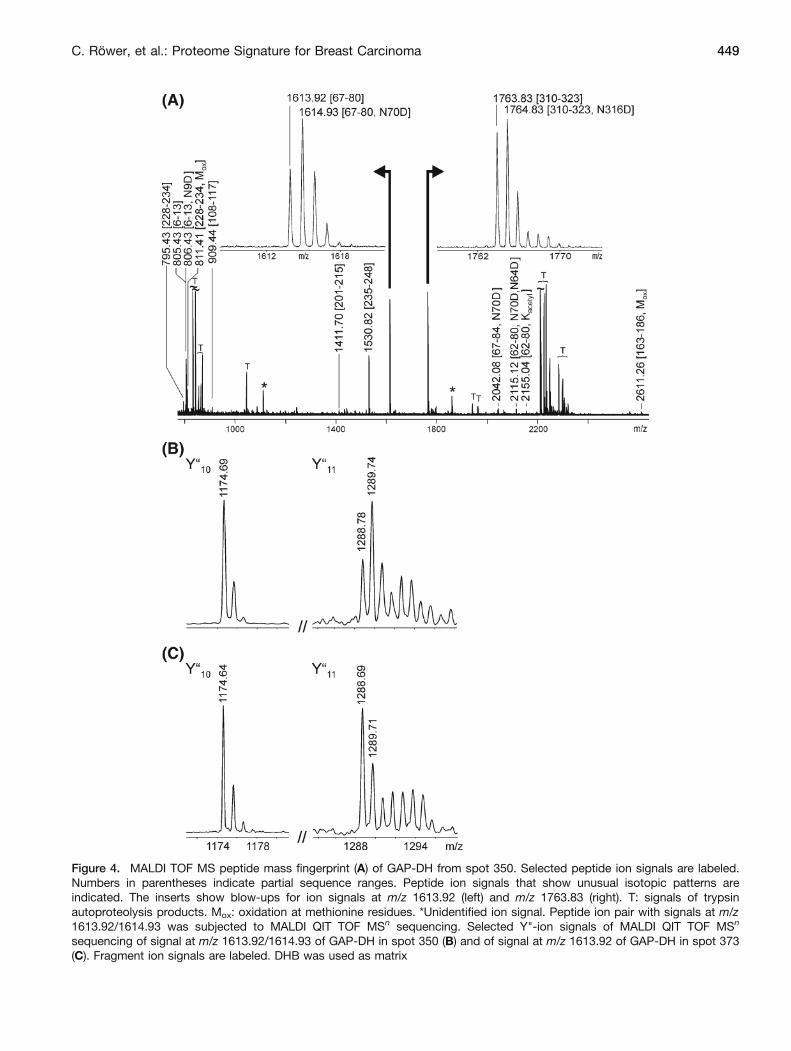
Figure 4. MALDI TOF MS peptide mass fingerprint (A) of GAP-DH from spot 350. Selected peptide ion signals are labeled.Numbers in parentheses indicate partial sequence ranges. Peptide ion signals that show unusual isotopic patterns areindicated. The inserts show blow-ups for ion signals at m/z 1613.92 (left) and m/z 1763.83 (right). T: signals of trypsinautoproteolysis products. Mox: oxidation at methionine residues. *Unidentified ion signal. Peptide ion pair with signals at m/z1613.92/1614.93 was subjected to MALDI QIT TOF MSn sequencing. Selected Y"-ion signals of MALDI QIT TOF MSn
sequencing of signal at m/z 1613.92/1614.93 of GAP-DH in spot 350 (B) and of signal at m/z 1613.92 of GAP-DH in spot 373(C). Fragment ion signals are labeled. DHB was used as matrix
C. Röwer, et al.: Proteome Signature for Breast Carcinoma 449
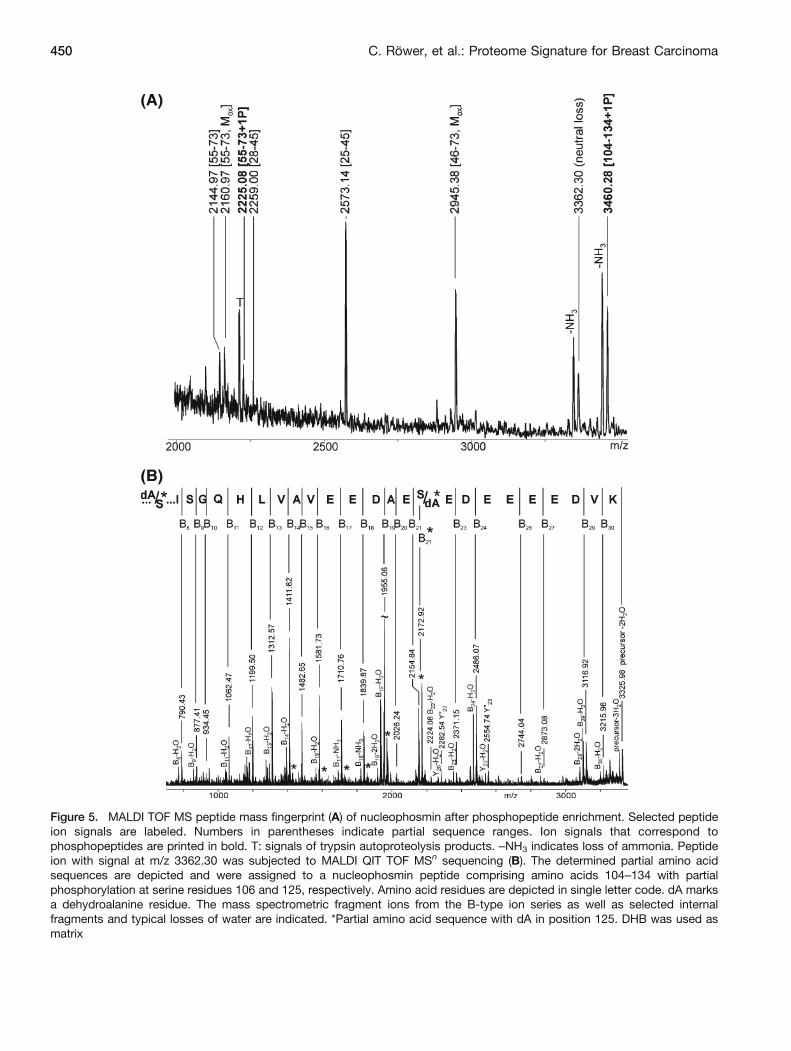
Figure 5. MALDI TOF MS peptide mass fingerprint (A) of nucleophosmin after phosphopeptide enrichment. Selected peptideion signals are labeled. Numbers in parentheses indicate partial sequence ranges. Ion signals that correspond tophosphopeptides are printed in bold. T: signals of trypsin autoproteolysis products. –NH3 indicates loss of ammonia. Peptideion with signal at m/z 3362.30 was subjected to MALDI QIT TOF MSn sequencing (B). The determined partial amino acidsequences are depicted and were assigned to a nucleophosmin peptide comprising amino acids 104–134 with partialphosphorylation at serine residues 106 and 125, respectively. Amino acid residues are depicted in single letter code. dA marksa dehydroalanine residue. The mass spectrometric fragment ions from the B-type ion series as well as selected internalfragments and typical losses of water are indicated. *Partial amino acid sequence with dA in position 125. DHB was used asmatrix
450 C. Röwer, et al.: Proteome Signature for Breast Carcinoma
peptide ion signal at m/z 3460.28 (aa 104-134) wasaccompanied by an ion signal at m/z 3362.30, indicatingloss of phosphoric acid (neutral loss; –98 Da) and formationof a dehydroalanine residue (dA). Both peptide ion signalsshowed, in addition, loss of ammonia (–17 Da) in thisanalysis. As the MS/MS spectrum of the ion signal at m/z3460.30 gave only very few fragment ion signals, the ionsignal at m/z 3362.30 was fragmented as well.
Now, mass spectrometric sequencing (Figure 5b) waspossible due to intense B-type ion signals. The fragment ionseries revealed that the precursor ion signal harbored twoclosely related sequences that differed only in the position ofthe dehydroalanine residue. The first partial sequence readsCGdAGPVHISGQHLVAVEEDAESEDEEEEDVK withthe dehydroalanine residue in position 106. The secondsequence shows the dehydroalanine residue in position 125,reading CGSGPVHISGQHLVAVEEDAEdAEDEEEEDVK(marked with * in Figure 5b). The most indicative ion signalfor the presence of two related partial sequences was the B21
ion signal pair that differed in mass by 18.08 Da. Note thatB22 and higher numbered B-type ions have the same massfor both sequences whereas the B-type ions with lowernumbers than B21 are all expected to be 18 Da apart fromeach other. These ion doublets were observed down to theB14 ion (marked with *). The MS/MS analysis clearlyshowed that partial phosphorylation took place at serineresidues 106 and 125 but not at serine residue 112.Functional consequences of these phosphorylation eventsin nucleophosmin were not investigated. Phosphorylation onserine 70 could not be confirmed by MS/MS analysisbecause fragmentation of the ion signal at m/z 2225.08 (cf.Figure 5a) gave too few fragment ion signals. Hence, theappearance of the ion signal at m/z 2225.08 upon phospho-peptide enrichment remains the only piece of evidence forphosphorylation at Ser-70 in our experiments.
Post-translational modifications, such as phosphorylation,acetylation, and deamidation or the presence of differentisoforms mainly caused by alternative splicing as well as bytruncations can alter the electrophoretic mobility of a certainprotein significantly. As we showed here, analyzing themass spectra of a protein in its related 2D gel spots in detailled to the detection of such protein modifications that mostlyremain unsolved in global proteome analyses. Preciseknowledge of protein structure details is, however, ofimportance when defining proteome signatures that may beapplied for patient screening.
Patient Sample Classification via Protein SpotAbundance Differences
In order to test whether the sub-signature of 38 protein spots(20 proteins) that came out of the 2D gel analysis wasperforming well with respect to differentiating tumor fromgland tissue, we first performed a principal componentanalysis using the respective LC-MSE data set (patients A–C, Supplemental Figure 4a). The result resembled that of the
original signature (that contained peptides from 60 proteins)quite well. Again, PCA separated the tumor samples fromthe controls (gland) along the PC1 axis, indicating that themajor discriminating proteins were maintained in thissubset of proteins. Also, tumor samples were clusteringmore closely together than control samples, suggestingthat the remaining protein expressions were more tumor-related and contained less information on inter-individualdifferences.
Of more importance here, similar results could beobtained with the 2D gel data set, i.e., using the spotvolumes of the 38 spots (that reflected the 20 proteins fromthe sub-signature) from samples belonging to patients A–C(Supplemental Figure 4b). Despite being slightly moredisperse in appearance, the separation between tumor andcontrol samples along the PC1 axis was well feasible.
In agreement with the PCA results, hierarchical clusteringenabled clear separation of the tumor from the controlsamples applying both, the LC-MSE data (SupplementalFigure 5a) with 20 protein entries and the 2D gel spotvolumes (Supplemental Figure 5b) with 38 entries,respectively.
The fact that the retrospectively designed proteomesignature derived from the LC-MSE platform was at leastin part transferable to the 2D gel based spot analysistechnology and that the resulting sub-signature was capableto perform equally well with respect to separating the tumorfrom the control samples appropriately was encouraging toinclude more samples. The following investigations onadditional samples can be regarded prospective as theseparation rules were applied unchanged.
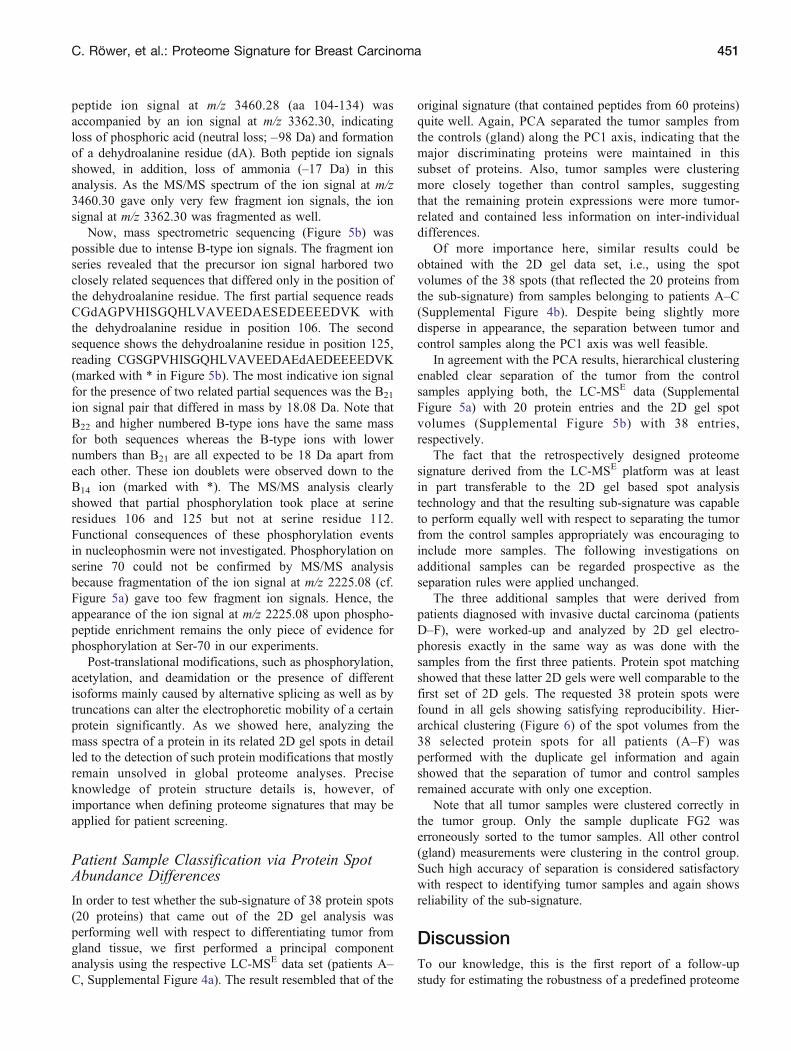
The three additional samples that were derived frompatients diagnosed with invasive ductal carcinoma (patientsD–F), were worked-up and analyzed by 2D gel electro-phoresis exactly in the same way as was done with thesamples from the first three patients. Protein spot matchingshowed that these latter 2D gels were well comparable to thefirst set of 2D gels. The requested 38 protein spots werefound in all gels showing satisfying reproducibility. Hier-archical clustering (Figure 6) of the spot volumes from the38 selected protein spots for all patients (A–F) wasperformed with the duplicate gel information and againshowed that the separation of tumor and control samplesremained accurate with only one exception.
Note that all tumor samples were clustered correctly inthe tumor group. Only the sample duplicate FG2 waserroneously sorted to the tumor samples. All other control(gland) measurements were clustering in the control group.Such high accuracy of separation is considered satisfactorywith respect to identifying tumor samples and again showsreliability of the sub-signature.
DiscussionTo our knowledge, this is the first report of a follow-upstudy for estimating the robustness of a predefined proteome
C. Röwer, et al.: Proteome Signature for Breast Carcinoma 451
signature for invasive ductal carcinoma. At the same time, weshow that the information that is contained in a sub-signature of20 proteins is maintaining a strong separation power, evenwhen using a different methodology for determining differ-ential protein abundance. Comparing the list of proteins fromour proteome signature with those published as "repeatedlyidentified proteins" [51, 52], it can be seen that only five fromthe 20 proteins of the sub-signature fall into the categories ofproteins whose protein abundance differences are thought asbeing merely "stress-related" (Table 3).
It has to be mentioned that in this comparison, informa-tion on protein structure alterations is not considered. Thefact that one and the same protein was identified in morethan one spot and that only some of these spots showeddifferences in abundance (according to our criteria fordifferential expression) was clearly pointing towards thepresence of distinct protein forms and/or modifications.
Today, most biomarker studies put emphasis on highthroughput methods for identification of proteins fromcomplex protein mixtures for setting up proteome signatures.Protein structure details are often not determined due to lackof modern data base designs and/or sophisticated searchsoftware. More advanced tools are needed that containinformation about PTMs in such a way that this informationis easily and automatically accessible to the MS user. In themajority of cases, it is still necessary to manually analyze thespectra for interpretation of unassigned signals and to makefurther mass spectrometric analysis using MS/MS methodsto identify or validate PTMs and/or protein isoforms. Inaddition, information on such modifications gets lost,particularly if the different isoforms do not have their ownentry in the data bases. However, a detailed analysis ofsingle proteins concerning PTMs and isoforms is absolutelynecessary because they can change protein function andphysicochemical properties, for example, in a tumoroustissue compared with the normal state.
Some protein examples from our proteome signature forinvasive ductal carcinoma are discussed in the literature inthe context of their potential roles as risk markers forprimary tumor aggressiveness, metastasis power, and fordisease prognosis. Notably, the M2 splice isoform frompyruvate kinase has been reported to be important for cancermetabolism and tumor growth [53, 54]. Its phosphorylationthrough tyrosine kinases has been demonstrated [53, 55, 56]as being crucial in this respect. Its quantities have beenmeasured and were found to be up-regulated in tumors [57],which is consistent with our findings. Phosphorylatedpyruvate kinase M2 is responsible for metabolic changes intumor cells such that glucose metabolites are directed awayfrom the citrate cycle into anabolic processes (Warburghypothesis) [58, 59]. It has also been reported that pyruvatekinase M2 plays an important role in caspase-independentcell death of tumor cells, providing a novel target for cancertherapy [60].
Similarly, nucleophosmin is frequently overexpressed,mutated, rearranged, and deleted in human cancer. Tradi-tionally regarded as a tumor marker and a putative proto-oncogene, it has now also been attributed with tumor-suppressor functions [61]. Nucleophosmin has been reportedas up-regulated in anti-estrogen-resistant breast tumor cells(MCF-7/LCC9), where it functions as a nucleolar phospho-protein inhibitor of the putative tumor suppressor interferonregulatory factor-1 [62, 63]. Nucleophosmin expressionblocks cellular growth and proliferation, whereas phosphor-ylation of Thr198 is not essential for nucleophosminscapacity to drive cell cycle progression and proliferation[64]. Interestingly, anti-nucleophosmin autoantibody levelsincrease significantly between diagnosis and 6 mo beforerecurrence in recurrent patients, suggesting anti-nucleophos-min autoantibody levels to function as simple serumbiomarker for predicting the timing of recurrence and formonitoring response to endocrine manipulations in breastcancer patients [65].
Figure 6. Hierarchical clustering analysis with spot volumesof 38 protein spots from 2D gel data that belong to theproteome signature for patients A–F with invasive ductalcarcinoma. The duplicate spot volume values from the 2Dgels yield in clear separation of the tumor samples from thecontrol (gland) tissues for invasive ductal carcinoma, exceptfor sample FG2. Tumor samples (T) and control samples (G)are shown in single lanes. Protein spot numbers are indicatedat the right
452 C. Röwer, et al.: Proteome Signature for Breast Carcinoma
Another protein that has been found consistently up-regulated in tumor samples was GAP-DH, a glycolyticenzyme that is also involved in the early steps of apoptosis,nuclear tRNA export, DNA replication, DNA repair, andtranscription [66]. This protein, when considered as a“housekeeping” protein, might serve as a useful marker fora tissue with high metabolism as opposed to a tissue withlow overall metabolism. Clearly, mammary gland tissuedecreases its metabolic activity after menopause and standsin contrast to tumor tissue in this respect. However, GAP-DH expression has been described as being dynamic, e.g.,affected by hypoxic stress [67]. It also was reported thatGAP-DH accumulates in the nucleus after cells were treatedwith genotoxic drugs, such as mercaptopurine or thioguanine[68, 69]. Interestingly, when overexpressed, GAP-DH hasbeen found to function as interaction partner of NDKAcausing a change in NDKA substrate specificity. The newlyformed protein complex functions as a histidine kinase on anumber of proteins that participate in signal transductionpathways [70, 71]. It remains to be elucidated whether theliterature reports refer to full-length GAP-DH or to a GAP-DH with altered length as was found in our studies.
NDKA expression was observed to be up-regulatedabove the threshold of detection in the tumor samples, inagreement with literature reports [72, 73]. However, NDKAexpression was found not to correlate with primary tumorgrowth but with potential for metastasis [74, 75]. An inverserelation between NDKA amount and risk of metastasisdevelopment has been described [74, 76]. It has been foundthat lack of NDKA expression in tumor cells increases cellmotility and, as a consequence, metastasis potential [77]. Atleast three mechanisms are thought to contribute to themetastasis-suppressive effects of NDKA, (1) its histidinekinase activity; (2) binding proteins that titer out “free”NDKA and inhibit its ability to suppress metastasis; and (3)altered gene expression downstream of NDKA [75, 78–80].
Regulation of p53, for instance, by NDKA mediation [81]and vice versa, regulation of NDKA by p53 [81] has beenreported to occur in the tumor, ultimately implementing itsmetastasis potential. The intriguing roles of metastasissuppressor proteins and the signal pathways they areinvolved in have led to various attempts to potentiate theireffects. Unfortunately, histidine phosphorylation is poorlystudied in mammalian cells because of the lability ofhistidine phosphates that is due to their high-energy fastkinetics, which renders them invisible in most analyticalassays. Phosphohistidine lacks an antibody [75]. By con-trast, histidine kinases are well known in bacteria and lowereukaryotes, in which they form a major signal transductionpathway to extracellular events (two-component-signal-transduction systems) [82, 83]. In model studies with humanbreast carcinoma cells, it could be shown that the metastasispotential was decreased upon treatment with compounds thatwere capable to increase NDKA expression [84]. Recently,pharmaceutical companies have identified histidine kinaseinhibitors as a next generation approach to antibiotic-resistant bacterial infection [85], and these technologiesand agents may be readily transferable to the cancer field,once anti-metastatic activity is proven. Note that some smallmolecules have already been developed with the intention torestore the expression or mimic the function of metastasis-suppressor genes, such as NDKA, and some of them areunder clinical trials [86].
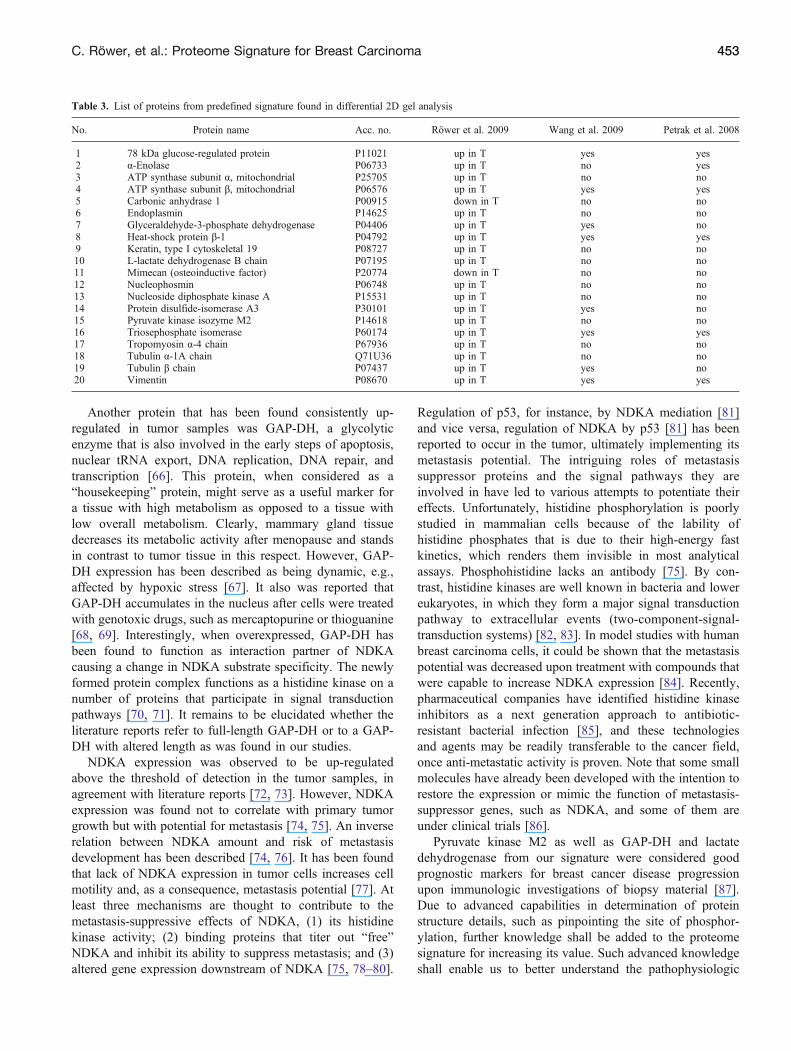
Pyruvate kinase M2 as well as GAP-DH and lactatedehydrogenase from our signature were considered goodprognostic markers for breast cancer disease progressionupon immunologic investigations of biopsy material [87].Due to advanced capabilities in determination of proteinstructure details, such as pinpointing the site of phosphor-ylation, further knowledge shall be added to the proteomesignature for increasing its value. Such advanced knowledgeshall enable us to better understand the pathophysiologic
Table 3. List of proteins from predefined signature found in differential 2D gel analysis
No. Protein name Acc. no. Röwer et al. 2009 Wang et al. 2009 Petrak et al. 2008
1 78 kDa glucose-regulated protein P11021 up in T yes yes2 α-Enolase P06733 up in T no yes3 ATP synthase subunit α, mitochondrial P25705 up in T no no4 ATP synthase subunit β, mitochondrial P06576 up in T yes yes5 Carbonic anhydrase 1 P00915 down in T no no6 Endoplasmin P14625 up in T no no7 Glyceraldehyde-3-phosphate dehydrogenase P04406 up in T yes no8 Heat-shock protein β-1 P04792 up in T yes yes9 Keratin, type I cytoskeletal 19 P08727 up in T no no10 L-lactate dehydrogenase B chain P07195 up in T no no11 Mimecan (osteoinductive factor) P20774 down in T no no12 Nucleophosmin P06748 up in T no no13 Nucleoside diphosphate kinase A P15531 up in T no no14 Protein disulfide-isomerase A3 P30101 up in T yes no15 Pyruvate kinase isozyme M2 P14618 up in T no no16 Triosephosphate isomerase P60174 up in T yes yes17 Tropomyosin α-4 chain P67936 up in T no no18 Tubulin α-1A chain Q71U36 up in T no no19 Tubulin β chain P07437 up in T yes no20 Vimentin P08670 up in T yes yes
C. Röwer, et al.: Proteome Signature for Breast Carcinoma 453
roles of a given protein in the context of the disease. As hasbeen requested [32], the available methodology is fostering thecombination of detailed clinicopathologic information withexperimental data from proteome analyses that have beenregarded to be necessary for uncovering candidates that mayserve as key-markers for diagnostics and/or prognostics, orfunction as future therapeutic targets in clinical applications.As the robustness of our proteome signature has now beendemonstrated successfully, future investigations shall focus onthe applicability of the described proteins as marker for earlydetection or as potential target for patient-tailored therapy. Inongoing data analysis, we screen for specific a pattern amongcarcinoma-subgroup with respect to axillary nodal status. Atumor protein signature predictive of negative axillary statuscould lead to a less invasive surgical approach.
AcknowledgementsThe authors thank Annika Kasten, Stefanie Haase, KatharinaDreschler, Paul Witt, Michael Kreutzer, and Manuela Siebfor excellent technical assistance. They express their thanksto Dr. Falk Pommerenke and Dr. Anngret Radtke from thePartnerschaft der Fachärzte für Pathologie at the SüdstadtClinical Center, Rostock, for supplying histological data onthe individual samples, and Dr. Christian George for clinicalinformation on the individual samples.
References1. Olopade, O.I., Grushko, T., Nanda, R., Huo, D.: Advances in breast
cancer: pathways to personalized medicine. Clin. Cancer Res. 14,7988–7999 (2008)
2. Boyd, Z.S., Wu, Q.J., O’Brien, C., Spoerke, J., Savage, H., Fielder, P.J.,Amler, L., Yan, Y., Lackner, M.R.: Proteomic analysis of breast cancermolecular subtypes and biomarkers of response to targeted kinaseinhibitors using reverse-phase protein microarrays. Mol. Cancer Ther.7, 3695–3706 (2008)
3. Callesen, A.K., Vach, W., Jørgensen, P.E., Cold, S., Mogensen, O.,Kruse, T.A., Jensen, O.N., Madsen, J.S.: Reproducibility of massspectrometry based protein profiles for diagnosis of breast cancer acrossclinical studies: a systematic review. J. Proteome Res. 7, 1395–1402(2008)
4. Hondermarck, H., Tastet, C., El Yazidi-Belkoura, I., Toillon, R.-A., LeBourhis, X.: Proteomics of breast cancer: the quest for markers andtherapeutic targets. J. Proteome Res. 7, 1403–1411 (2008)
5. Kuramitsu, Y., Kazuyuki, N.: Proteomic analysis of cancer tissues:shedding light on carcinogenesis and possible biomarkers. Proteomics6, 5650–5661 (2006)
6. Pastwa, E., Somiari, S.B., Czyz, M., Somiari, R.I.: Proteomics in humancancer research. Proteom. Clin. Appl. 1, 4–17 (2007)
7. Abbott, K.L., Aoki, K., Lim, J.-M., Porterfield, M., Johnson, R.,O’Regan, R.M., Wells, L., Tiemeyer, M., Michael, P.: Targetedglycoproteomic identification of biomarkers for human breast carci-noma. J. Proteome Res. 7, 1470–1480 (2008)
8. Chen, S.-T., Pan, T.-L., Juan, H.-F., Chen, T.-Y., Lin, Y.-S., Huang, C.-M.: Breast tumor microenvironment: proteomics highlights the treat-ments targeting secretome. J. Proteome Res. 7, 1379–1387 (2008)
9. Hawkins, O.E., VanGundy, R.S., Eckerd, A.M., Bardet, W., Buchli, R.,Weidanz, J.A., Hildebrand, W.H.: Identification of breast cancer peptideepitopes presented by HLA-A*0201. J. Proteome Res. 7, 1445–1457(2008)
10. He, Q., Zhang, S.-Q., Chu, Y.-L., Jia, X.-L., Zhao, L.-H., Wang, X.-L.: Separation and identification of differentially expressed nuclaermatrix proteins in breast barcinoma forming. Acta Oncol. 49, 76–84(2010)
11. Kang, U.-B., Ahn, Y., Lee, J.W., Kim, Y.-H., Kim, J., Yu, M.-H., Noh,D.-Y., Lee, C.; Differential profiling of breast cancer plasma proteomeby isotope-coded affinity tagging method reveals biotinidase as a breastcancer biomarker. BMC Cancer 10, 113 (2010)
12. Lu, H., Goodell, V., Disis, M.L.: Humoral immunity directed againsttumor-associated antigens as potential biomarkers for the earlydiagnosis of cancer. J. Proteome Res. 7, 1388–1394 (2008)
13. Ou, K., Yu, K., Kesuma, D., Hooi, M., Huang, N., Chen, W., Lee,S.Y., Pei Goh, X., Tan, L.K., Liu, J., Soon, S.Y., Rashid, S.B.A.,Putti, T.C., Jikuya, H., Ichikawa, T., Nishimura, O., Salto-Tellez,M., Tan, P.: Novel breast cancer biomarkers identified by integrativeproteomic and gene expression mapping. J. Proteome Res. 7, 1518–1528 (2008)
14. Pucci-Minafra, I., Cancemi, P., Marabeti, M.R., Albanese, N.N., DiCara, G., Taomina, P., Marrazzo, A.: Proteomic profiling of 13 pairedductal infiltrating breast carcinomas and non-tumoral adjacent counter-parts. Proteom. Clin. Appl. 1, 118–129 (2007)
15. Sanders, M.E., Dias, E.C., Xu, B.J., Mobley, J.A., Billheimer, D.,Roder, H., Grigorieva, J., Dowsett, M., Arteaga, C.L., Caprioli, R.M.: Differentiating proteomic biomarkers in breast cancer by lasercapture microdissection and MALDI MS. J. Proteome Res. 7, 1500–1507 (2008)
16. Slamon, D.J., Clark, G.M., Wong, S.G., Levin, W.J., Ullrich, A.,McGuire, W.: Human breast cancer: correlation of relapse and survivalwith amplification of the HER-2/neu oncogene. Science 235, 177–182(1987)
17. Dowsett, M., Dunbier, A.K.: Emerging biomarkers and new under-standing of traditional markers in personalized therapy for breast cancer.Clin. Cancer Res. 14, 8019–8026 (2008)
18. Paik, S., Tang, G., Shak, S., Kim, C., Baker, J., Kim, W., Cronin, M.,Baehner, F.L., Watson, D., Bryant, J., Costantino, J.P., Geyer Jr., C.E.,Wickerham, D.L., Wolmark, N.: Gene expression and benefit ofchemotherapy in women with node-negative, estrogen receptor-positivebreast cancer. J. Clin. Oncol. 24, 3726–3734 (2006)
19. Umar, A., Kang, H., Timmermans, A.M., Look, M.P., Meijer-van-Gelder, M.E., den Bakker, M.A., Jaitly, N., Martens, J.W.M., Luider, T.M., Foekens, J.A.: Pasa-tolic identification of a putative protein profileassociated with tamoxifen therapy resistance in breast cancer. Mol. Cell.Proteom. 8, 1278–1294 (2009)
20. Willipinski-Stapelfeldt, B., Riethdorf, S., Assmann, V., Woelfle, U.,Rau, T., Sauter, G., Heukeshoven, J., Pantel, K.: Changes incytoskeletal protein composition indicative of an epithelial-mesenchy-mal transition in human micrometastatic and primary breast carcinomacells. Clin. Cancer Res. 11, 8006–8014 (2005)
21. Alldridge, L., Metodieva, G., Greenwood, C., Al-Janabi, K., Thwaites,L., Sauven, P., Metodiev, M.: Proteome profiling of breast tumors bygel electrophoresis and nanoscale electrospray ionization mass spec-trometry. J. Proteome Res. 7, 1458–1469 (2008)
22. Seike, M., Kondo, T., Fujii, K., Yamada, T., Gemma, A., Kudoh, S.,Hirohashi, S.: Proteomic signature of human cancer cells. Proteomics 4,2776–2788 (2004)
23. Wang, M., You, J., Bemis, K.G., Tegeler, T.J., Brown, D.P.G.: Label-freemass spectrometry-based protein quantification technologies in proteomicanalysis. Brief Funct. Genomic. Proteomic. 7, 329–339 (2008)
24. Yamada, M., Fujii, K., Koyama, K., Hirohashi, S., Kondo, T.: Theproteomic profile of pancreatic cancer cell lines correspondingto carcinogenesis and metastasis. J. Proteom. Bioinform. 2, 1–18(2009)
25. Brennan, D.J., Gallagher, W.M.; Prognostic Ability of a Panel ofImmunohistochemistry Markers-Retailoring of an "Old Solution."Breast Cancer Res. 10, 102 (2008)
26. Röwer, C., Vissers, J.P.C., Koy, C., Kipping, M., Hecker, M., Reimer,T., Gerber, B., Thiesen, H.-J., Glocker, M.O.: Towards a proteomesignature for invasive ductal breast carcinoma derived from label-freenanoscale LC-MS protein expression profiling of tumorous andglandular tissue. Anal. Bioanal. Chem. 395, 2443–2456 (2009)
27. Wulfkuhle, J.D., Speer, R., Pierobon, M., Laird, J., Espina, V., Deng, J.,Mammano, E., Yang, S.X., Swain, S.M., Nitti, D., Essermann, L.J.,Belluco, C., Liotta, L.A., Petricoin, E.F.: III. Multiplexed cell signalinganalysis of human breast cancer applications for personalized therapy. J.Proteome Res.7, 1508–1517 (2008)
28. Paik, S., Shak, S., Tang, G., Kim, C., Baker, J., Cronin, M., Baehner, F.L., Walker, M.G., Watson, D., Park, T., Hiller, W., Fisher, E.R.,Wickerham, D.L., Bryant, J., Wolmark, N.: A multigene assay to
454 C. Röwer, et al.: Proteome Signature for Breast Carcinoma
predict recurrence of tamoxifen-treated, node-negative breast cancer. N.Engl. J. Med. 351, 2817–2826 (2004)
29. Sparano, J.A., Paik, S.: Development of the 21-gene assay and itsapplication in clinical practice and clinical trials. J. Clin. Oncol. 26,721–728 (2008)
30. van de Vijver, M.J., He, Y.D., van’t Veer, L.J., Dai, H., Hart, A.A.M., Voskuil, D.W., Schreiber, G.J., Peterse, J.L., Roberts, C.,Marton, M.J., Parrish, M., Atsma, D., Witteveen, A.T., Glas, A.,Delahaye, L., Van der Velde, T., Bartelink, H., Rodenhuis, S.,Rutgers, E.T., Friend, S.H., Bernards, R.: A gene-expressionsignature as a predictor of survival in breast cancer. N. Engl. J.Med. 347, 1999–2009 (2002)
31. van’t Veer, L.J., Dai, H., van de Vijver, M.J., He, Y.D., Hart, A.A.M.,Bernards, R., Friend, S.H.: Expression profiling predicts outcome inbreast cancer. Breast Cancer Res. 5, 57–58 (2002)
32. Kondo, T.: Tissue proteomics for cancer biomarker development: lasermicrodissection and 2D-DIGE. BMB Rep. 41, 626–634 (2008)
33. Zhang, X., Li, L., Wei, D., Yap, Y., Chen, F.: Moving cancerdiagnostics from bench to bedside. Trends Biotechnol. 25, 166–173(2007)
34. Just, T., Gafumbegete, E., Gramberg, J., Prüfer, I., Mikkat, S., Ringel,B., Pau, H.W., Glocker, M.O.: Differential proteome analysis of tonsilsfrom children with chronic tonsillitis or with hyperplasia revealsdisease-associated protein expression differences. Anal. Bioanal. Chem.384, 1134–1144 (2006)
35. Bradford, M.M.A.: Rapid and sensitive method for the quantitation ofmicrogram quantities of protein utilizing the principle of protein-dyebinding. Anal. Biochem. 72, 248–254 (1976)
36. Lorenz, P., Bantscheff, M., Ibrahim, S.M., Thiesen, H.-J., Glocker,M.O.: Proteome analysis of diseased joints from mice suffering fromcollagen-induced arthritis. Clin. Chem. Lab. Med. 41, 1622–1632(2003)
37. Sinz, A., Bantscheff, M., Mikkat, S., Ringel, B., Drynda, S., Kekow, J.,Thiesen, H.-J., Glocker, M.O.: Mass spectrometric proteome analyses ofsynovial fluids and plasmas from patients suffering from rheumatoidarthritis and comparison to reactive arthritis or osteoarthritis. Electro-phoresis 23, 3445–3456 (2002)
38. Laemmli, U.K.: Cleavage of structural proteins during the assembly ofthe head of bacteriophage T4. Nature 227, 680–685 (1970)
39. Bantscheff, M., Ringel, B., Madi, A., Schnabel, R., Glocker, M.O.,Thiesen, H.-J.: Differential proteome analysis and mass spectrometriccharacterization of germ line development-related proteins of caeno-rhabditis elegans. Proteomics 4, 2283–2295 (2004)
40. Neuhoff, V., Arold, N., Taube, D., Ehrhardt, W.: Improved staining ofproteins in polyacrylamide gels including isoelectric focusing gels withclear background at nanogram sensitivity using coomassie brilliant blueG-250 and R-250. Electrophoresis 9, 255–262 (1988)
41. Heitner, J.C., Koy, C., Reimer, T., Kreutzer, M., Gerber, B., Glocker,M.O.: Differentiation of HELLP patients from healthy pregnant womenby proteome analysis. J. Chromatogr. B Analyt. Technol. Biomed. LifeSci. 840, 10–19 (2006)
42. Kienbaum, M., Koy, C., Montgomery, H.V., Drynda, S., Lorenz, P.,Illges, H., Tanaka, K., Kekow, J., Guthke, R., Thiesen, H.-J., Glocker,M.O.: Mass spectrometric characterization of apheresis samples fromrheumatoid arthritis patients for the improvement of immunoadsorptiontherapy-A pilot study. Proteomics Clin. Appl. 3, 797–809 (2009)
43. Mikkat, S., Koy, C., Ulbrich, M., Ringel, B., Glocker, M.O.: Massspectrometric protein structure characterization reveals cause of migra-tion differences of haptoglobin a chains in two-dimensional gelelectrophoresis. Proteomics 4, 3921–3932 (2004)
44. Larsen, M.R., Thingholm, T.E., Jensen, O.N., Roepstorff, P., Jorgensen,T.J.D.: Highly selective enrichment of phosphorylated peptides frompeptide mixtures using titanium dioxide microcolumns. Mol. Cell.Proteom. 4, 873–886 (2005)
45. Mikkat, S., Lorenz, P., Scharf, C., Yu, X., Glocker, M.O., Ibrahim, S.M.: MS characterization of qualitative protein polymorphisms in thespinal cords of inbred mouse strains. Proteomics 10, 1050–1062 (2010)
46. Koy, C., Mikkat, S., Raptakis, E., Sutton, C., Resch, M., Tanaka, K.,Glocker, M.O.: Matrix-assisted laser desorption/ionization-quadrupoleion trap-time of flight mass spectrometry sequencing resolves structuresof unidentified peptides obtained by in-gel tryptic digestion ofhaptoglobin derivatives from human plasma proteomes. Proteomics 3,851–858 (2003)
47. Jollife, J.T.: Principal component analysis. Springer Verlag, New York(1986)
48. Eisen, M.B., Spellmann, P.T., Brown, P.O., Botstein, D.: Clusteranalysis and display of genome-wide expression patterns. Proc. Natl.Acad. Sci. U.S.A. 95, 14863–14868 (1998)
49. Elston, C.W.: Classification and grading of invasive breast carcinoma.Verh. Dtsch Ges. Pathol. 89, 35–44 (2005)
50. Remmele, W., Stegner, H.E.: Recommendation for uniform definitionof an immunoreactive score (IRS) for immunohistochemical estrogenreceptor detection (ER-ICA) in breast cancer tissue. Pathologe 8, 138–140 (1987)
51. Petrak, J., Ivanek, R., Toman, O., Cmejla, R., Cmejlova, J., Vyoral, D.,Zivny, J., Vulpe, C.D.: Déjà Vu in Proteomics. A Hit Parade ofRepeatedly Identified Differentially Expressed Proteins. Proteomics 8,1744–1749 (2008)
52. Wang, P., Bouwman, F.G., Mariman, E.C.M.: Generally detectedproteins in comparative proteomics—a matter of cellular stressresponse? Proteomics 9, 2955–2966 (2009)
53. Christofk, H.R., Vander Heiden, M.G., Harris, M.H., Ramanathan, A.,Gerszten, R.E., Wei, R., Fleming, M.D., Schreiber, S.L., Cantley, L.C.:The M2 splice isoform of pyruvate kinase is important for cancermetabolism and tumor growth. Nature 452, 230–233 (2008)
54. Presek, P., Glossmann, H., Eigenbrodt, E., Schoner, W., Rübsamen, H.,Friis, R.R., Bauer, H.: Similarities between a phosphoprotein (pp60arc)-associated protein kinase of rous sarcoma virus and a cyclicadenosine 3´:5´-monophosphate-independent protein kinase that phos-phorylates pyruvate kinase Type M2. Cancer Res. 40, 1733–1741(1980)
55. Presek, P., Reinacher, M., Eigenbrodt, E.: Pyruvate kinase Type M2 isphosphorylated at tyrosine residues in cells transformed by roussarcoma virus. FEBS Lett. 242, 194–198 (1988)
56. Presek, P., Reuter, C., Findik, D., Bette, P.: High-yield purification of app 60c-src related protein-tyrosine Kinase from human platelets.Biochim. Biophys. Acta 969, 271–280 (1988)
57. Acebo, P., Giner, D., Calvo, P., Blanco-Rivero, A., Ortega, Á.D.,Fernández, P.L., Roncador, G., Fernández-Malavé, E., Chamorro, M.,Cuezva, J.M.: Cancer abolishes the tissue type-specific differences inthe phenotype of energetic metabolism. Transl. Oncol. 2, 138–145(2009)
58. Mazurek, S., Zwerschke, W., Jansen-Dürr, P., Eigenbrodt, E.: Effects ofthe human papilloma virus HPV-16 E7 oncoprotein on glycolysis andglutaminolysis: role of pyruvate kinase Type M2 and the glycolytic–enzyme complex. Biochem. J. 356, 247–256 (2001)
59. Mazurek, S., Zwerschke, W., Jansen-Dürr, P., Eigenbrodt, E.: Meta-bolic cooperation between different oncogenes during cell transforma-tion: interaction between activated ras and HPV-16 E7. Oncogene 20,6891–6899 (2001)
60. Steták, A., Veress, R., Ovádi, J., Csermely, P., Kéri, G., Ullrich, A.:Nuclear translocation of the tumor marker pyruvate kinase M2 inducesprogrammed cell death. Cancer Res. 67, 1602–1608 (2007)
61. Grisendi, S., Mecucci, C., Falini, B., Pandolfi, P.P.: Nucleophosmin andCancer. Nat. Rev. Cancer 6, 493–505 (2006)
62. Gu, Z., Lee, R.Y., Skaar, T.C., Bouker, K.B., Welch, J.N., Lu, J., Liu,A., Zhu, Y., Davis, N., Leonessa, F., Brünner, N., Wang, Y., Clarke, R.:Association of interferon regulatory factor-1, Nucleophosmin, nuclearfactor-κB, and cyclic amp response element binding with acquiredresistance to Faslodex (ICI 182, 780). Cancer Res. 62, 3428–3437(2002)
63. Skaar, T.C., Prasad, S.C., Sharareh, S., Lippmann, M.E., Brünner, N.,Clarke, R.: Two-dimensional gel electrophoresis analyses identifynucleophosmin as an estrogen regulated protein associated withacquired estrogen-independence in human breast cancer cells. J. SteroidBiochem. Mol. Biol. 67, 391–402 (1998)
64. Brady, S.N., Maggi, L.B.J., Winkeler, C.L., Toso, E.A., Gwinn, A.S.,Pelletier, C.L., Weber, J.D.: Nucleophosmin protein expression level,but not threonine 198 phosphorylation, is essential in growth andproliferation. Oncogene 28, 3209–3220 (2009)
65. Brankin, B., Skaar, T.C., Brotzmann, M., Trock, B., Clarke, R.:Autoantibodies to the nucleolar phosphoprotein nucleophosmin inbreast cancer patients. Cancer Epidemiol. Biomarkers Prev. 7, 1109–1115 (1998)
66. Kim, D.H., Noh, D.-Y., Lee, C., Yu, M.-H.: Proceedings of the HUPO6th annual world congress. Seoul, South Korea (2007)
C. Röwer, et al.: Proteome Signature for Breast Carcinoma 455
67. Graven, K.K., Troxler, R.F., Kornfeld, H., Panchenko, M.V., Farber, H.W.: Regulation of endothelial cell glyceraldehyde-3-phosphate dehydro-genase expression by hypoxia. J. Biol. Chem. 269, 24446–24453 (1994)
68. Brown, V.M., Krynetski, E.Y., Krynetskaia, N.F., Grieger, D.,Mukatira, S.T., Murti, K.G., Slaughter, C.A., Park, H.-W., Evans, W.E.: A novel CRM1-mediated nuclear export signal governs nuclearaccumulation of glyceraldehyde-3-phosphate dehydrogenase followinggenotoxic stress. J. Biol. Chem. 279, 5984–5992 (2004)
69. Sawa, A., Khan, A.A., Hester, L.D., Snyder, S.H.: Glyceraldehyde-3-phosphate dehydrogenase: nuclear translocation participates in neuronaland nonneuronal cell death. Proc. Natl. Acad. Sci. U.S.A. 94, 11669–11674 (1997)
70. Engel, M., Mazurek, S., Eigenbrodt, E., Welter, C.: Phosphoglyceratemutase-derived polypeptide inhibits glycolytic flux and induces cellgrowth arrest in tumor cell lines. J. Biol. Chem. 279, 35803–35812(2004)
71. Engel, M., Seifert, M., Theisinger, B., Seyfert, U., Welter, C.:Glyceraldeyde-3-phosphate dehydrogenase and Nm23-H1/nucleosidediposphate kinase A-two old enzymes combine for the novel Nm23protein phosphotransferase function. J. Biol. Chem. 273, 20058–20065(1998)
72. Salerno, M., Palmieri, D., Bouadis, A., Halverson, D., Steeg, P.S.:Nm23-H1 metastasis suppressor expression level influences the bindingproperties, stability, and function of the kinase suppressor of Ras1(KSR1) erk scaffold in breast carcinoma cells. Mol. Cell. Biol. 25,1379–1388 (2005)
73. Tee, Y.-T., Chen, G.-D., Lin, L.-Y., Ko, J.-L., Wang, P.-H.: Nm23-H1: ametastasis-associated gene. Taiwan. J. Obstet. Gynecol. 45, 107–113 (2006)
74. Horak, C.E., Lee, J.H., Elkahloun, A.G., Boissan, M., Dumont, S.,Maga, T.K., Arnaud-Dabernat, S., Palmieri, D., Stetler-Stevenson, W.G., Lacombe, M.-L., Meltzer, P.S., Steeg, P.S.: Nm23-H1 suppressestumor cell motility by down-regulating the lysophosphatidic acidreceptor EDG2. Cancer Res. 67, 7238–7246 (2007)
75. Steeg, P.S., Horak, C.E., Miller, K.D.: Clinical-translational approachesto the Nm23-H1 metastasis suppressor. Clin. Cancer Res. 14, 5006–5012 (2008)
76. Ouatas, T., Salerno, M., Palmieri, D., Steeg, P.S.: Basic and transla-tional advances in cancer metastasis: Nm23. J. Bioenerg. Biomembr. 35,73–79 (2003)
77. Steeg, P.S.: Metastasis suppressors alter the signal transduction ofcancer cells. Nat. Rev. Cancer 3, 55–63 (2003)
78. D’Angelo, A., Garzia, L., André, A., Carotenuto, P., Aglio, V.,Guardiola, O., Arrigoni, G., Cossu, A., Palmieri, G., Aravind, L.,Zollo, M.: Prune cAMP phosphodiesterase binds nm23-H1 andpromotes Ccancer metastasis. Cancer Cell 5, 137–149 (2004)
79. Garzia, L., D'Angelo, A., Amoresano, A., Knauer, S.K., Cirulli, C.,Campanella, C., Stauber, R.H., Steegborn, C., Iolascon, A., Zollo, M.:Phosphorylation of nm23-H1 by CKI induces its complex formationwith h-prune and promotes cell motility. Oncogene 27, 1853–1864(2008)
80. Kaetzel, D.M., Zhang, Q., Yang, M., McCorkle, J.R., Ma, D., Craven,R.J.; Potential Roles of 3'-5' Exonuclease Activity of NM23-H1 in DNARepair and Malignant Progression. J. Bioenerg. Biomembr. 2006, 3/4.
81. Jung, H., Seong, H.-A., Ha, H.: Direct interaction between NM23-H1and macrophage migration inhibitory factor (MIF) is critical foralleviation of MIF-mediated suppression of p53 activity. J. Biol. Chem.283, 32669–32679 (2006)
82. Bantscheff, M., Perraud, A.L., Bock, A., Rippe, K., Weiss, V., Glocker,M.O., Gross, R.: Structure–function relationships in the Bvg and Evgtwo-component phosphorelay systems. Int. J. Med. Microbiol. 290,317–323 (2000)
83. Beier, D., Gross, R.: The BvgS/BvgA phosphorelay system ofpathogenic bordetellae: structure, function, and evolution. Adv. Exp.Med. Biol. 631, 149–160 (2008)
84. Marshall, J.-C., Lee, J.H., Steeg, P.S.: Clinical-translational strategiesfor the elevation of Nm23-H1 metastasis suppressor gene expression.Mol. Cell. Biochem. 329, 115–120 (2009)
85. Payne, D.J.: Microbiology. Desperately seeking new antibiotics.Science 321, 1644–1645 (2008)
86. Iiizumi, M., Liu, W., Paia, S.K., Furutaa, E., Watabe, K.: Drugdevelopment against metastasis-related genes and their pathways: arationale for cancer therapy. Biochim. Biophys. Acta 1786, 87–104(2008)
87. Isidoro, A., Casado, E., Redondo, A., Acebo, P., Espinosa, E., Alonso,A.M., Cejas, P., Hardisson, D., Fresno Vara, J.A., Belda-Iniesta, C.,González-Barón, M., Cuezva, J.M.: Breast carcinomas fulfill thewarburg hypothesis and provide metabolic markers of cancer prognosis.Carcinogenesis 26, 2095–2104 (2005)
456 C. Röwer, et al.: Proteome Signature for Breast Carcinoma