The function of food volatiles: insect behaviour and pest control
Upload
independentCategory
view
1download
0
A
sdrOduTh©
K
1
entiempddloc
0d
Available online at www.sciencedirect.com
Journal of Chromatography A, 1179 (2008) 205–215
Comprehensive two-dimensional gas chromatography/time-of-flightmass spectrometry peak sorting algorithm
Cheolhwan Oh a,1, Xiaodong Huang b,1, Fred E. Regnier a,b,Charles Buck a, Xiang Zhang a,∗
a Bindley Bioscience Center, Purdue University, West Lafayette, IN 47907, USAb Department of Chemistry, Purdue University, West Lafayette, IN 47907, USA
Received 5 October 2007; received in revised form 26 November 2007; accepted 28 November 2007Available online 3 December 2007
bstract
We report a novel peak sorting method for the two-dimensional gas chromatography/time-of-flight mass spectrometry (GC × GC/TOF-MS)ystem. The objective of peak sorting is to recognize peaks from the same metabolite occurring in different samples from thousands of peaksetected in the analytical procedure. The developed algorithm is based on the fact that the chromatographic peaks for a given analyte have similaretention times in all of the chromatograms. Raw instrument data are first processed by ChromaTOF (Leco) software to provide the peak tables.ur algorithm achieves peak sorting by utilizing the first- and second-dimension retention times in the peak tables and the mass spectra generateduring the process of electron impact ionization. The algorithm searches the peak tables for the peaks generated by the same type of metabolite
sing several search criteria. Our software also includes options to eliminate non-target peaks from the sorting results, e.g., peaks of contaminants.he developed software package has been tested using a mixture of standard metabolites and another mixture of standard metabolites spiked intouman serum. Manual validation demonstrates high accuracy of peak sorting with this algorithm. 2007 Elsevier B.V. All rights reserved.etry;
albp(tmttflsm
eywords: Two-dimensional gas chromatography/time-of-flight mass spectrom
. Introduction
Metabolomics is the study of the low molecular massndogenous metabolites in tissues and biofluids that providesontargeted, global, qualitative and quantitative information ofhese small molecules in biological systems. This approachs gaining increasing interest in discovery of biomarkers,lucidation of disease mechanisms and description of newetabolic pathways. Effective application of this approach will
rovide better understanding of disease processes, improvedisease prognoses and diagnoses, as well as more efficientrug discovery [1–4]. Although the number of known metabo-
ites in many organisms is fewer than the number of genesr proteins, development of profiling methods and analyti-al techniques for metabolite detection and identification is∗ Corresponding author. Tel.: +1 765 496 1153.E-mail address: [email protected] (X. Zhang).
1 These authors made equal contribution to this work.
oop(soGi
021-9673/$ – see front matter © 2007 Elsevier B.V. All rights reserved.oi:10.1016/j.chroma.2007.11.101
Peak sorting; Algorithm; Metabolite; Human serum
challenge due to the chemical diversity of metabolites andarge concentration ranges. Many analytical techniques haveeen applied in metabolomics including liquid chromatogra-hy (LC), capillary electrophoresis (CE), gas chromatographyGC), and each of these coupled with mass spectrome-ry (LC–MS, CE–MS and GC–MS) [5–9]. Single dimension
ethods, however, often provide discriminating capabilityhat is too limiting. An emerging technology, comprehensivewo-dimensional gas chromatography coupled with time-of-ight mass spectrometry (GC × GC/TOF-MS), brings increasedeparation capacity, chemical selectivity and sensitivity foretabolomics analyses [10,11]. Compared with conventional
ne-dimensional GC, two-dimensional gas chromatographyffers significant advantages for analysis of complex sam-les: an order-of-magnitude increase in separation capacitydiscrimination of over 1000 peaks), significant increase in
ignal-to-noise ratio and dynamic range, and improvementf mass spectral deconvolution and similarity matches. SinceC × GC/TOF-MS can provide more analytical information,t represents an alternative analytical tool for analysis of
2 ogr. A
lt
dawtfldpsfmmm
gssGoormtpadt[oadscvbacSsarb
ismoTsgtmnGt
mCaRwds
2
2
owA0afpwUpS((GT
2
flTa fatty acid mixture with 10 �L of this amino acid mixture(FA + AA), and with 10 �L organic acid mixture (FA + OA).Eight FA + AA and eight FA + OA test samples were derivatizedwith 20 �L MTBSTFA for 30 min at 60 ◦C, respectively.
Table 1Standards used in experiments
Amino acid Fatty acid Organic acid
l-Alanine Hexanoic acid Isobutyric acidGlycine Heptanoic acid Butyric acidL-Valine Octanoic acid L-(+)Lactic acidL-Leucine Nonanoic acid Benzoic acidL-Isoleucine Decanoic acid Oxalic acidL-Methionine Undecanoic acid Malonic acidL-Serine Dodecanoic acid Maleic acidL-Threonine Tridecanoic acid Succinic acidL-Proline Tetradecanoic acid Fumaric acidL-Phenylalanine Pentadecanoic acid Adipic acidL-Aspartic acid Hexadecanoic acid d-Malic acidL-Glutamic acid Heptadecanoic acid d-Tartaric acidL-Lysine Octadecanoic acid Citric acid
06 C. Oh et al. / J. Chromat
ow-molecular-mass metabolites in complex biological sys-ems.
Although GC × GC/TOF-MS systems show high repro-ucibility of metabolite retention times in highly controlledpplications, retention times may still shift in two dimensionsithin certain variation windows as a result of several, some-
imes uncontrollable factors such as temperature and pressureuctuations, matrix effects on samples and stationary phaseegradation. Retention time shifts introduce difficulty in datarocessing for chemometric differential metabolomics analy-es because of the requirement that chromatographic peaksor a given analyte have the same retention time in all chro-atograms analyzed. Therefore, the retention time variationust be adjusted, i.e., aligned, before applying chemometricethods.Many sorting and/or alignment algorithms have been sug-
ested for one-dimensional retention time alignment but fewtudies have addressed two-dimensional gas chromatographyeparations. Fraga et al. developed a rank-based algorithm forC × GC retention time alignment based on the previous workf Prazen et al. [12]. Mispelaar et al. also developed a correlation-ptimized shifting-based algorithm for alignment of a localegion of a GC × GC chromatogram [13]. However, these twoethods only can be used to align small regions of interest in the
wo-dimensional data set and they both require a standard as aoint of reference. Recently, Pierce et al. proposed an alignmentlgorithm that can correct the entire chromatogram in both GCimensions [14]. The algorithm used a novel indexing schemeogether with a piecewise retention time alignment algorithm15–17], in which one chromatogram is used as the target andther chromatograms aligned to it. A chromatogram is defineds an M × N matrix where there are N units along the first columnimension and M units along the second column dimension. Aample chromatogram can be firstly indexed along the first GColumn dimension into M vectors, each N unit long. One of theectors is then projected into the target chromatogram indexedy the same means and aligned using the piecewise alignmentlgorithm. In this scheme all of the M vectors in the samplehromatogram can be aligned along the first column dimension.ubsequently, the sample chromatogram is indexed along theecond GC column dimension into N vectors, each M unit longnd these N vectors are also aligned by the above method. As aesult, the entire of GC × GC chromatogram can be aligned inoth retention time axes.
It is well known that thousands of metabolites may be presentn a biological sample. Some of these metabolites will haveimilar retention times in both dimensions. Therefore, aligningetabolite peaks based on retention time alone, whether in one-
r two-dimensions, may introduce false positive alignments.his situation worsens when complex samples such as humanerum or plant extracts are analyzed. Coupling two-dimensionalas chromatography with mass spectrometry not only increaseshe analytical peak capacity, but also provides more infor-
ation for reliable data analysis. In this paper, we report aew method for directly recognizing and sorting the peaks ofC × GC/TOF-MS experiments according to their retention
ime in both dimensions and the metabolite mass spectrum infor-
LLL
1179 (2008) 205–215
ation. Raw experimental data are first processed using LecohromaTOF software to generate peak tables. The proposedlgorithm was implemented in MSort software using MATLAB2006b. Compared with existing sorting and/or alignment soft-are, our method utilizes metabolite mass spectra generateduring electron impact to greatly reduce the false positive peakortings.
. Experiments
.1. Materials and reagents
An amino acid standard mixture, fatty acid standards,rganic acid standards, anhydrous pyridine and human serumere obtained from Sigma–Aldrich (St. Louis, MO, USA).mino acids were mixed at a concentration of 2.5 �mol/mL in.1 M HCl except l-cystine at 1.25 �mol/mL. The fatty acidsnd organic acids were prepared by mixing the 0.5 mg/mLatty acid standards and 0.5 mg/mL organic acid standards inyridine, respectively. Anhydrous methanol and chloroformere purchased from Mallinkrodt Baker (Phillipsburg, NJ,SA). The solution of ethoxyamine hydrochloride was pre-ared by dissolving 50 mg ethoxyamine hydrochloride fromigma–Aldrich in 1 mL pyridine. The derivatization reagentN-methyl-N-tert-butyldimethylsilyl)-trifluoroacetamideMTBSTFA) was obtained from Regis Technologies (Mortonrove, IL, USA). Standards used in experiment are listed inable 1.
.2. Derivatization
The amino acid mixture (200 �L) was dried with nitrogenow and redissolved in 100 �L pyridine before derivatization.wo type of test mixtures were prepared by mixing 10 �L of
-Histidine Nonadecanoic acid-Tyrosine Docosanoic acid-Cystine Tricosanoic acid
Tetracosanoic acid
atogr
2
wvacpa(Thdpa
2
eGMegPT5iscipTw1dcttss5tsasLNdLm
3
mi
CmiattCclfiftaca
tcimbdttosaamtciTfittnbicatcdtsf
R
t
C. Oh et al. / J. Chrom
.3. Extraction and derivatization of serum samples
Human serum aliquots (50 �L, 100 �L, 200 �L) were mixedith 400 �L organic solvent (water/methanol/chloroform, 2:5:2,/v/v) for removal of proteins. After sitting at room temper-ture for 1 h and sonication for 10 min, the mixtures wereentrifuged at 15 000 rpm to pellet the proteins. The liquidhases were collected and evaporated to dryness by SpeedVacnd then redissolved in 150 �L pyridine. The fatty acid mixture4 �L) was spiked in 20 �L aliquots of the three serum samples.hese mixtures were reacted with 10 �L 50 mg/mL ethoxyamineydrochloride solution for 30 min at 60 ◦C and subsequentlyerivatized with 20 �L MTBSTFA for 1 h at 60 ◦C. A blank wasrepared in parallel under the same conditions but without theddition of human serum and fatty acid mixture.
.4. GC × GC/TOF-MS analyses
Analyses of the derivatized standard mixtures and thextracted serum sample were performed using a Pegasus 4DC × GC/TOF-MS instrument (Leco Corporation, St. Joseph,I, USA) equipped with a cryogenic modulator. This instrument
mploys an Agilent 6890 gas chromatograph (Agilent Technolo-ies, Palo Alto, CA, USA) and the injector is a CTC CombiAL auto sampler (CTC Analytics, Zwingen, Switzerland).he first-dimension chromatographic column was a 10 m DB-capillary column ((5%-phenyl)-methylpolysiloxane) with an
nternal diameter of 180 �m and a film thickness of 0.18 �m. Theecond-dimension chromatographic column was a 1 m DB-17apillary column ((50%-phenyl)-methylpolysiloxane) with annternal diameter of 100 �m and a film thickness of 0.1 �m. Highurity helium was used as carrier gas at a flow rate of 1.0 mL/min.he first-dimension column oven temperature began at 50 ◦Cith a hold time of 0.2 min, then increased to 300 ◦C at a rate of0 ◦C/min and held at this temperature for 5 min. The second-imension column oven temperature was 20 ◦C higher than theorresponding first-dimension column oven temperature withhe same rate and hold time. The second-dimension separationime was set for 4 s. A solvent delay of 110 s was set up fortandard mixtures and 250 s for serum sample. Derivatizationolutions (2 �L) were injected at a split mode with a ratio of0:1 except for the serum samples injected at 20:1. The inletemperature and the transfer line were set at 280 ◦C. The ionource was held at 200 ◦C. The detector voltage was 1600 Vnd the filament bias was −70 V. Electron impact (EI) masspectra were collected from 50 to 800 m/z at 50 spectra/s. Theeco ChromaTOF software version 3.25 equipped with the USational Institutes of Standards and Technology (NIST) MSatabase (NIST MS Search 2.0, NIST/EPA/NIH Mass Spectralibrary; NIST 2002) was used for data processing and peakatching.
. Algorithm
We developed a peak sorting software package for experi-ental data generated on the Pegasus 4D GC × GC/TOF-MS
nstrument equipped with electron impact ionization (Leco
bf
p
. A 1179 (2008) 205–215 207
orporation, St. Joseph, MI, USA). Since metabolites are frag-ented during ionization, the mass information of the metabolite
s lost. The measured mass spectrum contains all fragmentsnd potentially the parent metabolite ions. The mass spectrumherefore provides a fingerprint of the metabolite chemical struc-ure. Raw data from the instrument are first processed by LecohromaTOF software to generate a peak table. This peak tableontains the features of each identified peak such as metabo-ite name (if determined), CAS registry number, peak area,rst-dimension retention time, second-dimension retention time,ragment spectrum, and statistical confidence of metabolite iden-ification. This information provides the input for our sortinglgorithm. Fig. 1 shows the flow chart of MSort software, whichontains three major functionalities: peak entry merging, sorting,nd contaminant elimination.
Peak entry merging is a preprocessing task carried out beforehe actual sorting process. In comprehensive two-dimensionalhromatography, a short sampling time in the second-dimensions prerequisite to obtain high two-dimensional resolution. This
eans that each separated peak in the first-dimension shoulde split into at least three or four fractions in the second-imension [18,19]. In our experiments, the short modulationime, e.g., 4 s, for the first-dimension retention time causes mul-iple peak entries for one chromatographic peak generated byne metabolite. For example, the chromatographic peak of theame metabolite may be split into two peak entries in one samplend three peak entries in another due to retention time shift orbundance change in two samples. Unequal splitting of a singleetabolite peak will prevent further data analysis in a differen-
ial metabolomics study. Therefore, peak entries from the samehromatographic peak must be merged so that each peak entryn the merged peak table represents one chromatographic peak.he peak entry merging process utilizes parameters such as therst-dimension retention time, the second-dimension retention
ime, the threshold of the spectrum correlation value (Rmin), andhe name of the identified metabolites (SID). Inclusion of theame of the identified metabolite (SID) in this process is optionalecause the metabolite identification may provide false positivedentification results. Users are thereby reminded to exerciseaution when employing the name of an ‘identified metabolite’s a criterion for peak entry merging. The spectrum correla-ion is calculated using Pearson’s correlation method. Pearsonorrelation coefficient (R) assumes that a linear function bestescribes the relationship between two variables. It can be usedo evaluate data for n subjects, each of which has contributed acore on two variables designated as X and Y. R is calculated asollows:
=∑
XY−(∑
X)(∑
Y)/n√[∑
X2−(∑
X)2
/n
][∑Y2−
(∑Y)2
/n
] (1)
In our sorting algorithm, X and Y are the intensities of thewo spectra that are compared with each other and n is the num-
er of data points in the spectra, i.e., the number of metaboliteragments.The peak entry merging algorithm is as follows. First, eacheak table is sorted by first-dimension retention time in ascend-

208 C. Oh et al. / J. Chromatogr. A 1179 (2008) 205–215
prov
ifiTtT
adorwmsusrNprmrtppeatrorbusm
ttiset
ilsIsdevritoottssvosmt
Fig. 1. Flow chart of MSort software. The right side
ng order. We choose the first peak entry (that has the smallestrst-dimension retention time) as the initial reference peak entry.hen, we seek a peak entry that satisfies the following condi-
ions: (1) |T 1c − T 1
r | ≤ �T1 and |T 2c − T 2
r | ≤ �T2, where T 1r and
1c are the first-dimension retention times of the reference peaknd the current peak in the search, T 2
r and T 2c are the second-
imension retention times, and �T1 and �T2 are the limitsf allowable first and second-dimension retention time drifts,espectively; (2) Rrc ≥ Rmin; and (3) optionally SIDr = SIDc,here Rrc is the Pearson’s correlation coefficient between theass spectra of the reference peak and the current peak in the
earch. Rmin is the threshold of Pearson correlation coefficientsed to determine if two fragment spectra are generated by theame metabolite. SIDr and SIDc are the metabolite names ofeference metabolite and current metabolite identified from theIST database search, respectively. In other words, we seek aeak entry of which not only the first and the second-dimensionetention times are close to those of the reference peak but alsoass spectrum is similar to that of the reference peak (high cor-
elation value), where Rmin is the threshold for the decision. Ifhe conditions above are satisfied, we conclude that the currenteak entry is from the same chromatographic peak as a referenceeak entry and put them in the same group. The current peakntry that was just found becomes a new reference peak entry,nd the same procedure continues until no peak entry is foundo satisfy the criteria. After a group of peak entries is set, weepresent them with one representative peak entry. The valuesf the first-dimension retention time and the second-dimensionetention time of the representative peak entry are determined
y the peak-area-weighted average values or by the median val-es of the member peaks, which is much more accurate thanimply using retention time of the largest peak to represent theetabolite peak location. The mass spectrum of the represen-tarr
ides details for information flow in the sorting step.
ative peak is calculated by the sum of all the mass spectra ofhe member peaks according to the m/z value of each fragmenton. After a group of peak entries is replaced with a single repre-entative peak, we repeat the procedure for the remaining peakntries until all the peak entries in the peak table are convertedo merged peaks.
The next step is a sorting process. The sorting algorithms based on the fact that in an ideal case, the same metabo-ites have the same first-dimension retention time, the sameecond-dimension retention time, and the same mass spectrum.n realistic experimental situations, however, the first and theecond-dimension retention times of the same metabolite mayiffer from experiment to experiment. To accommodate thisxperimental retention time shift, we adopted the retention timeariation window concept. That is, if the difference between theetention times of two metabolite peaks in different experimentss less than a specified value, the peaks are considered to belongo the same retention time window. In addition, the mass spectrabtained from the same metabolites should be similar to eachther. This motivated us to use the correlation value betweenwo fragment spectra as another search criterion. The values ofhe retention time variation window and the similarity of masspectra could be estimated from replicate analysis of the sameample. Although the metabolite name for each peak is pro-ided by Leco ChromaTOF software, we did not adopt it as onef our basic criteria for peak sorting, but left it as optional. Thisoftware searches the NIST spectral database to find the bestatch of the fragmentation spectrum of a peak. For example,
his search outputs the name of a metabolite whose spectrum is
he best match of the testing spectrum even if the spectrum oftrue metabolite is not in the database. With this approach, theeported metabolite may not be the actual metabolite that gaveise to the fragment spectrum.

atogr
mGtecsasepfisaOibtfii
(StSoS
|
|
R
S
wrsrstmStsipttts
r
s
T
T
a
S
wssswtficwdtoaa
ssiaTiitnpcw
dpapas
dmoop3tt
C. Oh et al. / J. Chrom
Multiple samples are usually analyzed in differentialetabolomics. Each of these samples will generate a peak table.iven the multiple peak tables, we first choose a table that has
he maximum number of merged metabolite peaks as a refer-nce table (RefTbl) to sort as many peaks as possible with theurrent reference table. We designate the rest of the tables asearch tables (SchTbl). Each peak in the reference table is sets a reference peak in each sorting task. The objective of eachorting task is to find the peaks in the search tables that were gen-rated from the same metabolite as the corresponding referenceeak. As discussed above, the basic sorting parameters are therst-dimension retention time variation window size (�T1), theecond-dimension retention time variation window size (�T2),nd the threshold of mass spectrum correlation value (Rmin).nce again, the reported name of the identified metabolites (SID)
s an optional parameter. The values of the basic parameters cane determined based on the performance of the instrument whilehe optional parameter can be employed based on the user’s con-dence with the identification. Information from the basic group
s used to limit the searching space in each input table.The sorting algorithm is as follows. After the reference table
RefTbl) is determined, the search tables are numbered fromchTbl1 to SchTbln−1, where n is the number of all the peakables. Then, the algorithm searches peaks in each search tablechTblk (k = 1, 2,. . ., n − 1) that satisfy the sorting criteria. Inther words, the algorithm searches peaks in the search tablechTblk such that:
T 1r − T 1
c | ≤ �T 1 (2)
T 2r − T 2
c | ≤ �T 2 (3)
rc ≥ Rmin (4)
and optionally
IDr = SIDc (5)
here T 1r and T 1
c are the first-dimension retention times of theeference peak in the reference table and the peak in the currentearch table respectively, T 2
r and T 2c are their second-dimension
etention times, Rrc is the correlation value between the masspectra of the reference peak and the peak in the current searchable, Rmin is a threshold of Pearson’s correlation coefficient of
ass spectra derived from sample metabolites, and SIDr andIDc are the identified names of the metabolites correspondingo the reference peak and the peak in the search table. If no peakatisfies the sorting criteria, we conclude that there is no peakn the search table SchTblk that could be sorted to the referenceeak in RefTbl. If there is one peak in the search table SchTblkhat satisfies the sorting criteria, we choose it as a sorted peak. Ifhere are multiple peaks in the search table SchTblk that satisfy
he sorting criteria, we choose a peak that has the highest masspectra correlation value as a sorted peak.If a sorted peak is found in the search table SchTblk, theeference values are updated as follows for searching the next
tbtt
. A 1179 (2008) 205–215 209
earch table SchTblk+1.
1rn = T 1
ro × Iro + T 1c × Ic
Iro + Ic(6)
2rn = T 2
ro × Iro + T 2c × Ic
Iro + Ic(7)
nd
rn = Sro + Sc (8)
here Iro is the sum of all the intensities of processed masspectra, Ic is the sum of all the intensities of current masspectrum, T 1
c and T 2c are the first dimensional and second dimen-
ional retention time, respectively. T 1ro and T 2
ro are the intensityeighted first dimensional and second dimensional retention
ime of processed spectra. T 1rn and T 2
rn are the intensity weightedrst dimensional and second dimensional retention time of pro-essed spectra and the current spectrum. In other words, theeighted averages using the total ion currents for the first-imension retention time and the second-dimension retentionime are used as new reference values. The sum of mass spectraf the reference peak (Sro) and the sorted peak (Sc) is used asnew reference mass spectrum (Srn). Note that Sro, Sc, and Srn
re vectors whose elements are the intensities of spectra.After the reference values are modified, the algorithm
earches the next search table SchTblk+1 to find the peak thatatisfies the criteria with the highest correlation value. If a peaks found in SchTblk+1, the reference values are modified as abovend the searching process is performed in the next search table.his process is continued until the algorithm finishes the search-
ng task in the last search table. All the sorted peaks are recordedn the sorting table, and removed from the reference table andhe search tables. The next peak in the reference table is set as aew reference peak and the same procedure is carried out. Thisrocess is repeated until all the peaks in the reference table areovered. Since the current reference table is empty at this point,e discard the empty table.Using the remaining tables, we repeat all the above proce-
ures. The peak table that contains the maximum number ofeaks is chosen as a new reference table and the rest are chosens new search tables. The subsequent steps described above areerformed using the new reference table and search tables. Thelgorithm stops when there is no remaining table in the searchingpace.
As an additional feature, we implemented a process toeal with metabolites that are not of interest. ‘Uninteresting’etabolites may be eliminated before or after the actual sorting
peration via two methods: elimination by the exclusion tabler elimination of sorted peaks using peak tables of blank sam-les. In Fig. 1, these methods are classified as Type 1, 2, andeliminations. The exclusion table contains the information of
he metabolites that are not of interest to the user. Type 1 ishe case where an exclusion table is provided that contains only
he names of the non-target metabolites; these are eliminatedefore the sorting process. In Type 2 elimination, the exclusionable with the names and the first and second-dimension reten-ion times of the non-target metabolites are provided. Non-target
2 ogr. A
mfitIacasc
4
iWgtodbs
FRm
Ltimptts
4m
fisto
10 C. Oh et al. / J. Chromat
etabolites are eliminated using the metabolite names and therst and second retention times after the sorting process. Use of
he peak tables generated by blank samples is Type 3 elimination.n this case, each peak table is generated for each blank samplend the peaks included in these peak tables are considered to beontaminants. Peak tables from blank samples are considereds ‘regular’ tables and included in the sorting procedure. Afterorting is finished, we remove the peaks that are sorted to theontaminant peaks in the blank samples.
. Results and discussion
Algorithms for GC × GC/TOF-MS peak sorting have beenmplemented in our MSort software using MATLAB R2006b.
e tested the performance of MSort with experimental data setsenerated from two distinct groups of samples. The first is a mix-ure of standard metabolites (Table 1); the second is a mixture
f standard metabolites in human serum. Fig. 2a shows the rawata obtained for a human serum sample, where 1535 peaks haveeen detected by Leco ChromaTOF software with the minimumignal to noise (S/N) ratio set at 10. Three peaks identified asig. 2. Three-dimensional visualization of raw GC × GC/TOF-MS data. (a)aw data from a serum sample. (b) Three distinct peaks identified by Chro-aTOF software as l-methionine (two of these are false positives).
mbroTltep‘m(rscviva
T
wwpiac−prphvo
vsle
1179 (2008) 205–215
-methionine are displayed in Fig. 2b. Manual validation showshat only one of these peaks is l-methionine, the other two arencorrectly identified. This is probably because the spectra of the
etabolites that correspond to the mis-identified peaks were notresent in the database. This illustrates the potential false posi-ive identification of metabolites and explains why we includedhe identified metabolite name as an optional parameter for peakorting in MSort.
.1. Analysis of data generated from standard metaboliteixtures
As described above, we used the value of the correlation coef-cient between two mass spectra as one of the criteria for theorting task. To determine the threshold (Rmin) of the mass spec-ra correlation coefficients, we manually picked all mass spectraf standard metabolites from 16 samples (mixture of standardetabolites) and calculated Pearson’s correlation coefficients
etween every mass spectrum pair. By this process 116,403 cor-elation values were generated. It should be noted that the rangef the Pearson’s correlation coefficient value is from −1 to 1.he closer two spectra are to each other, the closer the corre-
ation coefficient is to 1. We then studied the relation betweenrue positive rate (TPR) and false positive rate (FPR) at differ-nt correlation thresholds. ‘Positive’ in this context means that aair of mass spectra is from the same metabolite. Accordingly,negative’ means that a pair of mass spectra is from the differentetabolites. Since the mass spectra from the same metabolites
positive case) are usually very similar to each other, the cor-elation coefficient for the positive pair is high. Hence, we canet a threshold and classify a pair of mass spectra with a higherorrelation value than the threshold as positive. If the correlationalue of two mass spectra is lower than the threshold, the pairs classified as negative. After the calculation of the correlationalue for every pair of spectra, we can obtain TPR and FPR forgiven threshold using the following:
PR = TP
TP + FNand FPR = FP
FP + TN, (9)
here TP (true positive) is the number of positive pairs thatere classified as positive, FN (false negative) is the number ofositive pairs that were classified as negative, FP (false positive)s the number of negative pairs that were classified as positive,nd TN (true negative) is the number of negative pairs that werelassified as negative. While changing the threshold value from1 to 1, we calculated the values of FPRs and TPRs, where each
air of (FPR, TPR) corresponds to a specific threshold value. Theeceiver operating characteristic (ROC) curve obtained by thisrocess is shown in Fig. 3. Since every point on the ROC curveas a corresponding threshold value, we can decide the thresholdalue that achieves specific TPR and FPR by choosing a pointn the curve.
Using the ROC curve, we set the threshold of correlation
alue as 0.95, which resulted in TPR = 0.92 and FPR = 0.11. Ithould be noted that the actual FPR value is expected to be muchess than 0.11 since metabolite retention time was not consid-red in calculation of the correlation coefficients. Two distinct
C. Oh et al. / J. Chromatogr. A 1179 (2008) 205–215 211
Fig. 3. Receiver operating characteristic (ROC) curve (TPR: true positive rate,FPR: false positive rate). ‘Positive’ in this plot means that a pair of mass spectrais from the same metabolite. The TPR is the rate that pairs of mass spectrafrom the same metabolite are correctly assigned to that metabolite. The FPRis the rate that pairs of mass spectra from different metabolites are incorrectlyccp
mmneF
aowmwift
es�
apspopotoogetTi
Fig. 4. (a) The number of peak entries in a row of the sorting table versus thenumber of rows in the sorting table. (b) The box plot for the peak area. Theupper end of the upper whisker is the maximum of the average peak area, theupper end of the box is the upper quartile, the lower end of the box is the lowerqt
pe
draootaTut
lassified arising from the same metabolites. Each point on the ROC plot has aorresponding threshold value (ThCorr). Therefore, by choosing a point on thelot, we can obtain the threshold value that achieves specific TPR and FPR.
etabolites may share a high correlation coefficient but willost likely have distinct retention times. Such metabolites will
ot interfere with each other during the sorting process. How-ver, such pairs of metabolites are included in our calculation ofPR.
We tested the sorting algorithm with a mixture of fatty acidsnd amino acids (FA + AA), and a mixture of fatty acids andrganic acids (FA + OA) listed in Table 1. The 16 peak tables,hich were generated by eight replicate samples of the FA + AAixture and another eight replicate samples of FA + OA mixture,ere used for sorting. In our tests, an exclusion table contain-
ng 35 metabolite names was used to demonstrate the softwareeature to filter the metabolites listed in the exclusion list beforehe sorting operation (Type 1 elimination).
The sorting table generated by MSort is organized such thatach column represents a sample and each row represents aet of sorted metabolites. With parameters �T 1 = 0.01 × T 1
r ,T 2 = 0.05 × T 2
r , Rmin = 0.95, and SID = false, MSort gener-ted a sorting table with 8683 rows, that is, 8683 sets of sortedeaks. Fig. 4a indicates that many of the rows include only amall number of entries in the sorting table. More than 6900eaks were detected in only one of the 16 samples. For each setf sorted peaks (i.e., each row of the sorting table), the averageeak area is calculated. This area value is then classified intone of the 16 groups corresponding to the number of entries inhe row of the sorting table. For example, the average area valuebtained from a row with 10 peak entries becomes a memberf group 10. Since there are 16 analyte samples, we have 16roups, because a row in the sorting table can have 1–16 peak
ntries. This process is performed for all rows in the sorting tableo obtain the distribution of average peak areas in each group.he distribution of the average areas is illustrated in a box plotn Fig. 4b. The rows with a small number of entries have small
ptsa
uartile, the lower end of the lower whisker is the minimum, and the bar insidehe box is the median.
eak areas. These are likely to be random peaks and should bexcluded for further analysis.
We set the minimum signal to noise ratio (S/N) at 10 for peaketection. At this setting the ChromaTOF instrument softwareeported about 2500 peaks in each sample. Many of these peaksre clearly noise with very low confidence identifications; thether intense peaks may arise from the derivatization reagentr GC column artifacts. Just a few peaks from the derivatiza-ion reagent would appear in very many slices because of largemount of the reagent. These peaks usually elute before 225 s.he GC column artifacts may generate many bleed peaks thatsually elute during last 5–10 min of separation. About 700 ofhe reported peaks have an S/N larger than 100 while only 200eaks have a S/N larger than 1000. From manual validation of
hese data, we have determined that the S/N values of most of thetandard acids are in the range of 1500–31000. However, therere several standards with S/N less than 1500; heptanoic acid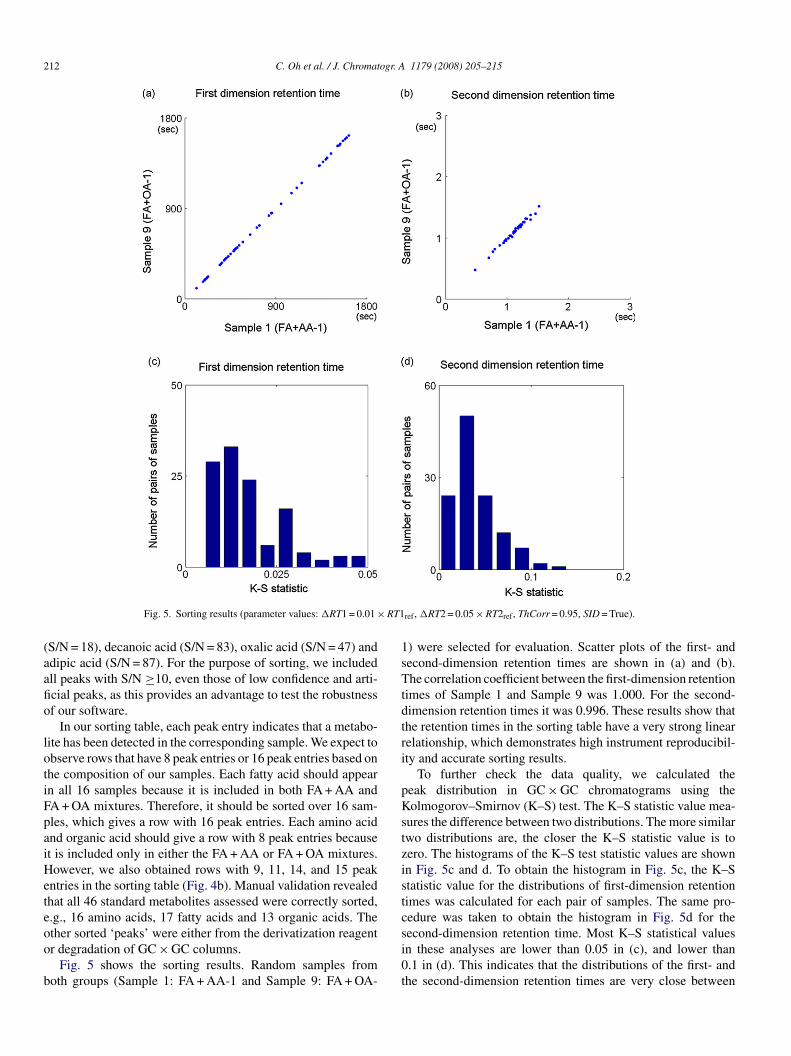
212 C. Oh et al. / J. Chromatogr. A 1179 (2008) 205–215
RT1
(aafio
lotiFpaiHeteoo
b
1sTtdtri
pKstzistc
Fig. 5. Sorting results (parameter values: �RT1 = 0.01 ×
S/N = 18), decanoic acid (S/N = 83), oxalic acid (S/N = 47) anddipic acid (S/N = 87). For the purpose of sorting, we includedll peaks with S/N ≥10, even those of low confidence and arti-cial peaks, as this provides an advantage to test the robustnessf our software.
In our sorting table, each peak entry indicates that a metabo-ite has been detected in the corresponding sample. We expect tobserve rows that have 8 peak entries or 16 peak entries based onhe composition of our samples. Each fatty acid should appearn all 16 samples because it is included in both FA + AA andA + OA mixtures. Therefore, it should be sorted over 16 sam-les, which gives a row with 16 peak entries. Each amino acidnd organic acid should give a row with 8 peak entries becauset is included only in either the FA + AA or FA + OA mixtures.owever, we also obtained rows with 9, 11, 14, and 15 peak
ntries in the sorting table (Fig. 4b). Manual validation revealedhat all 46 standard metabolites assessed were correctly sorted,.g., 16 amino acids, 17 fatty acids and 13 organic acids. The
ther sorted ‘peaks’ were either from the derivatization reagentr degradation of GC × GC columns.Fig. 5 shows the sorting results. Random samples fromoth groups (Sample 1: FA + AA-1 and Sample 9: FA + OA-
si0t
ref, �RT2 = 0.05 × RT2ref, ThCorr = 0.95, SID = True).
) were selected for evaluation. Scatter plots of the first- andecond-dimension retention times are shown in (a) and (b).he correlation coefficient between the first-dimension retention
imes of Sample 1 and Sample 9 was 1.000. For the second-imension retention times it was 0.996. These results show thathe retention times in the sorting table have a very strong linearelationship, which demonstrates high instrument reproducibil-ty and accurate sorting results.
To further check the data quality, we calculated theeak distribution in GC × GC chromatograms using theolmogorov–Smirnov (K–S) test. The K–S statistic value mea-
ures the difference between two distributions. The more similarwo distributions are, the closer the K–S statistic value is toero. The histograms of the K–S test statistic values are shownn Fig. 5c and d. To obtain the histogram in Fig. 5c, the K–Statistic value for the distributions of first-dimension retentionimes was calculated for each pair of samples. The same pro-edure was taken to obtain the histogram in Fig. 5d for the
econd-dimension retention time. Most K–S statistical valuesn these analyses are lower than 0.05 in (c), and lower than.1 in (d). This indicates that the distributions of the first- andhe second-dimension retention times are very close between
C. Oh et al. / J. Chromatogr. A 1179 (2008) 205–215 213
F RT1 =a show
sa
4s
m2mwco
pStdpT
pa
brpassa
To further study the performance of MSort, we analyzed thesimilarity of the fragment spectra of all full entries with full sort-ing. First, we picked up the rows with a complete entry (15 peakentries) from the sorting table. Then, we calculated the corre-
Table 2Correlation coefficients between the samples for the first- and the second-dimension retention times in Fig. 6
(a) (b) (c) (d)
Correlation coefficient betweenSamples 1 and 6
1.000 0.999 1.000 0.972
ig. 6. Sorting results from Samples 1, 6, and 11 with sorting parameter values �
nd second-dimension retention times with SID = True, respectively. (c) and (d)
amples, which suggests that the sorting results are quiteccurate.
.2. Analysis of data generated from mixtures of humanerum and fatty acids
We tested our algorithm with another set of data from threeixtures of human serum and fatty acids (50 �L, 100 �L, and
00 �L of human serum combined with 4 �L of the fatty acidixture). Each mixture was experimentally analyzed five timesith 2 �L injections. In this experimental design, we varied the
oncentration of fatty acids in human serum to test the sensitivityf our sorting algorithms.
Fig. 6 shows the sorting results from these test data. Weicked up one sample from each group (50-Serum + FA, 100-erum + FA, and 200-Serum + FA) respectively, and obtained
he three-dimensional scatter plots for both the first- and second-imension retention times of all sorted entries. Sorting was
erformed with parameters �T 1 = 0.01 × T 1r , �T 2 = 0.05 ×2r , Rmin = 0.95, and SID = True (Fig. 6(a) and (b)), and witharameters �T 1 = 0.01 × T 1
r , �T 2 = 0.05 × T 2r , Rmin = 0.95,
nd SID = False (Fig. 6(c) and (d)). The correlation coefficients
C
C
0.01 × RT1ref, �RT2 = 0.05 × RT2ref, ThCorr = 0.95. (a) and (b) show the firstthe first and second-dimension retention times with SID = False, respectively.
etween the samples for the first- and the second-dimensionetention times in Fig. 6 are summarized in Table 2. The sortingerformances for the first-dimension retention time (Fig. 6(a)nd (c)) were almost the same regardless of the SID optionelection. However, for the second-dimension retention time, theorting performance with SID = True was slightly better (Fig. 6bnd d).
orrelation coefficient betweenSamples 6 and 11
1.000 0.999 1.000 0.967
orrelation coefficient betweenSamples 11 and 1
1.000 0.999 1.000 0.981

214 C. Oh et al. / J. Chromatogr. A
Fig. 7. Box plots of the correlation coefficients between fragment spectra. Theupper end of the upper whisker is the maximum of the correlation coefficient,the upper end of the box is the upper quartile, the lower end of the box istt�
ltoorctdr1rrt
amMftdadrustrWsmatessb
cs
bttiscopttwbls
5
tberisTpsio
A
fwt
R
he lower quartile, the lower end of the lower whisker is the minimum, andhe bar inside the box is the median. (Parameter values: �RT1 = 0.01 × RT1ref,
RT2 = 0.05 × RT2ref, ThCorr = 0.95, and SID = True.).
ation coefficient between each pair of fragment spectra withinhe same row. Since there are 105 (=15 × 14/2) pairs, we couldbtain 105 different values of the correlation coefficients fromne row. We repeated the same procedure for all the selectedows. Finally, we drew the box plot for the distribution of theorrelation coefficients (Fig. 7) demonstrating the similarity ofhe fragment spectra of the sorted peaks. Each box illustrates theistribution of the 105 correlation coefficients for each selectedow. All the values of correlation coefficients are very close to.0 even though our threshold of correlation was set 0.95. Thisesult again demonstrates high performance of our sorting algo-ithm. We also manually checked the sorting table and concludedhat all of fatty acid standards were correctly sorted.
Most of current available GC or GC × GC alignmentlgorithms perform chromatogram alignment, e.g., aligningetabolites based on retention time. It should be noted thatSort algorithm does not include chromatogram alignment
unctionality. Based on our experience, the retention time shift ofhe same metabolite in the Leco GC × GC/TOF-MS instrumentoes not have significant variation during the entire separationnd the overall retention time drift is less than 1% for the firstimensional retention time and 4% for the second dimensionaletention time for replicate continuous runs. For this reason, theser predefined retention time variation windows for the first andecond dimensional retention times are used to set a retentionime rectangular, i.e., retention time box, in the two-dimensionaletention time map of the other sample, e.g., the search sample.
e expect that the true corresponding metabolite peak in theearch sample presents in this retention time box. Then, theetabolite fragment spectrum in the reference sample is used
s the key criterion for find the right metabolite peak from peakable of the search sample, which is done by studying the lin-
ar correlation between the fragment spectrum of the referenceample with the fragment spectra of every peaks of the searchample present in the retention time box. The peak that has theest correlation score in the search sample is then selected the[[[
1179 (2008) 205–215
andidate peak that corresponding to the peak in the referenceample.
The size of user defined retention time box affects the relia-ility and efficiency of MSort software. If the size of retentionime box is smaller than the actual retention time shift betweenhe reference sample and the search sample, the true correspond-ng peak may not present in the retention time box in the searchample and therefore, will not be selected. MSort will treat theurrent peak as a missing peak in the search sample. If the sizef retention time box is much larger than it should be, moreeaks in the search table will be analyzed. This will increasehe sorting space in the search sample and therefore, increasehe computing time. However, the large retention time boxill not introduce either false positive or false negative sortingecause MSort selects a peak from the search table that has theargest spectral correlation with the current peak in the referenceample.
. Conclusions
Metabolomics profiling has been widely used to obtain quan-itative information about expression of small molecules iniological systems. The GC × GC/TOF-MS instrument empow-rs metabolomics profiling studies with high reproducibility,esolution, and analysis power. We have developed MSort, annformatics tool to find metabolite peaks generated from theame metabolite but detected in different biological samples.he developed software has been tested with two types of sam-les; a mixture of standard metabolites, and a mixture of humanerum and standard metabolites. Our analysis showed that MSorts able to sort metabolite peaks generated from these two typesf samples with very high accuracy.
cknowledgements
The authors thank Dr. Mark Merrick at Leco Corporationor his advice in data analysis of using Leco ChromaTOF soft-are. This project was supported by National Institute of Health
hrough grant NIH DK070290.
eferences
[1] G.G. Harrigan, R. Goodacre (Eds.), Metabolic Profiling: Its Role inBiomarker Discovery and Gene Function Analysis, Kluwer, Boston, MA,2003, p. 171.
[2] S.M. Watkins, J.B. German, Curr. Opin. Mol. Ther. 4 (2002) 224.[3] T. Dunckley, K.D. Coon, D.A. Stephan, Drug Discov. Today 10 (2005) 326.[4] G.G. Harrigan, R. Goodacre (Eds.), Metabolic Profiling: Its Role in
Biomarker Discovery and Gene Function Analysis, Kluwer, Boston, MA,2003, p. 199.
[5] W.B. Dunn, D.I. Ellis, Trends Anal. Chem. 24 (2005) 285.[6] J. Kopka, J. Biotechnol. 124 (2006) 312.[7] I.D. Wilson, R. Plumb, J. Granger, H. Major, R. Williams, E.M. Lenz, J.
Chromatogr. B 817 (2005) 67.[8] E.C. Soo, A.J. Aubry, S.M. Logan, P. Guerry, J.F. Kelly, N.M. Young, P.
Thibault, Anal. Chem. 76 (2004) 619.[9] E.M. Lenz, I.D. Wilson, J. Proteome Res. 6 (2007) 443.10] P. Marriott, R. Shellie, Trends Anal. Chem. 21 (2002) 573.11] R.A. Shellie, Aust. J. Chem. 58 (2005) 619.12] C.G. Fraga, B.J. Prazen, R.E. Synovec, Anal. Chem. 73 (2001) 5833.

atogr
[
[
[
[
C. Oh et al. / J. Chrom
13] V.G.V. Mispelaar, A.C. Tas, A.K. Smilde, P.J. Schoenmakers, A.C. van
Asten, J. Chromatogr. A1019 (2003) 15.14] K.M. Pierce, L.F. Wood, B.W. Wright, R.E. Synovec, Anal. Chem. 77(2005) 7735.
15] N.E. Watson, M.M. VanWingerden, K.M. Pierce, B.W. Wright, R.E. Syn-ovec, J. Chromatogr. A 1129 (2006) 111.
[
[[
. A 1179 (2008) 205–215 215
16] K.M. Pierce, J.L. Hope, J.C. Hoggard, K.J. Johnson, B.W. Wright, R.E.
Synovec, J. Chromatogr. A 1096 (2005) 101.17] K.M. Pierce, B.W. Wright, R.E. Synovec, J. Chromatogr. A 1141 (2007)106.
18] R.E. Murphy, M.R. Schure, J.P. Foley, Anal. Chem. 70 (1998) 1585.19] P. Schoenmakers, P. Marriot, J. Beens, LC–GC Eur. 16 (2003) 335.
Copyright © 2022 FDOKUMEN