Multicenter trial of fluoxetine as an adjunct to behavioral smoking cessation treatment
Upload
independentCategory
view
2download
0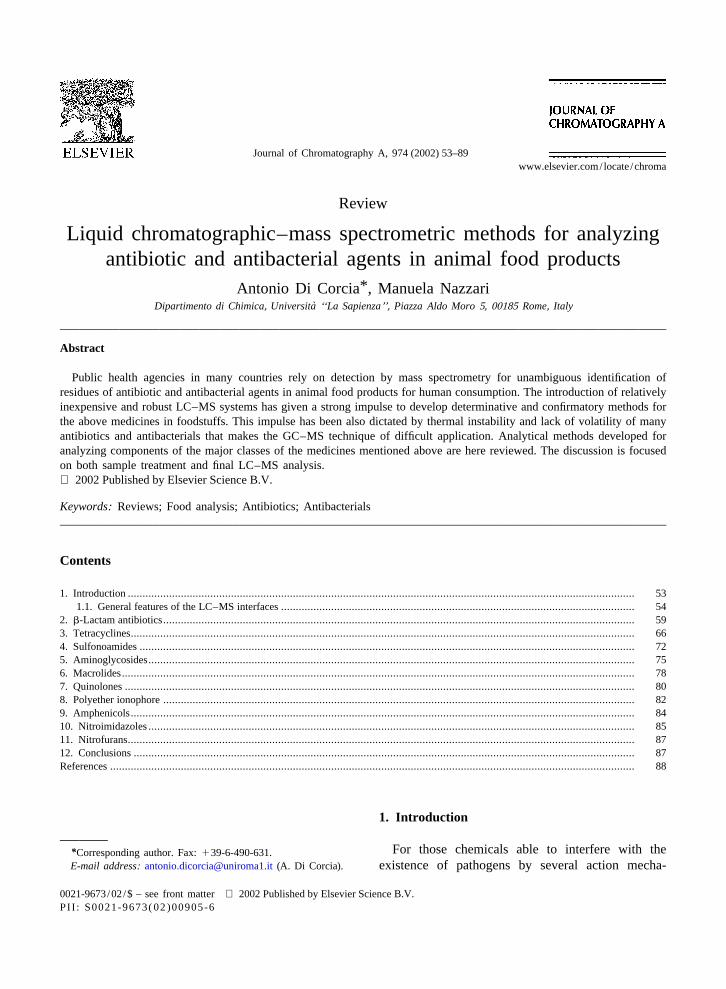
Journal of Chromatography A, 974 (2002) 53–89www.elsevier.com/ locate/chroma
Review
L iquid chromatographic–mass spectrometric methods for analyzingantibiotic and antibacterial agents in animal food products
*Antonio Di Corcia , Manuela Nazzari`Dipartimento di Chimica, Universita ‘‘ La Sapienza’’, Piazza Aldo Moro 5, 00185Rome, Italy
Abstract
Public health agencies in many countries rely on detection by mass spectrometry for unambiguous identification ofresidues of antibiotic and antibacterial agents in animal food products for human consumption. The introduction of relativelyinexpensive and robust LC–MS systems has given a strong impulse to develop determinative and confirmatory methods forthe above medicines in foodstuffs. This impulse has been also dictated by thermal instability and lack of volatility of manyantibiotics and antibacterials that makes the GC–MS technique of difficult application. Analytical methods developed foranalyzing components of the major classes of the medicines mentioned above are here reviewed. The discussion is focusedon both sample treatment and final LC–MS analysis. 2002 Published by Elsevier Science B.V.
Keywords: Reviews; Food analysis; Antibiotics; Antibacterials
Contents
1 . Introduction ............................................................................................................................................................................ 531 .1. General features of the LC–MS interfaces ........................................................................................................................ 54
2 . b-Lactam antibiotics................................................................................................................................................................ 593 . Tetracyclines........................................................................................................................................................................... 664 . Sulfonoamides ........................................................................................................................................................................ 725 . Aminoglycosides..................................................................................................................................................................... 756 . Macrolides.............................................................................................................................................................................. 787 . Quinolones ............................................................................................................................................................................. 808 . Polyether ionophore ................................................................................................................................................................ 829 . Amphenicols........................................................................................................................................................................... 841 0. Nitroimidazoles ..................................................................................................................................................................... 851 1. Nitrofurans............................................................................................................................................................................ 871 2. Conclusions .......................................................................................................................................................................... 87References .................................................................................................................................................................................. 88
1 . Introduction
For those chemicals able to interfere with the*Corresponding author. Fax:139-6-490-631.E-mail address: [email protected](A. Di Corcia). existence of pathogens by several action mecha-
0021-9673/02/$ – see front matter 2002 Published by Elsevier Science B.V.PI I : S0021-9673( 02 )00905-6
54 A. Di Corcia, M. Nazzari / J. Chromatogr. A 974 (2002) 53–89
nisms, an old and not yet abandoned classification of a commonly used antibiotic class, that isb-lactamreserves the term ‘antibiotics’ to natural or semi- antibiotics, in milk and concluded that none of thesynthetic compounds, while synthetic ones are tested procedures satisfied the requirements for atermed ‘antibacterials’. In this review, this classifica- suitable and reliable multiresidue confirmatory meth-tion will not be adopted and the term ‘antibiotic’ will od.refer to any pharmaceutical able to act against Public Health Agencies in many countries reliesbacteria. The use of antibiotics in veterinary medi- on detection by mass spectrometry (MS) for un-cine began in the 1950s with the use of oxytet- ambiguous confirmation of antibiotics in foodstuff.racycline and chlortetracycline as feed additives. The Commission Decision 93/256/EEC states thatToday, many classes of antibiotics are widely used ‘‘Methods based only on chromatographic analysisfor preventing and treating several diseases as well without the use of molecular spectrometric detectionas for promoting growth in food producing animals. are not suitable for use as confirmatory methods’’.In the 1980s, it was estimated that at least 60% of all Gas chromatography–mass spectrometry (GC–MS)animals used for food were exposed to antibiotics at should be the technique of choice, as it has beensome point in their lives. With current intense animal routinely used in the last 35 years for analyzing anhusbandry practices, this figure may be higher. enormous number of compounds in a variety of
If recommendations for drug withdrawal times are matrices. However, almost all of the antibiotics arenot respected, there is a significant risk of detecting very polar and/or thermally unstable compounds,antibiotic residues in food. Moreover, some of the thus complicating or precluding their analysis byantibiotics can be added directly to food, mainly to GC. Research in new methodologies in MS, notablymilk, to prolong its freshness. Relatively high levels LC–MS, has greatly benefited from the internationalof antibiotic residues in foodstuff can provoke need of protecting food quality and now can serve toallergic reactions in some hypersensitive individuals. fulfill the goals initially sought by such a technique,Of particular concern is that low-level doses of that is monitoring non volatile and polar targetantibiotics for long periods could result in antibiotic- compounds with the specificity and sensitivity simi-resistant bacteria that can transfer from food to lar to GC–MS. In the past 20 years, a large varietyhumans [1]. In addition to immediate adverse effects, of interfaces have been developed to make the highthere are also long-term effects to the exposure of vacuum of the mass analyzer compatible with thelow levels of residue that are still unknown. large amounts of liquids coming out from the LC
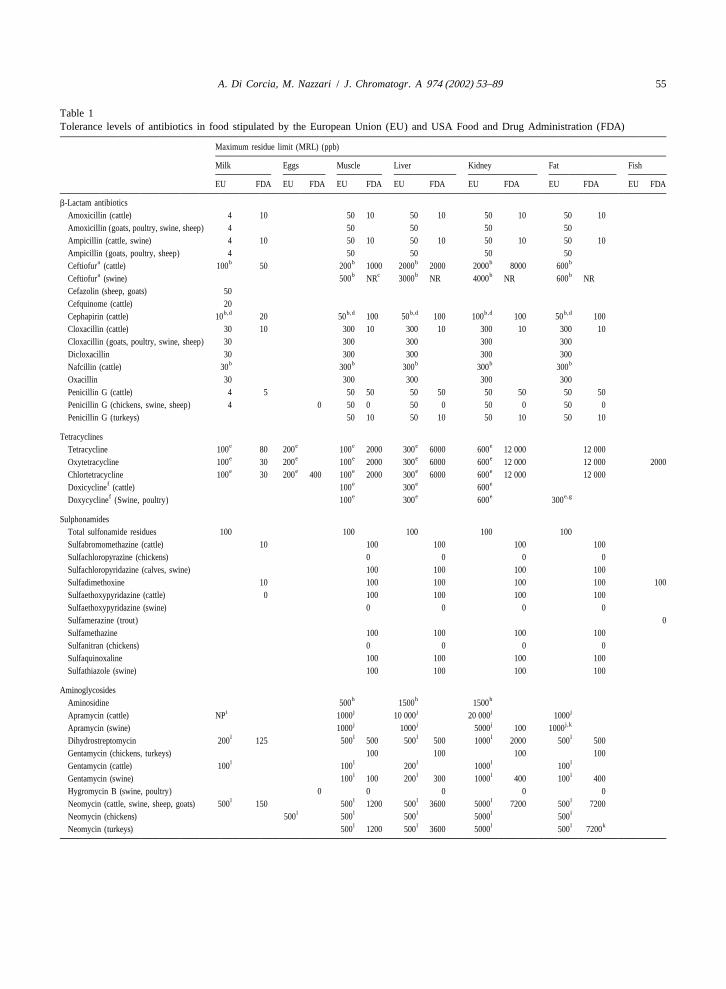
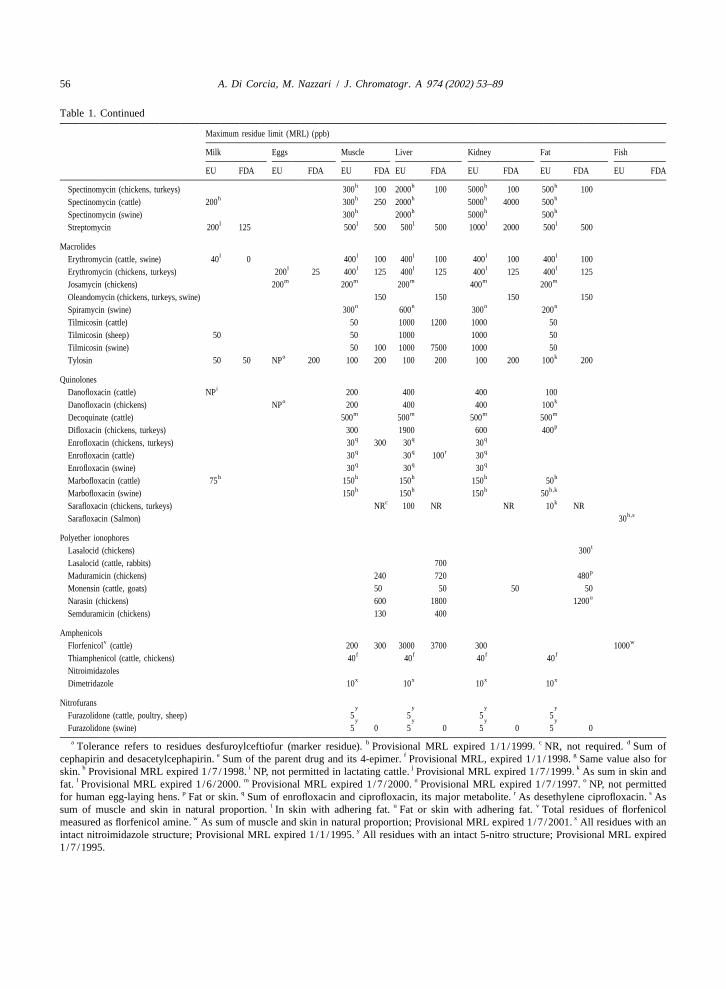
To minimize exposure of humans to antibiotics, column. LC–MS has been extensively reviewed intolerance levels of antibiotics in food have been the past years. Several books [3–8] and reviewestablished by both the European Union and US papers [9–14] devoted to illustrating principles,Food and Drug Administration (Table 1). instrumentations and applications of LC–MS have
For detecting antibiotic residues in food, bioassay been published. In particular, the use of LC–MS fortechniques are widely used in screening methods. analyzing antibiotics in food was reviewed in 1998These methods generally do not distinguish between [15,16]. It is the general opinion that, among themembers of a class of antibiotics, they provide only various interfaces developed in the last 25 years,semiquantitative measurements of residues detected thermospray (TS), particle beam (PB) electrosprayand sometimes give rise to false positives. Neverthe- (ESI) and atmospheric pressure chemical ionizationless, they continue to be used because of their (APCI) are the most effective for coupling to LCsimplicity and cheapness. But, before samples are instrumentation. Here, we will shortly describe typi-condemned for containing levels of antibiotics ex- cal characteristics, qualities and faults of these threeceeding the tolerance levels, it is well recognized devices.these methods need to be supported by highlyselective and sufficiently sensitive chemical methods. 1 .1. General features of the LC–MS interfacesCarson et al. [2] evaluated several proposed gaschromatographic and liquid chromatographic (LC) The TS interface can accommodate reversed-phasemethods using conventional detectors for the analysis solvents and any volatile buffer. Among the three
A. Di Corcia, M. Nazzari / J. Chromatogr. A 974 (2002) 53–89 55
Table 1Tolerance levels of antibiotics in food stipulated by the European Union (EU) and USA Food and Drug Administration (FDA)
Maximum residue limit (MRL) (ppb)
Milk Eggs Muscle Liver Kidney Fat Fish
EU FDA EU FDA EU FDA EU FDA EU FDA EU FDA EU FDA
b-Lactam antibioticsAmoxicillin (cattle) 4 10 50 10 50 10 50 10 50 10Amoxicillin (goats, poultry, swine, sheep) 4 50 50 50 50Ampicillin (cattle, swine) 4 10 50 10 50 10 50 10 50 10Ampicillin (goats, poultry, sheep) 4 50 50 50 50
a b b b b bCeftiofur (cattle) 100 50 200 1000 2000 2000 2000 8000 600a b c b b bCeftiofur (swine) 500 NR 3000 NR 4000 NR 600 NR
Cefazolin (sheep, goats) 50Cefquinome (cattle) 20
b,d b,d b,d b,d b,dCephapirin (cattle) 10 20 50 100 50 100 100 100 50 100Cloxacillin (cattle) 30 10 300 10 300 10 300 10 300 10Cloxacillin (goats, poultry, swine, sheep) 30 300 300 300 300Dicloxacillin 30 300 300 300 300
b b b b bNafcillin (cattle) 30 300 300 300 300Oxacillin 30 300 300 300 300Penicillin G (cattle) 4 5 50 50 50 50 50 50 50 50Penicillin G (chickens, swine, sheep) 4 0 50 0 50 0 50 0 50 0Penicillin G (turkeys) 50 10 50 10 50 10 50 10
Tetracyclinese e e e eTetracycline 100 80 200 100 2000 300 6000 600 12 000 12 000e e e e eOxytetracycline 100 30 200 100 2000 300 6000 600 12 000 12 000 2000e e e e eChlortetracycline 100 30 200 400 100 2000 300 6000 600 12 000 12 000
f e e eDoxicycline (cattle) 100 300 600f e e e e,gDoxycycline (Swine, poultry) 100 300 600 300
SulphonamidesTotal sulfonamide residues 100 100 100 100 100Sulfabromomethazine (cattle) 10 100 100 100 100Sulfachloropyrazine (chickens) 0 0 0 0Sulfachloropyridazine (calves, swine) 100 100 100 100Sulfadimethoxine 10 100 100 100 100 100Sulfaethoxypyridazine (cattle) 0 100 100 100 100Sulfaethoxypyridazine (swine) 0 0 0 0Sulfamerazine (trout) 0Sulfamethazine 100 100 100 100Sulfanitran (chickens) 0 0 0 0Sulfaquinoxaline 100 100 100 100Sulfathiazole (swine) 100 100 100 100
Aminoglycosidesh h hAminosidine 500 1500 1500
i j j j jApramycin (cattle) NP 1000 10 000 20 000 1000j j j j,kApramycin (swine) 1000 1000 5000 100 1000
l l l l lDihydrostreptomycin 200 125 500 500 500 500 1000 2000 500 500Gentamycin (chickens, turkeys) 100 100 100 100
l l l l lGentamycin (cattle) 100 100 200 1000 100l l l lGentamycin (swine) 100 100 200 300 1000 400 100 400
Hygromycin B (swine, poultry) 0 0 0 0 0l l l l lNeomycin (cattle, swine, sheep, goats) 500 150 500 1200 500 3600 5000 7200 500 7200
l l l l lNeomycin (chickens) 500 500 500 5000 500l l l l kNeomycin (turkeys) 500 1200 500 3600 5000 500 7200
56 A. Di Corcia, M. Nazzari / J. Chromatogr. A 974 (2002) 53–89
Table 1. Continued
Maximum residue limit (MRL) (ppb)
Milk Eggs Muscle Liver Kidney Fat Fish
EU FDA EU FDA EU FDA EU FDA EU FDA EU FDA EU FDA
h h h hSpectinomycin (chickens, turkeys) 300 100 2000 100 5000 100 500 100h h h h hSpectinomycin (cattle) 200 300 250 2000 5000 4000 500
h h h hSpectinomycin (swine) 300 2000 5000 500l l l l lStreptomycin 200 125 500 500 500 500 1000 2000 500 500
Macrolidesl l l l lErythromycin (cattle, swine) 40 0 400 100 400 100 400 100 400 100
l l l l lErythromycin (chickens, turkeys) 200 25 400 125 400 125 400 125 400 125m m m m mJosamycin (chickens) 200 200 200 400 200
Oleandomycin (chickens, turkeys, swine) 150 150 150 150n n n nSpiramycin (swine) 300 600 300 200
Tilmicosin (cattle) 50 1000 1200 1000 50Tilmicosin (sheep) 50 50 1000 1000 50Tilmicosin (swine) 50 100 1000 7500 1000 50
o kTylosin 50 50 NP 200 100 200 100 200 100 200 100 200
QuinolonesiDanofloxacin (cattle) NP 200 400 400 100
o kDanofloxacin (chickens) NP 200 400 400 100m m m mDecoquinate (cattle) 500 500 500 500
pDifloxacin (chickens, turkeys) 300 1900 600 400q q qEnrofloxacin (chickens, turkeys) 30 300 30 30q q r qEnrofloxacin (cattle) 30 30 100 30q q qEnrofloxacin (swine) 30 30 30
h h h h hMarbofloxacin (cattle) 75 150 150 150 50h h h h,kMarbofloxacin (swine) 150 150 150 50
c kSarafloxacin (chickens, turkeys) NR 100 NR NR 10 NRh,sSarafloxacin (Salmon) 30
Polyether ionophorestLasalocid (chickens) 300
Lasalocid (cattle, rabbits) 700pMaduramicin (chickens) 240 720 480
Monensin (cattle, goats) 50 50 50 50uNarasin (chickens) 600 1800 1200
Semduramicin (chickens) 130 400
Amphenicolsv wFlorfenicol (cattle) 200 300 3000 3700 300 1000
f f f fThiamphenicol (cattle, chickens) 40 40 40 40Nitroimidazoles
x x x xDimetridazole 10 10 10 10
Nitrofuransy y y y
Furazolidone (cattle, poultry, sheep) 5 5 5 5y y y y
Furazolidone (swine) 5 0 5 0 5 0 5 0
a b c dTolerance refers to residues desfuroylceftiofur (marker residue). Provisional MRL expired 1/1/1999. NR, not required. Sum ofe f gcephapirin and desacetylcephapirin. Sum of the parent drug and its 4-epimer. Provisional MRL, expired 1/1/1998. Same value also for
h i j kskin. Provisional MRL expired 1/7/1998. NP, not permitted in lactating cattle. Provisional MRL expired 1/7/1999. As sum in skin andl m n ofat. Provisional MRL expired 1/6/2000. Provisional MRL expired 1/7/2000. Provisional MRL expired 1/7/1997. NP, not permitted
p q r sfor human egg-laying hens. Fat or skin. Sum of enrofloxacin and ciprofloxacin, its major metabolite. As desethylene ciprofloxacin. Ast u vsum of muscle and skin in natural proportion. In skin with adhering fat. Fat or skin with adhering fat. Total residues of florfenicol
w xmeasured as florfenicol amine. As sum of muscle and skin in natural proportion; Provisional MRL expired 1/7/2001. All residues with anyintact nitroimidazole structure; Provisional MRL expired 1/1/1995. All residues with an intact 5-nitro structure; Provisional MRL expired
1/7/1995.
A. Di Corcia, M. Nazzari / J. Chromatogr. A 974 (2002) 53–89 57
most commonly used interfaces for LC–MS, TS is detection of several classes of analytes, as it is ablethe only one that exhibits the optimum efficiency at to generate classical electron-impact (EI) spectra.100% water. The ion source is the same as that used by GC–MS
The TS interface sometimes exhibits tailing for and EI spectra are equal to those reported in spectranonvolatile or thermally labile compounds due to libraries. This is a well-defined advantage of thedeposition on the source and re-evaporation or LC–PB-MS technique. Another positive feature ofdecomposition. Some but not all of these unwelcome the PB interface is that it can handle commoneffects can be eliminated by increasing the source solvents for reversed-phase (RP)-LC, including vola-temperature to avoid deposition or decreasing the tile buffers, at flow-rates of up to 1 ml /min.temperature to avoid decomposition. A serious drawback of the LC–PB-MS system is
TS sensitivity is analyte dependent and difficult to that it is unsuitable to analysis of very low volatilepredict. Usually, detection limits lie in the 10–60 ng compounds, as the interface is incapable of transfer-range, under full scan conditions. ring them from the liquid to the gas phase. More-
1Typically, ion evaporation shows [M1H] ions over, effects of adsorption of polar analytes on thefor compounds having a high proton affinity, such as material composing the transmission device result in
1those basic in nature. Otherwise, [M1NH ] ions broad and tailed peaks.42are formed. In negative detection, [M2H] or [M1 Another well established drawback of the LC–PB-
2buffer or solvent] ions are observed. When using MS system is the relatively low sensitivity, becausethe electric discharge, gas-phase chemical ionization the transmission efficiency is not higher than 1%.(CI) spectra are generated. Due to the soft ionization Even after optimizing parameters related to the PBprocess, TS spectra often do not display structurally- interface and under selected ion monitoring (SIM),significant fragment ions. In some cases, fragmenta- Voyksner et al. were able to analyze compounds oftion can be induced by using the ‘‘discharge-assisted pharmaceutical interest at level not lower than fewthermospray’’ technique or using higher repeller ppm in milk and tissue extracts [17].voltages. By this expedient the kinetic energy of the Another drawback of the PB-MS device is theions is increased and collision-induced decomposi- nonlinearity of the response at low analyte con-tion (CID) processes generate fragment ions. How- centrations. Causes related to this effect have beenever, high repeller voltages are not compatible with the object of detailed studies, but the mechanism hasan optimal transmission efficiency, hence sensitivity not yet been completely understood. To enhance theis decreased. In particular cases, apparent fragmenta- transmission efficiency at low analyte concentrations,tion can be obtained by thermal degradation of the malic acid or ammonium acetate have been added toanalytes while passing through the thermospray the mobile phase. The rationale behind this approachvaporizer probe. That TS spectra rarely show frag- is that a compound-specific or nonspecific ‘carrierment ions is a well defined drawback of this inter- effect’ can be obtained. However, this expedient isface. When LC–TS-MS is applied to monitoring not always effective, as it depends upon the nature oftraces of target compounds in complex matrices, the the analyte.combination of retention time and molecular mass The ESI interface is the youngest device intro-could be not sufficient for unequivocal identification duced for LC–MS coupling. ESI has opened newof a target compound. The specificity of methods and exciting perspectives to the LC–MS technique.involving the TS interface can be greatly increased It is sufficient to say that the ESI interface enablesby making use of tandem MS. However, many LC–MS analysis of compounds having molecularregulatory laboratories cannot afford the cost of such masses up to 4 000 000, as the ESI process is able toinstrumentation. form multiply charged ions, depending on the acid /
The lack of fragment ions for unequivocal de- base chemistry and hydration energy of the mole-termination of a certain analyte by the TS-MS cules. The ability to increase charge (z) permits thearrangement encouraged several researchers to consi- analysis of large molecular masses on a conventionalder the use of the particle beam (PB) interface for quadrupole limited tom /z of 2000 for singly charged
58 A. Di Corcia, M. Nazzari / J. Chromatogr. A 974 (2002) 53–89
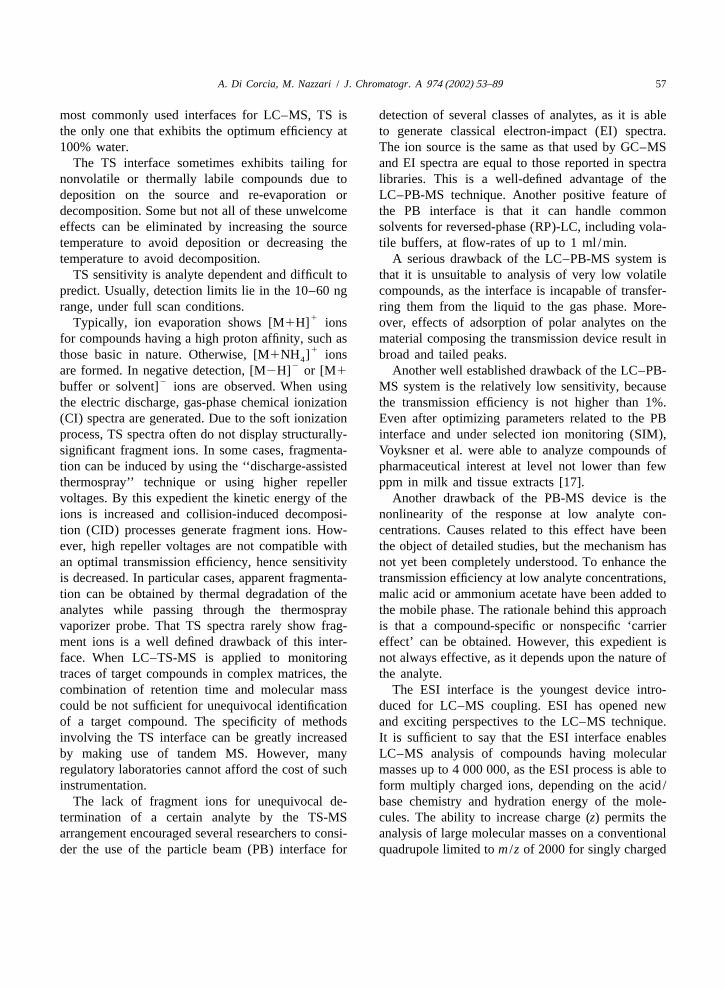
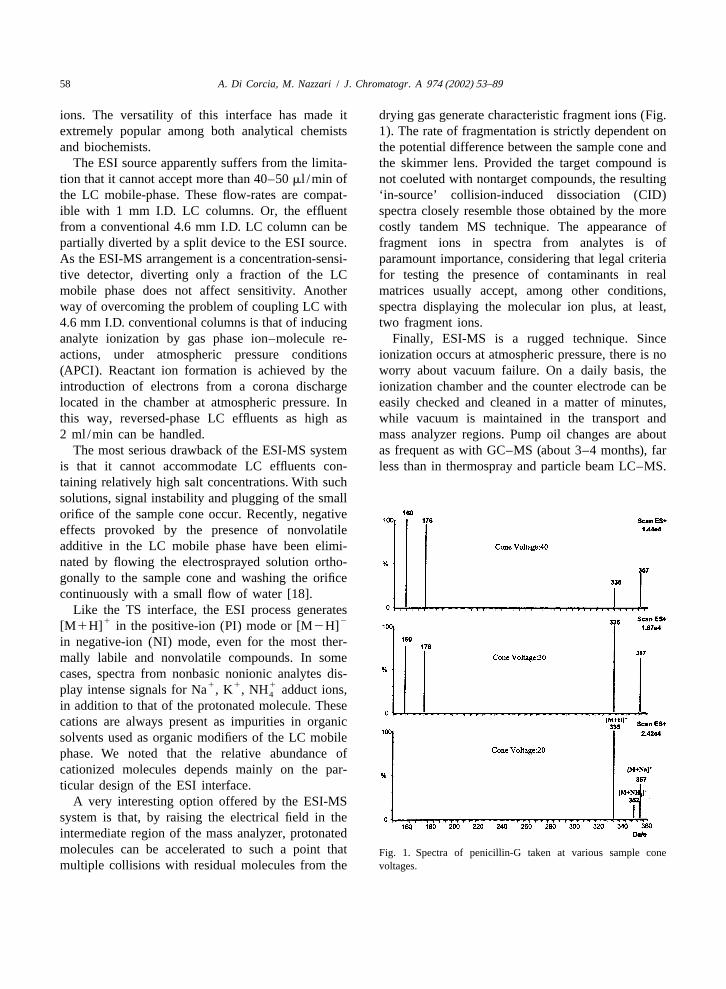
ions. The versatility of this interface has made it drying gas generate characteristic fragment ions (Fig.extremely popular among both analytical chemists 1). The rate of fragmentation is strictly dependent onand biochemists. the potential difference between the sample cone and
The ESI source apparently suffers from the limita- the skimmer lens. Provided the target compound istion that it cannot accept more than 40–50ml /min of not coeluted with nontarget compounds, the resultingthe LC mobile-phase. These flow-rates are compat- ‘in-source’ collision-induced dissociation (CID)ible with 1 mm I.D. LC columns. Or, the effluent spectra closely resemble those obtained by the morefrom a conventional 4.6 mm I.D. LC column can be costly tandem MS technique. The appearance ofpartially diverted by a split device to the ESI source. fragment ions in spectra from analytes is ofAs the ESI-MS arrangement is a concentration-sensi- paramount importance, considering that legal criteriative detector, diverting only a fraction of the LC for testing the presence of contaminants in realmobile phase does not affect sensitivity. Another matrices usually accept, among other conditions,way of overcoming the problem of coupling LC with spectra displaying the molecular ion plus, at least,4.6 mm I.D. conventional columns is that of inducing two fragment ions.analyte ionization by gas phase ion–molecule re- Finally, ESI-MS is a rugged technique. Sinceactions, under atmospheric pressure conditions ionization occurs at atmospheric pressure, there is no(APCI). Reactant ion formation is achieved by the worry about vacuum failure. On a daily basis, theintroduction of electrons from a corona discharge ionization chamber and the counter electrode can belocated in the chamber at atmospheric pressure. In easily checked and cleaned in a matter of minutes,this way, reversed-phase LC effluents as high as while vacuum is maintained in the transport and2 ml /min can be handled. mass analyzer regions. Pump oil changes are about
The most serious drawback of the ESI-MS system as frequent as with GC–MS (about 3–4 months), faris that it cannot accommodate LC effluents con- less than in thermospray and particle beam LC–MS.taining relatively high salt concentrations. With suchsolutions, signal instability and plugging of the smallorifice of the sample cone occur. Recently, negativeeffects provoked by the presence of nonvolatileadditive in the LC mobile phase have been elimi-nated by flowing the electrosprayed solution ortho-gonally to the sample cone and washing the orificecontinuously with a small flow of water [18].
Like the TS interface, the ESI process generates1 2[M1H] in the positive-ion (PI) mode or [M2H]
in negative-ion (NI) mode, even for the most ther-mally labile and nonvolatile compounds. In somecases, spectra from nonbasic nonionic analytes dis-
1 1 1play intense signals for Na , K , NH adduct ions,4
in addition to that of the protonated molecule. Thesecations are always present as impurities in organicsolvents used as organic modifiers of the LC mobilephase. We noted that the relative abundance ofcationized molecules depends mainly on the par-ticular design of the ESI interface.
A very interesting option offered by the ESI-MSsystem is that, by raising the electrical field in theintermediate region of the mass analyzer, protonatedmolecules can be accelerated to such a point that Fig. 1. Spectra of penicillin-G taken at various sample conemultiple collisions with residual molecules from the voltages.
A. Di Corcia, M. Nazzari / J. Chromatogr. A 974 (2002) 53–89 59
APCI is another very soft ionization technique and at detecting antibiotics in food, today ESI and APCIhas many similarities to ESI. Ionization takes place are become the ion sources of choice. This can beat atmospheric pressure and the ions are extracted deduced from the fact that about 98% of the LC–MSinto the mass detector in the same way as in ESI. works are currently performed with the above ion
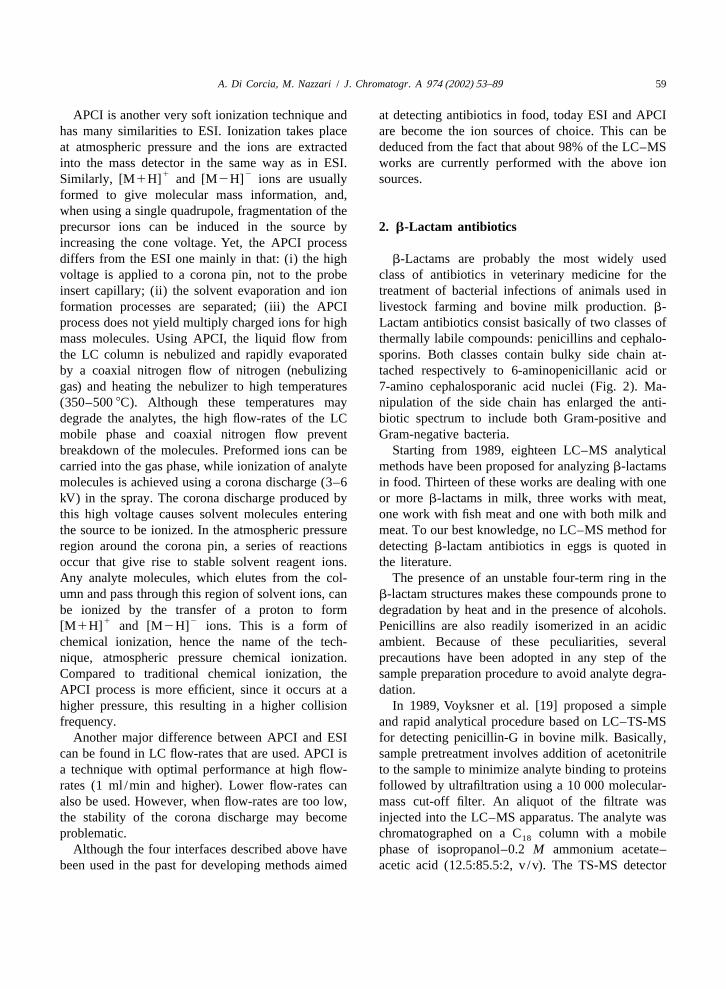
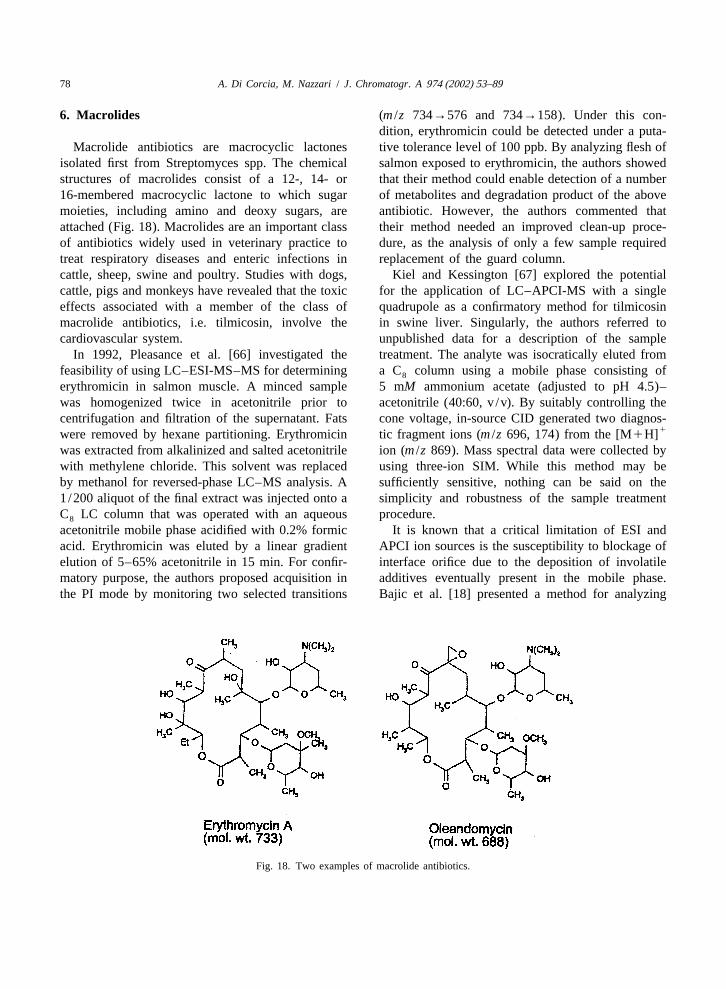
1 2Similarly, [M1H] and [M2H] ions are usually sources.formed to give molecular mass information, and,when using a single quadrupole, fragmentation of theprecursor ions can be induced in the source by 2 . b-Lactam antibioticsincreasing the cone voltage. Yet, the APCI processdiffers from the ESI one mainly in that: (i) the high b-Lactams are probably the most widely usedvoltage is applied to a corona pin, not to the probe class of antibiotics in veterinary medicine for theinsert capillary; (ii) the solvent evaporation and ion treatment of bacterial infections of animals used information processes are separated; (iii) the APCI livestock farming and bovine milk production.b-process does not yield multiply charged ions for high Lactam antibiotics consist basically of two classes ofmass molecules. Using APCI, the liquid flow from thermally labile compounds: penicillins and cephalo-the LC column is nebulized and rapidly evaporated sporins. Both classes contain bulky side chain at-by a coaxial nitrogen flow of nitrogen (nebulizing tached respectively to 6-aminopenicillanic acid orgas) and heating the nebulizer to high temperatures 7-amino cephalosporanic acid nuclei (Fig. 2). Ma-(350–5008C). Although these temperatures may nipulation of the side chain has enlarged the anti-degrade the analytes, the high flow-rates of the LC biotic spectrum to include both Gram-positive andmobile phase and coaxial nitrogen flow prevent Gram-negative bacteria.breakdown of the molecules. Preformed ions can be Starting from 1989, eighteen LC–MS analyticalcarried into the gas phase, while ionization of analyte methods have been proposed for analyzingb-lactamsmolecules is achieved using a corona discharge (3–6 in food. Thirteen of these works are dealing with onekV) in the spray. The corona discharge produced by or moreb-lactams in milk, three works with meat,this high voltage causes solvent molecules entering one work with fish meat and one with both milk andthe source to be ionized. In the atmospheric pressure meat. To our best knowledge, no LC–MS method forregion around the corona pin, a series of reactions detectingb-lactam antibiotics in eggs is quoted inoccur that give rise to stable solvent reagent ions. the literature.Any analyte molecules, which elutes from the col- The presence of an unstable four-term ring in theumn and pass through this region of solvent ions, can b-lactam structures makes these compounds prone tobe ionized by the transfer of a proton to form degradation by heat and in the presence of alcohols.
1 2[M1H] and [M2H] ions. This is a form of Penicillins are also readily isomerized in an acidicchemical ionization, hence the name of the tech- ambient. Because of these peculiarities, severalnique, atmospheric pressure chemical ionization. precautions have been adopted in any step of theCompared to traditional chemical ionization, the sample preparation procedure to avoid analyte degra-APCI process is more efficient, since it occurs at a dation.higher pressure, this resulting in a higher collision In 1989, Voyksner et al. [19] proposed a simplefrequency. and rapid analytical procedure based on LC–TS-MS
Another major difference between APCI and ESI for detecting penicillin-G in bovine milk. Basically,can be found in LC flow-rates that are used. APCI is sample pretreatment involves addition of acetonitrilea technique with optimal performance at high flow- to the sample to minimize analyte binding to proteinsrates (1 ml /min and higher). Lower flow-rates can followed by ultrafiltration using a 10 000 molecular-also be used. However, when flow-rates are too low, mass cut-off filter. An aliquot of the filtrate wasthe stability of the corona discharge may become injected into the LC–MS apparatus. The analyte wasproblematic. chromatographed on a C column with a mobile18
Although the four interfaces described above have phase of isopropanol–0.2M ammonium acetate–been used in the past for developing methods aimed acetic acid (12.5:85.5:2, v /v). The TS-MS detector
60 A. Di Corcia, M. Nazzari / J. Chromatogr. A 974 (2002) 53–89
Fig. 2. Some examples of structures ofb-lactam antibiotics.
was operated in the PI mode, monitoring the [M1 improving mass transmission through the interface,1H] ion at m /z 335. The LOD was 100 ppb, well in particular through the momentum separators.
exceeding tolerance levels. After experiencing the PB interface, Voyksner andOne year later, Voyksner et al. [17] evaluated the co-workers [20,21] re-examined the use of the TS
usefulness of adopting the PB interface for unam- ion source for developing confirmatory methods forbiguous identification of pharmaceutical interest, detecting cloxacillin, ampicillin, amoxicillin,including b-lactams, in milk and meat samples. cephapirin and its metabolite in bovine milk. TheSample pretreatment was the same as reported sample preparation procedure was almost unvariedabove. The authors evaluated the influence of various [17]. Ammonium acetate was added to the LCparameters on the response of the PB-MS system. mobile phase to promote formation of gas-phase ionsThey found that the sensitivity of the instrumentation in the TS ion source. Owing to their nature,b-lactamwas dependent on the nature of the organic modifier antibiotics can be detected both in the PI and NIand flow-rate of the LC mobile phase, while parame- modes. Preliminary studies showed that the NI modeters such as desolvation temperature, helium flow- of operation was 5–10 times less sensitive comparedrate to the nebulizer and nebulizer position resulted to the PI detection mode. The same situation isin minimal changes of sensitivity. Under methane CI, encountered when using the ESI ion source. Spectraand with five-ions SIM, the use of LC–PB-MS of all of the analytes mentioned above displayedpermitted quantification of 14.1 ppm of cephapirin in signals for protonated molecules as well as [M1
1bovine milk. The authors concluded that one way of Na] adduct ions. Confirmatory ions were obtaineddecreasing detection limits with PB-MS is that of by thermal decomposition ofb-lactams. In particular,
A. Di Corcia, M. Nazzari / J. Chromatogr. A 974 (2002) 53–89 61
1the [M1H226] ion was common to all of the carboxylic group produced the ions atm /z 220,penicillins considered and was postulated to form while other fragment ions resulted from cleavage offrom opening of theb-lactam ring followed by the amide moiety (see again Fig. 3). Using flowhydration and loss of CO . Unlike the previous work injection ESI-MS, the effects of various mobile2
[17], the MS system was now set to monitor several phase additives, such as formic, acid acetic acid,fragment ions of the analytes, besides protonated trifluoroacetic acid, ammonium acetate, ammoniaones. That fragment ions resulted from thermal and ion pair forming agents, on sensitivity weredegradation on the source walls of the penicillins assessed. Generally, the most intense signals werewas evidenced from the fact that the ions atm /z 160 achieved by adding formic acid (pH 3.1) to a water–and 277 maximized after several seconds after the methanol mixture.
1[M1H] ion. This anomaly could be explained A laborious and lengthy sample pretreatment wasassuming that penicillins are first decomposed and followed by Blanchflower et al. [23] for determiningthe formed products are then vaporized and ionized. five penicillins in milk by LC–ESI-MS. AcetonitrileAnyway, the two above ions could not be used as was used for protein precipitation and analyte ex-confirmatory ions due to the high background ion traction. Nafcillin was used as a surrogate standard.current in the low-mass region. This failure coupled After centrifugation, the extract was purified by fiveto low enrichment factors obtained by preliminary liquid–liquid extraction steps using sequentiallysample treatment concurred to give high detection methylene chloride, hexane–acetonitrile, water,limits (50–100 ppb), making their method inade- phosphate buffer (pH 7) and again methylene chlo-quate for analyzingb-lactams in food at the toler- ride as extractants. Following each extraction step,ance levels. the extract was centrifuged. Unlike the previous
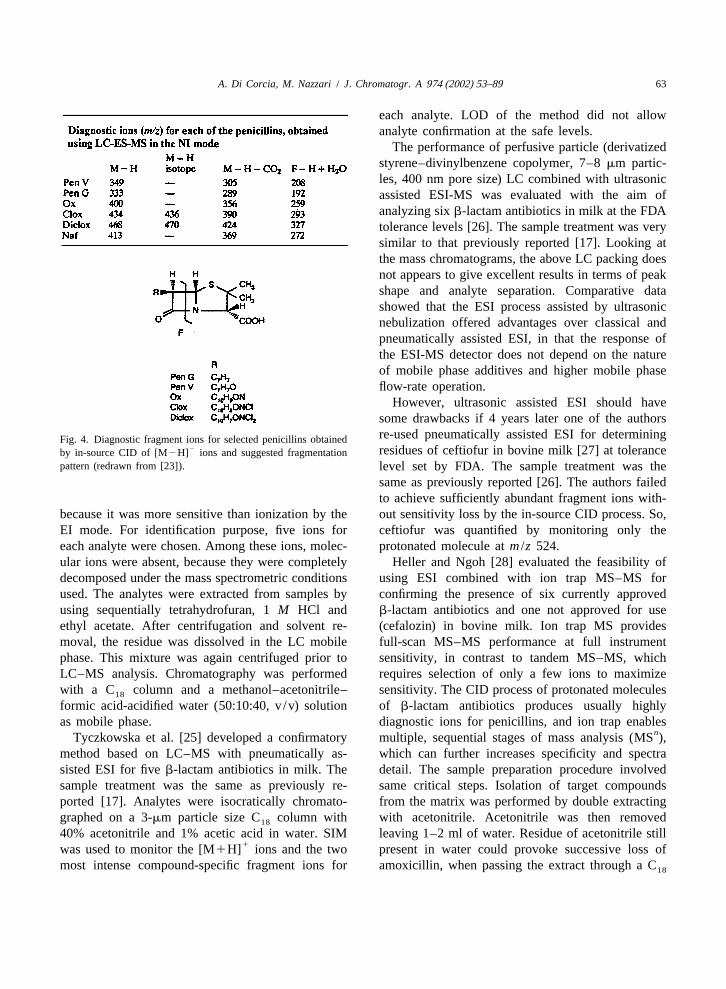
In 1993, Straub and Voyksner [22] investigated the work [22], the ESI process was now pneumaticallypotential of the recently introduced ESI ion source assisted by a nebulizer gas and the ion source wasfor confirming b-lactam antibiotics in bovine milk. able to accommodate mobile phase flow-rates up toThe sample preparation procedure was the same as 1 ml /min. In contrast to Voyksner and other re-reported above [17]. By using classical ESI (no searchers, the authors found that the NI modenebulizer gas, LC effluent delivered at the ion source operation gave more intense signals for penicillinsat a flow-rate of 4ml /min), the interest of the above than the PI mode. They had no explanation for thisauthors was primarily focused on obtaining diagnos- except that it might be due to differences in the type
1tic fragment ions by decomposing [M1H] or of instrument used. Diagnostic ions and suggested2[MH] ions in the intermediate region of the MS fragmentation pattern for each of the penicillin are
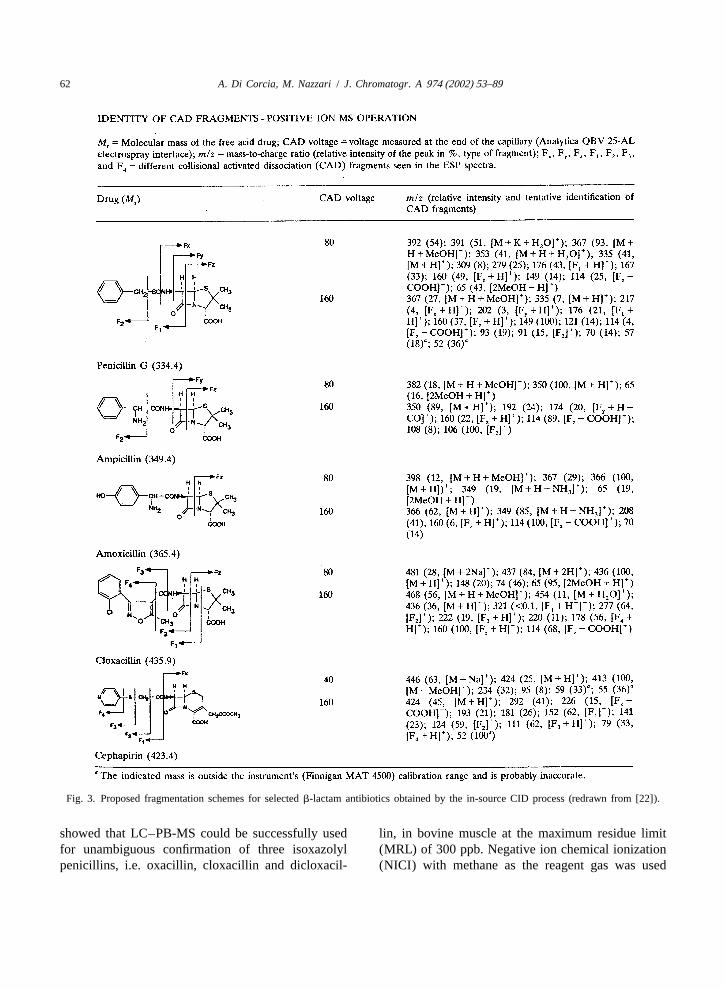
instrumentation (in-source CID). Compared to PI shown in Fig. 4. Ions for operating in the SIM modeoperation, the authors observed less fragmentation of were selected after evaluating the effects of varyingthe analytes considered and one-fourth decrease of the electric field in the desolvation chamber on thethe signal intensities. In the PI mode and at a CID spectra of the five penicillins. In spite of the factrelatively large potential difference between the that the LC mobile phase composed of a water–sample cone and the skimmer lens, the spectra of all acetonitrile solution gave intense signals for the fivethe penicillins studied, i.e. penicillin-G, ampicillin, analytes, triethylamine was added to the mobileamoxicillin and cloxacillin, displayed to a larger or phase to reduce shift in retention times betweenlesser extent the characteristic cleavage product of sample and standards due to matrix effects. In spitethe b-lactam ring atm /z 160 and a further loss of of a complex sample preparation procedure, the useCOOH atm /z 114. Obviously, cleavage of the amide of a surrogate standard helped to obtain relativemoiety of penicillins formed more specific product recoveries of the analytes in the three matrices betterions. Under conditions used by the two authors, than 70%. Owing to injection of the final extracts infragmentation schemes of the four penicillins are the LC column equivalent to 2 ml of milk, quantifi-visualized in Fig. 3. Singularly, the CID spectrum of cation limits were below or near to stipulated EUcephapirin did not display ions coming from cleav- tolerance levels.age of the b-lactam ring. Instead, loss of the In 1994, an active French researcher group [24]
62 A. Di Corcia, M. Nazzari / J. Chromatogr. A 974 (2002) 53–89
Fig. 3. Proposed fragmentation schemes for selectedb-lactam antibiotics obtained by the in-source CID process (redrawn from [22]).
showed that LC–PB-MS could be successfully used lin, in bovine muscle at the maximum residue limitfor unambiguous confirmation of three isoxazolyl (MRL) of 300 ppb. Negative ion chemical ionizationpenicillins, i.e. oxacillin, cloxacillin and dicloxacil- (NICI) with methane as the reagent gas was used
A. Di Corcia, M. Nazzari / J. Chromatogr. A 974 (2002) 53–89 63
each analyte. LOD of the method did not allowanalyte confirmation at the safe levels.
The performance of perfusive particle (derivatizedstyrene–divinylbenzene copolymer, 7–8mm partic-les, 400 nm pore size) LC combined with ultrasonicassisted ESI-MS was evaluated with the aim ofanalyzing sixb-lactam antibiotics in milk at the FDAtolerance levels [26]. The sample treatment was verysimilar to that previously reported [17]. Looking atthe mass chromatograms, the above LC packing doesnot appears to give excellent results in terms of peakshape and analyte separation. Comparative datashowed that the ESI process assisted by ultrasonicnebulization offered advantages over classical andpneumatically assisted ESI, in that the response ofthe ESI-MS detector does not depend on the natureof mobile phase additives and higher mobile phaseflow-rate operation.
However, ultrasonic assisted ESI should havesome drawbacks if 4 years later one of the authorsre-used pneumatically assisted ESI for determiningFig. 4. Diagnostic fragment ions for selected penicillins obtained
2 residues of ceftiofur in bovine milk [27] at toleranceby in-source CID of [M2H] ions and suggested fragmentationpattern (redrawn from [23]). level set by FDA. The sample treatment was the
same as previously reported [26]. The authors failedto achieve sufficiently abundant fragment ions with-
because it was more sensitive than ionization by the out sensitivity loss by the in-source CID process. So,EI mode. For identification purpose, five ions for ceftiofur was quantified by monitoring only theeach analyte were chosen. Among these ions, molec- protonated molecule atm /z 524.ular ions were absent, because they were completely Heller and Ngoh [28] evaluated the feasibility ofdecomposed under the mass spectrometric conditions using ESI combined with ion trap MS–MS forused. The analytes were extracted from samples by confirming the presence of six currently approvedusing sequentially tetrahydrofuran, 1M HCl and b-lactam antibiotics and one not approved for useethyl acetate. After centrifugation and solvent re- (cefalozin) in bovine milk. Ion trap MS providesmoval, the residue was dissolved in the LC mobile full-scan MS–MS performance at full instrumentphase. This mixture was again centrifuged prior to sensitivity, in contrast to tandem MS–MS, whichLC–MS analysis. Chromatography was performed requires selection of only a few ions to maximizewith a C column and a methanol–acetonitrile– sensitivity. The CID process of protonated molecules18
formic acid-acidified water (50:10:40, v /v) solution ofb-lactam antibiotics produces usually highlyas mobile phase. diagnostic ions for penicillins, and ion trap enables
nTyczkowska et al. [25] developed a confirmatory multiple, sequential stages of mass analysis (MS ),method based on LC–MS with pneumatically as- which can further increases specificity and spectrasisted ESI for fiveb-lactam antibiotics in milk. The detail. The sample preparation procedure involvedsample treatment was the same as previously re- same critical steps. Isolation of target compoundsported [17]. Analytes were isocratically chromato- from the matrix was performed by double extractinggraphed on a 3-mm particle size C column with with acetonitrile. Acetonitrile was then removed18
40% acetonitrile and 1% acetic acid in water. SIM leaving 1–2 ml of water. Residue of acetonitrile still1was used to monitor the [M1H] ions and the two present in water could provoke successive loss of
most intense compound-specific fragment ions for amoxicillin, when passing the extract through a C18
64 A. Di Corcia, M. Nazzari / J. Chromatogr. A 974 (2002) 53–89
SPE cartridge. Analytes were eluted from the car- phosphate buffer and hexane were added to thetridge with acetonitrile, which was then diluted with sample. An aliquot of the aqueous phase was thenwater. Acetonitrile was again removed leaving ana- applied to a C SPE cartridge and analytes were18
lytes in some water. This solution was filtered and an re-extracted with a phosphate buffer–acetonitrilealiquot injected into the LC–MS system. Recovery (1:1, v /v) solution. The eluent volume was firstof the analytes were not specified. By observing ion reduced by heating for eliminating acetonitrile andsignal intensities, we deduced that amoxicillin and then it was diluted with other water. Before LC–MSampicillin were poorly recovered. The method sen- analysis, the final extract was filtered with a cutoffsitivity allowed detection of the analytes at safe filter device (nominal molecular mass limit 10 000).levels. The analytes were separated in the gradient elution
An LC–ESI-MS method for simultaneously de- mode using a 5-cm length, 3-mm particle size C18
termining fourb-lactam antibiotics in animal tissues column and a mobile phase consisting of water–´was proposed by Hornazabal and Yndestad [29]. acetonitrile acidified with formic acid. Selected
Analytes were extracted by liver, kidney, meat reaction monitoring (SRM) of two or more frag-samples with an acetone–trichloroacetic acid solu- mentation transitions were selected to provide a hightion. The water–acetone extract was partially evapo- degree of sensitivity and specificity. The employ-rated to remove the organic solvent and the extract ment of postcolumn infusion of a standard compoundwas purified by applying it to a C SPE cartridge. (azlocillin) during chromatography of a milk extract18
The eluate was diluted with water and filtered. The showed significant ion suppression only in the veryfinal extract was submitted to the remaining part of first part of the mass chromatogram. Thus the matrixthe analysis. Isocratic separation was performed on a did not significantly affect the analyte ionization.C column with a methanol–ammonium acetate The concentration limit for analyte confirmation18
(50:50, v /v) solution. The ESI-MS detector was ranged from 0.4 to 1.1 ppb for the analytes consid-operated in the NI mode and set to collect ion atm /z ered. Successively [32], this method was employed333 (penicillin-G), 349 (penicillin-V), 434 (clox- for measuring concentrations of penicillins in in-acillin) and 468 (dicloxacillin) in the one-ion SIM curred raw milk.mode. We have developed a simple and rapid method for
An LC–ESI-MS–MS method was developed for quantifying ten approved-for-useb-lactam antibioticsconfirming the presence of amoxicillin in catfish in bovine milk below stipulated USA and EUmuscle [30]. Amoxicillin in the sample was deriva- tolerance levels [33]. The analytes are directlytized by heating the sample suspended in an acetate extracted from intact milk by passing it through abuffer. Amoxicillin derivatives were then extracted Carbograph 4 cartridge. Penicillin-V was used as I.S.five times with ethyl ether. The organic solvent was The flow-rate was adjusted in such a way that timeremoved and the dry extract dissolved in the LC was allowed for the analytes to be desorbed frommobile phase. After filtering, the final extract was proteins and readsorbed on the sorbent material. Atready for the final part of the analysis. The mobile 5 ppb level, recovery of theb-lactams were betweenphase was 18% acetonitrile in water adjusted to pH 70 (nafcillin) and 108% (cefalexin), with relative4.4 with formic acid. The MS apparatus was set to standard deviations ranging between 5 (oxacillin) and
1monitor four product ions from the [M1H] ion at 11% (amoxicillin and ceftiofur). The analytes werem /z 203. Confirmation of amoxicillin was demon- fractionated on a C column in the gradient elution18
strated in incurred fish samples containing the mode. The phase A was methanol and the phase Bpenicillin at 50–300 ppb levels. was water. Both phases were acidified with 10 mM
Riediker and Stadler [31] developed a multiresidue formic acid. During the first part of the chromato-method based on LC–ESI-MS–MS for the detection graphic run, the ESI-MS system was operated in theof amoxicillin, ampicillin, cloxacillin, oxacillin and PI mode, while late-eluted compounds were detectedpenicillin-G in milk. d -pen-G was used as surrogate in the NI mode. This was made to circumvent matrix7
standard. After milk defatting by centrifugation, a interferences resulting in remarkable signal weaken-

A. Di Corcia, M. Nazzari / J. Chromatogr. A 974 (2002) 53–89 65
ing for some of the last-eluted analytes (penicillin-G, taining 1% acetic acid. Determination was in the PIoxacillin and cloxacillin) when detecting them as mode. Analyte detection and quantitation was based
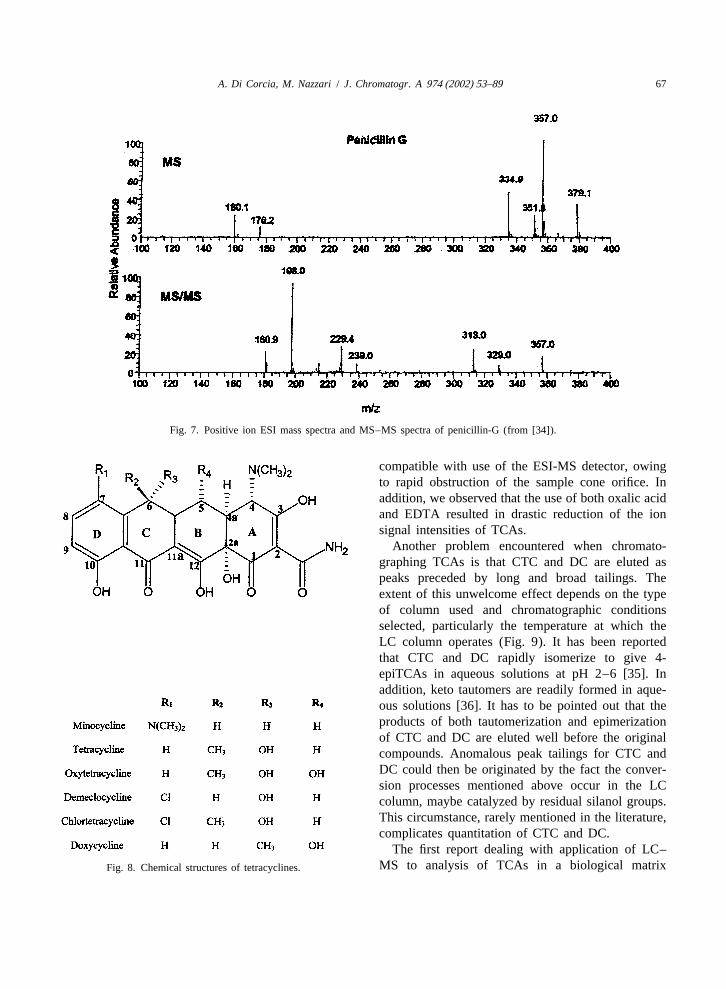
1[M1H] ions. MS data acquisition was performed on the most abundant product ions from fragmenta-by a time-scheduled three-ion SIM program. Fig. 5 tion of the protonated molecules for amoxicillin,shows a typical mass chromatogram resulting from ampicillin, cephapirin and ceftiofur and from frag-analysis of a 10-ml milk sample spiked with the mentation of the sodiated molecules for penicillin-G,analytes at 10 ppb level. Analyses of milk samples penicillin-V and cloxacillin. An example of PI ESItaken after intramammary application of amoxicillin mass spectrum and MS–MS spectrum of penicillin-Gshowed that 1.2 ng/ml of this penicillin were still is shown in Fig. 7. It may be that the MS system waspresent 6 days after treatment. At this concentration uncalibrated at the time the spectra were obtained,level, the identification power of the method was not because the sodiated fragment ion corresponding toweakened, as signals of the three monitored ions the class-specific protonated fragment ion atm /z 160were still well distinguishable from the background should have anm /z at 182, instead of atm /z 181.noise (Fig. 6). Another consideration concerns with the anomalous-
A sensitive LC–ESI-iontrap-tandem MS method ly abundant formation of cationized molecules,for the quantitation and mass spectral confirmation of which might be traced to the particular design of thefive penicillins and two cefalosporins commonly or ESI-ion trap device. Finally, the CID process rarelypotentially used in diary industry was described by produces abundant fragment ions from decomposi-Holstege et al. [34]. Antibiotics were extracted from tion of sodiated parent ions. Anyway, low limits ofmilk with acetonitrile, followed by reversed-phase quantification were achieved for all of the analytes,column clean-up. Analytes were separated by a C ranging between 0.2 (ampicillin) and 2 ppb (clox-18
LC column using a water–methanol gradient con- acillin and penicillin-V).
Fig. 5. Time-scheduled SIM LC–MS chromatogram resulting from analysis of 10 ml of milk spiked withb-lactams at the individual levelof 10 ng/ml (from [33]).
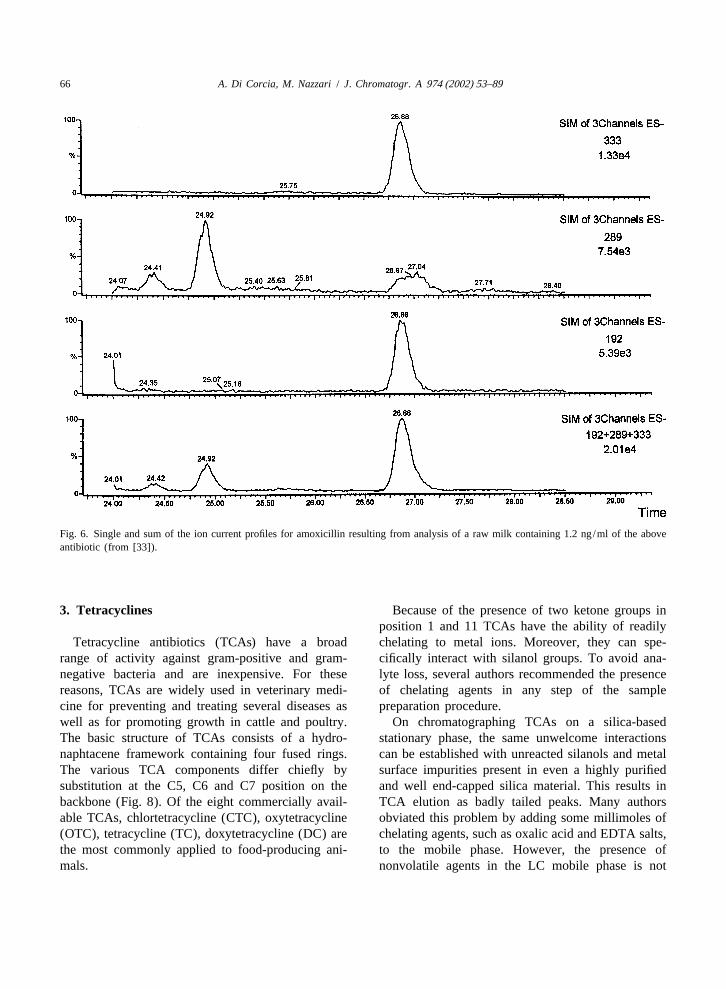
66 A. Di Corcia, M. Nazzari / J. Chromatogr. A 974 (2002) 53–89
Fig. 6. Single and sum of the ion current profiles for amoxicillin resulting from analysis of a raw milk containing 1.2 ng/ml of the aboveantibiotic (from [33]).
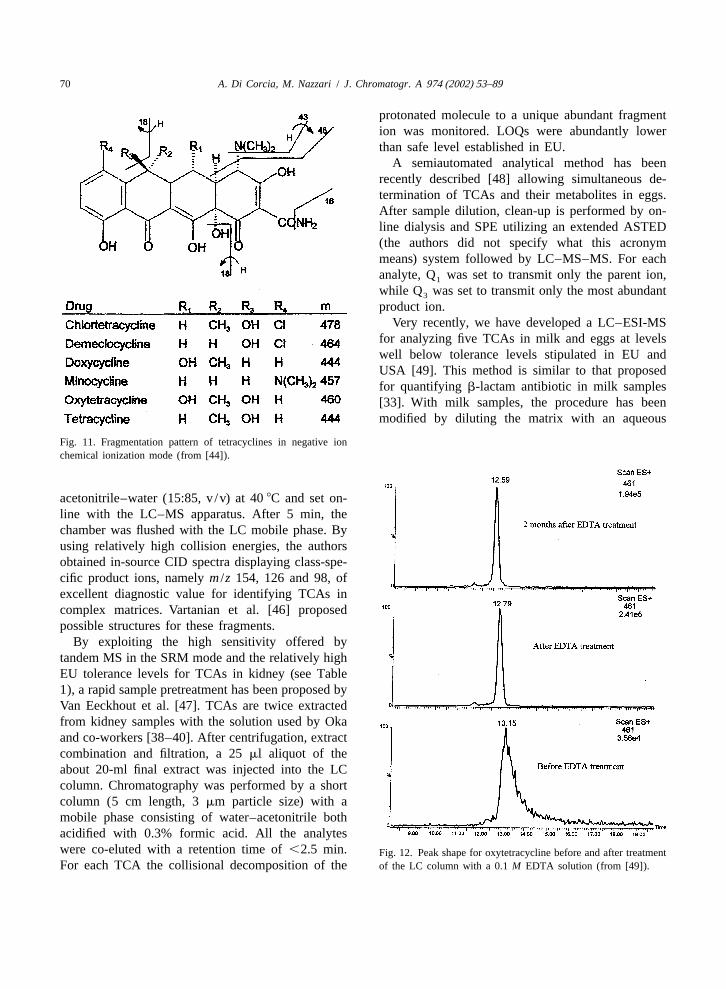
3 . Tetracyclines Because of the presence of two ketone groups inposition 1 and 11 TCAs have the ability of readily
Tetracycline antibiotics (TCAs) have a broad chelating to metal ions. Moreover, they can spe-range of activity against gram-positive and gram- cifically interact with silanol groups. To avoid ana-negative bacteria and are inexpensive. For these lyte loss, several authors recommended the presencereasons, TCAs are widely used in veterinary medi- of chelating agents in any step of the samplecine for preventing and treating several diseases as preparation procedure.well as for promoting growth in cattle and poultry. On chromatographing TCAs on a silica-basedThe basic structure of TCAs consists of a hydro- stationary phase, the same unwelcome interactionsnaphtacene framework containing four fused rings. can be established with unreacted silanols and metalThe various TCA components differ chiefly by surface impurities present in even a highly purifiedsubstitution at the C5, C6 and C7 position on the and well end-capped silica material. This results inbackbone (Fig. 8). Of the eight commercially avail- TCA elution as badly tailed peaks. Many authorsable TCAs, chlortetracycline (CTC), oxytetracycline obviated this problem by adding some millimoles of(OTC), tetracycline (TC), doxytetracycline (DC) are chelating agents, such as oxalic acid and EDTA salts,the most commonly applied to food-producing ani- to the mobile phase. However, the presence ofmals. nonvolatile agents in the LC mobile phase is not
A. Di Corcia, M. Nazzari / J. Chromatogr. A 974 (2002) 53–89 67
Fig. 7. Positive ion ESI mass spectra and MS–MS spectra of penicillin-G (from [34]).
compatible with use of the ESI-MS detector, owingto rapid obstruction of the sample cone orifice. Inaddition, we observed that the use of both oxalic acidand EDTA resulted in drastic reduction of the ionsignal intensities of TCAs.
Another problem encountered when chromato-graphing TCAs is that CTC and DC are eluted aspeaks preceded by long and broad tailings. Theextent of this unwelcome effect depends on the typeof column used and chromatographic conditionsselected, particularly the temperature at which theLC column operates (Fig. 9). It has been reportedthat CTC and DC rapidly isomerize to give 4-epiTCAs in aqueous solutions at pH 2–6 [35]. Inaddition, keto tautomers are readily formed in aque-ous solutions [36]. It has to be pointed out that theproducts of both tautomerization and epimerizationof CTC and DC are eluted well before the originalcompounds. Anomalous peak tailings for CTC andDC could then be originated by the fact the conver-sion processes mentioned above occur in the LCcolumn, maybe catalyzed by residual silanol groups.This circumstance, rarely mentioned in the literature,complicates quantitation of CTC and DC.
The first report dealing with application of LC–MS to analysis of TCAs in a biological matrixFig. 8. Chemical structures of tetracyclines.

68 A. Di Corcia, M. Nazzari / J. Chromatogr. A 974 (2002) 53–89
The lack of sensitivity of the frit FAB-MS ar-rangement adopted in a previous study devoted todetecting TCAs in honey [38], led Oka et al. to adoptfirst ESI-tandem MS–MS [39] and then APCI-tan-dem MS–MS [40] for identifying TCAs in a varietyof biological matrices. The rationale behind thischange was that, unlike ESI, APCI could be operatedat sufficiently high temperatures to decompose oxalicacid used as LC mobile phase additive. Oka et al.were of the opinion that only this additive canprovide the best separation between TCAs and co-eluting substances. Another important modificationwas that the acquisition previously performed in thedaughter ion scan mode [39] was replaced by themuch more sensitive SRM acquisition mode [40].After optimizing conditions of the triple quadrupoleinstrumentation, the mass spectra shown in Fig. 10relative to four targeted TCAs and nontargeted DMC(internal standard) were obtained. These spectrashow typical fragment ions generated by loss of NH3
from the carboxyamide group and additional loss ofFig. 9. Peak shape for chlortetracycline by varying the LC columnwater for those TCAs possessing a hydroxyl group attemperature (from [49]).the C position. For a variety of biological matrices,6
i.e. honey, milk, eggs, muscle, kidney, liver, fish,appeared in 1991 [37]. A PB device was used to Oka et al. invariably proposed a lengthy but notinterface LC with MS. The authors devised a simple complex sample preparation procedure [38–40].sample preparation procedure involving ultrafiltration Basically, it consists of triple extraction with thefollowed by cleanup with a C SPE cartridge. They Na EDTA–McIlvaine buffer (pH 4). Each extraction18 2
employed reversed-phase LC with a C column is followed by centrifugation. Combined superna-18
packing and analytes were eluted isocratically with a tants are first filtered and then passed through a C18
water–methanol–acetonitrile mixture containing 50 SPE cartridge. Before use, the cartridge is washedmM oxalic acid. NICI with methane as reagent and with a saturated Na EDTA solution to eliminate2
four-ion SIM mode was used to identify TCAs in metal ions that can affect analyte recovery. TCAs aremilk extracts. No fragmentation scheme of the [M2 then eluted with 20 ml of methanol. This solvent was
2H] ions was reported. The authors observed that removed and the residue was reconstituted with arelative abundance of a fragment ion atm /z 442 methanol–water solution. Chromatography was per-
2([M2H O2H] ) was much greater in the OTC formed on a C column and the mobile phase was2 8
standard than in the OTC injected from the milk methanol–acetontrile–5 mM aqueous oxalic acid.extract at the start of a series of analyses. Only after Two years before Nakazawa et al. [40] (Oka’sseveral injections of several milk extracts, relative group), an active English research group [41] usedabundance of the above ion in the analysis of the APCI source with a probe temperature set atstandards approached that in the analysis of fortified 5008C to avoid clogging of the sample cone orificesamples. No explanation for this effect was reported. by oxalic acid added to a concentration of 10 mM inThe authors concluded that the high background the mobile phase. With this LC–MS system, theynoise due to injection of milk extracts precluded developed a confirmatory assay for determining TC,quantification of the three TCAs at the stipulated OTC, CTC and its isomers in muscle and kidney.tolerance levels. Frozen tissue samples were pulverized using a

A. Di Corcia, M. Nazzari / J. Chromatogr. A 974 (2002) 53–89 69
and was found not detrimental to the MS interface.The authors proposed of acquiring data for only themolecular ions of TC, OTC and CTC and, eventual-ly, re-injecting sample extracts for collecting twoadditional confirmatory ions for each analyte. Thesediagnostic ions were obtained by in-source CID ofprotonated molecules. The same LC–MS instrumen-tation was used by the same research group toconduct important studies on the metabolism ofchlortetracycline in eggs [42,43].
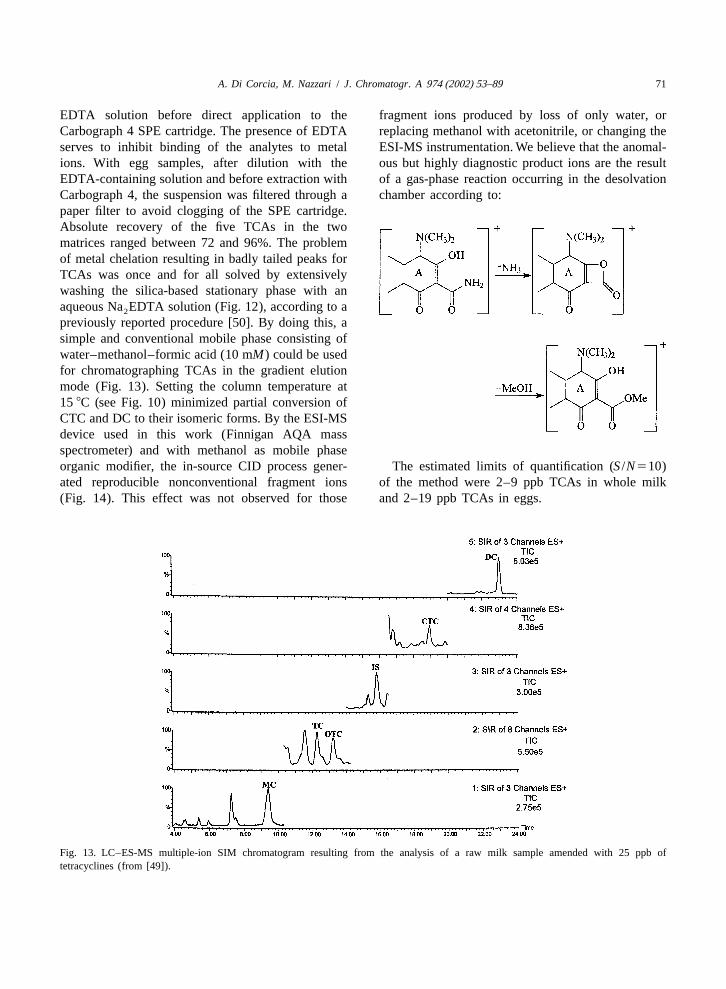
Based on LC–PB-MS where negative ions weregenerated by chemical ionization NICI usingmethane as reagent gas, Carson et al. [44] developeda confirmatory assay for monitoring residues of sixTCAs in milk and oxytetracycline in shrimp. Arather complex but original sample preparation pro-cedure was developed by the authors. Milk sampleswere defatted by centrifugation. Milk deproteiniza-tion–extraction was performed with glacial aceticacid. Shrimp tissue was homogenized with 0.1Msuccinic acid and the homogenate was centrifuged.By exploiting the affinity of TCAs for metals,purification of both milk and tissue extracts was
21made with a metal chelate affinity column (Cuions immobilized on sepharose). The eluate wasfurther purified by a conventional SPE cartridge. Theabsolute recovery for the various analytes from eithermilk or shrimp was near 50%. Final extracts werechromatographed on a styrene–divinylbenzene co-polymer (PLRP–S) material with methanol–5 mM
Fig. 10. CID spectra with tandem MS of tetracyclines (fromaqueous oxalic acid (58:42, v /v) as mobile phase. A[40]).fragmentation pattern of TCAs in methane NICImode proposed by the authors is shown in Fig. 11.
domestic food blender. Analytes were extracted from The problem of variations in fragment ion productiontissues by a glycine–HCl buffer. After homogenizing occurring between standards and sample extracts wasand centrifuging the extraction was repeated. Com- not resolved. To make the method rugged enough,bined extracts were purified with a SPE cartridge acquisition in the SIM mode was then abandonedfilled with a cyclohexyl-bonded silica material. Ana- and replaced by acquisition in a narrowm /z rangelytes were eluted with methanol. This solvent was (m /z 378 to 483). This change increased specificityremoved and replaced with 20 mM oxalic acid– and the loss of sensitivity was compensated by largeacetonitrile (80:20, v /v). After centrifugation, an enrichment factors.aliquot of the supernatant was injected into the LC– The simplest method based on LC–ESI-MS forMS apparatus. The mobile phase composition was analyzing TCAs in milk is that proposed by Lock etindeed complex, as it contained heptafluorobutyric al. [45]. Analytes are extracted from the sample byacid (0.04%), 10 mM oxalic acid and 10mM solid-phase microextraction (SPME) with a Car-Na EDTA, as additives. The tiny amounts of EDTA bowax/ templated resin. Analytes are then desorbed2
inhibited metal chelation somewhere in the system from the fiber by putting it in a chamber filled with
70 A. Di Corcia, M. Nazzari / J. Chromatogr. A 974 (2002) 53–89
protonated molecule to a unique abundant fragmention was monitored. LOQs were abundantly lowerthan safe level established in EU.
A semiautomated analytical method has beenrecently described [48] allowing simultaneous de-termination of TCAs and their metabolites in eggs.After sample dilution, clean-up is performed by on-line dialysis and SPE utilizing an extended ASTED(the authors did not specify what this acronymmeans) system followed by LC–MS–MS. For eachanalyte, Q was set to transmit only the parent ion,1
while Q was set to transmit only the most abundant3
product ion.Very recently, we have developed a LC–ESI-MS
for analyzing five TCAs in milk and eggs at levelswell below tolerance levels stipulated in EU andUSA [49]. This method is similar to that proposedfor quantifying b-lactam antibiotic in milk samples[33]. With milk samples, the procedure has beenmodified by diluting the matrix with an aqueous
Fig. 11. Fragmentation pattern of tetracyclines in negative ionchemical ionization mode (from [44]).
acetonitrile–water (15:85, v /v) at 408C and set on-line with the LC–MS apparatus. After 5 min, thechamber was flushed with the LC mobile phase. Byusing relatively high collision energies, the authorsobtained in-source CID spectra displaying class-spe-cific product ions, namelym /z 154, 126 and 98, ofexcellent diagnostic value for identifying TCAs incomplex matrices. Vartanian et al. [46] proposedpossible structures for these fragments.
By exploiting the high sensitivity offered bytandem MS in the SRM mode and the relatively highEU tolerance levels for TCAs in kidney (see Table1), a rapid sample pretreatment has been proposed byVan Eeckhout et al. [47]. TCAs are twice extractedfrom kidney samples with the solution used by Okaand co-workers [38–40]. After centrifugation, extractcombination and filtration, a 25ml aliquot of theabout 20-ml final extract was injected into the LCcolumn. Chromatography was performed by a shortcolumn (5 cm length, 3mm particle size) with amobile phase consisting of water–acetonitrile bothacidified with 0.3% formic acid. All the analyteswere co-eluted with a retention time of,2.5 min. Fig. 12. Peak shape for oxytetracycline before and after treatmentFor each TCA the collisional decomposition of the of the LC column with a 0.1M EDTA solution (from [49]).
A. Di Corcia, M. Nazzari / J. Chromatogr. A 974 (2002) 53–89 71
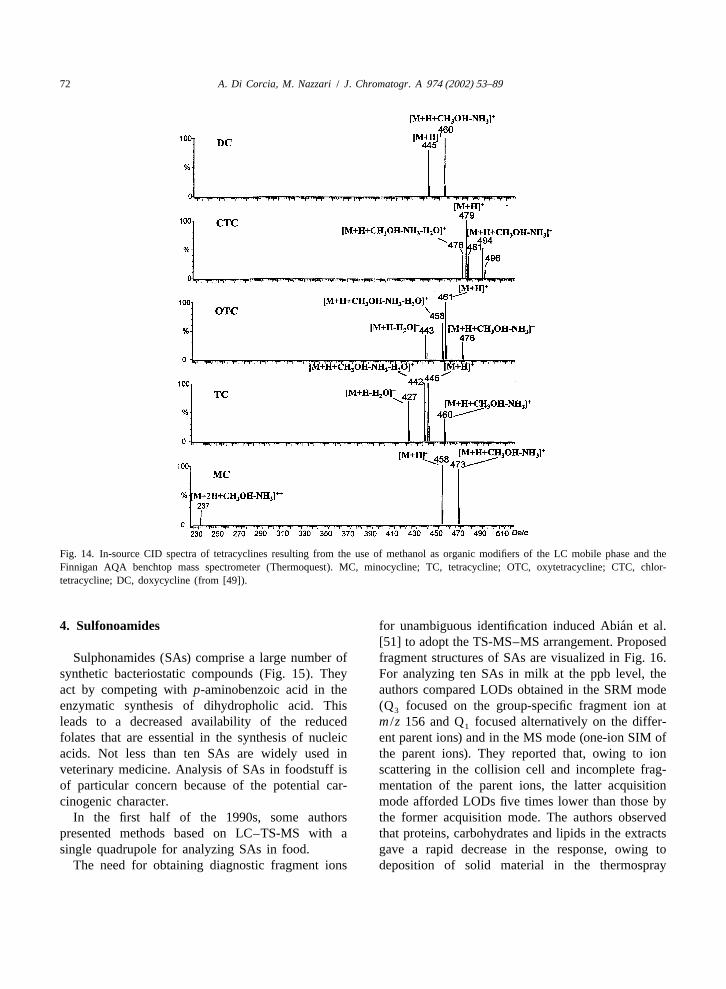
EDTA solution before direct application to the fragment ions produced by loss of only water, orCarbograph 4 SPE cartridge. The presence of EDTA replacing methanol with acetonitrile, or changing theserves to inhibit binding of the analytes to metal ESI-MS instrumentation. We believe that the anomal-ions. With egg samples, after dilution with the ous but highly diagnostic product ions are the resultEDTA-containing solution and before extraction with of a gas-phase reaction occurring in the desolvationCarbograph 4, the suspension was filtered through a chamber according to:paper filter to avoid clogging of the SPE cartridge.Absolute recovery of the five TCAs in the twomatrices ranged between 72 and 96%. The problemof metal chelation resulting in badly tailed peaks forTCAs was once and for all solved by extensivelywashing the silica-based stationary phase with anaqueous Na EDTA solution (Fig. 12), according to a2
previously reported procedure [50]. By doing this, asimple and conventional mobile phase consisting ofwater–methanol–formic acid (10 mM) could be usedfor chromatographing TCAs in the gradient elutionmode (Fig. 13). Setting the column temperature at15 8C (see Fig. 10) minimized partial conversion ofCTC and DC to their isomeric forms. By the ESI-MSdevice used in this work (Finnigan AQA massspectrometer) and with methanol as mobile phaseorganic modifier, the in-source CID process gener- The estimated limits of quantification (S /N510)ated reproducible nonconventional fragment ions of the method were 2–9 ppb TCAs in whole milk(Fig. 14). This effect was not observed for those and 2–19 ppb TCAs in eggs.
Fig. 13. LC–ES-MS multiple-ion SIM chromatogram resulting from the analysis of a raw milk sample amended with 25 ppb oftetracyclines (from [49]).
72 A. Di Corcia, M. Nazzari / J. Chromatogr. A 974 (2002) 53–89
Fig. 14. In-source CID spectra of tetracyclines resulting from the use of methanol as organic modifiers of the LC mobile phase and theFinnigan AQA benchtop mass spectrometer (Thermoquest). MC, minocycline; TC, tetracycline; OTC, oxytetracycline; CTC, chlor-tetracycline; DC, doxycycline (from [49]).
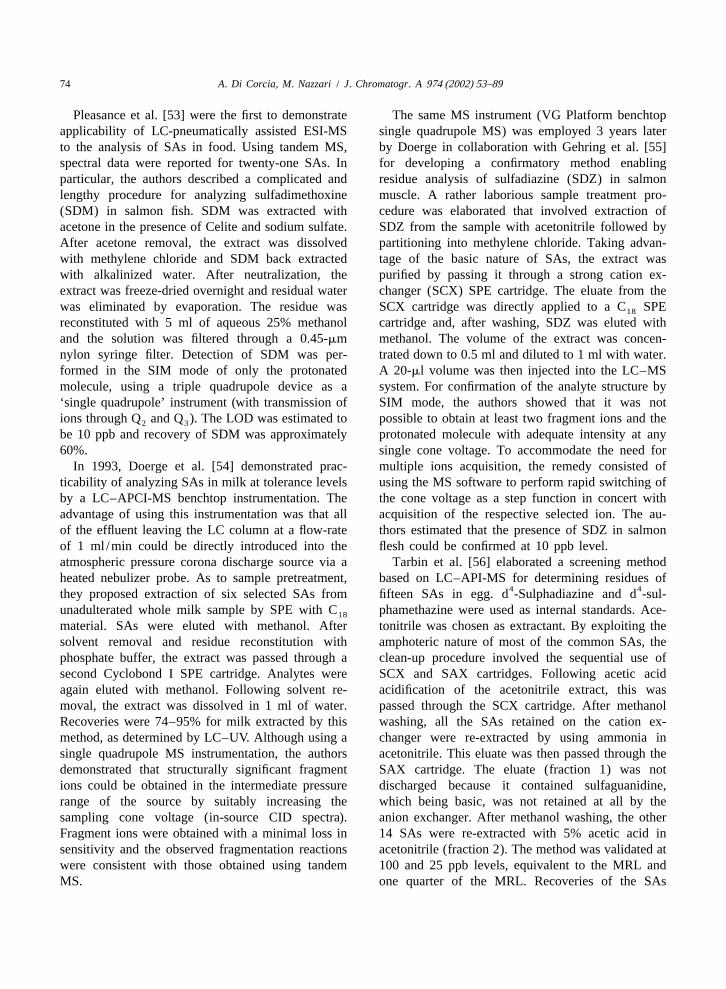
´4 . Sulfonoamides for unambiguous identification induced Abian et al.[51] to adopt the TS-MS–MS arrangement. Proposed
Sulphonamides (SAs) comprise a large number of fragment structures of SAs are visualized in Fig. 16.synthetic bacteriostatic compounds (Fig. 15). They For analyzing ten SAs in milk at the ppb level, theact by competing withp-aminobenzoic acid in the authors compared LODs obtained in the SRM modeenzymatic synthesis of dihydropholic acid. This (Q focused on the group-specific fragment ion at3
leads to a decreased availability of the reduced m /z 156 and Q focused alternatively on the differ-1
folates that are essential in the synthesis of nucleic ent parent ions) and in the MS mode (one-ion SIM ofacids. Not less than ten SAs are widely used in the parent ions). They reported that, owing to ionveterinary medicine. Analysis of SAs in foodstuff is scattering in the collision cell and incomplete frag-of particular concern because of the potential car- mentation of the parent ions, the latter acquisitioncinogenic character. mode afforded LODs five times lower than those by
In the first half of the 1990s, some authors the former acquisition mode. The authors observedpresented methods based on LC–TS-MS with a that proteins, carbohydrates and lipids in the extractssingle quadrupole for analyzing SAs in food. gave a rapid decrease in the response, owing to
The need for obtaining diagnostic fragment ions deposition of solid material in the thermospray
A. Di Corcia, M. Nazzari / J. Chromatogr. A 974 (2002) 53–89 73
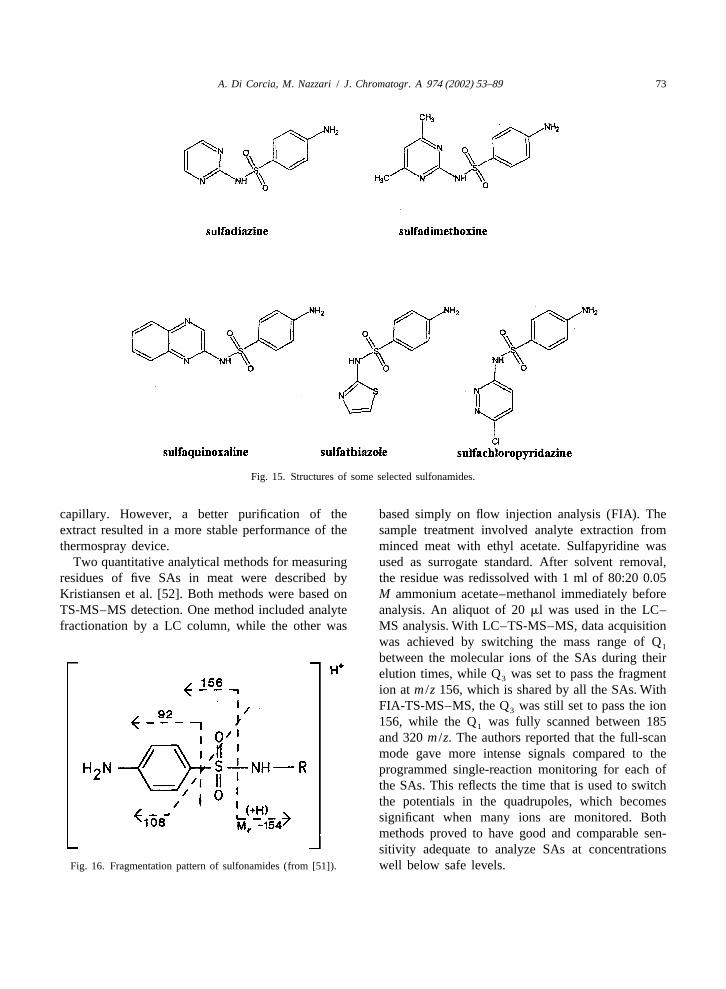
Fig. 15. Structures of some selected sulfonamides.
capillary. However, a better purification of the based simply on flow injection analysis (FIA). Theextract resulted in a more stable performance of the sample treatment involved analyte extraction fromthermospray device. minced meat with ethyl acetate. Sulfapyridine was
Two quantitative analytical methods for measuring used as surrogate standard. After solvent removal,residues of five SAs in meat were described by the residue was redissolved with 1 ml of 80:20 0.05Kristiansen et al. [52]. Both methods were based on M ammonium acetate–methanol immediately beforeTS-MS–MS detection. One method included analyte analysis. An aliquot of 20ml was used in the LC–fractionation by a LC column, while the other was MS analysis. With LC–TS-MS–MS, data acquisition
was achieved by switching the mass range of Q1
between the molecular ions of the SAs during theirelution times, while Q was set to pass the fragment3
ion at m /z 156, which is shared by all the SAs. WithFIA-TS-MS–MS, the Q was still set to pass the ion3
156, while the Q was fully scanned between 1851
and 320m /z. The authors reported that the full-scanmode gave more intense signals compared to theprogrammed single-reaction monitoring for each ofthe SAs. This reflects the time that is used to switchthe potentials in the quadrupoles, which becomessignificant when many ions are monitored. Bothmethods proved to have good and comparable sen-sitivity adequate to analyze SAs at concentrations
Fig. 16. Fragmentation pattern of sulfonamides (from [51]). well below safe levels.
74 A. Di Corcia, M. Nazzari / J. Chromatogr. A 974 (2002) 53–89
Pleasance et al. [53] were the first to demonstrate The same MS instrument (VG Platform benchtopapplicability of LC-pneumatically assisted ESI-MS single quadrupole MS) was employed 3 years laterto the analysis of SAs in food. Using tandem MS, by Doerge in collaboration with Gehring et al. [55]spectral data were reported for twenty-one SAs. In for developing a confirmatory method enablingparticular, the authors described a complicated and residue analysis of sulfadiazine (SDZ) in salmonlengthy procedure for analyzing sulfadimethoxine muscle. A rather laborious sample treatment pro-(SDM) in salmon fish. SDM was extracted with cedure was elaborated that involved extraction ofacetone in the presence of Celite and sodium sulfate. SDZ from the sample with acetonitrile followed byAfter acetone removal, the extract was dissolved partitioning into methylene chloride. Taking advan-with methylene chloride and SDM back extracted tage of the basic nature of SAs, the extract waswith alkalinized water. After neutralization, the purified by passing it through a strong cation ex-extract was freeze-dried overnight and residual water changer (SCX) SPE cartridge. The eluate from thewas eliminated by evaporation. The residue was SCX cartridge was directly applied to a C SPE18
reconstituted with 5 ml of aqueous 25% methanol cartridge and, after washing, SDZ was eluted withand the solution was filtered through a 0.45-mm methanol. The volume of the extract was concen-nylon syringe filter. Detection of SDM was per- trated down to 0.5 ml and diluted to 1 ml with water.formed in the SIM mode of only the protonated A 20-ml volume was then injected into the LC–MSmolecule, using a triple quadrupole device as a system. For confirmation of the analyte structure by‘single quadrupole’ instrument (with transmission of SIM mode, the authors showed that it was notions through Q and Q ). The LOD was estimated to possible to obtain at least two fragment ions and the2 3
be 10 ppb and recovery of SDM was approximately protonated molecule with adequate intensity at any60%. single cone voltage. To accommodate the need for
In 1993, Doerge et al. [54] demonstrated prac- multiple ions acquisition, the remedy consisted ofticability of analyzing SAs in milk at tolerance levels using the MS software to perform rapid switching ofby a LC–APCI-MS benchtop instrumentation. The the cone voltage as a step function in concert withadvantage of using this instrumentation was that all acquisition of the respective selected ion. The au-of the effluent leaving the LC column at a flow-rate thors estimated that the presence of SDZ in salmonof 1 ml /min could be directly introduced into the flesh could be confirmed at 10 ppb level.atmospheric pressure corona discharge source via a Tarbin et al. [56] elaborated a screening methodheated nebulizer probe. As to sample pretreatment, based on LC–API-MS for determining residues of
4 4they proposed extraction of six selected SAs from fifteen SAs in egg. d -Sulphadiazine and d -sul-unadulterated whole milk sample by SPE with C phamethazine were used as internal standards. Ace-18
material. SAs were eluted with methanol. After tonitrile was chosen as extractant. By exploiting thesolvent removal and residue reconstitution with amphoteric nature of most of the common SAs, thephosphate buffer, the extract was passed through a clean-up procedure involved the sequential use ofsecond Cyclobond I SPE cartridge. Analytes were SCX and SAX cartridges. Following acetic acidagain eluted with methanol. Following solvent re- acidification of the acetonitrile extract, this wasmoval, the extract was dissolved in 1 ml of water. passed through the SCX cartridge. After methanolRecoveries were 74–95% for milk extracted by this washing, all the SAs retained on the cation ex-method, as determined by LC–UV. Although using a changer were re-extracted by using ammonia insingle quadrupole MS instrumentation, the authors acetonitrile. This eluate was then passed through thedemonstrated that structurally significant fragment SAX cartridge. The eluate (fraction 1) was notions could be obtained in the intermediate pressure discharged because it contained sulfaguanidine,range of the source by suitably increasing the which being basic, was not retained at all by thesampling cone voltage (in-source CID spectra). anion exchanger. After methanol washing, the otherFragment ions were obtained with a minimal loss in 14 SAs were re-extracted with 5% acetic acid insensitivity and the observed fragmentation reactions acetonitrile (fraction 2). The method was validated atwere consistent with those obtained using tandem 100 and 25 ppb levels, equivalent to the MRL andMS. one quarter of the MRL. Recoveries of the SAs
A. Di Corcia, M. Nazzari / J. Chromatogr. A 974 (2002) 53–89 75
ranged from 33% for sulfaguanidine to 92% for approach was adopted to detect, confirm and quan-sulfamethazine and sulfadimethoxine. For identifica- tify SAs in milk samples: (1) prescreening (andtion and quantitation, an evolved model of the above confirmation) of target compounds by precursor-ionmentioned Platform APCI-MS system equipped with scan and/or multiple reaction monitoring (MRM)a single quadrupole was used. Mass data acquisition experiments using class-specific fragment ions; (2)was performed in the SIM mode by monitoring the quantification of identified target compounds by
1[M1H] ions. monitoring their protonated molecules by time-Application of ESI-MS–MS in the SRM mode to scheduled SIM; (3) further confirmation, if neces-
monitoring SA residues in food dates back to 1994. sary, by time-scheduled SRM using compound-spe-Based on the above detection system, Porter [57] cific fragment ions. The author concluded thatdescribed a method for analyzing five SAs in pig simultaneous confirmation of all analytes present atkidney. Compared to ESI-MS with SIM acquisition levels between 0.2 and 10 ppb was readily possiblemode, the use of ESI-MS–MS in the SRM mode using time-scheduled MRM.offered sensitivity more than 13 times higher, due to Ito et al. [60] presented a LC–ESI-MS–MS meth-reduction in noise. For each analyte, three transitions od able to quantify ten SAs in animal liver andbetween the parent ion and three class-specific kidney at the tolerance levels with a high identifica-fragment ions, i.e.m /z 92, 108, 156 were used. tion power achieved by CID spectra obtained bySample pretreatment was carried out by extracting scanning the third quadrupole. The SAs were ex-SAs with acidified ethyl acetate. The extract was tracted with ethyl acetate. After solvent removal,purified by first passing it through a SPE cartridge SAs were dissolved with ethylacetate–hexanefilled with a weak cation-exchange sorbent material (50:50, v /v). For clean-up of the crude extract, thisand then through a SCX extraction cartridge. solution was passed through a WCX extraction
Casetta et al. [58] devised a LC–ESI-MS–MS cartridge. Analytes were re-extracted by 5 ml of 20%method for determining sulfamethazine and sul- acetonitrile–0.05 ammonium formate and 20ml offathiazole in honey. Mass data acquisition was this solution were injected into the LC–MS–MSperformed in the SRM mode by monitoring the apparatus.transitions 279→124 and 256→108 for sulfametha-zine and sulfathiazole, respectively. In spite of the 5 . Aminoglycosidesfact that the ion source (high flow ionspray) couldaccept the entire LC eluent flow (1 ml /min), the Aminoglycosides (AGs) are active against a broadauthors decided to split the column effluent by a spectrum of Gram-negative and Gram-positive bac-factor of 1:25 before entering the source. In this way, teria. They exert their antibacterial effect by bindingany matrix component makes the ion source 25 times to the 30S ribosome, which disrupt bacterial proteinless dirty than with a full flow-rate with no loss of synthesis. The chemical structures of AGs are basedsensitivity, as the ESI-MS system is a concentration- on a aminocyclitol ring (2-deoxystreptamine, in mostdependent detector. Sample preparation was carried cases) connected to two or more amino sugars in aout by extracting the two analytes with methylene glycoside linkage (Fig. 17). It is believed thatchloride from water-diluted and salted honey. The improper use of this antibiotic class may generateextract was passed through a Florisil SPE cartridge residues that are potentially harmful due to oto- andand analytes were eluted with methanol. This was nephrotoxicity.removed by evaporation and SAs redissolved in 1 ml McLaughlin and Henion [61] evaluated theof an acidified water–acetonitrile solution (1:1). feasibility of using LC–MS for analyzing four AGs,
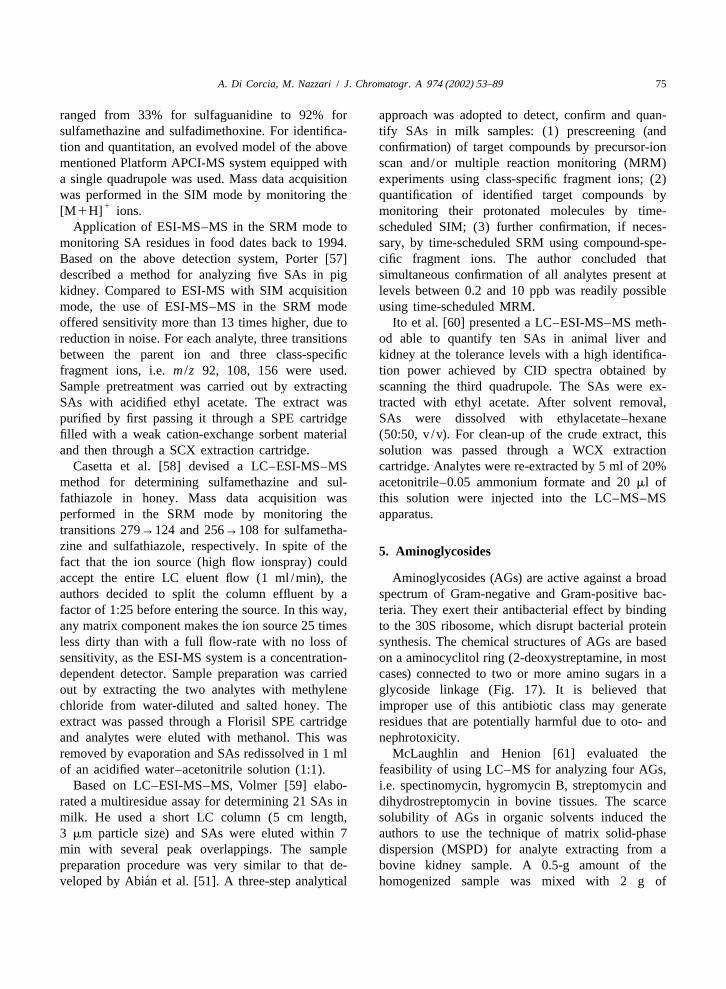
Based on LC–ESI-MS–MS, Volmer [59] elabo- i.e. spectinomycin, hygromycin B, streptomycin andrated a multiresidue assay for determining 21 SAs in dihydrostreptomycin in bovine tissues. The scarcemilk. He used a short LC column (5 cm length, solubility of AGs in organic solvents induced the3 mm particle size) and SAs were eluted within 7 authors to use the technique of matrix solid-phasemin with several peak overlappings. The sample dispersion (MSPD) for analyte extracting from apreparation procedure was very similar to that de- bovine kidney sample. A 0.5-g amount of the
´veloped by Abian et al. [51]. A three-step analytical homogenized sample was mixed with 2 g of
76 A. Di Corcia, M. Nazzari / J. Chromatogr. A 974 (2002) 53–89
Fig. 17. Structures of the aminocyclitol and aminoglycoside antibiotics (redrawn from [61]).
cyanopropyl-bonded silica. After blending, the solid The authors studied the effects of the nature andmaterial was packed into an empty SPE cartridge. concentration of pairing ions on LC separation andThe cartridge was then washed sequentially with ionization efficiency of the analytes in the electro-hexane, ethylacetate, methanol and 50% methanol in sprayed solutions. SIM acquisition was adopted for
1water. The analytes were eluted with 1 ml of water detecting the [M1H O1H] ion at m /z 351 and2
followed by 8 ml of 0.05M sulfuric acid. The eluate 301 relative to respectively spectinomycin and strep-21volume was reduced by a factor 4, neutralized with tomycin, the [M12H] ions at m /z 265 and 293
ammonia and 10ml of the final solution was injected relative to respectively hygromycin B and dihydro-into the LC–ESI-MS apparatus, which was operated streptomycin. These compounds could be detected inin the PI mode. A C analytical column was used bovine kidney at 20 ppm level, which is well above18
and the analytes were chromatographed by ion-pair levels of regulatory interest.LC with pentafluoropropyl acid as ion pair reagent. Two years later, McLaughlin et al. [62] improved
A. Di Corcia, M. Nazzari / J. Chromatogr. A 974 (2002) 53–89 77
the above method in terms of sensitivity and spe- poor signal for the precursor ion. The fragment ionscificity. In addition to the four AGs mentioned observed were qualitatively comparable to thoseabove, neomycin B and four components of the reported using a triple quadrupole instrument. How-gentamycin C complex were considered. Improve- ever, a poor chromatographic performance (peakment in the sensitivity was achieved mainly by tailing, peak splitting, some significant differences ofconcentrating the original eluate by a factor of 53. retention times between standard and extract res-With tandem MS, data acquisition in the SRM mode idues) and high day-to-day variability of the ion trapby choosing three transitions for each analyte (where quantitative response (sum of fragment ionsm /z 140,possible) provided a high level of specificity. The 186–190 and 227) induced the authors to concludeauthors studied the fragmentation patterns of the that the method needed some improvement to meetcompounds considered and reportedm /z values of guidelines for regulatory determination in the US.their product ions in their work [62]. The remedy of LC–APCI-MS–MS was employed by Hornish andanalyte ion suppression by matrix components was Wiest [64] for elaborating a confirmatory method ofthat of adopting fortified control tissue samples as analysis for spectinomycin in various bovine tissues.standards. All compounds could be detected (while Spectinomycin was extracted from ground tissue bymonitoring three ions by SRM) in bovine kidney at adding a citric acid buffer and trichloroacetic acid toor below the regulatory level of concern, with the the sample. Methylene chloride was also added toexception of spectinomycin. The failure in detecting eliminate non polar potentially interfering com-spectinomycin at the regulatory level was also due to pounds. After shaking and centrifuging, the aqueousa severe loss of the analyte occurring during sample extract was purified by passing it through a C SPE18
treatment. cartridge and spectinomycin was eluted from theCarson and Heller [63] developed a confirmatory cartridge by a citric acid buffer. Recovery of spec-
method for residues of spectinomycin in bovine tinomycin ranged between 85 and 94%, irrespectivemilk. Adding trichloroacetic acid and centrifuging of the type of the tissue and of the fortification leveleliminated proteins. An aliquot of the middle aque- (0.1–10 ppm). The target compound was chromato-ous layer was first diluted with an aqueous solution graphed on a C column with a mobile phase18
containing an ion pair reagent, i.e. heptafluorobutyric consisting of 1% acetic acid–methanol (92:8, v /v).acid (HFBA), and then applied to a C SPE Q was set tom /z 333 (molecular ion), while Q was18 1 3
cartridge. Spectinomycin was eluted with a metha- set to scan the selected fragment ions atm /z 98, 116,nol–water mixture (4:1, v /v) containing HFBA. The 158 and 189. The limit of confirmation was esti-eluate was concentrated to 1 ml and filtered through mated to be 50 ppb.0.2-mm pore size, 13 mm diameter PDVF syringe A procedure for the confirmation of neomycin andfilter (Whatman). A 20-ml aliquot of the final extract gentamicin in milk at 30 ppb level has been recentlywas injected into a LC–ESI-ion trap MS system. The reported [65]. This method is based on weak cation-column was a PLRP–S 1530.21 cm, 5mm particle exchange extraction and analyte monitoring by ESI-size. The mobile phase was a water–methanol solu- ion trap-MS. Milk was first treated with acid andtion containing HFBA as ion pair reagent. In full centrifuged. The supernate was buffered at neutralscan MS mode, the spectrum displayed the proton- pH by sodium citrate and applied to a WCX SPEated hydrated molecule (m /z 351) as the major ion, cartridge. Targeted compounds were eluted withwhile the molecular ion (m /z 333) was present with acidic methanol. Following separation by ion-paira 30% relative abundance. In the MS–MS mode, LC, analytes were ionized with an ESI interface.CID of the 351 ion substantially produced only the Protonated molecular ions were selectively stored in333 molecular ion. Since this condition was not an ion trap MS, then decomposed giving CID spectrasufficiently specific for confirmatory purpose, the displaying several diagnostic fragment ions. Toauthors selected the latter ion as the precursor ion for obviate matrix effect causing the absolute responseMS–MS analysis. The optimum collision energy to increase in extracts as compared to pure standards,value was rather critical and reproducible fragment quantitation was performed using fortified controlion spectra were obtained under a condition giving a tissue samples as standards.
78 A. Di Corcia, M. Nazzari / J. Chromatogr. A 974 (2002) 53–89
6 . Macrolides (m /z 734→576 and 734→158). Under this con-dition, erythromicin could be detected under a puta-
Macrolide antibiotics are macrocyclic lactones tive tolerance level of 100 ppb. By analyzing flesh ofisolated first from Streptomyces spp. The chemical salmon exposed to erythromicin, the authors showedstructures of macrolides consist of a 12-, 14- or that their method could enable detection of a number16-membered macrocyclic lactone to which sugar of metabolites and degradation product of the abovemoieties, including amino and deoxy sugars, are antibiotic. However, the authors commented thatattached (Fig. 18). Macrolides are an important class their method needed an improved clean-up proce-of antibiotics widely used in veterinary practice to dure, as the analysis of only a few sample requiredtreat respiratory diseases and enteric infections in replacement of the guard column.cattle, sheep, swine and poultry. Studies with dogs, Kiel and Kessington [67] explored the potentialcattle, pigs and monkeys have revealed that the toxic for the application of LC–APCI-MS with a singleeffects associated with a member of the class of quadrupole as a confirmatory method for tilmicosinmacrolide antibiotics, i.e. tilmicosin, involve the in swine liver. Singularly, the authors referred tocardiovascular system. unpublished data for a description of the sample
In 1992, Pleasance et al. [66] investigated the treatment. The analyte was isocratically eluted fromfeasibility of using LC–ESI-MS–MS for determining a C column using a mobile phase consisting of8
erythromicin in salmon muscle. A minced sample 5 mM ammonium acetate (adjusted to pH 4.5)–was homogenized twice in acetonitrile prior to acetonitrile (40:60, v /v). By suitably controlling thecentrifugation and filtration of the supernatant. Fats cone voltage, in-source CID generated two diagnos-
1were removed by hexane partitioning. Erythromicin tic fragment ions (m /z 696, 174) from the [M1H]was extracted from alkalinized and salted acetonitrile ion (m /z 869). Mass spectral data were collected bywith methylene chloride. This solvent was replaced using three-ion SIM. While this method may beby methanol for reversed-phase LC–MS analysis. A sufficiently sensitive, nothing can be said on the1/200 aliquot of the final extract was injected onto a simplicity and robustness of the sample treatmentC LC column that was operated with an aqueous procedure.8
acetonitrile mobile phase acidified with 0.2% formic It is known that a critical limitation of ESI andacid. Erythromicin was eluted by a linear gradient APCI ion sources is the susceptibility to blockage ofelution of 5–65% acetonitrile in 15 min. For confir- interface orifice due to the deposition of involatilematory purpose, the authors proposed acquisition in additives eventually present in the mobile phase.the PI mode by monitoring two selected transitions Bajic et al. [18] presented a method for analyzing
Fig. 18. Two examples of macrolide antibiotics.
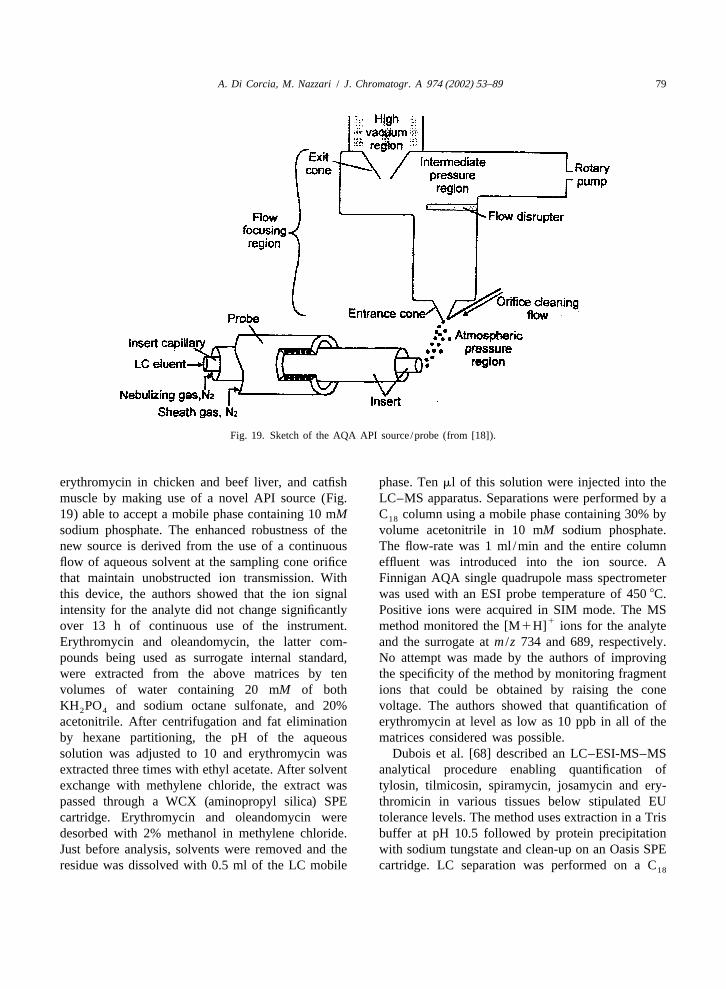
A. Di Corcia, M. Nazzari / J. Chromatogr. A 974 (2002) 53–89 79
Fig. 19. Sketch of the AQA API source/probe (from [18]).
erythromycin in chicken and beef liver, and catfish phase. Tenml of this solution were injected into themuscle by making use of a novel API source (Fig. LC–MS apparatus. Separations were performed by a19) able to accept a mobile phase containing 10 mM C column using a mobile phase containing 30% by18
sodium phosphate. The enhanced robustness of the volume acetonitrile in 10 mM sodium phosphate.new source is derived from the use of a continuous The flow-rate was 1 ml /min and the entire columnflow of aqueous solvent at the sampling cone orifice effluent was introduced into the ion source. Athat maintain unobstructed ion transmission. With Finnigan AQA single quadrupole mass spectrometerthis device, the authors showed that the ion signal was used with an ESI probe temperature of 4508C.intensity for the analyte did not change significantly Positive ions were acquired in SIM mode. The MS
1over 13 h of continuous use of the instrument. method monitored the [M1H] ions for the analyteErythromycin and oleandomycin, the latter com- and the surrogate atm /z 734 and 689, respectively.pounds being used as surrogate internal standard, No attempt was made by the authors of improvingwere extracted from the above matrices by ten the specificity of the method by monitoring fragmentvolumes of water containing 20 mM of both ions that could be obtained by raising the coneKH PO and sodium octane sulfonate, and 20% voltage. The authors showed that quantification of2 4
acetonitrile. After centrifugation and fat elimination erythromycin at level as low as 10 ppb in all of theby hexane partitioning, the pH of the aqueous matrices considered was possible.solution was adjusted to 10 and erythromycin was Dubois et al. [68] described an LC–ESI-MS–MSextracted three times with ethyl acetate. After solvent analytical procedure enabling quantification ofexchange with methylene chloride, the extract was tylosin, tilmicosin, spiramycin, josamycin and ery-passed through a WCX (aminopropyl silica) SPE thromicin in various tissues below stipulated EUcartridge. Erythromycin and oleandomycin were tolerance levels. The method uses extraction in a Trisdesorbed with 2% methanol in methylene chloride. buffer at pH 10.5 followed by protein precipitationJust before analysis, solvents were removed and the with sodium tungstate and clean-up on an Oasis SPEresidue was dissolved with 0.5 ml of the LC mobile cartridge. LC separation was performed on a C18

80 A. Di Corcia, M. Nazzari / J. Chromatogr. A 974 (2002) 53–89
column with a gradient of 0.1M ammonium acetate– the PI mode. Identification and quantitation ofacetonitrile as mobile phase. Protonated molecules danofloxacin was performed in the SRM mode byserved as precursor ions for ESI in the PI mode and choosing two transitions, i.e. 358→340 andthe most abundant fragment ion was chosen for each 358→255. The fragment ion atm /z 340 formed byanalyte for MRM acquisition. Eventually, further loss of water, while the ion atm /z 255 was post-confirmation could be achieved by including three ulated to originate by losses of water1N-additional product ions for multiple MRM acquisi- methylpyrrolidine from the piperazine moiety. Au-tion. thors estimated that the method can enable confirma-
A confirmatory method for three macrolides tion of danofloxacin down to 50 ppb.(tylosin, tilmicosin and erythromicin) in bovine Doerge and Bajic [73] evaluated performances oftissues by micro-LC–ESI-MS–MS was presented by both LC–MS and LC–MS–MS instrumentations forDraisci and co-workers [69,70]. The molecular re- determining and quantifying nalidixic, oxolinic,
21lated ion, [M12H] , at m /z 435 for tilmicosin, the piromidic acids, and flumequine, in catfish muscle.1[M1H] ions at m /z 734 and 916 for respectively Protonated molecules were obtained by an APCI ion
erythromicin and tylosin were the precursor ions and source. With the former equipment, fragmentation of1two fragment ions for each macrolide were used for the [M1H] ions was induced by in-source CID.
SRM operation. Analyte extraction and clean-up was Under these conditions, all of the analyte spectracarried out according to a previously reported pro- indicated losses of water and CO . SIM of the2
cedure [71]. Depending on the nature of both ma- protonated molecule plus the two fragment ions fortrices and analytes, limits of quantification ranged each compound allowed detection in catfish musclebetween 30 and 150 ppb, and were all below MRLs at levels of 0.8–1.7 ppb. A ten times lower detectionissued by EU. limit was obtained by the MS–MS arrangement by
exploiting the MRM acquisition mode. Only one1 1transition, i.e. [M1H] →[M2H O1H] , was2
7 . Quinolones chosen for each analyte. The four analytes wereeluted on a styrene–divinylbenzene copolymer LC
Quinolones are a group of relatively new anti- column using a mobile phase gradient consisting ofbiotics synthesized from 3-quinolonecarboxylic acid. 22–38% solvent A (acetonitrile) in solvent B (9%Some representative structures are shown in Fig. 20. tetrahydrofuran in 25 mM acetic acid) over 20 min.Quinolones show excellent activity against both The sample preparation procedure was not describedGram-positive and Gram-negative organisms, as well by the authors.anaerobes. They act to inhibit DNA gyrase a key Schilling et al. [74] developed an analytical pro-enzyme in DNA replication. cedure for confirming trace levels of sarafloxacin in
A confirmatory method for monitoring residues of catfish tissue based on LC–ESI-MS–MS. Catfishdanofloxacin in chicken and bovine liver by micro- tissue was first homogenized with 1M NaOH andLC–ESI-MS–MS was developed by Schneider et al. then protein were precipitated with an acetonitrile–[72]. To liver homogenate, 0.15M of both phosphor- 85% phosphoric acid solution (2:1, v /v). Afteric and perchloric acids in equal volumes of metha- centrifugation, the extract was purified by a C SPE18
nol–water were added. Then, the sample was again cartridge. After washings, sarafloxacin was desorbedhomogenized and incubated 1 h at 558C. After by an acetonitrile–0.04M citric acid (pH 2.4)centrifugation, the supernatant pH was adjusted to solution. The eluate was evaporated to a dry residue8.5 and the analytes were extracted with methylene and redissolved in the LC mobile phase. Differentlychloride. After evaporation, the residue was dis- from Doerge and Bajic [73], an analyte-specificsolved with 50ml of the LC mobile phase and 1ml fragment ion was also selected for MS–MS opera-was injected onto the above apparatus. The mobile tion. The method allowed for the detection ofphase consisted of acetonitrile–0.1% trifluoroacetic sarafloxacin of 200 ppb in catfish tissue.acid, while the stationary phase was a base-deacti- Volmer et al. [75] described a multiresidue methodvated C column. The MS–MS system operated in for simultaneous detection and confirmation of18
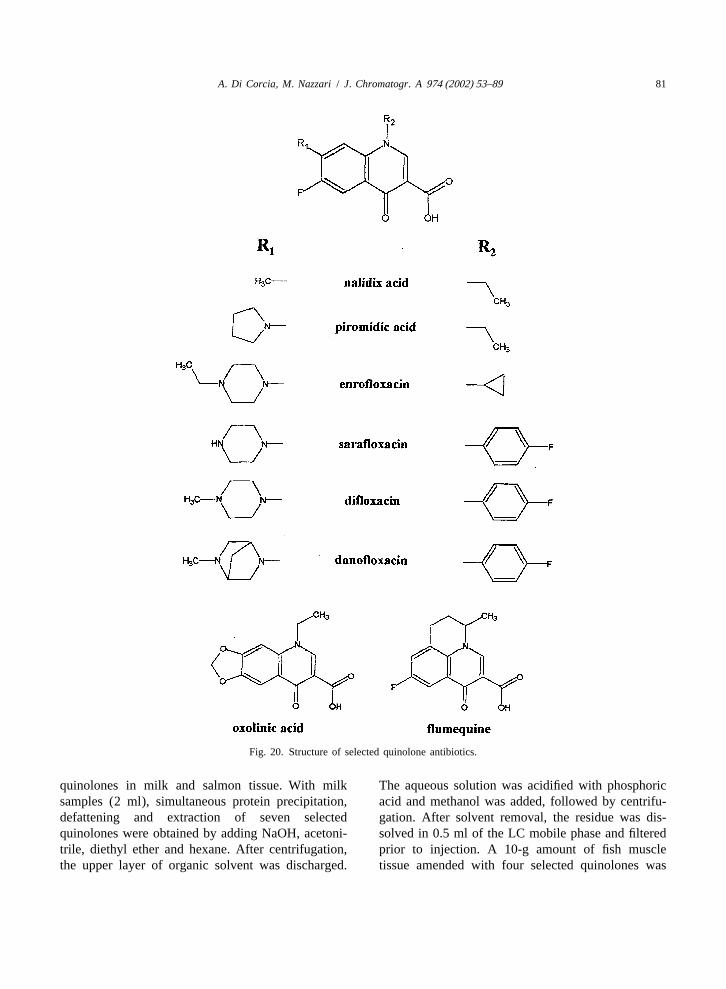
A. Di Corcia, M. Nazzari / J. Chromatogr. A 974 (2002) 53–89 81
Fig. 20. Structure of selected quinolone antibiotics.
quinolones in milk and salmon tissue. With milk The aqueous solution was acidified with phosphoricsamples (2 ml), simultaneous protein precipitation, acid and methanol was added, followed by centrifu-defattening and extraction of seven selected gation. After solvent removal, the residue was dis-quinolones were obtained by adding NaOH, acetoni- solved in 0.5 ml of the LC mobile phase and filteredtrile, diethyl ether and hexane. After centrifugation, prior to injection. A 10-g amount of fish musclethe upper layer of organic solvent was discharged. tissue amended with four selected quinolones was
82 A. Di Corcia, M. Nazzari / J. Chromatogr. A 974 (2002) 53–89
first homogenized with acetone. The watery acetone fractionation, a C column was used. The mobile18
extract was defatted with hexane, and the analytes phase composition was acetonitrile–water containingwere subsequently extracted with chloroform. This 1% formic acid and 50 mM ammonium acetatesolvent was evaporated to dryness and the residue (20:80, v /v) programmed to 40:60 in 5 min, then towas dissolved in 1 ml of water that was filtered prior 80:20 in 6 min. Acquisition was performed in the PIto injection. Analyte recovery was 56–95%. Sepa- mode. Confirmatory ions were obtained by in-sourcerations were accomplished on a short column (5 cm) CID. Four ions for each quinolone were monitored inpacked with 3-mm phenyl-bonded silica. The mobile the SIM mode. The LOCs of the method permittedphase composition was acetonitrile–water (2:98, the confirmation of the six quinolones down to 7.5v/v) acidified with 20 mM formic acid programmed ppb.to 57:43 in 10 min. LC–ESI-MS–MS equipment was A multiresidue LC–ESI-MS method was de-employed for identifying and quantifying quinolones. veloped for identification of ciprofloxacine, enroflox-The strategy proposed by the authors to detect, acine, sarafloxacine and difloxacine in catfish muscleconfirm and quantify 7-piperazinyl-6-fluoro- at 10 ppb level [77]. Quinolones were twice ex-quinolones in milk samples was as follows: (a) tracted from 2 g of catfish muscle with ethanol–prescreening of target and nontarget quinolone anti- water glacial acetic acid (98:1:1, v /v). After thebiotics by constant neutral loss scan experiments second centrifugation, other acetic acid was added to
1 1using the [M1H] →[MH287] transition; (b) the combined supernatants. This solution was placedquantification of identified target compounds by in freezer for 30 min and then centrifuged. Themonitoring their protonated molecules in a time- supernatant was cleaned up on a SCX SPE cartridge.scheduled SIM operation; (c) further confirmation, if After washing with methanol, the analytes werenecessary, by SRM using three characteristic transi- eluted with 30% ammonia–methanol (1:4, v /v).tions. The LODs in milk in SIM of protonated After drying, the residue was reconstituted in 0.5 mlmolecules were 0.2–2 ppb for six 7-piperazinyl-6- mobile phase and this solution was filtered. A 50-mlfluoroquinolones, and 0.5 ppb for enrofloxacin. aliquot was injected into the LC column. TheLimits of confirmation (LOCs) by MS–MS were chromatography was performed on a phenyl-bondedbetween 1 and 2 ppb. The SIM LODs of four acidic silica. The mobile phase consisted of 2% formic4-quinolones, which are typical in aquaculture appli- acid–acetonitrile (86:14). By adjusting the conecation, were about 1 ppb for all the analytes. Unlike voltage, in-source CID provided two class-specific7-piperazinyl-6-fluoroquinolones, the four acidic 4- and one compound-specific fragment ions for eachquinolones do not exhibit class-specific fragment quinolone. Acquisition was performed by time-ions. For confirmatory purposes, then, characteristic scheduled four-ion SIM.product ions were monitored by using three transi-tions for each analyte.
Delepine et al. [76] described an LC–APCI-MS 8 . Polyether ionophoremethod for the confirmation of six quinolones (en-rofloxacine, ciprofloxacine, marbofloxacine, danofl- Polyether ionophore antibiotics are fermentation-oxacine, sarafloxacine and difloxacine) in pig mus- derived biologically active compounds characterizedcle. The analytes were extracted from 2 g of tissue by the presence of a carboxylic acid group andwith phosphate buffer (pH 7.4). After centrifugation, several cyclic units (Fig. 21). The term ionophorethe supernatant was purified on a C SPE cartridge. derives from their ability to form stable complexes18
After washings, the analytes were eluted from the with alkaline cations. They are widely used ascartridge with 1 ml of 1% trifluoroacetic acid anticoccidiosis agents in broiler chickens and as feedfollowed by 0.5 ml of acetonitrile. After solvent efficiency enhancers in cattle and sheep.removal by evaporation, the residue was redissolved An LC–ESI-MS–MS for the residue analysis ofin 200ml of acetonitrile and the solution was diluted semduramicin in chicken liver was described byto 2 ml with water. A 100-ml aliquot of the resulting Schneider et al. [78]. Semduramicin was extractedsolution was injected into the LC–MS system. For from 1.25 g of the tissue with methanol–1% aqueous

A. Di Corcia, M. Nazzari / J. Chromatogr. A 974 (2002) 53–89 83
Fig. 21. Structures of the most commonly used polyether ionofore antibiotics.
ammonia (8:2, v /v) and separated from co-extrac- from the latter column with a methylene chloride–tives by using first a C SPE cartridge and then a methanol (90:10, v /v) mixture. Solvents were elimi-8
silica gel SPE cartridge. Semduramicin was eluted nated by evaporation and the residue was redissolved
84 A. Di Corcia, M. Nazzari / J. Chromatogr. A 974 (2002) 53–89
in 50 ml of LC mobile phase. One tenth of this trifuging, an aliquot of the supernatant was filteredsolution was injected into the LC–MS–MS system. through a 0.45-mm syringe filter and 15ml of theThe analytical column was a C microbore column filtrate was injected into the LC–MS–MS system.18
(25031 mm) and the mobile phase consisted of Chromatography was performed using the same5 mM sodium acetate–acetonitrile (10:90, v /v) at a conditions reported by Blanchflower and Kennedyflow-rate of 40 ml /min. All of the effluent was [80]. MS–MS parameters were suitably adjusted todelivered to the ESI source. Ionophores have the give the sodiated ion atm /z 613 and two fragmentability to form several adduct ions with cations ions atm /z 577 and 377. The product ions werepresent in the electrosprayed solution. This situation monitored by the MRM mode. The LOQ of lasalocidcomplicates structural analysis and dilutes the ion in all of the matrices considered was estimated to bebeam. The rationale behind the addition of sodium 1 ppb.
´acetate to the mobile phase was that of shifting Rosen [82] developed, validated and used forequilibrium toward the formation of only the routine surveillance a method based on LC–ESI-sodiated adduct ion. However, CID of this ion MS–MS for determining traces of narasin, monensinshowed very limited fragmentation, i.e. the loss of and salinomycin in chicken liver and eggs. Essential-CO and CO1water. By monitoring both losses in ly, the aim of this work paper was that of demon-2 2
the SRM mode, the authors demonstrated that sem- strating that one single method can serve very wellduramicin in chicken liver could be quantified at for two different purposes, i.e. screening and con-level of few teens of ppb. firmation. Samples were extracted with 87% metha-
Blanchflower and Kennedy [79] presented a LC– nol and extracts were centrifuged. A single-stepESI-MS method for determining lasalocid in eggs. extract purification was automatically performed by aSamples were extracted under acidic conditions with C SPE cartridge. Analyte elution was carried out18
acetonitrile and a simple clean-up procedure consist- with methanol and an aliquot of it was submitted toing of liquid–liquid partitioning using an hexane– analysis by LC–MS–MS. The stationary phase was atoluene solution as extractant. Analyte identification C material and analyte fractionation was done18
was not highly specific as only the sodiated adduct isocratically by acetonitrile–50 mM ammonium ace-ion at m /z 613 was monitored. tate (80:20, v /v). Infusion experiments for each
The above authors used the same instrumentation compounds in both PI and NI modes were performedto develop a method enabling simultaneous determi- to individuate fragment ions and to find the bestnation of three ionophores, monensin, salinomycin condition in term of sensitivity. The sodiated mole-and narasin in muscle, liver and eggs from domestic cules gave the best response and the MS parametersfowl at 1 ppb level [80]. The sample preparation were optimized to obtain MRM transitions for eachscheme was the same as reported above [79]. Ana- sodiated complex. For screening purpose one transi-lytes were chromatographed on a C column with a tion was selected for each analyte, while four18
mobile phase consisting of acetonitrile–methanol– transition were monitored for narasin confirmation.water–trifluoroacetic acid (67:10:10:13:0.1). The By using this method, results of a 1-year monitoringESI-MS detector was set to collect multiple single- campaign revealed that 50% of the Swedish eggsion data for the ions atm /z 693, 773, and 787 were contaminated by narasin at 0.2–11 ppb levels.relative to the sodiated ions of monensin,salinomycin and narasin, respectively. Again, theconfirmatory ions observed by in-source CID were 9 . Amphenicolsnot included in the acquisition program.
For determining residues of lasalocid in animal Chloramphenicol is a broad spectrum antibiotictissues and eggs, a simple and rapid method based on frequently used in veterinary and human medicine.LC–ESI-MS–MS was developed by Matabudul et al. After publication of studies showing anemia in[81]. Following addition of anhydrous sodium sulfate humans as side effect arising from its use, chloram-to absorb water in liver, kidney and egg samples, phenicol has been banned within the USA and thelasalocid was extracted with acetonitrile. After cen- EU. Thiamphenicol and florfenicol, which have
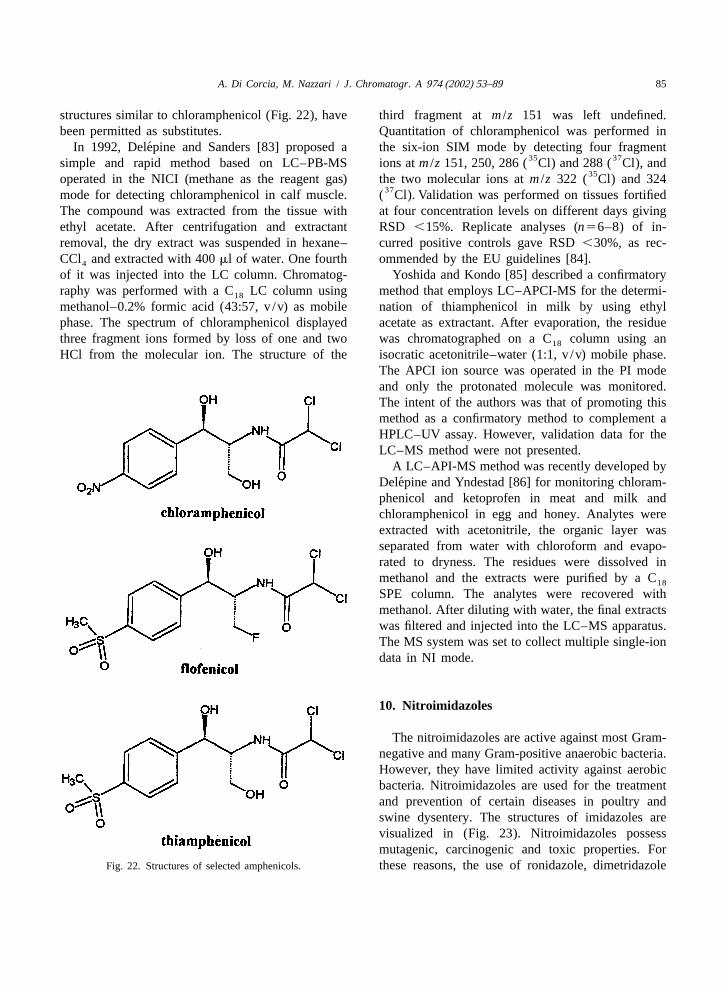
A. Di Corcia, M. Nazzari / J. Chromatogr. A 974 (2002) 53–89 85
structures similar to chloramphenicol (Fig. 22), have third fragment atm /z 151 was left undefined.been permitted as substitutes. Quantitation of chloramphenicol was performed in
´In 1992, Delepine and Sanders [83] proposed a the six-ion SIM mode by detecting four fragment35 37simple and rapid method based on LC–PB-MS ions atm /z 151, 250, 286 ( Cl) and 288 ( Cl), and
35operated in the NICI (methane as the reagent gas) the two molecular ions atm /z 322 ( Cl) and 32437mode for detecting chloramphenicol in calf muscle. ( Cl). Validation was performed on tissues fortified
The compound was extracted from the tissue with at four concentration levels on different days givingethyl acetate. After centrifugation and extractant RSD,15%. Replicate analyses (n56–8) of in-removal, the dry extract was suspended in hexane– curred positive controls gave RSD,30%, as rec-CCl and extracted with 400ml of water. One fourth ommended by the EU guidelines [84].4
of it was injected into the LC column. Chromatog- Yoshida and Kondo [85] described a confirmatoryraphy was performed with a C LC column using method that employs LC–APCI-MS for the determi-18
methanol–0.2% formic acid (43:57, v /v) as mobile nation of thiamphenicol in milk by using ethylphase. The spectrum of chloramphenicol displayed acetate as extractant. After evaporation, the residuethree fragment ions formed by loss of one and two was chromatographed on a C column using an18
HCl from the molecular ion. The structure of the isocratic acetonitrile–water (1:1, v /v) mobile phase.The APCI ion source was operated in the PI modeand only the protonated molecule was monitored.The intent of the authors was that of promoting thismethod as a confirmatory method to complement aHPLC–UV assay. However, validation data for theLC–MS method were not presented.
A LC–API-MS method was recently developed by´Delepine and Yndestad [86] for monitoring chloram-
phenicol and ketoprofen in meat and milk andchloramphenicol in egg and honey. Analytes wereextracted with acetonitrile, the organic layer wasseparated from water with chloroform and evapo-rated to dryness. The residues were dissolved inmethanol and the extracts were purified by a C18
SPE column. The analytes were recovered withmethanol. After diluting with water, the final extractswas filtered and injected into the LC–MS apparatus.The MS system was set to collect multiple single-iondata in NI mode.
1 0. Nitroimidazoles
The nitroimidazoles are active against most Gram-negative and many Gram-positive anaerobic bacteria.However, they have limited activity against aerobicbacteria. Nitroimidazoles are used for the treatmentand prevention of certain diseases in poultry andswine dysentery. The structures of imidazoles arevisualized in (Fig. 23). Nitroimidazoles possessmutagenic, carcinogenic and toxic properties. For
Fig. 22. Structures of selected amphenicols. these reasons, the use of ronidazole, dimetridazole
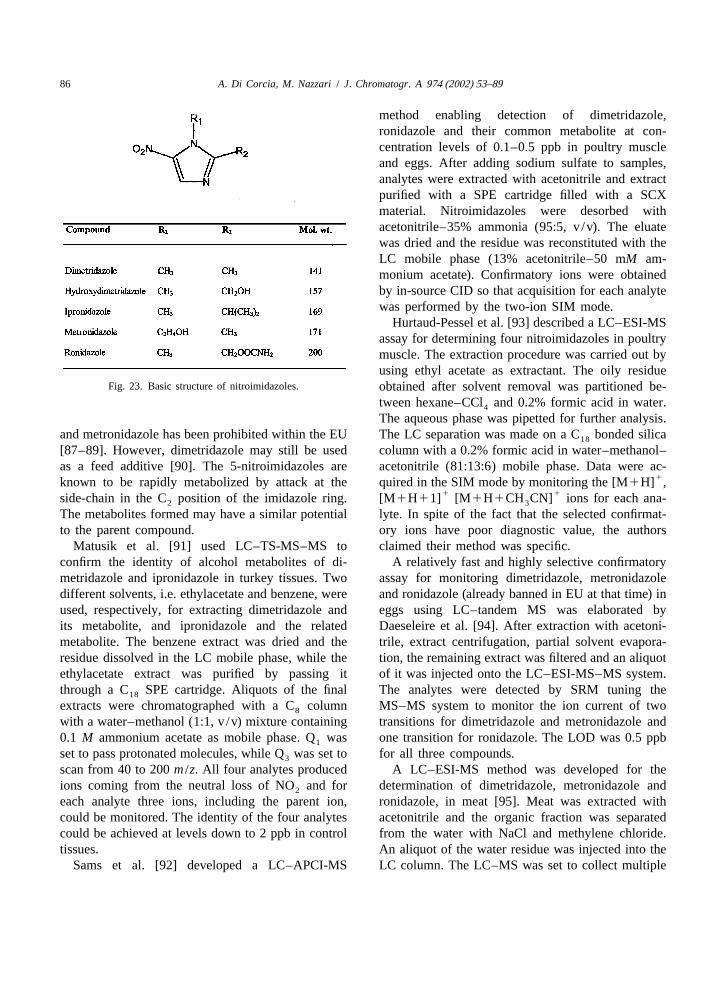
86 A. Di Corcia, M. Nazzari / J. Chromatogr. A 974 (2002) 53–89
method enabling detection of dimetridazole,ronidazole and their common metabolite at con-centration levels of 0.1–0.5 ppb in poultry muscleand eggs. After adding sodium sulfate to samples,analytes were extracted with acetonitrile and extractpurified with a SPE cartridge filled with a SCXmaterial. Nitroimidazoles were desorbed withacetonitrile–35% ammonia (95:5, v /v). The eluatewas dried and the residue was reconstituted with theLC mobile phase (13% acetonitrile–50 mM am-monium acetate). Confirmatory ions were obtainedby in-source CID so that acquisition for each analytewas performed by the two-ion SIM mode.
Hurtaud-Pessel et al. [93] described a LC–ESI-MSassay for determining four nitroimidazoles in poultrymuscle. The extraction procedure was carried out byusing ethyl acetate as extractant. The oily residue
Fig. 23. Basic structure of nitroimidazoles. obtained after solvent removal was partitioned be-tween hexane–CCl and 0.2% formic acid in water.4
The aqueous phase was pipetted for further analysis.and metronidazole has been prohibited within the EU The LC separation was made on a C bonded silica18
[87–89]. However, dimetridazole may still be used column with a 0.2% formic acid in water–methanol–as a feed additive [90]. The 5-nitroimidazoles are acetonitrile (81:13:6) mobile phase. Data were ac-
1known to be rapidly metabolized by attack at the quired in the SIM mode by monitoring the [M1H] ,1 1side-chain in the C position of the imidazole ring. [M1H11] [M1H1CH CN] ions for each ana-2 3
The metabolites formed may have a similar potential lyte. In spite of the fact that the selected confirmat-to the parent compound. ory ions have poor diagnostic value, the authors
Matusik et al. [91] used LC–TS-MS–MS to claimed their method was specific.confirm the identity of alcohol metabolites of di- A relatively fast and highly selective confirmatorymetridazole and ipronidazole in turkey tissues. Two assay for monitoring dimetridazole, metronidazoledifferent solvents, i.e. ethylacetate and benzene, were and ronidazole (already banned in EU at that time) inused, respectively, for extracting dimetridazole and eggs using LC–tandem MS was elaborated byits metabolite, and ipronidazole and the related Daeseleire et al. [94]. After extraction with acetoni-metabolite. The benzene extract was dried and the trile, extract centrifugation, partial solvent evapora-residue dissolved in the LC mobile phase, while the tion, the remaining extract was filtered and an aliquotethylacetate extract was purified by passing it of it was injected onto the LC–ESI-MS–MS system.through a C SPE cartridge. Aliquots of the final The analytes were detected by SRM tuning the18
extracts were chromatographed with a C column MS–MS system to monitor the ion current of two8
with a water–methanol (1:1, v /v) mixture containing transitions for dimetridazole and metronidazole and0.1 M ammonium acetate as mobile phase. Q was one transition for ronidazole. The LOD was 0.5 ppb1
set to pass protonated molecules, while Q was set to for all three compounds.3
scan from 40 to 200m /z. All four analytes produced A LC–ESI-MS method was developed for theions coming from the neutral loss of NO and for determination of dimetridazole, metronidazole and2
each analyte three ions, including the parent ion, ronidazole, in meat [95]. Meat was extracted withcould be monitored. The identity of the four analytes acetonitrile and the organic fraction was separatedcould be achieved at levels down to 2 ppb in control from the water with NaCl and methylene chloride.tissues. An aliquot of the water residue was injected into the
Sams et al. [92] developed a LC–APCI-MS LC column. The LC–MS was set to collect multiple

A. Di Corcia, M. Nazzari / J. Chromatogr. A 974 (2002) 53–89 87
single-ion data in the PI mode. LOQs ranged be- detector response was not very reproducible, thus ittween 1 and 4 ppb. could be more applicable for qualitative analysis than
quantitative analysis, even considering it affordedsensitivity not better than that of the UV detector for
1 1. Nitrofurans this compound.Using LC–APCI-MS, Horne et al. [97] developed
Nitrofurans are synthetic antibiotics. Two exam- a method for the quantitative and confirmatoryples of structures of nitrofuran antibiotics are shown determination of protein-bound metabolites ofin Fig. 24. They act by inhibiting a number of furazolidone and furaltadone, i.e. 3-amino-2-ox-microbial enzymes involved in carbohydrate metabo- azolidinone and 5-morpholino-methyl-3-amino-2-ox-lism. Concerning the toxicological properties of azolidinone, in pig liver. After extensive solventnitrofurans, mutagenic activity has been observed in washing of the tissue, target compounds were simul-yeast and fungi as well as in bacterial and submam- taneously extracted and derivatized with 2-nitroben-malian systems. Moreover, nitrofurans have been zaldheyde under mildly acidic conditions. The twoshown to be mutagenic in rats and mice, and derivatives were separated on a C column by using18
cytotoxic to mammalian cells in culture. Nitrofurans a methanol–0.025% acetic acid (45:55, v /v) mobileare rapidly metabolized and their metabolites co- phase. Analytes were detected in the two-ion SIMvalently bound to cellular protein. The potential risk mode atm /z 236 and 206 for the 3-amino-2-ox-to the consumer by protein-bound metabolites of azolidinone derivative, andm /z 335 and 291 for thefurazolidone has been shown. For the above reasons, 5-morpholino-methyl-3-amino-2-oxazolidinone de-nitrofurans are not registered for use in any farm rivative. Daughter ions were obtained by the in-animals in the EU. source CID process. The LOD for both the two
Yoshida and Kondo [96] evaluated the prac- analytes were approximately 10 ppb in liver.ticability of using LC–API-MS for determining The determination of the nitrofuran residues,furazolidone in avian egg. After diluting the egg nitrofurazone, furazolidone and furaltadone, in eggssample, it was directly applied to a C SPE car- by LC–ESI-MS was described by Draisci et al. [98].18
tridge. The target compounds was then eluted with Nitrofurans were extracted from eggs with acetoni-ethyl acetate. The solvent was eliminated and the trile and the extracts purified by liquid–liquid parti-residue dissolved with the LC mobile phase. After tioning. Analytes were chromatographed isocraticallycentrifuging, an aliquot of the final extract was with a C column using a mobile phase composed18
injected into the LC column. The C analytical of acetonitrile–water solution containing 1 mM18
column was operated with an acetonitrile–water ammonium acetate and 0.025% acetic acid. Based on(40:60) mobile phase. Furazolidone was detected in SIM of the protonated molecules, LODs were be-the one-ion SIM mode by monitoring the protonated tween 1 and 3 ppb.molecules. The authors concluded that the APCI-MS
1 2. Conclusions
For methodologies devoted to residue analysis ofantibiotics in food, the first and most important stepis the extraction of these compounds from biomat-rices and extract purification. Techniques for residueanalysis have changed as different technologies havebecome available. Liquid–liquid extraction has beenlargely replaced by SPE, C being the material of18
choice. Matrix solid-phase dispersion (MSPD), aphysical variation of SPE whereby the initial
Fig. 24. Structures of two examples of nitrofuran antibiotics. solubilization of target compounds is replaced by the
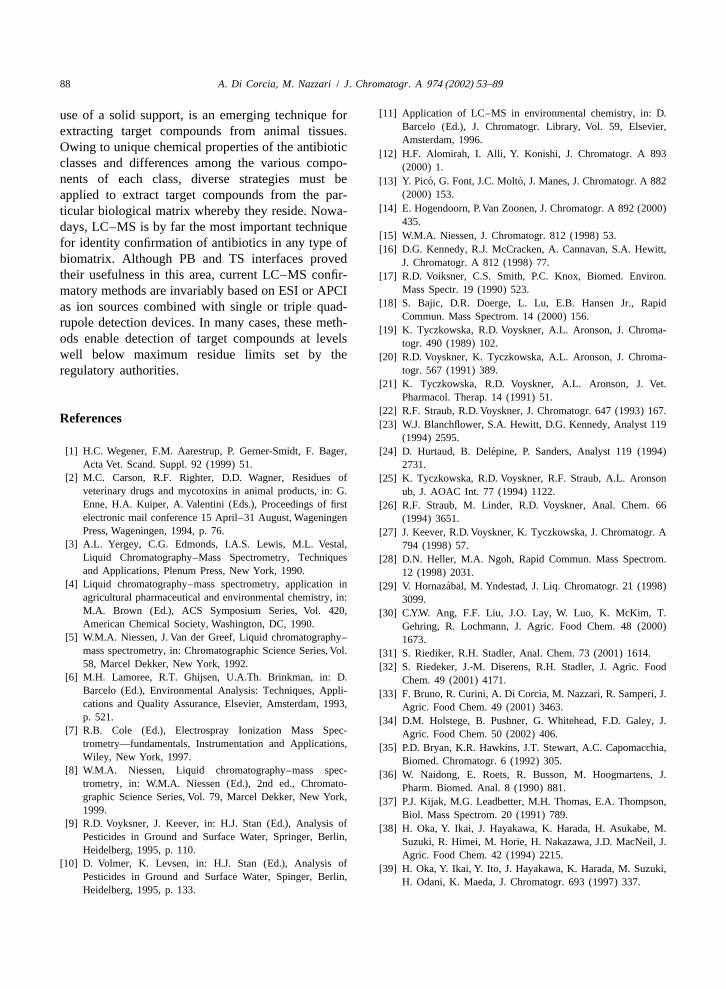
88 A. Di Corcia, M. Nazzari / J. Chromatogr. A 974 (2002) 53–89
[11] Application of LC–MS in environmental chemistry, in: D.use of a solid support, is an emerging technique forBarcelo (Ed.), J. Chromatogr. Library, Vol. 59, Elsevier,extracting target compounds from animal tissues.Amsterdam, 1996.
Owing to unique chemical properties of the antibiotic[12] H.F. Alomirah, I. Alli, Y. Konishi, J. Chromatogr. A 893
classes and differences among the various compo- (2000) 1.nents of each class, diverse strategies must be ´ `[13] Y. Pico, G. Font, J.C. Molto, J. Manes, J. Chromatogr. A 882
(2000) 153.applied to extract target compounds from the par-[14] E. Hogendoorn, P.Van Zoonen, J. Chromatogr. A 892 (2000)ticular biological matrix whereby they reside. Nowa-
435.days, LC–MS is by far the most important technique[15] W.M.A. Niessen, J. Chromatogr. 812 (1998) 53.
for identity confirmation of antibiotics in any type of [16] D.G. Kennedy, R.J. McCracken, A. Cannavan, S.A. Hewitt,biomatrix. Although PB and TS interfaces proved J. Chromatogr. A 812 (1998) 77.their usefulness in this area, current LC–MS confir- [17] R.D. Voiksner, C.S. Smith, P.C. Knox, Biomed. Environ.
Mass Spectr. 19 (1990) 523.matory methods are invariably based on ESI or APCI[18] S. Bajic, D.R. Doerge, L. Lu, E.B. Hansen Jr., Rapidas ion sources combined with single or triple quad-
Commun. Mass Spectrom. 14 (2000) 156.rupole detection devices. In many cases, these meth-[19] K. Tyczkowska, R.D. Voyskner, A.L. Aronson, J. Chroma-
ods enable detection of target compounds at levels togr. 490 (1989) 102.well below maximum residue limits set by the [20] R.D. Voyskner, K. Tyczkowska, A.L. Aronson, J. Chroma-
togr. 567 (1991) 389.regulatory authorities.[21] K. Tyczkowska, R.D. Voyskner, A.L. Aronson, J. Vet.
Pharmacol. Therap. 14 (1991) 51.[22] R.F. Straub, R.D. Voyskner, J. Chromatogr. 647 (1993) 167.
R eferences [23] W.J. Blanchflower, S.A. Hewitt, D.G. Kennedy, Analyst 119(1994) 2595.
[1] H.C. Wegener, F.M. Aarestrup, P. Gerner-Smidt, F. Bager, ´[24] D. Hurtaud, B. Delepine, P. Sanders, Analyst 119 (1994)Acta Vet. Scand. Suppl. 92 (1999) 51. 2731.
[2] M.C. Carson, R.F. Righter, D.D. Wagner, Residues of [25] K. Tyczkowska, R.D. Voyskner, R.F. Straub, A.L. Aronsonveterinary drugs and mycotoxins in animal products, in: G. ub, J. AOAC Int. 77 (1994) 1122.Enne, H.A. Kuiper, A. Valentini (Eds.), Proceedings of first [26] R.F. Straub, M. Linder, R.D. Voyskner, Anal. Chem. 66electronic mail conference 15 April–31 August, Wageningen (1994) 3651.Press, Wageningen, 1994, p. 76. [27] J. Keever, R.D. Voyskner, K. Tyczkowska, J. Chromatogr. A
[3] A.L. Yergey, C.G. Edmonds, I.A.S. Lewis, M.L. Vestal, 794 (1998) 57.Liquid Chromatography–Mass Spectrometry, Techniques [28] D.N. Heller, M.A. Ngoh, Rapid Commun. Mass Spectrom.and Applications, Plenum Press, New York, 1990. 12 (1998) 2031.
[4] Liquid chromatography–mass spectrometry, application in ´[29] V. Hornazabal, M. Yndestad, J. Liq. Chromatogr. 21 (1998)agricultural pharmaceutical and environmental chemistry, in: 3099.M.A. Brown (Ed.), ACS Symposium Series, Vol. 420, [30] C.Y.W. Ang, F.F. Liu, J.O. Lay, W. Luo, K. McKim, T.American Chemical Society, Washington, DC, 1990. Gehring, R. Lochmann, J. Agric. Food Chem. 48 (2000)
[5] W.M.A. Niessen, J. Van der Greef, Liquid chromatography– 1673.mass spectrometry, in: Chromatographic Science Series, Vol. [31] S. Riediker, R.H. Stadler, Anal. Chem. 73 (2001) 1614.58, Marcel Dekker, New York, 1992. [32] S. Riedeker, J.-M. Diserens, R.H. Stadler, J. Agric. Food
[6] M.H. Lamoree, R.T. Ghijsen, U.A.Th. Brinkman, in: D. Chem. 49 (2001) 4171.Barcelo (Ed.), Environmental Analysis: Techniques, Appli- [33] F. Bruno, R. Curini, A. Di Corcia, M. Nazzari, R. Samperi, J.cations and Quality Assurance, Elsevier, Amsterdam, 1993, Agric. Food Chem. 49 (2001) 3463.p. 521. [34] D.M. Holstege, B. Pushner, G. Whitehead, F.D. Galey, J.
[7] R.B. Cole (Ed.), Electrospray Ionization Mass Spec- Agric. Food Chem. 50 (2002) 406.trometry—fundamentals, Instrumentation and Applications, [35] P.D. Bryan, K.R. Hawkins, J.T. Stewart, A.C. Capomacchia,Wiley, New York, 1997. Biomed. Chromatogr. 6 (1992) 305.
[8] W.M.A. Niessen, Liquid chromatography–mass spec- [36] W. Naidong, E. Roets, R. Busson, M. Hoogmartens, J.trometry, in: W.M.A. Niessen (Ed.), 2nd ed., Chromato- Pharm. Biomed. Anal. 8 (1990) 881.graphic Science Series, Vol. 79, Marcel Dekker, New York, [37] P.J. Kijak, M.G. Leadbetter, M.H. Thomas, E.A. Thompson,1999. Biol. Mass Spectrom. 20 (1991) 789.
[9] R.D. Voyksner, J. Keever, in: H.J. Stan (Ed.), Analysis of [38] H. Oka, Y. Ikai, J. Hayakawa, K. Harada, H. Asukabe, M.Pesticides in Ground and Surface Water, Springer, Berlin, Suzuki, R. Himei, M. Horie, H. Nakazawa, J.D. MacNeil, J.Heidelberg, 1995, p. 110. Agric. Food Chem. 42 (1994) 2215.
[10] D. Volmer, K. Levsen, in: H.J. Stan (Ed.), Analysis of [39] H. Oka, Y. Ikai, Y. Ito, J. Hayakawa, K. Harada, M. Suzuki,Pesticides in Ground and Surface Water, Spinger, Berlin, H. Odani, K. Maeda, J. Chromatogr. 693 (1997) 337.Heidelberg, 1995, p. 133.
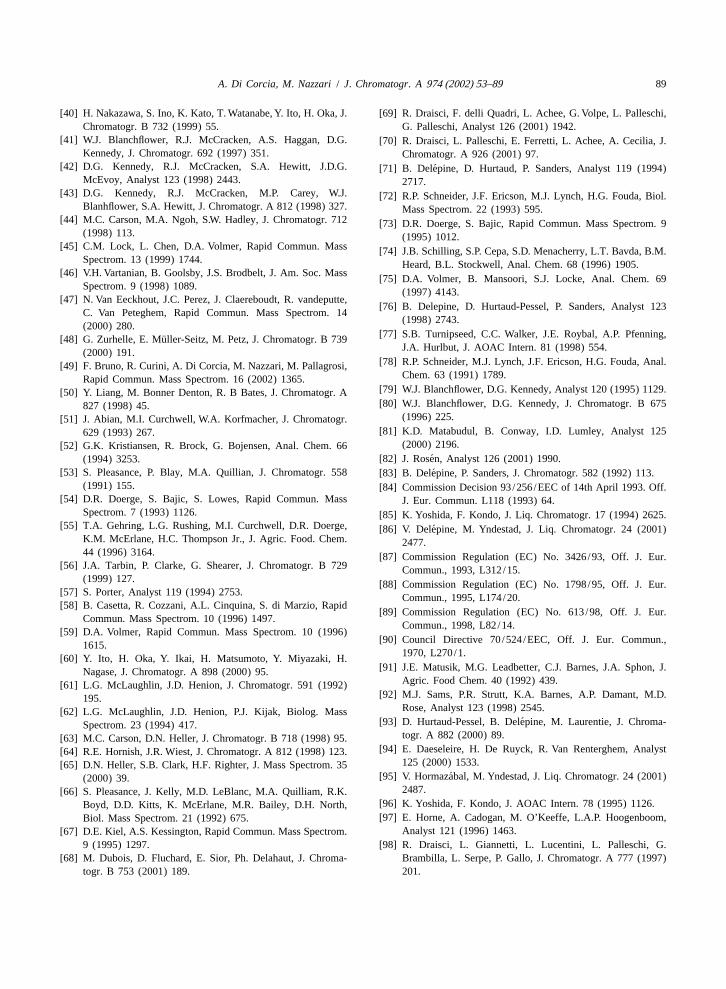
A. Di Corcia, M. Nazzari / J. Chromatogr. A 974 (2002) 53–89 89
[40] H. Nakazawa, S. Ino, K. Kato, T. Watanabe, Y. Ito, H. Oka, J. [69] R. Draisci, F. delli Quadri, L. Achee, G. Volpe, L. Palleschi,Chromatogr. B 732 (1999) 55. G. Palleschi, Analyst 126 (2001) 1942.
[41] W.J. Blanchflower, R.J. McCracken, A.S. Haggan, D.G. [70] R. Draisci, L. Palleschi, E. Ferretti, L. Achee, A. Cecilia, J.Kennedy, J. Chromatogr. 692 (1997) 351. Chromatogr. A 926 (2001) 97.
[42] D.G. Kennedy, R.J. McCracken, S.A. Hewitt, J.D.G. ´[71] B. Delepine, D. Hurtaud, P. Sanders, Analyst 119 (1994)McEvoy, Analyst 123 (1998) 2443. 2717.
[43] D.G. Kennedy, R.J. McCracken, M.P. Carey, W.J. [72] R.P. Schneider, J.F. Ericson, M.J. Lynch, H.G. Fouda, Biol.Blanhflower, S.A. Hewitt, J. Chromatogr. A 812 (1998) 327. Mass Spectrom. 22 (1993) 595.
[44] M.C. Carson, M.A. Ngoh, S.W. Hadley, J. Chromatogr. 712 [73] D.R. Doerge, S. Bajic, Rapid Commun. Mass Spectrom. 9(1998) 113. (1995) 1012.
[45] C.M. Lock, L. Chen, D.A. Volmer, Rapid Commun. Mass [74] J.B. Schilling, S.P. Cepa, S.D. Menacherry, L.T. Bavda, B.M.Spectrom. 13 (1999) 1744. Heard, B.L. Stockwell, Anal. Chem. 68 (1996) 1905.
[46] V.H. Vartanian, B. Goolsby, J.S. Brodbelt, J. Am. Soc. Mass[75] D.A. Volmer, B. Mansoori, S.J. Locke, Anal. Chem. 69
Spectrom. 9 (1998) 1089.(1997) 4143.
[47] N. Van Eeckhout, J.C. Perez, J. Claereboudt, R. vandeputte,[76] B. Delepine, D. Hurtaud-Pessel, P. Sanders, Analyst 123
C. Van Peteghem, Rapid Commun. Mass Spectrom. 14(1998) 2743.
(2000) 280.[77] S.B. Turnipseed, C.C. Walker, J.E. Roybal, A.P. Pfenning,¨[48] G. Zurhelle, E. Muller-Seitz, M. Petz, J. Chromatogr. B 739
J.A. Hurlbut, J. AOAC Intern. 81 (1998) 554.(2000) 191.[78] R.P. Schneider, M.J. Lynch, J.F. Ericson, H.G. Fouda, Anal.[49] F. Bruno, R. Curini, A. Di Corcia, M. Nazzari, M. Pallagrosi,
Chem. 63 (1991) 1789.Rapid Commun. Mass Spectrom. 16 (2002) 1365.[79] W.J. Blanchflower, D.G. Kennedy, Analyst 120 (1995) 1129.[50] Y. Liang, M. Bonner Denton, R. B Bates, J. Chromatogr. A[80] W.J. Blanchflower, D.G. Kennedy, J. Chromatogr. B 675827 (1998) 45.
(1996) 225.[51] J. Abian, M.I. Curchwell, W.A. Korfmacher, J. Chromatogr.[81] K.D. Matabudul, B. Conway, I.D. Lumley, Analyst 125629 (1993) 267.
(2000) 2196.[52] G.K. Kristiansen, R. Brock, G. Bojensen, Anal. Chem. 66´[82] J. Rosen, Analyst 126 (2001) 1990.(1994) 3253.
[53] S. Pleasance, P. Blay, M.A. Quillian, J. Chromatogr. 558 ´[83] B. Delepine, P. Sanders, J. Chromatogr. 582 (1992) 113.(1991) 155. [84] Commission Decision 93/256/EEC of 14th April 1993. Off.
[54] D.R. Doerge, S. Bajic, S. Lowes, Rapid Commun. Mass J. Eur. Commun. L118 (1993) 64.Spectrom. 7 (1993) 1126. [85] K. Yoshida, F. Kondo, J. Liq. Chromatogr. 17 (1994) 2625.
[55] T.A. Gehring, L.G. Rushing, M.I. Curchwell, D.R. Doerge, ´[86] V. Delepine, M. Yndestad, J. Liq. Chromatogr. 24 (2001)K.M. McErlane, H.C. Thompson Jr., J. Agric. Food. Chem. 2477.44 (1996) 3164. [87] Commission Regulation (EC) No. 3426/93, Off. J. Eur.
[56] J.A. Tarbin, P. Clarke, G. Shearer, J. Chromatogr. B 729 Commun., 1993, L312/15.(1999) 127. [88] Commission Regulation (EC) No. 1798/95, Off. J. Eur.
[57] S. Porter, Analyst 119 (1994) 2753. Commun., 1995, L174/20.[58] B. Casetta, R. Cozzani, A.L. Cinquina, S. di Marzio, Rapid
[89] Commission Regulation (EC) No. 613/98, Off. J. Eur.Commun. Mass Spectrom. 10 (1996) 1497.
Commun., 1998, L82/14.[59] D.A. Volmer, Rapid Commun. Mass Spectrom. 10 (1996)
[90] Council Directive 70/524/EEC, Off. J. Eur. Commun.,1615.1970, L270/1.[60] Y. Ito, H. Oka, Y. Ikai, H. Matsumoto, Y. Miyazaki, H.
[91] J.E. Matusik, M.G. Leadbetter, C.J. Barnes, J.A. Sphon, J.Nagase, J. Chromatogr. A 898 (2000) 95.Agric. Food Chem. 40 (1992) 439.[61] L.G. McLaughlin, J.D. Henion, J. Chromatogr. 591 (1992)
[92] M.J. Sams, P.R. Strutt, K.A. Barnes, A.P. Damant, M.D.195.Rose, Analyst 123 (1998) 2545.[62] L.G. McLaughlin, J.D. Henion, P.J. Kijak, Biolog. Mass
´[93] D. Hurtaud-Pessel, B. Delepine, M. Laurentie, J. Chroma-Spectrom. 23 (1994) 417.togr. A 882 (2000) 89.[63] M.C. Carson, D.N. Heller, J. Chromatogr. B 718 (1998) 95.
[94] E. Daeseleire, H. De Ruyck, R. Van Renterghem, Analyst[64] R.E. Hornish, J.R. Wiest, J. Chromatogr. A 812 (1998) 123.125 (2000) 1533.[65] D.N. Heller, S.B. Clark, H.F. Righter, J. Mass Spectrom. 35
´[95] V. Hormazabal, M. Yndestad, J. Liq. Chromatogr. 24 (2001)(2000) 39.2487.[66] S. Pleasance, J. Kelly, M.D. LeBlanc, M.A. Quilliam, R.K.
[96] K. Yoshida, F. Kondo, J. AOAC Intern. 78 (1995) 1126.Boyd, D.D. Kitts, K. McErlane, M.R. Bailey, D.H. North,[97] E. Horne, A. Cadogan, M. O’Keeffe, L.A.P. Hoogenboom,Biol. Mass Spectrom. 21 (1992) 675.
Analyst 121 (1996) 1463.[67] D.E. Kiel, A.S. Kessington, Rapid Commun. Mass Spectrom.9 (1995) 1297. [98] R. Draisci, L. Giannetti, L. Lucentini, L. Palleschi, G.
[68] M. Dubois, D. Fluchard, E. Sior, Ph. Delahaut, J. Chroma- Brambilla, L. Serpe, P. Gallo, J. Chromatogr. A 777 (1997)togr. B 753 (2001) 189. 201.
Copyright © 2022 FDOKUMEN