POLLUTANTS IN WASTEWATER EFFLUENTS: IMPACTS AND REMEDIATION PROCESSES
Upload
independentCategory
view
1download
0
DOI: 10.2478/s11532-007-0013-0Research article
CEJC 5(2) 2007 455–465
Ion-pair chromatographic monitoringof photographic effluents
Giedre Kesiunaite1, Birute Pranaityte1, Audrius Padarauskas1∗,Arvydas Dikcius2, Romas Ragauskas2
1 Department of Analytical and Environmental Chemistry,Vilnius University,
LT-03225 Vilnius, Lithuania2 Institute of Chemistry,
LT-01108, Vilnius, Lithuania
Received 21 November 2006; accepted 4 January 2007
Abstract: Ion-pair chromatographic technique was developed for the rapid and simple determinationof the main contaminants (bromide, iodide, sulphite, thiosulphate, thiocyanate, iron(III)-EDTA chelate,free EDTA, hydroquinone and phenidone) in spent photographic solutions. Free EDTA was convertedinto stable Ni(II)-EDTA chelate prior to analysis. The optimal mobile phase conditions were establishedby varying the concentrations of tetrabutylammonium (TBA) phosphate and acetonitrile, pH and ionicstrength. Separation of five inorganic anions, two metal chelates and two neutral compounds wasaccomplished in about 30 min using a mobile phase containing 7.5 mmol/L TBA-phosphate, 10 mmol/LNaCl (pH 6.5) and 20% (v/v) acetonitrile. The detection limits (UV detection at 210 nm) ranged from 0.4µmol/L for phenidone to 8 µmol/L for sulphite with a linearity of 2–2.5 orders of magnitude. The methodwas applied to the rapid monitoring of spent photographic solutions before and after decomposition. Therecovery tests established for two samples were within the range 95–103%.c© Versita Warsaw and Springer-Verlag Berlin Heidelberg. All rights reserved.
Keywords: Ion-pair chromatography, anions, neutral compounds, photographic effluents
1 Introduction
The increasing use of black and white and color photography is leading to an increase in
the problem of contaminated waste solution. A typical photographic process involves basi-
cally two steps: developing and fixing [1]. The main components present in a photographic
∗ E-mail: [email protected]

456 G. Kesiunaite et al. / Central European Journal of Chemistry 5(2) 2007 455–465
developer are the developing agent (hydroquinone (1,4-dihydroxybenzene) and phenidone
(1-phenyl-3-pyrazolidone)), an antioxidant (sulfite) and an alkaline buffer (potassium car-
bonate). The fixing baths usually contain thiosulfate, sulfite, thiocyanate, free ethylene-
diaminetetraacetic acid (EDTA) and FeEDTA− complex. In addition, the effluents from
used baths may also contain large amounts of Br− and in some cases I− anions which
appear during the photofinishing process. In most photolaboratories the ecologically
harmful spent photographic solutions accumulate. In order to minimize unwanted envi-
ronmental contamination, these solutions should be collected and decomposed. In the
last decade various techniques have been investigated for this purpose [2–6]. The main
problem of such investigations is the need for simple but rapid monitoring of contami-
nants before and during their decomposition. Because of the different chemical properties
of these compounds the monitoring of spent photographic solutions is labor-intensive as
well as time-consuming.
In the last few years, capillary electrophoresis (CE) has been successfully introduced
for the analyses of various photographic solutions [7–14]. However, the determination of
fast (e.g., Br−, S2O2−3 ) and less mobile (free EDTA, FeEDTA−) anions together with neu-
tral compounds (hydroquinone, phenidone) using CE technique requires entirely different
conditions and cannot be performed in a single run.
Currently, a variety of high-performance liquid chromatography (HPLC) techniques
can be used for the analysis of organic and inorganic species [15]. There are only a
few studies dealing with the HPLC analysis of photographic solutions. Conventional
reversed-phase HPLC with UV detection was used for the determination of common
black-and-white as well as colour [16] or X-ray film [17] developing agents in photographic
baths. HPLC-mass spectrometry was applied to determine the degradation products of
the developing agents in photographic effluents [18, 19] and to characterize toxic organic
pollutants in colour photographic wastewaters during their chemical degradation [20].
However, this HPLC mode is hardly suited for the analysis of highly hydrophilic charged
analytes.
The most common method used for anion analysis in the last two decades is ion
chromatography (IC) [21], but the use of ion-exchange stationary phases preclude the
possibility to determine neutral compounds together with inorganic anions.
An alternative to the conventional IC method is the ion-pair chromatography (IPC)
[22], wherein a mobile phase containing a hydrophobic counter-ion is used with a reversed-
phase stationary phase. Generally, the use of this kind of stationary phase gives better
efficiencies than those obtained with conventional ion exchangers. Moreover, in the case
of complicated samples, IPC offers several advantages over IC, including more mobile-
stationary phase parameters that can be adjusted for optimization of the separation,
capability to analyze samples containing both ions and neutral species, reduced analysis
time together with better separation selectivity [23].
The main aim of this study was to evaluate the IPC technique for a rapid and simple
monitoring of spent photographic solutions.
G. Kesiunaite et al. / Central European Journal of Chemistry 5(2) 2007 455–465 457
2 Experimental
2.1 Instrumentation
The HPLC instrumentation consisted of a Waters Model 501 high-pressure pump, an
injection valve equipped with a sample loop of 20-µL and a Waters Lambda-Max Model
481 variable wavelength UV detector set to absorb at 210 nm. The results and data were
collected and plotted on a plotter/integrator SP 4290 (Spectrophysics, San Jose, CA,
USA). IPC separations were performed on a 5 µm AscentisTM C18 (150×4.6 mm i.d.)
column (Supelco, Bellefonte, PA, USA). The mobile phase flow rate was 0.5 mL/min.
2.2 Reagents and solutions
All mobile phases and standard solutions were prepared using doubly distilled helium
degassed water. HPLC-grade acetonitrile was purchased from Merck (Darmstadt, Ger-
many). Tetrabutylammonium (TBA) hydroxide solution (40% in water) was obtained
from Fluka Chemie GmbH (Buchs, Switzerland). All other reagents were of analytical-
reagent grade obtained from Aldrich (Milwaukee, WI, USA). Stock solutions (10 mmol/L)
of the analytes were prepared in water. Hydroquinone and phenidone standard solutions
were prepared just before use. Sodium sulfite stock solutions were prepared daily and
standardized by iodometric titration. Metal complexes with EDTA were prepared by
direct mixing of equimolar amounts of metal and EDTA standard solutions. All working
solutions were prepared before use by suitable dilution. Initial 0.1 mol/L TBA-phosphate
solution was prepared by neutralization of appropriate amount of tetrabutylammonium
hydroxide with H3PO4 to desired pH.
All mobile phase and sample solutions were filtered through a 0.45 µm nylon 66
membrane filter (Supelco, Bellefonte, PA, USA) and degassed by ultrasonication.
2.3 Sample preparation
Anodic oxidation test was performed in a teflon cell (10 mL) using a boron doped diamond
anode (0.8 cm2) and Pt cathode. Stirring was implemented by turning plastic bar inserted
in the cell. Oxidation was carried out for 3 h 20 min at a constant current of 50 mA.
The sample solution was filtered through a 0.45 µm membrane filter. After this, an
aliquot of the sample solution (0.25 mL) was placed in a 25 mL volumetric flask and
0.125 mL of 10 mmol/L (NH4)2MoO4 and 0.50 mL of 10 mmol/L NiCl2 were added.
Finally, the solution was adjusted to final volume with mobile phase and analyzed.
458 G. Kesiunaite et al. / Central European Journal of Chemistry 5(2) 2007 455–465
3 Results and discussion
3.1 Derivatization of free EDTA
As mentioned previously , the major components of spent photographic solutions are
Br−, I−, S2O2−3 , SO2−
3 , Ag(S2O3)3−2 , SCN−, FeEDTA−, free EDTA, hydroquinone and
phenidone. Silver from such solutions is recovered electrolytically. All these compounds
except free EDTA exhibit relatively strong absorbance in the UV range 200-220 nm.
Consequently, the determination of all these nine analytes in a single run can be performed
only after derivatization of free EDTA into a UV-absorbing derivative. Most of the
derivatization techniques are based on the complexation of EDTA with Fe3+ cation into
UV-absorbing, negatively charged chelate [24, 25]. However, the use of Fe3+ ions in
our system is complicated because spent photographic solutions already contain large
amounts of FeEDTA− chelate. Consequently, the determination of free EDTA using Fe3+
requires at least two separate runs of the same sample: one before and the other after
the derivatization. On the basis of our previous work [7], Ni2+ was selected in this study.
This cation forms doubly charged chelate with EDTA stable enough for derivatization
(logK = 18.5) which also has relatively strong UV absorption below 220 nm.
In order to determine whether an excess of Ni2+ causes a decomposition and/or pre-
cipitation of other analytes present in the real samples, various amounts of Ni2+ chloride
(from 0.5 to 5 mmol/L) were added to standard solution of each analyte (0.5 mmol/L)
and the analyte peak areas were measured and compared. No statistically significant de-
crease in the peak areas for all analytes was observed with increasing Ni2+ concentration
up to about 1 mmol/L.
3.2 Chromatographic separation
Tetraalkylammonium salts have been widely used as ion-pairing reagents for the sepa-
ration of anionic compounds. In studies of the determination of the inorganic anions
the tetrabutylammonium (TBA) ion has been the most popular ion-pairing reagent [22].
Consequently, TBA-phosphate was selected as an ion-pairing reagent in this study. In or-
der to establish the optimal concentration of TBA in the mobile phase for the separation
of the analytes studied, various amounts (from 1 to 10 mmol/L) of TBA-phosphate were
tested in acetonitrile-water (20:80 v/v) mixtures. The pH of the aqueous TBA-phosphate
solution was kept constant in these experiments at 6.5. The results obtained are shown in
Fig. 1. As can be observed, with increasing TBA-phosphate concentration in the mobile
phase from 1 to about 5-6 mmol/L the dynamic ion-exchange capacity of the stationary
phase and, consequently, the retention of anionic analytes increase. As the concentra-
tion of the ion-pairing reagent was increased further, there was a clear leveling off in
retention, followed by significant reductions in retention, particularly for thiocyanate and
thiosulphate. Thiosulphate was particularly sensitive to TBA-phosphate concentration,
as selectivity changed from thiosulphate > iodide > thiocyanate at 1 mmol/L TBA-

G. Kesiunaite et al. / Central European Journal of Chemistry 5(2) 2007 455–465 459
phosphate, to thiocyanate >iodide > thiosulphate at 10 mmol/L TBA-phosphate. In
general, the trends shown in Fig. 1 are again typical of an ion-pair mechanism with the
maximum retention being achieved at the point where stationary phase surface becomes
saturated with the ion-pairing reagent. After this point further addition of the reagent
to the mobile phase causes a reduction in retention due to the increased concentration of
the counter-ion, in this case phosphate.
Fig. 1 Effect of TBA-phosphate concentration on retention times. Mobile phase: TBA-
phosphate (pH 6.5), 20% (v/v) CH3CN; flow rate: 0.5 mL/min; UV detection at 210 nm.
1 – hydroquinone; 2 – phenidone; 3 – Br−; 4 – SO2−3 ; 5 – FeEDTA−; 6 – NiEDTA2−; 7 –
S2O2−3 ; 8 – I−; 9 – SCN−.
As expected, the effect of TBA-phosphate concentration on the retention of neutral
analytes (hydroquinone and phenidone) was negligible.
However, it was clear from the results obtained that there was a large difference in
retention times shown between what can be termed the more hydrophilic anions, sulphite,
bromide, FeEDTA− and NiEDTA2−, and the less hydrophilic anions, iodide, thiosulphate
and thiocyanate. Therefore, three other parameters were chosen for optimization, namely
the mobile phase pH and ionic strength, and the concentration of the acetonitrile.
The effect of mobile phase pH on analyte retention was studied over the range of 4-7.
Varying pH had little or no effect on improving the separation selectivity. Only sulphite
retention was slightly increased with pH because of the deprotonation at higher pH. The
retention times of other analytes decreased gradually with the increasing pH values. It
would appear, therefore, that in our system, variation of mobile phase pH range has no
practical application to modification of the separation selectivity.
Increased acetonitrile concentration (from 20 to 40% v/v) greatly accelerated elution
of the both anionic and neutral analytes and the concentration in the range 20-25% (v/v)
460 G. Kesiunaite et al. / Central European Journal of Chemistry 5(2) 2007 455–465
provided the best resolution.
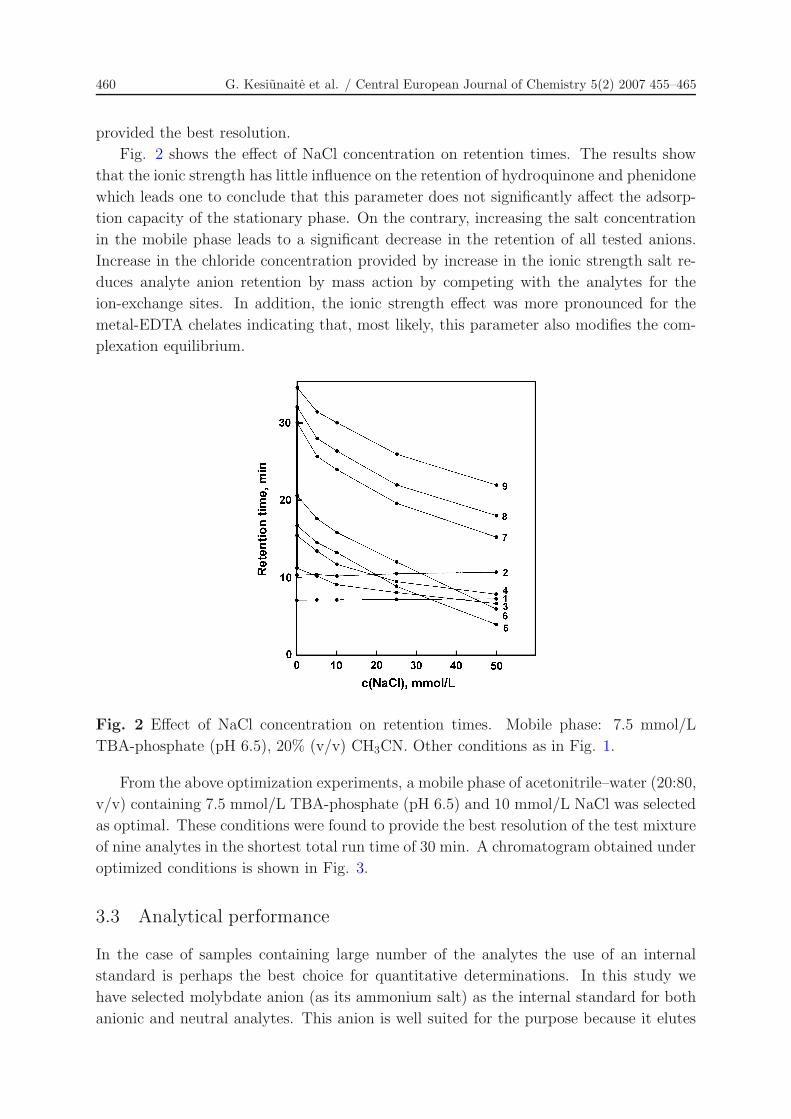
Fig. 2 shows the effect of NaCl concentration on retention times. The results show
that the ionic strength has little influence on the retention of hydroquinone and phenidone
which leads one to conclude that this parameter does not significantly affect the adsorp-
tion capacity of the stationary phase. On the contrary, increasing the salt concentration
in the mobile phase leads to a significant decrease in the retention of all tested anions.
Increase in the chloride concentration provided by increase in the ionic strength salt re-
duces analyte anion retention by mass action by competing with the analytes for the
ion-exchange sites. In addition, the ionic strength effect was more pronounced for the
metal-EDTA chelates indicating that, most likely, this parameter also modifies the com-
plexation equilibrium.
Fig. 2 Effect of NaCl concentration on retention times. Mobile phase: 7.5 mmol/L
TBA-phosphate (pH 6.5), 20% (v/v) CH3CN. Other conditions as in Fig. 1.
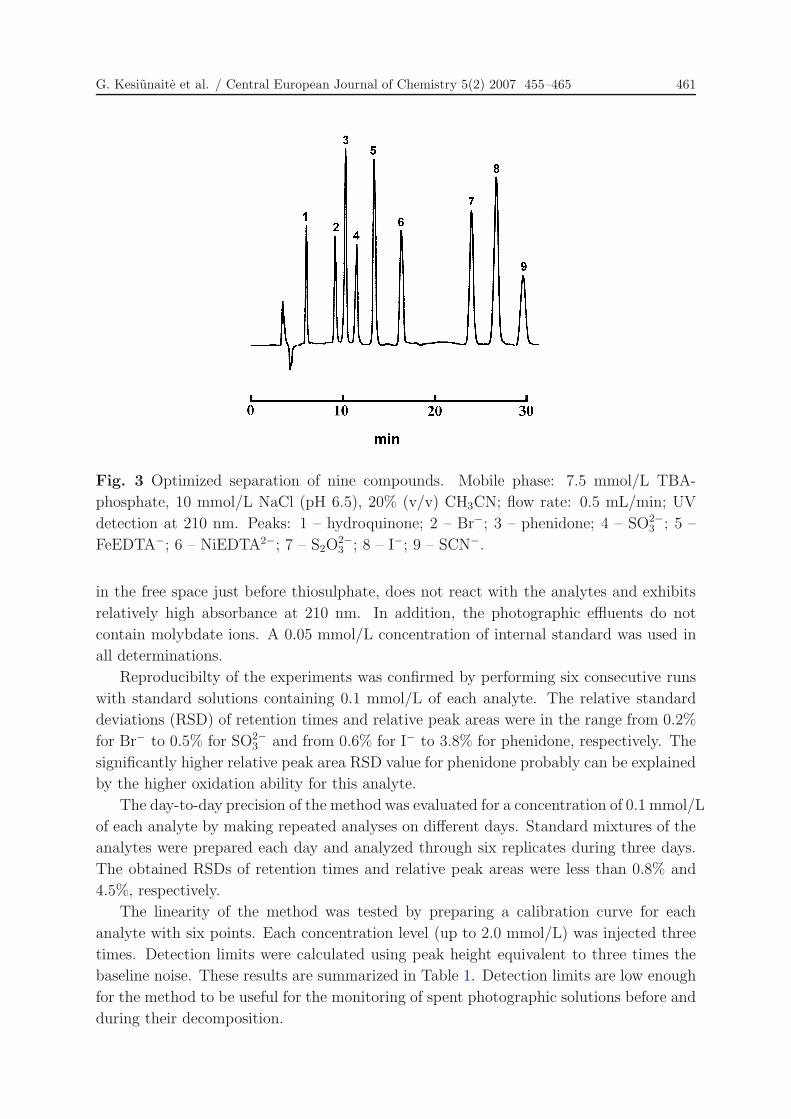
From the above optimization experiments, a mobile phase of acetonitrile–water (20:80,
v/v) containing 7.5 mmol/L TBA-phosphate (pH 6.5) and 10 mmol/L NaCl was selected
as optimal. These conditions were found to provide the best resolution of the test mixture
of nine analytes in the shortest total run time of 30 min. A chromatogram obtained under
optimized conditions is shown in Fig. 3.
3.3 Analytical performance
In the case of samples containing large number of the analytes the use of an internal
standard is perhaps the best choice for quantitative determinations. In this study we
have selected molybdate anion (as its ammonium salt) as the internal standard for both
anionic and neutral analytes. This anion is well suited for the purpose because it elutes
G. Kesiunaite et al. / Central European Journal of Chemistry 5(2) 2007 455–465 461
Fig. 3 Optimized separation of nine compounds. Mobile phase: 7.5 mmol/L TBA-
phosphate, 10 mmol/L NaCl (pH 6.5), 20% (v/v) CH3CN; flow rate: 0.5 mL/min; UV
detection at 210 nm. Peaks: 1 – hydroquinone; 2 – Br−; 3 – phenidone; 4 – SO2−3 ; 5 –
FeEDTA−; 6 – NiEDTA2−; 7 – S2O2−3 ; 8 – I−; 9 – SCN−.
in the free space just before thiosulphate, does not react with the analytes and exhibits
relatively high absorbance at 210 nm. In addition, the photographic effluents do not
contain molybdate ions. A 0.05 mmol/L concentration of internal standard was used in
all determinations.
Reproducibilty of the experiments was confirmed by performing six consecutive runs
with standard solutions containing 0.1 mmol/L of each analyte. The relative standard
deviations (RSD) of retention times and relative peak areas were in the range from 0.2%
for Br− to 0.5% for SO2−3 and from 0.6% for I− to 3.8% for phenidone, respectively. The
significantly higher relative peak area RSD value for phenidone probably can be explained
by the higher oxidation ability for this analyte.
The day-to-day precision of the method was evaluated for a concentration of 0.1 mmol/L
of each analyte by making repeated analyses on different days. Standard mixtures of the
analytes were prepared each day and analyzed through six replicates during three days.
The obtained RSDs of retention times and relative peak areas were less than 0.8% and
4.5%, respectively.
The linearity of the method was tested by preparing a calibration curve for each
analyte with six points. Each concentration level (up to 2.0 mmol/L) was injected three
times. Detection limits were calculated using peak height equivalent to three times the
baseline noise. These results are summarized in Table 1. Detection limits are low enough
for the method to be useful for the monitoring of spent photographic solutions before and
during their decomposition.
462 G. Kesiunaite et al. / Central European Journal of Chemistry 5(2) 2007 455–465
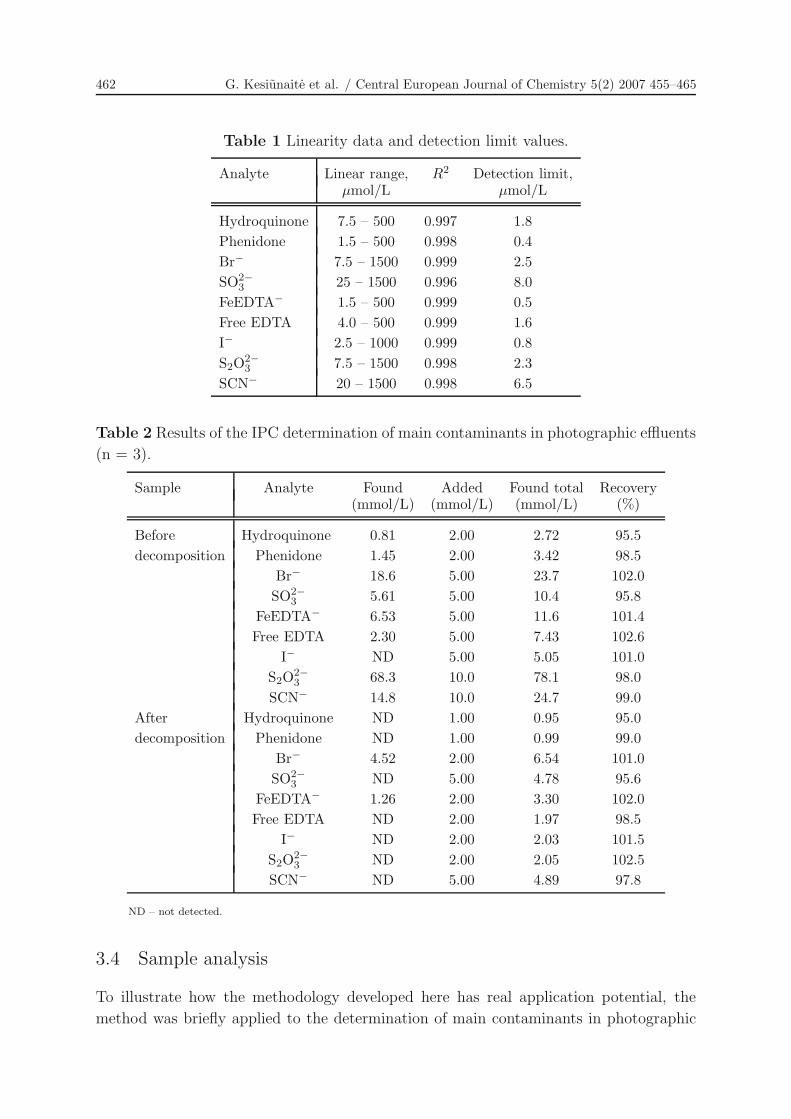
Table 1 Linearity data and detection limit values.
Analyte Linear range, R2 Detection limit,µmol/L µmol/L
Hydroquinone 7.5 – 500 0.997 1.8Phenidone 1.5 – 500 0.998 0.4Br− 7.5 – 1500 0.999 2.5SO2−
3 25 – 1500 0.996 8.0FeEDTA− 1.5 – 500 0.999 0.5Free EDTA 4.0 – 500 0.999 1.6I− 2.5 – 1000 0.999 0.8S2O2−
3 7.5 – 1500 0.998 2.3SCN− 20 – 1500 0.998 6.5
Table 2 Results of the IPC determination of main contaminants in photographic effluents
(n = 3).
Sample Analyte Found Added Found total Recovery(mmol/L) (mmol/L) (mmol/L) (%)
Before Hydroquinone 0.81 2.00 2.72 95.5decomposition Phenidone 1.45 2.00 3.42 98.5
Br− 18.6 5.00 23.7 102.0SO2−
3 5.61 5.00 10.4 95.8FeEDTA− 6.53 5.00 11.6 101.4Free EDTA 2.30 5.00 7.43 102.6
I− ND 5.00 5.05 101.0S2O2−
3 68.3 10.0 78.1 98.0SCN− 14.8 10.0 24.7 99.0
After Hydroquinone ND 1.00 0.95 95.0decomposition Phenidone ND 1.00 0.99 99.0
Br− 4.52 2.00 6.54 101.0SO2−
3 ND 5.00 4.78 95.6FeEDTA− 1.26 2.00 3.30 102.0Free EDTA ND 2.00 1.97 98.5
I− ND 2.00 2.03 101.5S2O2−
3 ND 2.00 2.05 102.5SCN− ND 5.00 4.89 97.8
ND – not detected.
3.4 Sample analysis
To illustrate how the methodology developed here has real application potential, the
method was briefly applied to the determination of main contaminants in photographic
G. Kesiunaite et al. / Central European Journal of Chemistry 5(2) 2007 455–465 463
effluent sample before and after decomposition by anodic oxidation. To establish an
optimal amount of Ni2+ required for complete complexation of free EDTA various con-
centrations of Ni2+ were added to a 1:100 diluted sample and the amount of NiEDTA2−
chelate was measured. The obtained results showed that at Ni2+ concentrations higher
than 0.1 mmol/L, no statistically significant increase in the amount of NiEDTA2− was ob-
served indicating the completeness of the derivatization reaction. Therefore, 0.2 mmol/L
NiCl2 was added to the samples in the assays.
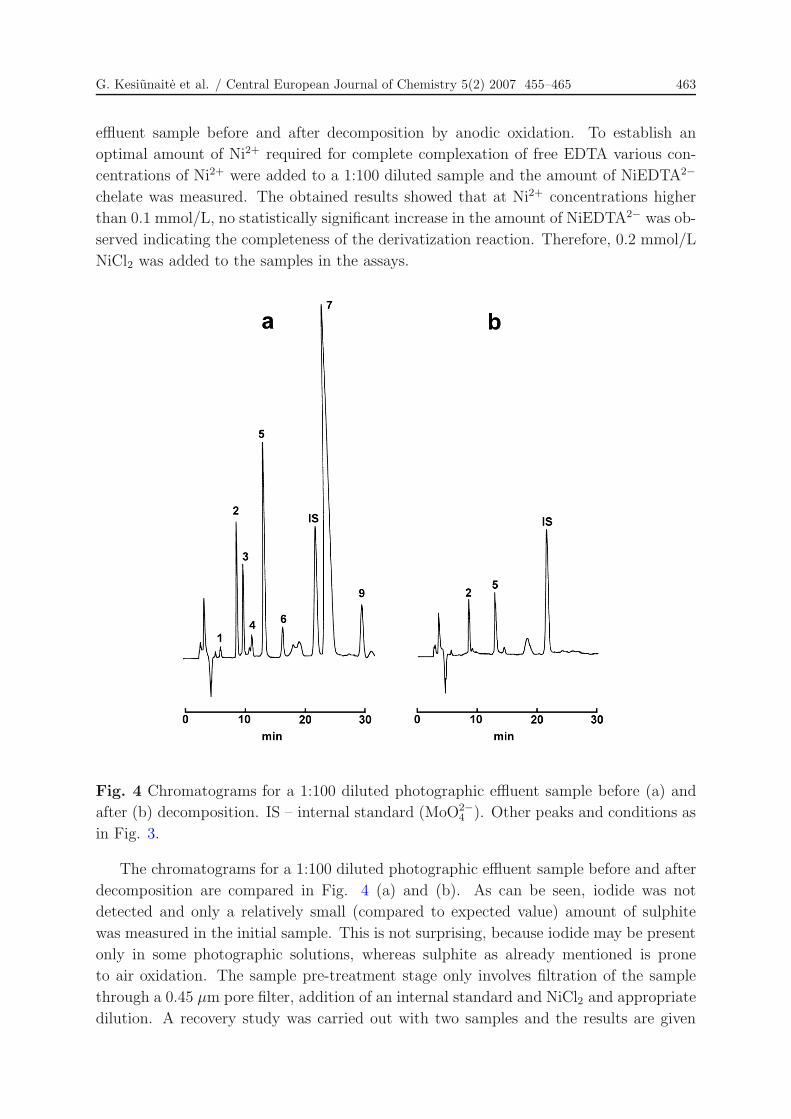
Fig. 4 Chromatograms for a 1:100 diluted photographic effluent sample before (a) and
after (b) decomposition. IS – internal standard (MoO2−4 ). Other peaks and conditions as
in Fig. 3.
The chromatograms for a 1:100 diluted photographic effluent sample before and after
decomposition are compared in Fig. 4 (a) and (b). As can be seen, iodide was not
detected and only a relatively small (compared to expected value) amount of sulphite
was measured in the initial sample. This is not surprising, because iodide may be present
only in some photographic solutions, whereas sulphite as already mentioned is prone
to air oxidation. The sample pre-treatment stage only involves filtration of the sample
through a 0.45 µm pore filter, addition of an internal standard and NiCl2 and appropriate
dilution. A recovery study was carried out with two samples and the results are given
464 G. Kesiunaite et al. / Central European Journal of Chemistry 5(2) 2007 455–465
in Table 2. It can be seen in the table that the concentrations found were generally in
good agreement with the added concentrations, with recoveries between 95 and 103%.
Slightly lower recoveries for hydroquinone and sulphite may be most likely attributed to
the higher oxidation ability for these compounds. Phenidone possesses the property of
being regenerated by the hydroquinone, therefore in the presence of hydroquinone it is
significantly less prone to air oxidation. These results suggest that interferences by the
other matrix components are not significant.
In conclusion, the results obtained here show that the IPC technique proved to be
satisfactory for the monitoring of spent photographic solutions with simple sample prepa-
ration and with high speed compared with other analytical techniques.
References
[1] S.G. Anchell and B. Troop: The film developing cookbook: advanced techniques for
film developing, Focal Press, Boston, 1998.
[2] L. Lunar, D. Sicilia, S. Rubio, D. Perez-Bendito and U. Nickel: “Degradation of
photographic developers by Fenton’s reagent: Condition optimization and kinetics
for metol oxidation”, Wat. Res., Vol. 34, (2000), pp. 1791–1802.
[3] C.D. Stalikas, L. Lunar, S. Rubio and D. Perez-Bendito: “Degradation of medical
X-ray film developing wastewaters by advanced oxidation processes”, Wat. Res., Vol.
35, (2001), pp. 3845–3856.
[4] R. Ragauskas, A. Dikcius, T. Vengris and A. Padarauskas: “Degradation of color
photographic waste fix solution by anodic oxidation”, J. Chem. Technol. Biotechnol.,
Vol. 78, (2003), pp. 81–86.
[5] R. Ragauskas, J. Matulionyte, T. Vengris and A. Padarauskas: “Regeneration of a
spent photographic fixer solution”, J. Chem. Technol. Biotechnol., Vol. 79, (2004),
pp. 1003–1008.
[6] J. Matulionyte, T. Vengris, R. Ragauskas and A. Padarauskas: “Removal of the com-
ponents from photoprocessing rinse water by anion-exchange resins”, Desalination,
Vol. 208, (2007), pp. 81–88.
[7] S. Pozdniakova, R. Ragauskas, A. Dikcius and A. Padarauskas: “Determination
of EDTA in used fixing solutions by capillary electrophoresis”, Fresenius J. Anal.
Chem., Vol. 363, (1999), pp. 124–125.
[8] S. Sirichai and A.J. de Mello: “A capillary electrophoresis microchip for the analysis
of photographic developer solutions using indirect fluorescence detection”, Analyst,
Vol. 125, (2000), pp. 1033–1036.
[9] V. Paliulionyte and A. Padarauskas: “Rapid analysis of spent fixing solutions by
capillary electrophoresis”, Chromatographia, Vol. 51, (2000), pp. 491–494.
[10] A. Padarauskas, V. Paliulionyte, R. Ragauskas and A. Dikcius: “Capillary elec-
trophoretic determination of thiosulfate and its oxidation products”, J. Chromatogr.
A, Vol. 879, (2000), pp. 235–243.
G. Kesiunaite et al. / Central European Journal of Chemistry 5(2) 2007 455–465 465
[11] S. Sirichai and A.J. de Mello: “A capillary electrophoresis chip for the analysis of
print and film photographic developing agents in commercial processing solutions
using indirect fluorescence detection”, Electrophoresis, Vol. 22, (2001), pp. 348–354.
[12] Z. Daunoravicius and A. Padarauskas: “Capillary electrophoretic determination of
thiosulfate, sulfide and sulfite using in-capillary derivatization with iodine” Elec-
trophoresis, Vol. 23, (2002), pp. 2439–2444.
[13] B. Pranaityte, A. Padarauskas, A. Dikcius and R. Ragauskas: “Rapid capillary
electrophoretic determination of glutaraldehyde in photographic developers using
a cationic polymer coating”, Anal. Chim. Acta, Vol. 507, (2004), pp. 185–190.
[14] B. Pranaityte, Z. Daunoravicius and A. Padarauskas: “Micellar electrokinetic chro-
matography of X-ray film developing baths”, Microchim. Acta, Vol. 149, (2005), pp.
49–54.
[15] L.R. Snyder, J.J. Kirkland and J.L. Glajch: Practical HPLC Method Development,
2nd ed., Wiley-Interscience, 1997.
[16] P. Davidkova: “Determination of developing agents in photographic bathes by liquid
chromatography”, J. Inform. Rec. Mat., Vol. 19, (1991), pp. 135–143.
[17] A. Padarauskas, Z. Daunoravicius and S. Jermak: “High-performance liquid chro-
matography of X-ray film developing baths”, Chemija (Vilnius), Vol. 15, (2004), pp.
34–38.
[18] L. Lunar, D. Sicilia, S. Rubio, D. Perez-Bendito and U. Nickel: “Identifica-
tion of metol degradation products under Fenton’s reagent treatment using liquid
chromatography-mass spectrometry”, Wat. Res., Vol. 34, (2000), pp. 3400–3412.
[19] L. Lunar, S. Rubio, D. Perez-Bendito and C. Jimenez: “Identification of the
main by-products of the developing agent N-hydroxyethyl-N-ethyl-3-methyl-p-
phenylenediamine in photographic effluents by liquid chromatography/mass spec-
trometry”, Rapid Commun. Mass Spectrom., Vol. 16, (2002), pp. 1622–1630.
[20] L. Lunar, S. Rubio and D. Perez-Bendito: “Ion trap LC/MS characterization of toxic
polar organic pollutants in colour photographic wastewaters and monitoring of their
chemical degradation”, Environ. Technol., Vol. 25, (2004), pp. 173–184.
[21] P.R. Haddad and P.E. Jackson: Ion chromatography – principles and applications,
Elsevier, Amsterdam, 1990.
[22] M.C. Gennaro: “Reversed-phase ion-pair and ion-interaction chromatography”, Adv.
Chromatogr., Vol. 35, (1995), pp. 343–381.
[23] M.C. Gennaro and S. Angelino: “Separation and determination inorganic anions by
reversed-phase high-performance liquid chromatography”, J. Chromatogr. A, Vol.
789, (1997), pp. 181–194.
[24] M. Sillanpaa, K.B. Raimo and M.L. Sihvonen: “Determination of EDTA and DTPA
as their Fe(III) complexes in pulp and paper mill process and waste-waters by liquid
chromatography”, Anal. Chim. Acta, Vol. 303, (1995), pp. 187–192.
[25] A. Padarauskas and G. Schwedt: “Capillary electrophoresis in metal analysis. Inves-
tigations of multi-elemental separation of metal chelates with aminopolycarboxylic
acids”, J. Chromatogr. A, Vol. 773, (1997), pp. 351–360.
Copyright © 2022 FDOKUMEN