Mass spectral investigations on trichothecene mycotoxins VII. Liquid chromatographic—thermospray...
14
BIOMEDICAL AND ENVlRONMENTAL MASS SPECTROMETRY, VOL. 18, 287-300 (1989) Mass Spectral Investigations on Trichothecene Mycotoxins VIII-Thermospray Ionization and Collisionally Activated Dissociation of Macrocyciic Trichothecenes Thaiya Krishnamurthyt Debra J. Beck and Robert K. Isensee US Army Chemical Research, Development and Engineering Center, Aberdeen Proving Ground, Maryland 21010, USA Oneida Research Services, 1 Halsey Road, Whitesboro, New York 13492 USA Several structurally similar, biologically active macrocyclic trichothecenes were ionized under thermospray condi- tions followed by collisionally activated dissociation of the ammonium adducts. Most of the observed daughter ions were formed by bond cleavage at the exocyclic ester bridges. Compounds with similar ester bridges formed several common daughter ions and underwent similar neutral losses. Fragmentation pathways proposed for the dissociation of the adducts were confirmed from the corresponding neutral loss spectra. Simple experiments designed for the sequential monitoring of the characteristic daughter ions were used for the rapid, direct and accurate analysis of macrocyclic trichothecenes in real samples. The pnmary drawback of the method is its inabil- ity to distinguish between isomers. INTRODUCTION Trichothecene mycotoxins are toxic fungal metabolites with a characteristic tetracyclic 12,13-trichothec-9-ene ring structure.',' They are classified into two major groups, simple and macrocyclic, based on their chemical structures.'92 The simple trichothecenes are invariably aicohols with substituents such as acetyl and isovaleryl gr~ups.~ The macrocyclic trichothecenes, with large, thermally labile exocyclic ester bridges, are the di- or triesters of simple trichothecenes such as verrucarols or oxygenated verrucarol~.~ They have been observed to be the most toxic of al1 known trichothecenes and are isoiated from fungai extracts, fermentation broths and Baccharis p l a n t ~ . ~ Economic losses and health hazards due to natural and induced exposure of crops, farm animals and humans to trichothecenes have been reported in several instances.'-'z Routine monitoring of agricultura1 products and the environment have thus become a ne~essity.'~.'~ The large number of known trichothecenes and their polar complex structures have posed a challenge in deveioping reiiable, specific, sensitive and accurate methods for their analysis in environmental samples. Even simple trichothecenes must be converted into more voiatile derivatives prior to analysis by gas chromatography/mass spectrometry (GC/MS).'5-'6 Analytical procedures for the macrocyclic tri- chothecenes by GC/MS are even more tedious and the results are not totally c~nclusive.'~ On the other hand, they have been analyzed with great sensitivity, selec- t Author to whom correspondence should be addressed 0887-61 34/89/050287-14 $07.00 (i) 1989 by John Wiley & Sons, Ltd tivity and accuracy by direct chemical ionization tandem mass spectrometric techniques with minimal sample clean-up and preparation.' *-'O We have previously reported sensitive and accurate chemical ionization mass spectrometric and tandem m a s spectrometric methods for the analysis of both simple and macrocyclic trichothecenes.' Our aim has been to develop a single, sensitive, accurate and applicable method of analysis for both types of tri- chothecenes. As a part of our continuing effort to develop such a method and to improve the presently available analytical methodoiogies, we investigated the ionization of aqueous solutions containing the macro- cyclic trichothecenes (Fig. 1). The soiutions were intro- duced directly into the source via a thermospray liquid chromatograph/mass spectrometer interfacez1 using 50% methanoi/O.lM ammonium acetate buffer. The molecules were ionized under these conditions and their corresponding positive ion chemical ionization m a s spectra recorded. The m a s spectra indicated the forma- tion of the corresponding molecular ion ammonium adducts in great abundances. A method using liquid chromatography/mass spectrometry (LC/MS) was developed to analyze some of these macrocyclic tri- chothecenes in crude aqueous samples." In certain instances, a high signal to noise ratio due to matrix effects had an undesirable effect in both the detection and quantification of the analytes.22 Techniques using tandem mass spectrometry (MS/MS) were pursued in order to develop a more direct and specific method. The ammonium adducts were subjected to collisionaliy activated dissociation (CAD) in the presence of argon, and their daughter mass spectra were recorded. The ions observed in the CAD mass spectra revealed that structurally similar compounds underwent common fragmentation modes Received 23 May 1988 Revised 9 November 1988
-
Upload
independent -
Category
Documents
-
view
3 -
download
0
Transcript of Mass spectral investigations on trichothecene mycotoxins VII. Liquid chromatographic—thermospray...

BIOMEDICAL AND ENVlRONMENTAL MASS SPECTROMETRY, VOL. 18, 287-300 (1989)
Mass Spectral Investigations on Trichothecene Mycotoxins VIII-Thermospray Ionization and Collisionally Activated Dissociation of Macrocyciic Trichothecenes
Thaiya Krishnamurthyt
Debra J. Beck and Robert K. Isensee US Army Chemical Research, Development and Engineering Center, Aberdeen Proving Ground, Maryland 21010, USA
Oneida Research Services, 1 Halsey Road, Whitesboro, New York 13492 USA
Several structurally similar, biologically active macrocyclic trichothecenes were ionized under thermospray condi- tions followed by collisionally activated dissociation of the ammonium adducts. Most of the observed daughter ions were formed by bond cleavage at the exocyclic ester bridges. Compounds with similar ester bridges formed several common daughter ions and underwent similar neutral losses. Fragmentation pathways proposed for the dissociation of the adducts were confirmed from the corresponding neutral loss spectra. Simple experiments designed for the sequential monitoring of the characteristic daughter ions were used for the rapid, direct and accurate analysis of macrocyclic trichothecenes in real samples. The pnmary drawback of the method is its inabil- ity to distinguish between isomers.
INTRODUCTION
Trichothecene mycotoxins are toxic fungal metabolites with a characteristic tetracyclic 12,13-trichothec-9-ene ring structure.',' They are classified into two major groups, simple and macrocyclic, based on their chemical structures.'92 The simple trichothecenes are invariably aicohols with substituents such as acetyl and isovaleryl g r ~ u p s . ~ The macrocyclic trichothecenes, with large, thermally labile exocyclic ester bridges, are the di- or triesters of simple trichothecenes such as verrucarols or oxygenated verrucarol~.~ They have been observed to be the most toxic of al1 known trichothecenes and are isoiated from fungai extracts, fermentation broths and Baccharis p l a n t ~ . ~ Economic losses and health hazards due to natural and induced exposure of crops, farm animals and humans to trichothecenes have been reported in several instances.'-'z Routine monitoring of agricultura1 products and the environment have thus become a ne~ess i ty . '~ . '~
The large number of known trichothecenes and their polar complex structures have posed a challenge in deveioping reiiable, specific, sensitive and accurate methods for their analysis in environmental samples. Even simple trichothecenes must be converted into more voiatile derivatives prior to analysis by gas chromatography/mass spectrometry (GC/MS).'5-'6 Analytical procedures for the macrocyclic tri- chothecenes by GC/MS are even more tedious and the results are not totally c~nclusive. '~ On the other hand, they have been analyzed with great sensitivity, selec-
t Author to whom correspondence should be addressed
0887-61 34/89/050287-14 $07.00 (i) 1989 by John Wiley & Sons, Ltd
tivity and accuracy by direct chemical ionization tandem mass spectrometric techniques with minimal sample clean-up and preparation.' *-'O
We have previously reported sensitive and accurate chemical ionization mass spectrometric and tandem m a s spectrometric methods for the analysis of both simple and macrocyclic trichothecenes.' Our aim has been to develop a single, sensitive, accurate and applicable method of analysis for both types of tri- chothecenes. As a part of our continuing effort to develop such a method and to improve the presently available analytical methodoiogies, we investigated the ionization of aqueous solutions containing the macro- cyclic trichothecenes (Fig. 1). The soiutions were intro- duced directly into the source via a thermospray liquid chromatograph/mass spectrometer interfacez1 using 50% methanoi/O.lM ammonium acetate buffer. The molecules were ionized under these conditions and their corresponding positive ion chemical ionization m a s spectra recorded. The m a s spectra indicated the forma- tion of the corresponding molecular ion ammonium adducts in great abundances. A method using liquid chromatography/mass spectrometry (LC/MS) was developed to analyze some of these macrocyclic tri- chothecenes in crude aqueous samples." In certain instances, a high signal to noise ratio due to matrix effects had an undesirable effect in both the detection and quantification of the analytes.22
Techniques using tandem mass spectrometry (MS/MS) were pursued in order to develop a more direct and specific method. The ammonium adducts were subjected to collisionaliy activated dissociation (CAD) in the presence of argon, and their daughter mass spectra were recorded. The ions observed in the CAD mass spectra revealed that structurally similar compounds underwent common fragmentation modes
Received 23 M a y 1988 Revised 9 November 1988

288 T. KRISHNAMURTHY, D. J. BECK AND R. K. ISENSEE
R1 R2 R 3 R4 OTHER _ _ _ - ~
2' 3' 4 5' 61 RORIDIN A (1) - cnon cn c n p Z cn20cn cnon cn3 n n n n -
12' 13' 1 4
2,0,3' 4 5' 6.1 RORIDIN D (11) - cn - c n c n 3 c n 2 c H 2 0 c n cnoncn3 H n n n -
12' 13' 14'
2' 3 4' 5' 6'1 n n n n RORIDIN E 1111) - cn = cncn3 cn2 CH? cn cnoncn3 -
12' 1 3 14'
2 3' 4 s/o\;,- RORIDIN n (iv) - cn = cn cn3 cn2 cn , n n n n -
1 2 \OMcncn3 13' 14'
2' 3' 12' 4 5' 6 / 1 3 14'
BAccnARiNoiD.1 h z (v h vi) - c n p c H 3 c n o n c n 2 0 c n cnoncn3 n on n H -
2 3 1 2 4 5' / 13' 14' EACC~ARINOID-3 6 7 mi EL x) - cno ncn cn3 cnZ cn20cn cnon cn3 n on n n -
6'
2 3 4' 5' 6.1 BACCHARINOID-4 WII) - cn ~ cncn3cnon cn20 cn cnon cn3 n on n n -
'o' 12' 13' 1 4
2 3' 4 5' 6/ BACCHARINOID-5 (DO - cn - cncn3 cnon cnzo cn cnon cn3 n n n n 9. i o . E w x Y
'o' 1 2 13' 14 '
2 3 ' 4 ' 5 ' 6 VERRUCARIN A (mi - cnon cn cn3 cnZ cnz o c ~ n n n n -
12' O
2 3' 4 5 ' 6
30-HYDROXYVERRUCARIN A (XII) - CHOH CH CH3 CH2 CH O o n n n n 2 F - - 1 2 O
2' 3 4 5' 6' 8n-HYDROXYVERRUCARIN A ~ i i i ) ~ CHOH CH CH3 CH2 CH2 O C ~ n n o n n -
12' O
2 3' 4 ' 5 ' 6
1bHYDROXYVERRUCARIN A W ) - CHOH CH CH3 CH2 CH2 O F n n n o n - 1 2 O
2 3' 4 5 ' 6 9,lO~EPOXYVERRUCARIN A (XVi) ~ CHOH CH CH3 CH2 CH O n n n n 9.io-EPoxY f -
12'
2 3' 4' 5' 6 n E-KETO B.KETOVERRUCARIN A IXVII) - cnon cn cn3 cn2 o c ~ n - -
1 2 O
2 3 ' 4 ' 5 ' 6 '
II O
VERRUCARIN J ( m i i ) ~ cn = c cn3 cnz cn2 o c ~ n n ~ n - 12'
Figure 1. Structures of macrocyclic trichothecenes.
and neutral losses. Severa1 common daughter ions were also observed for such compounds. Simple procedures were devised for the direct introduction of aqueous sol- utions containing macrocyclic trichothecenes and A standard commercial Finnigan-MAT triple- sequentially detecting the specific daughter ions of these quadrupole mass spectrometer (TSQ), Waters Associ- compounds. The developed procedures were applied to ates high-performance liquid chromatograph with their direct and accurate analysis in real samples. sample injector loop (20 pl), and Vestec thermospray
EXPERIMENTAL
MACROCYCLIC TRICHOTHECENES 289
14208.
Roridin A
100.0
50.C
7
i 83
Roridin H
359
M/Z 150 200 250 300 350 400 450 500
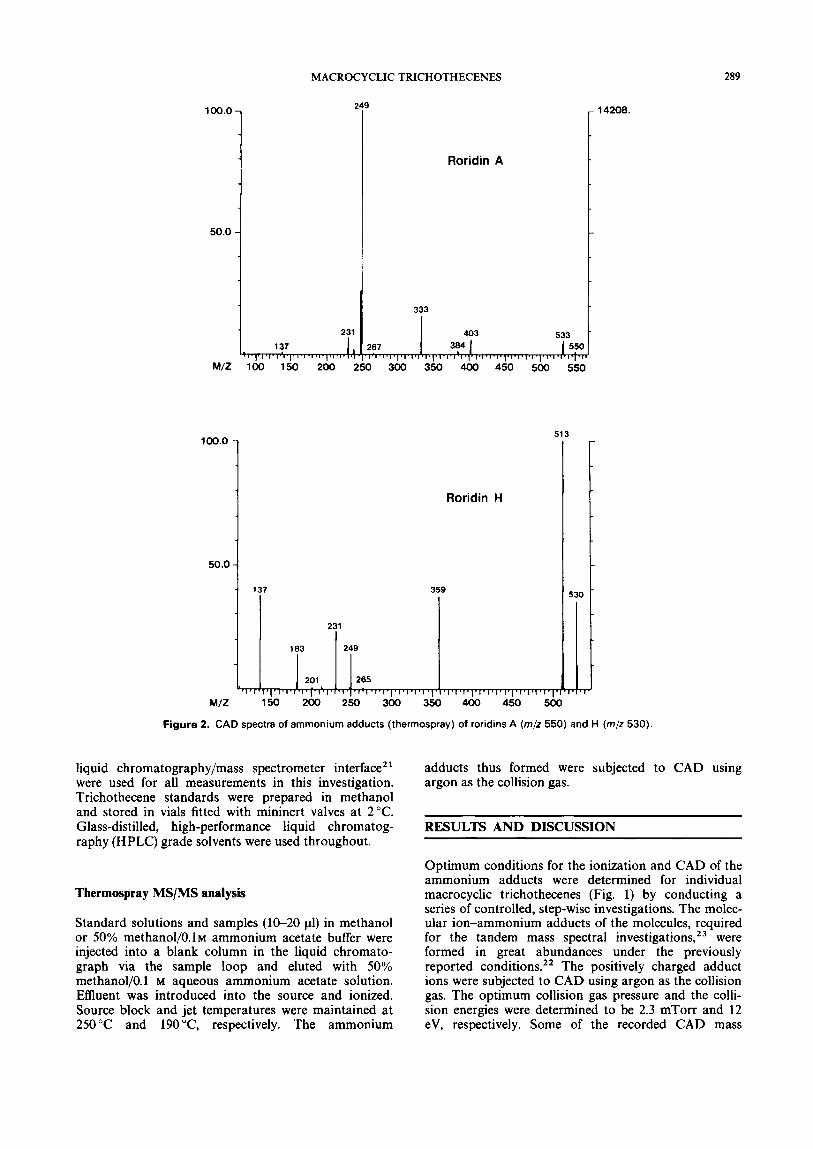
Figure 2. CAD spectra of ammonium adducts (therrnospray) of roridins A (m/z 550) and H (m/z 530).
liquid chromatography/mass spectrometer interface” were used for al1 measurements in this investigation. Trichothecene standards were prepared in methanol and stored in vials fitted with mininert valves at 2°C. Glass-distilled, high-performance liquid chromatog- raphy (HPLC) grade solvents were used throughout.
Therrnospray MS/MS analysis
Standard solutions and samples (10-20 VI) in methanol or 50% methanol/O.lM ammonium acetate buffer were injected into a blank column in the liquid chromato- graph via the sample loop and eluted with 50% methanol/O. 1 M aqueous ammonium acetate solution. Effluent was introduced into the source and ionized. Source block and jet temperatures were maintained at 250 “C and 190 “C, respectively. The ammonium
adducts thus formed were subjected to CAD using argon as the collision gas.
RESULTS AND DISCUSSION
Optimum conditions for the ionization and CAD of the ammonium adducts were determined for individual macrocyclic trichothecenes (Fig. 1) by conducting a series of controlled, step-wise investigations. The molec- ular ion-ammonium adducts of the molecules, required for the tandem mass spectral inve~tigations,’~ were formed in great abundances under the previously reported conditions.” The positively charged adduct ions were subjected to CAD using argon as the collision gas. The optimum collision gas pressure and the colli- sion energies were determined to be 2.3 mTorr and 12 eV, respectively. Some of the recorded CAD mass
290
-
100.0
50.0
T. KRISHNAMURTHY, D. J. BECK AND R. K. ISENSEE
81 28.
Baccharinoid-3
M/Z 1 0 0 200 300 400 500
100.0
50.0
2
247
Baccharinoid-5
347
409
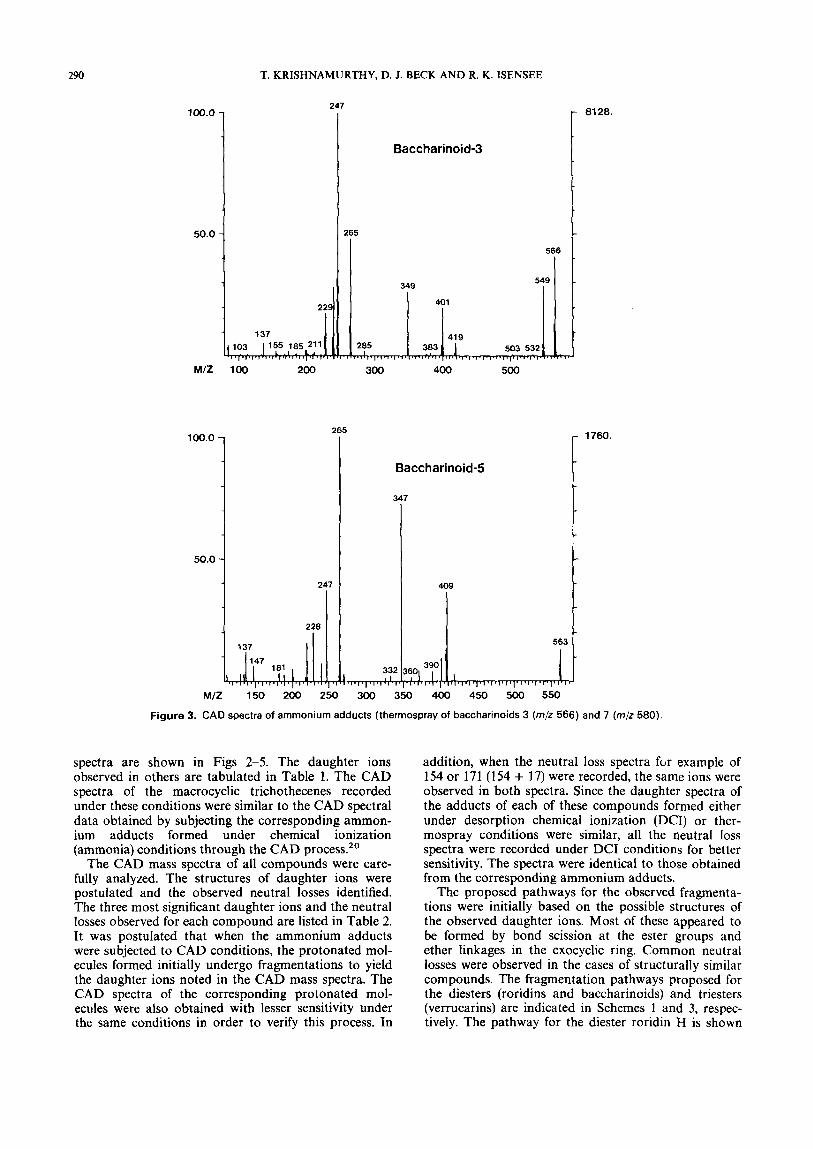
Figure 3. CAD spectra of ammoniurn adducts (therrnospray of baccharinoids 3 (m/z 566) and 7 (m/z 580).
spectra are shown in Figs 2-5. The daughter ions observed in others are tabulated in Table 1. The CAD spectra of the macrocyclic trichothecenes recorded under these conditions were similar to the CAD spectral data obtained by subjecting the corresponding ammon- ium adducts formed under chemical ionization (ammonia) conditions through the CAD process.20
The CAD mass spectra of al1 compounds were care- fully analyzed. The structures of daughter ions were postulated and the observed neutral losses identified. The three most significant daughter ions and the neutral losses observed for each compound are listed in Table 2. It was postulated that when the ammonium adducts were subjected to CAD conditions, the protonated mol- ecules formed initially undergo fragmentations to yield the daughter ions noted in the CAD mass spectra. The CAD spectra of the corresponding protonated mol- ecules were also obtained with lesser sensitivity under the same conditions in order to verify this process. In
addition, when the neutral loss spectra f w example of 154 or 171 (154 + 17) were recorded, the same ions were observed in both spectra. Since the daughter spectra of the adducts of each of these compounds formed either under desorption chemical ionization (DCI) or ther- mospray conditions were similar, al1 the neutral loss spectra were recorded under DCI conditions for better sensitivity. The spectra were identical to those obtained from the corresponding ammonium adducts.
The proposed pathways for the observed fragmenta- tions were initially based on the possible structures of the observed daughter ions. Most of these appeared to be formed by bond scission at the ester groups and ether linkages in the exocyclic ring. Common neutral losses were observed in the cases of structurally similar compounds. The fragmentation pathways proposed for the diesters (roridins and baccharinoids) and triesters (verrucarins) are indicated in Schemes 1 and 3, respec- tively. The pathway for the diester roridin H is shown
MACROCYCLIC TRICHOTHECENES
8-5
29 1
12112.
Verrucarin A
: 100.0
50.0
M/Z 100 150 200
5 0 1
8P-Hydroxyverrucarin
473
247
rp
250 300 350 400 450 5
536
.I 3 5!
- 13552.
1
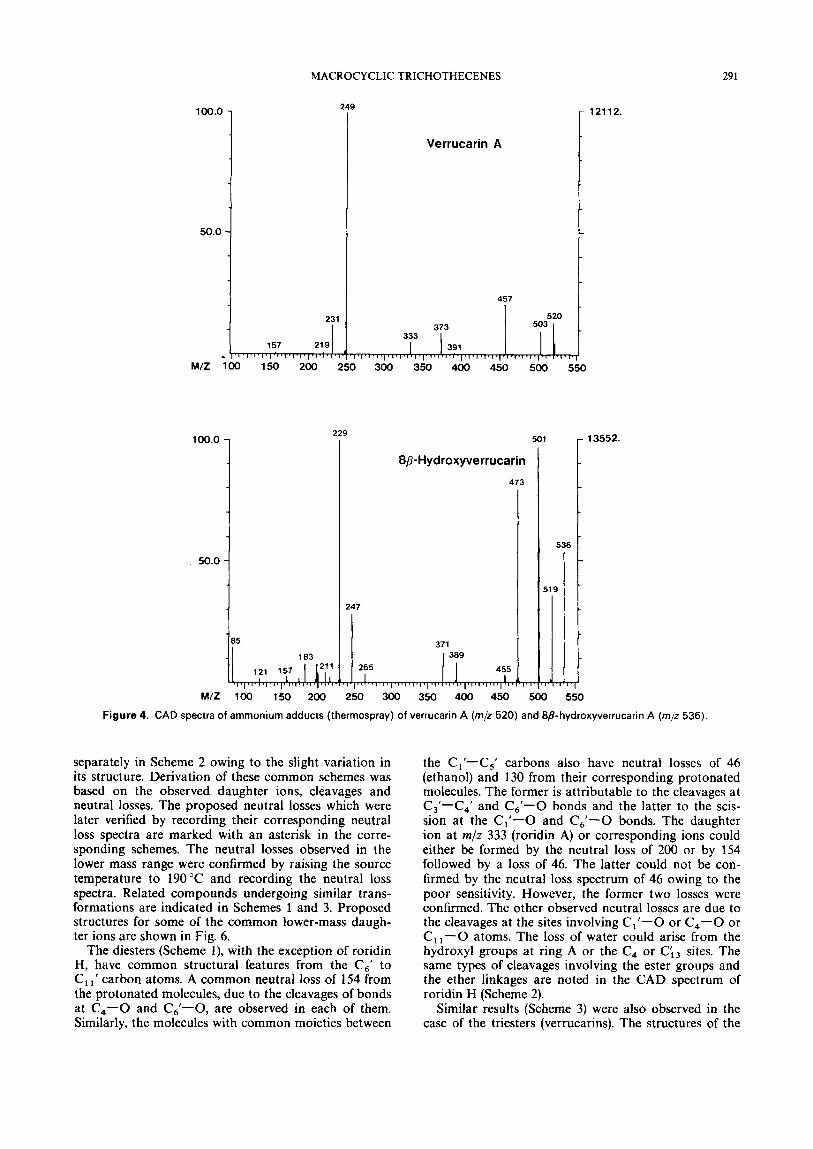
Figure 4. CAD spectra of ammonium adducts (therrnospray) of verrucarin A (m/z 520) and 8~-hydroxyverrucarin A (m/z 536)
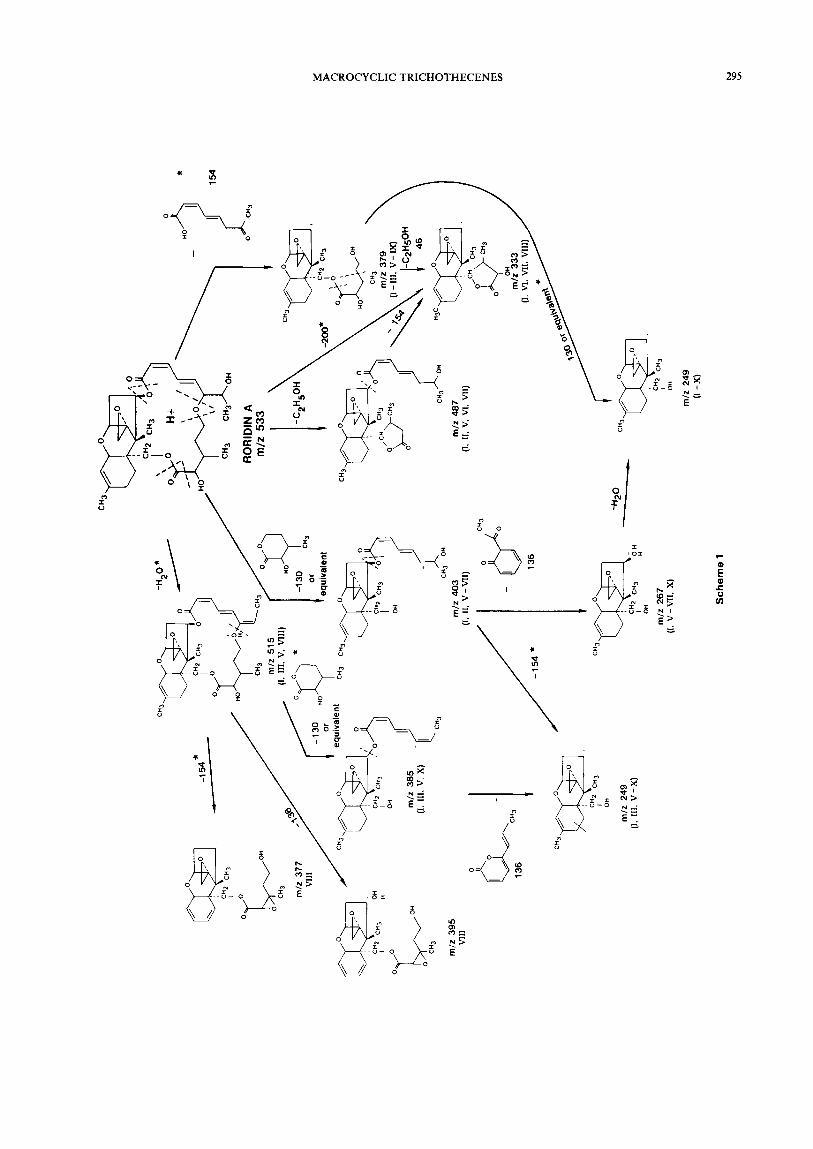
separately in Scheme 2 owing to the slight variation in its structure. Derivation of these common schemes was based on the observed daughter ions, cleavages and neutral losses. The proposed neutral losses which were later verified by recording their corresponding neutral loss spectra are marked with an asterisk in the corre- sponding schemes. The neutral losses observed in the lower mass range were confirmed by raising the source temperature to 190°C and recording the neutral loss spectra. Related compounds undergoing similar trans- formations are indicated in Schemes 1 and 3. Proposed structures for some of the common lower-mass daugh- ter ions are shown in Fig. 6.
The diesters (Scheme l), with the exception of roridin H, have common structural features from the c6’ to Cl l ‘ carbon atoms. A common neutral loss of 154 from the protonated molecules, due to the cleavages of bonds at C,-O and (2,’-O, are observed in each of them. Similarly, the molecules with common moieties between
the Cl’-C,’ carbons also have neutral losses of 46 (ethanol) and 130 from their corresponding protonated molecules. The former is attributable to the cleavages at C3’-C4’ and C,’-O bonds and the latter to the scis- sion at the C,’-O and C,’-O bonds. The daughter ion at m/z 333 (roridin A) or corresponding ions could either be formed by the neutral loss of 200 or by 154 followed by a loss of 46. The latter could not be con- firmed by the neutral loss spectrum of 46 owing to the poor sensitivity. However, the former two losses were confirmed. The other observed neutral losses are due to the cleavages at the sites involving C,’-O or C,-O or Cll-O atoms. The loss of water could arise from the hydroxyl groups at ring A or the C, or C;, sites. The same types of cleavages involving the ester groups and the ether linkages are noted in the CAD spectrum of roridin H (Scheme 2).
Similar results (Scheme 3) were also observed in the case of the triesters (verrucarins). The structures of the
292 T. KRISHNAMURTHY, D. J. BECK A N D R. K. ISENSEE
100.0
50.0
*í3
M/Z 100 150 200 250 300 350 400 450 500 550
100.0
50.0 -
2
15
227
8-Ketoverrucarin A
534
163
51 7
307
471
O 3 0 0 3 5 0 4 0 0 4 5 0 5 0 0
6488.
14448.
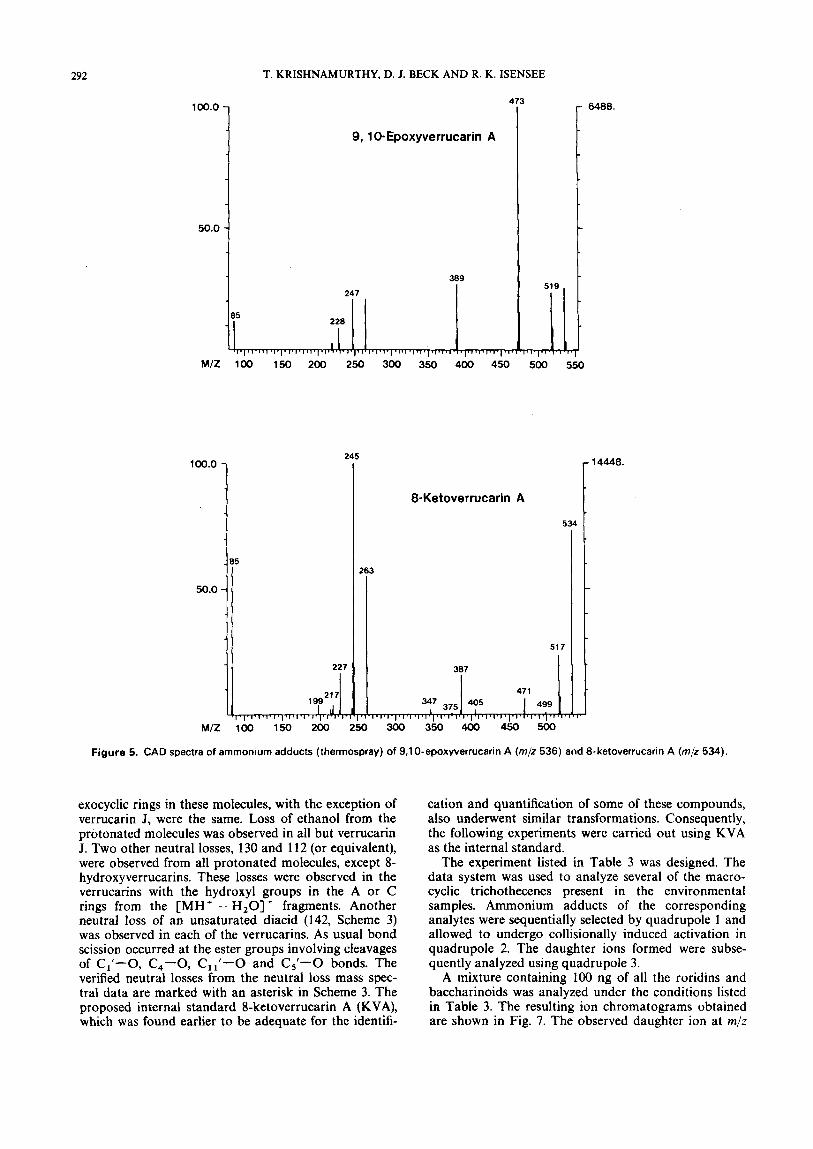
Figure 5. CAD spectra of arnmoniurn adducts (therrnospray) of 9,lO-epoxyverrucarin A (m/z 536) and 8-ketoverrucarin A (m/z 534)
exocyclic rings in these molecules, with the exception of verrucarin J, were the same. Loss of ethanol from the protonated molecules was observed in al1 but verrucarin J. Two other neutral losses, 130 and 112 (or equivalent), were observed from al1 protonated molecules, except 8- hydroxyverrucarins. These losses were observed in the verrucarins with the hydroxyl groups in the A or C rings from the [MH+ - H,O]+ fragments. Another neutral loss of an unsaturated diacid (142, Scheme 3) was observed in each of the verrucarins. As usual bond scission occurred at the ester groups involving cleavages of (2,’-O, C,-O, Cl1’-0 and C5’-0 bonds. The verified neutral losses from the neutral loss mass spec- tral data are marked with an asterisk in Scheme 3. The proposed internal standard 8-ketoverrucarin A (KVA), which was found earlier to be adequate for the identifi-
cation and quantification of some of these compounds, also underwent similar transformations. Consequently, the following experiments were carried out using KVA as the internal standard.
The experiment listed in Table 3 was designed. The data system was used to analyze severa1 of the macro- cyclic trichothecenes present in the environmental samples. Ammonium adducts of the corresponding analytes were sequentially selected by quadrupole 1 and allowed to undergo collisionally induced activation in quadrupole 2. The daughter ions formed were subse- quently analyzed using quadrupole 3.
A mixture containing 100 ng of al1 the roridins and baccharinoids was analyzed under the conditions listed in Table 3. The resulting ion chromatograms obtained are shown in Fig. 7. The observed daughter ion at mlz
MACROCYCLIC TRICHOTHECENES 293
Table 1. CAD spectra of ammooium adducts (thermospray) of macrocyciic trichotheceoesa
Compound
Roridin D 548 (1 6) 531 (5) 376 (2) 359 (2)
Roridin E 532 (1 8) 515 (10) 361 (100) 267 (2)
Baccharinoids-1 and 2 566 (4) 549 (36) 383 (9) 285 (1 2)
Baccharinoid-7 566 (45) 549 (23) 349 (22) 285 (3)
3a- Hydroxyverrucarin A 519 (3) 501 (4) 283 (8) 265 (64)
8a- Hydroxyverrucarin A 536 (6) 519 (4) 247 (11) 229 (99)
16-Hydroxyverrucarin A 536 (52) 519 (16) 349 (9) 265 (100)
Verrucarin J 502 (53) 485 (58) 231 (76) 113 (27)
a Only ten daughter ions observed in the CAD spectra are listed.
Daughter ions rnp (relative abundance)
485 (3) 249 (1 00) 514 (3) 231 (2) 531 (19) 265 (1 2) 503 (2) 265 (47) 389 (52) 247 (1 00) 501 (100) 211 (4) 473 (94) 247 (41 ) 373 (31 )
403 (3) 231 (23) 497 (1) 114 (1) 496 (3) 247 (1 00) 419 (6) 247 (1 00) 371 (16) 229 (71 ) 473 (4) 199 (13) 407 (1) 229 (1 6) 343 (1 00)
377 (2)
379 (1)
401 (73) 229 (90) 401 (15) 229 (24) 59 (5)
201 (46). 265 (1) 183 (5) 389 (1 2) 183 (3) 249 (23)
137 (6)
Table 2. Significant daughter ions and neutral losseso
Compound
Roridin A Roridin D Roridin E Roridin H Baccharinoids-1 and 2 Baccharinoid-4 Baccharinoid-5 Baccharinoid-7 Verrucarin A 3a- Hydroxyverrucarin A 8a- Hydroxyverrucarin A 8B-Hydroxyverrucarin A 16-Hydroxyverrucarin A 9.1 O-Epoxyverrucarin A 8-Ketoverrucarin A Verrucarin J
Daughter ions (rnlz)
249, 333,403 231,249. 403 137, 231, 361 137, 231,359 229, 247, 401 137, 247. 391 247, 265.409 247, 265, 349 249,373, 457 247, 265, 389 229, 265,473 229, 247.473 247, 265,473 265,389.473 245, 263. 387 231, 343. 373
Neutral losses General
46,130, 136,154 128, 136,154 18,112,154 94,110 18,116,130,154 18,136,154 18, 46, 130, 136, 154 18, 130, 136,154 18, 1 24, 130,142 18,112, 124,130,142 18,112, 124,130,142 18, 112, 124,130,142 18,112, 124,130 18,124,142 18,112,124, 130,142 18,94,112,142
a The most abundant daughter ions and the most predominant neutral losses are listed in bold letters.
From MH *
18,130, 154, 200 46, 128,154 18,136,154 154 18, 148 18,154 154 46,130 46,112,130 18,46, 112,130 18,46 18,46,130 46,112,130 46,130 46, 11 2,130 112,142
Table 3. Conditions for analysis by thermospray MS/MS analysis
Cornpound
Roridin A 550 249 Roridin D 548 249 Roridin E 532 361 Baccharinoids 1, 2, 3 and 7 566 247 Baccharionoids 4 and 5 580 247 KVA (internal standard) 534 245
a Each daughter ion was monitored for 0.06 s.
249 originated from roridins A and D. The ions arising from the individual compounds could be obtained by spiitting the acquired raw tandem mass spectral data using the data system. Similarly, the ion counts of m/z 247 originating from the parent ions of m/z 580
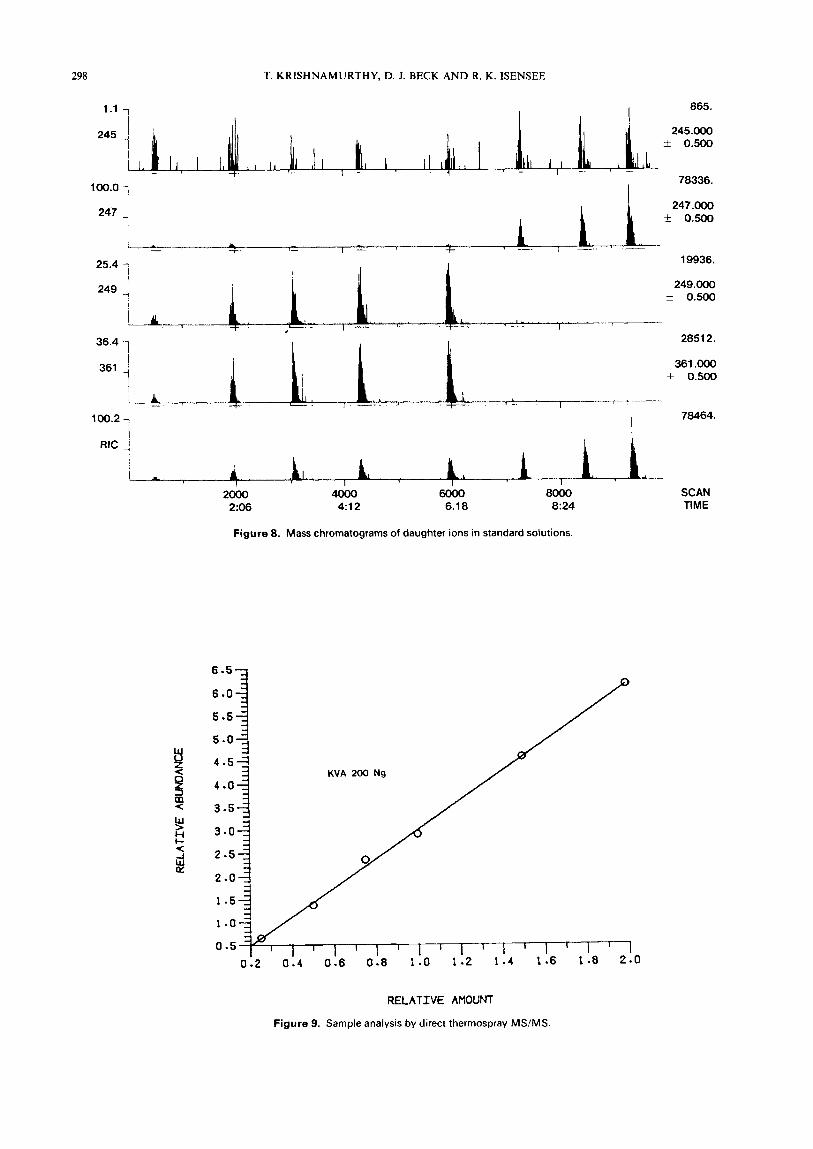
(baccharinoids 4 and 5 ) and m/z 566 (baccharinoids 1, 2, 3 and 7) were aiso determined. A number of standard solutions containing different amounts (20-400 ng) of analytes and the same amount (200 ng) of interna1 sample (KVA) were injected at short intervals and anaiyzed during a single run (Fig. 8). Standard solutions 6-8 did not contain the roridins. The mass chromato- grams clearly show the absence of roridins in these solu- tions, even though solution 5 contained larger amounts of roridins and the standard soiutions were introduced within short intervals (less than 2 min). The calibration curves required to quantify the analytes were obtained in iess than 15 min. The caiibration curve thus obtained for roridin D is shown in Fig. 9.
Duplicates of two unknown crude aqueous samples, ‘cor 3’ (coridfolia) and ‘meg lo’ (megapotamica),’’ and the blanks containing the internal standard (KVA, 50 ng) were analyzed by this procedure (Fig. 10). Blank runs indicated no carry-overs between sample runs, and the interferences from the sampie matrix were negligible.

294 T. KRISHNAMURTHY, D. J. BECK A N D R. K. ISENSEE
H
Ovo;v + \
+
HO
m/z 113 (1 1
O
m/z 131 (2)
H3C * OH
m/z 155 (4)
O
m/z 171 (5)
O
m/z 137 (3)
OH O
m/z 183 (6)
m/z 183 (7)
cH3w CH2 I CH3 +
OH
m/z 213 (8)
m/z 231 (9)
O
m/z 249 m/z 199
Figure 6. Proposed structures for some common daughter ions. (1 0) (11)
Detected compounds were later verified by comparing their sample CAD spectra with those of the standards.
One serious shortcoming of this procedure was evident. The sources and the corresponding amount of m/z 249 formed from roridins A and D could be traced and measured by splitting (software) the data file since they were derived from different parent ions (m/z 550 and 548). Similarly, the daughter ions (m/z 247) derived from m/z 566 and 580 could also be distinguished.
However, the daughter ions with the same m a s to charge ratios derived from different compounds with the same molecular weights could not be distinguished. Thus, only the total ion counts due to m/z 247 derived from baccharinoids 4 and 5 (m/z 580) could be mea- sured. Similarly, the source(s) of m/z 247 could not be ascertained between the baccharinoids 1, 2, 3 and 7 present in the samples. As a result, only the roridins were identified in sample 2. The distinction between
MACROCYCLIC TRICHOTHECENES 295

296
245 .
T. KRISHNAMURTHY, D. J. BECK AND R. K. ISENSEE
245.073 KVA i 0.500 -,.&h , . L , .
r ..........
90.7 - 249
154
RORlDlN H m/z 513
10976. 249.075
RORlDlN A & D * 0.500
mlz 249
Scheme 2
on mlz 265

MACROCYCLIC TRICHOTHECENES 297
298 T. KRISHNAMURTHY, D. J. BECK A N D R. K. ISENSEE
249 4 25.4 1
865. 1.1 7 I
249.000 k 0.500
361 I
100.2,
361 .000 f 0.500
,
78464. I
2000 4000 aooo 2:06 4:12 6.1 a 8:24
Figure 8. Mass chromatograms of daughter ions in standard solutionc.
KVA 200 Ng
SCAN TIME
RELATIVE AMOUNT
Figura 9. Sample analysis by direct therrnospray MS/MS.

6392. I 35.2 -,
245.000 f 0.500
_. I I 1 I l I l
1 1
181 76.
247.000 lW'Ol 247 , f 0.500
MEG 10
l 1 L .
I l 1 _ _ 1 l fi
3528. 19.4 -, l
i 361 .000 1 f 0.500
361 i i l I
I I I I
l - . .. _.
18272.
I
1 0 0 0 2000 3Ooo 4Ooo 5Ooo 6Ooo 7000 SCAN 1 :O3 2:06 3 : w 4:12 5:15 6.1 8 7.21 TIME
Figure 10. Calibration curve for roridin D.
100'o/ 50.0
247
STANDARD
265
M I 2 150 200 250 300 350
lm'oi i 3088 STANDARD
M I 2 400 450 500 550
F 12672. 247
I sAMPLE
t 50.0 1
MI2 100 1 50 200 250 300
F 12672 SAMPLE lo0.O 1
1 50.0 580 1 I
MIZ 350 400 450 500 550
Figure 1 1 . Standard and sample daughter spectra of baccharinoid 4.

300 T. KRISHNAMURTHY, D. J. BECK AND R. K. ISENSEE
baccharinoids 4 and 5 detected in ‘meg 10’ sample could not be made by this procedure. The full-scan daughter spectra of the standards for these two isomers are similar, and hence identification of these isomers in samples by comparing the sample daughter spectrum (Fig. 11) with the standard was not posible. One solu- tion to this type of exceptional problem is the chro- matographic separation of the isomers prior to analysis. Investigations towards the simultaneous identification and accurate quantification of these isomeric macro- cyclic trichothecenes by a single LC/MS/MS run are under way.
The list of neutral losses shown in Table 2 indicates that the losses of 154 and 130 should be helpful in the specific detection of al1 roridins and baccharinoids in samples. Similarly, the verrucarins can be analyzed by obtaining the neutral loss spectra of 130 and 142. The data system was programmed to sequentially obtain the neutral loss spectra of 130, 142 and 154. A mixture con- taining al1 compounds under investigation was analyzed using this procedure. The acquired data were split into three data files to obtain individual neutral loss spectra. Owing to poor sensitivity and higher noise levels, the attempt to identify al1 of these molecules during a single analysis from their neutral loss spectra was unsuc- cessful.
CONCLUSIONS ~ ~ ~ ~~ ~~
Direct thermospray/tandem mass spectrometric tech- niques are applicable to the rapid, selective, sensitive and accurate analysis of certain macrocyclic tri- chothecenes in crude aqueous samples. However, the method suffers in its ability to distinguish between isomers. Separation of such analytes on an HPLC column prior to subjecting them to CAD should solve this specific problem.
Acknowledgements
The authors gratefully acknowledge Mrs Marguerite E. Brooks and Dr Richard Smardzewski of U S Army Chernical Research, Develop- rnent and Engineering Center, Aberdeen Proving Ground, Maryland, and Professor Bruce B. Jarvis of the University of Maryland, College Park, Maryland, for their continued interest, valuable suggestions and trichothecene standards and samples rendered throughout this investi- gation.
REFERENCES
1. Y. Ueno (Ed.), Developments in Food Science. 4- Trichothecenes. Chemical, Biological and Toxicological Aspecrs, pp. 1-6. 135-301. Elsevier, Amsterdam (1 983).
2. H. Kurata and Y. Ueno (Eds), Toxigenic Fungi-Their Toxins and Health Hazards. Elsevier. Amsterdam 11 984).
3.
4.
5.
6.
7.
8.
9.
1 o.
K. Ishi, in Developments in Food Science: 4-Trichothecenes, Chemical, Biological and Toxicological Aspects, ed. by Y . Ueno, pp. 7-1 9. Elsevier. Amcterdam (1 983). B. B. JaNiS, in Developments in Food Science. 4- Trichothecenes, Chemical, Biological and Toxicological Aspects, ed. by Y. Ueno, pp. 2&38. Elsevier. Amcterdam (1983). J. V. Rodricks, C. W. Hesseltine and M. A. Mehlman (Edc), Mycotoxins in Human and Animal Health. Pathotox, Park Forest, lllinois (1 977). J. Palti. Toxigenic Fusaria. Their Distribution and Significance as Causes of Disease in Animals and Men. Parey, Berlin (1978). D. Eaker and T. Wadstrom, Natural Toxins. Plenum, New York (1980). A. M. Haig, Chemical Warfare in Southeast Asia and Afganis- ran, US Department of State Special Report No. 98. Washing- ton, DC, March (1982). G. P. Schultz, Chemical Warfare in Southeast Asia and Afga- nisran: An Update, US Department of State Special Report No. 104. Washington, DC, November (1 982). R. T. Rosen and J. D. Rosen, Biomed. Mass Spectrom. 9, 443 (1982).
11. C. J. Mirocha, R. A. Pawlosky, K. Chatterjee, S. Watson and
12. W. A. Craft, B. B. Jarvis and C. S. Yatawara, Atmos. Environ.. W. Hayes, J . Assoc. Off. Anal. Chem. 66,1485 (1 983).
13.
14.
15.
16.
17.
18.
19.
20.
21. 22.
23.
20,549 (1 986). P. M. Scott, P. Lau and S. R. Kanhere, J. Assoc. Off. Anal. Chem. 6,1364 (1 981 ). R. D. Plattner and G. A. Bennett, J. Assoc. Off. Anal. Chem. 66, 1470 (1983). T. Krishnamurthy, M. B. Wasserman and E. W. Sarver, Biomed. Mass Spectrom. 1 3, 503 (1 986). T. Krishnamurthy and E. W. Sarver, J. Chromatogr. 355, 253 (1986). T. Krishnamurthy, E. W. Sarver, B. B. Jarvis and S. L. Greene, J . Assoc. Off. Anal. Chem. 70, 1 32 (1 987). T. Krishnamurthy and E. W. Sarver, Biomed. Environ. Mass Spectrom. 15,13 (1988). T. Krichnamurthy and E. W. Sarver, Biomed. Environ. Mass Spectrom. 15, 1 85 (1 988). T. Krishnamurthy and E. W. Sarver, Anal. Chem. 59, 1272 (1987). M. L. Vestal, Int. J. Mass Spectrom. Ion Phys. 15, 388 (1982). T. Krishnamurthy, D. J. Beck and R. K. Isensee, J. Chro- matogr., submitted for publication. D. F. Hunt, in Tandem Mass Spectrometry. ed. by F. W. McLafferty, pp. 1051 24. Wiley, New York (1 983).