Galaxy And Mass Assembly (GAMA): stellar mass functions by Hubble type
16
Mon. Not. R. Astron. Soc. 000, 1–14 (2013) Printed 1st August 2014 (MN L A T E X style file v2.2) Galaxy And Mass Assembly (GAMA): Stellar mass functions by Hubble type Lee S. Kelvin, 1,2,3 Simon P. Driver, 2,3 Aaron S. G. Robotham, 3 Edward N. Taylor, 4 Alister W. Graham, 5 Mehmet Alpaslan, 2 Ivan Baldry, 6 Steven P. Bamford, 7 Amanda E. Bauer, 8 Joss Bland-Hawthorn, 9 Michael J. I. Brown, 10 Matthew Colless, 11 Christopher J. Conselice, 7 Benne W. Holwerda, 12 Andrew M. Hopkins, 8 Maritza A. Lara-López, 8 Jochen Liske, 13 Ángel R. López-Sánchez, 8,14 Jon Loveday, 15 Peder Norberg, 16 Steven Phillipps, 17 Cristina C. Popescu, 18 Matthew Prescott, 19 Anne E. Sansom, 18 and Richard J. Tuffs 20 1 Institut für Astro- und Teilchenphysik, Universität Innsbruck, Technikerstraße 25, 6020 Innsbruck, Austria 2 School of Physics and Astronomy, University of St Andrews, North Haugh, St Andrews, Fife, KY16 9SS, UK 3 International Centre for Radio Astronomy Research, 7 Fairway, The University of Western Australia, Crawley, Perth, Western Australia 6009, Australia 4 School of Physics, the University of Melbourne, Parkville, VIC 3010, Australia 5 Centre for Astrophysics and Supercomputing, Swinburne University of Technology, Hawthorn, Victoria 3122, Australia 6 Astrophysics Research Institute, Liverpool John Moores University, Twelve Quays House, Egerton Wharf, Birkenhead CH41 1LD, UK 7 School of Physics and Astronomy, The University of Nottingham, University Park, Nottingham, NG7 2RD, UK 8 Australian Astronomical Observatory, PO Box 915, North Ryde, NSW 1670, Australia 9 Sydney Institute for Astronomy, School of Physics A28, University of Sydney, NSW 2006, Australia 10 School of Physics, Monash University, Clayton, VIC 3800, Australia 11 Research School of Astronomy and Astrophysics, The Australian National University, Canberra, ACT 2611, Australia 12 European Space Agency, ESTEC, Keplerlaan 1, NL-2200 AG Noordwijk, The Netherlands 13 European Southern Observatory, Karl-Schwarzschild-Str. 2, 85748 Garching, Germany 14 Department of Physics and Astronomy, Macquarie University, NSW 2109, Australia 15 Astronomy Centre, University of Sussex, Falmer, Brighton BN1 9QH, UK 16 Institute for Computational Cosmology, Department of Physics, Durham University, South Road, Durham DH1 3LE, UK 17 Astrophysics Group, H.H. Wills Physics Laboratory, University of Bristol, Tyndall Avenue, Bristol BS8 1TL, UK 18 Jeremiah Horrocks Institute, School of Computing, Engineering and Physical Sciences, University of Central Lancashire, Preston PR1 2HE, UK 19 Astrophysics Group, Department of Physics, University of the Western Cape, 7535 Bellville, Cape Town, South Africa 20 Max Planck Institut für Kernphysik, Saupfercheckweg 1, D-69117 Heidelberg, Germany Accepted for publication in MNRAS ABSTRACT We present an estimate of the galaxy stellar mass function and its division by mor- phological type in the local (0.025 <z< 0.06) Universe. Adopting robust morpho- logical classifications as previously presented (Kelvin et al.) for a sample of 3, 727 galaxies taken from the Galaxy And Mass Assembly survey, we define a local volume and stellar mass limited sub-sample of 2, 711 galaxies to a lower stellar mass limit of M = 10 9.0 M . We confirm that the galaxy stellar mass function is well de- scribed by a double Schechter function given by M * = 10 10.64 M , α 1 = -0.43, φ * 1 =4.18 dex -1 Mpc -3 , α 2 = -1.50 and φ * 2 =0.74 dex -1 Mpc -3 . The constituent morphological-type stellar mass functions are well sampled above our lower stellar mass limit, excepting the faint little blue spheroid population of galaxies. We find ap- proximately 71 +3 -4 % of the stellar mass in the local Universe is found within spheroid dominated galaxies; ellipticals and S0-Sas. The remaining 29 +4 -3 % falls predominantly within late type disk dominated systems, Sab-Scds and Sd-Irrs. Adopting reasonable bulge-to-total ratios implies that approximately half the stellar mass today resides in spheroidal structures, and half in disk structures. Within this local sample, we find approximate stellar mass proportions for E : S0-Sa : Sab-Scd : Sd-Irr of 34 : 37 : 24 : 5. Key words: Galaxies – galaxies: elliptical and lenticular, cD – galaxies: spiral – galaxies: luminosity function, mass function – galaxies: fundamental parameters c 2013 RAS arXiv:1407.7555v1 [astro-ph.GA] 28 Jul 2014
Transcript of Galaxy And Mass Assembly (GAMA): stellar mass functions by Hubble type
Mon. Not. R. Astron. Soc. 000, 1–14 (2013) Printed 1st August 2014 (MN LATEX style file v2.2)
Galaxy And Mass Assembly (GAMA): Stellar massfunctions by Hubble type
Lee S. Kelvin,1,2,3 Simon P. Driver,2,3 Aaron S. G. Robotham,3Edward N. Taylor,4 Alister W. Graham,5 Mehmet Alpaslan,2 Ivan Baldry,6Steven P. Bamford,7 Amanda E. Bauer,8 Joss Bland-Hawthorn,9Michael J. I. Brown,10 Matthew Colless,11 Christopher J. Conselice,7Benne W. Holwerda,12 Andrew M. Hopkins,8 Maritza A. Lara-López,8Jochen Liske,13 Ángel R. López-Sánchez,8,14 Jon Loveday,15 Peder Norberg,16
Steven Phillipps,17 Cristina C. Popescu,18 Matthew Prescott,19
Anne E. Sansom,18 and Richard J. Tuffs201Institut für Astro- und Teilchenphysik, Universität Innsbruck, Technikerstraße 25, 6020 Innsbruck, Austria2School of Physics and Astronomy, University of St Andrews, North Haugh, St Andrews, Fife, KY16 9SS, UK3International Centre for Radio Astronomy Research, 7 Fairway, The University of Western Australia, Crawley, Perth, WesternAustralia 6009, Australia4School of Physics, the University of Melbourne, Parkville, VIC 3010, Australia5Centre for Astrophysics and Supercomputing, Swinburne University of Technology, Hawthorn, Victoria 3122, Australia6Astrophysics Research Institute, Liverpool John Moores University, Twelve Quays House, Egerton Wharf, Birkenhead CH41 1LD, UK7School of Physics and Astronomy, The University of Nottingham, University Park, Nottingham, NG7 2RD, UK8Australian Astronomical Observatory, PO Box 915, North Ryde, NSW 1670, Australia9Sydney Institute for Astronomy, School of Physics A28, University of Sydney, NSW 2006, Australia10School of Physics, Monash University, Clayton, VIC 3800, Australia11Research School of Astronomy and Astrophysics, The Australian National University, Canberra, ACT 2611, Australia12European Space Agency, ESTEC, Keplerlaan 1, NL-2200 AG Noordwijk, The Netherlands13European Southern Observatory, Karl-Schwarzschild-Str. 2, 85748 Garching, Germany14Department of Physics and Astronomy, Macquarie University, NSW 2109, Australia15Astronomy Centre, University of Sussex, Falmer, Brighton BN1 9QH, UK16Institute for Computational Cosmology, Department of Physics, Durham University, South Road, Durham DH1 3LE, UK17Astrophysics Group, H.H. Wills Physics Laboratory, University of Bristol, Tyndall Avenue, Bristol BS8 1TL, UK18Jeremiah Horrocks Institute, School of Computing, Engineering and Physical Sciences, University of Central Lancashire, PrestonPR1 2HE, UK19Astrophysics Group, Department of Physics, University of the Western Cape, 7535 Bellville, Cape Town, South Africa20Max Planck Institut für Kernphysik, Saupfercheckweg 1, D-69117 Heidelberg, Germany
Accepted for publication in MNRAS
ABSTRACTWe present an estimate of the galaxy stellar mass function and its division by mor-phological type in the local (0.025 < z < 0.06) Universe. Adopting robust morpho-logical classifications as previously presented (Kelvin et al.) for a sample of 3, 727galaxies taken from the Galaxy And Mass Assembly survey, we define a local volumeand stellar mass limited sub-sample of 2, 711 galaxies to a lower stellar mass limitof M = 109.0M. We confirm that the galaxy stellar mass function is well de-scribed by a double Schechter function given by M∗ = 1010.64M, α1 = −0.43,φ∗
1 = 4.18 dex−1Mpc−3, α2 = −1.50 and φ∗2 = 0.74 dex−1Mpc−3. The constituent
morphological-type stellar mass functions are well sampled above our lower stellarmass limit, excepting the faint little blue spheroid population of galaxies. We find ap-proximately 71+3
−4% of the stellar mass in the local Universe is found within spheroiddominated galaxies; ellipticals and S0-Sas. The remaining 29+4
−3% falls predominantlywithin late type disk dominated systems, Sab-Scds and Sd-Irrs. Adopting reasonablebulge-to-total ratios implies that approximately half the stellar mass today resides inspheroidal structures, and half in disk structures. Within this local sample, we findapproximate stellar mass proportions for E : S0-Sa : Sab-Scd : Sd-Irr of 34 : 37 : 24 :5.Key words: Galaxies – galaxies: elliptical and lenticular, cD – galaxies: spiral –galaxies: luminosity function, mass function – galaxies: fundamental parametersc© 2013 RAS
arX
iv:1
407.
7555
v1 [
astr
o-ph
.GA
] 2
8 Ju
l 201
4
2 L. S. Kelvin et al.
1 INTRODUCTION
Amongst the veritable cornucopia of observed and derivedgalaxy parameters, the total stellar mass of a system is ar-guably one of the most fundamental, perhaps in conjunctionwith the shape of the galaxy light profile as parameterisedby, e.g., the Sérsic (1963) function. One common viewpointhas it that galaxies form via a series of monolithic col-lapse and/or hierarchical merging events, whereafter evol-ution continues to occur via additional merging events andstochastic gas accretion phases (e.g., Navarro & Benz 1991;White & Frenk 1991; Cook et al. 2009; L’Huillier et al. 2012;Khochfar & Silk 2006b; De Lucia & Blaizot 2007; Pichonet al. 2011; Wyse et al. 1997; van Dokkum et al. 2010; Khoch-far & Silk 2006a; Kormendy & Bender 2012; Kereš et al.2005; Cook et al. 2010; Debattista et al. 2006). Each stageduring this galactic ageing process has an observational im-pact upon the instantaneous state of a galaxy, e.g.; colour(Baldry et al. 2004, 2008), star formation rate (Behrooziet al. 2013; Moustakas et al. 2013), in addition to leaving alonger term imprint on the nature of the galaxy, e.g.; metal-licity (De Lucia et al. 2004; Driver et al. 2013; Lara-Lópezet al. 2013), structure (Cooper et al. 2012; Shankar et al.2013; Szomoru et al. 2013; Robotham et al. 2013). In manyways this latter parameter, galaxy structure, promises to bethe most profound, as rearranging the orbital properties ofbillions of stars is not a whimsical thing.
Several well known relations between stellar mass andadditional complementary galaxy parameters are known toexist, including total size (Graham et al. 2006; Patel et al.2013), velocity dispersion (Davies et al. 1983; Davies &Illingworth 1983; Shen et al. 2003; Matković & Guzmán2005), concentration indices and light profile shapes (Caonet al. 1993; Young & Currie 1994; Kauffmann et al. 2003;Blanton et al. 2005; Kelvin et al. 2012), environment (Kauff-mann et al. 2004; Baldry et al. 2006), metallicity (Tremontiet al. 2004), metallicity and star formation rate in a 3-dimensional plane (Lara-López et al. 2010) and colour (Con-selice 2006). This latter study highlights the importance ofstellar mass above other observed parameters, such as starformation rate and merger activity, in describing the max-imal variance across the galaxy population. Numerous re-cent studies explore the division of the local stellar massbudget by, e.g., colour (Baldry et al. 2012; Peng et al. 2012;Taylor et al., 2014, submitted), star formation rate (Pozz-etti et al. 2010), environment (Bolzonella et al. 2010) andcoarse morphology (Bundy et al. 2010). Here we study therelation between stellar mass and morphology, specifically;how the local galaxy stellar mass function (GSMF) is builtfrom different morphological types. A standard cosmologyof (H0, Ωm, ΩΛ)=(70 km s−1 Mpc−1, 0.3, 0.7) is assumedthroughout this paper.
2 DATA
Our data is taken from the Galaxy And Mass Assemblysurvey (GAMA: Driver et al. 2009, 2011) phase 1 (GAMAI). GAMA is a combined spectroscopic and multi-wavelengthimaging survey designed to study spatial structure in thenearby (z < 0.25) Universe on scales of 1 kpc to 1 Mpc. TheGAMA regions lie within areas of sky previously surveyed
by both SDSS (York et al. 2000; Abazajian et al. 2009) aspart of its Main Survey, and UKIRT as part of the UKIDSSLarge Area Survey (UKIDSS-LAS; Lawrence et al. 2007).
Using the latest version (version 16) of the GAMA Itiling catalogue1 (TilingCatv16, see Baldry et al. 2010), weadopt a local, volume and luminosity limited sample of 3, 727galaxy-like (SURVEY_CLASS > 2) objects, GAMAnear,previously defined in Kelvin et al. (2014). In brief, thissample is defined thus:
• a local flow-corrected spectroscopic redshift z of 0.025 <z < 0.06 with an associated GAMA redshift quality flag ofnQ > 2 (i.e., good for science),• a Milky Way dust extinction corrected apparent r band
SDSS (DR7) Petrosian magnitude of r < 19.4 mag,• an absolute Sérsic magnitude truncated at 10 multiples
of the half-light radius in the r-band of Mr < −17.4 mag.
Local flow-corrected spectroscopic redshifts are taken fromthe GAMA I DistancesFramesv07 catalogue (Baldry et al.2012). For this sample, we adopt an upper redshift limitof z = 0.06. This limit is chosen such that the majority ofbulges (the limiting structural component) should remainresolvable2. To calculate this limit, typical bulge half-lightradii for galaxies in the local Universe are estimated basedon prior bulge-disk decompositions presented in Allen et al.2006 (∼ 1.93 kpc) and Simard et al. 2011 (∼ 3.02 kpc, seeKelvin et al. 2014 for a complete discussion). Our upperredshift limit is determined using these data to estimate themaximal redshift out to which a bulge would remain largerthan the average seeing found in SDSS imaging (∼ 1.1′′,see Kelvin et al. 2012). At z = 0.06, 1.1′′ corresponds toa physical size of 1.28 kpc. Therefore, bulge half-light dia-meters are at least three times the median r band seeing atz = 0.06. A lower limit of z = 0.025 is also adopted to avoidlow galaxy number densities below this redshift and suchthat redshifts are not dominated by peculiar velocities. (seeKelvin et al. 2014 for further details). Our redshift limitsgive this sample a volume of 2.1× 10⁵ Mpc3. Matching theGAMAnear sample to the GAMA galaxy group catalogue(G3C; Robotham et al. 2011), we find that just under half(1797, ∼ 48%) of our galaxies lie in identified groups, witha median halo mass ofMH ∼ 1012.9M. Of these galaxies,672 (∼ 18%) lie in groups with a richness greater than 5,with a median halo mass of MH ∼ 1013.5M. Owing tothis, our sample should be considered predominantly fielddominated, extending into the intermediate-mass group re-gime.
Our SDSS DR7 (York et al. 2000; Abazajian et al. 2009)apparent Petrosian magnitude limit of r = 19.4 is chosen tocorrespond to the main GAMA I spectroscopic target se-lection limit (Driver et al. 2009; Baldry et al. 2010), ensur-ing completeness across all three equatorial GAMA regions3.
1 All data release 2 GAMA catalogues are available throughthe GAMA database, available online at http://www.gama-survey.org/dr2/ .2 Assuming of course a sufficiently high B/T ratio which allowsfor the detection of bulge flux above the host disk flux.3 Whilst the central 12h equatorial GAMA field (G12) reaches agreater limiting depth of r = 19.8, we choose not to consider thisextra data here to maintain a consistent depth of r = 19.4 acrossall three primary GAMA fields.
c© 2013 RAS, MNRAS 000, 1–14

GAMA: Stellar mass functions by Hubble type 3
Sérsic magnitudes are robustly derived using the galaxy 2Dlight-profile modelling package SIGMA (Kelvin et al. 2010,2012). Information on their derivation, and a further discus-sion of our choice to truncate these extrapolated light-profilefits to 10 multiples of the half light radius may be found inKelvin et al. (2012). Our absolute Sérsic magnitude r-bandlimit of Mr < −17.4 mag is chosen to avoid the effects ofMalmquist bias out to our upper redshift limit of z = 0.06.A further discussion of this limit can be found in Kelvinet al. (2014).
The GAMAnear dataset is visually morphologicallyclassified in Kelvin et al. (2014) by three independent ob-servers into their appropriate Hubble type, namely; ellipt-ical (E), lenticular/early-type spiral (S0-Sa, barred and un-barred), intermediate/late-type spiral (Sab-Scd, barred andunbarred), disk-dominated spiral or irregular (Sd-Irr), star(see below) and little blue spheroid (LBS). Classificationsare assigned on a majority agreement basis; at least two ofthe three observers must agree on the classification. In theresult of a three-way tie (only occurring for 56 galaxies, or1.5% of the total sample), preference is given to the seniorobserver.
As previously noted in Kelvin et al. (2014), the LBStype galaxy is typically compact, spheroidal and blue, hencetheir designation as ‘Little Blue Spheroids’. The mediancolour of LBS galaxies within our GAMAnear sample isg − i ∼ 0.6 with a median Sérsic index of nr ∼ 1.9 in ther band (nK ∼ 1.6 in the K band) and a median physicalsize of re ∼ 1.1 kpc in the r band (re ∼ 0.9 kpc in theK band). Because of their physical similarities with bothspheroids and disks, it is not immediately apparent whichstructural class these objects should be associated with. Fora further discussion of our LBS class, we refer the reader toKelvin et al. (2014), and we note that a dedicated study iscurrently in progress in order to better understand our LBSpopulation (Moffett et al., in prep.).
We acknowledge the apparent difficulty in visually di-viding galaxies along the elliptical/lenticular interface, ashighlighted in the recent literature, e.g., Bamford et al.(2009); Emsellem et al. (2011); Cappellari et al. (2011a,2013). A face on lenticular galaxy may appear, even tothe expert classifier, as a smooth 1-component system, andtherefore be mis-classified as an elliptical galaxy. As a con-sequence of this, the S0-Sa class will suffer from a shortfallin the correct number of S0 type galaxies. Nevertheless, inkeeping with the classification methodology of our originalstudy (Kelvin et al. 2014), here we opt to maintain this di-vision between elliptical and lenticular type galaxies.
The latter ‘star’ type refers to incorrectly targeted fore-ground stars in front of a background galaxy (to which theassociated redshift belongs) or segments of a large diffusegalaxy, and therefore this population shall be discarded fromsubsequent morphological analyses. Owing to low numberstatistics for our barred systems, the barred populationshave been merged into their sibling unbarred classes. Anysubsequent discussion of the barred populations alone areprovided for completeness sake, in keeping with the classi-fication criteria established in Kelvin et al. (2014), but thisinformation is not used for scientific analyses. For furtherdetails on our morphological dataset and base sample selec-tion criteria, see Kelvin et al. (2014).
2.1 Stellar Masses
Stellar masses used in this study are taken from version 8of the GAMA I stellar mass catalogue (StellarMassesv08 ;Taylor et al. 2011). In summary, a series of Bruzual & Char-lot (2003) composite stellar population spectral models arecreated, adopting a Chabrier (2003) Initial Mass Functionand using a Calzetti et al. (2000) dust attenuation law. Astellar population library is constructed under the assump-tions of a single metallicity and a continuous exponentiallydeclining star formation history for each stellar population.Dust is modelled as a single uniform screen. These spec-tra are subsequently rescaled by some normalisation factorin order that the synthetic spectral flux matches that asdefined by a series of Kron-like (AUTO) apertures as de-tailed in Hill et al. (2011). The value of the normalisationfactor determines the AUTO aperture defined stellar massfor that particular system,M∗,AUTO.
We apply a secondary Sérsic flux correction to theAUTO defined stellar masses as recommended in Tayloret al. (2011). As shown in Graham & Driver (2005), bothPetrosian and Kron-like photometry have the potential tomiss flux in the wings of large, extended systems (particu-larly those with high Sérsic indices). Sérsic photometry isideally suited to correct for this effect, and so we chooseto apply it to these data. Our final stellar mass estimates,log(M∗M
), are given using the equation
log(M∗M
)= log
(M∗,AUTO
M
)+ log
(LSersic
LAUTO
)(1)
where LAUTO and LSersic are the (linear) r-band AUTOaperture flux and the total r-band flux inferred from fit-ting a Sérsic profile truncated at 10 multiples of the half-light radius (as given in Kelvin et al. 2012), respectively.The scale factor LSersic/LAUTO describes the additional fluxgiven by our single Sérsic model fits relative to the stand-ard GAMA AUTO photometry. For each morphologicaltype we find the following median Sérsic–AUTO flux scalefactors; LBS=1.01, E=1.03, S0-Sa=1.05, Sab-Scd=1.01, Sd-Irr=1.00. Note that our resultant stellar mass estimates referto the stellar mass implied via the visible flux from the liv-ing stellar population within a galaxy, and not the totalliving plus faint/dark remnant (i.e., white dwarf, neutronstar, black hole, etc.) populations (Shimizu & Inoue 2013).
As expanded upon in Baldry et al. (2012), theGAMAnear sample will suffer from surface brightness limit-ations at the faint/low-mass end of our sample owing to pho-tometric incompleteness. Figure 11 of Baldry et al. (2012)shows the relation between surface brightness and stellarmass for a subset of the GAMA dataset across a similarredshift range. Clearly, the impact of surface brightness in-completeness becomes increasingly severe in the mass rangelog (M∗/M) = 8.0 − 9.0. To mitigate the effects of in-completeness, we adopt the extreme of this range and thatrecommended in Baldry et al. (2012), log (M∗/M) = 9.0,as an additional stellar mass limit to our sample. This re-duces our GAMAnear sample from 3, 727 galaxies to 2, 711(73% of the GAMAnear dataset).
The well-established relation between colour and mass-to-light ratio (e.g., Figure 12, Taylor et al. 2011) implies thatgalaxies with a higher mass-to-light ratio tend towards be-
c© 2013 RAS, MNRAS 000, 1–14
4 L. S. Kelvin et al.
ing redder in colour. Therefore, for a given luminosity, reddergalaxies appear more massive than their bluer counterparts.Consequently, for galaxies in our volume and r band mag-nitude limited GAMAnear sample, at a given stellar mass,one is able to see bluer galaxies out to a higher redshift thanred systems (e.g., Figure A1, van den Bosch et al. 2008).Alternatively, at a given redshift, the stellar mass complete-ness limit is higher for red galaxies than for blue. In orderto fully account for any potential incompleteness bias withinour remaining mass-limited sample of 2, 711 galaxies, we alsoopt to weight each galaxy above our mass limit accordingto W = Vtot/Vmax (Schmidt 1968); the ratio of the totalobserved volume (2.1× 10⁵ Mpc3) to the maximum comov-ing volume over which the galaxy could have been observedwithin the survey limits. The corresponding zmax is the max-imum redshift at which a galaxy can be seen based on itsspectral shape and survey limits (r = 19.4 mag). We adoptzmax values as presented in Taylor et al. (2011) and avail-able in the GAMA StellarMassesv08 catalogue in order tocalculate Vmax estimates. Weights in the range W < 1, i.e.,Vtot < Vmax, are set equal to 1. All stellar masses presen-ted hereafter should be assumed to have this Vmax weightcorrection applied, unless otherwise stated.
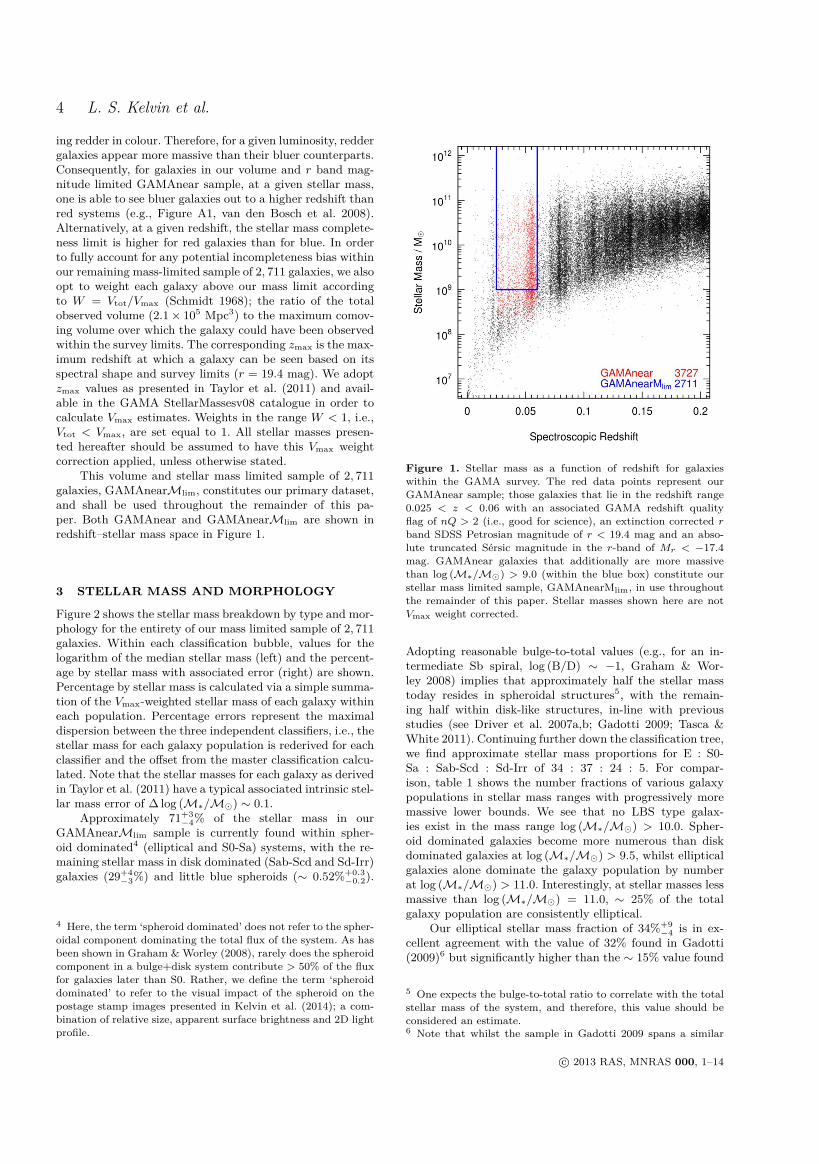
This volume and stellar mass limited sample of 2, 711galaxies, GAMAnearMlim, constitutes our primary dataset,and shall be used throughout the remainder of this pa-per. Both GAMAnear and GAMAnearMlim are shown inredshift–stellar mass space in Figure 1.
3 STELLAR MASS AND MORPHOLOGY
Figure 2 shows the stellar mass breakdown by type and mor-phology for the entirety of our mass limited sample of 2, 711galaxies. Within each classification bubble, values for thelogarithm of the median stellar mass (left) and the percent-age by stellar mass with associated error (right) are shown.Percentage by stellar mass is calculated via a simple summa-tion of the Vmax-weighted stellar mass of each galaxy withineach population. Percentage errors represent the maximaldispersion between the three independent classifiers, i.e., thestellar mass for each galaxy population is rederived for eachclassifier and the offset from the master classification calcu-lated. Note that the stellar masses for each galaxy as derivedin Taylor et al. (2011) have a typical associated intrinsic stel-lar mass error of ∆ log (M∗/M) ∼ 0.1.
Approximately 71+3−4% of the stellar mass in our
GAMAnearMlim sample is currently found within spher-oid dominated4 (elliptical and S0-Sa) systems, with the re-maining stellar mass in disk dominated (Sab-Scd and Sd-Irr)galaxies (29+4
−3%) and little blue spheroids (∼ 0.52%+0.3−0.2).
4 Here, the term ‘spheroid dominated’ does not refer to the spher-oidal component dominating the total flux of the system. As hasbeen shown in Graham & Worley (2008), rarely does the spheroidcomponent in a bulge+disk system contribute > 50% of the fluxfor galaxies later than S0. Rather, we define the term ‘spheroiddominated’ to refer to the visual impact of the spheroid on thepostage stamp images presented in Kelvin et al. (2014); a com-bination of relative size, apparent surface brightness and 2D lightprofile.
Figure 1. Stellar mass as a function of redshift for galaxieswithin the GAMA survey. The red data points represent ourGAMAnear sample; those galaxies that lie in the redshift range0.025 < z < 0.06 with an associated GAMA redshift qualityflag of nQ > 2 (i.e., good for science), an extinction corrected rband SDSS Petrosian magnitude of r < 19.4 mag and an abso-lute truncated Sérsic magnitude in the r-band of Mr < −17.4mag. GAMAnear galaxies that additionally are more massivethan log (M∗/M) > 9.0 (within the blue box) constitute ourstellar mass limited sample, GAMAnearMlim, in use throughoutthe remainder of this paper. Stellar masses shown here are notVmax weight corrected.
Adopting reasonable bulge-to-total values (e.g., for an in-termediate Sb spiral, log (B/D) ∼ −1, Graham & Wor-ley 2008) implies that approximately half the stellar masstoday resides in spheroidal structures5, with the remain-ing half within disk-like structures, in-line with previousstudies (see Driver et al. 2007a,b; Gadotti 2009; Tasca &White 2011). Continuing further down the classification tree,we find approximate stellar mass proportions for E : S0-Sa : Sab-Scd : Sd-Irr of 34 : 37 : 24 : 5. For compar-ison, table 1 shows the number fractions of various galaxypopulations in stellar mass ranges with progressively moremassive lower bounds. We see that no LBS type galax-ies exist in the mass range log (M∗/M) > 10.0. Spher-oid dominated galaxies become more numerous than diskdominated galaxies at log (M∗/M) > 9.5, whilst ellipticalgalaxies alone dominate the galaxy population by numberat log (M∗/M) > 11.0. Interestingly, at stellar masses lessmassive than log (M∗/M) = 11.0, ∼ 25% of the totalgalaxy population are consistently elliptical.
Our elliptical stellar mass fraction of 34%+9−4 is in ex-
cellent agreement with the value of 32% found in Gadotti(2009)6 but significantly higher than the ∼ 15% value found
5 One expects the bulge-to-total ratio to correlate with the totalstellar mass of the system, and therefore, this value should beconsidered an estimate.6 Note that whilst the sample in Gadotti 2009 spans a similar
c© 2013 RAS, MNRAS 000, 1–14

GAMA: Stellar mass functions by Hubble type 5
Figure 2. The breakdown of stellar mass within our GAMAnearMlim sample by morphological type. Within each classification bubble,values for the logarithm of the median stellar mass (left) and the percentage of total stellar mass with its associated error (right) areshown. Stellar masses shown here have been Vmax weight corrected.
Population Stellar Mass Range [log (M∗/M)]
> 9 > 9.5 > 10 > 10.5 > 11 > 11.5
LBS 0.04 0.01 0.00 0.00 0.00 0.00
E 0.19 0.24 0.24 0.31 0.72 1.00
S0-Sa 0.18 0.28 0.42 0.48 0.22 0.00
Sab-Scd 0.28 0.36 0.32 0.20 0.06 0.00
Sd-Irr 0.31 0.11 0.02 0.00 0.00 0.00
Sph Dom 0.37 0.51 0.66 0.80 0.94 1.00
Disk Dom 0.59 0.47 0.34 0.20 0.06 0.00
Table 1. The number fractions of various galaxy populations forstellar mass ranges with progressively more massive lower bounds,as indicated. Barred populations have been merged into their sib-ling unbarred classes. Stellar masses shown here have been Vmaxweight corrected.
in Driver et al. (2007a). This presumably reflects the greatdifficulty in distinguishing between genuine pressure suppor-ted ellipticals and rotationally supported face-on lenticulars,as highlighted by the ATLAS3D team, see for example
redshift range, their lower stellar mass limit is 1 dex higher, 1010
M, than that adopted here.
Emsellem et al. (2011); Krajnović et al. (2011); Cappellariet al. (2011b); Duc et al. (2011); Khochfar et al. (2011), alsoD’Onofrio et al. (1995); Graham et al. (1998). If the Driveret al. study is correct then the potential contamination ofour elliptical class by lenticular types may be significant. Akey difference in our classifications and that of Driver et al.is the method of selection, with the former using eyeballmorphology based on SDSS/UKIDSS data and the latterusing GIM2D bulge-disc decompositions based on the sig-nificantly deeper Millennium Galaxy Catalogue B band data(see Liske et al. 2003; Driver et al. 2005). The Gadotti (2009)elliptical class is based on a Petrosian concentration indexcut. In Driver et al. (2006) it was reported than the E/S0(red spheroid) class contains (35± 2)% of the stellar mass,which is closer to our elliptical value, and perhaps support-ing the notion that our visually classified E class potentiallycontains a large fraction of lenticular contaminants. We willexplore this issue in detail using robust structural decompos-itions (Kelvin et al., in prep.) based on the GALFIT galaxyfitting software (Peng et al. 2002, 2010a) and via ongoingSAMI and CALIFA integral field unit observations (in pro-gress). At present we advocate a small amount of caution inregards to the level of potential lenticular contamination ofour elliptical sample.
c© 2013 RAS, MNRAS 000, 1–14
6 L. S. Kelvin et al.
4 THE STELLAR MASS FUNCTION
4.1 The Galaxy Stellar Mass Function
One of the most fundamental measurements in astronomyis that of the galaxy luminosity function, or its equivalentin mass, the galaxy stellar mass function (hereafter GSMF).The GSMF gives the effective number of galaxies per unitvolume in the logarithmic stellar mass interval logM tologM + d logM, where d logM is some log base 10 massinterval. Adopting the GAMA stellar masses presented inTaylor et al. (2011), we calculate our GSMF (and also ourMSMFs below) via a direct summation of stellar mass inbins of 0.1 dex.
The GSMF may be described using a Schechter (1976)function whereby the number density, Φ (logM) d logM, isgiven by
Φ (logM) d logM = ln(10) · φ∗10log(M/M∗)(α+1)
× exp(−10log(M/M∗)
)d logM(2)
where M∗ is the characteristic mass corresponding to theposition of the distinctive ‘knee’ in the mass function. Theterms α and φ∗ refer to the slope of the mass function atthe low mass end and the normalisation constant, respect-ively. Several recent studies have previously measured theGSMF (e.g.; Baldry et al. 2008; Peng et al. 2010b; Baldryet al. 2012), and advocate the double Schechter form of theGSMF with a combined knee (M∗) for the global popu-lation. The double Schechter function is simply given byΦdouble (logM) d logM = Φ1 + Φ2, where Φ1 and Φ2 referto Equation 2 above, albeit with separate slope paramet-ers, α1 and α2, and unique normalisation values, φ∗1 and φ∗2.Both Φ1 and Φ2 share a commonM∗ parameter. The doubleSchechter function allows one to more accurately model thedistinctive bump observed in the GSMF about M∗, withone Schechter function dominant at stellar masses greaterthanM∗, and the second dominant otherwise. We adopt thistechnique, opting to fit the GSMF with a double Schechtermodel7, however, we maintain a single Schechter model forthe morphological-type stellar mass functions (MSMFs here-after) that constitute it.
4.2 Morphological-Type Stellar Mass Functions
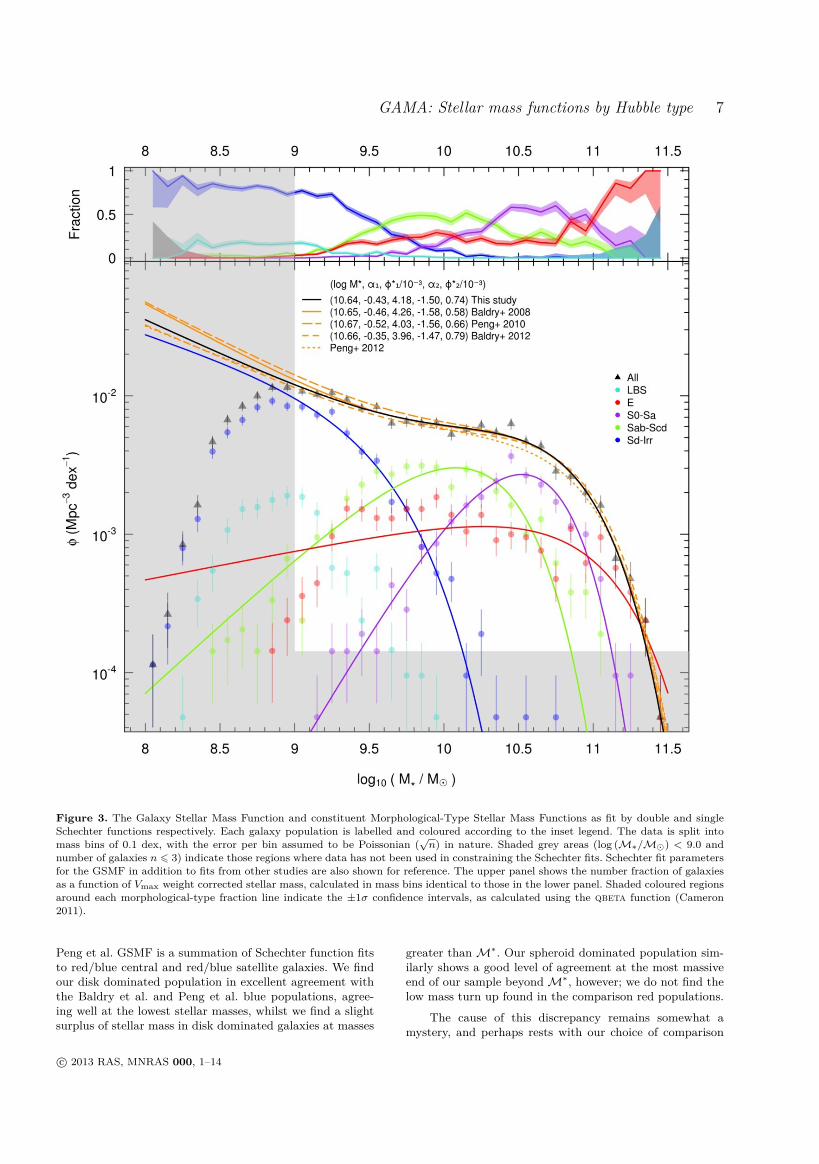
Figure 3 shows our GSMF and constituent MSMFs for ourvolume and stellar mass limited GAMAnearMlim sample of2, 711 systems. Stellar masses shown here have been Vmaxweight corrected where appropriate. The solid black line in-dicates a double Schechter fit to the total GSMF, binnedinto mass bins of 0.1 dex, whilst the various orange linesshow similar GSMF double Schechter fits found in recentstudies (Baldry et al. 2008; Peng et al. 2010b; Baldry et al.2012; Peng et al. 2012). Note that we choose not to match to
7 All Schechter functions are fit using the nlminb routine in R;a quasi-Newton algorithm based on the PORT routines that op-timise fitting in a similar sense to the Limited-memory Broyden-Fletcher-Goldfarb-Shanno algorithm (LM-BFGS), with an exten-sion to handle simple box constraints on input variables (L-BFGS-B). The PORT documentation is available at http://netlib.bell-labs.com/cm/cs/cstr/153.pdf
additional complementary studies, such as that of Taylor etal. (2014, submitted) which divides their sample into stat-istically defined ‘R’ and ‘B’ populations, or the older yetstill equally valid studies of Bell et al. (2003) and Baldryet al. (2004). This is for the sake of clarity alone, to avoidconfusion within our Figure 3. Solid coloured lines indicatesingle Schechter fits to the constituent MSMFs, where colourrelates to morphology as indicated by the inset legend. Notethat no Schechter fit to the LBS population is shown, asthere was not sufficient data to constrain a Schechter func-tion at this low mass end of the dataset. Shaded grey areas(log (M∗/M) < 9.0 and number of galaxies n 6 3) indic-ate those regions where data has not been used in constrain-ing the Schechter fits. Data points below our lower mass limitare from the parent GAMAnear sample, and are shown onlyfor reference. Also consider that the GAMA dataset exhibitsa high level of spectroscopic completeness (> 98%) down toits stated limiting apparent magnitude depth of r = 19.4mag (Driver et al. 2011), which precludes the possibilityof severely impacting our measured stellar mass functions.The upper panel of Figure 3 shows the number fractionof galaxies as a function of Vmax weight corrected stellarmass, calculated in mass bins identical to those in the lowerpanel. Shaded coloured regions around each morphological-type fraction line within the upper panel indicate the ±1σconfidence intervals, as calculated using the qbeta function(Cameron 2011).
We find our global GSMF in excellent agreement withthe complementary studies shown in Figure 3, exhibiting acomparableM∗ Schechter fit parameter at log (M∗/M) =10.64 ± 0.07, and agreeing well within the errors. The highmass end of our sample predominantly consists of spheroiddominated elliptical and S0-Sa type galaxies. At interme-diate masses below the global M∗ value, the disk domin-ated Sab-Scd population dominates the stellar mass budget,whilst at the low mass end of our dataset the Sd-Irr andLBS populations are the most influential. It is apparent thatthe latter LBS population is poorly sampled in this mass re-gime, with theM∗ parameter likely residing below our lowerstellar mass limit of log (M∗/M) = 9.0. For this reason,we do not provide Schechter function fit parameters to theLBS population in this study. We remind the reader thatthis sample should be considered a field dominated sample,rather than a cluster environment, as is evidenced by thedominance of Sd-Irr and LBS type systems at the low massend of our dataset.
Because of the uncertainty in our elliptical/S0-Sa di-vision, and in an attempt to group galaxies into structur-ally meaningful parent samples, we now also combine ourmorphological types into two populations in Figure 4 as in-dicated, namely: spheroid dominated (E, S0-Sa) and diskdominated (Sab-Scd, Sd-Irr) galaxies, and similarly fit thesedata with a single Schechter function. our recovered M∗Schechter fit parameters for our combined stellar mass func-tions are remarkably similar to one another and to our totalGSMF, with log (M∗/M) = 10.60 and 10.70, respectively,supporting the notion that the combined total galaxy stellarmass function is well described by a double Schechter func-tion comprised of two distinct components identified mor-phologically here. Comparison Schechter function fits for asimilar red and blue population from Baldry et al. (2012)and Peng et al. (2012) are also shown in Figure 4. The
c© 2013 RAS, MNRAS 000, 1–14
GAMA: Stellar mass functions by Hubble type 7
Figure 3. The Galaxy Stellar Mass Function and constituent Morphological-Type Stellar Mass Functions as fit by double and singleSchechter functions respectively. Each galaxy population is labelled and coloured according to the inset legend. The data is split intomass bins of 0.1 dex, with the error per bin assumed to be Poissonian (
√n) in nature. Shaded grey areas (log (M∗/M) < 9.0 and
number of galaxies n 6 3) indicate those regions where data has not been used in constraining the Schechter fits. Schechter fit parametersfor the GSMF in addition to fits from other studies are also shown for reference. The upper panel shows the number fraction of galaxiesas a function of Vmax weight corrected stellar mass, calculated in mass bins identical to those in the lower panel. Shaded coloured regionsaround each morphological-type fraction line indicate the ±1σ confidence intervals, as calculated using the qbeta function (Cameron2011).
Peng et al. GSMF is a summation of Schechter function fitsto red/blue central and red/blue satellite galaxies. We findour disk dominated population in excellent agreement withthe Baldry et al. and Peng et al. blue populations, agree-ing well at the lowest stellar masses, whilst we find a slightsurplus of stellar mass in disk dominated galaxies at masses
greater thanM∗. Our spheroid dominated population sim-ilarly shows a good level of agreement at the most massiveend of our sample beyondM∗, however; we do not find thelow mass turn up found in the comparison red populations.
The cause of this discrepancy remains somewhat amystery, and perhaps rests with our choice of comparison
c© 2013 RAS, MNRAS 000, 1–14

8 L. S. Kelvin et al.
Figure 4. As Figure 3, but for a reduced grouping of morphological types, as indicated, which may broadly be compared to early typeand late type galaxies. Comparison Schechter function fits for similar red and blue populations from Baldry et al. (2012) and Peng et al.(2012) are also shown.
samples. For example, Yang et al. (2009) find no low-massturn up for their red population across a stellar mass regimecomparable to that probed here, disagreeing with the stud-ies above, and highlighting apparent difficulties when divid-ing the galaxy population by colour alone. Similarly, whilstMuzzin et al. (2013) and Tomczak et al. (2014) do find a low-mass turn up in the stellar mass function of quiescent galax-ies when dividing the galaxy population into quiescent/star-forming sub-populations, Omand et al. (2014) find no notice-able low-mass turn up for their equivalent quiescent sample.
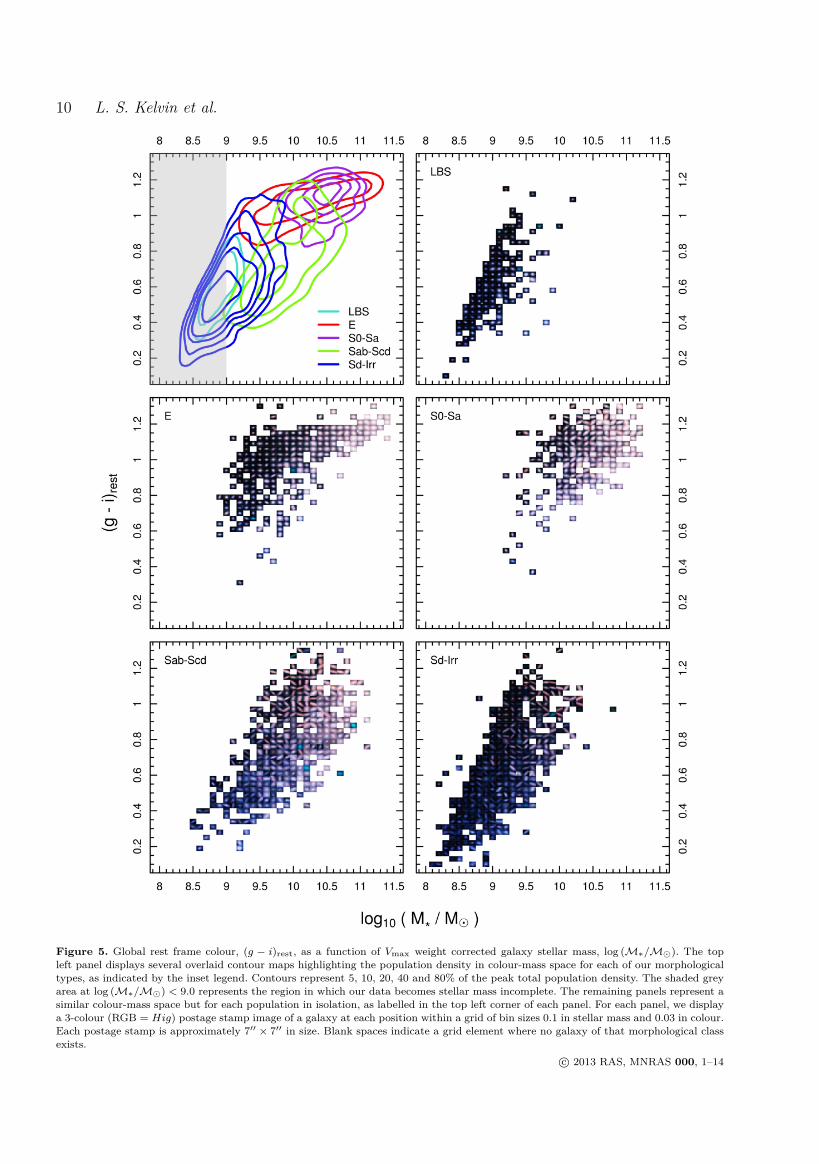
To expand on the relation between colour and stellar mass,Figure 5 shows global rest frame colour, (g − i)rest, as afunction of galaxy stellar mass, log (M∗/M). Our rest-frame colours are those derived concurrently with the stel-lar masses from Taylor et al. (2011), i.e., an SED fit to theGAMA galaxy photometry. The top left panel displays sev-eral overlaid contour maps highlighting the population dens-ity in colour-mass space for all of our morphological types, asindicated by the inset legend, whereas the remaining pan-els represent the same colour-mass space for each popula-
c© 2013 RAS, MNRAS 000, 1–14
GAMA: Stellar mass functions by Hubble type 9
tion in isolation, as labelled in the top left corner of eachpanel. For these latter panels, we display a 3-colour (RGB= Hig)8 postage stamp image of a galaxy at each posi-tion within a grid of bin size 0.1 in stellar mass and 0.03in colour, where a blank space indicates no galaxy of thatmorphological type exists. In total in this figure, we dis-play 1, 245 galaxies from our GAMAnear sample (32.5%),with each postage stamp approximately 7′′ × 7′′ in size. Wefind the spheroid dominated elliptical and lenticular/earlytype red sequence extending across a wide range of stel-lar masses, 9.5 < log (M∗/M) < 11.5 with a relativelysmall variation in global (g − i)rest colour across this range.As can also be seen in Figure 3, the elliptical populationrarely dominates the stellar mass budget in this range forany given stellar mass, except at the most massive extremeof our sample (log (M∗/M) ∼ 11). At stellar masses be-low log (M∗/M) ≈ 10.2, first the disk dominated Sab-Scdpopulation followed by the Sd-Irr population provide a signi-ficant contamination fraction to the red sequence. This con-tamination ‘break-point’ is in good agreement with that re-ported in Taylor et al. (2014, submitted), whereby the meancolour of a statistically defined red population of galaxiesjumps by ≈ 0.2 mag, coupled with an increase in scatter, atlog (M∗/M) ≈ 10.1.
One possible explanation behind this red sequence con-tamination becomes apparent in the postage stamps for theSab-Scd and Sd-Irr population panels. In the colour regime(g − i)rest > 0.7, a significant fraction of disk dominatedgalaxies are observed highly inclined or edge on. The re-processing of galactic light as it travels through a disk hasthe effect of reddening the resultant light due to the effectsof intrinsic dust attenuation, so therefore any photometricestimate of the global colour will be biased redwards, inaddition to affecting other measured photometric proper-ties (e.g.; Pastrav et al. 2013). This late type morphologicalcontamination of the red sequence, effectively a redistribu-tion of stellar mass from the blue to the red population,may perhaps be responsible for the observed turn up of thered population stellar mass functions at the low mass endreported in, e.g., Baldry et al. (2012); Peng et al. (2012).Further, we posit that any such division of the local galaxypopulation by (uncorrected) colour into a red sequence andblue cloud, such as that adopted by, e.g., Bell et al. 2003;Baldry et al. 2004 (a division in colour-magnitude space) andPeng et al. 2010b (a division in colour-stellar mass space),becomes increasingly meaningless at stellar masses belowlog (M∗/M) ≈ 10.2.
We stress however that colour is no more equivalentto spheroid/disk-dominated than it is to quiescent/star-forming, slow/fast rotator, early-type/late-type or metalrich/poor, to name but a few common bimodal galaxy iden-tities. Whilst significant overlaps may, and do, exist betweenthese populations, they do in fact measure distinct galaxypopulations, and therefore one may not always expect to re-cover a similar trend in, for example, the observed stellarmass function. Also consider that our choice to construct a
8 Postage stamps of a peculiar turquoise colour indicate galax-ies that lie in a region where no near-infrared (UKIDSS-LAS)data was available at the time of postage stamp creation, hencea missing red channel in the creation of our 3-colour images.
spheroid-dominated sample from elliptical and S0-Sa galax-ies alone undoubtedly influences our recovered stellar massfunctions. We note that, should we choose to include theLBS population into the spheroid-dominated population, wesimilarly recover a low-mass turn up such as that observedin Baldry et al. (2012) and Peng et al. (2012). However,since LBS galaxies are notably blue, one might expect anydivision by colour to bin LBS galaxies with our typicallyblue disk-dominated systems, increasing the number dens-ity for the disk-dominated population alone, and thereforenot providing the required turn-up for spheroid-dominatedsystems in the low mass regime. See Appendix A for a fur-ther discussion of the inclusion of the LBS population intoour spheroid dominated class.
Full Schechter fit parameters for both the double GSMFand constituent MSMFs (both Hubble type morphologiesand combined spheroid/disk dominated populations) areshown in Tables 2 and 3 respectively. As previously noted,we do not provide Schechter fit parameters for the LBS pop-ulation. Errors on the ρΣ parameter are propagated throughfrom the stellar mass errors estimated in Taylor et al. (2011),typically of the order ∼ 0.1 dex. The second set of errorsfor the logM∗, α and φ∗ parameters represent one stand-ard deviation as derived from comparable Schechter func-tion fits to each individual observers data set alone, giv-ing an indication of classification agreement between allthree observers. All other errors provided in both tablesare estimated from jackknifed resampling using the relationσ2 = N−1
N
∑N
i=1 (xj − x)2, where x is the best fit parameter,xj is the best fit parameter as given from a jackknife res-ampled variant of the data set and N represents the numberof jackknife volumes (we adopt N = 10).
The double Schechter GSMF provides a good fit to thebimodal form of the total population, with a goodness offit parameter of χ2/ν = 1.12 (a χ2 p-value of p = 0.33,with χ2 = 21.2 and k = 19 degrees of freedom; i.e., wehave insufficient evidence to reject our fitted model). As canbe inferred from Figure 3 and the gradient of the ellipticalpopulation in Table 3, the initial high-mass peak primar-ily consists of S0-Sa galaxies, with some small contributionfrom elliptical galaxies. Ellipticals appear to exist uniformlyacross a wide range of masses. Our fitted Schechter func-tion to the elliptical population appears to be a relativelypoor fit to the data, as evidenced by the goodness of fitparameter and confidence intervals quoted in Table 3, ableto capture the high mass turnover about M∗ but partiallyunderestimating the number counts at lower stellar masses.No doubt this discrepancy is caused by the inflexibility ofthe Schechter function in fitting a population that is uni-formly distributed in number density such as this. Similarly,the goodness of fit parameter for the Sab-Scd populationis quite poor. From Figure 3 we see that this discrepancyoccurs at the high mass end, above M∗, with an unexpec-ted surplus of galaxies and a departure from the Schechterfit at log (M∗/M) ∼ 11. This could be evidence of per-haps spheroid dominated (elliptical, lenticular or early-typespiral) contamination of the Sab-Scd population in this re-gime. In addition, errors arising from observer disagreementplace a significant level of uncertainty on Schechter fit para-meters to our Sd-Irr population. This implies that perhapsthese data are not of a sufficient depth to fully measure thecharacteristic turn-over in the Sd-Irr stellar mass function.
c© 2013 RAS, MNRAS 000, 1–14
10 L. S. Kelvin et al.
Figure 5. Global rest frame colour, (g − i)rest, as a function of Vmax weight corrected galaxy stellar mass, log (M∗/M). The topleft panel displays several overlaid contour maps highlighting the population density in colour-mass space for each of our morphologicaltypes, as indicated by the inset legend. Contours represent 5, 10, 20, 40 and 80% of the peak total population density. The shaded greyarea at log (M∗/M) < 9.0 represents the region in which our data becomes stellar mass incomplete. The remaining panels represent asimilar colour-mass space but for each population in isolation, as labelled in the top left corner of each panel. For each panel, we displaya 3-colour (RGB = Hig) postage stamp image of a galaxy at each position within a grid of bin sizes 0.1 in stellar mass and 0.03 in colour.Each postage stamp is approximately 7′′ × 7′′ in size. Blank spaces indicate a grid element where no galaxy of that morphological classexists.
c© 2013 RAS, MNRAS 000, 1–14
GAMA: Stellar mass functions by Hubble type 11
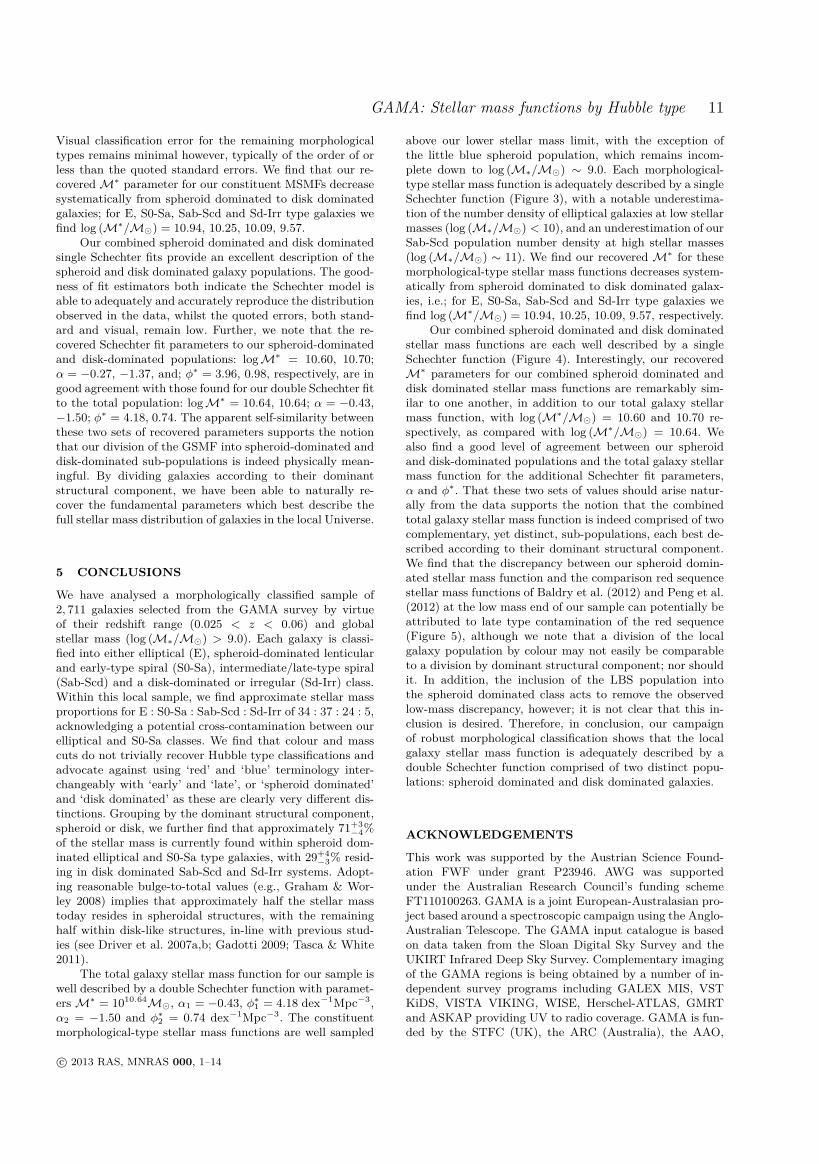
Visual classification error for the remaining morphologicaltypes remains minimal however, typically of the order of orless than the quoted standard errors. We find that our re-coveredM∗ parameter for our constituent MSMFs decreasesystematically from spheroid dominated to disk dominatedgalaxies; for E, S0-Sa, Sab-Scd and Sd-Irr type galaxies wefind log (M∗/M) = 10.94, 10.25, 10.09, 9.57.
Our combined spheroid dominated and disk dominatedsingle Schechter fits provide an excellent description of thespheroid and disk dominated galaxy populations. The good-ness of fit estimators both indicate the Schechter model isable to adequately and accurately reproduce the distributionobserved in the data, whilst the quoted errors, both stand-ard and visual, remain low. Further, we note that the re-covered Schechter fit parameters to our spheroid-dominatedand disk-dominated populations: logM∗ = 10.60, 10.70;α = −0.27, −1.37, and; φ∗ = 3.96, 0.98, respectively, are ingood agreement with those found for our double Schechter fitto the total population: logM∗ = 10.64, 10.64; α = −0.43,−1.50; φ∗ = 4.18, 0.74. The apparent self-similarity betweenthese two sets of recovered parameters supports the notionthat our division of the GSMF into spheroid-dominated anddisk-dominated sub-populations is indeed physically mean-ingful. By dividing galaxies according to their dominantstructural component, we have been able to naturally re-cover the fundamental parameters which best describe thefull stellar mass distribution of galaxies in the local Universe.
5 CONCLUSIONS
We have analysed a morphologically classified sample of2, 711 galaxies selected from the GAMA survey by virtueof their redshift range (0.025 < z < 0.06) and globalstellar mass (log (M∗/M) > 9.0). Each galaxy is classi-fied into either elliptical (E), spheroid-dominated lenticularand early-type spiral (S0-Sa), intermediate/late-type spiral(Sab-Scd) and a disk-dominated or irregular (Sd-Irr) class.Within this local sample, we find approximate stellar massproportions for E : S0-Sa : Sab-Scd : Sd-Irr of 34 : 37 : 24 : 5,acknowledging a potential cross-contamination between ourelliptical and S0-Sa classes. We find that colour and masscuts do not trivially recover Hubble type classifications andadvocate against using ‘red’ and ‘blue’ terminology inter-changeably with ‘early’ and ‘late’, or ‘spheroid dominated’and ‘disk dominated’ as these are clearly very different dis-tinctions. Grouping by the dominant structural component,spheroid or disk, we further find that approximately 71+3
−4%of the stellar mass is currently found within spheroid dom-inated elliptical and S0-Sa type galaxies, with 29+4
−3% resid-ing in disk dominated Sab-Scd and Sd-Irr systems. Adopt-ing reasonable bulge-to-total values (e.g., Graham & Wor-ley 2008) implies that approximately half the stellar masstoday resides in spheroidal structures, with the remaininghalf within disk-like structures, in-line with previous stud-ies (see Driver et al. 2007a,b; Gadotti 2009; Tasca & White2011).
The total galaxy stellar mass function for our sample iswell described by a double Schechter function with paramet-ersM∗ = 1010.64M, α1 = −0.43, φ∗1 = 4.18 dex−1Mpc−3,α2 = −1.50 and φ∗2 = 0.74 dex−1Mpc−3. The constituentmorphological-type stellar mass functions are well sampled
above our lower stellar mass limit, with the exception ofthe little blue spheroid population, which remains incom-plete down to log (M∗/M) ∼ 9.0. Each morphological-type stellar mass function is adequately described by a singleSchechter function (Figure 3), with a notable underestima-tion of the number density of elliptical galaxies at low stellarmasses (log (M∗/M) < 10), and an underestimation of ourSab-Scd population number density at high stellar masses(log (M∗/M) ∼ 11). We find our recovered M∗ for thesemorphological-type stellar mass functions decreases system-atically from spheroid dominated to disk dominated galax-ies, i.e.; for E, S0-Sa, Sab-Scd and Sd-Irr type galaxies wefind log (M∗/M) = 10.94, 10.25, 10.09, 9.57, respectively.
Our combined spheroid dominated and disk dominatedstellar mass functions are each well described by a singleSchechter function (Figure 4). Interestingly, our recoveredM∗ parameters for our combined spheroid dominated anddisk dominated stellar mass functions are remarkably sim-ilar to one another, in addition to our total galaxy stellarmass function, with log (M∗/M) = 10.60 and 10.70 re-spectively, as compared with log (M∗/M) = 10.64. Wealso find a good level of agreement between our spheroidand disk-dominated populations and the total galaxy stellarmass function for the additional Schechter fit parameters,α and φ∗. That these two sets of values should arise natur-ally from the data supports the notion that the combinedtotal galaxy stellar mass function is indeed comprised of twocomplementary, yet distinct, sub-populations, each best de-scribed according to their dominant structural component.We find that the discrepancy between our spheroid domin-ated stellar mass function and the comparison red sequencestellar mass functions of Baldry et al. (2012) and Peng et al.(2012) at the low mass end of our sample can potentially beattributed to late type contamination of the red sequence(Figure 5), although we note that a division of the localgalaxy population by colour may not easily be comparableto a division by dominant structural component; nor shouldit. In addition, the inclusion of the LBS population intothe spheroid dominated class acts to remove the observedlow-mass discrepancy, however; it is not clear that this in-clusion is desired. Therefore, in conclusion, our campaignof robust morphological classification shows that the localgalaxy stellar mass function is adequately described by adouble Schechter function comprised of two distinct popu-lations: spheroid dominated and disk dominated galaxies.
ACKNOWLEDGEMENTS
This work was supported by the Austrian Science Found-ation FWF under grant P23946. AWG was supportedunder the Australian Research Council’s funding schemeFT110100263. GAMA is a joint European-Australasian pro-ject based around a spectroscopic campaign using the Anglo-Australian Telescope. The GAMA input catalogue is basedon data taken from the Sloan Digital Sky Survey and theUKIRT Infrared Deep Sky Survey. Complementary imagingof the GAMA regions is being obtained by a number of in-dependent survey programs including GALEX MIS, VSTKiDS, VISTA VIKING, WISE, Herschel-ATLAS, GMRTand ASKAP providing UV to radio coverage. GAMA is fun-ded by the STFC (UK), the ARC (Australia), the AAO,
c© 2013 RAS, MNRAS 000, 1–14
12 L. S. Kelvin et al.
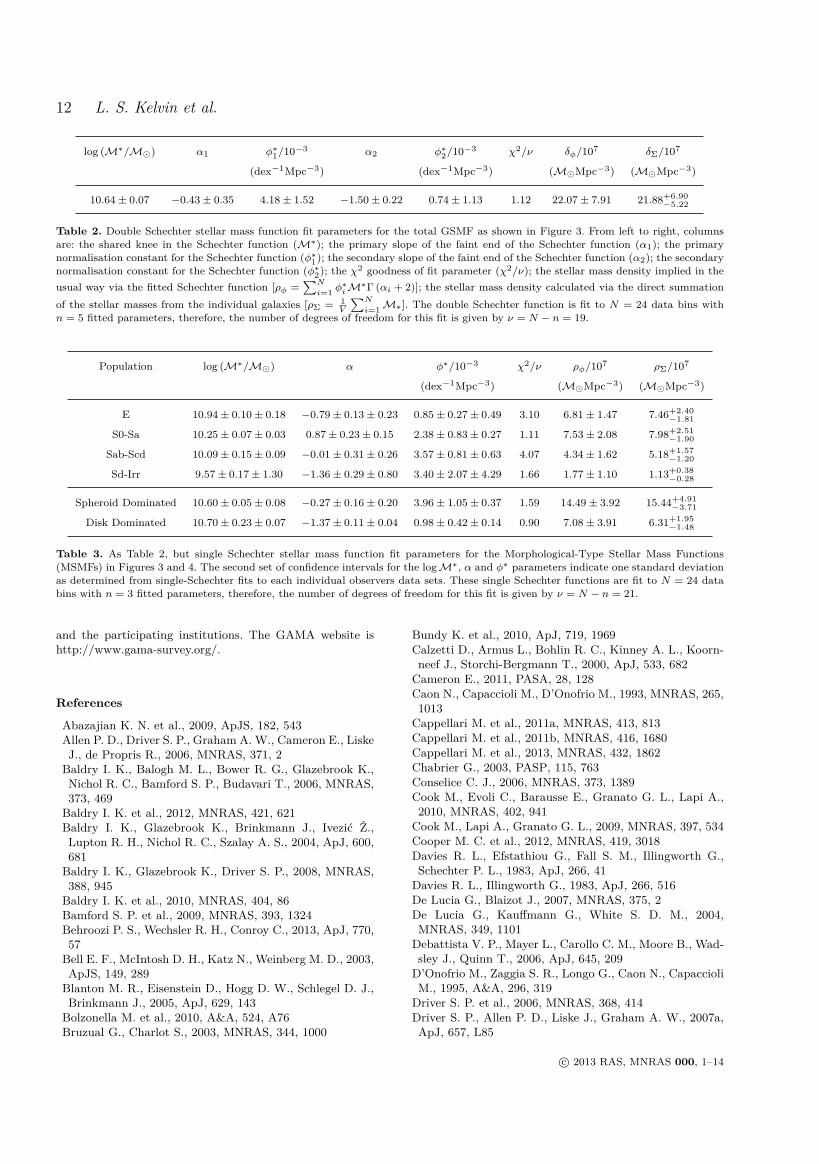
log (M∗/M) α1 φ∗1/10−3 α2 φ∗2/10−3 χ2/ν δφ/107 δΣ/107
(dex−1Mpc−3) (dex−1Mpc−3) (MMpc−3) (MMpc−3)
10.64± 0.07 −0.43± 0.35 4.18± 1.52 −1.50± 0.22 0.74± 1.13 1.12 22.07± 7.91 21.88+6.90−5.22
Table 2. Double Schechter stellar mass function fit parameters for the total GSMF as shown in Figure 3. From left to right, columnsare: the shared knee in the Schechter function (M∗); the primary slope of the faint end of the Schechter function (α1); the primarynormalisation constant for the Schechter function (φ∗1); the secondary slope of the faint end of the Schechter function (α2); the secondarynormalisation constant for the Schechter function (φ∗2); the χ2 goodness of fit parameter (χ2/ν); the stellar mass density implied in theusual way via the fitted Schechter function [ρφ =
∑N
i=1 φ∗iM∗Γ (αi + 2)]; the stellar mass density calculated via the direct summation
of the stellar masses from the individual galaxies [ρΣ = 1V
∑N
i=1M∗]. The double Schechter function is fit to N = 24 data bins withn = 5 fitted parameters, therefore, the number of degrees of freedom for this fit is given by ν = N − n = 19.
Population log (M∗/M) α φ∗/10−3 χ2/ν ρφ/107 ρΣ/107
(dex−1Mpc−3) (MMpc−3) (MMpc−3)
E 10.94± 0.10± 0.18 −0.79± 0.13± 0.23 0.85± 0.27± 0.49 3.10 6.81± 1.47 7.46+2.40−1.81
S0-Sa 10.25± 0.07± 0.03 0.87± 0.23± 0.15 2.38± 0.83± 0.27 1.11 7.53± 2.08 7.98+2.51−1.90
Sab-Scd 10.09± 0.15± 0.09 −0.01± 0.31± 0.26 3.57± 0.81± 0.63 4.07 4.34± 1.62 5.18+1.57−1.20
Sd-Irr 9.57± 0.17± 1.30 −1.36± 0.29± 0.80 3.40± 2.07± 4.29 1.66 1.77± 1.10 1.13+0.38−0.28
Spheroid Dominated 10.60± 0.05± 0.08 −0.27± 0.16± 0.20 3.96± 1.05± 0.37 1.59 14.49± 3.92 15.44+4.91−3.71
Disk Dominated 10.70± 0.23± 0.07 −1.37± 0.11± 0.04 0.98± 0.42± 0.14 0.90 7.08± 3.91 6.31+1.95−1.48
Table 3. As Table 2, but single Schechter stellar mass function fit parameters for the Morphological-Type Stellar Mass Functions(MSMFs) in Figures 3 and 4. The second set of confidence intervals for the logM∗, α and φ∗ parameters indicate one standard deviationas determined from single-Schechter fits to each individual observers data sets. These single Schechter functions are fit to N = 24 databins with n = 3 fitted parameters, therefore, the number of degrees of freedom for this fit is given by ν = N − n = 21.
and the participating institutions. The GAMA website ishttp://www.gama-survey.org/.
References
Abazajian K. N. et al., 2009, ApJS, 182, 543Allen P. D., Driver S. P., Graham A. W., Cameron E., LiskeJ., de Propris R., 2006, MNRAS, 371, 2Baldry I. K., Balogh M. L., Bower R. G., Glazebrook K.,Nichol R. C., Bamford S. P., Budavari T., 2006, MNRAS,373, 469Baldry I. K. et al., 2012, MNRAS, 421, 621Baldry I. K., Glazebrook K., Brinkmann J., Ivezić Ž.,Lupton R. H., Nichol R. C., Szalay A. S., 2004, ApJ, 600,681Baldry I. K., Glazebrook K., Driver S. P., 2008, MNRAS,388, 945Baldry I. K. et al., 2010, MNRAS, 404, 86Bamford S. P. et al., 2009, MNRAS, 393, 1324Behroozi P. S., Wechsler R. H., Conroy C., 2013, ApJ, 770,57Bell E. F., McIntosh D. H., Katz N., Weinberg M. D., 2003,ApJS, 149, 289Blanton M. R., Eisenstein D., Hogg D. W., Schlegel D. J.,Brinkmann J., 2005, ApJ, 629, 143Bolzonella M. et al., 2010, A&A, 524, A76Bruzual G., Charlot S., 2003, MNRAS, 344, 1000
Bundy K. et al., 2010, ApJ, 719, 1969Calzetti D., Armus L., Bohlin R. C., Kinney A. L., Koorn-neef J., Storchi-Bergmann T., 2000, ApJ, 533, 682
Cameron E., 2011, PASA, 28, 128Caon N., Capaccioli M., D’Onofrio M., 1993, MNRAS, 265,1013
Cappellari M. et al., 2011a, MNRAS, 413, 813Cappellari M. et al., 2011b, MNRAS, 416, 1680Cappellari M. et al., 2013, MNRAS, 432, 1862Chabrier G., 2003, PASP, 115, 763Conselice C. J., 2006, MNRAS, 373, 1389Cook M., Evoli C., Barausse E., Granato G. L., Lapi A.,2010, MNRAS, 402, 941
Cook M., Lapi A., Granato G. L., 2009, MNRAS, 397, 534Cooper M. C. et al., 2012, MNRAS, 419, 3018Davies R. L., Efstathiou G., Fall S. M., Illingworth G.,Schechter P. L., 1983, ApJ, 266, 41
Davies R. L., Illingworth G., 1983, ApJ, 266, 516De Lucia G., Blaizot J., 2007, MNRAS, 375, 2De Lucia G., Kauffmann G., White S. D. M., 2004,MNRAS, 349, 1101
Debattista V. P., Mayer L., Carollo C. M., Moore B., Wad-sley J., Quinn T., 2006, ApJ, 645, 209
D’Onofrio M., Zaggia S. R., Longo G., Caon N., CapaccioliM., 1995, A&A, 296, 319
Driver S. P. et al., 2006, MNRAS, 368, 414Driver S. P., Allen P. D., Liske J., Graham A. W., 2007a,ApJ, 657, L85
c© 2013 RAS, MNRAS 000, 1–14

GAMA: Stellar mass functions by Hubble type 13
Driver S. P. et al., 2011, MNRAS, 413, 971Driver S. P., Liske J., Cross N. J. G., De Propris R., AllenP. D., 2005, MNRAS, 360, 81Driver S. P. et al., 2009, Astronomy and Geophysics, 50,050000Driver S. P., Popescu C. C., Tuffs R. J., Liske J., GrahamA. W., Allen P. D., de Propris R., 2007b, MNRAS, 379,1022Driver S. P., Robotham A. S. G., Bland-Hawthorn J.,Brown M., Hopkins A., Liske J., Phillipps S., Wilkins S.,2013, MNRAS, 430, 2622Duc P.-A. et al., 2011, MNRAS, 417, 863Emsellem E. et al., 2011, MNRAS, 414, 888Gadotti D. A., 2009, MNRAS, 393, 1531Graham A. W., Colless M. M., Busarello G., Zaggia S.,Longo G., 1998, A&AS, 133, 325Graham A. W., Driver S. P., 2005, PASA, 22, 118Graham A. W., Merritt D., Moore B., Diemand J., TerzićB., 2006, AJ, 132, 2711Graham A. W., Worley C. C., 2008, MNRAS, 388, 1708Hill D. T. et al., 2011, MNRAS, 412, 765Kauffmann G. et al., 2003, MNRAS, 341, 54Kauffmann G., White S. D. M., Heckman T. M., MénardB., Brinchmann J., Charlot S., Tremonti C., BrinkmannJ., 2004, MNRAS, 353, 713Kelvin L., Driver S., Robotham A., Hill D., CameronE., 2010, in American Institute of Physics ConferenceSeries, Vol. 1240, American Institute of Physics Confer-ence Series, Debattista V. P., Popescu C. C., eds., pp.247–248Kelvin L. S. et al., 2014, MNRAS, 439, 1245Kelvin L. S. et al., 2012, MNRAS, 421, 1007Kereš D., Katz N., Weinberg D. H., Davé R., 2005,MNRAS, 363, 2Khochfar S. et al., 2011, MNRAS, 417, 845Khochfar S., Silk J., 2006a, ApJ, 648, L21Khochfar S., Silk J., 2006b, MNRAS, 370, 902Kormendy J., Bender R., 2012, ApJS, 198, 2Krajnović D. et al., 2011, MNRAS, 414, 2923Lara-López M. A. et al., 2010, A&A, 521, L53Lara-López M. A. et al., 2013, MNRAS, 434, 451Lawrence A. et al., 2007, MNRAS, 379, 1599L’Huillier B., Combes F., Semelin B., 2012, A&A, 544, A68Liske J., Lemon D. J., Driver S. P., Cross N. J. G., CouchW. J., 2003, MNRAS, 344, 307Matković A., Guzmán R., 2005, MNRAS, 362, 289Moustakas J. et al., 2013, ApJ, 767, 50Muzzin A. et al., 2013, ApJ, 777, 18Navarro J. F., Benz W., 1991, ApJ, 380, 320Omand C., Balogh M., Poggianti B., 2014, arXiv:1402.3394Pastrav B. A., Popescu C. C., Tuffs R. J., Sansom A. E.,2013, A&A, 553, A80Patel S. G. et al., 2013, ApJ, 766, 15Peng C. Y., Ho L. C., Impey C. D., Rix H.-W., 2002, AJ,124, 266Peng C. Y., Ho L. C., Impey C. D., Rix H.-W., 2010a, AJ,139, 2097Peng Y.-j. et al., 2010b, ApJ, 721, 193Peng Y.-j., Lilly S. J., Renzini A., Carollo M., 2012, ApJ,757, 4Pichon C., Pogosyan D., Kimm T., Slyz A., Devriendt J.,Dubois Y., 2011, MNRAS, 418, 2493
Pozzetti L. et al., 2010, A&A, 523, A13Robotham A. S. G. et al., 2013, MNRAS, 431, 167Robotham A. S. G. et al., 2011, MNRAS, 416, 2640Schechter P., 1976, ApJ, 203, 297Schmidt M., 1968, ApJ, 151, 393Sérsic J. L., 1963, Boletin de la Asociacion Argentina deAstronomia La Plata Argentina, 6, 41
Shankar F., Marulli F., Bernardi M., Mei S., Meert A.,Vikram V., 2013, MNRAS, 428, 109
Shen S., Mo H. J., White S. D. M., Blanton M. R.,Kauffmann G., Voges W., Brinkmann J., Csabai I., 2003,MNRAS, 343, 978
Shimizu I., Inoue A. K., 2013, arXiv:1310.0879Simard L., Mendel J. T., Patton D. R., Ellison S. L., Mc-Connachie A. W., 2011, ApJS, 196, 11
Szomoru D., Franx M., van Dokkum P. G., Trenti M.,Illingworth G. D., Labbé I., Oesch P., 2013, ApJ, 763,73
Tasca L. A. M., White S. D. M., 2011, A&A, 530, A106Taylor E. N. et al., 2011, MNRAS, 418, 1587Tomczak A. R. et al., 2014, ApJ, 783, 85Tremonti C. A. et al., 2004, ApJ, 613, 898van den Bosch F. C., Aquino D., Yang X., Mo H. J.,Pasquali A., McIntosh D. H., Weinmann S. M., Kang X.,2008, MNRAS, 387, 79
van Dokkum P. G. et al., 2010, ApJ, 709, 1018White S. D. M., Frenk C. S., 1991, ApJ, 379, 52Wyse R. F. G., Gilmore G., Franx M., 1997, ARA&A, 35,637
Yang X., Mo H. J., van den Bosch F. C., 2009, ApJ, 695,900
York D. G. et al., 2000, AJ, 120, 1579Young C. K., Currie M. J., 1994, MNRAS, 268, L11
APPENDIX A: IMPACT OF THE LBSPOPULATION ON THE GSMF
Our prior division of our galaxy sample into spheroid domin-ated (E, S0-Sa) and disk dominated (Sab-Scd, Sd-Irr) galax-ies, as shown in Figure 4, neglected the low-mass little bluespheroid population. Figure A1 shows the GSMF and diskdominated MSMF as before, but with an updated spher-oid dominated MSMF including the LBS population (i.e.,E, S0-Sa, LBS). All data analysis is conducted in a similarfashion to that outlined in Section 4. The previous spheroiddominated (E, S0-Sa) single Schechter function fit is shownin light grey, for reference. As can clearly be seen, once theLBS galaxy population is included into the spheroid domin-ated class, we recover a low-mass upturn exceedingly similarin nature to the red population as reported in, e.g., Baldryet al. (2012) and Peng et al. (2012). On the surface, thespheroid dominated class may perhaps be the natural homeof the ‘little blue spheroid’ galaxy population, allowing us tomaintain a good level of agreement with comparison studies.
However, we remind the reader that our adoptedvisual morphological classification boundaries (Kelvin et al.2014) are substantially different from the red/blue divisionspresented in Baldry et al. (2012) and Peng et al. (2012),and also the star forming/quiescent divisions as noted inSection 4.2. See, for example, Figure 5 for a visual repres-entation of the colour mix across all morphologies. Indeed,
c© 2013 RAS, MNRAS 000, 1–14
14 L. S. Kelvin et al.
despite the inherent trends between morphology, colour andstar formation rate, we see no explicit reason why a bimodaldivision along morphological lines should reproduce exactlythat of one which has been created along colour or star form-ation rate measures. In which case, it is perhaps surprisingthat a combined spheroid dominated plus LBS populationso closely recovers the low-mass upturn observed in the redpopulations of Baldry et al. (2012) and Peng et al. (2012).Also note that whilst the third word in LBS denotes itsshape, the second part of the acronym denotes their typicalcolour: blue. As is shown in Figure 5, the majority of bluegalaxies lie in the disk dominated Sab-Scd and Sd-Irr classes,giving weight to the inclusion of the LBS population in ourdisk dominated sub-sample instead. This would only serveto increase the low-mass upturn of the disk dominated pop-ulation, and maintain the low-mass discrepancy we observebetween our spheroid dominated class and the comparisonred-population data from the literature. The correct place-ment of our LBS galaxy population within the morphologicalschema adopted throughout this study remains unclear, andtherefore, we continue to advocate its exclusion at present.Future studies are planned to clarify the importance of theLBS population (Moffett et al., in prep.).
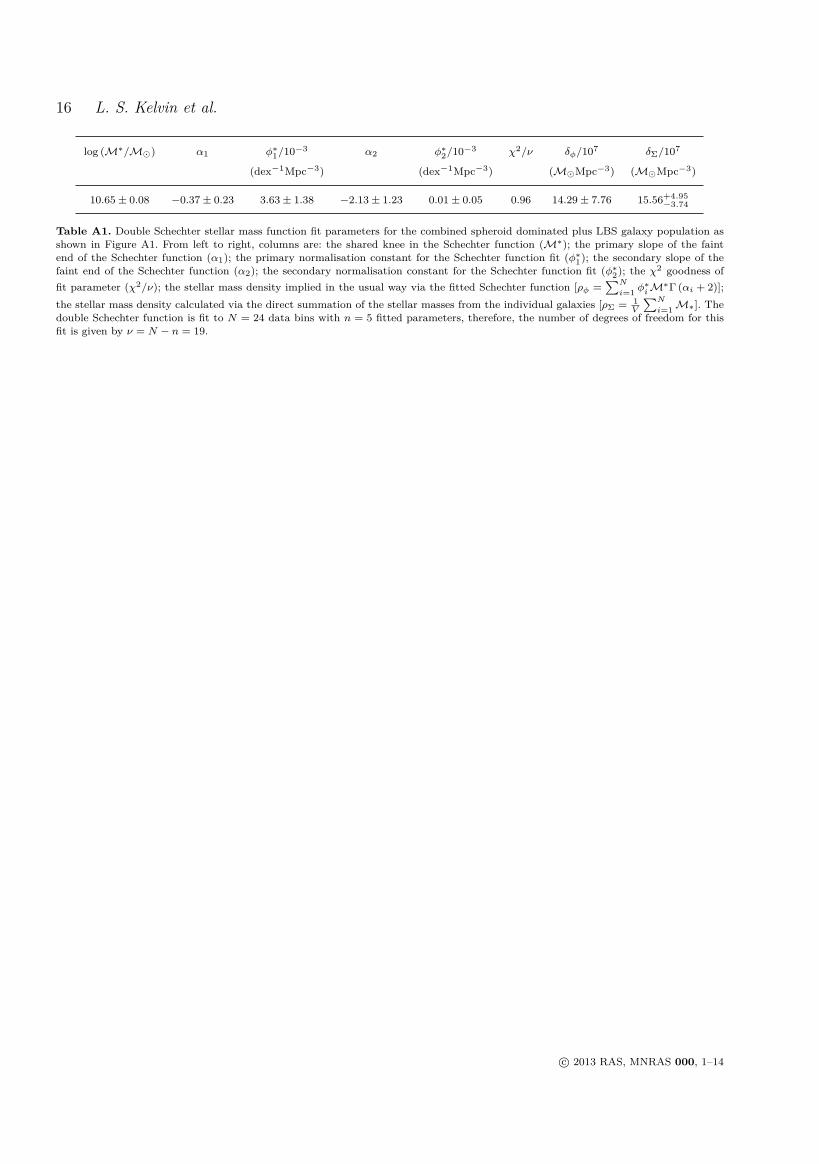
Table A1 provides the double Schechter fit paramet-ers to the combined spheroid dominated (E, S0-Sa) plusLBS population. Note the unusually low α2 slope para-meter, combined with relatively large error bars. This in-dicates that shape of the low-mass end of our Schechter fitis poorly constrained, as is evidenced by the unusually steepgradient of the fit when extrapolated below our mass limit(see Figure A1). Nevertheless, the Schechter fit provides agood description of the data across the range of interest(log (M∗/M) > 9.0), exhibiting a strong goodness of fitparameter.
c© 2013 RAS, MNRAS 000, 1–14

GAMA: Stellar mass functions by Hubble type 15
Figure A1. As Figure 4, but with the inclusion of the LBS population in the spheroid dominated class (red data points). The combinedspheroid dominated plus LBS population is fitted by a double Schechter component (red solid line) as is the total galaxy population(solid black line), whereas the disk dominated population remains well described by a single Schechter function (solid blue line). Theprevious spheroid dominated (E, S0-Sa) single Schechter function fit is shown in light grey, for reference. Comparison Schechter functionfits for similar red and blue populations from Baldry et al. (2012) and Peng et al. (2012) are also shown.
c© 2013 RAS, MNRAS 000, 1–14
16 L. S. Kelvin et al.
log (M∗/M) α1 φ∗1/10−3 α2 φ∗2/10−3 χ2/ν δφ/107 δΣ/107
(dex−1Mpc−3) (dex−1Mpc−3) (MMpc−3) (MMpc−3)
10.65± 0.08 −0.37± 0.23 3.63± 1.38 −2.13± 1.23 0.01± 0.05 0.96 14.29± 7.76 15.56+4.95−3.74
Table A1. Double Schechter stellar mass function fit parameters for the combined spheroid dominated plus LBS galaxy population asshown in Figure A1. From left to right, columns are: the shared knee in the Schechter function (M∗); the primary slope of the faintend of the Schechter function (α1); the primary normalisation constant for the Schechter function fit (φ∗1); the secondary slope of thefaint end of the Schechter function (α2); the secondary normalisation constant for the Schechter function fit (φ∗2); the χ2 goodness offit parameter (χ2/ν); the stellar mass density implied in the usual way via the fitted Schechter function [ρφ =
∑N
i=1 φ∗iM∗Γ (αi + 2)];
the stellar mass density calculated via the direct summation of the stellar masses from the individual galaxies [ρΣ = 1V
∑N
i=1M∗]. Thedouble Schechter function is fit to N = 24 data bins with n = 5 fitted parameters, therefore, the number of degrees of freedom for thisfit is given by ν = N − n = 19.
c© 2013 RAS, MNRAS 000, 1–14