Metropolitan Area (GAMA) -Ghana - Environmental Problems ...
154
George Benneh, Jacob Songsore, John S. Nabila, A.T. Amuzu, K.A. Tutu and Yvon Yangyuoru University of Ghana-Legan Study Team Gordon McGranahan Stockholm Environment Institute ISBN: 91 88116 75 1
-
Upload
khangminh22 -
Category
Documents
-
view
0 -
download
0
Transcript of Metropolitan Area (GAMA) -Ghana - Environmental Problems ...

~SE
I~:~~:~~~~NTIN
ST
ITU
TE
Inte
rna
tion
alIn
stitute
forE
nviro
nm
en
talT
ech
no
log
yand
Ma
na
ge
me
nt
--=-"'_
En
viro
nm
ental
Pro
blem
san
dth
eU
rban
Ho
useh
old
inth
eG
reaterA
ccraf
Metro
po
litanA
rea(G
AM
A)
-Gh
ana
Geo
rge
Ben
neh
,JacobS
ongsore,Joh
nS.
Nabila,
A.T
.A
mu
zu,
K.A
.T
utuan
dY
vonY
angyuoruU
niversityof
Ghana-L
eganS
tudyT
eam
Go
rdo
nM
cGran
ahan
Stockholm
Environm
entInstitute
ISB
N:
9188116
751


En
viro
nm
ental
Pro
blem
san
dth
eU
rban
Ho
useh
old
inth
eG
reaterA
ccraM
etrop
olitan
Area
(GA
MA
)-G
han
a
George
Benneh,Jacob
Songsore,Jo
hn
S.N
abila,A
.T.
Am
uzu,K
.A.
Tutu
and
Yvon
Yangyuoru
University
ofG
hana-Legon
Study
Team
*
Go
rdo
nM
cGran
ahan
Stockholm
Environm
entInstitute
*C
on
tact
ad
dre
ss:U
niversityof
Ghana,
Departm
entof
Geography
andR
esourceD
evelopment,
P.O
.B
ox59,
Legon,G
hana

Stockholm
Environm
entInstituteB
ox2142
S-103
14S
tockholmS
weden
Tel
+46
8723
0260F
ax+
468
7230348
Responsible
Editor,
Am
oR
osemarin
(SE
I)C
opyE
ditor,R
achelC
oleD
esk-topP
ublishing,H
eliP
ohjolainen(SE
I)
©C
opyright1993
bythe
StockholmE
nvironment
InstituteN
op
an
ofthis
repo
nm
aybe
reproducedin
anyform
byphotostat,
microfilm
,or
anyother
means;>
wiihout
written
permission
fromthe
publisher.
ISB
N:
918
81
16
75
1C
overp
ho
to:
Bjo
mLarsson
Ask,
SvD

Benneh
etal.
LIS
TO
FA
BB
RE
VIA
TIO
NS
.AR
IC
DR
EP
CG
AM
AG
WS
CK
VIP
LP
GP
EF
UN
WH
O
Acute
Respiratory
InfectionC
omm
itteefor
theD
efenceo
ftheR
evolutionE
nvironmental
Protection
Council
Greater
Accra
Metropolitan
Area
Ghana
Water
andS
ewerage
Corporation
Kum
asiV
entilatedIm
provedP
itLatrine
bottledgas
Peak
Expiratory
Flow
United
Nations
World
Health
Organisation
Note:
At
thetim
eo
fthe
survey(end
1991)there
were
approximately
400cedis
toone
US
$.

11E
nvironmental
Problem
sand
theU
rbanH
ouseholdin
theG
AM
A-G
hana
TA
BL
EO
FC
ON
TE
NT
S
LIS
TO
FA
BB
RE
VIA
TIO
NS
iF
OR
EW
OR
Dv
AC
KN
OW
LE
DG
EM
EN
TS
vi
EX
EC
UT
IVE
SU
MM
AR
Yviii
Household
Water
Supplies
-C
onditions:viii
Sanitation
andH
ygiene-
Conditions:
ixS
olidW
aste-
Conditions:
xiP
estsand
Pesticides
-C
onditions:xi
Food
Contam
ination-
Conditions:
xiiH
ouseholdS
moke
(andC
rowding)
-C
onditions:xiii
Health
andE
nvironmentalR
iskF
actorsxiii
Environm
entalV
aluesand
Household
Econom
icsxv
InstitutionalA
spectso
fUrban
Environm
entalManagem
entxvi
Policy
Implications
xvii
IIN
TR
OD
UC
TIO
N1
1.1S
copeand
Approach
11.1.1
Scope
11.1.2
Research
Design
21.1.3
Sam
plingP
rocedurefor
Household
Survey
21.1.4
Physical
Tests
51.1.5
Focus
Group
Discussions
51.2
Overview
ofthe
Urban
Grow
thD
ynamics
ofGA
MA
.5
1.2.1P
opulationG
rowth
andP
hysicalD
evelopments
within
GA
MA
61.2.2
Urban
Econom
icG
rowth
Trends
81.3
The
Challenge
ofG
AM
A's
Grow
thatthe
Local
Level
9
2H
OU
SE
HO
LD
WA
TE
RS
UP
PL
Y11
2.1Introduction
112.2
Water
Supply
System
s11
2.3C
onvenienceo
fAccess
andR
eliabilityo
fS
upply12
2.4W
aterS
torageand
Handling
Practices
152.5
Water
Utilisation
Patterns
172.6
Water
Paym
ents18
2.7B
acteriologicalExam
inationo
fDrinking
Water
Supply
202.7.1
Bacteriological
Quality
ofH
ouseholdW
aterS
ources22
2.7.2In-H
ouseW
aterC
ontamination
24B
ox2.1
Water
andW
ealth26
3S
AN
ITA
TIO
NF
AC
ILIT
IES
273.1
Introduction2.7~..
3.2A
ccessto
Sanitation
Facilities
2T
3.3P
revalenceo
fO
utdoorD
efecation30
3.4H
ygieneand
Hand
washing
Practices
323.5
Sullage
andS
tormW
aterD
rainage35
Box
3.1S
anitationF
acilitiesand
Wealth
37

III
4S
OL
IDW
AS
TE
DIS
PO
SA
LS
YS
TE
MS
AN
DP
RA
CT
ICE
S38
4.1Introduction
384.2
Handling
ofS
olidW
astes38
4.2.1H
ousehold-Level
Storage
andD
isposalP
ractices38
4.2.2C
omm
unityL
evelWaste
Managem
ent39
4.2.3H
ouseholdL
evelS
erviceC
hargesfor
Garbage
Rem
oval42
4.3F
inalDisposal
Systems
42
5U
RB
AN
PE
ST
SA
ND
PE
ST
CO
NT
RO
L.
445.1
Urban
InsectVectors
andR
odents44
5.1.1Introduction
445.1.2
Mosquitoes
445.1.3
House
Flies
455.1.4
Cockroaches
485.1.5
Rodents
,49
5.2Insecticide
Usage
andO
therP
reventiveM
easures50
5.2.1H
ouseholdInsectC
ontroL50
Box
5.1F
lies,Mosquitoes
andW
ealth53
6F
OO
DC
ON
TA
MIN
AT
ION
546.1
Introduction54
6.2F
oodS
upplies54
6.3F
oodP
reparation55
6.4F
oodS
toragein
theH
ome
58B
ox6.1
Food
Vending
andW
ealth60
7A
IRP
OL
LU
TIO
NA
ND
HO
US
ING
617.1
Household
Air
Pollution
617.1.1
Cooking
Fuels
627.1.2
Cooking
Locations
637.1.3
Exposure
toR
espirableP
articulatesW
hileC
ooking65
7.1.4E
xposureto
Carbon
Monoxide
While
Cooking
677.1.5
Cooking
Patterns
andR
espiratoryP
roblems
707.2
Housing
72B
ox7.1
Cooking
Fuels
andW
ealth74
8H
OU
SE
HO
LD
EN
VIR
ON
ME
NT
AN
DH
EA
LT
H75
8.1Introduction
758.2
Diarrhoea
778.3
Respiratory
Illness82
8.3.1A
cuteR
espiratoryInfection
among
Children
Under
Six
Years
Old
828.3.2
Respiratory
Problem
Sym
ptoms
among
PrincipalH
omem
akers85
Box
8.1H
ouseholdE
nvironmental
Conditions
andH
ealth89
9T
HE
EC
ON
OM
ICS
OF
HO
US
EH
OL
DE
NV
IRO
NM
EN
TA
LM
AN
AG
EM
EN
T91
9.1Introduction
919.2
Where
isaction
neededby
whom
?93

IVE
nvironmental
Problem
sand
theU
rbanH
ouseholdin
theG
AM
A-G
hana
9.3W
illingnessand
Ability
To
Pay
959.4
Sum
mary
,..99
10T
HE
INS
TIT
UT
ION
AL
AS
PE
CT
SO
FU
RB
AN
EN
VIR
ON
ME
NT
AL
MA
NA
GE
ME
NT
10010.1
Introduction100
10.2T
heG
overnment's
InstitutionalS
tructure100
10.2.1C
entralG
overnmentInstitutions
10010.2.2
Health
Education
10210.2.3
The
DistrictA
ssemblies
10210.2.4
The
Environm
entalProtection
Council
(EPC
)103
10.2.5E
nvironmental
Sub-C
onunittees103
10.3D
eliveryA
gencies103
10.4P
oliticalO
rganisations:T
heC
onunitteesfor
theD
efenceo
ftheR
evolution(C
DR
s)104
10.5O
fficialN
eighbourhoodG
roups105
10.6S
pontaneousN
eighbourhoodO
rganisations106
10.6.1N
ima
441W
elfareA
ssociation106
10.6.2L
aM
ansaamo
Kpee,L
aT
own
(Labadi)
10610.7
Households'E
nvironmental
Role
10710.8
Sum
mary
andC
onclusions108
11S
UM
MA
RY
OF
PO
LIC
YIM
PL
ICA
TIO
NS
11011.1
Introduction110
11.2W
ater110
11.3S
anitationand
Hygiene
11111.4
Solid
Waste
11211.5
Pests
andP
esticides113
11.6F
oodC
ontamination
11411.7
Household
Air
Pollution
11411.8
An
IntegratedE
nvironmental
Strategy
115
RE
FE
RE
NC
ES
117
AP
PE
ND
IX1
,120·
Sam
plingP
rocedurefor
Questionnaire
Survey
120A
PP
EN
DIX
2122
Methodology
forA
ssessmento
fWater
Quality
1221
Material
andm
ethods122
2W
aterS
ampling
Procedure
1222.1
Bacteriological
Exam
ination122
AP
PE
ND
IX3
123M
ethodologyfor
Air
Test..
1231
Field
Operations
123·1.1
Field
Exposure
Measurem
entsM
ethods123·
AP
PE
ND
IX4
125O
peningA
ddresso
ftheR
ightHonorable
Dr.C
hristineA
moako-N
uamah,
Minister
forthe
Environm
ent,Ghana.

Benneh
etai.v
FO
RE
WO
RD
For
many
lowincom
eurban
dwellers,
thereis
noneed
topredict
life-threateningenvironm
entaldegradation:
itis
alreadya
facto
flife.
Indeed,m
anyo
fthe
worst
featureso
furban
povertyin
theT
hirdW
orldare
environmental:
pooraccess
tosafe
water,
unsanitaryconditions,
smoky
kitchens,contam
inatedfood,
uncollectedsolid
waste,
insectinfestation.L
ikem
ostenvironm
entalproblem
s,these
areclosely
interrelated.T
heneed
fora
multisectoral
strategyto
addressthese
problems
isgenerally
recognised.M
ostresearch,
however,
continuesto
proceedalong
disciplinarylines.
An
environmental
perspective,w
ithits
inherentlytransdisciplinary
nature,is
theappropriate
approach.M
oreover,it
isim
portantthat
thelocal
environmental
problems
which
currentlyplague
thepoor
beaddressed
with
dueregard
forthe
broaderenvironm
entalcontext.
As
theexperience
of
many
middle-incom
em
egacitiesindicates,
economic
expansionand
rapidurbanization
cancreate
ahost
of
newenvironm
entalproblem
s,w
ithoutnecessarily
resolvingthose
typicallyassociated
with
poverty.In
1991,S
EI,
working
incollaboration
with
localresearch
institutions,initiated
ascoping
studyo
fhousehold
environmental
problems
inA
ccra,Jakarta
andS
aoP
aulo.D
rawing
uponboth
localand
internationalexpertise,
acom
parableapproach
was
developedand
appliedin
eacho
fthese
cities.S
urveyso
f1,000
householdsw
ereundertaken
ineach
city,along
with
physicaltesting
insubsam
pleso
fabout
200.T
hestudy
isboth
trans-disciplinaryand
action-oriented.T
heem
piricalresultsrange
fromindicators
offaecal
contamination
indrinking
water,
topeople's
perceptionso
fw
hatshould
bedone
byw
homto
improve
thesituation..
The
analysisexam
inesthe
physicalseverity
of
theproblem
s,and
alsothe
institutionalcontextfrom
which
practicalsolutions
mustem
erge.T
hisreport
summ
arizesthe
resultso
ftheA
ccracase
study.It
ishoped
thatthe
reportw
illb
eo
finterest
notonly
within
Accra,
butalso
toother
researchersand
policy-makers
concernedw
ithurban
environmental
issues.S
aoP
auloand
Jakartaare
bothm
egacities,renow
nedas
thesites
of
severeenvironm
entaldistress.
Accra
doesnot
yetface
them
egacityproblem
s.Y
etthe
localenvironm
entalproblem
sdescribed
inthis
reporton
Accra
areprobably
afar
greaterburden
forlocal
inhabitantsthan,
forexam
ple,the
widely
publicisedam
bientair
pollutionin
Sao
Paulo.
Moreover,
Accra
isprobably
typicalo
fhundreds
of
otherm
edium-sized
citiesin
thisregard.
This
reportaim
sto
demonstrate
notonly
thatsom
ethingneeds
tobe
done,but
that,w
ithbetter
information,
something
canbe
done.P
reliminary
resultsw
erepresented
atthe
SE
IlIIED
/SID
Aw
orkshopon
Urban
Environm
entsand
Hum
anW
elfarein
SouthernC
ities:L
essonsfrom
fivecase
studies(S
EI,
Stockholm
,F
ebruary,1993).
The
casestudies
includednot
onlyA
ccra,Jakarta
andS
aoP
aulo,but
alsolIE
Dco-ordinated
studieso
fN
airobiand
Lagos.
Papers
onhealth
andenvironm
entalaspects
inall
fivecities
areappearing
inthe
journalE
nvironment
andU
rbanization(for
Accra
andJakarta,
seeV
ol.5,
No.2).
Further
publicationsare
anticipated.D
etailson
thepublications
arisingfrom
thestudies
of
Accra,
Jakartaand
Sao
Paulo
will
beavailable
fromS
EI.
For
furtherdetails
onthe
studieso
fN
airobiand
Lagos,
pleasecontact
David
Satterthw
aiteor
Diana
Mitlin,
Hum
anS
ettlements,
lIED
,3
Endsleigh
Street,
London
WC
IHO
DD
,U
.K.
Gord
onM
cGran
ahan
Urban
Environm
ent,S
tockholmE
nvironmentInstitute

viE
nvironmental
Problem
sand
theU
rbanH
ouseholdin
theG
AM
A-G
hana
AC
KN
OW
LE
DG
EM
EN
TS
Research
work
isa
collectiveenterprise,
thesuccess
of
which
dependson
theco
operationo
fm
anyactors.
While
theresponsibility
forthe
contentso
fthis
reportis
theauthors',
much
of
thecredit
must
goto
thosew
hom
aynot
havew
rittenthe
text,butw
ithoutwhom
thisstudy
would
nothavebeen
successful.T
hanksare
dueto
thestudents
of
theU
niversityo
fG
hanaw
hoserved
as.research
assistantsand
supervisorsfor
them
ainsurvey.
Am
ongthis
group,P
atienceD
jietror,B
enjamin
KB
.A
moyaw
,G
odwin
A.
Djietror,
Ernest
Y.
Asante
andS
.A.
Tetteh
needspecial
mention
forthe
continuedsupport
theyshow
edfor
thestudy
beyondthe
fieldresearch
stage.T
hephysical
testso
fw
aterand
airquality
were
carriedout
bytw
oseparate
teams
basedat
theW
aterR
esourcesR
esearchInstitute
of
theC
SIR
.S
pecialm
entionis
made
of
E.K
Bosque-H
amilton
andW
.D
oudufor
thew
atersam
pling;and
E.
Nana-A
mankw
ahand
Ms.
P.D
.A
tsakpofor
theair
monitoring.
We
arealso
gratefulto
thecom
puterprogram
mer
Mr.
KK
Etsibah
who
didthe
dataprocessing
atthe
University
of
Ghana-L
egon,and
Mr.
S.A
.O
tcherew
hohandled
allthe
secretarialwork,especially
thetyping
ofthe
draftreportC
hristerP
erssoncreated
thedata
baseat
SE
I,upon
which
thestatistical
analysiso
fhealth
andenvironm
entis
based.S
olveig'N
ilssonprovided
criticalsupport
duringthe
revisionprocess.
Anna
Bratt
conductedthe
statisticalanalysis
of
thephysical
testresults,
andhelped
innum
erousw
aysto
getthe
[mal
document
intoshape.
All
deservethanks.
Carolyn
Stephens,
of
theL
ondonS
choolo
fH
ygieneand
Tropical
Medicine,
reviewed
thedraftreport,providing
many
perceptivecom
ments
andsuggestions.
Am
ongthe
policym
akers,w
eare
especiallygrateful
forthe
supporto
fthe
Mayor
of
theA
ccraM
etropolitanA
uthority,and
theH
eadso
fD
epartment
of
theW
asteM
anagement,
Environm
entalH
ealth,and
Tow
nand
Country
Planning
Departm
ents.T
hesam
ealso
goesfor
theA
reaM
anager,G
hanaW
aterand
Sew
erageC
orporationA
TM
Aand
theH
eadso
fthe
variousD
epartments
within
theorganisation.A
llo
fthe
participantsat
thew
orkshopheld
inpreparation
forthe
three-citystudy
(SE
I,S
tockholm,
June17-21,
1991)contributed
substantiallyto
developingthe
approachtaken.
Special
thanksgo
to:A
ndersE
llegard,w
honot
onlyprovided:
.guidelines
forthe
airquality
monitoring,
buthelped
supervisethe
field-testing;.
JosefL
eitmann,
whose
help,especially
atthe
criticalearly
stageso
fthe
study,w
asinvaluable;
andY
vonneA
nderssono
fthe
Sw
edishS
tateB
acteriologicalL
aboratory,w
hosecontinuing
interestand
supporthasbeen
greatlyappreciated.
The
discussionsheld
atthe
SE
IJIIED
/SID
Aw
orkshopon
Urban
Environm
entsand
Hum
anW
elfarein
SouthernC
ities:L
essonsfrom
fivecase
studies(S
EI,
Stockholm
,F
ebruary,1993)
were
alsoextrem
elyhelpful.
David
Satterthw
aiteand
Goran
Tannerfeldt
deservethanks
forhelping
createthis
opportunity.A
Sem
inaron
Environm
entalP
roblems
andthe
Urban
Household
inthe..
Greater
Accra
Metropolitan
Area
was
organisedin
Accra
onthe
9thand
10th0
[
Decem
ber1993
topresent
theresults.
We
were
honouredto
havethe
Minister
forthe
Environm
ent,D
r.(M
rs.)C
hristineA
moako-N
uamah
providean
introduction,clearly
placingthe
studyin
context.P
rofessorE
.A
.B
oatengdeserves
thanksfor
expertlychairing
thesessions,
asw
ellas
making
anum
bero
fcritical
interventions.T
hesem
inarw
asattended
bynum
erousrepresentatives
of
governmental
andnon-
Benneh
etal.vii
governmental
organisationsinvolved
inenvironm
entalim
provement,
whose
contributionsto
thediscussions
were
invaluable.S
AR
EC
andS
IDA
providedfinancial
supportatcriticaljunctures.A
ndo
fcourse,
avery
specialthanks
goesto
thethousand
or
sorespondents
who
answered
atrying
questionnaire.W
ecan
onlyhope
thatthe
resultso
fthe
studyw
illcontribute
toa
betterenvironmentfor
themand
theirneighbours.

GH
AN
AS
HO
WIN
GG
RE
AT
ER
AC
CR
AR
EG
ION
3"
2"
1•O
'1"
5"-
S"-
9"-
7"-
10
"-
I'"r,I'I')r:.Z
""
~~.o
40
80
·Km
.1
::1:::::!:=:!:::'=:::!:::=JI
RE
GIO
N
J"......._
.,....
\,......_
..-._._.-._.......,........,....-._
..........,..,"
,,:
JU
PP
ER
v·
/•
"I
IU
PP
ER
WE
ST
(E
AS
T·8oIQoIOnQ~
...(I
r\
,.,,-'-'"
,\
"'\'"\.,I
.,,-.1)
RE
GIO
N••J......./
\...,t
/\
(~
...I
v
I'
j•
We
,.,..)\
I",o
JI
..--..,.....,
NO
RT
HE
RN
\,.......
IT
am
ale
.;
\
iI
l.\:
\)
'l'-"\
r-~
,/-/
-..,J
"\'
./
/{
......\
"(.....
I\
•\
II
L'"'\
<:"
I"
)l,
/-
.....'",-
..........(
0'"
j"
r.........)
v('
~.--
\/
'---<.-~
(~....
lJ'"'I
1:>I
, i'~
BR
ON
GA
HA
FO
RE
GIO
N:u
'I
\'"/"11
/1
...../'1..._
-__
""-,C
l(
JS
un
ya
nl,--,
,.........,
\'
•L
\....
\.I
0....
............,.
......_:z:
I
I-)
'\I
I.,,/A
SH
AN
TI
RE
GIO
N,....}
-----....l..(
{.
"...'"
r-'"
IJ
,/_
,/
IJ
j(
It.
/'I
)t
/'.K
um
asl
1-'"
EA
ST
ER
N}
Ho'\
i'.
I....._
\I
)(
•'-
~"\J
("....IR
EG
ION
\\
~\.
/'")~.
I'.
)-),
/~.'\
\,\.
'-(K
ofo
rld
ua
I\
'."
',,-
I•
\_
-,
;2;-\
WE
ST
ER
N"...\\.'-\.,........-\
f@/7
//S
"-
L\
'-......-....
J/-.i/-,
I---'---'-y/
.....~R
EG
ION
L..-)
CE
NT
RA
LI
}>
\.......RE
G/O
NA
CC
RA
\)
/
8"
7"
5"
11"
-10
"
-6
"
-9
"
2"
I'IO
'1

GREATERACCRAMETROPOLITANAREASHOWINGDISTRICTS
~.<0'·
"\\,
"\\\
KEY
0"00'
---AccraMetropolifonArea(A.M.AJBoundary
---DisfrictBoundary~·:l0'
•DistrictCapitol
••OfherTowns,VII/ages
---Roods
az..cs8Ki~m,J(,'
,.'I•I"foI2J4~Mil..
".6arCllana."-
DISTRICT"'IRPO~r
0"10'
0-10'
~-
/II.
/!/! ./I ;".
./I ./.....-""-I
//
.Oanto•Kwemon
~TE5"'E_~LAOt.OI............CHRISTIANSeCflG
AC::RA
oAbokObl'~::nron
././
GA
./,/
(
Ij/
IIII-",(pua:r
Clon~c.<'
-A,ala
"Gbc·".
PokOQJO-
.Wcljo
0"20'
oAlanko,oku
'-----.J
(
,..)
I'I\
()
,/
\\\'\.;,,'"\
I'\.
~"~O'
/---',I'......_
------- IJ
/......Modlo\./ J........-..-
(\J
,J/~)
/(
\v'----\"AYI~oldaba(o
t ~'<O'

viiiE
nvironmentaL
ProbL
ems
an
dthe
Urban
HousehoLd
inthe
GA
MA
-Ghana
EX
EC
UT
IVE
SU
MM
AR
YT
hisreport
summ
arisesthe
resultsof
astudy
ofhousehold
environmental
problems
inthe
Greater
Accra
Metropolitan
Area
(GA
MA
),undertaken
jointlyby
theD
epartment
of
Geography
andR
esourceD
evelopment
of
theU
niversityo
fG
hanaand
theS
tockholmE
nvironment
Institute.T
hestudy
isaction
oriented,and
isintended
toenhance
theunderstanding
of
householdenvironm
entalproblem
sw
itha
viewtow
ardsim
provingthem
.P
astenvironm
entalassessm
entso
fA
ccrahave
emphasised
thelarger
scaleproblem
s,w
hichrange
fromm
arinepollution
to·am
bientair
pollution.In
time,
theselarge
scaleproblem
sm
ayindeed
become
critical,as
theycontinue
tounderm
inethe
sustainabilityo
fthe
city.C
urrently,how
ever,it
isthe
problems
which
GA
MA
dwellers
facein
theirhom
esand
neighbourhoodsw
hichare
ofprim
aryconcern.
Acom
binationof
poverty,dem
ographicgrow
th,econom
icfluctuations,
andfiscal
austerityis
placinga
considerablestrain
onhousehold
environments
inG
AM
A.
GA
MA
isboth
thenational
capitaland
them
ajorindustrial
centreo
fG
hana.In
1990it
hadan
estimated
populationo
f1.7
million,
andby
2010its
populationis
projectedto
reachthe
4m
illionm
ark.B
yinternational
standards,the-·
majority
of
thepopulation
livesin
poverty.W
ith10%
of
thecountry's
population,G
AM
Aaccounts
forbetw
een15%
and20%
of
thegross
domestic
product.T
hesepercentages
areexpected
toincrease
inthe
coming
years.T
heeconom
icenvironm
entis
veryuncertain,
however.
Following
asevere
economic
recessionin
Ghana
duringthe
1970sand
early1980s,
aneconom
icrecovery
programm
ew
asintroduced
in1983.
While
therehas
beena
strongtum
-aroundin
theeconom
yin
recentyears,
government
financesrem
ainseverely
constrained.T
hism
akesit
allthe
more
criticalthat
environmental
effortstarget
priorityproblem
sand
areas,and
arew
elldesigned.
Given
theprevious
lacko
finform
ationon
householdenvironm
entalproblem
s,this
reportconcentrates
onproviding
asum
mary
of
existingconditions.
The
problemareas
coveredinclude
water,
sanitation,solid
waste,
pestsand
pesticides,food
contamination
andhousehold
airpollution.
Specialattention
isgiven
toissues
of
environment
andhealth.
Inaddition,
thereport
providesinform
ationon
thehouseholds'
own
views
onw
hatneeds
tobe
doneand
byw
hom,
andsum
marises
theinstitutional
contextw
ithinw
hichhousehold
environmental
managem
enttakes
place.Finally,som
eofthe
policyim
plicationsare
discussedbriefly.
The
empirical
basisfor
thisstudy
includesa
questionnairesurvey
of
1,000representative
households,physicaltests
ofw
aterand
airquality
among
sub-setso
fabout
200,focus
groupdiscussion
inselected
low-incom
eneighbourhoods,
andunstructured
interviews
with
policym
akersand
implem
entors.
Household
Water
Supplies-
Conditions:
The
vastm
ajorityo
fhouseholds
surveyedin
GA
MA
depend,either
directlyo
rindirectly,
onpiped
water
supplies.A
ccessto
drinkingw
atervaries
considerably,how
ever.R
oughlyone
thirdo
fhouseholds
surveyedhad
indoorpiping,
anotherthird
gottheir
water
fromprivate
orpublic
standpipes,and
thebulk
of
the,,·rem
aininghouseholds
boughtw
aterfrom
vendors.O
nlyabout
3%o
fhouseholds"
reliedon
thelargely
pollutedw
ellsand
waterw
ays.N
otsurprisingly,
itw
asthe
wealthy
householdsw
hotended
tohave
indoorpiping,
andpoor
householdsw
horelied
most
heavilyon
water
vendors.W
ellsand
waterw
aysw
erelargely
restrictedto
poorperi-urban
households.

Benneh
etal.IX
The
physicaltests
indicatedsom
efaecal
contamination
of
thetap
water,
particularlyfrom
tapsin
poorareas
of
thecity.
Overall,
10%of
the(136)
samples
of
tapw
aterhad
positivecounts
of
faecalcolifonn.
The
qualityo
fthe
water
inhousehold
storagecontainers
was
considerablyw
orse,how
ever:87%
of
the(149)
testshad
positivecounts.
Faecalcontam
inationis
likelyto
bea
greaterhealth
riskw
henit
originatesoutside
of
theim
mediate
household.N
evertheless,the
levelsencountered
instorage
containersw
eredisturbingly
high,especially
inlight
of
thefact
thatless
than10%
· of
householdsboiled
orfiltered
theirw
aterprior
todrinking.
Also,
thisin-hom
econtam
inationreflects
am
oregeneral
fmding
thatthe
householdw
aterproblem
so
fG
AM
Alie
more
inaccess
andits
effectson
hygienethan
inw
aterquality
problems
atthe
tap.C
ompared
toother
areaso
fGhana,
water
accessis
relativelygood.
About
halfo
fthe
householdshad
aw
atersource
intheir
housecom
pound,and
95%o
fhouseholds
hada
drinkingw
atersource
within
100m
etreso
ftheir
home.
The
resultssuggest,
however,
thateven
thedifference
between
havingw
aterin
thehouse
compound
andhaving
tofetch
itfrom
ashort
distanceaw
aybears
arelation
tohealth.
Am
onghouseholds
with
small
children,the
prevalenceo
fchildhood
diarrhoeaw
as7%
when
therew
asa
water
sourcein
thehouse
compound,
ascom
paredto
20%w
henthere
was
not.T
hesam
ehouseholds
who
hadno
water
sourcein
thehouse
compound
may
alsoface
otherrisk
factors,but
thereis
goodreason
tobelieve
thatdifficulties
inobtaining
water
area
contributingfactor.
Having
tofetch
water
reducesw
aterconsum
ption,thereby
creatingvarious
hygieneproblem
s.W
atersupply
interruptionsare
comm
onthroughout
GA
MA
,and
areless
dependenton
wealth
thanis
thelocation
ofthew
atersource.
As
aresult,
almost
allhouseholds
hadsom
efonn
of
water
storagein
theirhom
e.T
heoverhead
tankw
asthe
most
comm
oncontainer
among
wealthy
households,w
hilethe
barrelw
asthe
most
comm
onam
ongpoor
andm
edium-w
ealthhouseholds.
Buckets
were
alsopopular
among
thepoor,
andpots
areused
bysom
e6%
.B
yincreasing
theneed
tostore
water,
water
irregularitiesare
contributingto
water
contamination
problems.
Moreover,
bycreating
periodicw
atershortages,
water
interruptionscan
leadto
hygieneproblem
s.T
hism
ayexplain
why,
inthe
healthresults
describedbelow
,households
facingregular
water
interruptionsw
erealso
foundto
havea
higherprevalence
ofchildhood
diarrhoea.F
orthe
poor,access
tow
ateris
furthercom
promised
bythe
pricingsystem
.T
heofficial
water
tariff isintended
tobe
progressive,w
ithhigher
pricescharged
tohigh-volum
econsum
ers.T
hisintention
isunderm
inedby
thefact
thatpoor
householdsare
more
likelyto
sharew
aterconnections,
therebyincreasing
thew
ateruse
perconnection.
More
significant,them
ostcomm
onw
atersource
among
poorhouseholds
was
water
vendors,w
hocharge
significantlym
orethan
thehighest
tarifflevel,
althoughthe
purchaserstypically
collectedthe
water
themselves.
Vendors
servean
important
rolein
thew
aterdistribution
system,
butin
conditionso
fgeneralw
aterscarcity,those
who
purchasefrom
vendorslose
out.
Sanitationa
nd
Hygiene
-C
onditions:G
AM
Ahas
two
of
thethree
publicw
ater-bornesew
eragesystem
sin
thecountry,
butexceptin
theplanned
township
ofT
ema,
onlya
verysm
allshare
of
householdsare
served.T
hisis
reflectedin
thetypes
of
toiletsused:
36%used
flushtoilets,
31%
conventionalpit
latrines(broadly
defined),10%
Kum
asiV
entilatedIm
provedP
it(KV
IP)
latrines,20%pan
latrines,and
about3%
hadno
accessto
atoilet
atall.

xE
nvironmental
Problem
sand
theU
rbanH
ouseholdin
theG
AM
A-G
hana
Flush
toiletsw
ereused
byalm
ostall
of
thew
ealthyhouseholds
andm
osto
fthe
medium
-wealth
households,m
anyo
fw
hichhave
septictanks.
Pitlatrines
orpan
latrinesw
ereused
bym
ostpoor
households.·Households
with
flushtoilets
hada
considerablylow
erprevalence
of
childhooddiarrhoea
thanthose
usingother
typeso
ffacilities,
thoughthis
may
bea
reflectiono
fthe
crowding
of
theseother
facilities.W
hilethe
sanitationtechnology
profilem
aybe
superficiallysuperior
tothat
of
therest
of
Ghana,
crowding
hascreated
aserious
sanitationproblem
fora
largeshare
of
GA
MA
'spopulation.
Alm
ostthree
outo
ffour
householdsshared
theirtoilet,
andabout
41%
reliedon
comm
unalfacilities
opento
thew
holeneighbourhood.
The
comm
unalfacilities
areso
overcrowded
thatalm
osttw
oout
of
threeusers
claimed
thatthere
were
times
when
thesetoilets
were,
ineffect,
unusable(e.g.
theyw
ereout-of-order
orthe
queuesw
eretoo
long).R
esidentso
fG
a,the
peri-urbandistrict,
reliedm
oreheavily
onconventional
pitlatrines
thanresidents
of
Accra
orT
ema
Districts,
butless
oftencom
plainedthat
theirtoilets
were
unusable.T
hisprobably
reflectsa
more
generalphenom
enon.T
oiletsin
GA
MA
may
betechnologically
superiorto
thosein
otherparts
ofG
hana.F
ora
small
elitew
ithprivate
flushtoilets
conditionsare
indeedbetter.
But
forthe
poor.m
ajority,crowding
more
thanelim
inatesany
technologicaladvantage.
Crow
dingo
fsanitary
facilitiescreates
problems
onat
leasttw
ofronts.
On
theone
handthe
conditionso
fthe
toiletsdeteriorate.
This
was
evidentin
thehigher
prevalenceo
fdirty
floors,flies
andother
indicatorsof
unhygienicconditions
inthe
more
widely
sharedtoilets.
On
theother
hand,crow
dingcan
leadto
opendefecation,
which
isitself
agreater
publichealth
riskin
more
denselypopulated
areas.A
bouthalf
of
theadults,
onfinding
theirusual
toiletunusable,
saythat
theyused
anothertoilet.
Athird,
however,
usedopen
landor
abeach
undersuch
circumstances.
One
would
expectm
oreopen
defecationam
ongchildren,
astheir
knowledge
of
personalhygiene
andneed
forprivacy
islow
er.Y
etchildren
arem
orevulnerable,
andtheir
faecesa
greaterhealth
risk.O
verall,36%
of
householdssaid
childrenin
theirneighbourhood
sometim
espractised
opendefecation,
with
thehighest
percentagesin
poorareas.
Both
crowding
of
sanitaryfacilities
andopen
defecationby
neighbourhoodchildren
were
associatedw
ithhigher
prevalenceso
fchildhood
diarrhoea.T
hecosts
of
usingsanitary
facilitiesplace
asignificant
burdenon
po
or
households,despite
theinadequacy
of
theirfacilities.
Atypical
chargefor
acom
munal
latrinew
as5
cedisper
use,and
anadditional
5for
toiletpaper
(anda
penaltyon
theorder
of20
cedisfor
thosew
hobring
excretain
pans).M
ost(82%
)o
fhouseholds
payinguser
feesincurred
costso
fbetw
een10
and60
cedisper
day.R
elativelyfew
householdscited
costas
areason
fornot
always
beingable
touse
theirusual
toilet.N
evertheless,one
canassum
ethat
thesecosts,
which
aresom
etimes
intendedto
covernot
onlym
aintenanceo
fthe
facilitiesbut
alsoother
environmental
maintenance,
arecontributing
tothe
opendefecation
problems.
More
generally,hygiene
inG
AM
Ais
notsim
plya
matter
of
householdhabits:
itisintim
atelylinked
tothe
water
andsanitation
conditions.O
pendefecation
isjust
oneexam
ple.M
uchthe
same
appliesto
handw
ashingpractices,
thoughin
thiscase
thelin
kis
with
water
ratherthan
sanitaryfacilities.
The
resultsindicate
thatw
hilefactors
likeeducation
may
beassociated
with
betterhand
washing
practices,the
typeofw
atersupply
hasan
independentandprobably
more
significanteffect.

Benneh
etai.xi
SolidW
aste-
Conditions:
Solid
waste
disposalis
notas
important
tohealth
asw
aterand
sanitation,but
hasbecom
eone
of
them
oreintractable
environmental
managem
entproblem
s.D
espiterecent
upgrading,the
Waste
Managem
entD
epartment
isstill
onlycapable
of
collectingsom
e60%
of
refuse.O
nlyabout
10%o
fthe
surveyedhouseholds
hadhom
ecollection,
thoughthe
sharerose
to39%
among
wealthy
households.M
ostdum
pedtheir
waste
locally,about
70%at
collectionpoints
orofficial
dumps,
and13%
onem
ptyland
orother
unofficialsites.
The
firstpoint
atw
hichsolid
waste
canbecom
ea
problemis
within
thehom
e.O
penstorage
of
solidw
astew
aspractised
bysom
e42%
ofhouseholds,
andw
asassociated
with
ahigher
prevalenceo
fflies
androdents.
Outdoor
storageo
fw
astein
thehouse
compound
was
relativelyrare,
reflectingin
partthe
lowlevel
of
home
collection.A
ccumulations
of
waste
within
theneighbourhood
arethe
most
visibleproblem
inthis
sector.E
vencollection
pointsand
officialdum
pscan
become
environmental
hazards,especially
giventhe
veryinterm
ittentcollection,
andthe
tendencyfor
faecalm
aterialto
become
intermixed
with
householdrefuse.
Alm
osthalf
of
thehouseholds
perceivedlocal
accumulations
of
solidw
asteto
bea
problem,
andm
orethan
onethird
mentioned
opendum
psites
intheir
neighbourhoodw
herew
astew
entuncollected
fora
week
orm
ore.In
additionto
beingunsightly
andgenerally
unpleasant,such
sitesare
ahealth
riskfor
children,exacerbating
flyand
rodentproblems,and
when
washed
away
canblock
thedrains.
Finalw
astedisposal
isalso
aproblem
.T
hem
ostcom
mon
method
isdum
pingin
pits,designated
aslandfIlls
butactually
littlem
orethan
opendum
ps.M
ostexisting
siteshave
alreadybeen
usedup
to,or
beyond,capacity,
andthere
isan
urgentneed
fornew
sites.U
nlikew
ateror
sanitation,the
wealthy
payconsiderably
more
forw
astedisposal
thanthe
poorerhouseholds.
This
isnot
onlybecause
thecharge
forhom
ecollection
isconsiderably
higherthan
thatfor
usinga
collectionsite,
butalso
becausem
osthouseholds
who
donot
havehom
ecollection
donot
actuallypay
thefee
forusing
officialsites.
Pests
an
dP
esticides-
Conditions:
Malarial
mosquitoes
remain
am
ajorhealth
hazardin
GA
MA
.W
hilepast
urbanizationhas
lowered
theincidence
of
malaria
inG
AM
A,
thereis
noreason
toassum
ethis
trendw
illcontinue
unaided.P
aststudies
suggestthat
some
malarial
mosquitoes
areadapting
toG
AM
A's
urbanenvironm
ent,w
ith,for
example,
increasedbreeding
inhousehold
water
containers.W
hileonly
arelatively
small
shareo
fthe
mosquitoes
arem
alarialspecies,
malaria
remains
byfar
them
ostfrequently
reportedhealth
problematout-patientfacilities.
Moreover,continual
urbanw
ateruse
combined
with
poordrainage
hascreated
asituation
where
mosquitoes
arecom
mon
throughoutthe
year.A
lmost
allhouseholds
surveyedsaid
theyw
ereat
leastoccasionally
bittenby
mosquitoes
indoorsat
nightthroughout
theyear,
with
aboutthree
outo
ffour
beingbitten
regularlyin
bothw
etand
dryseasons.
Excluding
householdsw
ithfull
screening,the
responsesw
erequite
similar
indifferent
areaso
fthe
cityand
among
poorand
wealthy
households.B
arringexplicit
effortsto
controlm
osquitoes,the
onlyinfluential
factorw
asindoor
water
storage,w
hichw
asassociated
with
more
mosquito
biting.W
hilethis
shouldnot
betaken
tosuggest
thatthe
risko
fm
alariais
similar
throughoutthe
city(the
prevalenceo
fm
alarialm
osquitoesis
likelyto
be

Xli
Environm
entalProblem
sa
nd
theU
rbanH
ouseholdin
theG
AM
A-G
hana
more
variedthan
thato
fm
osquitoesin
general),it
doeshelp
explainthe
widespread
concern.A
lso,if
thepresence
of
malarial
mosquitoes
breedingin
householdw
atercontainers
isincreasing,
these[m
dingsalso
indicatethat
indoorw
aterstorage
may
be
increasingm
alariaprevalence.
House
fliesare
alsoknow
nto
bea
healthrisk,
especiallygiven
generallyunsanitary
conditions.T
heresults
of
thesurvey
indicatethat
thisrisk
shouldbe
takenseriously:
childhooddiarrhoea
prevalencew
asconsiderably
higherin
householdsw
ithm
oreflies
intheir
kitchenso
rtoilets.
House
fliesw
erecom
mon
inall
neighbourhoods,iIiboth
kitchensand
toilets.T
heprevalence
of
houseflies
was
considerablyhigher
among
po
or
householdsthan
wealthy
households,how
ever.T
hus,for
example,
more
thanfour
outo
ffive
wealthy
householdssaid
theyalm
ostnever
hadflies
intheir
toilets,com
paredto
aboutone
poorhousehold
inseven.
Environm
entalm
anagement
tocontrol
insectsis
notgenerally
practisedin
GA
MA
.H
owever,
about90%
of
thehouseholds
usedsom
eform
of
insectcontrol,
principallyfor
mosquitoes.
The
most
popularm
ethodsinclude
screening,m
osquitocoils,
andaerosol
andpum
pinsecticides.
Mosquito
coilsare
them
ostcom
mon
means
of
controlam
ongp
oo
rhouseholds,
while
screeningand
sprayinsecticides
arem
orecom
mon
among
wealthy
households.T
heuse
of
chemicals
tocontrol
insectscreates
itso
wn
healthrisks.
The
childhoodprevalence
of
acuterespiratory
infection(o
rat
leastreported
symptom
sthereof)
was
significantlyhigher
when
mosquito
.coilsw
ereused.
Am
ongthe
principalw
omen
of
thehouseholds,
who
were
likelyto
bethe
onesapplying
thepesticides,
theprevalence
of
respiratoryproblem
symptom
sw
ashigher
where
pump-spray
insecticidesw
ereused.
Food
Contam
ination-
Conditions:
Fo
od
canb
echem
icallyo
rm
icrobiallycontam
inated.T
hisreport
isonly
concernedw
iththe
latter.M
ost
householdsin
GA
MA
obtaintheir
foodfrom
openm
arkets,w
herethe
riskso
fcontam
inationare
significant.P
reparedvendor
foodis
likelyto
posethe
highestrisks,
however.
Most
householdspatronised
vendorso
fprepared
foodregularly,
bu
tthe
percentagew
aslow
eram
ongw
ealthyhouseholds.
Also,
thefoods
purchasedby
po
or
householdsw
erem
orelikely
tofall
intopotentially
highrisk
categories.O
verall,the
prevalenceo
fchildhood
diarrhoeaw
asroughly
twice
ashigh
among
householdsw
hopatronised
foodvendors.
Fo
od
contamination
anddeterioration
inthe
home
isalso
aconcern.
As
indicatedabove,
fliesin
thekitchen
posea
healthrisk,
principallydue
tothe
dangerso
ffood
contamination.
Serving
coldleftovers
isalso
apotential
risk,b
ut
well
under10%
of
thehouseholds
saidthey
didso
regularly,and
therew
asno
associationw
ithdiarrhoea
prevalence.F
oo
dstorage
practicesvaried
widely.
Fo
rexam
ple,w
hilevirtually
allw
ealthyhouseholds
storedm
eatin
refrigerators,alm
osthalf
of
thep
oo
rhouseholds
who
hadm
eatto
storesim
plyused
coveredbow
ls.A
gain,how
ever,there
was
noclear
associationw
ithdiarrhoea
prevalence.Q
uitepossibly,
theprincipal
effectis
thatp
oo
rhouseholds
storefoods
lesslong:
aconsiderably
highershare
of
po
or
householdssaid
thatleftover
foodw
ouldspoil
inless
thantw
elvehours
thandid
wealthy
households.H
ouseholdsw
ithsick
childrenw
erem
oreinclined
toblam
efood
eatenoutside·
thehouse
thanfood
preparedat
home.
Indeed,28
of
the72
householdsw
hosechildren
hadrecently
haddiarrhoea
identifiedfood
eatenout
asthe
probablecause.
While
thisis
likelyto
bea
farhigher
sharethan
thosew
hoactually
contracteddiarrhoea
fromsuch
food,it
doesindicate
considerableaw
arenesso
fthe
dangerso
ffood
contamination.

Benneh
etal.xiii
Household
Smoke
(andC
rowding)
-C
onditions:C
ookingfuels
arethe
most
significantsource
of
householdair
pollutionin
GA
MA
.H
ouseholdsnot
onlyuse
arange
of
fuels,but
individualhouseholds
typicallyuse
more
thanone.
Charcoal
was
theprincipal
cookingfuel
for69%
of
thehouseholds
surveyed,follow
edby
bottledgas
orL
PG
(14%),
fuelwood
(8%),
kerosene(6%
),and
electricity(3%
).G
enerally,the
wealthier
householdsused
cleanerfuels.
Past
studiessuggest
thatrespirable
particulateconcentrations
arelikely
tobe
highestam
ongfuelw
oodusers,
followed
bycharcoal,
kerosene,L
PG
andelectricity.
These
areprecisely
thehousehold
preferencessuggested
bythe
relationshipbetw
eenfuel
choiceand
wealth,
with
charcoaland
wood
thetw
oprincipal
fuelso
fp
oo
rhouseholds,
charcoaland
LP
Gthe
principalfuels
of
medium
wealth
households,and
LP
Gand
electricitythe
principalfuels
of
thew
ealthy.H
owever,
evenL
PG
andelectricity
usersoften
alsouse
charcoal,w
hichw
asused
atleast
intermittently
by81
%o
fthe
households.P
articulateexposure
measurem
entsundertaken
forthis
studyindicate
thatw
oodusers
areindeed
them
ostexposed,
followed
bycharcoal
usersand
[mally
kerosene,L
PG
andelectricity
users(these
lastthree
fuelsw
erecom
bineddue
tosm
allsub-sam
ples).T
helevels
encounteredam
ongw
oodand
charcoalusers
were
significantlyhigh
soas
toraise
concernabout
healtheffects.
Carbon
monoxide
exposurew
ashighest
among
charcoalusers,
followed
byw
oodusers.
Again,
levelsw
eresufficiently
highto
raiseconcern,
butw
erenot
ashigh
assom
estudies
inother
locationshave
encountered.In
additionto
cookingfuels,
exposuredepends
uponcooking
practices.A
mong
po
or
householdsseparate
kitchensare
rare,though
inthe
ruralfringe
cookinghuts
arecom
mon.
How
ever,m
ostw
oodand
charcoalusers
cookoutdoors,
atleast
when
itis
notraining.
Children's
exposurealso
dependson
whether
theyare
presentduring
cooking.A
mong
householdsw
ithsm
allchildren,
25%usually
hadchildren
presentduring
cooking,and
most
hadchildren
presentat
leastoccasionally._
While
therelationship
between
respiratoryproblem
sand
cookingfuel
choicew
asnot
statisticallysignificant,
perhapsdue
tothe
predominance
of
charcoal,use
patternsdid
displaysignificant
associations.A
mong
wom
en(principal
homem
akers)the
prevalenceo
frespiratory
problemsym
ptoms
was
higheram
ongthose
usinga
cookinghut.
Itw
asalso
higheram
ongthose
who
nevercooked
outof-doors.
Am
ongchildren,
symptom
so
facute
respiratoryinfection
were
more
comm
onw
henchildren
were
usuallypresentduring
cooking.
Health
an
dE
nvironmentalR
iskF
actorsB
etween
1987and
1990,m
alaria,upper
respiratorytract
infections,and
diarrhoeaw
ereconsistently
thethree
most
comm
onlyreported
healthproblem
sat
out-patientfacilities
inthe
Greater
Accra
Region.
All
threeare
alsoclosely
relatedto
avariety
of
environmental
factors.A
sustainedanalysis
of
malaria
andits
associationw
ithenvironm
entalconditions
isbeyond
thescope
of
thisstudy:
selfdiagnosis
of
malaria
isnotoriously
inaccurate,households
cannotidentify
malarial
mosquito
species,and
neitherblood
testsnor
mosquito
countsw
ereundertaken
duringthe
survey.B
othrespiratory
problems
anddiarrhoea
arethe
outcome
of
complex
combinations
of
interrelatedfactors,
buttheresults
ofthis
studyclearly
indicatethe
importance
ofenvironm
entalinadequacies.

xivE
nvironmental
Problem
sand
theU
rbanH
ouseholdin
theG
AM
A-G
hana
The
prevalenceo
fdiarrhoea
among
childrenunder
sixw
as,not
surprisingly,associated
with
wealth
andtype
ofresidential
area:w
ealthyhouseholds
andhouseholds
inhigh
classareas
hadconsiderably
lesschildhood
diarrhoea.T
heresults
suggestthat
most
of
thesedifferences
arerelated
tothe
environmental
conditionshouseholds
face.In
am
ultifactorialstatistical
analysiso
fchildhood
diarrhoeaprevalence,
allof
thefollow
ingw
erefound
tobe
significantlyassociated
with
higherdiarrhoea
prevalence:
1.Sharing
toiletw
ithm
orethan
5other
households.2.
Using
potforstoring
water.
3.Storing
water
inan
opencontainer.
4.O
utdoordefecation
byneighbourhood
children5.T
hepresence
ofm
anyflies
inthe
cookingarea.
6.N
otalways
washing
handbefore
preparingfood.
7.E
xperiencingw
aterinterruptions
atcertaintim
eso
fday.8.B
uyingprepared
foodfrom
vendors.
Once
theserisk
factorsw
ereincluded
inthe
analysis,social
andeconom
icfactors
were
nolonger
significant.O
fthe
69households
with
small
childrenw
hofaced
atm
ostone
of
theserisk
factors,there
were
norecent
caseso
fdiarrhoea.
Of
the102
householdsfacing
more
thanfour
riskfactors,
37had
childreriw
hohad
haddiarrhoea
inthe
pasttwo
weeks.
Sym
ptoms
of
acuterespiratory
infectionin
youngchildren
were
alsom
oreprevalent
among
poorhouseholds
andin
lowclass
areas,though
thedifferences
were
notas
striking.A
gainthe
resultssuggest
thatthese
differencescould
bedue
toenvironm
entalconditions.
Inthis
case,the
following
riskfactors
were
foundto
besignificantin
them
ultivariateanalysis:
1.Children
oftenpresent
duringcooking.
2.P
resenceo
fmany
fliesin
thecooking
area.3.L
essthan
foursquare
meters
perperson
inthe
most
crowded
sleepingroom
.4.
Experiencing
water
interruptionsatcertain
times
ofday.5.U
singm
osquitocoils
6.N
evercooking
outdoors7.
Leaky
roof.
Again,
socialand
economic
factorsw
ereno
longersignificant
oncethese
riskfactors
were
included.A
mong
the51
householdsfacing
atm
ostone
riskfactor,
therew
eretw
oin
which
youngchildren
hadhad
acuterespiratory
infectionsym
ptoms
inthe
pasttw
ow
eeks.A
mong
the107
householdsfacing
fiveor
more,
therew
ere29.
Respiratory
problemsym
ptoms
inthe
principalw
omen
of
thehouseholds
boreno
clearassociation
with
eitherthe
wealth
ofthehousehold
orthe
typeo
farea
they.lived
in.V
ariousenvironm
entalrisk
factorsw
eresignificant,
however,
andseveral
of
thesefactors
were
notso
prevalentam
ongpoor
households(it
isalso
possible,as
otherstudies
of
Accra
havesuggested
inthe
past,that
wealthy
respondentsare
more
likelyto
reportm
inorhealth
problems).
More
specifically,the
following
riskfactors
were
foundto
besignificant:

Benneh
etal.
1.S
moking
cigarettes2.
Using
pump-spray
insecticides3.E
xperiencingw
aterinterruptions
atcertaintim
eso
fday.
4.N
ever
cookingoutdoors
5.L
eakyroof.
xv
While
fewer
significantfactors
were
identifiedthan
inthe
previoustw
oexam
ples,the
healthdifferences
remain
striking.O
fthe
79w
omen
notexposed
toany
riskfactors,
sixhad
respiratoryproblem
symptom
s,ascom
paredw
ith56
of
the178
wom
enw
hofaced
threeor
more
riskfactors.
Itis
important
notto
overinterpret
individualfactors.
Som
ecould
reflectother,
unmeasured,
factors.T
hepresence
of
flies,for
example,
couldbe
anindicator
of
generallypoor
sanitaryconditions.
Som
efactors
couldbe
statisticallysignificant
just
bychance
(thoughvirtually
bydefinition
theprobability
of
thisoccurring
arerelatively
small).
How
ever,taken
togetherthe
resultsclearly
illustratethe
importance
of
environmental
improvem
entto
thehealth
of
theresidents
of
Accra,
andparticularly
thechildren.
Environm
entalValues
an
dH
ouseholdE
conomics
Th
evalues
therespondents
placedon
environmental
improvem
ents(ascertained
throughcontingent
valuationquestions)
were
atleast
roughlyconsistent
with
existingknow
ledgeo
fthe
healthburdens
imposed.
Malaria
isthe
most
evidenthealth
problem,
andinsect
controlw
asthe
most
valuedim
provement.
Diarrhoea
isalso
am
ajorhealth
problem,
andw
aterim
provements
were
alsohighly
valued.(S
anitationim
provements
were
notincluded
inthe
survey,but
thereis
everyindication
thatthey
toow
ouldhave
beenhighly
valued.)A
irquality
improvem
entsw
ereless
highlyvalued,
despitethe
importance
of
respiratoryinfection.
How
ever,the
linkbetw
eenair
pollutionand
respiratoryproblem
sm
ayw
ellbe
lesssignificant
thanthat
between
water
anddiarrhoea.
Solid
waste
collectionw
asquite
highlyvalued,
despitehaving
avery
uncertainlink
tohealth.
Inthis
case,it
isprobably
bestto
assume
thathealthw
asnotthe
principalm
otivation.T
heresults
supportthe
notionthat
peopleplace
considerablevalue
onenvironm
entalim
provements,
andare
willing
tom
akesignificant
economic
concessionsin
orderto
achievethem
.T
heeconom
icburden
of
payingfor
existingenvironm
entalservices
isconsiderable.
Inseveral
cases(e.g.
water)
po
or
householdsare
alreadypaying
highprices
foran
inadequateam
enity.U
ndersuch
circumstances,
itis
anindication
of
theim
portancepeople
attachto
thehousehold
environment
thatm
ostare
willing
topay
stillm
orefor
improvem
ents.H
owever,
itis
unrealisticto
expectto
achieveadequate
home
andneighbourhood
environments
without
significantim
provements
inthe
economic
statuso
fthe
majority
of
households.A
bilityto
payis
clearlya
major
constraint,especiallyin
poorareas.
On
theother
hand,even
ifhouseholds
valueenvironm
entalbenefits,
individuallythey
oftenhave
relativelylittle
controlover
theenvironm
entthey
face.Indeed,
theim
mediate
economic
incentivem
aybe
todegrade
theenvironm
ent,despite
thecosts
thisincurs
onothers.
Such
problems
arisein
po
or
asw
ellas
wealthy
areas.O
utdoordefecation
inan
urbansetting,
forexam
ple,is
inpart
asym
ptomo
fsevere
poverty.B
ut
itis
alsoan
indicationthat
individualand
collectiveinterests
arenot
inharm
ony.S
imilarly,
inadequatew
ateraccess
may
besym
ptomatic
of
poverty,but
povertydoes
notdictate
thatw
aterprices
shouldbe

XV
IE
nvironmental
Problem
sand
theU
rbanH
ouseholdin
theG
AM
A-G
hana
especiallyhigh.
Econom
icssuggests
thatsom
eform
of
collectiveaction
may
berequired
when
publicbenefits
areinvolved.
Justas
householdsseem
edto
placea
higherpriority
onim
provements
which
would
havea
major
healthim
pact,so
alsohouseholds
tendedto
identifya
needfor
more
collectiveaction
them
orepublic
thebenefits.
Respondents
were
askedw
hetherthey
feltaction
was
requiredin
eachofthe
majorproblem
areascovered
inthe
survey,and
ifso
whether
theythought
individualaction,
neighbourhoodaction
orgovernm
entaction
was
mostim
portant.Indoor
airim
provement,
which
benefitslargely
thehousehold
making
theim
provement,
was
seenprincipally
asa
householdaffair.
For
otherproblem
s,the
respondentsm
ostoften
identifieda
needfor
government
action,though
neighbourhoodaction
receivedconsiderable
supportforgarbage,
insectandespecially
sanitationproblem
s.
InstitutionalAspects
ofU
rbanE
nvironmentalM
anagement
Environm
entalm
anagement
institutionsrange
fromgovernm
entagencies
andutilities
tothe
householdsthem
selves,and
includea
number
ofcritical
intermediate
institutions.E
venconventional
environmental
services,such
asw
ater,sanitation
andsolid
waste
disposal,are
more
oftenprovided
togroups
ofhouseholds
thanto
individualhomes.
Especially
inpoor
areas,thisis
likelyto
remain
thecase
forsom
etim
eto
come.
This
hascreated
asituation
inw
hichco-ordination
among
institutionsis
ascriticalto
environmental
managem
entastheir
individualefficiency.T
hegovernm
entalready
hasa
keyrole
inenvironm
entalm
anagement,
andits
rolein
environmental
managem
entislikely
toincrease
relativeto
many
of
itsother
more
traditionalroles.
More
thanhalf
of
thegovernm
entm
inistriesare
directlyinvolved
inone
way
oranother
inurban
environmental
managem
ent.T
heM
inistryo
fF
inanceand
Econom
icPlanning
hasthe
overalltask
of
allocatingfunds
forresearch
intoenvironm
ent-relatedissues
andfor
theexecution
of
environmental
actionplans.
The
Ministry
of
Works
andH
ousinghas
atleast
asupervisory
rolein
almost
allpublic
constructionactivities,
andthe
Ghana
Water
andS
ewerage
Corporation
isa
serviceagency
within
thism
inistry.W
ithinthe
Ministry
ofL
ocalG
overnment,the
Tow
nand
Country
Planning
Departm
enthasthe
responsibilityfor
ensuringthe
planneddevelopm
ento
fthe
metropolis,
while
theE
nvironmental
Protection
Council
isresponsible
forensuring
thatdevelopm
entprojects
takeproper
measures
toavoid
environmental
destruction.T
heD
istrictA
ssemblies
ofA
ccra,T
ema
andG
ahave,
among
theirresponsibilities,
thato
fgeneral
managem
ento
fw
asteand
sanitation.C
o-ordinatingthe
activitieso
fthe
numerous
ministries
anddifferent
levelso
fgovernm
entis
aform
idabletask.
The
currentclim
ateo
ffm
ancialausterity
makes
efficientco-ordination
allthe
more
important.
How
ever,just
asim
portant,these
numerous
governmental
institutionsm
ustinteract
with
thefar
more
numerous
andever
changingnon-governm
entalinstitutions.
The
localinstitutionsinvolved
inenvironm
entalm
anagement
varyconsiderably
inim
portancefrom
neighbourhoodto
neighbourhood,but
tendto
bem
oresignificant
inlow
-wealth
areas.In
anum
berof
areas,political
groups(C
omm
ittees.for
theD
efenceo
fthe
Revolution
orC
.D.R
.s)took
theinitiative
inthe
early1980s,
organisingnot
onlythe
provisiono
fsanitary
facilities,but
aw
iderange
of
environmental
improvem
entactivities.Som
ehave
beennotably
successful,notonly
inorganising
improvem
entefforts,
butalso
ingenerating
localsupport
forenvironm
entalm
anagement.
C.D
.R.s
areby
nom
eansthe
onlylocal
groupsinvolved
inenvironm
entalm
anagement,
however,
andgiven
currentpolitical
and
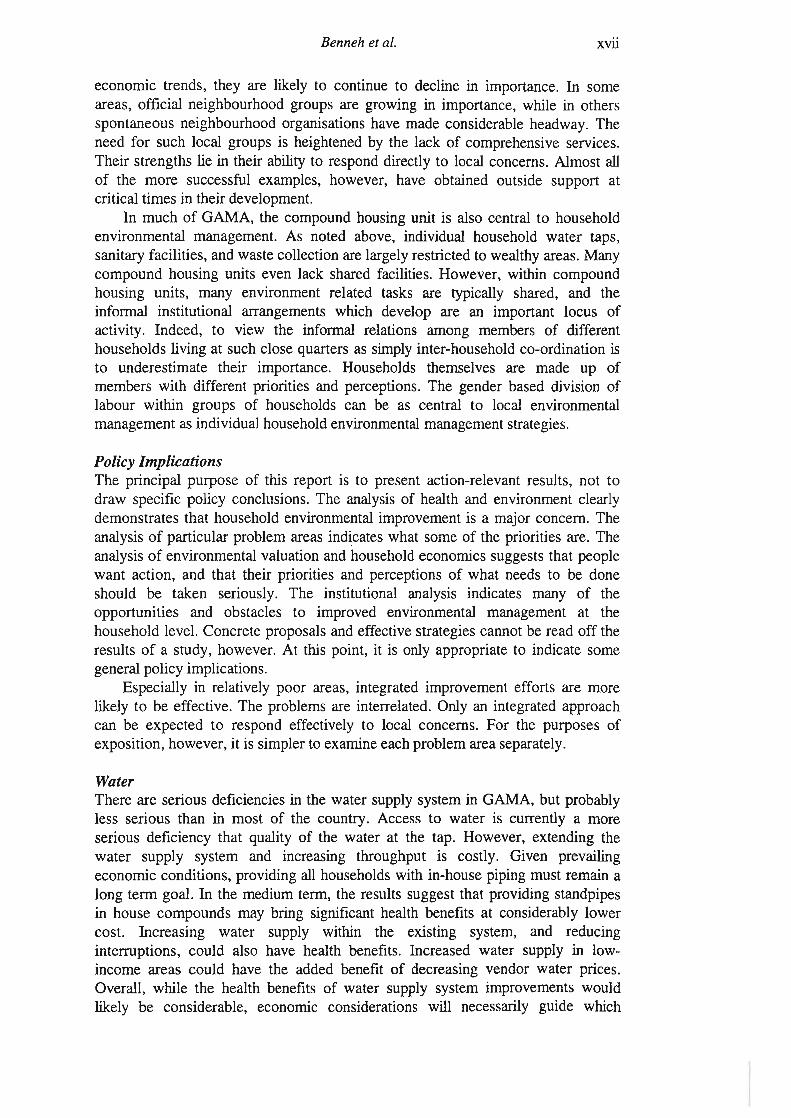
Benneh
etal.xvii
economic
trends,they
arelikely
tocontinue
todecline
inim
portance.In
some
areas,official
neighbourhoodgroups
aregrow
ingin
importance,
while
inothers
spontaneousneighbourhood
organisationshave
made
considerableheadw
ay.T
heneed
forsuch
localgroups
isheightened
bythe
lacko
fcom
prehensiveservices.
Their
strengthslie
intheir
abilityto
responddirectly
tolocal
concerns.A
lmost
allo
fthe
more
successfulexam
ples,how
ever,have
obtainedoutside
supportat
criticaltimes
intheir
development.
Inm
ucho
fG
AM
A,
thecom
poundhousing
unitis
alsocentral
tohousehold
environmental
managem
ent.A
snoted
above,individual
householdw
atertaps,
sanitaryfacilities,
andw
astecollection
arelargely
restrictedto
wealthy
areas.M
anycom
poundhousing
unitseven
lackshared
facilities.H
owever,
within
compound
housingunits,
many
environment
relatedtasks
aretypically
shared,and
theinfonnal
institutionalarrangem
entsw
hichdevelop
arean
important
locusof
activity.Indeed,
toview
theinfonnal
relationsam
ongm
embers
of
differenthouseholds
livingat
suchclose
quartersas
simply
inter-householdco-ordination
isto
underestimate
theirim
portance.H
ouseholdsthem
selvesare
made
upo
fm
embers
with
differentpriorities
andperceptions.
The
genderbased
divisiono
flabour
within
groupso
fhouseholds
canbe
ascentral
tolocal
environmental
managem
entasindividualhousehold
environmental
managem
entstrategies.
Policy
Implications
The
principalpurpose
of
thisreport
isto
presentaction-relevant
results,not
todraw
specificpolicy
conclusions.T
heanalysis
ofhealth
andenvironm
entclearly
demonstrates
thathousehold
environmental
improvem
entis
am
ajorconcern.
The
analysiso
fparticular
problemareas
indicatesw
hatsom
eof
thepriorities
are.T
heanalysis
of
environmental
valuationand
householdeconom
icssuggests
thatpeople
want
action,and
thattheir
prioritiesand
perceptionso
fw
hatneeds
tobe
doneshould
betaken.
seriously.T
heinstitutional
analysisindicates
many
ofthe
opportunitiesand
obstaclesto
improved
environmental
managem
entat
thehousehold
level.C
oncreteproposals
andeffective
strategiescannot
beread
offthe
resultso
fa
study,how
ever.A
tthis
point,it
isonly
appropriateto
indicatesom
egeneral
policyim
plications.E
speciallyin
relativelypoor
areas,integrated
improvem
entefforts
arem
orelikely
tobe
effective.T
heproblem
sare
interrelated.O
nlyan
integratedapproach
canbe
expectedto
respondeffectively
tolocal
concerns.F
orthe
purposesof
exposition,however,itis
simpler
toexam
ineeach
problemarea
separately.
Water
There
areserious
deficienciesin
thew
atersupply
systemin
GA
MA
,but
probablyless
seriousthan
inm
osto
fthe
country.A
ccessto
water
iscurrently
am
oreserious
deficiencythat
qualityo
fthe
water
atthe
tap.H
owever,
extendingthe
water
supplysystem
andincreasing
throughputis
costly.G
ivenprevailing
economic
conditions,providing
allhouseholdsw
ithin-house
pipingm
ustrem
aina
longtenn
goal.In
them
ediumterm
,the
resultssuggest
thatproviding
standpipesin
housecom
poundsm
aybring
significanthealth
benefitsat
considerablylow
ercost.
Increasingw
atersupply
within
theexisting
system,
andreducing
interruptions,could
alsohave
healthbenefits.
Increasedw
atersupply
inlow
incom
eareas
couldhave
theadded
benefito
fdecreasing
vendorw
aterprices.
Overall,
while
thehealth
benefitso
fw
atersupply
systemim
provements
would
likelybe
considerable,econom
icconsiderations
will
necessarilyguide
which

xviiiE
nvironmentalP
roblems
andthe
Urban
Household
inthe
GA
MA
-Ghana
measures
oughtto
betaken.
Even
disregardingcostly
improvem
entefforts,
theresults
clearlydem
onstratethat
theexisting
systemplaces
thegreatest
healthburden
onthe
poorhouseholds,
who
alsoend
uppaying
thehighest
pricefor
theirw
ater.T
hisis
verym
uchcounter
tothe
govemm
ent'sintentions,
anddeserves
specialattention.
To
addressthis
problemeffectively
islikely
torequire
institutionalinnovation
cateringto
theparticular
needso
flow
income
householdsliving
predominantly
incom
poundhousing
units.
SanitationO
verall,alleviating
thesanitation
problems
ofG
AM
Ais
clearlya
major
priority.T
hem
ostserious
problemis
theovercrow
dingof
thefacilities.
Ifthe
healtho
fthe
populationis
theprincipal
concem,
increasingthe
quantityo
ftoilet
facilitiesavailable
isprobably
more
criticalthan
introducingim
provedtechnologies.
Improved
maintenance
isalso
important,
butextrem
elydifficult
giventhe
severeovercrow
ding.O
wing
tothe
comm
unalcharacter
of
alarge
shareo
fthe
facilities,the
government
andlocal
comm
unitygroups
arealready
directinvolved
indeterm
iningthe
quantityo
ffacilities
available.M
oresupport
tocom
munity
groupsinvolved
inim
provingsanitary
conditionsw
ouldbe
verybeneficial.
Measures
toincrease
theincentives
forprivate
provisioncould
alsobe
important.
While
sanitaryfacilities
requireboth
landand
investment,
giventhe
healthrisks
of
inadequateprovision,
itseem
slikely
thatthe
benefitsw
ouldbe
substantiallygreater
thanthe
costs.
Hygiene
Hygiene
problems
aresevere,
butare
closlylinked
tow
ater,sanitation
andeven
solidw
asteproblem
s.It
isoften
notedthat
water
andsanitation
improvem
entscan
failw
henhygiene
practicesrem
ainthe
same.
The
resultssuggest
thatthe
reverseis
probablyequally
true.In
anycase,
itis
difficultto
prescribehousehold
hygienehabits.
Education
andaw
arenessprogram
mes
arepotentially
important,
butare
likelyto
befar
more
convincingifaccom
paniedby
improved
conditions.
SolidW
asteW
hilesolid
waste
problems
arenot
apriority
healthconcern,
thecapacity
forsolid
waste
collectionand
disposalrem
ainsw
eak,and
thecosts
ofallow
ingrefuse
toaccum
ulatelocally
areconsiderable.
Effective
arrangements
forhandling
waste
problems
atthe
locallevel
couldhelp
redressat
leastsom
eo
fthe
capacitydeficiencies.
As
with
sanitation,m
anylocal
groupsare
alreadyinvolved
insolid
waste
managem
ent,and
probablydeserve
more
support.H
owever,
itis
difficultto
envisagem
ajorim
provements
inthe
solidw
astesituation
without
increasingthe
collectionand
disposalcapacity.
There
areindications
thatm
osthouseholds
arew
illingto
payfor
improved
solidw
astem
anagement,even
iftheyare
notw
illingto
payfor
poorservice.
Pests
an
dP
esticidesInsects,
andespecially
malarial
mosquitoes,
accountfor
alarge
shareo
fillness
inG
AM
A.
The
resultsindicate
thatim
provements
ininsect
controlare
apriority
forthe
householdsthem
selves.C
urrently,households
arespending
considerablesum
so
fm
oneyon
chemical
insectcontrol.There
issom
edoubt
asto
theeffectiveness
of
.these
measures
inreducing
malaria
prevalence,how
ever.M
oreover,the
useof
thesechem
icalsis
notonly
environmentally
hazardous,but
may
behaving

Benneh
etat.xix
detrimental
effectson
healthtoo.
There
isa
needto
investigatethe
dangerso
fexisting
methods
of
insectcontrol
further.F
urthermore,
newapproaches
toinsect
controlshould
beconsidered.
Environm
entalm
anagement
asa
means
of
controllingm
osquitoescould
proveto
befar
more
costeffective
thanexisting
measures.
As
anurban
area,G
AM
Aalready
standsat
aconsiderable
advantagein
comparison
with
mosto
fGhana:
mostm
alarialm
osquitospecies
arebetter
adaptedto
ruralconditions.E
xploitingthis
advantagecould
yieldm
ajorbenefits.
Food
Contam
inationT
herelative
importance
of
foodcontam
inationto
healthis
difficultto
discern,but
couldbe
considerable.W
omen
with
sickchildren
oftenblam
edfood
eatenoutside
thehom
e,and
therew
ereother
indicationsthat
foodprepared
byvendors
may
becontributing
significantlyto
healthproblem
s.U
nfortunately,governm
entpoliciesto
reducefood
contamination
aredifficult
todevise.
Improved
hygieneeducation
ispossible,
butacting
tocontrol
thepractices
of
foodvendors
isdifficult.
On
theother
hand,som
elocal
groupsare
alreadyacting
toim
provethe
hygieneo
ffood
vendors.P
rovidingsupport
forthese
localactivities
couldw
ellbe
them
osteffective
means
of
improving
foodquality,
especiallyif
combined
with
more
attentionto
foodhygiene
within
educationalactivities.
Household
Air
Pollution
Both
charcoaland
fuelwood,
butespecially
fuelwood,
giverise
topotentially
damaging
levelso
fpollution
exposurefor
wom
enand
childrenin
GA
MA
.H
owever,
conditionsare
probablyw
orsein
otherparts
of
thecountry
where
wood
isthe
predominant
fu~l.P
romoting
theincreased
useof
LP
Gor
electricityfor
cookingw
ouldreduce
exposurefor
thosehouseholds
who
switch
fuels.H
owever,
subsidieslarge
enoughto
influencefuel
choiceare
likelyto
bevery
costly,and
will
benefitprincipally
therelatively
well
offw
hocan
affordthe
necessaryequipm
ent.A
tleast
inthe
shortrun,
improved
cookingpractices,
possiblyin
conjunctionw
ithim
provedstoves,
areo
fmore
relevanceto
thepoor
majority.


Benneh
etat.
CH
AP
TE
RO
NE
1IN
TR
OD
UC
TIO
NT
hisstudy
of
householdenvironm
entalproblem
sin
theG
reaterA
ccraM
etropolitanA
rea(G
AM
A)
isa
component
of
aresearch
projectco-ordinated
bythe
Stockholm
Environm
entInstitute,
andalso
coveringJakarta
(Indonesia)and
Sao
Paulo
(Brazil).
Of
thethree
cities,G
AM
Astands
outas
beingan
ordero
fm
agnitudesm
allerin
population.T
hatdoes
notm
akeits
environmental
problems
anym
oretractable,
however.
Despite
vastdifferences,
notonly
insize,
butalso
ineconom
y,clim
ateand
culture,households
inall
threecities
faceat
leastsuperficially
similar
typeso
fenvironm
entalproblem
s.In
allthree
cities,these
problems
areparticularly
severein
low-incom
eareas.
Inorder
toallow
theresults
tobe
compared
acrossthe
threecities,a
similar
approachw
asadopted
ineach
city.T
hefollow
ingsection
summ
arisesthe
scopeo
fthe
GA
MA
studyand
them
ethodsem
ployed.W
hilethe
kindsofenvironm
entalproblems
householdsin.G
AM
Aface
may
notbe
untypical,their
severity,incidence
andsocio-econom
icbasis
areradically
differentfrom
thosein
theother
citiesstudied.
Following
thediscussion
of
thescope
andm
ethods,this
introductorychapter
continuesw
ithan
overviewo
fthe
urbangrow
thdynam
icso
fG
AM
A,
andthe
localcontext
within
which
householdand
neighbourhoodlevel
environmental
problems
arise.G
hana'srecent
economic
anddem
ographichistory
iscritical
tounderstanding
notonly
thecurrent
situationin
GA
MA
,but,
more
important,
theconstraints
onand
possibilitiesfor
improvem
ent.
1.1Scope
an
dA
pproachT
hisstudy
was
designedto
providea
coherentassessm
ento
fhousehold
environmental
problems
inA
ccra,with
anem
phasison
thoseproblem
sfaced
bythe
poor.T
hestudy
isaction-oriented;
theresearch
isintended
toim
proveunderstanding
Ofhousehold
environmental
problems
andhelp
developstrategies
toalleviate
them.
Various
assessments
of
Accra's
environmental
problems
havebeen
conductedin
thepast
(e.g.E
nvironmental
Managem
entA
ssociates,1989;
Am
uzuand
Leitm
ann,1991).
For
them
ostpart,
suchassessm
entshave
concentratedon
largerscale
environmental
problems,
inpart
becauseo
fa
lacko
finform
ationon
householdand
neighbourhoodlevel.
Yet,
asthe
resultso
fthis
studyclearly
demonstrate,
small
scaleenvironm
entalproblem
scan
havelarge
effects.W
hileperhaps
lesscritical
tothe
environmental
sustainabilityo
fthe
city,these
problems
arecentralto
thehealth
andw
ell-beingo
ftheinhabitants.
1.1.1Scope
The
problemareas
coveredinclude:
water
(Chapter
Tw
o),sanitation
(Chapter
Three);
solidw
aste(C
hapterF
our);pests
andpesticides
(Chapter
Five);food
contamination
(Chapter
Six);and
airpollution
andhousing
conditions(C
hapterS
even).T
hestudy
setsout
toexam
inethe
physicalseverity
of
theseproblem
sam
onghouseholds
with
differingsocio-econom
icbackgrounds
andliving
conditions.W
herepossible,
theanalysis
attempts
todraw
outthe
interconnections,both
among
theenvironm
entalproblem
sand
more
generallyw
ithother
physical,social
andeconom
icconditions.
Som
eo
fthe
healthrisks
associatedw
itheach
ofthe
problemareas
arealso
assessed.

2E
nvironmental
Problem
sand
theU
rbanH
ouseholdin
theG
AM
A-G
hana
Am
oreintegrated
analysiso
fthe
relationbetw
eenenvironm
entalconditions
anddiarrhoea
andrespiratory
problems
was
alsoconducted
(Chapter
Eight).
These
healthproblem
sare
notonly
extremely
serious,particularly
forchildren,
butrelate
toa
varietyo
fenvironm
entalproblem
s.O
nlyby
analysingthe
environmentai
riskssim
ultaneouslyis
itpossible
toaddress
thecom
plexo
fenvironm
entaland
socialfactors
involved.In
orderto
betterunderstand
some
of
thecritical
constraintsand
possibilitiesfor
environmental
improvem
ent,an
assessment
of
theeconom
icso
fhousehold
environmental
managem
entw
asundertaken
(Chapter
Nine).
Due
tothe
publicnature
of
many
environmental
problems,
pricescan
rarelybe
usedto
ascertainhouseholds'
concernfor
environmental
improvem
ent.C
ontingentvaluation
methods
were
employed
toascertain
thevalue
householdsw
ouldplace
onim
provements.
An
attempt
was
alsom
adeto
identifyhouseholders'perceptions
of
what
needsto
bedone
byw
hom.
Any
attempt
toim
proveenvironm
entalm
anagement
inG
AM
Am
ust,o
fcourse,
buildon
existinginstitutional
capacities.A
nassessm
ento
fthe
institutionalaspects
of
urbanenvironm
entalm
anagementw
asundertaken
(Chapter
Ten),
with
aview
towards
identifyingsom
eo
fthe
keyactors,
andthe
rolethey
couldplay
inim
provingenvironm
entalm
anagementatthe
locallevel.M
akingspecific
strategicrecom
mendations
isbeyond
thescope
of
thisstudy.
The
information
presenteddoes
haveim
portantim
plicationsfor
strategydevelopm
ent,how
ever.T
he[m
altask
of
thestudy
was,
therefore,to
highlightsom
eo
fthese
implications,
anddem
onstratethat
theresults
areindeed
actionoriented.
Given
thepaucity
of
pre-existinginform
ationon
householdenvironm
entalproblem
s,a
largepart
of
theeffort
undertakenfor
thisstudy
was
devotedto
collectingand
analysingnew
data.The
methods
employed
aresum
marised
below.
1.1.2R
esearchD
esignT
hefield
work
involvedthe
useo
fthefollow
inginstrum
ents:
(a)A
detailedand
structuredquestionnaire
surveyof
householdstogether
with
physicaltests
ofw
aterquality
andexposure
toair
pollutionfor
asub-set o
fthehouseholds
coveredin
thequestionnaire
survey.(b)
Afew
selectedfocus
groupdiscussions
ongrassroots
environmental
concernsand
actionw
ithrank
andfile
mem
bersand
some
executivesof
wom
en'sgroups,
ethnicassociations,
neighbourhoodw
elfareassociations,
andother
comm
unitybased
organisations.(c)
Unstructured
discussionsor
interviews
with
policym
akersand
implem
entors.
1.1.3Sam
plingP
rocedurefo
rH
ouseholdSurvey
Asurvey
of
1,000households
inG
AM
Aprovides
thecore
empirical
baseo
fthe
study.The
surveyw
asadm
inisteredto
theprincipal
homem
akero
feachhousehold,
generallya
wom
an.T
heprincipaltopics
coveredare
summ
arisedin
Table
1.1.

Benneh
etal.
Table
1.1:S
electedT
op
icsC
overedin
Household
En
viron
me
ntS
urveyso
fAccra
Jakartaand
Sao
Paulo.
Ba
ckgro
un
dIn
form
atio
nH
ou
seh
old
Size
andage
structure
Indicatorso
fincome/w
ealth
Ge
nd
er
ofhousehold
head
Education
(principalm
ale&
female)
Mig
rato
rystatus
(principalhom
emaker)
Typ
eand
qualityof
residence
Size
ofresidence
andplot
Te
nu
reo
fresidence
Tim
ehouseholders
spendat
home
Water:
Typ
eof
wa
ter
sup
ply
byuse
Ease
ofaccess
todrinking
water
supply
Wa
ter
storagepractices
Wa
ter
filtrationo
rboiling
practices
Wa
ter
sup
ply
disruptions
Sa
nita
tion
&H
ygiene:T
ype
oftoilet
To
ilet
sharing
To
ilet
usepractices(e.g.
useof
toiletsb
ychildren)
Ind
icatio
ns
ofu
nh
ygie
nic
toilets
Ha
nd
cleansingpractices
ofprincipal
ho
me
ma
ker
Pests:
Pre
sen
ceo
ffliesin
kitchensand
toilets
Mo
squ
itobiting
An
ima
lskept
at
home
Ro
de
nt
problems
Co
ckroa
chproblem
s
Ho
usin
gP
rob
lem
s:C
rowding
Da
mp
problems
Building
materials
"Ind
oo
r"A
irP
ol/u
tion
:F
uelsused
forcooking
andheating
Locationof
cookingplace
Co
okin
gpractices
Pesticide
use
Sm
okin
gpractices
Fo
od
Co
nta
min
atio
n:
Fo
od
storagepractices
andfacilities
Food
preparationpractices
Indicationsof
po
or
foodhygiene
Use
offood
ven
do
rs
So
lidW
aste:W
aste
stora
ge
andcollection
Wa
stepicking
andselling
Locationof
waste
problems
Va
lua
tion
ofim
pro
ved
wa
stecollection
service
Health:
Ch
ildre
n's
diarrhoeaproblem
s
Ch
ildre
n's
respiratoryproblem
s
Re
spira
tory
problems
ofprincipal
ho
me
ma
ker
3
The
sampling
procedurew
asdesigned
toprovide
arepresentative
sample
ofhouseholds.
The
firststep
ofthe
sampling
procedureinvolved
proportional

4E
nvironmental
Problem
sand
theU
rbanH
ouseholdin
theG
AM
A-G
hana
stratificationaccording
tothe
residentialcategories
outlinedin
Table
1.2;an
adaptationof
thestrata
employed
inthe
recentH
ousingN
eedsA
ssessment
Study(H
ousingand
Urban
Developm
entA
ssociates,1990)
of
theA
ccraM
etropolitanA
rea(A
MA
).T
hesam
plew
asapportioned
acrossthe
firstseven
categoriesaccording
tothe
relativeshare
ofhouseholds
estimated
tobe
residingin
eachstratum
.T
heapportioning
was
basedon
theresults
ofthe1984
Census,adjusted
toallow
fora
more
rapidrate
ofgrow
thsince
1984in
the"L
owD
ensityN
ewly
Developing
Sector".The
shareofhouseholds
inthe
lastcategory,
"RuralFringe"
isnot
known
accurately,but
hasbecom
esignificantdue
tothe
recentinclusionofthe
Ga
districtw
ithinG
AM
A.
Itw
asapportioned
5%of
thesam
pleas
arough
estimate
of
itsshare
ofhouseholds.
The
resultingsam
plesize
ineach
stratumis
givenin
Table
1.2(w
ithsom
erounding).
For
detailso
fsam
plingprocedure,
seeA
ppendix1.1.
Ta
ble
1.2:S
tratifica
tion
by
Re
side
ntia
lCa
teg
ory.
Stratum
High
Density
IndigenousS
ector(H
DIS
)
Lo
wD
en
sityH
ighC
lassS
ecto
r(LD
HC
S)
Middle
Density
Middle
Class
Sector
(MD
MC
S)
Lo
wD
ensityM
iddleC
lassS
ector(LD
MC
S)
Lo
wD
ensityN
ewly
Developing
Sector
(LDN
DS
)
Middle
Density
IndigenousS
ector(M
DIS
)
High
Density
Lo
wC
lassS
ector(H
DLC
S)
Rural
Fringe
(RF
)
Total
Sam
pleshare
17%
2%5%
11%3%
12%
46
%5%
100%
Sam
pleS
ize
170
2050
11030115
45550
1000
As
theirnam
essuggest,
thestrata
were
designedto
distinguishareas
ofthe
cityprincipally
onthe
basisof
populationdensity
andam
enityvalues.
The
indigenoussectors
(HD
ISand
MD
IS)consist
of
settlement
nucleialong
thecoast.
They
areterm
edindigenous
becausethey
were
fqundedby
theG
aethnic
groupw
hooccupied
theA
ccraplains
beforethe
earlyperiod
ofE
uropeancoastal
trade.A
number
ofresidentsare
stillengagedin
coastalcanoe
fishing.T
hesesettlem
ents,and
especiallythe
HD
IS,
sharecom
mon
traitsw
ithother
lowclass
areas.T
helow
densitynew
lydeveloping
sector(L
DN
DS),
onthe
otherhand,includes
areaslikely
tobecom
ehigh
class,but
asyet
havinga
poorlydefined
comm
unitycharacter
andin
some
caseshaving
publicam
enitiesw
hichlag
behindthe
privatedevelopm
ent.T
herural
fringe(R
F)consists
ofrural
settlement
nucleiw
hichhave
nowbeen
incorporatedinto
them
etropolisthrough
anextension
ofthe
metropolitan
boundary.L
argeopen
spacesstill
exist,allow
ingfor
peri-urbanagriculture.
These
Ga
villages,likem
ostrurallocalities,are
generallybereftofservice
provisions.F
orthe
purposesof
presentation,tw
oform
so
fpost-stratification
were·
applied.L
ow,
middle
andhigh
wealth
householdshave
beengrouped
accordingto
aw
ealthindex
constructedfrom
thefollow
ingindicators
(weights
appliedare
inbrackets):
lamps
(1);iron
(5);fan
(5);black
andw
hitetelevision
(10);colour
television(20);
video(20);
refrigerator(30);
airconditioner
(50);bicycle
(10);m
otorcycle(40);
automobile
(100).H
ouseholdsscoring
lessthan
96have
been

Benneh
etal.5
designatedL
owW
ealth,those
scoringbetw
een96
and190
havebeen
designatedM
ediumW
ealth,and
thosescoring
over190
havebeen
designatedH
ighW
ealth.O
fthe
1,000households
surveyed,818
areL
owW
ealth,131
areM
ediumW
ealthand
51are
High
Wealth.
While
imperfect,
theow
nershipofconsum
erdurables
was
deemed
abetter
indicatoro
fw
ealththan
theinaccurate
estimates
of
income
andexpenditure
which
couldbe
obtainedrapidly
ina
householdsurvey.
Reapplying
thehousehold
wealth
indexto
thestrata
confmned
thew
ealthclassification
ofthe
stratathem
selves:T
hehigh
densityindigenous
sector,the
highdensity
lowclass
sector,the
middle
densityindigenous
sectorand
therural
fringeallhave
averagescores
significantlybelow
thelow
andm
iddledensity
middle
classsectors,
which
inturn
scoredlow
erthan
thelow
densityhigh
classsector
andthe
lowdensity
newly
developingsector.
This
trichotomy
providesthe
basisfor
thedistinction
between
low,
middle
andhigh
classareas
appliedin
some
of
thechapters
which
follow.
1.1.4P
hysicalTests
As
anothercom
ponento
fthe
study,physical
testsfor
water
andair
qualityw
erecarried
outin
asubset
of
200o
fthe1000
householdscovered
bythe
questionnairesurvey.
One
of
thefive
householdssurveyed
ineach
blockw
asselected
forthe
physicaltests,
allowing
maxim
umspread.
The
water
testsw
erefor
faecalcoliform
,both
atsource
andin
storagecontainers
when
possible.T
heair
testsw
eredesigned
toassess
wom
en'sexposure
toparticulates
andcarbon
monoxide
duringthe
cookingperiod.
Details
of
them
ethodsem
ployedfor
thephysical
testsare
presentedin
Appendix
1.2and
1.3.
1.1.5F
ocusG
roupD
iscussionsF
ocusgroup
discussionsw
ereundertaken
in14
lowincom
eneighbourhoods
where
environmental
qualityw
aspoor,
therebyindicating
aneed
forcom
munity
action.T
heneighbourhoods
includeA
shiaman,
Tem
aN
ewT
own
andO
ldA
shaleB
otwe
inT
ema
District;
Labadi
(La),
Darkum
an,Sabon
Zongo,
Maam
obi,A
ccraN
ewT
own,
Nim
a,Mam
probi,Jam
estown
andM
atahekoin
Accra
District;
andO
fankorand
Madina
forG
aD
istrict.T
hisfield
work,
includingthe
survey,the
physicaltests
andthe
focusgroup
discussions,provides
a"snap
shot"o
fA
ccraat
onepoint
intim
e.In
orderto
appreciatethe
contextfrom
which
this"snap
shot"w
astaken,
thefollow
ingsections
of
thischapter
reviewthe
urbangrow
thdynam
icso
fG
AM
A,
anddraw
outsom
eo
ftheim
plicationsfor
localenvironmental
managem
ent.
1.2O
verviewo
ftheU
rbanG
rowth
Dynam
icso
fGA
MA
An
estimated
1.5billion
peoplecurrently
livein
thecities
andtow
nso
fthe
Third
World.
Already
much
largerthan
thecom
binedpopulations
of
Europe,
North
Am
ericaand
Japan,this
figureis
stillgrow
ingby
some
70m
illionper
year(H
ardoy,M
itlinand
Satterthw
aite,1992,
p.29).
While
sub-Saharan
Africa
isthe
leasturbanized
of
allregions,
itsrate
of
urbanizationis
thehighest.
The
largestcities
havebeen
growing
particularlyrapidly
(White,
1989,p.2).T
heglobal
economic
problems
of
recentdecades
havehelped
drivesub
Saharan
Africa
intoa
graveeconom
iccrisis.
Most
countriesin
theregion
havehad
toadopt
Structural
Adjustm
entProgram
mes
underthe
auspicesof
theW
orldB
ankand
theIM
P.
Proponents
arguethat
structuraladjustm
entis
thebest
means
of
corningto
terms
with
hardeconom
icrealities.
Detractors
arguethat
itcom
pounds

6E
nvironmentalP
roblems
an
dthe
Urban
Household
inthe
GA
MA
-Ghana
theeconom
iccrisis
forthe
poor,and
helpscreate
the"hard"
economic
conditions.R
egardless,m
ostgovernm
entsare
clearlyfacing
aperiod
of
severefm
ancialausterity.
These
demographic
andeconom
icconditions
havecom
binedto
placesevere
pressureson
governments
attempting
tom
aintainpublic
facilitiesand
services,let
aloneim
proveand
expandcoverage
(Stren,
1989).P
erhapsnow
hereis
thism
oretrue
thanin
theG
reaterA
ccraM
etropolitanA
rea(G
AM
A),
which
servesas
boththe
capitalo
fGhana
andthe
major
industrialgrow
thpole
(Songsore,
1992,p.1).
1.2.1P
opulationG
rowth
andP
hysicalDevelopm
entsw
ithinG
AM
AF
oundedin
the16th
centuryas
asm
allcoastal
fishingvillage
closeto
theeastern
shoreo
fthe
Korle
Lagoon,
Accra
soonbecam
ea
pre-eminent
centrein
Ghana.
Inthe
17thcentury
itbecam
eone
of
them
ostim
portantE
uropeantrading
centresalong
theG
oldC
oast(as
Ghana
was
thenknow
n).A
sm
anyas
threetrading
fortsor
castlesw
erebuilt
inA
ccra:the
Dutch
builtU
ssherF
ort(1650),
theS
wedish
Christiansborg
Castle
(1657),and
theB
ritishJam
esF
ort(1673).
In1877,
havingestablished
themselves
asthe
solecolonial
power
inthe
country,the
British
decidedto
transferthe
seato
fB
ritishA
dministration
fromC
apeC
oastto
Accra..
This
eventwas
ofsem
inalim
portancein
thedevelopm
entofA
ccra(D
ickson,1969,
p.259).
Accra
grewrapidly
butin
agenerally
unplannedm
anner.T
hepopulation
of
thesettlem
entincreased
from16,000
in1891
toaround
42,000in
1921and
in1948
(atthe
lastcensus
beforepolitical
independencein
1957)recorded
apopulation
of
136,000(Plan
Consult
1989,p.ii).A
newindustrial
satellitetow
nshipof
Tem
aw
asdeveloped
inthe
wake
ofindependence,a
periodw
hena
largeshare
of
publicinvestm
entw
asbeing
divertedtow
ardslarge
citiesand
towns.
Plannedby
Doxiades
andA
ssociates,this
industrialsatellite
grewfrom
apopulation
of
only23,000
in1960
to181,000
in1984.
Tem
ais
thesite
of
am
odemdeep
seaharbour
anda
major
industrialestate.
Accra
andT
ema
were
plannedto
growinto
onebig
metropolitan
area.T
heG
reaterA
ccraM
etropolitanA
rea(G
AM
A),
asdefined
here,includes
theA
ccraM
etropolitanA
rea(narrow
lydefm
edas
theA
ccraD
istrict)in
additionto
Tem
aand
Ga
Districts
(Fig.1.1
andF
ig.l.2).T
hesethree
districtshave
become
physicallyand
functionallyone
singleurbanized
area.T
heG
AM
Ahad
acom
binedpopulation
of
450,000in
1960,w
hichalm
ostdoubled
by1970,
andstood
at1,300,000
aso
fthe
1984census.
The
estimated
populationfor
them
etropolitanarea
was
putat
1.7m
illionin
1990.It
isexpected
toreach
the4
million
mark
by2010,
accountingfor
about15%
of
estimated
nationalpopulation
atthat
time
(Accra
Planning
Developm
entProgram
me
(Draft)
1992,p.35).T
heaverage
annualintercensal
growth
rates(6%
between
1960and
1970and
3.5%betw
een1970-84)
were
bothw
ellabove
thenational
growth
rate(T
able1.3).
The
much
highergrow
thrate
between
1960and
1970coincides
with
theeconom
icboom
periodfor
them
etropolitanarea
consequentto
thecreation
ofthe
industrialtow
nshipo
fT
ema
andthe
generalrapid
expansionof
administrative,
comm
ercial,business
andindustrial
activitiesin
Accra
township
itself.

Benneh
etal.
Ta
ble
1.3:P
op
ula
tion
Tre
nd
sw
ithin
GA
MA
,1960,1970,
1984.
Population
Totals
AnnualG
rowth
Rate
District
19
60
19
70
19841960-70
1970-84
Accra
388,396636,667
969,1955.1
3.1
Te
ma
27,127102,431
190,91714.2
4.5
Ga
33,90766,336
136,3586.9
5.3
TotalG
AM
A449,430
805,4341
29
6,4
70
6.03.5
Data
source:G
ha
na
Population
Census,
1984.
7
Although
about75%
of
thetotal
populationis
locatedin
Accra
District,
them
orerapid
growth
ratesare
foundin
theindustrial
districto
fT
ema
andthe
periurban
District
of
Ga,
which
havebeen
accomm
odatingm
ucho
fthe
over-spillo
furban
development
fromA
ccraD
istrict.G
iventhese
differentialgrow
thrates
itis
anticipatedthat
Tem
aand
Ga
districtsw
illaccount
foran
increasingshare
of
thetotal
population,as
shown
inT
able1.4
below.
By
2010,A
ccra'srelative
shareo
fthe
totalpopulation
of
GA
MA
isexpected
tohave
droppedto
66%,
from75%
in1984.
The
relativeshare
of
thesetw
odistricts
couldeven
behigher
thanthese
otherfigures
suggest,given
thesaturation
of
thebuilt
residentialenvironm
entw
ithinA
ccraD
istrict.
Ta
ble
1.4:P
op
ula
tion
Pro
jectio
ns
for
Districts
inG
AM
A1990-2000
('OO
Os).
District
19
90
19952000
20052010
Accra
1,2431,514
1,8432,231
2,686
Te
ma
268351
459547
772
Ga
197262
348461
607
Total
GA
MA
1,7082,126
2,6503,239
4,065
Data
source:A
ccraP
lanningand
Developm
entP
rogramm
e,1991.
GA
MA
'srapid
populationgrow
thhas
ledto
urbanspraw
land
uncontrolledphysical
expansionfrom
them
unicipalboundary
of
Accra
intoG
aD
istrict,w
hichuntil
1960·was
largelyrural
incharacter.
Som
eo
fthe
more
notableresidential
satellitesthat
havesprung
upinclude
Madina,.A
denta,H
aatcho,M
cCarthy
Hill,
Kw
ashieman,
New
Achim
ota,Dom
eand
Ofankor.
Inaddition
toexpansion,
therehas
alsobeen
increasedcrow
dingin
existingresidential
areas.T
hishas
resultedin
higheroccupancy
ratiosin
existinghousing
unitsand
theinfilling
of
vacantplots
inthe
existingresidential
areas(B
enneh,et
al,1990,
pp.17-19).
The
overcrowding
hasbeen
particularlysevere
inthe
numerous
unservicedand
unplannedslum
areasw
ithinthe
Accra
District
andA
shiaman
inT
ema
District.

8E
nvironmentalP
roblems
andthe
Urban
Household
inthe
GA
MA
-Ghana
InA
ccraD
istrict,except
forthe
fewhigh
andm
ediumclass
residentialareas,
thebulk
of
thepopulation
livesin
largelyunplanned
residential·developments.
This
dualstructure
reflectsthe
charactero
fall
Ghanaian
citieso
fcolonial
origin:w
hilstthe
European
sectorw
asplanned,
theA
fricanor
indigenouscity
was
oftenleft
onits
own,
exceptfor
afew
regulationsto
controlthe
frequentoutbreak
of
epidemics
(Songsore,
inpress).
Tem
aindustrial
township
hadthe
singularprivilege
of
havinga
plannedsew
eragesystem
andother
municipal
facilities.A
shiaman,
however,
which
developedas
asquatter
settlement
nextto
Tem
a,lacks
anym
eaningfulservice
infrastructure,w
hilstT
ema
New
Tow
n,w
herethe
originalG
afisherm
enw
ereresettled,
is-inadequately
serviced.T
heG
aD
istrict,w
hichurbanized.during
thecrisis
decadeso
fthe
70sand
80s,is
characterisedby
uncontrolledphysical
development
anda
poorcoverage
ofmunicipal
services.O
necannot
fullyunderstand
thefailures
inservice
deliveryexcept
throughan
analysiso
fthe
trendsin
urbaneconom
icperform
ance.B
oththe
ambitious
planningo
fT
ema
andthe
laissezfaire
charactero
frecent
developments
inG
areflect
.changesin
theeconom
icas
well
aspolitical
climates.
1.2.2U
rbanE
conomic
Grow
thT
rendsH
avingbeen
chosenas
thenational
capital,a
chaino
fagglom
erativeprocesses
were
soonset
inm
otion,further
consolidatingA
ccra'spre-em
inentposition
inthe
nationaleconom
y.C
ompounding
theover-centralisation
of
governmental
decisionm
akingpow
erand
controlin
Accra,
many
headoffices
of
businessfum
sw
ereestablished
inA
ccrato
benext
tothe
seato
fgovernment.
The
metropolis
was
alsohost
tothe
most
dynamic
fums
andindustries
inthe
country.W
ithjust
over10%
of
thetotal
population,it
hasthe
most
diversifiedeconom
yin
thecountry,
andcontributes
between
15and
20%o
fG
DP
(Accra
PlanningD
evelopment
Program
me
(Draft)
1992, p.17).
About
32%o
fthe
country'sm
anufacturirigindustries
arelocated
inthe
metropolis.
Itis
thecom
mercial,
business,educational
andcultural
centreo
fthe
country.It
liesat
thehub
ofinternal
andinternational
comm
unicationsnetw
orksw
iththe
most
modem
deep-seaport
atT
ema
andthe
onlyinternational
airport.M
oreover,the
metropolis
isw
ellserved
byroad
linksto
otherparts
of
thecountry,
andis
them
ostimportantcoastal
terminus
ofthe
railway
network
inG
hana.H
owever,
theeconom
yo
fthe
metropolitan
areais
alsocharacterised
bystructural
imbalances.
Itis
estimated
thatservices
aloneaccount
for26%
oftotal
employm
entfollow
edclosely
byw
holesaleand
retailtrade
with
24%.
Manufacturing
activityaccounts
foronly
19%o
fthe
totallabour
employed
(Am
uzuand
Leitm
an,1991, p.i).
During
the1970s
andearly
1980s,G
hana'sG
rossD
omestic
Product
persistentlydeclined.
Output
shrunkin
almost
allsectors,
inflationw
ashigh,
andthere
were
acuteshortages
of
consumer
goods.T
hisled
todeclining
percapita
incomes
anda
generaldeterioration
inthe
welfare
of
thepopulation.
The
metropolitan
economy
was
particularlyaffected
bythe
economic
crisis,given
its.dependence
onim
ports.Industrial
productionw
asat
anall
time
loww
ithcapacity
utilisationfor
most
establishments
generallybelow
25%(Plan
Consult,
1989,p.
104).In1983,
Ghana
initiatedan
Econom
icR
ecovery/Structural
Adjustm
entP
rogramm
e(E
RP
/SA
P),
with
theobject
of
arrestingthe
declinein
theeconom
icand
socialconditions
inG
hana.T
able1.5
indicatesthe
extento
fthe
recoveryin

Benneh
etal.9
GD
P.
For
theyears
1984-1987,G
DP
recordedan
averageannual
growth
rateo
f6%
,w
ithindustry
growing
at12%
,servicesat
8%,and
agricultureat
3%.
Table
1.5:G
row
tho
fG
ha
na
'sG
OP
by
kind
ofe
con
om
ica
ctivityin
con
stan
t1975
price
s(p
er
cen
tpe
ra
nn
um
).
19
80
19811982
19831984
19851986
1987
Agriculture
2.17-2.56
-3.25-9.11
9.710.65
3.310.04
Ind
ustry
-1.85-14.46
-16.67-6.77
11.9417.60
7.5611.34
Se
rvices
-2.792.73
-4.65-4.54
6.637.52
6.509.38
Total
GD
P-0.23
-3.18-5.85
-4.348.96
5.095.20
4.80
Data
source:Je
bu
niet
aI.,1991,
p.8.
Since
GA
MA
hasa
highconcentration
of
industryand
service.activities,these
figuresw
ouldseem
tosuggest
thatits
recoveryhas
beenstrong.
This
impression
shouldbe
qualifiedby
thefact
thatm
iningaccounts
form
ucho
fthe
growth
inthe
industrialsector,
andis
insignificantin
GA
MA
.T
hem
anufacturingindustry
facesstiff
competition
fromim
portedgoods
underthe
liberalisationprogram
me.
The
balanceo
fpaym
entsposition
hasrem
ainedprecarious
throughoutthe
period,and
thereare
doubtsabout
thelong
termsustainability
of
recentgrow
thtrends
(Jebuniet
al.,1991).
Moreover,
evenif
growth
inproduction
canbe
maintained,
theeconom
icprospects
forthe
majority
ofthe
populationare
uncertain.T
heincreasing
economic
activityis
generatinggreater
industrial,com
mercial
andm
unicipalw
astes.Y
etthe
government
islikely
tocontinue
toface
severebudget
constraints.C
ombined
with
thepressing
needso
fhouseholds
inthe
burgeoningresidential
areas,theenvironm
entalchallenge
isim
mense.
1.3T
heC
hallengeo
fGA
MA
'sG
rowth
attheL
ocalLevel
The
rapidgrow
tho
fGA
MA
inan
unfavourableeconom
icenvironm
enthas
ledto
arapid
increasein
thenum
bero
fits
inhabitantsliving
insubstandard
housingand
overcrowded
conditions,w
ithoutthe
resourcesfor
decentshelter.
Our
surveyresults
indicatethat
about67%
of
householdslive
inthe
singlestorey
traditionalhouse
compounds,
occupiedby
severalhouseholds,
andoften
sharingsanitary
andkitchen
facilities.A
bout35%
of
householdslive
crowded
intoone
roomand
another33%
intotw
oroom
s.T
hegeneral
shortageo
fhousing
hasforced
some
peopleto
resortto
otherm
eanso
fshelter
includingthe
occupationo
fbuildings
underconstruction,
kiosks,garages
andverandas.
Itis
estimated
thatabout
3%o
fthe
populationo
fG
AM
Ais
homeless
(Accra
Planning
Developm
entP
rogramm
e,1992,
p.7).E
venaqlong
thehouseholds
surveyed,there
was
evidencethatin
them
orecrow
dedhouses
itis
notuncom
mon
forsom
ehouseholders
tosleep
away
fromhom
e.T
heH
ousingN
eedsA
ssessment
studyindicates
thaton
averagethere
are4.2
householdso
r23.3
personsper
dwelling.
There
areon
average1.8
rooms
perhousehold
and8.1
rooms
perdw
ellingw
ithan
averageo
f2.9
personsper
room.
The
mean
occupancyrate
of
2.9per
roomis
abovethe
United
Nations
recomm
endedstandard
of
2.5.(H
ousingand
Urban
Developm
entA
ssociates,1990,V
ol.1,p.103).

10E
nvironmental
Problem
sand
theU
rbanH
ouseholdin
theG
AM
A-G
hana
About20%
ofthe
householdheads
andprincipal
homem
akersfrom
oursurvey
were
illiterate,whilst
them
ajority(65%
)had
nothad
educationbeyond
elementary
schoollevel.
Most
peoplew
ithvery
lowskills
canbe
assumed
tow
orkin
theinform
alsector
which
accountsfor
about57%
of
thetotal
employm
entof
GA
MA
.W
omen
dominate
inthis
sector,often
working
closeto
home.
About
40%o
fthe
populationcovered
inour
surveyw
asbelow
15,m
ostlyyoung
childrenw
hospend
thebulk
of
theirtim
eat
home.
Overall,
thesurvey
resultsindicate
thatabout
30%o
fhouseholdm
embers
spend4
hoursor
lessaw
ayfrom
home,
50%spend
between
5-8hours
away
fromhom
e,andonly
4%o
fthe·populationspend
12hours
or
more
away
fromhom
e.T
heseresults
underscorethe
potentialim
portanceo
fthe
householdenvironm
enttothe
welfare
ofAccra's
inhabitants.R
eflectingthe
prevailinggender
divisiono
flabour,
itw
asfound
tobe
mainly
wom
enand
female
childrenw
hocook
andm
anagethe
householdenvironm
ent,and
arem
ostat
risk.M
oreover,as
would
beexpected,
thew
omen
were
generallyless
educated.A
sregards
poverty,the
evidencefor
Accra
would
seemto
suggestthat
thehigh
economic
growth
ratesrecorded
sincethe
inceptiono
fG
hana'sS
tructuralA
djustment
Program
me
havebrought
minim
alrelief
tothe
averageurban
household.F
orexam
ple,the
averageurban
worker
isstill
much
poorerthan
in1970.
Although
povertyis
stillm
oreprevalent
inrural
areas,w
iththe
metropolis
havingthe
highestm
eanper
capitahousehold
expenditurein
Ghana,
ina
recentstudy
about95%
of
thosesurveyed
earnedbelow
thepoverty
lineo
f$4.00per
dayas
stipulatedby
theInternational
Labour
Organisation
(Housing
andU
rbanD
evelopmentA
ssociates,1990).Indeed,given
thepressures
ofday
today
survival,the
capacityo
fpoor
householdsto
manage
theirlocal
environment
may
well
havecontinued
todecline
understructural
adjustment.

Benneh
etal.
CH
AP
TE
RT
WO
11
2H
OU
SE
HO
LD
WA
TE
RS
UP
PL
Y2.1
IntroductionT
hischapter
providesa
physicaloverview
of
water
accessand
useam
ongG
AM
Ahouseholds.
Itcovers
thetypes
andlocation
of
water
sources,w
aterstorage
andhandling,
water
payments
anduse
patterns,and
theassociation
between
water
sourceand
diarrhoeaprevalence
among
children.F
inally,the
physicalquality
of
thew
ater,both
atthe
households'w
atersources
andin
theirstorage
containers,are
examined.
Intra-urbandifferences
inaccess
tofacilities
arediscussed
interm
so
fboth
geographicalareas
andhousehold
wealth.
Both
of
thesedim
ensionsare
relevantto
policysince
itis
important
toknow
theareas
of
intervention.and
thetarget
groupsinvolved.
2.2W
aterSupply
Systems
An
adequatesupply
of
easilyaccessible,
potablew
ateris
centralto
households'w
elfare,and
aprerequisite
togood
hygieneand
sanitation(S
ongsore,1992,
p.5).M
anyhealth
problems
arelinked
tow
aterquality,
availability,ease
of
accessand
provisionsfor
disposal(see
Hardoy,
Mitlin
andS
atterthwaite,
1992;C
airncross,1990).
GA
MA
hasa
more
comprehensive
pipedw
atersystem
thanother
urbancentres
inG
hana.It
accountsfor
90x
10 6m
3(m
illioncubic
metres)
outo
fthe
totalannual
water
productionby
pipedsystem
so
fabout130
x10 6
m3
.
Ta
ble
2.1
:D
istrib
utio
no
fH
ou
se
ho
lds
inG
AM
Ab
yS
ou
rce
of
Drin
kin
gW
ate
r.
So
urce
Accra
Tem
aG
aG
AM
A
No.
0/0N
o.%
No.
%N
o.0/0
IndoorP
iping248
34.765
40.639
31.2352
35.2P
rivateS
tandpipe221
30.910
6.312
9.6243
24.3W
aterV
endor167
23.472
45.041
32.8280
28.0O
therP
rivateS
ource9
1.32
1.34
3.215
1.5C
omm
unalStandpipe
689.5
116.9
32.4
828.2
Well
20.3
75.6
90.9
Rainw
aterC
ollector4
3.24
0.4O
penW
aterway
1512.0
151.5
Total
715100.0
160100.0
125100.0
1000100.0
Data
source:Q
uestionnaireS
urveyof
GA
MA
.1991.
Table
2.1show
sthe
differentsources
of
water
supplyfor
them
etropolisas
aw
hole,w
ithindoor
pipingaccounting
for35%
whilst
privatestandpipes
andw
atervending
accountfor
24%and
28%respectively
of
thesam
pleo
fhouseholds
interviewed.
Virtually
allo
fthe
householdsin
Accra
andT
ema
dependon
thepiped
water
system,
eitherdirectly
or
indirectly.T
ema
District
hasthe
highestshare
with
indoorpiping
asthis
isthe
normin
allthe
plannedresidential
areaso
fT
ema
Tow
nship.In
Ga,
however,
more
than20%
of
thehouseholds
obtaintheir
drinkingw
aterfrom
rainwater
collectiono
ropen
waterw
aysand
wells.

12E
nvironmentaL
ProbLem
sa
nd
theU
rbanH
ousehoLdin
theG
AM
A-G
hana
Access
topiped
water
isclosely
relatedto
thedegree
of
planning,but
alsoto
householdw
ealth.A
sdescribed
inC
hapterI,
householdsw
eredivided
intothree
wealth
categories:low
wealth
(poor),m
ediumw
ealthand
highw
ealth(w
ealthy).T
able2.2
indicatesthe
importance
of
householdw
ealthin
determining
accessto
thebest
water
supplysystem
.W
hereas98%
of
wealthy
householdsand
70%o
fm
edium-w
ealthhouseholds
respectivelyhave
accessto
indoorpiping,
only26%
ofall
poorhouseholds
havesuch
afacility.
About33%
ofpoorhouseholds
relyon
thew
atervendor
asthe
principaldrinking
water
source.
Ta
ble
2.2:R
ela
tion
ship
Betw
eenP
rincip
alS
ou
rceo
fD
rinkin
gW
ate
rand
Ho
use
ho
ldW
ea
lth(%
).Wealth
IndexofH
ouseholdS
ourceLow
Medium
Ind
oo
rP
iping25.7
70.2
Sta
nd
pip
e(P
rivate)27.1
15.3
Wa
ter
Ve
nd
or
32.98.4
Co
mm
un
al
Sta
nd
pip
e9.2
5.3
Oth
ers
5.10.8
To
tal
10
0100
(N)
(818)(131)
High
98.0
2.0
100
(51)
All
35.2
24
.3
28
.0
8.2
4.3
100
(1000)
Da
taso
urce
:Q
ue
stion
na
ireS
urve
yof
GA
MA
,1991.
2.3C
onvenienceo
fAccess
an
dR
eliabilityo
fSupplyA
bout83%
of
allhouseholds
inG
AM
Adepend
onshared
water
supplysources
(includingvendors),w
hichnotonly
canlead
tothe
problemo
fqueues,but
insom
ecases
may
causecontam
inationproblem
s.S
ome
20%o
fthe
householdsget
theirdrinking
water
fromsources
theyshare
with
atleast
tenother
households;usually
sourcesopen
tothe
whole
neighbourhood.T
hevendors,
who
serveanother
28%o
fthe
households,also
typicallyhave
alarge
number
of
customers.
Reflecting
theoverall
availabilityo
fpiped
water,
householdsin
Ga
District
were
them
ostlikely;.,
tohave
toshare
aw
atersource
with
largenum
berso
fotherhouseholds,
while
high·levels
ofsharing
were
relativelyuncom
mon
inT
ema.

Benneh
etai.
Ta
ble
2.3
:R
ela
tion
sh
ipb
etw
ee
nH
ou
se
ho
ldS
ha
ring
Sa
me
Wa
ter
Su
pp
lya
nd
We
alth
of
Ho
use
ho
ldin
GA
MA
(%).
We
alth
Ind
ex
of
Ho
use
ho
ld
No
.of
Ho
use
ho
lds
Lo
wM
ed
ium
Hig
hA
ll
No
Sharing
(0)9
.039.9
76.616.2
1-
26.6
15.623.4
8.6
3-4
13.913.3
4.95
-78.5
7.78.0
8-
10
6.13.1
13.6
Above
10
-22.5
11.620.0
From
Ve
nd
or
33.58.6
28.6
Total
100.0100.0
100.0100.0
(N)
(803)(128)
(47)(978)
Data
source:Q
ue
stion
na
ireS
urveyo
fGA
MA
,1991.
N.B
.T
his
tab
lee
xclud
es
22
householdsw
ho
didnotrespond
toquestion
onsharing.
13
Table
2.3show
sthat
whereas
77%o
fall
wealthy
householdshave
exclusiveuse
of
theirw
atersupply,
most
poorhouseholds
eithershare
theirsource
of
water
with
atleastten
otherhouseholds
orbuy
fromvendors.
Ifone
isto
regardhouseholds
within
100m
etresof
water
sourceas
havingadequate
supplyo
fpotable
water
thenthe
bulkof
thepopulation
within
GA
MA
isadequately
servedw
ithw
ater,as
Table
2.4illustrates.
As
many
as54%
of
allhouseholds
haveaccess
tow
atersupply
within
theirhouse
compound,
andonly
5%have
supplysources
beyond100
metres
distancefrom
home.
Again,
thebest
serveddistrictis
Tem
aand
thew
orstisG
a.
Ta
ble
2.4
:A
ve
rag
eD
ista
nce
of
Ho
use
ho
lds
from
Wa
ter
So
urc
e.
Dista
nce
from
District
Ho
me
(me
tres)
Accra
Te
ma
Ga
To
tal
GA
MA
No.
0/0N
o.%
No.
%N
o.%
InH
om
e(0)
40857.1
7546.9
5241.6
53553.5
1-
50
23833.3
7546.9
3427.2
34734.7
51-
10
05
57
.75
3.113
10.473
7.3
10
1-2
00
50
.72
1.316
12.823
2.3
Above
2009
1.33
1.910
8.0
222.2
To
tal
715100.0
160100.0
125100.0
1000100.0
Data
source:Q
ue
stion
na
ireS
urveyof
GA
MA
,1991.
Whilst
allbut
2households
within
thehigh
classresidential
areas(for
definitionsee
section1.1.3)
havein-house
water
suppliesand
onlya
small
proportionw
ithinthe
medium
classresidential
areaslack
in-housesupplies,
allhouseholds
whose
water
supplysources
were
beyond50
metres
fromthe
house

14E
nvironmental
Problem
sand
theU
rbanH
ouseholdin
theG
AM
A-G
hana
were
foundin
thelow
classresidential
areas.E
venhere,
however,
about5%
of
allhouseholds
hadw
atersources
beyond100
metres
fromthe
house.T
hisgives
theim
pressiono
fadequate
overallcoverage.
How
ever,even
shortdistances
canlead
tow
atersupply
deficiencies.M
oreover,w
atersupply
inG
AM
Ais
oftendisrupted
bythe
breakdown
of
obsoleteequipm
entin
treatment
plantsat
theW
eijaand
Kpong
water
works,
which
supplythe
bulkof
potablew
aterto
them
etropolis.T
hepresent
estimated
water
demand
forA
ccraand
Tem
a,excluding,
thefast
growing
Ga
District,
is76
million
gallonsper
day(M
GD
)as
againstthe
actualestimated
productionof60
MG
D(T
able2.5).
According
tothe
managem
ento
fthe
Ghana
Water
andS
ewerage
Corporation
(GW
SC
),an
additional30%
of
totalproduction
islost
throughleakages.
Supplyis
particularlyerratic
andprecarious
forthe
lowpressure
zonein
thew
esternparts
of
Accra
servedby
theold
Weija
Water
Works.
Ta
ble
2.5:W
ate
rP
rod
uctio
na
tthe
Weija
an
dK
po
ng
Tre
atm
en
tP
lants.
Insta
lled
Tre
atm
en
tP
lan
tC
ap
acity
MG
D
A.W
eija
Ne
wW
orks15.00
Bam
ag4.00
Candy
8.00
Weija
Sub-total
27.00
B.K
po
ng
Ne
wW
orks
40.0
Old
Works
10.5
Kpong
Sub-total
50.5
Grand
Total
77.5
Actu
alP
rod
uctio
n
MG
D15.00
3.000.00
18.00
35.6
6.75
42.35
60.35
Re
ma
rks
Candy
Plant
brokendow
nsince
1986.
1.2MG
Dis
supplieddaily
to
Akw
apimR
idge.
Data
source:D
atacom
piledfor
studyby
GW
SC
,A
ccra,1992.
The
worst
affectedareas
includeD
ansoman
Housing
Estates,
South
Odorkor;
Bubuashie,and
Darkom
anto
theW
est,and
Teshie-N
unguaH
ousingE
statesto
theE
ast.In
additionm
ostnew
housingestates
andhigh
densitylow
classareas
inG
adistrict,
suchas
Madina,
alsosuffer
acutew
atershortages.
This
isaggravated
inthe
dryseason
when
theonly
availablesource
ofw
aterfor
householduse,
gardening,w
ashingo
fcars,etc.,isthe
GW
SCsystem
.D
atafrom
thequestionnaire
surveytend
tosupport
theobservation
thatthe
water
supplyfrom
theG
WS
Csystem
isunreliable
andirregular.
About
66%o
fhouseholds
indicateda
regulardaily
interruptiono
ftheir
principaldrinking
water
supply.T
hesereported
interruptionsw
erew
idespreadin
them
etropolis,affecting
neighbourhoodsin
low,
medium
andhigh
classresidential
areasalike.
They
alsoarise
throughoutthe
year:m
osto
fthe
households(91
%)
who
reportedinterruptions
indicatedthat
theyoccurred
inboth
thew
etand
dryseasons.
The
problemis
particularlysevere
inthe
dryseason,
however,
especiallyfor
residentsw
ithinthe
Ga
District
where
some
comm
unitiesrely
onnatural
sourcessuch
asstream
s,rainwater
harvestingand
shalloww
ells.

Benneh
etal.15
Ow
ingto
theunreliability
of
water
supply,the
practiceo
fw
aterstorage
isw
idespreadeven
among
householdsw
hohave
indoorpiping.
Inaddition
tothe
inconvenience,thiscreates
adanger
ofcontamination.
The
sourceo
fw
atersupply,
thenum
berof
householdssharing
water,
thedistance
tosource
andsupply
interruptionsare
alldim
ensionso
fw
ateravailability
andease
of
access.M
osto
fthese
factorsare
alsorelated
tow
aterquality.
Evidence
fromthe
bacteriologicalquality
of
drinkingw
ater(see
below)
suggeststhat
althoughw
aterquality
fromthe
pipedsystem
isgenerally
good,it
isoften
contaminated
dueto
poorstorage
andhandling
practicesby
households.
2.4W
aterStorage
an
dH
andlingP
racticesM
ostlandlords
andhousing
agenciesw
hobuild
inhigh
andm
ediumclass
residentialareas
provideoverhead
tanksor
otherrelatively
efficientstorage
facilitiesin
thehouses
theyconstruct.
Especially
inthe
lowclass
residentialareas
with
inadequateservice
facilities,individual
householdshave
devisedcoping
strategiesby
providingtheir
own
small
storagecontainers
suchas
barrels,pigfeet
containers,jerrycans,
potsand
bucketso
fvarious
sizes.T
hehigh
incidenceof
water
storageis
confirmed
bythe
surveydata;
about96%
of
allhouseholds
within
GA
MA
storedw
ater(T
able2.6).
Ta
ble
2.6
:P
ractic
eo
fW
ate
rS
tora
ge
inth
eM
etro
po
lis.
Response
District
No
Yes
To
taI
No.
0/0N
o.%
No.
%
Accra
324.5
68395.5
715100.0
Tem
a2
1.3158
98.8160
100.0G
a9
7.2116
92.8125
100.0
TotalG
AM
A43
4.3957
95.71000
100.0
Data
source:Q
uestionnaireS
urveyofG
AM
A,1991.
The
most
comm
onstorage
containeris
theengine
oildrum
orbarrel,
followed
bythe
bucket,the
pigfeetcontainer,
thejerry
can,the
overheadw
atertank
andthe
potin
descendingorder
of
importance.
Table
2.7show
sthat
whereas
theoverhead
tanktends
tobe
thepredom
inantm
eanso
fw
aterstorage
among
thew
ealthyhouseholds,the
barrelis
popularam
ongpoor
andm
ediumincom
egroups.

16E
nvironmental
Problem
sand
theU
rbanH
ouseholdin
theG
AM
A-G
hana
Ta
ble
2.7
:R
ela
tion
sh
ipB
etw
ee
nT
ype
of
Sto
rag
eC
on
tain
er
Use
da
nd
Ho
use
ho
ldW
ea
lthin
pe
rcen
tag
es.
Wealth
Ind
ex
of
Ho
use
ho
ldC
on
tain
er
(typica
lsize)L
ow
Medium
High
All
Overhead
Tank
(2,250)2.6
16.348.9
6.6B
arrel(225
litres)48.6
48.025.5
47.4P
igF
eetContainer
(45H
tres)15.0
15.412.8
15.0Jerrycan
(22.5H
tres)8.4
9.88.5
8.5P
ot(13.5-100
litres)6.3
3.35.6
Bucket
(13.5-18litres)
19.27.3
4.316.9
Total
100.0100.0
100.0100
(N)
(778)(123)
(47)(948)
Data
source:Q
uestionnaireS
urveyofG
AM
A,
1991.
About
43%o
fall
householdshad
tocarry
water
totheir
homes,
usingsuch
rudimentary
methods
ashead
portageand
handcarriage.
The
hygienepractices
surroundingw
aterportage
ispoor
asm
ostpeople
useopen
bucketsand
containersto
conveythe
water.
Although
83%o
fhouseholds
inthe
metropolis
hadtheir
water
storedin
closedcontainers,
asignificant
number
of
these(i.e.
28%)
keptthese
containersoutside.
Only
17%o
fhouseholds
storingw
aterused
opencontainers.
The
useo
fclosed
water
containersw
asrelated
tothe
educationalstatus
ofthe
principalhom
emakers.
For
example,w
hereasonly
76%o
fprincipalhom
emakers
with
noform
aleducation
storedw
aterin
closedcontainers,
83%o
fthose
with
onlysom
eelem
entaryschool
education,88%
of
thosew
ithsom
esecondary
education,and
94%o
fthose
with
post-secondaryeducation
storedw
aterin
closedcontainers.
Given
thehigh
incidenceo
fw
aterstorage
discussedabove,
andirregular
washing
of
storagecontainers
(Table
2.8),one
would
anticipatesignificant
inhouse
water
contamination.
How
ever,the
practiceo
fboiling
water
orfiltering
beforedrinking
isnegligible.
About
90%o
fall
householdsinterview
eddrank
theirw
aterw
ithoutboiling
orfiltering
it(T
able2.9).
The
onlyneighbourhoods
where
am
ajorityo
fthe
respondentsboiled
orfiltered
theirw
aterw
erethe
highclass
residentialareas
of
Airport
andR
ingway
Estate,
which
havea
highconcentration
of
foreignem
bassystaff
andtop
businessexecutives.
Even
among
the24
householdsusing
wells
oropen
waterw
ays,only
5boiled
orfiltered
thew
aterprior
todrinking
(indeed,alm
osthalfo
fthe
householdsboiling
orfiltering
water
hadin
housepiping).

Benneh
etaL.17
Ta
ble
2.8
:F
req
ue
ncy
of
Cle
an
ing
of
Sto
rag
eC
on
tain
ers
by
Ho
use
ho
lds.
District
GA
MA
Cle
an
sing
Fre
qu
en
cyA
ccraT
ernaG
aT
otal
No.
%N
o.%
No.
%N
o.%
Daily
29743.5
6440.5
3227.8
39341.0
Weekly
27840.8
5434.2
6455.7
39641.5
Monthly
608.8
148.9
97.8
838.7
Rarely
orN
ever47
6.926
16.510
8.783
8.7
Total
682100.0
158100.0
115100.0
955100.0
Data
source:Q
uestionnaireS
urveyofG
AM
A,
1991.
Ta
ble
2.9
:G
en
era
lP
ractice
of
Wa
ter
Bo
iling
or
Filte
ring
Be
fore
Drin
kin
gb
yH
ou
se
ho
lds.
Response
District
No
Yes
To
taI
No.
%N
o.%
No.
%A
ccra635
88.880
11.2715
100.0T
erna154
96.36
3.8160
100.0G
a113
90.412
9.6125
100.0
TotalG
AM
A902
90.298
9.81000
100.0
Data
source:Q
uestionnaireS
urveyof
GA
MA
,1991.
Most
householdsfailed
toboil
theirw
aterbecause
of
thepopular
perceptionthat
overallw
aterquality
was
good.E
venw
henthey
perceivedan
inadequacyin
thew
aterquality,
theygenerally
didnot
care,perhaps
implying
alack
of
understandingo
fthe
healthrisks
involved.F
ewpeople
indicatedtim
eor
fuelcost/scarcity
asbeing
theconstraint
forthe
lowpractice
of
water
boilingor
filtering.D
rinkingw
aterdirectly
fromrivers,
streams
andother
waterw
aysw
as,on
theother
hand,relatively
rare,even
among
children.O
nlythree
percent
of
therespondents
saidtheir
childrendrank
regularlyfrom
suchsources,
whilst
aboutfive
percent
saidthey
didoccasionally.
These
childrenw
erem
ainlyfound
indeprived
comm
unitiesin
theperi-urban
andrural
fringeareas
inG
aand
Tem
aD
istricts.T
hew
orstaffected
comm
unitiesare
Danfa
andA
masam
anin
Ga
District.
InA
ccradistrict,
itw
asm
ainlychildren
of
poorlyeducated
slumdw
ellersw
hooccasionally
drankw
aterfrom
suchsources.
2.5W
aterU
tilisationP
atternsU
nlikesom
ecities
with
well-planned
neighbourhoodutility
services,such
asbath
houses,the
metropolitan
areain
generallacks
suchpublic
bathingfacilities,
andthe
fewthat
existedin
thepast
havefallen
intodisrepair.
Afew
comm
ercialshow
erunits
havestarted
developing:som
ew
erenoted
inthe
lowclass
residentialarea
ofS
abonZ
ongoin
Accra
andT
ema
New
Tow
nin
Tem
a.O
verall,for
thelow
class

18E
nvironmental
Problem
sa
nd
theU
rbanH
ouseholdin
theG
AM
A-G
hana
residentialzones
which
lackindoor
piping,the
practiceof
water
utilisationat
sitew
hetherfor
drinking,bathing,cooking,washing
orotheruses
was
negligible.A
lthoughthe
practiceof
drinkingice
water
andice-kenkey
fromunhygienic
ice-water
sellersis
popularin
comm
ercial,industrial
andother
workplaces,
veryfew
ofthose
without
regularin-house
water
supplydrank
water
atthe
pointof
water
collection.B
athingand
washing
atthe
water
sourcew
aslim
itedto
therural
fringezone
inG
aD
istrictespeciallyin
them
ostdeprived
andisolated
comm
unitiessuch
asO
yarifa,Danfa
andO
ldO
fankor.
2.6W
aterP
ayments
Sincethe
inceptionof
Ghana's
Econom
icR
ecovery/StructuralA
djustment
Program
me,
theprevailing
ethoshas
beenthe
removal
ofsubsidies
fromall
servicesincluding
water.
The
costrecovery
measures
forw
ateruse
havem
eantthe
veryregular
revisionof
water
tariffsupw
ards.A
tthe
time
ofthe
survey,for
metered
premises
therates
varyfrom
741for
thefirst
3,000gallons
perm
onth(equivalent
to247
cedisper
thousandgallons
ifthe
full3,000
was
consumed)
to814
cedisper
thousandgallons
consumed
inexcess
of
10thousand
gallonsper
month.
Unm
eteredprem
isesw
erecharged
aflat
rateo
f741
cedisper
houseper
month.
Those
who
relyon
publicstand
pipesw
erecharged
aflat
rateof
247cedis
perhouse
perm
onth.F
orresidents
who
relyon
boreholes,w
ellsand
handpum
psa
flatm
onthlycharge
of146
cedisw
aslevied
perhouse.
More
recently,these
rateshave
increasedby
between
27and
161%
.A
bout90%
of
householdsin
them
etropolishad
topay
forw
ater.T
hebulk
ofG
AM
A's
population,how
ever,w
asunm
eteredand
hadto
payby
thebucket
tow
atervendors
ora
fixedm
onthlyrate
toG
WS
c.F
orthe
metropolis
asa
whole
only38%
ofhouseholds
who
paidfor
water
uselived
inm
eteredprem
ises(T
able2.10).
Ta
ble
2.1
0:
Mo
de
of
Wa
ter
Pa
yme
nt
am
on
gH
ou
seh
old
sP
ayin
gfo
rW
ate
r.
Mode
of
Paym
entA
ccraT
ema
Ga
TotalG
AM
A
No.
0/0N
o.%
No.
%N
o.%
Fixed
Monthly
Rate
11718.9
4831.4
1920.0
18421.2
.,.M
etered254
41.139
25.53
738.9
33038.1
Bucket
23938.7
6441.8
3941.1
34239.5
Other
Container
40.6
40.5
Pay
forE
achU
se4
0.62
1.36
0.7
Total
618100.0
153100.0
95100.0
866100.0
Source:
Questionnaire
Survey
ofGA
MA
,1991.
As
aresult
ofthe
widespread
practiceof
water
vendingin
lowincom
eareas,
about40%
of
allhouseholds
who
paidfor
water
usedid
soon
adaily
basis.E
achbuyer
paysfive
orten
cedisper
bucket,indicating
anaverage
costof
roughlyone
cediper
gallon.T
hisis
well
abovethe
pricefor
householdspurchasing
water
directlyfrom
theutility.
Am
eteredor
unmetered
householdusing
3,000gallons
perm
onth,or
ahousehold
collectinga
1,000from
apublic
standpipe,paid
aquarter
of
thisrate.
The
costofpurchasing
water
froma
vendorcould
easilycom
e

Benneh
etal.19
to10%
of
them
onthlyincom
eo
fa
lowincom
ehousehold.
This
almost
certainlyserves
asa
constraintonthe
amounto
fdailyw
ateruse.
Also,
while
thegraduated
tariffm
ayserve
todissuade
some
wealthy
householdsfrom
usingw
atercarelessly,it
canalso
bea
burdenon
householdsw
hoshare
water
meters.
The
surveyresults
indicatethat
more
thanthree
outo
ffour
metered
connectionsused
bypoor
householdsare
shared,w
hilesharing
isan
exceptionam
ongw
ealthyhouseholds.
Thus
wealthy
householdscan
consume
considerablym
orew
aterbefore
fallinginto
thehigh
tariffblocks.T
able2.11
illustratesthe
closerelationship
between
thew
ealtho
fhouseholds
andthe
mode
of
payment
forw
ater,establishing
thecase
thatthe
poorestgroups
arehaving
topay
bythe
buckettow
atervendors.
.
Tab
le2.11:
Relatio
nsh
ipB
etween
Wealth
Statu
so
fH
ou
seho
ldan
dM
od
eo
fW
aterP
aymen
ts(%
).
Wealth
Ind
exo
fH
ou
seho
ld
Mo
de
of
Paym
ent
Lo
wM
ediu
mH
igh
All
Fixe
dM
on
thly
Ra
te2
2.4
16
.21
5.2
21
.2
Me
tere
d2
9.2
74
.88
4.8
38.1
Bu
cket
47
.08.1
39
.5
Oth
er
Co
nta
ine
r0
.70
.5
Pa
yfo
re
ach
Use
0.7
0.9
0.7
To
tal
10
0.0
10
0.0
10
0.0
10
0.0
(N)
(708)(108)
(46)(866)
Da
taso
urce
:Q
ue
stion
na
ireS
urve
yof
GA
MA
,1
99
1.
Households
with
asew
erageconnection
haveto
paya
35%surcharge.
From
January1992,a
surchargeo
f3%has
beenadded
forthe
publicuse
ofw
aterfor
fIrefIghting
andfor
theprom
otiono
frural
water
development.
Only
about10%
of
totalhouseholds
who
paidfor
water
indicatedthat
they~ere
aware
of
anadditional
servicecharge
forsew
erageconnection.
These
areprincipally
inthe
plannedm
aintow
nshipo
fT
ema
andthe
highto
medium
classresidential
areasin
Accra
District.
According
tothe
GW
SC
,m
ostresidents
inthe
metropolis
donot
want
topay
forw
aterservices.
Am
ongthe
reasonsare
thefollow
ing:
Consum
erssubject
tosupply
interruptionsm
ayfeel
theyshould
nothave
topay.
Residents
donot
seemto
appreciatethat
with
inadequatefunds
foroperational
expenses,it
isdiffIcult
forthe
GW
SC
toprovide
areliable
service.C
onsumers
canfall
backon
neighboursor
evena
tankerservice
inthe
evento
fadisconnection
fornon-paym
entofwaterbills.
Consum
ersin
thehigh
classresidential
areas,living
infenced
inbungalow
sw
ithguard
dogs,m
ayfeel
thatno
oneshould
dareto
enterand
demand
payment,letalone
attemptdisconnection,
and;In
ruralareas
inparticular,
peoplem
ayhave
become
accustomed
tothe
notionthatw
ateris
free,and
hencebe
unwilling
topay.

20
Environm
entalP
roblems
andthe
Urban
Household
inthe
GA
MA
-Ghana
Also,
asthe
GW
SC
putsit,
"sightshould
notbe
losto
fsom
econsum
ers'inability
topay
evenat
beloweconom
icrates.
The
percentageo
fpaym
entto
theearnings
of
theaverage
income
earnersignificantly
affectshis
decisionto
payfor
water
consumed
asw
ellas
tom
eetother
pressingcom
mitm
ents.F
acedw
iththis
dilemm
a,the
consumer
becomes
apatheticto
theneed
topay.
All
thesefactors
hamper
theflow
of
revenueto
theproducer
andconsequently
thecost
recoveryas
well."
(GW
SC
Materials
providedfor
study,1992).
Given
thew
idespreadpractice
of
unhygienicstorage
andhandling
of
water,
thevirtual
absenceo
fw
aterboiling
or
fIlteringand
theuse
of
dubiousw
atersources
bysom
ehouseholds,
itis
notenough
tofocus
onbringing
"water
tothe
tap"w
hatis
happening"betw
eentap
andm
outh"m
ayalso
becritical
(Lindskog
andL
undqvist,1989,
p.16).
The
evidencefrom
thephysical
testso
fw
aterquality
describedbelow
tendsto
supportthis
view.
Table
2.12illustrates
thestrong
associationbetw
eenprincipal
sourceo
fdrinking
water
andself-reported
prevalenceo
fchildhood
diarrhoeaam
onghouseholds
with
childrenunder
six.T
helocation
of
thew
atersource
alsodisplays
.aclose
association:the
two-w
eekprevalence
of
childhooddiarrhoea
among
householdsw
ithchildren
was
only7%
ifthew
atersource
was
within
thehouse,
incontrast
toa
prevalenceo
f20%
among
householdsw
hohad
theirw
atersource
locatedoutside
thehouse
compound.
Even
among
poorhouseholds
with
water
inthe
housecom
pound,the
diarrhoeaprevalence
was
low(7%
).T
hishas
potentiallyim
portantim
plicationsfor
healthpolicy,
asit
indicatesthat
theprovision
of
standpipesw
ithincom
poundhousing
units,w
hichis
lesscostly
thanin-house
piping,may
havesim
ilarhealth
benefits.
Ta
ble
2.12:R
ela
tion
ship
Be
twe
en
Drin
king
Wa
ter
So
urce
an
dP
reva
len
ceo
fD
iarrh
oe
ain
Ch
ildre
nU
nd
er
Six.
Water
Source
Ind
oo
rP
iping
Private
Standpipe
Wa
ter
Ve
nd
or
Com
munal
Standpipe
Oth
ers
Total
Num
berofhouseholds
with
children<6
yrs
162
139
165
5021
537
%tw
o-week
prevalenceo
fdiarrhoea
6.8
14.0
10.1
42.0
14.3
13.8
Data
source:Q
uestionnaireS
urveyofG
AM
A,
1991.
2.7
BacteriologicalE
xamination
ofD
rinkingW
aterSupply
Tests
were
conductedto
determine
thelevels
of
bothfaecal
coliformand
faecalstreptococci
inthe
water
householdsdrink.
Where
possible,sam
plesw
eretaken
fromboth
thehouseholds'w
atersources
andtheir
storagecontainers.
All
together,sam
plesw
eretaken
from199
households.T
hedetection
of
faecalcoliform
s(F
.e.)in
water
isconfirm
atoryevidence
of
faecalpollution
of
human
or
animal
origin.It
isam
ongthe
most
reliableindicators
of
excretalcontam
inationo
fw
ater.A
partfrom
contamination
fromexcretal
material,
F.e.
arerarely
foundnaturally
insoil,
vegetationor
water.
High
.countsindicate
heavyand
recentpollution,
lowcounts
slightor
relativelyrem
ote

Benneh
etal.21
pollution.T
heabsence
of
F.e.,
however,
isnot
anabsolute
indicationthat
thesupply
isfree
fromF
.e.,as
thecoliform
sdie
outratherrapidly
inw
ater.C
hlorinateddrinking
water
suppliesshould
ideallycontain
nofaecal
coliform(W
HO
,1984).
How
ever,it
issom
etimes
arguedthat
suchstandards
canbe
toorigorous
andim
practicalto
follow,
andlead
toan
overemphasis
onw
aterquality
incircum
stancesw
hereit
isthe
lacko
fw
aterw
hichis
more
detrimental
topublic
health(C
aimcross,
1990).In
unchlorinatedsupplies
suchas
boreholesand
handdug
wells,
F.e.
shouldnot
exceed3
organismsllO
Om
lo
fsam
ple,according
toW
HO
guidelines.F
aecalstreptococci
(F.S
.)are
unlikelyto
multiply
inw
ater,but
may
alsodie
ou
tless
rapidlythan
F.e.
They
may
thereforebe
usedto
confmn
remote
pollutiono
ffaecal
origin(K
enner,1978).
They
tendto
persistin
water
evenafter
chlorination(W
HO
1984).T
heresults
of
thehousehold
water
testsare
summ
arisedin
Table
2.13-2.15.T
hefollow
ingdiscussion
examines
fIrstthe
contamination
atthe
households'water
sources(principally
tapw
ater),and
thenthe
contamination
of
thew
aterin
householdcontainers.
Table
2.13:C
ou
nts
of
Faecalco
liform
sa
nd
Faecalstre
pto
cocci
pe
r100
mlw
ate
r(H
ou
seh
old
sg
rou
pe
da
ccord
ing
toC
lasso
fA
rea).
1.Lo
wC
lass
Areas
Tap
Faecalcoliform
sF
aecalstreptococci
n~
~
mean
2.628.4
standarddeviation
16.383.4
minim
um0
0m
aximum
150620
%contam
inated13
76
Co
nta
ine
rF
aecalcoliforms
Faecalstreptococci
129129
32.6338.2
34.0297.5
o1
1601480
88100
2.M
idd
lea
nd
Hig
hC
lass
Areas
n38
mean
0.02standard
deviation0.2
minim
um0
maxim
um1
%contam
inated3
3827.848.3o
16039
2014.817.1o5375
20144.9152.512
430100

22
Environm
entalP
roblems
andthe
Urban
Household
inthe
GA
MA
-Ghana
Ta
ble
2.1
4:
Ba
cte
riolo
gic
al
Re
sults
(Dis
trict
Le
vel).
1.Accra
District
Tap
Co
nta
ine
rF
aecalcoliforms
Faecalstreptococci
Faecalcoliforms
Faecalstreptococci
n110
110113
113m
ean2.3
26.730.9
261.5standard
deviation15.4
82.435.2
241.8m
inimum
00
01
maxim
um150
620160
1280%
contaminated
1266
85100
2.Tem
aD
istrictn
1818
1818
mean
0.0629.5
27.1604.3
standarddeviation
0.227.4
22.5452.9"
minim
um0
00
70m
aximum
182
661480
%contam
inated6
948
3100
3.G
aR
uralD
istrictn
88
1818
mean
047.8
28.6339.2
standarddeviation
29.325.6
177.9m
inimum
05
154
maxim
um0
9084
580%
contaminated
0100
100100
Ta
ble
2.1
5:
Ba
cte
riolo
gic
al
Re
sults
(GA
MA
).
4.To
talG
AM
A
nmean
standarddeviation
minim
umm
aximum
%contam
inated
Tap
Faecalcoliform
sF
aecalstreptococci136
136
1.928.3
13.975.1
o0
150620
1071
Container
Faecalcoliforms
Faecalstreptococci
149149
30.2312.3
32.8289.6
o1
1601480
87100
Data
source:T
estsundertaken
forthis
stUdy.
2.7.1B
acteriologicalQ
ualityo
fHousehold
Water
SourcesN
early56%
of
thetaps
sampled
inthe
GA
MA
duringthe
surveyw
erein
housecom
pounds.T
heothers
were
typicallyoutdoor
standpipes,eitherprivate
orpublic.
Households
which
hadno
in-housesupplies
andhad
nofree
accessto
standpipes,purchased
water
fromprivate
standpipes(w
atervendors).
Water
suppliesfrom
theG
WS
Ctreatm
entplants
areregularly
testedand
generallyfound
tobe
ofgood
qualityand
bacterial-free.T
herefore,the
presenceo
ffaecal
bacteriain
thew
atersource
suggestscontam
inationw
ithinthe
distributionsystem
.A
sindicated
inT
able2.13,
about13%
of
the98
tapssam
pledin
Low
Class
Areas
exceededthe
WH
Oguideline
of
O/lO
Om
lfor
F.e.O
nlyone
of
the38
samples
inthe
Middle-and-H
ighC
lassareas
exceededthis
guideline.C
hi-squarevalues
indicatethat
iftheextent
of
contamination
were
thesam
ein
Low
Class
and

Benneh
etal.23
Medium
-and-High
Class
Areas,
suchdifferences
would
beunlikely
(pr.<
07)to
arisein
thesam
ples.M
oreover,there
aregood
reasonsto
expectthe
water
qualityto
below
erin
poorareas
of
GA
MA
.illegal
andim
properlyfitted
connections,breakages
andloose
jointso
fpipes
which
runthrough
cesspoolsand
gutterscause
localcontam
inationo
fw
atersupply.
These
arenorm
allyfound
inthe
lowincom
eand
economically
depressedareas.
F.e.
countsranged
from0
to150/100m
lin
tapsam
plesfor
suppliesin
theL
owC
lassA
reas(T
able2.13).
Specifically,som
etaps
inA
ccraN
ewT
own,
Nim
aand
Maam
obineighbourhoods
hadF
.C.
countsgreater
thanthe
recomm
endedlevels.
F.e.
countsin
13sam
plesfrom
Accra
New
Tow
nranged
from0
to6/100m
lw
itha
mean
counto
f2.
Nim
ahad
thew
orstw
aterquality,
with
arange
of
0to
150,and
am
eano
f37
countsam
ongthe
10sam
ples.In
Accra
District
asa
whole,
12%o
ftap
water
samples
exceededthe
guidelinefor
F.e.
levels,as
compared
to6%
inthe
Tem
aD
istrict.F
aecalstreptococci
countsw
ereconsiderably
higherthan
thefaecal
coliformlevels.S
amples
fromS
abonZ
ongo,N
ima
andM
aamobi
containedparticularly
highcounts
of
F.S
.T
hem
eanF.S.
levelsw
ereo
fthe
same
ordero
fm
agnitudein
theA
ccraand
Tem
aD
istrict.T
hem
eancount
of
48in
theG
aD
istrictw
asconsiderably
higherthan
thato
fthe
otherD
istricts.T
hesupplies
inthe
Ga
districtare
however
unchlorinated.T
hehighest
counto
f620/100m
lw
asobtained
fora
supplyin
theA
ccraD
istrict,as
compared
tom
aximum
countso
f82
and90
inthe
Tem
aand
Ga
Districts
respectively(T
able2.14).
Overall,
10%o
fthe
tapw
atersam
plesin
GA
MA
exceededthe
WH
Ofaecal
coliformguideline
and71
%exceeded
theguidelines
onfaecal
streptococci(T
able2.15).
Groundw
aterand
Pond
(Ga
Rural
District)
Ahand-dug
well
anda
pondw
eresam
pledat
Oyarifa
andD
anfarespectively,both
inthe
Ga
district.T
hew
ellhad
aF
.e.value
of
1I100ml
anda
F.S.count
of470/100m
l.F
.e.count
forthe
pondw
as16/100m
lw
hilethe
F.S.level
was
480/l00ml.
'Ice-water'vendors
Tw
osurveys
were
specificallycarried
outonthe
qualityo
f'ice-w
ater'which
issold
allover
them
etropolis.In
most
market
placesand
busstations,
'ice-water'vendors
sellcold
drinkingw
aterduring
theday.
Blocks
of
iceare
putin
water
containedin
ice-boxesor
potsfor
cooling.T
hechilled
water
isdispensed
with
aluminium
orplastic
cupsfrom
thepots
orpackagedin
thincellophane
bagsfor
sale.In
thefirst
survey,faecal
coliformand
faecalstreptococci
numbers
were
detennined.In
thesecond
surveytotal
coliform,
F.C.
andF.S.
countsw
erecarried
out.N
oF
.e.w
eredetected
oneither
occasion.T
herew
erehow
eversignificantly
largecounts
of
totalcoliform
sand
F.S
.,as
indicatedin
Table
2.16.Indeed,
thelevels
of
F.S.w
ereso
highas
tow
arrantfurtherinvestigation.

24
Environm
entalP
roblems
andthe
Urban
Household
inthe
GA
MA
-Ghana
Table
2.16:B
acterialcon
cen
tratio
no
fdrin
king
water
from
'Ice-w
ater'vendors.
To
talco
liform
Faecalco
liform
Faecalstre
pto
cocci
cou
nts!
10
0m
lN
o.%
No.
%N
o.%
00
042
1000
01
-1
05
220
00
011
-100
1878
00
1433
101-
10000
00
028
67
Total
23100
42100
42100
Data
source:T
estsundertaken
forthis
study.
When
organisms
ofthe
coliformgroup
otherthan
faecalcoliform
sare
detectedin
aw
atersam
ple,the
presenceo
ffaecal
streptococciis
sufficientconfirm
atoryevidence
of
faecalcontam
ination.A
lsothe
presenceo
fcoliform
organisms
ina
water
sample
may
indicatepast
faecalcontam
inationat
atim
elong
enoughago
toallow
Ee.
todie
out.T
hefaecal
contamination
of
'ice-water'clearly
originatesfrom
sourcesoutside
theconsum
ers'households,
andis
thereforelikely
tobe
agreater
healthrisk.
Assum
ingthe
tapw
aterused
bythe
ice-water
vendorsis
ofa
qualitycom
parableto
thatused
bym
osthouseholds,
thedeterioration
probablyarises
duringthe
fillingand
dispensingo
fthecontainers.
2.7.2In-H
ouseW
aterC
ontamination
Ina
studyo
fw
atercontam
inationand
infantilediarrhoeal
diseasesin
thePhilippines,
VanD
ersliceet
al.(1991)
stressedthe
needto
improve
thequality
of
water
atthe
household'sw
atersource,
ratherthan
eliminating
in-housecontam
ination.A
mong
householdersalready
inclose
contactwith
eachother,
thereare
avariety
of
non-water-bom
eroutes.
Exposure
topathogens
harbouredby
otherhousehold
mem
bersthrough
in-housew
atercontam
inationis,
therefore,less
likelyto
becritical.
Such
considerationsm
ayapply
inA
ccra.A
higherlevel
of
in-:.house
thanat-tap
contamination
doesnot
necessarilyim
plythat
in-house·contam
inationplays
agreater
rolein
thespread
of
diarrhoealdisease.
In-housecontam
inationshould
notbe
entirelydiscounted,
however.
Indeed,in
areasw
herechildren
arelikely
todrink
fromother
households'w
atersources,
eventhe
distinctionis
questionable.G
enerally,as
indicatedin
Table
2.15,w
atersam
plesfrom
storagecontainers
were
foundto
bem
orecontam
inatedw
ithfaecal
bacteriathan
runningw
aterfrom
taps.In-house
contamination
was
estimated
byfm
dingthe
differencebetw
een83
pairedsam
pleso
fsource
water
andstored
water.
The
levelo
fin-house
contamination
was
approximated
tobe
thedifference
between
faecalbacteria
instored
water
andsource
water.
The
cumulative
effecto
fin-house
orintra-fam
ilycontam
inationo
fstored
water
ism
ostlikely
tobe
reflectedby
theincrease
inbacterial
counts.B
acterialregrow
thduring
water
storagew
asassum
edto
benegligible
atthe
time
of
sampling.
Levels
of
in-housecontam
inationare
shown
inT
able2.17.
Fivehouseholds
inG
AM
Ashow
eda
decreasein
bacterialconcentrations,
which
may
indicatebacterial
die-offor
changesin
thequality
of
the

Benneh
etal.25
fapw
aterbetw
eenthe
time
of
collectionfor
storageand
thetim
eo
fsam
pling.A
bout78%o
fstored
water
samples
hadnetincreases.
Table
2.17:Levels
of
in-h
ou
sew
aterco
nta
min
atio
nin
GA
MA
.
Ch
an
ge
inF
.co
liform
N%
Ne
tD
ecre
ase
-100to
·10
22.4
·10
to-1
33.6
Total
netdecrease5
5.8
No
cha
ng
e12
14.5
Ne
tIncre
ase
1to
1013
15.7
10to
10049
59.0
100to
10004
4.8
Totalnet
increase67
78
Total
Observation
86100.0
Data
source:T
estsundertaken
for
thisstudy.
There
area
number
of
possiblesources
of
contamination.
The
resultso
fa
small
questionnairesurvey
(199households)
indicatethat
them
ajorityo
fhouseholds
(91.6%)
usedipping
cups.(T
heuse
of
ladlesaccounts
for3%
.)T
hehigh
incidenceo
fthe
multiple
useo
fdipping
cupsw
ithinhouseholds
couldexplain
thehigh
in-housebacterial
contamination
andpossible
cross-contamination
acrossfam
ilym
embers.
Furtherm
ore,to
theextent
thatpeople,
andperhaps
childrenin
particular,visit
anddrink
water
inother
homes,
thecontam
inationcould
spreaddisease
among
householdsin
theneighbourhood.
Dirty
surroundingsand
poorpersonal
hygienecould
itselfcontribute
tocontam
inationo
fdipping
cups.A
bout75%
of
the199
householdssurveyed
inG
AM
Akept
theirdipping
cupsin
theirroom
s.A
sdescribed
below,
about5%
of
theprincipal
homem
akersin
GA
MA
neverw
ashtheir
handsw
ithsoap
andabout
50%only
washed
theirhands
with
soapone
tothree
times
aday.
The
surveyrevealed
poorhygiene
practicesin
thelow
income
neighbourhoodsw
hereall
thehouseholds
which
didnot
wash
theirhands
with
soapeven
oncea
dayw
ereidentified.
Buckets
arem
ostlyused
forcollection
of
water
eitherfrom
publicstandpipes
or
fromw
atervendors.
The
risko
fcontam
inationis
highbecause
bucketsare
usedfor
bathingand
otherhousehold
chores.

26
Environm
entalP
roblems
andthe
Urban
Household
inthe
GA
MA
-Ghana
Bo
x2.1:
Water
and
Wealth
Figure
2.3:Faecalco
liform
con
tam
ina
tion
levelsa
ttap
an
din
stora
ge
by
we
alth
gro
up
s
Code:
1•Tap
inm
edium-high
wealth
area2
-Tapin
loww
ealtharea
3·S
toragecontainerin
medium
-highw
ealtharea
4• S
toragecontainerin
loww
ealtharea
N-S
ubsample
size
Metered
Notpurchased
N=
subsample
size
.'-'0
Poor
householdsin
GA
MA
gettheleastw
ater,w
iththe
mosteffort,atthe
highestprice,anditis
more
likelyto
becontam
inatedtoo.
This
phenomenon,
probablyall
toocom
mon
incities
where
everyonedepends
onpiped
wa-
terbut
onlythe
relativelyw
ealthycan
•O
the
rafford
home
connections,is
clearlyil-
•V
endorlustrated
inthese
diagrams.
Figure
2.1portrays
theshifts
inD
Com
munalstandpipe
drinkingw
atersources
asone
moves
IIP
rivatestandpipe
fromthe
poorest20%o
fhouseholdson
•In-house
pipingthe
left,throughthe
intermediate
wealth
N=
subsample
sizequintiles,
tothe
wealthiest
20%on
theright.
The
poorerhouseholds
usesources
which
arein
herentlyless
convenient,andtypically
involvefetching
waterto
thehom
e.There
arestrong
indicationsthatthese
householdsare
notgettingenough
waterto
practicegood
hygiene,and
thatit
isaffecting
theirhealth.
There
aresignificant
differenceseven
among
thepoorest
80%o
fthe
households,all
of
which
arepoor
byinternational
standards.A
sillustrated
inF
igure2.2,these
shiftsalso
involvechanges
inthe
way
wateris
paidfor,
with
By
containero
ruse
poorerhouseholdspaying
bycontaineror
byuse,
andw
ealthierhouseholds
payingm
onthlybills
form
eteredw
ater.P
oorF
ixedm
onthlyrate
householdsfind
itdifficulttopay
relativelylarge
lump
sums
oncea
month,
andare
betterableto
make
thesm
allpayments
involved
inpurchasing
bycontaineroruse.
Butthe
priceperlitre
form
eteredw
aterisoften
lessthan
halfthatforvendor
water.
Com
poundingthese
problems,
water
fromtaps
inthe
low-w
ealthareas
were
more
oftenfound
tobe
contam
inatedthan
inm
ediumto
highw
ealthareas,as
illustrated
inF
igure2.3.
This
couldbe
dueto
theinadequate
11
'00
-1000
adhoc
pipingw
hichlocal
residentssom
etimes
lay.In
01
0-1
00
allareas
thesam
plesfrom
storagecontainers
were
con-siderably
worse
thanfrom
thetap,indicating
theim
portance
ofhousehold
hygiene.
•DII
..., 198200
200198
210
187210
187
L-MM
iddleU
-MU
pper
L-MM
iddleU
·MU
pper
Low
Low
N=
205
Fig
ure
2.1:Prin
cipa
ldrin
king
wa
ter
sou
rces
inA
ccrab
yw
ea
lthg
rou
p
Fig
ure
2.2:Distrib
utio
no
fho
use
ho
lds
by
mode
of
wa
ter
pa
yme
nt
inA
ccrab
yw
ealthg
rou
p
0%10
60%
20%
80%
40%
N=
205100°1.
100%
Data
source:Q
uestionnairesurvey
andphysicaltests,
Accra,1991.
Note:
The
wealth
groupsem
ployedin
thesediagram
sare
basedon
thesam
ew
ealthindex
employed
inthe
resto
fthe
report.H
owever,
ratherthan
threeunequal
groups(the
poorm
ajority,a
small
wealthy
elite,and
asom
ewhat
largerm
edium-w
ealthgroup),
fivegroups
of
roughlyequal
sizehave
beencreated
forthe
graphicalpresentation.

Benneh
etal.
CH
AP
TE
RT
HR
EE
27
3S
AN
ITA
TIO
NF
AC
ILIT
IES
3.1Introduction
Sanitation
managem
entis
closelylinked
topotable
water
supply,and
isalso
anim
portantfacet
of
thehousehold
environment,
with
important
healthim
plications(E
sreyand
Habicht,
1986).T
hischapter
addressesaccess
tosanitation
facilities,prevalence
of
outdoordefecation
andhygiene
behaviour.The
disposalo
fsullage
orgrey
water
isalso
brieflydiscussed.
3.2A
ccessto
SanitationF
acilitiesO
fthe
threecom
munity
water-borne
sewerage
systems
inthe
country,tw
oare
inT
ema
andA
ccraD
istricts,w
ithinthe
Metropolitan
Area.
InA
ccraD
istrictthere
isa
centralsew
eragesystem
which
was
designedin
·1971and
intendedfor
theA
ccraand
Tem
atow
nshipsand
theirfuture
extensions.D
ueto
lackof
funds,only
thefirst
phasew
asconstructed
andthis
isknow
nas
theC
entralA
ccraS
ewerage
System
andis
underthe
managem
ento
fthe
Ghana
Water
andS
ewerage
Corporation
(GW
SC
).A
so
fthe
endo
fthe
firstquarter
of1992,
therehave
been482
connectionsconsisting
ofthe
following:
187com
mercial
properties,166
domestic
properties,15
industrialproperties,and
114institutional
andpublic
services.
Since
theC
entralA
ccraS
ewerage
Systemfalls
within
theC
entralB
usinessD
istricto
fAccra,together
with
some
denselypopulated
innercity
residentialareas,
thelayout
hasbeen
deliberatelym
adeto
pickup
flows
fromabout
40public
toiletsin
thearea.
Due
tolack
of
awareness
of
theexistence
of
sucha
facility,coupled
with
highconnection
fees,there
arenot
asm
anyconnections
asanticipated
inthe
design.P
rospectiveconnectors
tothe
systemare
furtherdissuaded
bythe
surchargeo
f35%
of
them
onthlyw
aterbillfor
sewerage
services.T
hiscreates
lowflow
sand
subsequentsew
erm
aintenanceproblem
s(G
WS
C,
documents
compiled
forcurrent
study,1992).
Other
para-statalorganisations
provideeven
more
limited
sewer
systems
andtreatm
entplants
invarious
partso
fA
ccra.T
heseare
restrictedto
Teshie-N
ungua,L
aboneand
Dansom
anE
states,m
ilitarybarracks,
hospitals,m
inistriesand
theU
niversityo
fGhana.
These
systems
togetherserve
onlya
privilegedfew
inthe
highand
medium
classresidential
areas.B
ycontrast,
theplanned
township
ofT
ema
within
Tem
aD
istricthasa
modem
sewerage
systemw
hichhas
continuedto
expandto
newhousing
developments.
This
however,excludes
Tem
aN
ewT
own,the
squattersettlem
ento
fAshiam
anand
otheroutlying
settlements
within
thedistrict.
Ga
District
hasno
sewerage
system.
Consequently
therange
of
sanitationfacilities
isquite
diverse,depending
onthe
comm
unityor
neighbourhoodcharacter.
Table
3.1below
shows
theproportions
ofhouseholds
servedby
differenttypes
of
toiletfacility.
Inthe
metropolis
asa
whole,
about35%
areserved
byflush
toiletfacilities.
(Flush-sew
eredand
flushseptic
tanksare
classedtogether
becauseo
fthe
confusionrespondents
sometim
esm
adebetw
eenthe
two.)
The
more
comm
onfacilities
arethe
pitlatrines,
which
togetherserve
about40%
of
thepopulation.

28E
nvironmentalP
roblems
andthe
Urban
Household
inthe
GA
MA
-Ghana
Aboutone
infour
pitlatrineusers
reportedthat
theyw
ereusing
Kum
asiV
entilatedIm
provedP
it(K
VIP
)latrines,
which
arepit
latrinesw
ithan
improved
designbeing
promoted
asan
alternativeto
thepan
latrines.A
lmost
20%o
fthe
householdsstill
usedpan
orbucket
latrines,w
hichm
ustbe
emptied
frequently,typically
througha
hatchin
theouter
wall
of
thetoilet.
Three
percent
ofthe
respondentsclaim
edto
haveno
accessto
anytoiletfacility.
Ta
ble
3.1
:D
istrib
utio
no
fH
ou
seh
old
sb
yT
ype
of
To
ilet
Fa
cility.
District
Total
Type
ofT
oile
tA
ccraT
ema
Ga
GA
MA
No.
%N
o.%
No.
%N
o.%
No
Toilet
111.5
63.8
1310.4
30
3.0F
lushT
oilet240
33.691
56.924
19.2355
35.5P
itLatrine232
32.426
16.352
41.6310
31.0K
VIP
Latrine5
98.3
3320.6
129.6
10410.4
Pan
Latrine170
23.84
2.521
16.8195
19.5O
ther3
0.43
2.46
0.6
Total
715100.0
160100.0
125100.0
1000100.0
Data
source:Q
uestionnaireS
urveyof
GA
MA
,1991.
Whereas
98%
of
allw
ealthyhouseholds
hadaccess
toflush
toiletfacilities,
68%and
26%o
fm
ediumincom
eand
poorhouseholds
respectivelybenefited
fromsuch
facilities.T
hem
ostpopular
singlefacility
forthe
pooris
thestandard
pitlatrine,
as36%
of
thepoor
dependedon
it(T
able3.2).
About
22%o
fthe
poorw
ereusing
panlatrines,
which
arenot
onlyconsidered
tobe
sub-standardfor
thehouseholds
themselves,butdegrading
forthe
collectors.
Ta
ble
3.2:R
ela
tion
sh
ipB
etw
ee
nT
ype
of
To
ilet
Fa
cilitya
nd
Ho
use
ho
ldW
ea
lth(%
).
Wealth
Indexo
fHousehold
Typ
eo
fTo
ilet
LowM
edium
Flush-sew
ered12.3
35.9F
lush-septic14.1
32.1
PitLatrine
35.812.2
KV
IP12.1
3.8
Pan
Latrine22.1
10.7
Other
0.7
No
Toilet
2.85.3
Total
100.0100.0
(N)
(818)(131)
High
49.049.0
2.0
100.0(51)
-----------------------------_
---.:
•.~\D
atasource:
Questionnaire
Survey
ofGA
MA
,1991.

Benneh
etal.29
Table
3.3show
sthe
relationshipbetw
eenthe
typeoftoiletfacility
andthe
selfreported
prevalenceo
fchildhood
diarrhoea(tw
ow
eekrecall)
among
householdsw
ithchildren
undersix.
Ta
ble
3.3
:T
yp
eo
fT
oile
tF
acility
an
dP
reva
len
ceo
fD
iarrh
oe
ain
Ch
ildre
nU
nd
er
6(%
).
Type
ofT
oile
t
Flush
Toilet
Pit
latrin
eK
VIP
latrin
eP
anla
trine
No
Toilet
Total
Num
bero
fHouseholds
with
Children
<6yrs
1641756611317
535
%prevalence
ofd
iarrh
oe
a
6.715.421.216.011.8
14.0
Data
source:Q
uestionnaireS
urveyofG
AM
A,
1991.
The
low-cost
facilities,including
thepotentially
more
hygienicK
VIP
latrines,are
associatedw
itha
considerablyhigher
diarrhoealprevalence.
Ithas
beenfound
thatthe
KV
IPtechnology,
when
usedas
acom
munal
facility,often
doesnot
operatew
ell,and
many
ofthose
builtfor
comm
unaluse
havenot
beenconstructed
accordingto
standard.M
oregenerally,
theseresults
areat
leastas
likelyto
reflectproblem
so
fm
aintenanceand
crowding
asthey
areto
reflectdeficiencies
inherentto
thetechnologies
themselves.
There
isa
highincidence
oftoiletsharing.T
able3.4
indicatesthat
only28%
ofhouseholds
didnot
sharetheir
toiletfacilities.
By
contrast,about
41%
of
thepopulation
within
them
etropolisrelied
oncom
munal
facilitiesopen
tothe
whole
neighbourhood.A
lthoughm
ostpeople
usingpan
latrinesalso
sharedfacilities,
thisw
asnorm
allyrestricted
totenants
within
thehousing
unit.
Ta
ble
3.4
:N
um
be
ro
fH
ou
se
ho
lds
Sh
arin
gT
oile
tF
acility.
Nu
mb
er
ofH
ou
se-
District
Total
ho
lds
Sh
arin
gA
ccraT
ema
Ga
GA
MA
No.
%N
o.%
No.
0/0N
o.0/0
No
Sharing
19227.5
4831.2
2623.2
26627.6
1-
5119
17.118
11.731
27.7168
17.4
6-
1065
9.38
5.212
10.785
8.8A
bove10
456.5
63.9
43.6
555.7
Whole
Neighbourhood
27639.6
7448.1
3934.8
38940.5
Total
697100.0
154100.0
112100.0
963100.0
Data
source:Q
uestionnaireS
urveyofG
AM
A,
1991.
About
33%o
fthe
householdssurveyed
reportedthat
theydid
notm
akeregular
payments
forthe
useo
fthe
toilet,w
iththe
highestpercentage
inG
aD
istrict,w
herethe
enforcement
of
usercharges
isnot
asstrict
asfor
Accra
andT
ema
Districts.
InA
ccraand
Tem
a,the
householdsindicating
freeaccess
totoilet

30
Environm
entalP
roblems
andthe
Urban
Household
inthe
GA
MA
-Ghana
facilitiesw
eregenerally
thosew
ithin-house
flushtoilet
facilities.M
anyo
fthese
householdshave
topay
forthe
removal
of
sewage
fromtheir
septictanks
atthe
rateo
fabout
7,000cedis
pertrip
made
bythe
cesspoolem
ptiers.S
ome
82%of
householdspaying
dailyuser
chargesspentbetw
een10
to60
cedisper
day.T
hisis
thecom
mon
practicein
lowclass
residentialareas
with
publicpit
latrinesand
KV
IPs.T
hem
ostcom
mon
chargeis
fivecedis
peruse
andanother
fivecedis
forpaper
tobe
usedas
analcleansing
material
forthose
without
theirow
npaper.
Households
bringinghum
anexcreta
inbow
lsm
aybe
chargeda
20cedis
penalty.
3.3P
revalenceo
fOutdoor
Defecation
Insufficientcom
munal
facilitiescan
leadto
opendefecation
alongbeaches,
drainsand
openspaces.
Indeed,the
resultsindicate
thatopen
defecationis
closelyrelated
tothe
percentageo
fthe
populationw
horely
onthe
pitlatrine
andthe
publicK
VIPs.
Itw
ouldseem
thatoutdoor
defecationis
anoutcom
eo
flong
queuesat
comm
unaltoilet
facilitiesas
well
aspoor
maintenance.
These
factorsdo
notonly
poseinconvenience
forusers
butalsocreate
am
ajorpublic
hazard.A
bout35%
of
thepopulation
inthe
metropolis
reportedthat
therew
eretim
esw
henhousehold
mem
bersfound
itinconveriienttouse
theirregular
toilets,and
hadto
usean
alternativesite.
Not
surprisingly,such
problems
arem
oreprevalent
among
thepoor.
For
example,
about96%
ofall
householdsw
hofelt
inconveniencedin
theuse
of
toiletfacilities
were
poor.H
owever,
theG
aD
istrict,w
hichlies
inthe
peri-urbanzone,
hada
valuew
ellbelow
theaverage
forG
AM
A,
althoughis
hasthe
highestproportiono
fpoorhouseholds
(Table
3.5).
Ta
ble
3.5:H
ou
seh
old
sH
avin
gh
ad
toF
ind
Alte
rna
tiveS
iteD
ueto
Pro
ble
ms
Acce
ssing
or
Usin
gR
eg
ula
rT
oile
tb
yD
istrict.
District
No
Yes
Ta
taI
No.
%N
o.%
No.
%
Accra
46466.0
23934.0
703100.0
Te
ma
8253.2
7246.8
154100.0
Ga
8576.6
2623.4
111100.0
To
talG
AM
A631
65.1337
34.9968
100.0
Da
taso
urce
:Q
uestionnaireS
urveyof
GA
MA
,1991.
Of
thehouseholds
affected,a
disproportionatenum
berw
erehouseholds
sharingtoilets
with
more
thanfive
otherhouseholds
(Table
3.6).Indeed,
more
thanthree
quarterso
fthe
householdssharing
comm
unaltoilets
encounteredsuch
problems,
compared
toless
thanone
inten
householdsw
iththeir
own,
unshared,toilet.

Benneh
etai.
Ta
ble
3.6
:H
ou
se
ho
lds
En
co
un
terin
gP
rob
lem
sA
cce
ssin
go
rU
sin
gb
yL
eve
lo
fS
ha
ring
.
Sh
arin
gN
um
be
rP
ercentage
No
Sharing
164.8
1-
532
9.66
-10
4112.2
Above
10
298.7
Whole
Neighbourhood
21764.8
Total
335100.0
Data
source:Q
uestionnaireS
urveyofG
AM
A,
1991.
Note:
This
tableonly
includeshouseholds
which
encounteredproblem
s.
31
The
most
comm
onreasons
householdsgave
forhaving
tofm
danother
locationto
defecatew
eredirectly
relatedto
accessibility:o
fthose
affected,56%
mentioned
thatthe
toiletw
assom
etimes
outo
forder
orlocked-up,
47%that
thequeues
were
sometim
estoo
long,and
45%that
thetoilet
was
sometim
eslocked
(more
thanone
responsew
asallow
edfor).
No
otherreasons
were
citedby
more
thana
quartero
fthose
householdsaffected,
with
costonly
mentioned
byabout
12%.
Abreakdow
no
fthe
frequencyo
fdifferent
responsesin
eachdistrict
isprovided
inT
able3.7.
InA
ccra,long
queuesw
erethe
most
comm
onlycited
reason,w
hilein
bothT
ema
andG
athe
toiletsbeing
outof
orderw
ascited
more
thantw
iceas
oftenas
longqueues.
Ta
ble
3.7
:R
ea
so
ns
Giv
en
for
Se
ekin
gA
ltern
ativ
eL
oca
tion
for
De
feca
tion
.
District
To
tal
Circu
msta
nce
sA
ccraT
ema
Ga
GA
MA
No.
%N
o.%
No.
%N
o.%
Children
Don't
Alw
aysU
seT
oilet39
7.914
8.57
16.360
8.5O
utofOrder
10721.6
6237.8
1637.2
18526.3
Nighttim
e15
3.012
7.33
7.030
4.3
Cost
357.0
42.4
12.3
405.7
Early
Morning
6913.9
63.7
613.9
8111.5
Queue
toolong
13126.4
1811.0
716.3
15622.2
Lockedup
10020.2
4829.3
37.0
15121.5
Num
berof
Responses
496164
43703
Data
source:Q
uestionnaireS
urveyofG
AM
A,
1991.
Note:
As
some
householdsgave
more
thanone
response,the
percentagesare
notequalto
thepercentage
ofrespondinghouseholds.
Only
householdssaying
theyhad
hadto
seekalternative
locationsare
included.
These
problems
quiteclearly
leadto
opendefecation,
notonly
onthe
partof
children,but
alsoadults.
Table
3.8pertains
onlyto
those30%
of
allhouseholds
where
adultsare
affected.A
bouthalf
reportusing
othertoilets,
while
most
of
therem
ainderadm
itto
defecatingin
theopen.
(Of
thehouseholds
who
indicated"other
place",m
ostw
ouldhave
usedthe
bushor
the"w
rapperm
ethod"in
which
peopledefecate
inpolythene
bagsor
paperw
hichis
thenthrow
nin
guttersor
into

32
Environm
entalP
roblems
andthe
Urban
Hou$ehold
inthe
GA
MA
-Ghana
comm
unalw
astecontainers.)
This
may
underestimate
theextent
of
theproblem
,as
under-reportingis
comm
onw
henpeople
arequestioned
onpractices
known
tobe
frowned
upon.
Ta
ble
3.8
:P
lace
for
Ou
tdo
or
De
feca
tion
for
Ad
ults
.
District
Total
Pla
ceA
ccraT
ema
Ga
GA
MA
No.
%N
o.%
No.
%N
o.%
On
Land19
9.727
36.512
34.358
19.0R
iveror
Stream
21.0
12.9
31.2
Beach
4523.1
79.5
5217.1
OtherT
oilet126
64.618
24.410
28.6154
50.6O
therP
lace3
1.522
29.712
34.337
12.1
Total
195100.0
74100.0
35100.0
304100.0
Data
source:Q
uestionnaireS
urveyofG
AM
A.
1991.N
ote:O
nlyincludes
householdsw
hoseadults
hadencountered
problems
usingregular
toilet.
One
would
expectm
oreopen
defecationam
ongchildren,
astheir
knowledge
of
personalhygiene
andthe
needfor
privacyis
lower.
Yet
itis
preciselychildren
who
arem
ostat
riskbecause
of
theirgreater
vulnerability.M
oreover,children's
faecestend
tocreate
ahigher
healthrisk,
dueto
ahigher
concentrationo
fdangerous
pathogens.F
orthe
metropolis
asa
whole,
about100
respondents(10%
)reported
thatchildren
intheir
neighbourhoodfrequently
defecatedoutdoors
and263
respondents(26%
)indicated
thatchildren
sometim
espractised
opendefecation
(Table
3.9).In
them
ajorityo
fcases,
thisinvolved
defecatingon
land(58%
)o
rat
abeach
(13%).
Low
classresidential
areasw
erethe
most
severelyaffected.
Ta
ble
3.9
:In
cid
en
ce
of
Ou
tdo
or
De
feca
tion
by
Ch
ildre
nw
ithin
the
Ne
igh
bo
urh
oo
d.
Response
District
Never
Som
etimes
Re
gu
larly
Total
No.
%N
o.%
No.
%N
o.%
Accra
50270.2
19126.7
223.1
715100.0
Tem
a72
45.036
22.552
32.5160
100.0G
a63
50.436
28.826
20.8125
100.0
TotalG
AM
A637
63.7263
26.3100
10.01000
100.0
Data
source:Q
uestionnaireS
urveyofG
AM
A.
1991.
The
two-w
eekprevalence
of
childhooddiarrhoea
among
the(145)
householdssaying
neighbourhoodchildren
atleast
sometim
esdefecate
out-of-doorsat
thebeach
or
onopen
landis
26%;
more
thanthree
times
theprevalence
among
householdssaying
thatchildrennever
defecateoutdoors.

Benneh
etal.33
3.4H
ygienea
nd
Hand
washing
Practices
Given
thelow
amenity
valueo
fm
ostneighbourhood
environments,
characterisedby
inadequatesanitary
andsolid
waste
disposalfacilities,
goodhygiene
isnecessary
ifhouseholds
(more
especiallyw
omen
andchildren)
areto
reducethe
environmental
risksthey
areexposed
to.A
ndyet,
asalready
indicated,access
tow
ater,w
hichis
vitalfor
householdhygiene,
isfar
fromsatisfactory.
Hand
washing
practiceso
fthe
principalhom
emaker
areused
hereas
anindicator
of
hygiene.If
onecan
expectopen
defecationto
beunder-reported,
theopposite
istrue
of
handwashing~
Respondents
may
sometim
esdescribe
thehand
washing
practicesthey
believethey
shouldfollow
,rather
thanthose
theyactually
do.T
heresponses
aretherefore
likelyto
fallsom
ewhere
between
actualand
desiredpractice
onthe
parto
fthe
respondents.V
irtuallyall
principalhom
emakers
reportedw
ashingtheir
handsw
ithat
leastw
aterat
leastonce
aday,
andabout
63%claim
edto
wash
theirhands
more
thanseven
times.
Asm
allpercentage(5%
)did
notreport
washing
theirhands
with
soapeven
oncea
day,w
iththe
majority
(63%)
usingsoap
between
oneand
4tim
esa
day.T
able3.10
shows
thatlow
levelso
fhand
washing
were
reportedm
orefrequently
inG
aD
istrict,w
hilehigh
levelsw
erem
ostoften
reportedin
Accra
District.
The
differencesbetw
eentypes
of
neighbourhoodare
more
striking.O
nlyone
of
thefIfty
principalhom
emakers
livingin
highclass
areasreported
washing
herhands
lessthan
fIvetim
esa
day,as
compared
to14%
inthe
lowclass
areas.M
oreover,all
principalhomem
akersliving
inhigh
classareas
wash
theirhands
with
soapatleasttw
ice,w
hereas13%
ofthose
inlow
classareas
donot.
Ta
ble
3.10:F
req
ue
ncy
of
Hand
Wa
shin
gb
yP
rincip
alH
om
em
ake
rb
yD
istrict.
Tim
es!
District
To
tal
Da
yA
ccraT
ema
Ga
GA
MA
No.
%N
o.%
No.
%N
o.%
·0to
483
11.616
10.328
22
.8'
12712.8
-5
to8
15021.0
5736.5
3629.3
24324.5
·8+
48067.3
8353.2
5948.0
62262.7
Total
713100.0
156100.0
123100.0
992100.0
Data
source:Q
uestionnaireS
urveyofG
AM
A,
1991.
Tw
oo
fthe
times
when
handw
ashingis
criticalare
afterdefecation
andprior
topreparing
food.T
heprincipal
homem
akersw
ereasked
atw
hichtim
esthey
always
wash
theirhands.
About
91%
saidthey
always
washed
theirhands
afterusing
thetoilet,
while
only74%
saidthey
didbefore
preparingfood.
Moreover,
among
thosew
hodid
wash
theirhands,
itw
asm
orecom
mon
touse
soapafter
usingthe
toiletthanbefore
preparingfood.
There
isquite
aclose
relationbetw
eendiarrhoea
prevalenceand
handw
ashing,particularlyhand
washing
priorto
foodpreparation.
As
indicatedin
Table
3.11,am
onghouseholds
where
handsw
erenot
washed
beforefood
preparation,the
prevalenceo
fdiarrhoeaw
asseveraltim
eshigher
thanam
onghouseholds
where
handsare
regularlyw
ashedw
ithsoap
andw
ater.Hand
washing,
andindeed
theuse
of
soap,is
lessdiffIcult
when
water
iseasily
accessible,how
ever.T
hus,like
many

34
·E
nvironmental
Problem
sand
theU
rbanH
ouseholdin
theG
AM
A-G
hana
hygienepractices,
handw
ashingis
likelyto
involvea
combination
of
householdnorm
sand
facilities.
Ta
ble
3.11:H
andw
ash
ing
Be
fore
Preparing
Fo
od
an
dthe
Prevalence
of
Diarrhoea
inC
hild
ren
Un
de
r6.
Re
spo
nse
Doesn'tM
ention
Wa
ter
Water
or
Soap
Soap
andW
ater
Total
Nu
mb
er o
fH
ou
seh
old
s
with
Ch
ildre
n<
6
132
223
10560
520
Tw
ow
ee
kD
iarrh
oe
aP
reva
len
ce(%
)
22.1
12.1
12.4
3.0
13.7
Data
source:Q
uestionnaireS
urveyof
GA
MA
,1991.
As
indicatedin
Table
3.12,the
useo
fstandpipes,
especiallypublic
ones,w
asassociated
with
lowlevels
of
handw
ashingw
hethero
rnot
theprincipal
homem
akerhad
receivedany
formal
education.Indeed,
thedifferences
inhand
washing
arem
oreevident
acrosshouseholds
usingdifferent
water
sourcesthan
acrosseducation
levels.It
isoften
arguedthat
water
improvem
entsshould
beaccom
paniedby
hygieneprogram
mes
toensure
thebenefits
of
thew
aterare
fullyutilised.
These
resultssuggest
analternative
message
may
beequally
valid:w
ithoutbetter
water
supplies,improved
hygieneaw
arenessm
ayprove
ineffective.
Ta
ble
3.12:P
ercentageo
fP
rincip
alH
om
em
ake
rsW
ash
ing
Hands
Prio
rtoF
oo
dP
rep
ara
tion
by
Ed
uca
tion
an
dW
aterS
ou
rce.
Le
velo
fE
du
catio
n
Drin
king
No
Ed
uca
tion
Som
eE
du
catio
n
Wa
ter
Nu
mb
er
of
Per
cen
tN
um
be
ro
fP
erce
nt
So
urce
Re
spo
nd
en
tsN
otW
ash
ing
Re
spo
nd
en
tsN
otW
ash
ing
Ha
nd
sH
ands
Indoorpiping
5721.1
29117.2
Vendors
10221.6
17122.2
Private
standpipe54
38.9183
38.9
Public
standpipe27
55.654
40.7
Oth
er
1833.3
2422.3
Total
25829.5
72324.9
Data
source:Q
uestionnaireS
urveyof
GA
MA
,1991.
While
soapis
nota
largeitem
inhousehold
budgets,its
priceis
sufficientlyhigh
toinfluence
some
households.A
lso,toilets
andkitchens
inw
ealthyhouseholds
arem
orelikely
tobe
designedto
make
handw
ashingeasy.
The
resultsindicate
thatnot
onlyw
ashand
washing
lesscom
mon
among
poorhom
emakers,
bu
tw
henthey
didw
ashtheir
handsthey
were
lesslikely
touse
soap.F
or
example,
among
homem
akersw
how
ashedhands
priorto
foodpreparation,
only41
%from
po
or
householdsat
leastsom
etimes
usedsoap,
ascom
paredto
54%and
74%from

Benneh
etal.35
medium
-wealth
andw
ealthyhouseholds
respectively.T
able3.13
illustratesthe
relationbetw
eenw
ealthand
hygieneeven
more
clearly,using
theexam
pleo
fhand
washing
afterusing
thetoilet.
About
94%o
fprincipal
homem
akersfrom
wealthy
householdsw
ashedtheir
handsand
atleast
sometim
esused
soap.O
nly57%
of
poorhouseholds
practisedthis
goodhygiene
behaviour,although
overallthese
valuesare
higherfor
toiletusethan
forfood
preparation.
Ta
ble
3.1
3:
Re
latio
nsh
ipB
etw
ee
nH
ou
se
ho
ldW
ea
lthS
tatu
sa
nd
Ha
nd
Wa
shin
gA
fter
To
ilet(%
).
Wealth
Ind
ex
ofH
ou
seh
old
Response
Lo
wM
ediumH
igh
Doesn't
always
wash
9.510.2
Water
only32.1
15.05.9
Wateror
Soap
andW
ater29.4
40.239.2
Alw
aysS
oapand
Water
29.134.6
54.9
Total
100.0100.0
100.0(N
)(814)
(127)(51)
Data
source:Q
uestionnaireS
urveyofG
AM
A,
1991.
3.5Sullage
an
dStorm
Water
Drainage
"Sullage
orgrey
water
isthe
liquidw
astew
aterdischarged
fromdom
esticprem
isesand
consistso
feffluents
fromkitchens,
bathrooms
andlaundries.
Sullage
isnorm
allydischarged
intostreet
drainsor
intosoak-aw
ays.T
hebulk
of
householdw
ateruse
becomes
sullage.E
venin
thosehouseholds
with
flushtoilets
itis
estimated
thatsullage
amounts
to60%
of
totalw
ateruse"
(Tahal,
1981,p.
C.2
12).Table
3.14illustrates
thepatterns
ofsullage
disposalw
ithinthe
metropolis.
Ta
ble
3.1
4:
Me
tho
ds
of
Ho
use
ho
ldS
ulla
ge
(Gre
yW
ate
r)D
ispo
sal.
Disp
osa
lD
istrictT
otalP
ractice
Accra
Tem
aG
aG
AM
A
No.
0/0N
o.%
No.
%N
o.%
Sam
eas
Sew
erage11
1.520
12.511
8.842
4.2
Closed
Separate
drains43
6.019
11.97
5.669
6.9O
penS
eparatedrains
38353.6
6540.6
129.6
46046.0
Nearby
Waterw
ay44
6.26
4.850
5.0D
umped
inS
treet8
712.2
53.1
3528.0
12712.7
Dum
pedin
Yard
14520.3
5031.3
5241.6
24724.7
Other
20.3
10.6
21.6
50.5
Total
715100.0
160100.0
125100.0
1000100.0
Data
source:Q
uestionnaireS
urveyofG
AM
A,
1991.
Open
separatedrains
were
theprincipal
means
of
sullagedisposal
among
46%o
fthe
householdssurveyed.
The
betterm
ethods,including
closedseparate
drains

36E
nvironmentalP
roblems
andthe
Urban
Household
inthe
GA
MA
-Ghana
andsew
erageor
septictanks,
were
hardlyused.
The
leastsatisfactory
methods
ofstreet
andyard
dumping
accounttogether
forover
37%of
householdsullage
disposalm
ethods.T
able3.15
shows
therelationship
between
householdw
ealthstatus
andthe
means
of
sullagedisposalavailable.
Yard
andstreet
dumpirig
were
more
comm
onlypractised
among
poorand
medium
wealth
households.T
om
akem
attersw
orse,in
lowclass
residentialareas
andthe
slums,
some
ofthe
openseparate
drainsm
entionedare
nothingm
orethan
mere
naturalchannels
alongw
hichsullage
flows
fromholes
made
throughw
allso
fbuildings.
This
water
oftenends
ina
roadsideditch.
Consequently,stagnantpools
ofw
aterare
comm
onin
theseneighbourhoods.
Ta
ble
3.1
5:
Re
latio
nsh
ipB
etw
ee
nH
ou
se
ho
ldW
ea
ltha
nd
Me
tho
do
fS
ulla
ge
Dis
po
sa
l.
Lo
wM
ediumH
ighA
llD
ispo
salP
ractice
%%
%%
Sam
eas
Sew
age/Septic
Tank
2.89.2
13.73.2
Closed
Separate
Drain
4.316.0
23.56.9
Open
Separate
Drain
46.042.7
54.946.0
Nearby
Waterw
ay5.9
2.35.0
Dum
pedin
Street
14.27.6
2.012.7
Dum
pedin
Yard
26.421.4
5.924.7
Other
0.50.8
0.5
Total
100.0100.0
100.0100.0
(N)
(818)(131
(51)(1000)
Data
source:Q
uestionnaireS
urveyof
GA
MA
,1991.
As
aresult
of
theoverall
poorw
astew
aterdisposal
system,
togetherw
iththe
factthat
largeareas
liein
floodprone
areasless
than20
metres
abovesea
level,flooding
hasbecom
ecom
mon.
As
illustratedin
Table
3.16,som
eo
fthe
more
severefloods
havecaused
seriousdam
ageand
evenloss
oflife.
Ta
ble
3.1
6:
Ma
jor
Flo
od
Eve
nts
inth
eM
etro
po
litan
Are
a.
Ye
ar
Accra
District
1963floods
july
1973floods
May
1986floods
Te
ma
District
1.1988
floods
Dam
ageca
use
d
5deaths
anddam
ageto
property.
Extensive
floodsw
ith3
deathsand
lossof
property.
Lossof3
lives,dam
ageof
property&
telephonesw
itchingequipm
entworth
US
$10m
illionand
loss
ofpropertyof
residents.
InundationofpartofT
ema
Sew
age.
System
anddam
ageofproperty
incom
munities.
Data
source:E
nvironmentalM
anagementA
ssociatesLtd.,
1989,p.
114.

Benneh
etaL.37
Bo
x3.1:
San
itation
Facilities
and
Wealth
N=
205187
210200
198
Fig
ure
3.1:Distrib
utio
no
fho
use
ho
lds
by
type
of
toile
tfacility
inA
ccrab
yw
ealthg
rou
p
GA
MA
'soverallprofile
ofsanitation
technologiesis
superiorto
thatfor
mosto
fGhana,w
ithm
orethan
athird
ofhouseholds
havingflush
toilets.But
asillustrated
inF
igure3.1,sanitation
technologyis
closelylinked
tow
ealth,and
forG
AM
A's
poorm
ajoritythe
flushtoilets
arelargely
irrelevantandcom
munal
pitlatrines
arethe
most
comm
onfacility.
Pit
latrineso
fim
proved
design(K
VIP
)are
becoming
increasinglycom
mon,butexisting
facilities
areso
overusedthatany
technologicaladvantage
islost.
As
illustratedin
Figure
3.2,most
poorhouseholdsshared
latrinesw
ithm
orethan
tenother
households.A
lm
osttwo
outofthree
householdsus
ingcom
munal
facilitiescom
plainedthatthere
were
times
when
thelatrines
were
unusablebecause,for
example,
thequeues
were
toolong
inthe
morn
ingsorthe
latrinesw
eresim
plyouto
forder.
Inneighbourhoods
with
overcrow
dedsanitary
facilities,children
oftenpractised
opendefecation.
Not
surprisingly,recentcaseso
fdiarrhoeaw
erecom
mon
amo
ng
childrenin
householdsusing
heavilyshared
toilets.
•O
the
r/no
ne
oP
anLatrine
•P
itLatrine
•F
lush
N=
Su
bsa
mp
lesize
IN
oresponse
DS
harew
ith>10
hh
•S
harew
ith5.10
hh
IN
otshared
N=
Subsam
plesize
200198
LowL-M
Middle
U-M
Upper
0%
60%
40%
N=
205187
210
80%
20%0%
60%
40%
20%
80%
100%
LowL·M
Middle
U·M
Upper
Fig
ure
3.2:Distrib
utio
no
fho
use
ho
lds
by
nu
mb
ersh
arin
gto
iletfa
cilityin
Accra
by
we
alth
gro
up
(hh
=h
ou
seh
old
s)
Data
source:Questionnaire
surveyofA
ccra,1991.
Note:
The
wealth
groupsem
ployedin
thesediagram
sare
basedon
thesam
ew
ealthindex
employed
inthe
resto
fthe
report.H
owever,rather
thanthree
unequalgroups
(thepoor
majority,a
small
wealthy
elite,anda
somew
hatlargerm
edium-w
ealthgroup),
fivegroups
of
roughlyequal
sizehave
beencreated
forthe
graphicalpresentation.

38
Environm
entalP
roblems
andthe
Urban
Household
inthe
GA
MA
-Ghana
CH
AP
TE
RF
OU
R
4S
OL
IDW
AS
TE
DISPO
SAL
SYST
EM
SA
ND
PR
AC
TIC
ES
4.11ntroductionT
hischapter
isprim
arilyconcerned
with
refuserather
thannight
soil.H
owever,
owing
tothe
sanitationproblem
so
fG
AM
A,
nightsoil
oftenfinds
itsw
ayinto
therefuse.F
urthermore,nightsoil
collection,likerefuse
collection,isthe
responsibilityo
fthe
Waste
Managem
entDepartm
ent.The
collectionand
disposalo
fsolid
wastes
andnight
soildeteriorated
progressivelyfrom
1976,reaching
acrisis
in1985.
As
aresult,
theentire
cityw
as"engulfed
with
refuseheaps,
drainsand
gutterschoked
andpublic
septictank
latrinesover-flow
ing.In
thehom
es,a
similar
situationalso
couldbe
foundw
ithseptic
tankso
fWater
Closets
dischargingeffluents
freelyinto
drainsand
compounds."
(Chief
Mechanical
Engineer,
Waste
Managem
entD
epartment,
1992).T
heproblem
of
solidw
astedisposal,
excludingnight
soil,m
aynot
haveas
serioushealth
implications
asthe
water
andsanitation
problems
describedin
theprevious
two
chapters,but
hasbecom
e·one
of
them
oreintractable
waste
managem
entproblem
s.T
hisproblem
developedw
iththe
economic
crisiso
fthe
mid
'70sand
early'80s,
asthe
publiccollection
servicedeclined
dueto:
lacko
ffunds
forthe
acquisitionof
capitalequipm
entand
theoperation
of
theservices,
regularbreakdow
no
fvehicles,plantand
equipment,
lacko
fadequate,trainedand
motivated
personnelinappropriate
managem
entorganisation.
With
theestablishm
ento
fthe
Waste
Managem
entD
epartment
in1985,
equippedand
fundedw
ithG
erman
assistance,the
problemstarted
tobe
tackled.H
owever,
theD
epartment
"isstill
capableof
collectingonly
60%o
fthe
900tons
perdiem
of
refuseand
about300
tonsof
nightsoil."
(Chief
Mechanical
Engineer,
Waste
Managem
entDepartm
ent,1992).
4.2H
andlingo
fSolidW
astes4.2.1
Household-L
evelStorage
andD
isposalPractices
Residential
domestic
waste
forms
thebulk
ofall
sourceso
fsolid
waste
producedin
Ghanaian
urbanareas.
These
householdsolid
wastes
areknow
nto
havehigh
densitiesw
itha
highm
oisturecontent.
The
organiccom
ponento
fsolid
waste
which
isputrescible
probablyaccounts
forbetw
een70-90%
of
thetotal
refuseproduced.
Tins,
cansand
paperare
probablyresponsible
forabout
5to
10%of
totalw
asteproduced
(Songsore,
1992,p.13).T
hefust
pointat
which
solidw
astecan
createproblem
sis
within
thehouses
themselves.
Table
4.1below
shows
household-levelw
astestorage
practices.A
bout21
%o
fall
householdsw
ithinthe
metropolis
didnot
storesolid
waste
within
the:hom
e,42%stored
inopen
containersand
only36%
storedin
closedcontainers.

Benneh
etai.39
Ta
ble
4.1
:W
aste
Sto
rag
eP
ractice
sw
ithin
the
Ho
me
.
District
Do
n'tS
toreO
penC
ontainerC
losedC
ontainerT
otal
No.
%N
o.%
No.
%N
o.A
ccra136
19.0304
42.5275
38.5715
Tema
4025.0
5735.6
6339.4
160
Ga
3729.6
6350.4
2520.0
125
TotalG
AM
A213
21.3424
42.4363
36.31000
Data
source:Q
uestionnaireS
urveyofG
AM
A,
1991.
The
Ga
District
hadthe
highestincidence
of
bothnon-storage
andstorage
inopen
containers,increasingthe
risko
fattracting
diseasecausing
pestssuch
asflies,
cockroachesand
rats.A
mong
thew
ealthgroups,
itw
asthe
wealthy
householdsw
how
erem
ostlikely
touse
closedcon~ainers.
Whereas
65%o
fall
wealthy
householdsstored
theirw
astein
closedcontainers,
about50%
of
medium
income
householdsand
only32%
of
poorhouseholds
storedin
closedcontainers.
Non
storage,on
theother
hand,issim
ilarin
thedifferent
wealth
groups.T
herisks
of
increasingpest
infestationthrough
openw
astestorage
aregenerally
confmned
bythe
surveyresults.
The
enumerators
observedm
oreflies
inthe
kitchens(or
foodpreparation
areas)o
fhouses
where
solidw
astew
asbeing
storedindoors
inopen
containers.T
hus,m
any(>
10)flies
were
observedin
38%
of
thesuch
kitchens,but
where
waste
was
notstored
orw
asstored
inclosed
containersthis
percentagefell
to16%
and19%
respectively.Sim
ilarly,households
with
opencontainers
were
significantlym
orelikely
tocom
plaino
fratsor
mice.
Incontrast
toindoor
storageo
frefuse,
outdoorstorage
isrelatively
rare,as
house-to-housegarbage
collectionis
low.
Only
about32%
of
allhouseholdsstored
wastes
outsidethe
home.
Wealth
was
notsignificantly
relatedto
whether
ornot
householdsstored
waste
outside,but
againpoor
householdsgenerally
usedopen
containersw
hilethe
richm
oreoften
usedclosed
containers.C
losingw
astecontainers
isnot
generallyexpensive.
Inw
ealthyneighbourhoods
therem
aybe
strongersocial
sanctionspreventing
openw
astestorage
outside,and
door-to-doorrefuse
collectionim
posescertain
standards.H
owever,
thefact
thatw
ealthyhouseholds
alsoused
more
closedcontainers
indoorsalso
suggestsa
betterunderstanding
of
safew
astestorage
practice.T
hebulk
of
domestic
waste
fmds
itsw
ayto
eitherunauthorised
or
authorisedneighbourhood
disposalsites
where
itis
eithercollected
or
abandoned.O
nlya
fewhouseholds
inthe
metropolis
undertookfm
aldisposal
of
waste
throughburning
or
composting
aroundthe
house.Just
about18%
of
householdsin
GA
MA
burnttheir
refuse,8%
practisedsom
ecom
posting,anda
mere
5%buried
theirrefuse.
4.2.2C
omm
unityL
evelWaste
Managem
entT
hecapacity
tohandle
allo
fthe
householdw
astegenerated
isstill
weak.
About
83%o
fthe
populationdum
pstheir
refusein
eitherauthorised
or
unauthorisedsites
intheir
neighbourhood(T
able4.2).
Waste
dumping
ism
ostcom
mon
inA
ccraD
istrict.T
hispractice
was
notexclusive
tothe
most
run-down
poorslum
neighbourhoods,but
was
alsofound
inm
ediumand
highclass
areasbecause
of
theoverall
poorcoverage
ofw
astecollection
service.

40
Environm
entalP
roblems
andthe
Urban
Household
inthe
GA
MA
-Ghana
Ta
ble
4.2
:H
ou
se
ho
lds
Du
mp
ing
So
lidW
aste
inth
eN
eig
hb
ou
rho
od
.
Response
District
No
Yes
To
taI
No.
0/0N
o.%
No.
0/0
Accra
9613.4
61986.6
715100.0
Tem
a43
26.9117
73.1160
100.0G
a29
23.296
76.8125
100.0
TotalG
AM
A168
16.8832
83.21000
100.0
Data
source:Q
uestionnaireS
urveyofG
AM
A,
1991.
The
waste
was
typicallydum
pedat
aneighbourhood
collectionpoint
or
officialdum
p,w
ithonly
15%o
fall
householdsdum
pingrefuse
onem
ptyland,
.waterw
ay,gutters
andsuch
places(T
able4.3).
How
ever,som
eo
fthe
so-calledofficial
dumps
may
simply
beunauthorised
sitesw
hichhave
developedinto
accepteddum
psin
theabsence
of
alternatives.O
nestudy
identifiedsom
e100
unauthoriseddum
pingsites
inthe
metropolis
(Tahal,
1981,pp.C
.2-14).
Ta
ble
4.3
:N
eig
hb
ou
rho
od
Du
mp
ing
Site
so
fH
ou
seh
old
s.
District
To
taI
Site
Accra
Tem
aG
aG
AM
A
No.
%N
o.%
No.
%N
o.0/0
Collection
Point
29245.8
3025.6
1616.2
33839.6
OfficialD
ump
28044.0
7967.5
2929.3
38845.5
Em
ptyLand
568.8
76.0
5050.5
11313.2
Waterw
ay4
0.63
3.07
0.8
Other
50.8
0.91
1.07
0.8
Total
637100.0
117100.0
99100.0
853100.0
Data
source:Q
uestionnaireS
urveyofG
AM
A,
1991.N
ote:O
nlyhouseholds
dumping
theirw
asteare
includedin
thistable.
Given
thew
idespreadinadequacies
inw
astem
anagement,
itis
notsurprising
thatabout
45%o
fthe
populationin
them
etropolisconsider
waste
mism
anagement
tobe
aproblem
intheir
neighbourhood(T
able4.4).
The
responsesdid
notvary
appreciablybetw
eendistricts.
The
concernw
ithopen
dumping
sitesw
asclearly
relatedto
theoverall
amenity
levelofthe
area,however.W
hereasonly
12%in
highclass
areasand
31%
inm
iddleclass
areasperceived
aproblem
,the
sharerose
tohalf
inthe
lowclass
areas.T
hem
ostaffected
sitesw
ereopen
land,streets,
waterw
ayso
rgutters
andprivate
land,in
descendingorder
of
importance.
This
would
tendto
confmn
theview
thatsom
eo
fthe
dumps,
atleast
inthe
lowclass
areas,are
unauthorisedsites.
,-,

Benneh
etat.
Ta
ble
4.4
:H
ou
se
ho
lds
Pe
rceivin
gL
oca
lA
ccu
mu
latio
ns
of
So
lidW
aste
tob
ea
Pro
ble
m.
District
Response
No
Yes
To
taI
No.
%N
o.%
No.
%A
ccra382
53.4333
46.6715
100.0T
ema
9861.3
6238.8
160100.0
Ga
6854.4
5745.6
125100.0
TotalG
AM
A548
54.8452
45.21000
100.0
Data
source:Q
uestionnaireS
urveyofG
AM
A,
1991.
41
The
riskto
healthfrom
theexistence
of
thesesites
ispotentially
high,as
thew
astesom
etimes
remains
uncollectedfor
more
thana
week
(fable
4.5).T
hem
ostaffected
areasare
within
theG
aD
istrict.O
new
ouldexpect
theproblem
sto
bem
orethreatening
incrow
dedareas,
andindeed
thisw
ouldseem
tobe
theperception
of
theresidents.
While
inG
aD
istrict,w
itha
relativelylow
populationdensity,
twice
aslarge
ashare
ofrespondents
reporteduncollected
waste
sites,they
were
nom
orelikely
thanA
ccraresidents
tocom
plaino
fasolid
waste
problem.
Ta
ble
4.5
:E
xis
ten
ce
of
Op
en
Du
mp
Site
so
fU
nco
llecte
dW
aste
for
aW
ee
ko
rM
ore
.
Response
District
No
Yes
To
taI
No.
%N
o.%
No.
0/0
Accra
51471.9
20128.1
715100.0
Tem
a78
48.882
51.3160
100.0
Ga
4737.6
7862.4
125100.0
TotalG
AM
A639
63.9361
36.11000
100.0
Data
source:Q
uestionnaireS
urveyofG
AM
A,
1991.
Within
Tem
aD
istrict,it
ism
ainlyareas
outsidethe
plannedindustrial
township,
suchas
thesquatter
settlemento
fAshiam
an,Tem
aN
ewT
own
andother
outlyingcentres,
thatare
poorlyserved.
Large
areaso
fthe
Accra
District
arenow
benefitingfrom
more
regularservicing
interm
so
fw
asterem
ovalfrom
comm
unalcollection
points.A
mong
residentialareas
which
donot
asyet
benefitfrom
regularservice
arethose
inthe
fringeareas
of
thecity
includingN
orthT
eshieE
state,A
chimota,
Labadi,
Rom
anR
idgeand
Cantonm
ents.M
osto
fthese
arefar
frombeing
among
thepoorestcom
munities
which,
with
theexception
of
Jamestow
nand
Mam
probiare
nowbetter
servicedthan
before.T
heposition
ininner
cityareas
of
Accra
District
hasim
provedbecause
of
theprovision
of
comm
unalcontainers
toprevent
theindiscrim
inatedum
pingo
frefuseand
nightsoil.W
hilstsolid
waste
managem
entfor
them
ajorityis
generallyunsatisfactory,
thereare
aprivileged
feww
hoselevel
of
servicedelivery
isexceptional.
Table
4.6indicates
that11
%o
fthe
householdshave
home
collection.A
bout7%
of
poorhouseholds,
20%o
fm
edium-w
ealthhouseholds
and39%
of
wealthy
households

42
Environm
entalP
roblems
andthe
Urban
Household
inthe
GA
MA
-Ghana
benefited,leaving
medium
wealth
householdsm
arginallyless
likelyto
havehom
ecollection
thanthe
averageT
ema
resident.
Ta
ble
4.6
:H
om
eC
olle
ctio
nS
ervice
for
Ho
use
ho
ldS
olid
Wa
ste.
Response
District
No
Yes
To
taI
No.
%N
o.%
No.
%A
ccra640
90.766
9.3706
100.0T
ema
122n.7
3522.2
157100.0
Ga
11595.0
65.0
121100.0
TotalG
AM
A877
89.1107
10.9984
100.0
Data
source:Q
uestionnaireS
urveyofG
AM
A,
1991.
4.2.3H
ouseholdL
evelServiceC
hargesfo
rG
arbageR
emoval
Currently,
two
main
waste
collectionsystem
sare
inuse
inthe
metropolis:
houseto
housecollection
servicecom
munity
refusedum
pservice
ortransfer
stationsw
ithcom
munal
containers.
At
thetim
eo
fthe
survey,house
tohouse
collectiononce
aw
eekattracted
acharge
of
1,000cedis
am
onthfor
a100
litrecontainer
and3,500
cedisa
month
fora
240litre
container.O
nthe
otherhand,
thecharge
fora
householdusing
acom
munity
refusedum
po
rcontainer
was
2,500cedis
peryear,
or
abouttw
ohundred
andeightcedis
perm
onth.In
Tem
aD
istrict,the
waste
collectioncharge
is500
cedisper
month.
Out
of
about82%
of
thepopulation
of
them
etropolisthat
reliedon
comm
unalsolid
waste
disposalsites,
am
ere31
%claim
edto
payany
levyat
all.T
heproportions
who
paidw
erehighest
inthe
plannedtow
nshipo
fT
ema,
andthe
innercity
slums
suchas
Nim
aand
Maarnobi,
where
over90%
of
respondentspaid
alevy.T
hem
ajority,who
paidnothing,
may
well
havebeen
usingunauthorised
sites,o
rauthorised
sitesfrom
which
waste
was
notbeing
evacuated.T
hecollection
ratefor
thelevy
islow
inindigenous
areas(about
10%),
probablybecause
inthe
pastthese
areasw
ereprovided
with
afree
"generalservice,"
with
payments
onlybeing
made
forhom
ecollection.
Inthe
compound
housingunits
with
numerous
households,there
isalso
aproblem
of
detenniningw
hoshould
pay,especially
when
thelandlord
isnot
residentin
thecom
pound.In
theseneighbourhoods
thereis
noenforceable
penalty,as
residentscan
always
gainaccess
tothe
openrefuse
collectioncontainers
todum
ptheir
householdgarbage,
whether
ornot
theypaid
theservice
charge..'
4.3F
inalDisposalSystem
sS
olidw
astethatis
collectedfrom
householdso
rfrom
theneighbourhood
collectionpoints
isgenerally
transportedto
[mal
disposalsites.
The
Waste
Managem
entD
epartment
operatescom
postplants
andland
fIlls.Incineration
of
refuseis
rare.T
hem
ostcom
mon
method
of
[mal
disposalis
opendum
pingin
pits,euphem
isticallycalled
landfIlls,
principallynear
Korle
Lagoon,
Korle
Gonno

Benneh
etal.43
beach,L
abadi,R
idgeand
atA
penkwa
nearC
FChousing
estate.M
osto
fthese
havealready
beenused
to,or
beyond,capacity,
exceptfor
thoseat
Apenkw
aand
Korle
Lagoon.
The
Departm
entis
badlyin
needo
fnew
sites,as
residentsare
becoming
more
environmentally
conscious.A
newlandfill
hasbeen
openedat
Mallam
.H
ere,the
Environm
entalP
rotectionC
ouncilC
EPC)
hasstarted
monitoring
groundwater
aspart
of
ailattempt
toprevent
pollution.In
additionthe
Departm
enthas
acom
postplant
atT
eshie-Nungua
anda
number
of
high-techoxidation
pondsat
Achim
ota,both
ofw
hichproduce
compostm
anure.

44
Environm
entalP
roblems
andthe
Urban
Household
inthe
GA
MA
-Ghana
CH
AP
TE
RF
IVE
5U
RB
AN
PEST
SA
ND
PE
ST
CO
NT
RO
L5.1
Urban
InsectV
ectorsa
nd
Rodents
5.1.1Introduction
Certain
human
diseasesare
transmitted
fromone
hostto
anotherthrough
theagency
of
aninsect
intermediary
or
vector.In
Accra,
inadequatedrainage
and
sanitation,the
generalenvironm
entalconditions,
andthe
behaviourpatterns
of
thepeople
inthe
variousresidential
areas,all
combine
toprovide
favourableconditions
forsom
eo
fthem
oresevere
vector-bornediseases.
Many
insectvectors
existin
theG
reaterA
ccraM
etropolitanA
rea(G
AM
A).
This
studyfocuses
primarily
onm
osquitoes,flies,
andcockroaches.
The
incidenceo
frodents-
mice
andrats
-is
alsosum
marised
briefly.
5.1.2M
osquitoesP
oorsullage
disposal,blocked
drains,and
thegenerally
poordrainage
system,
facilitatem
osquitobreeding.
As
emphasised
duringm
anyo
fthe
focusgroup
discussions,w
hileone
mightexpect
mosquitoes
tobe
prevalentlargely
inthe
rainyseason,
over-crowding
coupledw
iththe
poordrainage
systemhas
meant
thatsom
egutters,
streams,
stormcanals,
etc.contain
water
throughoutthe
year.M
anyindustrial
andcom
mercial
establishments,
especiallychop-bars,
restaurants,hospitals,
andhotels,
continuouslyuse
largeam
ountso
fw
ater.P
erhapsas
aresult,
while
them
osquitopopulation
undoubtedlyincreases
duringthe
rainyseason,
itis
highthroughout
theyear.
Low
lyingareas
with
streams
andchoked
uplagoons
(theK
orle,C
hemu
andK
peshilagoons
inA
ccraD
istrict,for
example)
offerexcellentbreeding
grounds.It
hasbeen
estimated
thatover
90%o
fthe
mosquitoes
inA
ccracity
areC
ulexand
Aedes
species(C
hinery,1969).
Anopheles
mosquitoes,
thevectors
of
malaria,
generallyprefer
unpolluted,naturalbreeding
sites.N
evertheless,betw
een1987
and1990,
malaria
accountedfor
between
41%
and53%
of
thecases
reportedat
outpatientfacilities
inthe
Greater
Accra
Region
(seeT
able8.1).
While
suchstatistics
may
exaggeratethe
relativeim
portanceo
fm
alaria,there
islittle
doubtthat
itrem
ainsan
important
causeo
fillhealth.
Thus,
while
Anopheles
mosquitoes
onlyaccount
fora
small
shareo
fm
osquitoes,there
aresufficient
numbers
tohelp·
createlarge
scalehealth
problems.
Moreover,
Anopheles
mosquitoes
canadapt
tourban
breedingsites
overtim
e.In
India,the
A.
Stephensi"has
developedinto
anurban
speciesand
isfound
inm
uchhigher
numbers
inm
anycities
inIndia
thanin
thesurrounding
countryside"(W
HO
,1988a,
p.17).T
hereis
evidencethat
Anopheles
mosquitoes
arelikew
isebecom
ingbetter
adaptedto
thebreeding
siteso
fAccra.A
soutlined
byC
hinery(1984),
thechanging
ecologyo
fA
ccrahas
ledto
significantshifts
inthe
composition
of
them
osquitopopulation.
On
theone
hand,"T
healm
ostcom
pleteelim
inationo
fA
n.funestus
anddecrease
inbreading
intensityo
fAn
gambiae
s.l.over
theyears
havecontributed
todim
inishingm
alaria..
parasiterates
between
1912and
1964and
may
alsoaccount
forlow
incidence.of·
W.
bancroftiinfection
inA
ccrain
recentyears"
(Chinery,
1984,p.
75).O
nthe
otherhand,
"An.
gambiae
s.l.has
adaptedto
breedingappreciably
inw
ater-filleddom
esticcontainers
inrecent
times"
and"breeding
hasalso
increasedin
the

Benneh
etai.45
numerous
pollutedw
aterhabitats
createdas
aresult
of
urbanizationII
(Chinery,
1984,p.75).
Thus,
while
pasturbanization
haslow
eredthe
incidenceo
fm
alariain
Accra,
thereis
noreason
toassum
ethat
continuingurbanization
will
automatically
eliminate
itas
am
ajorhealth
problem.
Indeed,further
adaptationcould
actuallylead
toan
increasingpresence
of
Anopheles
mosquitoes.
Moreover,
theshift
todom
esticw
atercontainers
suggeststhat
malaria
isnot
onlylinked
top
oo
rdrainage,
butincreasingly
tohousehold
water
managem
ent,and
more
generallythe
reliabilityo
fwater
supply(as
outlinedin
Chapter
2,the
unreliabilityo
fw
ateris
oneo
fthe
main
reasonsfor
thehigh
levelo
fhousehold
water
storage).T
heA
edesspecies
alsocom
monly
breedin
householdw
atercontainers,
andcan
bevectors
of
yellowfever
anddengue
haemorrhagic
fever.T
herisks
of
urbanyellow
feverand
outbreakso
fdengue
haemorrhagic
fevershould
notbe
neglected,even
ifthey
arenot
currentlya
major
healthconcern.
The
surveyundertaken
forthis
studydoes
notprovide
information
onm
osquitospecies,
andas
such·provideslim
itedinsight
intothe
relativerisks
differenthouseholdsare
facingfrom
mosquitoes.
The
surveyresults
indicatethat
inalm
ostall
thesam
pledresidential
areasm
osquitobiting
was
prevalentduring
bothdry
andw
etseasons,especially
indoorsatnightw
henA
nopheles,but
alsothe
more
comm
onC
ulex,m
osquitoesare
biting.O
nly2%
of
therespondents
saidthat
theyw
erenot
botheredby
mosquitoes
bitingindoors
atnight
duringthe
wet
season,w
iththe
percentagerising
to4%
inthe
dryseason.
Som
e17%
inthe
dryseason
and21
%in
thew
etseason
saidthatthere
were.only
occasionallym
osquitoesbiting
indoorsat
night.B
ut
them
ajorityin
bothseasons
oftenhad
bitingm
osquitoes.M
oreover,excluding
householdsw
ithfull
window
screening,the
responsesw
erequite
similar
inthe
differentareas
of
thecity
andam
ongp
oo
rand
wealthy
households.O
nerelationship
which
didem
ergew
asa
significantassociation
between
thelocation
of
storedw
aterand
thelevel
of
mosquito
bitingin
thedry
season.W
hereas4
4%
of
the(621)
householdsstoring
water
insidew
ereoften
botheredby
many
bitingm
osquitoesat
nightduring
thedry
season,this
appliedto
only31
%o
fthose
(334)households
who
storedtheir
water
outside.A
lternatively,only
3.2%o
fthose
storingw
aterindoors
were
notbothered
bybiting
mosquitoes
atall,
asopposed
to6.6%
of
thosestoring
water
outdoors.If
thereis
indeeda
growing
presenceo
fA
nophelesm
osquitoesin
householdw
atercontainers,
indoorw
aterstorage
may
be
increasinglyrisky.
Except
when
mosquitoes
arebreeding
inhousehold
water
containers,there
isrelatively
littlean
individualhousehold
cando
tocontrol
breeding.O
nthe
otherhand,
thereare
anum
bero
fm
easuresw
hichcan
betaken
tokill
adultm
osquitoeso
rinhibit
theirentry
intothe
home.
As
illustratedin
Section
5.2.1,about
90%o
fhouseholds
inA
ccraattem
ptsom
eform
of
insectcontrol,
typicallytargeting
mosquitoes.
Very
few,
however,
achieveanything
likecom
pleteprotection.
5.1.3H
ouseF
liesM
anyinsects
otherthan
mosquitoes
serveas
diseasecarriers
inurban
areas.T
heseinclude
houseflies,
sandflies,
tricklingfIlter
flies,fleas,
bedbugs,
cockroaches,lice,
mites
andtriatom
inebugs
(Table
5.1).A
lmost
allthe
listeddisease
vectorsare
presentat
variouslevels
throughoutthe
studyarea.
How
ever,only
houseflies
andcockroaches
will
bediscussed.

46
Environm
entalP
roblems
andthe
Urban
Household
inthe
GA
MA
-Ghana
Table
5.1:H
abitatso
furbandisease
vecto
rso
the
rthanm
osquitoes.
House
Sand
Trickin
gF
leasB
ed
bu
gs
Flies
Flies
filter
flies
+++++
+++
++
++
+++
Co
ckroa
chL
iceM
itesT
riato
min
eb
ug
s
+++++
++
++
++
Refuse
Sites
Slaughter
houses
Food
Stores
Deficienthouses
Dirty
garments
Sew
eragefilters
An
ima
lshelters
Excre
me
nt
Unsanitary
latrines
Rodent
burrows
Refuse
Sites
Slaughter
houses
Food
Stores
Deficient
houses
Dirty
ga
rme
nts
Sew
eragefilters
Anim
alshelters
Excrem
ent
Un
san
itary
latrines
Rodent
burrows
WH
O,1
98
8a
The
housefly
isboth
afJlth
feederand
breeder.Flies
arem
echanicalcarriers,
andcan
contaminate
human
foodor
drinkthrough
directcontact
orby
defecatingor
regurgitatingstom
achcontents.
Unsanitary
conditionslead
tom
oreflies,
anda
higherrisk
thattheflies
will
spreaddisease.
House
fliesw
erecom
mon
inall
neighbourhoods,in
bothfood
preparationareas
andtoilets.
The
presenceo
ffliesin
toiletsvaried
more
thanin
kitchens.M
ore"than
twice
asm
anyhouseholds
claimed
neverto
haveflies
intheir
toiletsas
claimed
thesam
efor
theirfood
preparationareas
(23%as
opposedto
11%
).O
nthe
otherhand,
about50%
more
householdssaid
therew
erealm
ostalw
aysflies
intheir
toiletsthan
thatthere
were
almost
always
fliesin
theirfood
preparationareas
(38%as
opposedto
24%).
Similarly,
thedifferences
between
poorand
wealthy
householdsw
erem
orestriking
with
respectto
fliesin
thetoilet
thanw
ithrespect
toflies
inthe
kitchen(S
eeT
ables5.2
and5.3).
More
thanfour
outo
ffive
wealthy
householdssaid
theyalm
ostnever
hadflies
intheir
toilets,com
paredto
aboutone
poorhousehold
inseven.
Indeed,about
44%o
fpoor
householdsalm
ostalw
ayshad
fliesin
theirtoilets.
'"

Benneh
etal.47
Ta
ble
5.2
:P
rese
nce
of
Flie
sin
Fo
od
Pre
pa
ratio
nA
rea
by
Ho
use
ho
ldW
ea
lth(%
).
We
alth
Presence
ofF
liesIn
de
xo
fA
lmo
stO
cca-U
suallyA
lmo
stN
oT
ota
IH
ou
seh
old
Never
sion
ally
Alw
aysC
oo
king
%N
Low6.4
24.041.2
28.00.4
100.0818
Medium
30.529.0
29.89.9
0.8100.0
131H
igh39.3
43.113.7
3.9100.0
51
Total
11.225.6
38.324.4
0.4100.0
1000
Data
source:Q
uestionnaireS
urveyofG
AM
A,
1991.
Ta
ble
5.3
:P
rese
nce
of
Flie
sin
To
ilets
by
Ho
use
ho
ldW
ea
lth(%
).
Presence
ofF
liesW
ealthIn
de
xo
fA
lmo
stO
cea-U
suallyA
lmo
stF
reeT
ota
IH
ou
seh
old
Never
sion
ally
Alw
ays
Range
%N
Low14.3
16.323.8
44.41.2
100.0818
Medium
54.217.6
16.710.7
0.8100.0
131H
igh82.4
9.85.8
2.0100.0
51
Total
23.016.1
22.037.8
0.1100.0
1000
Data
source:Q
uestionnaireS
urveyofG
AM
A,
1991.
Inthe
discussiono
fsolid
waste
(Chapter
4),it
was
shown
thathouseholds
storingw
asteinside
theirhom
ew
erem
orelikely
tohave
fliesin
theirkitchen.
The
relationbetw
eenthe
sanitarycondition
of
thetoilet
andthe
presenceo
fflies
was,
asone
would
expect,far
stronger.T
he32%
of
householdsusing
toiletsw
herefaecal
material
was
visibleoutside
of
the"bow
l",accounted
form
orethan
halfo
fthe
householdsw
ithm
anyflies
inthe
toilet,and
only6%
ofthe
toiletsw
ithoutflies.S
imilar
associationsexist
with
otherindicators
of
unsanitarytoilets.
Furtherm
ore,unsanitary
toiletsare
associated,though
lessstrongly,
with
havingm
oreflies
inthe
kitchens.Indeed,
them
ultiplicityo
finterconnections
isso
strongthat
itis
more
reasonableto
portrayflies
asa
dangerousvector
within
acom
plexsystem
of
sanitaryproblem
s,than
toattem
ptto
singleout
particularreasons
forfly
prevalence.T
ables5
Aand
5.5illustrate
clearlythat
childhooddiarrhoea
ism
oreprevalent
inhouseholds
where
respondentssay
thereare
more
flies.In
lighto
fthe
multiplicity
of
interconnectionsnoted
above,this
associatiOll
shouldbe
takento
reflectnot
onlythe
roleo
fflies
ascarriers,
butalso
thefact
thatthe
presenceo
fflies
isan
indicationo
fotherhigh
riskconditions.

48
Environm
entalP
roblems
andthe
Urban
Household
inthe
GA
MA
-Ghana
Ta
ble
5.4
:P
rese
nce
of
Flie
sin
Kitch
en
an
dth
eT
wo
We
ek
Pre
vale
nce
of
Ch
ildh
oo
dD
iarrh
oe
aa
mo
ng
Ho
use
ho
lds
with
Ch
ildre
nU
nd
er
Six.
Presence
of
Ch
ild«
6)
with
Diarrhoea
Ho
use
flies
inL
astT
wo
Weeks
To
taI
%N
o%
Ves
%N
Alm
ostN
ever92.7
7.3100.0
41O
ccasionally93.4
6.6100.0
136~
Usually
87.612.4
100.0209
Alm
ostA
lways
77.322.7
100.0150
Total
86.613.4
100.0536
Data
source:Q
uestionnaireS
urveyofG
AM
A,
1991.
Ta
ble
5.5
:P
rese
nce
of
Flie
sin
To
ilet
an
dth
eT
wo
We
ek
Pre
vale
nce
ofC
hild
ho
od
Dia
rrho
ea
am
on
gH
ou
seh
old
sw
ithC
hild
ren
Un
de
rS
ix.
Ch
ild«
6)
with
Diarrhoea
Presence
of
inL
astT
wo
Weeks
To
taI
Ho
use
flies
%N
o%
Ves
%N
Alm
ostN
ever94.1
5.9100.0
101O
ccasionally90.8
9.2100.0
87U
sually86.2
13.8100.0
138A
lmost
Alw
ays81.2
18.8100.0
207
Total
86.513.5
100.0533
Data
source:Q
uestionnaireS
urveyofG
AM
A,
1991.
5.1.4C
ockroachesU
ndersom
econditions,
cockroaches,like
flies,can
bem
echanicalcarriers
of
disease.W
hilenot
inherentlyattracted
tohum
anfaeces,
theysom
etimes
livein
habitatsw
herecontactis
likely.P
athogenicbacteria
may
thenbe
depositedon
foodas
thecockroaches
foragein
akitchen
or
foodarea.
Astudy
of
cockroachesin·
Accra
(Agbodaze
andO
wusu,
1989)found
evidenceleading
theauthors
tosuggest
thatcockroaches
couldbe
playinga
rolein
thetransm
issionbacterial
diarrhoea.(O
uto
f208
cockroachescollected
fromkitchens,
64harboured
coliforms,
13harboured
proteusspecies,
sixharboured
Salmonella,
two
harbouredP
seudomonas
species,and
oneharboured
Shigelladysentariae.)
Inaddition
tothe
potentialhealth
risk,cockroaches
aregenerally
considereda
nuisance,and
canproduce
anunpleasantodour.
Only
8%
of
thehouseholds
surveyedfor
thisstudy
saidthey
neversaw
cockroachesin
theirhom
es,and
44%claim
edoften
tosee
largenum
bers.C
ockroachesw
ereassociated
with
many
of
thesam
eenvironm
entalindicators
asflies,
thoughthe
associationsw
eresom
ewhat
lessstrong.
As
aresult,
while
only'13%
of
(112)households
with
noflies
intheir
kitchenoften
sawm
anycockroaches,this
percentageclim
bedto
69%in
the(244)
householdsw
hichalm
ostalw
ayshad
fliesin
theirkitchen.
Again
thisindicates
thecom
plexcom
binationo
fsanitary
andinsect-related
conditionsw
hichm
anyhouseholds
face.N
ot

Benneh
etal.49
surprisingly,cockroaches,
likeflies,
arem
oreprevalent
inpoor
households(see
Table
5.6).
Ta
ble
5.6
:P
rese
nce
of
Co
ckroa
che
sin
Ho
me
sb
yH
ou
seh
old
We
alth
(%).
Prevalence
Wealth
To
taI
Indexo
fN
everO
ccasionallyO
ftenin
Often
in%
NH
ouseholdS
mallN
os.Large
Nos.
Low7.7
15.430.1
46.8100.0
818M
edium4.6
32.131.9
32.1100.0
131H
igh21.6
35.321.6
21.6100.0
51
Total
8.018.6
29.943.6
100.01000
Data
source:Q
uestionnaireS
urveyofG
AM
A,
1991.
5.1.5R
odentsS
everalspecies
of
ratsand
mice
arew
elladapted
tourban
environments.
They
consume
storedfood,
damage
property,and
cancontam
inatehum
anfood
with
theirfaeces
andurine,
sometim
estransm
ittingdiseases
inthe
process(W
HO
,1988a).
Historically,rats
areinfam
ousfor
theirrole
inspreading
theplague.
While
therodents
of
Accra
may
notbe
am
ajorhealth
problem,
theyare
apersistent
nuisance,and
atleasta
minor
healthproblem
.R
odentstend
tobe
comm
onin
certainneighbourhoods
asa
resulto
fthe
qualityo
fhousing
andthe
environmentas
aw
hole.H
ousesin
thelow
income
areasare
notonly
closelybuilt,
butare
typicallyin
avery
poorstate
of
repair,both
favourableconditions
forthese
pests.T
helack
of
adequatefacilities
tohandle
domestic
waste
inm
ostlow
income
householdshas
compounded
theproblem
.F
urthermore,
while
ratsand
mice
canadapt
tourban
conditions,they
arem
oreprevalent
inthe
ruralfringe.
Tables
5.7illustrates
theextent
tow
hichthese
factorscom
bineto
placea
largepart
of
theburden
onpoorer
households.H
owever,
likeseveral
otherpest
relatedproblem
s,it
isnotew
orthythat
eventhe
wealthy
areaffected.
Indeed,about
16%o
fthew
ealthyhouseholds
claimed
thattherew
ererats
orm
icein
theirhom
esevery
day.
Ta
ble
5.7
:P
rese
nce
of
Ra
tso
rM
icein
Ho
me
sb
yH
ou
seh
old
We
alth
(%).
Prevalence
Wealth
To
taI
Indexo
fN
everO
ccasionallyO
ftenE
veryN
igh
tl%
NH
ouseholdD
ay
Low18.8
24.418.0
38.8100.0
818M
edium32.1
37.414.5
16.0100.0
131H
igh62.8
17.63.9
15.7100.0
51
Total
22.825.8
16.834.6
100.01000
Data
source:Q
uestionnaireS
urveyofG
AM
A,
1991.
50
Environm
entalP
roblems
andthe
Urban
Household
inthe
GA
MA
-Ghana
5.2Insecticide
Usage
an
dO
therP
reventiveM
easuresT
hepeople
of
Accra
arevery
concernedabout
theirpest
problems.
There
is,how
ever,relatively
littleenvironm
entalm
anagement
designedto
reducethe
levelo
fpest
infestationthrough,
forexam
ple,controlling
man-m
adebreeding
sites.Instead,
householdstake
anum
bero
fprotective
measures,
many
of
which
involvethe
useo
fpotentially
hazardouschem
icals.D
espitethe
economic
burdenthey
impose,
theseprotective
measures
havethe
attractionso
fbeing
relativelysim
pleto
applyand
of
concentratingtheir
protectionon
theusers
themselves.
Controlling
breedingsites
requiresa
more
sophisticatedunderstanding
of
thebehaviour
of
thepests,
and,since
thebeneficiaries
arem
oredispersed,
ittypically
requiressom
eform
of
publico
rcollective
action.M
osquitoesare
perceivedto
bea
major
healthrisk,
andare
thetarget
of
most
of
theprotective
measures
householdstake.
Sim
ilarly,m
ostgovernm
entefforts
targetm
osquitoes.T
hefollow
ingsections
summ
arisethe
extentto
which
differentm
ethodsare
employed,
andsom
ehealth
associationsw
hich,w
hilefar
fromdefinitive,
do
indicatethat
thepotential
dangerso
fusing
insecticidesdeserve
more
.consideration.
5.2.1H
ouseholdInsect
Control
About
nineout
of
tenhouseholds
takesom
em
easuresto
controlm
osquitoes.A
sindicated
inT
able5.8,
them
ostcom
mon
measure
isscreening.
Even
ina
well
constructedhouse,
screeningdoes
notprovide
fullprotection,
andin
many
itis
relativelyineffective.
Indeed,households
with
fullscreening
arem
orelikely
touse
otherm
ethodso
finsect
controlthan
thosew
ithout.T
heother
threem
easurestaken
bym
orethan
10%o
fthe
respondentsare
allchem
ical:m
osquitocoils,
aerosolinsecticides
andpum
p-sprayinsecticides.
Table
5.8:U
seo
fInse
ctCo
ntro
lMethods.
Use
of
Me
tho
dT
ota
lR
esp
on
de
nts
No
nY
esn
n
Me
tho
d(%
)(%
)
Full
Screening
47.4474
52.6526
1000
Mo
squ
itocoils
54.7547
45.3453
1000
Ae
roso
linsecticides
59.5594
40.5405
999
Pu
mp
insecticides89.2
88910.8
108997
Bed
nets92.2
9227.8
781000
Traditional
method
96.5961
3.535
996
Private
service96.7
9633.3
33996
Go
vt.service
99.3989
0.77
996
Oth
er
97.9973
2.121
994
At
lea
stoneo
fabove10.2
10189.8
893994
Data
source:Q
uestionnaireS
urveyofG
AM
A,.1991.
Mosquito
coils,the
most
comm
onchem
icalm
eanso
finsect
control,are
usedm
orecom
monly
among
poorhouseholds,
asillustrated
inT
able5.9.
Their
useundoubtedly
leadsto
increasedexposure
toair
pollution.W
hilethe
healthhazards
of
suchpollution
arenot
well
documented,
among
thehouseholds
surveyedw
ho

Benneh
etaf.51
hadchildren
undersix
therew
asa
highershare
with
oneo
fthese
childrenhaving
respiratoryinfection
symptom
sw
henm
osquitocoils
were
used.Indeed,about
15%(of
260)using
mosquito
coilshad
atleastone
childunder
sixw
ithsuch
symptom
s,com
paredto
9%(of
284)am
ongthose
notusing
mosquito
coils.T
heassociation
between
mosquito
coilsand
healthis
exploredfurther
inC
hapter8.
Table
5.9:U
seo
fMo
squ
itoC
oils
by
Household
Wealth
(Ofo).
We
alth
Ind
ex
Use
ofC
oliT
ota
I
of
Ho
use
ho
ldN
o.
Yes
%N
Low50.5
49.5100.0
818
Medium
69.530.5
100.0131
High
84.315.7
100.051
Total
54.745.3
100.01000
Data
source:Q
uestionnaireS
urveyofG
AM
A,
1991.
Aerosol
insecticides,on
theother
hand,are
usedm
oreoften
among
wealthy
households,as
illustratedin
Table
5.10.A
erosolsalso
increasepersonal
exposureto
airbornepollution,
especiallyfor
theperson
applyingthe
insecticide.N
osignificant
associationbetw
eenchildren's
healthand
theuse
of
aerosolpesticides
was
found.R
espiratoryproblem
symptom
sw
ereactually
lessprevalent
among
personalhom
emakers
usingaerosol
insecticides.H
owever,
aerosolsand
pump
spraypesticides
arerelatively
closesubstitutes,
andthis
couldbe
confoundingthe
results.In
Chapter
8,a
briefattem
ptis
made
toexam
inethis
associationm
oreclosely,
controllingfor
factorssuch
assm
oking,gender
of
theprincipal
homem
aker,andother
potentiallysignificantvariables.
Table
5.10:U
seo
fAe
roso
lInse
cticide
sb
yH
ouseholdW
ealth(Ofo).
We
alth
Ind
ex
Use
of
Ae
roso
lT
ota
I
of
Ho
use
ho
ldN
oY
es%
N
Low65.2
34.8100.0
817M
edium38.8
61.2100.0
129
High
20.879.2
100.053
Total
61.038.9
100.0999
Like
aerosols,pum
pinsecticides
arem
oreoften
usedby
wealthy
households(see
Table
5.11).G
enerally,it
ism
oredifficult
tocontrol
thechem
icalsused
ininsecticide
pumps,
andpum
pusers
arelikely
touse
largerquantities
ofinsecticide.
As
inthe
caseo
faerosols,
nostatistically
significantassociation
couldbe
foundbetw
eenthe
useo
fpum
psprays
andchildren's
health.H
owever,
about40%
of
the(l08)
principalhom
emakers
usingpum
pinsecticides
hadrespiratory
problemsym
ptoms,as
compared
to17%
ofthe(889)
principalhom
emakers
notusing
pump
pesticides.

52
Environm
entalP
roblems
andthe
Urban
Household
inthe
GA
MA
-Ghana
Tab
le5.11:
Use
of
Pu
mp
Insecticid
esby
Ho
useh
old
Wealth
(%).
Wealth
Ind
exU
seo
fP
um
pP
esticide
To
taI
ofH
ou
seh
old
No
Yes
%N
Low90.2
9.8100.0
815.
Medium
84.515.5
100.0129
High
84.915.1
100.053
Total
89.210.8
100.0997
Data
source:Q
uestionnaireS
urveyofG
AM
A,
1991.

Benneh
etai.53
Bo
x5.1:
Flies,
Mo
squ
itoes
and
Wealth
Lo
wL-M
Middle
U-M
Up
pe
r
Flies
areboth
filthfeeders
andfilth
breeders,andtheir
presencein
thecooking
areais
particularlyhazar
dousw
hensanitation
isgenerally
poor,and
theyare
likelyto
transfer
faecalm
aterialtothe
food.A
sillustrated
inF
igure5.1,
thepres
ence
of
fliesfollow
sm
uch
the
.same
patternas
mostother
household
environmentalhazards
-they
arem
oreprevalent
among
poorerhouseholds.
Mosquitoes
were
comm
onboth
indoorsand
outinalm
ostallneighbourhoods.
How
ever,asillustrated
inF
igure5.2,the
measures
households
taketo
protectthemselves
arevery
much
wealth
dependent.M
osq
uito
coils
arem
ore
com
mo
nam
ongpoor
households,aerosol
spraysam
on
gw
ealthier
households,and
pump
sprayssom
ewhat
more
comm
onam
ongw
ealthierhouseholds.
Malaria
isa
majo
rhealth
hazardin
GA
MA
,butusinginsecticides
canalso
beharm
ful,especially
ifcareis
nottakenin
theirchoice
andapplication.
As
described
inC
hapterE
ight,the
useo
fm
osquitocoils
was
associatedw
ithrespiratory
problems
inchil
dren,w
hilethe
useo
fpump
sprayinsecticides
was
associatedw
ithrespiratory
problems
inthe
principalw
omen
ofthe
household.
•U
-M
oU
pper
•Low
oL-M
IlilM
iddle
Wealth
group
presenceofflies
oalm
ostalw
ays
•usually
IIIoccasionally
oalm
ostn
eve
r
N=
Subsam
plesize
198200
18
72
10
20
5N
=
o 5040 60 7010
Figure
5.1:P
resenceo
fflies
inco
okin
garea
by
we
alth
gro
up
20
100%
90%
80%
70
%
60%
50
%
40%
30
%
20%
10
%
0%--jL==:""-L---"~-'----"~-'---""-,--'---'L(
%30
mo
squ
itocoils
ae
roso
lspum
p
Inse
ctcon
trolm
ethod
Figure
5.2:U
seo
finse
ctcon
trolm
eth
od
sb
yw
ealthg
rou
p
Data
source:Questionnaire
surveyofA
ccra,1991.
Note:
The
wealth
groupsem
ployedin
thesediagram
sare
basedon
thesam
ew
ealthindex
employed
inthe
resto
fthe
report.H
owever,rather
thanthree
unequalgroups(the
poorm
ajority,asm
allwealthy
elite,anda
somew
hatlargerm
edium-w
ealthgroup),
fivegroups
of
roughlyequal
sizehave
beencreated
forthe
graphicalpresentation.

54
Environm
entalP
roblems
andthe
Urban
Household
inthe
GA
MA
-Ghana
CH
AP
TE
RS
IX
6F
OO
DC
ON
TA
MIN
AT
ION
6.1Introduction
This
chapteris
concernedw
ithm
icrobialfood
contamination,
andespecially
therole
offood
inthe
transmission
offaecal-oraldisease.
Bacterialagents
canm
ultiplyin
food,w
hilefor
viruses,protozoa
andhelm
inths,food
canbe
acarrier.
Food
contamination
canoccur
atany
number
ofpoints
between
productionand
consumption,
while
cookingfood
canreduce
contamination.
The
following
sectionsexam
ine,in
tum,
thepotential
sourcesof
contamination:
1)prior
topreparation;
2)during
preparation;and
3)during
storagein
thehom
e.
6.2F
oodSupplies
Mosthouseholds
inthe
studyarea
obtaintheir
foodfrom
openm
arkets.V
eryoften
thefood
isdisplayed
openlyon
tablesand
onthe
bareground
invery
poorsanitary
environments.
The
prevalenceof
diseasevectors
suchas
housefliesat
thesem
arkets,as
well
asthe
presenceof
pestssuch
ascockroaches
androdents
inthe
storagelocations,
suggestsa
potentiallyhigh
levelof
contamination.
Such
contamination
posesparticular
risksfor
meat,
fishand
forfruit
andvegetables
eatenraw
.A
significantshareofthe
vegetablessold
areproduced
insm
allmarketgardens
inthe
studyarea.
Vegetables
suchas
lettuce,carrots,
greenpepper,
cucumber
andIndian
spinachare
cultivatedalong
some
major
drainsin
thestudy
area,and
microbiological
examination
hasuncovered
highlevels
offaecal
contamination
bothin
thew
aterand
inlettuce
andcabbage
leavestaken
fromsuch
sites(E
nvironmentalM
anagementA
ssociatesL
td.,1989,p.154).
Fruits
areavailable
inalm
ostallthe
localm
arketsand
afew
wayside
groceriesin
thestudy
area,having
arrivedfrom
hinterlandareas
afew
kilometres
away.
Alm
ostall
fruitsare
eatenraw
.T
herisk
ofcontam
inationis
thushigh,
especiallyw
henthe
fruitsare
notw
ashedproperly
beforebeing
eaten.S
uchfruits
may
includem
angoes,sugar-caneand
berrieso
fallsorts.The
manner
inw
hichthese
arehandled
anddisplayed
forsale
exposesthem
todust
andhouseflies.
Sugar-cane
isunloaded
fromtrucks
andpacked
onthe
bareground
priorto
cuttingit
upin
bitsfor
sale.F
ortunately,fruits
suchas
coconut,groundnut
(inshell),
avocadopears
andbananas
arenotso
easilycontam
inated,dueto
theirprotective
outercoat.
Meat
ism
ostlysold
rawin
thestudy
area.H
owever,
ina
fewcases,
particularlyw
ithgam
e(popularly
referredto
asbush
meat),
itm
aybe
smoked
anddisplayed
ontables
onthe
openm
arketfor
sale.In
spiteof
theS
laughterH
ouseand
Saleo
fM
eatB
yeL
awof
1962,w
hichstates
thatno
animal
shouldbe
slaughteredfor
consumption
outsidethe
slaughterhouse,
theslaughter
andtransport
of
rawm
eatfrom
theexisting
slaughterhouses
inthe
studyarea
tothe
marketing
pointsis
~uch
thatthe
riskof
contamination
isvery
high.T
heslaughter
housesare
inpoor
conditionand
attim
espoorly
located.T
heJam
esT
own
slaughterhouse,
forexam
ple,is
locatedabout
20m
etresfrom
apublic
toilet.C
arcassesare
transportedin
opentrucks
andthen
head-loadedbare
tothe
sellingpoints
which
arethem
selvesoverw
helmed
byscores
ofbuzzing
houseflies.A
llthese
arepossible
sourcesofcontam
ination.B
othraw
andsm
okedfish
aredisplayed
bareon
wooden
traysin
theopen
market,
exposingthem
tocontam
inationby
houseflies.T
hesm
okingis
notalw
ays

Benneh
etal.55
properlydone,
andthe
fishis
oftenin
veryp
oo
rcondition
bythe
time
itis
boughtand
consumed.
Furtherm
ore,viruses
arepresent
inthe
shellfish,w
hichare
popularprotein
foodsin
most
indigenousG
acom
munities,
where
po
or
householdspredom
inate.
6.3F
oodP
reparationA
llbut
afew
(8)households
surveyedregularly
preparedat
leastone
meal
aday.
Inthe
majority
of
cases,tw
oo
rthree
meals
aday
areprepared.
How
ever,as
illustratedin
Table
6.1,a
higherproportion
of
thelow
income
householdsthan
highincom
ehouseholds
prepareonly
onem
eala
day.
Ta
ble
6.1:N
um
be
ro
fM
ealsP
reparedP
erD
ayb
yH
ou
seh
old
Wealth
(%).
We
alth
Ind
ex
Nu
mb
ero
fM
ealsT
ota
I
of
Ho
use
ho
ldO
ne
Tw
oT
hree%
N
Low16.8
42.840.3
100.0808
Medium
3.139.1
57.8100.0
128
High
2.031.4
66.7100.0
51
Total
14.241.7
43.9100.0
982
So
urce
:Q
ue
stion
na
ireS
urve
yo
fG
AM
A,
19
91
.
While
po
or
householdsconsum
eless
food,the
tendencyto
prepare.fewer
meals
athom
ealso
reflectstheir
greaterreliance
onvendors
sellingprepared
food,illustrated
inT
able6.2.
Most
operatorsin
theprepared
foodand
ready-to-eatfood
businessin
thestudy
areaoperate
underrather
unhygienicconditions.
Prepared
foodssuch
ascooked
rice,kenkey,
andgari
andbeans
aredished
outto
buyersin
leaves,cem
entpapers
andold
newspapers.
Besides,
some
of
thesem
aybe
uncoveredand
soare
exposedto
dustand
houseflies.R
eady-to-eatfoods
suchas
doughnuts,bread,
roastedplantain
andgroundnuts,
andpastry
arealso
inm
anycases
similarly
packagedo
rexposed.
Inthe
chopbars
thepresence
of
buzzinghouseflies
isnot
theonly
sourceo
ffood
contamination;
them
assuse
of
facilitiessuch
aseating
platesand
bowls
(which
may
notalw
aysbe
properlyw
ashedbefore
thenext
buyeris
served),drinking
cupsand
napkins/towels
forcleaning
thehands,
asw
ellas
thep
oo
rpersonal
hygieneo
fm
anyoperators
andstaff
of
thesechop
bars,m
ayw
ellbepossible
sourceso
ffoodcontam
inationtoo.
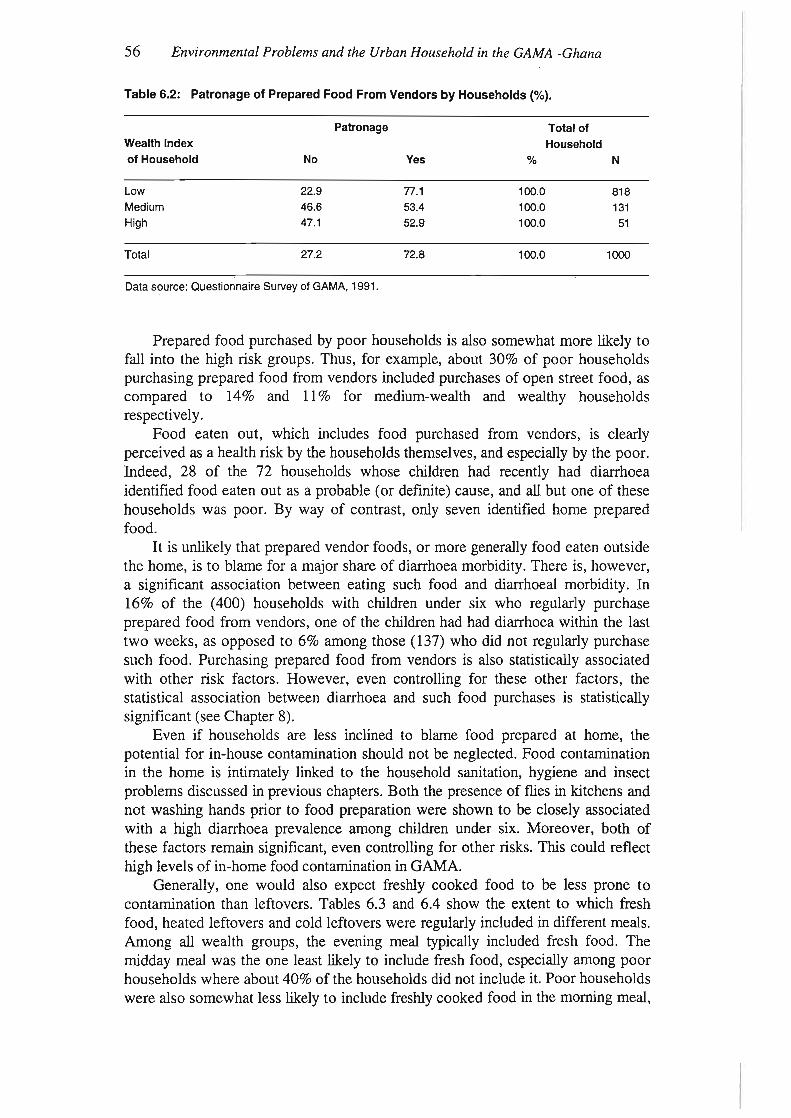
56
Environm
entalP
roblems
andthe
Urban
Household
inthe
GA
MA
-Ghana
Table
6.2:P
atronageo
fP
reparedF
oodF
romV
endorsb
yH
ouseholds(%
).
Pa
tron
ag
eT
ota
l of
We
alth
Ind
ex
Ho
use
ho
ldo
fH
ou
seh
old
No
Yes
%N
Low22.9
n.l
100.0818
Medium
46.653.4
100.0131
High
47.152.9
100.051
Total
27.272.8
100.01000
Data
source:Q
uestionnaireS
urveyofG
AM
A,
1991.
Prepared
foodpurchased
bypoor
householdsis
alsosom
ewhat
more
likelyto
fallinto
thehigh
riskgroups.
Thus,
forexam
ple,about
30%o
fpoor
householdspurchasing
preparedfood
fromvendors
includedpurchases
of
openstreet
food,as
compared
to14%
and11%
form
edium-w
ealthand
wealthy
householdsrespectively.
Food
eatenout,
which
includesfood
purchasedfrom
vendors,is
clearlyperceived
asa
healthrisk
bythe
householdsthem
selves,and
especiallyby
thepoor.
Indeed,28
of
the72
householdsw
hosechildren
hadrecently
haddiarrhoea
identifiedfood
eatenout
asa
probable(or
definite)cause,
andallbut
oneo
fthese
householdsw
aspoor.
By
way
of
contrast,only
sevenidentified
home
preparedfood.It
isunlikely
thatprepared
vendorfoods,
or
more
generallyfood
eatenoutside
thehom
e,is
toblam
efor
am
ajorshare
of
diarrhoeam
orbidity.T
hereis,
however,
asignificant
associationbetw
eeneating
suchfood
anddiarrhoeal
morbidity.
In16%
of
the(400)
householdsw
ithchildren
undersix
who
regularlypurchase
preparedfood
fromvendors,
oneo
fthe
childrenhad
haddiarrhoea
within
thelast
two
weeks,
asopposed
to6%
among
those(137)
who
didnot
regularlypurchase
suchfood.
Purchasing
preparedfood
fromvendors
isalso
statisticallyassociated
with
otherrisk
factors.H
owever,
evencontrolling
forthese
otherfactors,
thestatistical
associationbetw
eendiarrhoea
andsuch
foodpurchases
isstatistically
significant(seeC
hapter8).
Even
ifhouseholds
areless
inclinedto
blame
foodprepared
athom
e,the
potentialfor
in-housecontam
inationshould
notbe
neglected.F
oodcontam
inationin
thehom
eis
intimately
linkedto
thehousehold
sanitation,hygiene
andinsect
problems
discussedin
previouschapters.
Both
thepresence
of
fliesin
kitchensand
notw
ashinghands
priorto
foodpreparation
were
shown
tobe
closelyassociated
with
ahigh
diarrhoeaprevalence
among
childrenunder
six.M
oreover,both
of
thesefactors
remain
significant,even
controllingfor
otherrisks.
This
couldreflect
highlevels
ofin-hom
efood
contamination
inG
AM
A.
Generally,
onew
ouldalso
expectfreshly
cookedfood
tobe
lessprone
tocontam
inationthan
leftovers.T
ables6.3
and6.4
showthe
extentto
which
freshfood,
heatedleftovers
andcold
leftoversw
ereregularly
includedin
differentm
eals.A
mong
allw
ealthgroups,
theevening
meal
typicallyincluded
freshfood.
The
midday
meal
was
theone
leastlikely
toinclude
freshfood,
especiallyam
ongpoor
householdsw
hereabout40%
ofthe
householdsdid
notinclude
it.P
oorhouseholds
were
alsosom
ewhatless
likelyto
includefreshly
cookedfood
inthe
morning
meal,

Benneh
etal.57
thougheven
among
thepoor
more
thanfour
householdsin
fivedid
includefresW
ycooked
food.
Ta
ble
6.3:R
eg
ula
rIn
clusio
no
fF
resh
lyC
ookedF
oodin
Hom
eP
reparedM
ealsb
yH
ou
seh
old
Wealth.
Mo
rnin
gM
ealM
idd
ay
Meal
Eve
nin
gM
eal
We
alth
Ind
ex
No
Ye
sn
No
Ye
sn
No
Ye
sn
of
Ho
use
ho
ld(%
)(%
)(%
)(%
)(%
)(%
)
Lo
w17
83707
40
60530
397
785
Me
diu
m5
95121
1189
89
298
126
High
0100
4813
87
45
496
53
To
tal
14.485.6
87634.3
65.7664
3.097.0
964
Da
taso
urce
:Q
ue
stion
na
ireS
urve
yof
GA
MA
,1991.
Serving
reheatedleftovers
was
alsorelatively
comm
on,especially
forthe
midday
meal.
Except
forthe
morning
meal,
when
poorhouseholds
more
oftenincluded
reheatedleftovers,
itw
asthe
wealthier
householdsthat
were
more
inclinedto
servereheated
leftovers.T
hism
ayreflect
betterstorage
facilitieso
rthat
poorhouseholds
were
lesslikely
tohave
foodleftover.
Ta
ble
6.4:R
eg
ula
rIn
clusio
no
fR
eheatedL
efto
vers
inH
ome
Prepared
Meals
by
Ho
use
ho
ldW
ealth.
Mo
rnin
gM
ealM
idd
ay
Me
al
Eve
nin
gM
ea
l
We
alth
Ind
ex
No
Yes
nN
oY
esn
No
Ye
sn
of
Ho
use
ho
ld(%
)(%
)(%
)(%
)(%
)(%
)
Lo
w57
43703
6040
52871
29778
Me
diu
m64
36118
5149
8862
38125
High
7822
5042
5845
6238
53
To
tal
59.240.8
87157.6
42.4661
69.430.6
956
Da
taso
urce
:Q
ue
stion
na
ireS
urveyof
GA
MA
,1991.
As
illustratedin
Table
6.5,cold
leftoversw
ererarely
served,and
were
includedby
lessthan
10%o
fthehouseholds
inevery
category.

58
Environm
entalP
roblems
andthe
Urban
Household
inthe
GA
MA
-Ghana
Ta
ble
6.5
:R
eg
ula
rIn
clu
sio
no
fC
old
Le
ftove
rsin
Ho
me
Pre
pa
red
Me
als
by
Ho
use
ho
ldW
ea
lth.
We
alth
Mo
rnin
gM
ealM
idd
ay
Meal
Eve
nin
gM
ealIn
de
xo
fN
oY
esn
No
Yes
nN
oY
esn
Ho
use
ho
ld(%
)(%
)(%
)(%
)(%
)(%
)
Low97
3699
946
52398
2774
Medium
929
11894
688
982
125H
igh100
050
982
45100
053
Total
973
83794
6656
982
952
Data
source:Q
uestionnaireS
urveyofG
AM
A,
1991.
6.4F
oodStorage
inthe
Hom
eD
uringthe
surveythe
facilitiesfor
thehousehold
storageof
rawvegetables,
rawm
eat,and
leftoversw
ereinvestigated.
The
surveyrevealed
thatw
hilethe
refrigeratorw
asthe
most
popularstorage
facilityfor
theabove-m
entionedcategories
offood
among
them
ediumand
highincom
ehouseholds,
farfew
erhouseholds
inthe
lowincom
ebracket
usedthis
facility.M
anyo
fthe
poorhouseholds
eitherused
cupboardsor
thecovered
dishes(both
ofw
hichare
ineffectivestorage
facilities)for
thestorage
ofthese
categoriesof
food(see
Tables
6.6,6.7
and6.8).
There
were
alsoquite
anum
berof
poorhouseholds
who
eitherdid
notuse
anyo
fthe
storagefacilities
identifiedor
donot
haveany
of
thefood
categoriessurveyed
tostore.
Ta
ble
6.6
:S
tora
ge
Fa
cilitie
sN
orm
ally
Use
dfo
rR
aw
Ve
ge
tab
les
by
Ho
use
ho
ldW
ea
lth.
We
alth
To
taI
Ind
ex
of
Re
fri-C
up
-O
pe
nC
ove
red
Fo
od
Ho
use
ho
ldg
era
tor
bo
ard
Air
Dish
Ne
tN
lA%
n
Low30.1
15.610.5
27.62.1
14.1100.0
818M
edium81.7
5.33.8
5.30.8
3.1100.0
131
High
96.13.9
100.051
Total
40.213.5
9.123.5
1.811.9
100.01000
Data
source:Q
uestionnaireS
urveyofG
AM
A,
1991.

Benneh
etai.59
Ta
ble
6.7
:F
acilitie
sU
sed
for
Sto
ring
Ra
wM
ea
tb
yH
ou
seh
old
We
alth
(%).
Wealth
Ind
ex
of
Refri-
Cup-
Open
Covered
Food
To
tal
Household
ge
rato
rboard
Air
Dish
Net
NlA
%N
Low32.9
7.92.0
28.51.0
27.9100.0
818M
edium87.8
1.50.8
4.65.3
100.0131
High
98.02.0
100.051
Total
43.36.7
1.724.0
0.823.4
100.01000
Data
source:Q
uestionnaireS
urveyofG
AM
A,
1991.
Ta
ble
6.8
:F
acilitie
sU
sed
for
Sto
ring
Le
ftove
rsb
yH
ou
seh
old
We
alth
(%).
Wealth
Ind
ex
of
Refri-
Cup-
Open
Covered
Food
To
taI
Ho
use
ho
ldg
era
tor
boardA
irD
ishN
etN
lA%
N
Low27.5
10.93.3
46.62.0
9.7100.0
818
Medium
79.44.6
8.42.3
5.3100.0
131
High
94.02.0
2.02.0
100.051
Total
37.79.5
2.839.3
1.98.8
100.01000
Data
source:Q
uestionnaireS
urveyofG
AM
A,
1991.
The
generalpattern
thatem
ergesfrom
theabove
tablesis
thatit
isthe
poorerhouseholds
thatuse
theless
effectivestorage
facilitiesto
storethe
threecategories
offood.
They
thereforestand
thegreatest
riskof
losingtheir
freshfoods
andleftovers
throughspoilage.
This
problemis
highlightedin
theansw
ersto
questionsregarding
thetim
eit
takesfor
leftoversto
spoil.T
hereis
alarger
proportiono
flow
income
householdsfor
whom
leftoversspoil
rapidly(see
Table
6.9).T
hisis
obviouslydue
tothe
inefficientstorage
facilitiesused.
The
tablealso
shows
thatthere
isa
largerproportion
of
highincom
ehouseholds
forw
homthe
questionof
spoilageof
leftoversdoes
notapply,
most
probablybecause
ofthe
useof
refrigeratorsand
deepfreezing
facilities.
Ta
ble
6.9
:T
ime
Ta
ken
by
Le
ftove
rsto
Sp
oil
by
Ho
use
ho
ldW
ea
lth(%
).
Num
berof
Hours
Wealth
Ind
ex
of
To
tal
Ho
use
ho
ld1
-12
13-
2424
andA
boveN
lA%
N
Low33.0
31.58.1
27.4100.0
818
Medium
22.118.3
10.748.9
100.0131
High
15.717.6
11.854.9
100.051
Total
30.729.1
8.631.6
100.01000
Data
source:Q
uestionnaireS
urveyof G
AM
A,
1991.

60
Environm
entalP
roblems
andthe
Urban
Household
inthe
GA
MA
-Ghana
Bo
x6.1:
Fo
od
Ven
din
gan
dW
ealth
Figure
6.1:Purchase
ofuncovered
streetfoo
ds
from
ven
do
rsb
yw
ealthg
rou
p
30N
=205
en"
25o.EGil!!__
20
-;;~
1lf!
Qi.g15
~;
g>
~~
10G
lenca.s:u
5...:::Jn.
oL
ow
L·MM
iddle
We
elth
gro
up
s
M·H
High
InG
AM
A,
buyingprepared
foodfrom
vendorsis
nota
luxurycon
finedto
thew
ealthy.N
otonlyare
poorhouseholdsm
orelikely
topa
tronizevendors,butthey
arem
orelikely
topurchase
uncoveredstreet
foods,as
illustratedin
Figure
6.1.R
espondentsw
ithsick
childrenof
tenblam
edfood
preparedaw
ayfrom
home,
anda
statisticalasso
ciationbetw
eendiarrhoea
prevalence
andfrequenting
foodvendors
was
found.W
hilethese
vendorsprovide
anim
portantservice,
im
provinghygiene
practicesam
ongthese
vendorsis
oneo
fthe
more
importantfood-related
issues.
Data
source:Qu
estio
nn
aire
surve
yo
fAccra,
1991.
Note:
The
wealth
groupsem
ployedin
thesediagram
sare
basedon
thesam
ew
ealthindex
employed
inthe
restof
thereport.
How
ever,ratherthan
threeunequalgroups
(thepoor
majority,a
small
wealthy
elite,anda
somew
hatlargermedium
-wealth
group),five
groupso
froughlyequal
sizehave
beencreated
forthe
graphicalpresentation.

Benneh
etat.
CH
AP
TE
RSE
VE
N
61
7A
IRP
OL
LU
TIO
NA
ND
HO
USIN
G7.1
Household
Air
Pollution
Air
pollutionis
among
them
ostdiscussed
urbanenvironm
entalproblem
sin
internationalcircles,
andstatistics
onoutdoor
concentrationso
fparticulates
andS
02
areavailable
fora
wide
number
of
citiesacross
thew
orld(U
NE
PIW
HO
,1988).
How
ever,concentrations
inam
bientair
arepoor
indicatorso
fthe
healthburden
of
airpollutants.
High
levelso
fexposure
canresult
frompollution
which
onlyaccounts
fora
small
shareo
fthe
overallurban
airpollution
load.Pollution
fromcooking
fIiesis
acase
inpoint:
exposurecan
behazardous
dueto
highconcentrations
inthe
vicinityo
fthe
stove,even
ifthe
contributionto
monitored
ambient
airconcentrationsis
insignifIcant.A
listingo
fsome
ofthe
major
airpollutants
andtheir
potentialhealth
effectsis
providedin
Table
7.1,along
with
WH
Oguidelines.
Table
7.2sum
marises
therecom
mendations
of
theE
nvironmental
Protection
Council
of
Ghana
(seeC
hapter10).
Weekly
airquality
monitoring
hasbeen
establishedat
two
sitesin
Tem
a(A
muzu
andL
eitmann,
1991).Paststudies
havefound
particulateconcentrations
inam
bientair
inresidential
areasto
bebelow
suggestedlim
its.Sim
ilarly,results
froma
small
number
of
samples
indicatecom
parativelylow
sulphurdioxide
concentrations.G
enerally,w
hileoutdoor
airpollution
may
well
come
tobe
acritical
issuein
GA
MA
asindustrialisation
andm
otorizationproceed,
thereis
noevidence
thatitiscurrently
am
ajorhealth
problem.
Table
7.1:E
ffects
andg
uid
elin
es
for
ma
jor
air
po
lluta
nts.
Po
lluta
nt
Kn
ow
nD
an
ae
rW
HO
Gu
ide
line
sIJglm3
SU
lphurdioxide
respiratoryproblem
sannual
mean:
40-60
98th%
tile:100-150
TS
PIJglm
3
Particulates
respiratoryproblem
sannual
mean:
40
-60
98th%
tile:150-230
mg/m
2
Carbon
Monoxide
reducedability
toabsorb
oxygenand
15m
inutes:100
attendantdam
age3
0m
inutes:6
0
1h
ou
r:3
0
8h
ou
rs:1
0
LeadP
roblems
ofthecirculatory
andIJglm
3
nervoussyste
ms
annualm
ean:0.5-1.0
Nitrogen
dioxideviral
infections,·silo
-fillers·disease
IJglm3
andlung
disorders1
ho
ur:
40
0
24hours:
150
Po
lycyclica
rom
atic
cancer
hydrocarbons
Data
source:U
NE
P-W
HO
,1988;
Wellburn,
1988.

62
Environm
entalP
roblems
andthe
Urban
Household
inthe
GA
MA
-Ghana
ab
le7
.2:
Re
co
mm
en
de
dA
mb
ien
tA
irQ
ua
litvS
tan
da
rds
for
Se
lecte
dP
ollu
tan
ts-
Gh
an
a.
Po
lluta
nt
Effe
ctiveA
reaM
ax.P
erm
issible
LevelA
vera
ain
aT
ime
1.Pa
rticula
tes
Du
sta)
TotalS
uspendedR
esidential260
IJg/m3
24hours
Particulates
Industrial290
IJg/m3
24hours
b)R
espirablenon-
toxicdust
Residential
150IJg/m
324
hoursIndustrial
260IJg/m
324
hours
c)D
ustF
allR
esidential8
Ukm
2/month
1m
onthIndustrial
10U
km2/m
onth1
month
2.T
oxic
Pa
rticula
tes
a)A
sbestosA
llAreas
1fibre/m
324
hours
b)F
luorides(Total)
AllA
reas10
IJglm3
24hours
c)Lead
AllA
reas15IJglm
324
hours
d)A
rsenicA
llAreas
10ualm
324
hours
3.G
asesS
ulphurdioxide
AllA
reas200
ua/m3
24hours
TData
source:E
nvironmental
Protection
Council,
1977.
The
potentialdangers
of
exposureto
smoke
fromcooking
fIreshas
onlyrecently
begunto
receivew
idespreadattention.
Recent
estimates
suggest,how
ever,that
pollutionconcentrations
encounteredin
thevicinity
of
cookingfIres
accountfor
afar
largershare
ofglobal
human
exposureto
airborneparticulates
thandoes
ambient
airpollution
(Smith,
1993).F
oran
individualhousehold,
exposuredepends
onsuch
factorsas
thecooking
fuel,the
stove,ventilation,
cookingpractices,
andthe
locationo
fboth
thepeople
cDoking
andother
householdm
embers.
Even
within
GA
MA
thereis
sufficientvariation
inthese
factorsto
leadto
verydifferenthealth
burdensam
ongdifferentgroups.
7.1.1C
ookingF
uelsT
heresults
of
thequestionnaire
surveyindicate
afuel
transitionas
onem
ovesfrom
poorto
wealthy
households.A
sillustrated
inT
able7.3,
charcoalw
asthe
principalcooking
fuelo
fm
orethan
three-quartersof
thepoor
households,follow
edby
fuelwood
(usedprincipally
inthe
ruralfringe).
Am
ongm
ediumw
ealthhouseholds,
charcoalw
asalso
them
ostcom
mon
principalfuel,
butbottled
gas(L
PG)
was
almost
asprevalent.
For
abouttw
othirds
of
thew
ealthyhouseholds
LP
Gw
asthe
principalfuel,
followed
byelectricity.
This
shiftfrom
biofuelsto
LP
Gand
electricity,often
describedas
an"energy
ladder",is
comm
onto
many
urbanareas
acrossthe
world
(McG
ranahanand
Kaijser,
1993).D
espitethe
variationsam
ongw
ealthgroups,
charcoalstands
outas
thedom
inantfuel,
afInding
consistentw
iththe
Ghana
Living
Standards
Survey
(Ghana
Governm
ent,1989),
which
estimated
that81
%o
fhouseholds
inA
ccraused
charcoalas
cookingfuel.
Moreover,
theresults
of
oursurvey
indicaterelatively
highstability
infuel
usepatterns:
85%ofhouseholds
hadbeen
usingtheir
principalcookingfuels
form
orethan
fIveyears,
with
somew
hathigher
percentagesam
ongw
oodand
charcoalusers.

Benneh
etai.63
Ta
ble
7.3
:P
rincip
al
Co
okin
gF
ue
lb
yH
ou
seh
old
We
alth
(%).
Wealth
Do
no
tF
uel-C
har-K
ero-G
asE
lec-T
ota
IIn
de
xo
fco
ok
wo
od
or
coalsene
(LPG
)tricity
%N
Ho
use
ho
ldsim
ilar
Low1.0
8.875.6
6.16.1
2.4100.0
818M
edium1.5
3.143.5
6.941.2
3.8100.0
131H
igh2.0
9.868.6
19.6100.0
51
Total
1.07.7
68.06.0
13.83.5
100.01000
Data
source:Q
uestionnaireS
urveyofG
AM
A,
1991.
Fuelchoice
ism
orecom
plicatedthan
thesestatistics
might
seemto
suggest,how
ever:A
lmost
halfo
fthe
householdsused
more
thanone
fuel(see
Table
7.4),w
ithm
ultiplefuel
usem
ostcom
mon
among
wealthy
households.B
eingable
touse
more
thanone
fuelprovides
security,in
caseo
fsupply
interruptions.A
lso,som
ew
ealthyhouseholds
haveservants
cookingw
ithone
fuel,w
hilethey
themselves
cookw
ithanother.
Taking
accounto
fm
ultipleuse,
afull
88%o
fhouseholds
usecharcoal
atleastintermittently,including
60%ofthe
wealthy
households.
Ta
ble
7.4
:S
eco
nd
Co
okin
gF
ue
lsb
yH
ou
seh
old
We
alth
(%).
Wealth
No
seco
nd
Fuel-
Char-
Kero-
Gas
Elec-
To
taI
Ind
ex
of
fue
lw
oo
do
rcoal
sene(LP
G)
tricity%
NH
ou
seh
old
simila
r
Low54.4
9.616.1
15.91.6
2.3100.0
818M
edium37.2
3.935.7
13.25.4
4.7100.0
131H
igh19.6
7.847.1
2.09.8
13.7100.0
51
Total
50.78.8
20.114.7
2.53.1
100.01000
Data
source:Q
uestionnaireS
urveyofG
AM
A,
1991.
7.1.2C
ookingL
ocationsT
hecooking
locationsem
ployedw
erealso
verydiverse,
asindicated
inT
able7.5.
As
with
cookingfuels,
cookinglocations
beara
closerelation
tow
ealth.A
lmost
allw
ealthyhouseholds
hadseparate
kitchens,com
paredw
ithtw
othirds
of
medium
w
ealthhouseholds,
andonly
aboutone
infour
poorhouseholds.
Every
othercooking
location,from
multi-purpose
rooms,
tocooking
huts,to
openair,
were
more
frequentlyused
bypoor
households.

64
Environm
entalP
roblems
andthe
Urban
Household
inthe
GA
MA
-Ghana
Ta
ble
7.5
:C
oo
kin
gL
oca
tion
sb
yH
ou
se
ho
ldW
ea
lth(0/0).
Wealth
Separate
Oth
er
Co
mm
un
al
Co
okin
gV
erandaO
penT
ota
lIn
de
xo
fK
itche
nP
rivateR
oomH
ut
Air
NH
ou
seh
old
Ro
om
Low26.1
10.43.3
11.526.8
52.3817
Medium
66.75.4
1.66.2
17.133.3
129H
igh96.2
1.91.9
1.913.2
15.153
Total
35.09.3
3.010.3
24.847.8
999
Data
source:Q
uestionnaireS
urveyofG
AM
A,
1991.
Note:
The
figuresin
thetable
arepercentages
ofhouseholds.
Since
some
householdsused
more
thanone
location,the
percentagessum
tom
orethan
100.
The
locationalpatterns
aredisplayed
ina
somew
hatdifferentform
inT
able7.6
About
onethird
of
thehouseholds
always
cookedindoors,
onequarter
sometim
escooked
indoorsand
sometim
esoutdoors,
with
therem
aining40%
always
cookingoutdoors
(outdoorsis
defmed
hereto
includeverandas
andother
coveredopen-air
locations).T
heshift
towards
indoorlocations
with
increasingw
ealthis
clear.P
arto
fthis
shiftis
presumably
dueto
thegreater
indoorspace
availableto
wealthier
households.Indeed
poorhouseholds
livingin
theR
uralFringe
arem
orelikely
tohave
anindoor
cookinglocation
thanpoor
householdsin
them
orecrow
dedsectors.
Another
parto
fthe
shiftis
anoutcom
eo
fthe
fuelsused:
generallythe
more
smoky
fuelsare
more
likelyto
beused
outdoors.
Ta
ble
7.6
:O
utd
oo
ra
nd
Ind
oo
rC
oo
kin
gL
oca
tion
by
Ho
use
ho
ldW
ea
lth(0/0).
We
alth
Ind
ex
of
Alw
ays
Bo
thIn
do
ors
Alw
ays
To
taI
Ho
use
ho
ldO
utd
oo
rsand
Ou
tdo
ors
Ind
oo
rs%
N
Low49.7
22.927.4
100.0807
Medium
20.526.0
53.5100.0
127
High
25.574.5
100.051
Total
43.423.5
33.2100.0
985
Date
Source:
Questionnaire
Survey
ofGA
MA
,1991
Note:
Households
notcookingathom
eare
excludedfrom
thistable.
About
aquarter
of
thehouseholds
usingeither
fuelwood
orcharcoal
always
cookedindoors.
Ifhouseholdsw
ithcooking
hutsare
excluded,the
percentagefalls
to18.
Outdoor
cookingraises
avariety
of
hygieneand
sanitationproblem
s,but
onem
ightexpect
reducedsm
okeexposure.
How
ever,sm
okefrom
openfIres
canbe
blown
intothe
faceso
fthose
cooking.M
oreover,all
buta
fewpoor
andm
ediumw
ealthhouseholds
cookingindoors
saidthat
theircooking
rooms
were
ventilated.

Benneh
etaL.65
For
children,exposure
will
of
coursedepend
onw
hetherthey
arepresent
while
thecooking
isgoing
on.T
able7.7
indicatesthat
childrenin
poorhouseholds
areconsiderably
more
likelyto
bepresent.
Ta
ble
7.7:P
rese
nce
of
Ch
ildre
nU
nd
er
Six
Du
ring
Co
okin
gb
yH
ou
seh
old
We
alth
(%).
Wealth
Indexo
fN
everS
ometim
esU
suallyT
ota
IH
ouseholdP
resentP
resentP
resent%
N
Low32.8
40.426.9
100.0458
Medium
39.741.4
18.9100.0
58H
igh60.9
26.113.0
100.023
Total
34.739.9
25.4100.0
539
Data
source:Q
uestionnaireS
urveyof
GA
MA
,1991.
Note:
This
tab
leonly
includeshouseholds
with
childrenunder
six.
7.1.3E
xposureto
Respirable
Particulates
While
Cooking
Exposure
torespirable
particulates(R
SP)is
generallytaken
tobe
theprinciple
riskassociated
with
highconcentrations
ofair
pollutionfrom
cookingfires.
The
particulatesem
ittedcontain
avariety
ofcarcinogens.
But
more
important
toG
AM
Adw
ellers,particulates
canincrease
susceptibilityto
respiratoryinfection
among
childrenand
chronicrespiratory
problems
inadults.
Anum
berof
studiesundertaken
inother
countries,including
some
inA
frica,suggest
thatexposure
tow
ood-fuelsm
okecontributes
toacute
respiratoryinfections
inchildren
andchronic
obstructivelung
diseasein
wom
en(see
Chen
etaI.,
1990or
Smith,
1993).H
owever,
sincethe
evidencealso
indicatesconsiderable
variationin
exposureacross
differentlocations,itisim
portanttobe
ableto
assessexposures
locally.In
orderto
determine
more
preciselythe
levelso
fexposurew
omen
inG
AM
Aface
while
cooking,199
wom
enw
erem
onitoredfor
bothrespirable
particulates(R
SP
)and
carbonm
onoxide(C
O).
Inthis
section,the
resultsof
theR
SPm
easurements
aresum
marised.
Adescription
ofthe
measurem
entprocedures
areprovided
inA
ppendix3.
Briefly,
thew
omen
were
requestedto
wear
portablepum
psw
ithfIlters
forabout
threehours,
spanningthe
time
spentcooking
am
eal.T
heparticulates
collectedduring
thisperiod
were
measured,
andthen
employed
tocalculate
theaverage
concentrationof
respirableparticulates
inthe
vicinityof
thew
oman's
faceduring
theperiod.
As
illustratedin
Table
7.8,the
resultsconform
tothe
anticipatedfuel
hierarchy.W
oodusers
were
subjectto
thehighest
averageconcentrations,
followed
bycharcoal
usersand
fmally
kerosene,L
PG
andelectricity
users(grouped
togetherdue
tothe
small
sample
size).T
hedifferences
inthe
estimated
means
areappreciable.
At
587/lg/m
3,the
estimated
mean
concentrationfaced
byw
oodusers
isover
twice
theestim
ateof
195/lg/m
3for
kerosene,L
PG
andelectricity
users.W
hilethere
was
considerablevariation
inthe
averageconcentrations
evenw
ithinthe
fueluser
groups,fuel
choiceis
quiteclearly
an

66
Environm
entalP
roblems
andthe
Urban
Household
inthe
GA
MA
-Ghana
important
factorin
determining
exposure 1.T
hefrequency
distributionin
Figure
7.1-3illustrates
theextentto
which
wood
usersare
exposedto
largerquantities
ofrespirable
suspendedparticles
compared
tocharcoal
orkerosene,
LP
Gand
electricityusers.
Ta
ble
7.8:A
vera
ge
con
cen
tratio
ns
ofR
SP
(J1g/m3)
inthree
gro
up
so
ffue
lusers.
Wood
Mean
SE
n
587.1194.0
21
Charcoal
Mean
SE
n
341.234.4
122
Ke
rose
ne
,LP
G,e
lectr.
Mean
SE
n
195.255.0
24
Data
source:P
ersonalmonitoring
undertakenin
GA
MA
forthisstudy.
AS
P-
Wo
od
n=21605
0
40
%302
010o
00
00
00
00
0IJ'l
0IJ'l
0IJ'l
0IJ'l
08
NIJ'l
...~
~~
~0N
00
0N
c::iIJ'l
00
00
00
NIJ'l
IJ'l0
IJ'l0
'"...
~~
~~
IJg/m
3
Fig
ure
7.1:F
req
ue
ncy
distrib
utio
no
fR
SP
con
cen
tratio
ns
am
on
gw
oo
du
sers.
RS
P-
Ch
arc
oa
l
n=
11
9605
0
40
%3
0
2010O-l-l"'...:.::L~-"4~o.l.+'';';;;;''J..+..I.:''''''-I.~--'-4----+,~,,+--+l'''~
0~
80
80
80
§IJ'l
IJ'lIJ'l
§N
IJ'l...
~~
~~
.;N
8N
c::iIJ'l
0:5
0:5
0N
IJ'lIJ'l
IJ'lIJ'l
"~
~~
~
IJg/m
3
Fig
ure
7.2:F
req
ue
ncy
distrib
utio
no
fR
SP
con
cen
tratio
ns
am
on
gch
arco
alu
sers.
IAN
OV
Aanalysis
indicatedstatistically
significantdifferences
inexposure
toR
SPam
ongthe
threefuel-user
groups(p=O
.002).F
urtheranalysis,
applyingt-tests,
showed
astatistically
significantdifference
inR
SPexposure
between
wood
andcharcoal
users(p=O
.022)and
am
arginallysignificant
differencebetw
eencharcoal
usersand
kerosine,L
PG
andelectricity
users(p=
O.075).

Benneh
etal.
RS
P•
LPG
etc.n=
24
67
605040
%3
02010o0
00
00
00
00
0II)
0II)
0II)
0II)
00
NII)
.....0
NII)
.....0
00
00
......
......
N0
...0
00
00
00
C\l
ciII)
00
00
00
NII)
II)0
II)0
II).....
0N
II).....
......
......
~m3
Fig
ure
7.3:F
req
ue
ncy
distrib
utio
no
fRS
Pco
nce
ntra
tion
sa
mo
ng
kerosene,
LPG
an
de
lectricity
use
rs.
There
areno
directlyapplicable
internationalstandards
orguidelines
with
which
tocom
parethese
concentrationlevels.
How
ever,for
outdoorair,
WH
Orecom
mends
thatthe
mean
dailyconcentration
oftotal
suspendedparticulates
(TS
P)
shouldnotexceed
150-230Jlg/rn 3
more
thanseven
daysper
year(see
Table
7.1).T
heU
nitedS
tatesG
overnment
hasset
a24-hour
standardo
f150Jlg/m
3that
shouldnot
beexceeded
more
thanonce
ayear.
Also,
asnoted
inT
able7.2
above,the
maxim
umperm
issiblelevel
of
TS
Pin
residentialareas
inG
hanais
150Jlg/m3
(averagedover
24hours).
Inview
of
thesefigures
thelevels
measured
aredisturbingly
high.In
acom
parablestudy
fromZ
ambia,
wood
usersw
ereexposed
toa
mean
concentrationo
frespirable
particleso
f890
Jlg/m3,
charcoal.users
to380
Jlg/m3
andelectricity
usersto
240Jlg/m
3(E
llegardand
Egneus,
1992).T
hesefigures
arenot
verydifferent,
andcould
easilybe
accountedfor
bysom
ewhat
different.cooking
locationsand
practices.W
ithinG
AM
A,
nosignificant
differencesin
exposurecould
bedetected
among
thedistricts,
orbetw
eenhigh,
medium
andlow
classresidential
areas.H
owever,
asnoted
above,poor
householdsare
more
likelyto
usew
oodor
charcoalas
theirprincipal
fuel,w
hilehouseholds
inthe
ruralfringe
arethe
most
likelyto
usew
ood.It
issafe
toassum
e,therefore,
thatthe
poor,and
particularlythe
more
ruralpoor,face
thehighestexposure
torespirable
particulates.
7.1.4E
xposureto
Carbon
Monoxide
While
Cooking
Carbon
monoxide
(CO
)is
alsoem
ittedfrom
cookingfires,
andcan
behazardous
tothe
health.F
actorsthat
governthe
toxicityo
fC
Oinclude
theconcentration
of
thegas
inthe
inhaledair,
theduration
of
exposure,the
respiratoryvolum
e,the
cardiacoutput,
theoxygen
demand
of
thetissues
andthe
concentrationo
fhaem
oglobinin
theblood.
Table
7.9indicates
thephysiological
effectsdifferent
CO
levelshave
in

68E
nvironmental
Problem
sand
theU
rbanH
ouseholdin
theG
AM
A-G
hana
humans.
CO
exposureis
ofparticular
concernfor
pregnantw
omen,
andtheir
unbornchildren.
Ta
ble
7.9
:E
ffects
of
carb
on
mo
no
xide
an
dth
eir
likely
acco
mp
an
ying
carb
oxyh
ae
mo
glo
bin
blo
od
(CO
Hb
)co
nte
nt
inh
um
an
s.
Exp
osu
rera
ng
e·
Effe
cta
nd
symp
tom
sC
OH
b··
(pp
m)
blo
od
con
c.%
0-1
0N
odiscom
forto
reffect
0-21
0-5
0G
eneraltiredness,im
pairedvigilance
2-10and
reductionin
manual
dexterity5
0-1
00
Slight
headache,pronounced
tiredness10-20
andirritability
10
0-2
00
Headache
20-302
00
-40
0S
evereheadache,
visualim
pairment,
30-40nausea,
generalweakness
andvom
iting4
00
-60
0A
sabove,
butw
ithg
rea
ter
possibility40-50
ofcollapse
60
0-8
00
Fainting,
increasedpulse
rateand
50-60convulsions
80
0-1
60
0C
oma,
we
ak
pulseand
possibilityofdeath
60-701600-
Death
within
ash
ort
period7
0-
*2
hoursexposure
**Likely
equilibriumcarboxyhaem
oglobin/oxyhaemoglobin
ratiosin
theblood
aftersom
etim
ew
hilstresting
(althoughthey
may
beachieved
threetim
esas
fastduringheavy
work
andgenerally
byheatand
humidity).
Data
source:W
ellburn,1988.
p274.
WH
Oguidelines
forC
Oexposure
areas
follows:
maxim
umexposure
of
100m
glm
3(87
ppm)
fora
time
durationof
notm
orethan
15m
inutes,and
30m
glm
3
(approximately
25ppm
)for
atim
eduration
ofnot
more
than1
hour(U
NE
P
WH
O,
1988).E
PC
ofG
hanahas
norecom
mended
standardsin
regardo
fC
Oexposure
levels.H
encethe
WH
Oguideline
valueo
f25
ppmfor
1hour
isused
inthe
following
discussionresults.
The
averageexposures
ofthe
fivefuel-user
groupsare
presentedin
Table
7.10,along
with
thetim
e-weighted
averageconcentrations.
The
datashow
sthat
charcoalusers
were
thegroup
most
exposedto
CO
,follow
edby
wood
usersand,
[mally,
kerosene,L
PG
andelectricity
users.T
hegraphical
presentationin
Figure
7.4-6o
fthe
frequencydistribution
ofC
Oam
ongthe
threefuel
usergroups
inG
AM
Adem
onstratethat
more
charcoalusers
were
exposedto
higherconcentrations
thanusers
ofw
oodor
kerosene,L
PGand
electricity.A
llC
Oconcentrations
forw
oodusers
fallunder
20ppm
andunder
10ppm
forkerosene,
LPG
andelectricity
users.

Benneh
etal.
Table
7.10:A
vera
ge
con
cen
tratio
no
fCO
measured
asd
ose
un
its(p
pm
h)
andca
lcula
ted
Tim
e-W
eig
hte
dA
vera
ge
sin
thre
efu
el-u
ser
gro
up
so
ffue
luse
rs.
69
Wood
Mean
SE
nC
harcoalM
eanS
En
Kerosene,LP
G,electr.
Mean
SE
n
Exposure
(ppmh)
Concentration
(ppm)
24.17.5
9.124
3.024
33.111.0
2.9137
1.0137
3.81.2
1.10.4
3232
Data
source:P
ersonalm
onitoringundertaken
inG
AM
Afor
thisstudy.
CO
-Wo
od
n=228060
II
%4
020oo
0.1-1
010.1
-50
ppmC
O(TW
A)
50-
Fig
ure
7.4:F
req
ue
ncy
distrib
utio
no
fcarb
on
mo
no
xide
con
cen
tratio
ns
am
on
gw
oo
du
sers.
co-
Charcoal
n=l228060
%4
02000
0.1-
101
0.1
-50
50
-
pp
mC
O(T
WA
)
Fig
ure
7.5:F
req
ue
ncy
distrib
utio
no
fcarb
on
mo
no
xide
con
cen
tratio
ns
am
on
gch
arco
alusers.

70
Environm
entalP
roblems
andthe
Urban
Household
inthe
GA
MA
-Ghana
co-LP
Getc.
n=26
80706050
%4
0302010oo
0.1
-10
10
.1-5
0
ppmC
O(TW
A)
50
-
Fig
ure
7.6:F
req
ue
ncy
distrib
utio
no
fcarb
on
mo
no
xide
con
cen
tratio
ns
am
on
gkerosene,
LPG
an
de
lectricity
use
rs.
About
6%o
fthecharcoal
usersw
ereexposed
toan
averageC
Oconcentration
greaterthan
25ppm,
theU
NE
P-W
HO
guidelinefor
1hour
of
exposure.T
hem
easuringtim
eranged
between
1.6-
4.5hours,
with
am
eanm
easuringtim
eo
f3.0
hours,suggesting
that25ppm
isvery
conservative.A
lso,table
7.9indicates
thateven
lowexposure
levelso
f10-50
ppmv
havea
negativeeffectin
humans,w
hichis
accentuatedw
henexposure
time
isprolonged.
Itis
bestto
assume
thatC
Oexposure,
likeexposure
toparticulates,
isa
healthburden
fora
significantshareof
thew
omen
inG
AM
A.
Inthe
Zam
biastudy
referredto
above(E
llegardand
Egneus,
1992),the
mean
CO
exposuresw
erefound
tobe
43ppm
hfor
fuelwood
usersand
65ppm
hfor
charcoalusers,
which
areabout
doublethe
dosesm
easuredin
thepresent
studyand
coverperiods
of
similar
duration.W
hencom
paredto
arecent
studyfrom
Maputo
which
againused
similar
measurem
enttechniques
anddurations,
theC
Odose
measured
inA
ccrafor
wood,
24ppmh,
isalso
considerablylow
erthan
theM
aputodose
of
49ppm
h,w
hilecharcoal
levelsare
of
thesam
em
agnitude,33
ppmh
inA
ccraversus
37ppm
hin
Maputo
(Ellegard,
1993.).Ina
tablecom
piledby
Sm
ith(1987),
two
studiesfrom
Nepal
reported14
-295
ppmC
Oduring
1-
2hour
cookingperiods.
One
would
expectexposures
inN
epalto
beconsiderably
higherthan
Accra,
however,
ascooking
isoften
performed
indoorsw
ithvery
littleventilation.
7.1.5C
ookingP
atternsand
Respiratory
Problem
sT
heresults
describedabove
suggestthat
exposureto
pollutionfrom
cookingfires
isindeed
ahealth
risk,even
ifthe
situationis
likelyto
bew
orsein
otherparts
ofG
hanaw
herew
ooduse
ism
oreprevalent.
This
sectionlooks
brieflyat
therelationship
between
cookingpatterns
andsym
ptoms
of
respiratoryproblem
sin
female
principalhom
emakers
andchildren
undersix.
Am
orecom
prehensiveanalysis
of
respiratoryproblem
s,w
hichattem
ptsto
takeinto
accountfactors
otherthan
airpollution,
ispresented
inC
hapter8.
Even
inthis
section,how
ever,the
41principal
homem
akersw
hosm
okehave
beenexcluded
toavoid
distortingthe
results.M
orethan
halfo
fthe
smokers
complained
of
respiratoryproblem
symptom
s(e.g.
sorethroat,
cough,and
difficultiesbreathing),
ascom
paredto
18%for
non-smoking
principalhomem
akers.

Benneh
etal.71
Table
7.11presents
thetw
o-week
prevalenceo
frespiratory
problemsym
ptoms
forprincipal
homem
akersgrouped
accordingto
cookingpractices.
Only
thosecategories
foundto
bestatistically
significantare
included.P
erhapssurprisingly,
therelationship
between
fuelchoice
andrespiratory
problemprevalence
was
notstatistically
significant.A
sdescribed
inC
hapter8,
thism
aybe
dueto
otherrisk
factorsthe
wom
enusing
cleanfuels
face.A
lso,m
ultiplefuel
useand
therelatively
small
shareo
fhouseholds
usingthe
cleanerfuel
make
itinherently
more
difficultto
detectassociations.
Alonger
cookingtim
e,cooking
ina
cookinghut,
andnot
cookingin
theopen
air,are
allassociated
with
higherprevalences,
which
couldw
ellreflecthigher
exposuresto
airpollution.
Ta
ble
7.1
1:
Co
okin
gP
atte
rns
an
dth
eP
reva
len
ceo
fR
esp
irato
ryP
rob
lem
Sym
pto
ms
inF
em
ale
Prin
cipa
lH
om
em
ake
rs.
Category
Households
inC
ategoryT
wo-w
eekP
revalence(%
)
a.S
ometim
esco
ok
inopen
air
Yes
No
b.S
ometim
esco
ok
inco
okin
gh
ut
Yes
No
c.H
ou
rssto
veis
litper
da
y0~3
hours3+
hours
43413.8
47622.1
9425.6
81617.3
50615.4
40321.3
Data
source:Q
uestionnairesurvey
ofGA
MA
,1991.
Note:
Households
withoutfem
aleprincipalhom
emakers
andm
issingvalues
areexcluded.
The
wom
enm
onitoredfor
exposurew
erealso
testedfor
peakexpiratory
flow(see
Appendix
1.3).T
hepeak
expiratoryflow
(PE
F)
isproportional
tothe
diameter
of
theupper
andcentral
airways
andtherefore
lowvalues
canindicate
theexistence
of
areduction
inthe
airways
dueto
inflamm
atoryreactions
orblockage
byphlegm
.S
uchreaction
couldbe
dueto
theeffect
of
prolongedexposure
toparticulates
andirritating
gases(E
llegardand
Egneus,
1992).H
owever,
neitherthe
differencesin
PE
Fbefore
andafter
cooking,nor
thedifferences
between
fuels,are
appreciable(see
Table
7.12).
Ta
ble
7.1
2:
Pe
ak
Exp
irato
ryF
low
IImin
be
fore
an
da
fter
co
okin
gp
erio
db
yfu
el-u
ser
gro
up
.
Co
okin
gfuel
Wood
Charcoal
Kerosene,LP
G,E
lectr.m
eanS
En
mean
SE
nm
eanS
En
FinalPE
F344.4
20.824
361.67.2
1393
n.0
20.532
InitialPE
F373.4
17.424
353.77.0
139365.5
19.732
Difference
-29.07.9
11.6
Data
source:P
ersonalmonitoring
undertakenin
GA
MA
forthisstudy.

72
Environm
entalP
roblems
andthe
Urban
Household
inthe
GA
MA
-Ghana
As
illustratedin
Table
7.13,children
undersix
were
more
likelyto
havehad
symptom
so
facute
respiratoryinfection
inthe
lasttw
ow
eeksif
theyw
eregenerally
presentduring
cookingo
rif
cookingw
asdone
ina
cookinghut.
Again,
thiscould
well
reflectdifferences
inair
pollutionexposure.
Table
7.13:C
oo
king
Pa
ttern
sand
theP
revalenceo
fAcu
teR
espiratoryIn
fectio
nS
ymp
tom
sin
Ch
ildre
nU
nderS
ix.
Ca
teg
ory
Ho
use
ho
lds
inC
ate
go
ryT
wo-w
eekP
revalence(%
)
a.S
om
etim
es
coo
kin
coo
king
hu
tY
es63
20.6N
o481
10.6
b.C
hild
ren
pre
sen
t du
ring
coo
king
Usually
13720.4
Rarely
4029.0
Data
Source:
Questionnaire
surveyofG
AM
A.
1991.N
ote:H
ouseholdsw
ithoutchildrenunder
sixand
missing
valuesare
excluded.
7.2H
ousingT
hesize
andquality
of
thedw
ellingare,
ofcourse,critical
aspectso
fthe
householdenvironm
ent.M
anyprevious
sectionso
fthis
reporthave
dealt,either
directlyo
rindirectly,
with
housingproblem
s.T
herecent
Housing
Needs
Assessm
entS
tudy(H
ousingand
Urban
Developm
entA
ssociates,1990)
examines
GA
MA
'shousing
situationin
some
depth.T
hissection
providesa
briefassessm
ento
fselected
housingproblem
s,drawing
onthe
resultso
fthe
questionnairesurvey.
Excessive
crowding
clearlyaffects
thew
ellbeing
of
ahousehold,
andm
anystudies
indicateit
canalso
affecthealth
(Bradley
etal.,
1991).N
eighbourhoodcrow
dingis
atleast
partiallycaptured
inthe
strataupon
which
thequestionnaire
surveyw
asbased.
Crow
dingw
ithinthe
home
canbe
equallyim
portant.A
sindicated
inT
able7.14,
abouta
thirdo
fthe
householdssurveyed
residedin
oneroom
,another
thirdin
two
rooms,
andthe
finalthird
inthree
orm
oreroom
s.W
hileabout
41%
of
thepoor
householdslived
inone
room,
noneo
fthe
wealthy
householdsdid
so.Indeed,
94%lived
inthree
or
more
rooms,
indicatingthe
extentto
which
overcrowding
isassociated
with
poverty.
Table
7.14:N
um
be
ro
fR
ooms
Household
Occupies
by
Ho
use
ho
ldW
ealth.
We
alth
Nu
mb
ero
fRo
om
sO
ccup
ied
Ind
ex
of
One
Tw
oT
hree+T
ota
IH
ou
seh
old
Room
Room
sR
oo
ms
%N
Low40.9
35.423.7
100.0816
Medium
11.529.2
59.2100.0
130
High
5.994.1
100.051
Total
35.033.1
31.9100.0
997
Data
source:Q
uestionnairesurvey
ofGA
MA
.1991.
Note:
Missing
valuesare
excludedfrom
table.

Benneh
etal.73
Itis
possible,how
ever,for
crowding
toresult
evenin
homes
with
severalroom
s,especially
ifthe
useof
most
rooms
isrestricted
toone
ortw
ohouseholds
mem
bers.F
orthis
reason,the
spaceavailable
perperson
inthe
most
crowded
sleepingroom
canbe
abetter
indicatoro
fcrow
dingfor
most
householdm
embers
thanthe
overallnum
berofroom
sor
theirfloor
space.As
indicatedin
Table
7.15,in
about60%
ofhouseholds
thereis
lessthan
4square
meters
perperson
inthe
most
crowded
sleepingroom
,though
among
wealthy
householdsthe
percentagefalls
to16.W
hileall
buta
fewofthese
rooms
areventilated,
thislevel
of
crowding
isa
causefor
concern.Principal
homem
akersin
householdsw
ithless
than4
squarem
etersper
personhave
asom
ewhat
higherprevalence
of
respiratoryproblem
s(21
%instead
of
18%),
butthere
isa
more
obviousdifference
among
householdsw
ithsm
allchildren:
among
the(388)
householdsw
ithless
than4
squarem
eters,14%
hadhad
achild
with
symptom
sof
acuterespiratory
infectionin
thepast
two
weeks,
ascom
paredto
6%am
ongthe
(139)households
with
more
space.
Ta
ble
7.15:S
pa
cep
er
Pe
rson
inM
ostC
row
de
dS
lee
pin
gR
oo
m.
We
alth
Sq
ua
reM
ete
rsP
er
Pe
rson
Ind
ex
of
To
taI
Ho
use
ho
ld<2
2-44-8
8+%
N
Low11.4
53.328.6
6.7100.0
796
Medium
7.938.6
43.310.2
100.0127
High
2.014.3
57.126.5
100.049
Total
10.549.4
32.08.1
100.0972
Data
source:Q
uestionnairesurvey
ofG
AM
A,
1991.
Note:
Missing
valuesare
excludedfrom
table.
Dam
pconditions
canalso
affectboth
well
beingand
health.O
verall,40%
ofthe
householdsreported
thattheir
roofsleaked,
18%
complained
of
damp
conditions,and
14%reported
mildew
orm
ouldproblem
s.A
gainthe
problems
were
farm
oreprevalent
among
poorhouseholds
thanam
ongthe
wealthy.
Thus,
forexam
ple,43%
ofpoor
householdshad
leakyroofs,
compared
with
23%of
thew
ealthyhouseholds,
20%o
fpoor
householdscom
plainedof
damp
conditions,com
paredw
ith6%
ofw
ealthyhouseholds,
and15%
ofpoor
householdsreported
mildew
orm
ouldproblem
sw
hileno
wealthy
householdsreported
suchproblem
s.

74
Environm
entalProblem
sand
theU
rbanH
ouseholdin
theG
AM
A-G
hana
Bo
x7.1:
Co
okin
gF
uels
and
Wealth
N=
205187
210200
198
Fig
ure
7.1:D
istribu
tion
ofh
ou
seh
old
sb
ytyp
eo
fprin
cipa
lco
okin
gfu
elin
Accra
by
wealth
gro
up
100%
80%
60%
40%
20%0%Low
L-MM
iddleU
-MU
pper
•E
lectricity
•LP
G•
Kerosene
DC
harcoal
IIIW
oodfuel
•D
onotcook
N=
Subsam
plesize
Cooking
firesare
almost
certainly
them
ainsource
ofpersonal
exposureto
airpollution
forw
omen
inG
AM
A.
Charcoal
isthe
dominant
cookingfuel,
andis
likelyto
remain
sofor
many
yearsto
come.
As
illustratedin
Figure
7.1,how
ever,there
isa
fuelhierarchy,
with
asm
allbut
significantshare
of
thepoorest
householdsusing
wood,
andL
PG
andelectricity
becoming
significantin
thew
ealthiest
groups.E
xposurem
onitoringundertaken
forthis
studyindi
catedthat
wood
usersare
them
ostexposedto
particulates,follow
edby
charcoalusersand
finally
kerosene,LPG
andelectric
ityusers.
Data
source:Questionnaire
surveyofA
ccra,1991.
Note:
The
wealth
groupsem
ployedin
thesediagram
sare
basedon
thesam
ew
ealthindex
employed
inthe
resto
fthe
report.H
owever,rather
thanthree
unequalgroups(the
poorm
ajority,asm
allwealthy
elite,anda
somew
hatlargerm
edium-w
ealthgroup),
fivegroups
of
roughlyequal
sizehave
beencreated
forthe
graphicalpresentation.

Benneh
etal.
CH
AP
TE
RE
IGH
T
75
8H
OU
SE
HO
LD
EN
VIR
ON
ME
NT
AN
DH
EA
LT
H8.1
IntroductionM
anyo
fthe
environmental
problems
describedabove
posehealth
risks.In
individualchapters,
some
of
thesehealth
risksw
erediscussed,
andem
piricalassociations
between
particularenvironm
entalhazards
andill
healthw
erepresented.
Tw
oo
fthe
most
important
environment-related
healthproblem
sare
diarrhoeaand
respiratoryillness.N
eithero
fthese
healthproblem
sare
simple
effectso
findividualenvironm
entalfactors.
There
area
number
of
interrelatedenvironm
entalrisk
factors,w
hichare
relatedin
tumto
non-environmental
factorssuch
asage,
malnutrition
andso
on.O
neo
fthe
reasonsfor
bringingthe
healthissues
togetherin
thischapter
isto
broachsom
eof
thesecom
plexities.M
oregenerally,
byconsidering
thehealth
issuestogether,
itis
possibleto
demonstrate
more
forcefullythe
criticalim
portanceo
fhousehold
andneighbourhood
environments
tothe
well-being
ofthe
population.A
mong
theten
top"diseases"
reporte~
atoutpatient
facilitiesin
theG
reaterA
ccraR
egion(T
able8.1),
environment-related
healthproblem
sfeature
veryprom
inently.(G
AM
Aaccounts
forover
90%o
fthepopulation
ofthe
region.).F
orthe
period1987
to1990,
thetop
threeon
thelist
were
malaria,
diarrhoea,and
upperrespiratory
tractinfection.
Outpatient
visitsare
abiased
sourceof
information
onm
orbidity,and
will
tendto
exaggeratethe
importance
of
thebetter
known
treatableconditions.
On
theone
hand,people
arem
orelikely
tobecom
eoutpatients
ifthey
believethere
isa
treatment
fortheir
condition.O
nthe
otherhand,
thediagnostics
arerelatively
superficial.M
alaria,forexam
ple,is
likelyto
beover-reported,
sincethere
isa
treatment
known
tom
ostpotem
ialpatients,
anda
tendencyto
labelam
biguouscases
asm
alariaso
asto
justifytreatm
ent.E
venaccepting
thedata
deficiencies,how
ever,the
highprevalence
of
environment
relatedhealth
problems
isclear.
Table
8.1
:T
enM
ost
Fre
qu
en
tlyR
eportedH
ealthP
roblems
atO
utp
atie
nt
Fa
cilities
(Greater
Accra
Region
-19
87
-90
).
19
87
%1988
%1989
%1
99
0%
ma
laria
53.0m
alaria45.7
malaria
44.3m
alaria41.0
diarrhoea10.9
diarrhoea7.0
respiratoryinf.
10.9respiratory
info9.1
resp
irato
ryinf.
8.0
respiratoryinfo
10.3diarrhoea
5.8diarrhoea
5.9skin
dise
ase
s7
.3skin
dise
ase
s4.9
skindiseases
4.5skin
diseases5
.3a
ccide
nts
5.3
accidents3.2
pregnancyrelated
3.4pregnancy
related4.1
acu
teeye
info4
.3acute
eyeinfo
2.1accidents
3.2accidents
3.9
intestinalwo
rms
3.4intestinalw
orms
2.6intestinalw
orms
1.8hypertension
2.4
pre
gn
an
cyrelated
3.0
anaemia
2.1rheum
atism2.8
intestinalwo
rms
2.1
hypertension2
.3hypertension
2.4hypertension
2.0anaem
ia2
.02
feve
r2.1
pre
gn
an
cyrelated
1.9anaem
ia1.7
feve
r2.0
Data
source:G
ha
na
Governm
ent,1991.
2P
yrexia(fever)
of
unknown
origin.

76
Environm
entalP
roblems
andthe
Urban
Household
inthe
GA
MA
-Ghana
The
following
statement
fromthe
1991H
ealthA
nnualR
eportfor
GA
MA
clearlyem
phasisesthe
twin
roleo
fpoor
environmental
conditionsand
povertyin
causingdisease
inthe
metropolis:
"Ma
laria,
skinconditions,
respiratoryconditions,
measles,
whooping
cough,tuberculosis
andgastro-intestinal
infections-featuredprom
inentlyin
thelist
of
diseasescom
mon
inthe
Metropolis.
Poor
hygienicstandards
dueto
lacko
fhealth
knowledge
coupledw
ithlow
eredresistance
dueto
malnutrition
havebeen
some
ofthe
predisposingcauses
ofa
number
ofcases"
(Ghana
Governm
ent,1991,
p.2).
Over
time,
ifeconom
icconditions
improve,
thedisease
profileis
likelyto
change.A
lready,there
aresom
eindications
thatdiseases
more
typicallyassociated
with
wealthy
lifestyles,such
ascancer
andheart
disease,m
aybe
becoming
increasinglyim
portantcauses
of
deathin
GA
MA
.C
urrently,how
ever,the
most
evidenthealth
problems
arenot
theresult
of
lifestylechoices,
buto
fthe
lacko
fchoice.
Inthe
courseo
fthe
householdsurvey,
questionsw
ereasked
regardingdiarrhoea,
respiratoryillness
andm
alariaam
ongchildren
undersix,
andrespiratory
problems
among
principalhom
emakers,
most
of
whom
arew
omen.
The
principalsections
of
thischapter
coverdiarrhoea
andrespiratory
problems
inturn.
Num
erousother
healthproblem
sare
environment-related,
butare
noteasily
addressedusing
theapproach
adoptedin
thisstudy.
Malaria
isone
of
them
ostim
portantdiseases
inA
ccra.T
heprevalence
of
Anopheles
mosquitoes
dependson
anum
bero
fenvironm
entalfactors,
some
of
which
havebeen
discussedin
Chapter
5.O
ftenthe
linksare
complex.
Inadequatew
atersupplies,
forexam
ple,lead
tow
aterstorage
inthe
home,
creatinga
potentialbreeding
sitefor
malaria
vectors(see
page48
above).T
hesurvey
datado
notallow
fordetailed
analysis,how
ever.W
hileabout
19%o
fthe
householdsw
ithchildren
undersix
saidthat
atleast
oneo
fthe
childrenhad
hadm
alariaw
ithinthe
lasttw
ow
eeks,self
reportingo
fm
alariais
inaccurate.M
oreover,since
Anopheles
mosquitoes
make
uponly
asm
allshare
of
them
osquitopopulation,
reportso
fm
osquitobiting
arenot
agood
indicatoro
frisk
(some
of
them
orecom
mon
mosquitoes
can,how
ever,be
vectorso
fother
diseases,such
asdengue
andyellow
fever).F
inally,factors
suchas
proximity
tonatural
breedingsites
arelikely
tobe
critical,b
ut
were
notidentified
duringthe
survey.F
orthese
reasons,no
attempt
ism
adehere
togo
beyondthe
discussiono
fC
hapter5.
Sim
ilarly,epidem
icsare
notam
enableto
analysisusing
thehousehold
surveydata.
Inm
anycases,
however,
theconditions
which
sustainendem
icdiseases
arealso
thosew
hichgive
riseto
epidemics.
Evidence
inG
AM
Ao
fcholera
morbidity
in1991
suggeststhat
theurban
poorliving
indegraded
slumenvironm
entsw
ithp
oo
rw
aterand
sanitationfacilities
arem
oreat
riskfrom
choleraattack.
There
were
more
thantw
othousand
reportedcases
of
choleraw
ith35
reporteddeaths
inA
ccraD
istrictalone
(AM
A,
1991,T
able6).
The
residentialareas
where
thediseases
were
prevalentw
erem
ainlyfound
inthe
poorsectors.
The
poorneighbourhoods
inw
hichthe
epidemic
occurredinclude
Nirna,
Accra,
New
Tow
n,M
aamobi,
Zongo,
Sukura
andA
beka.O
thersare
Bukom
,Jam
esT
own,
Korle
Wokon,
Korle
Gonno,
Chorkor,
Labadi
andT
eshie.N
oneo
fthe
remaining
areascited,
includingA
sylumD
own,
Adabraka,
Kaneshie
andT
eshie,w
erehigh
classresidential
areaso
fthecity.
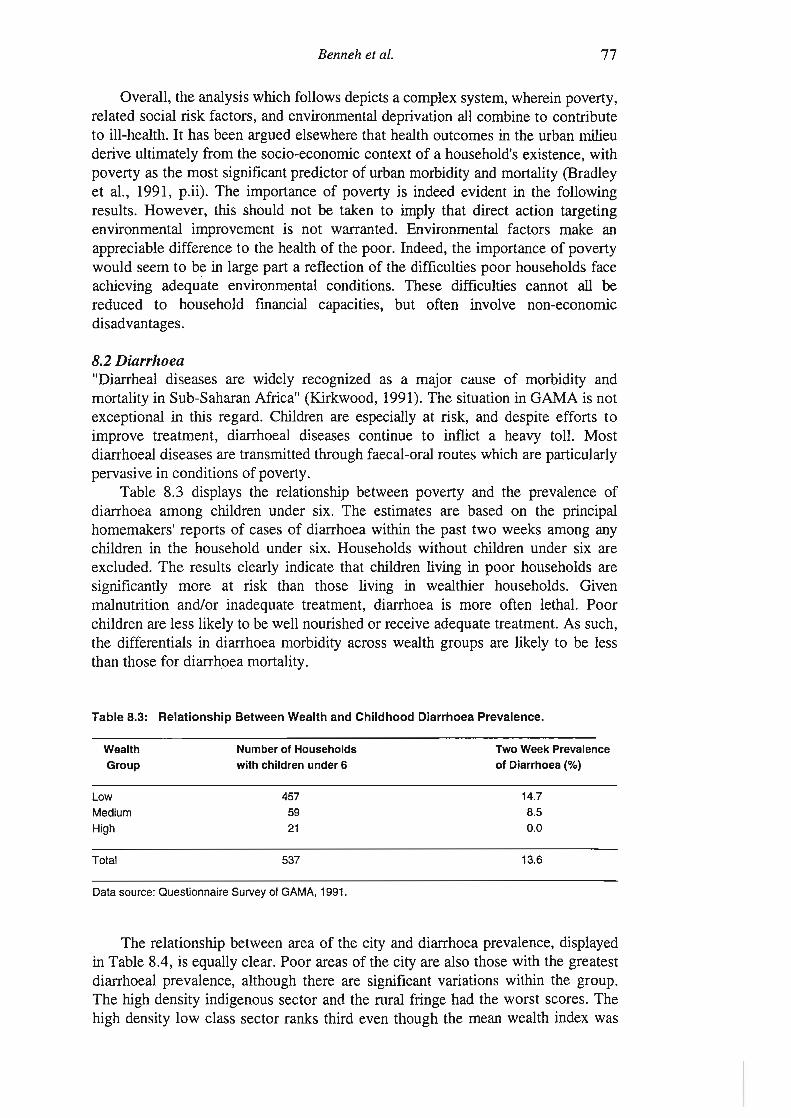
Benneh
etal.77
Overall,
theanalysis
which
follows
depictsa
complex
system,w
hereinpoverty,
relatedsocial
riskfactors,
andenvironm
entaldeprivation
allcom
bineto
contributeto
ill-health.Ithas
beenargued
elsewhere
thathealth
outcomes
inthe
urbanm
ilieuderive
ultimately
fromthe
socio-economic
contexto
fa
household'sexistence,
with
povertyas
them
ostsignificantpredictor
of
urbanm
orbidityand
mortality
(Bradley
etal.,
1991,p.ii).
The
importance
of
povertyis
indeedevident
inthe
following
results.H
owever,
thisshould
notbe
takento
imply
thatdirect
actiontargeting
environmental
improvem
entis
notw
arranted.E
nvironmental
factorsm
akean
appreciabledifference
tothe
healtho
fthe
poor.Indeed,
theim
portanceo
fpoverty
would
seemto
bein
largepart
areflection
of
thedifficulties
poorhouseholds
faceachieving
adequateenvironm
entalconditions.
These
difficultiescannot
allbe
reducedto
householdfm
ancialcapacities,
butoften
involvenon-econom
icdisadvantages.
8.2D
iarrhoea"D
iarrhealdiseases
arew
idelyrecognized
asa
major
causeo
fm
orbidityand
mortality
inS
ub-Saharan
Africa"
(Kirkw
ood,1991).
The
situationin
GA
MA
isnot
exceptionalin
thisregard.
Children
areespecially
atrisk,
anddespite
effortsto
improve
treatment,
diarrhoealdiseases
continueto
inflicta
heavytoll.
Most
diarrhoealdiseases
aretransm
ittedthrough
faecal-oralroutes
which
areparticularly
pervasivein
conditionso
fpoverty.T
able8.3
displaysthe
relationshipbetw
eenpoverty
andthe
prevalenceo
fdiarrhoea
among
childrenunder
six.T
heestim
atesare
basedon
theprincipal
homem
akers'reports
of
caseso
fdiarrhoea
within
thepast
two
weeks
among
anychildren
inthe
householdunder
six.H
ouseholdsw
ithoutchildren
undersix
areexcluded.
Th
eresults
clearlyindicate
thatchildren
livingin
poorhouseholds
aresignificantly
more
atrisk
thanthose
livingin
wealthier
households.G
ivenm
alnutritionand/or
inadequatetreatm
ent,diarrhoea
ism
oreoften
lethal.P
oorchildren
areless
likelyto
bew
ellnourished
orreceive
adequatetreatm
ent.A
ssuch,
thedifferentials
indiarrhoea
morbidity
acrossw
ealthgroups
arelikely
tobe
lessthan
thosefor
diarrhoeam
ortality.
Ta
ble
8.3:R
ela
tion
ship
Betw
eenW
ea
lthand
Ch
ildh
oo
dD
iarrh
oe
aP
revalence.
We
alth
Group
Lo
w
Medium
High
Total
Nu
mb
er
of
Ho
use
ho
lds
with
child
ren
un
de
r6
4575921
537
Tw
oW
ee
kP
reva
len
ceo
fD
iarrh
oe
a(%
)
14.78.50.0
13.6
Data
source:Q
ue
stion
na
ireS
urveyo
fGA
MA
,1991.
The
relationshipbetw
eenarea
of
thecity
anddiarrhoea
prevalence,displayed
inT
able8.4,
isequally
clear.P
oorareas
of
thecity
arealso
thosew
iththe
greatestdiarrhoeal
prevalence,although
thereare
significantvariations
within
thegroup.
The
highdensity
indigenoussector
andthe
ruralfringe
hadthe
worst
scores.T
hehigh
densitylow
classsector
ranksthird
eventhough
them
eanw
ealthindex
was

78E
nvironmental
Problem
sand
theU
rbanH
ouseholdin
theG
AM
A-G
hana
higherfor
thehigh
densityindigenous
sectorthan
thehigh
densitylow
classsector.
By"
contrast,the
diarrhoealprevalence
was
quitelow
forthe
middle
densityindigenous
sector,the
middle
tolow
densitym
iddleclass
sectorand
thelow
densityhigh
classsector
(incorporatingthe
newly
developinglow
densityareas).
Table
8.4:R
ela
tion
ship
between
Re
side
ntia
lSe
ctor
andC
hild
ho
od
Diarrhoea
Prevalence.
Are
a
RF
HD
LCS
HD
IS
MD
ISM
-LDM
CS
LDH
CS
Total
Nu
mb
ero
fH
ou
seh
old
sw
ithch
ildre
nu
nd
er
6
29
27481617022
537
Tw
oW
eekP
reva
len
ceo
fD
iarrh
oe
a(%
)
24.1
14.0
26.05.0
4.34.6
13.6
Key:
RF
=Rural
Fringe;
HD
LCS
=High
Density
LowC
lassS
ector;H
DIS
=High
Density
IndigenousS
ector;
MD
IS=
Middle
Density
IndigenousS
ector;M
-LDM
CS
=Middle
toLow
Density
Middle
Class
Sector;
LDH
CS
=Low
Density
High
Class
Sector
(includingN
ewly
Developing
Sector).
Data
source:Q
uestionnaireS
urveyofG
AM
A,
1991.
There
area
number
of
additionalsocial
factorsw
hichcould
beexpected
toaffect
diarrhoeaprevalence.
As
notedin
Chapter
One,
asignificant
shareo
fthe
householdsin
Accra
areheaded
byfem
ales.S
uchhouseholds
tendto
bepoorer
thanm
aleheaded
households.A
bout79%
ofall
male
headedhouseholds
fellinto
thepoor
groupw
ith15%
and7%
inthe
medium
income
andw
ealthygroups
respectively.B
ycontrast,
89%o
fall
female
headedhouseholds
were
poor,w
ith7%
and4%
lyingin
them
ediumincom
eand
wealth
groupsrespectively.
Nevertheless,
theprevalence
of
diarrhoeain
childrenunder
6w
asonly
marginally
higherfor
female
headedhouseholds
thanm
aleheaded
ones.A
bout13%
of
all(415)
male
headedhouseholds
with
childrenunder
6had
diarrhoea,as
compared
to15%
forall
(122)fem
aleheaded
householdsw
ithchildren
under6.
This
may
bedue
tothe
factthat
wom
entend
tochannel
more
of
theirincom
eand
time
totheir
childrenthan
men.
The
importance
of
wom
enis
alsohighlighted
bythe
factthat
when
theprincipal
homem
aker(generally
aw
oman)
spendsm
oretim
eat
home,
thechildren
areless
likelyto
havehad
diarrhoea.T
hus,for
example,
inthe
(174)households
where
theprincipal
homem
akertypically
spendsalm
ostall
hertim
eat
home,
diarrhoeaprevalence
fallto
about9%.
The
environmental
factorsm
ostoften
linkedto
diarrhoealm
ortalityand
morbidity
arew
aterand
sanitation.S
tudiesindicate
that"children
fromhouseholds
usingpublic
standpipesand
cesspoolsare
severaltim
esm
orelikely
todie
fromdiarrhoea
thanthose
with
in-housepiped
water
andsew
erage"(B
radleyet
al.,1991,
p.ii).T
herehave
beensim
ilarfindings
with
respectto
diarrhoealm
orbidity:"C
omparing
theresults
of
studieso
fdiarrhoeal
morbidity,
Esrey,
Feacham
andH
ughes(1985)
founda
median
percentagereduction
indiarrhoeal
morbidity
of16%
inthe
9cases
involvingim
provedw
aterquality,
25%
inthe
17cases
involvingim
provedw
ateravailability,
37%in
the8
casesinvolving
improvem
ents
Benneh
etal.79
inboth
water
qualityand
availability,and
22%in
the10
casesinvolving
improvem
entsin
excretadisposal"
(McG
ranahan,1991,p.14).
The
resultso
four
own
analysiscited
inthe
chapterson
water
andsanitation
tendto
conformto
suchobservations.
For
example,
theprevalence
of
childhooddiarrhoea
among
householdsusing
comm
unalstandpipes
was
severaltim
eshigher
thanam
ongthose
with
indoorpiped
water
supply.D
ifferenceso
fa
similar
magnitude
were
observedbetw
eenhouseholds
usingnon-flush
toilettechnologies
(i.e.pit,
KV
IP,
andpan
latrines)and
thosew
ithflush
systems.
As
Lindskog
andL
undqvisthave
indicated,im
provements
insanitation
andhygiene
may
havea
greaterim
pactupon
diarrhoealdiseases
thanim
provements
inw
aterquality
atsource
alone."T
hism
aybe
sobecause
improvem
entsin
water-quality
atthe
water
sourceonly
influencethe
diseaseload
inone
way,w
hileim
provements
insanitation
andpersonal
hygieneinfluence
thedisease
loadin
threedifferent
ways.
Firstly,better
personalhygiene
reducesfaecal-oral
transmission
viasolid
bodies.Secondly,
betterhygiene
reducesfaecal-oral
transmission
viaw
ater.Finally,
betterhygiene
reducesfaecal-oral
transmission
viafood.
Improvem
entsin
sanitation,i.e.
properlyconstructed
pit-latrinesw
hichare
correctly.used,prevent
transmission
viaw
ater,w
hilelack
of
goodpersonal
hygienem
aystill
resultin
transmission
viathe
otherroutes"
(Lindskog
andL
undqvist,1989,p.21).
Itis
thereforeim
portantto
takeaccount
of
hygienepractices
of
householdsto
achievea
betterunderstanding
of
thespread
ofdiarrhoeal
diseases.O
therfactors
which
were
identifiedin
previouschapters
aspotential
causeso
fhigh
diarrhoeaprevalence
includepurchasing
preparedfood
fromvendors
andthe
presenceof
fliesin
foodpreparation
areasand
toilets.In
acity
likeA
ccra,household
hygieneis
notindependent
of
water
andsanitation
facilities,how
ever.W
ithouta
reliablew
atersource,
goodhygiene
habitsare
difficulttom
aintain.As
indicatedin
Chapter
3,handw
ashingw
ouldseem
tobe
more
closelyassociated
with
thetype
of
water
sourcea
householdhas
thanthe
educationlevel
of
theprincipal
homem
aker.Sim
ilarly,hygiene
habitscan
beaffected
byinadequate
sanitation.T
heresults
summ
arisedin
Chapter
3clearly
demonstrate
thatoutdoordefecation
isrelated
toovercrow
dedsanitary
facilities.U
nderthese
circumstances,
itcanbe
unreasonableto
isolatespecific
causesof
highdiarrhoeal
morbidity,
andtarget
policiesaccordingly.
Socio-econom
icconditions
helpdeterm
ineaccess
toenvironm
entalam
enitiesw
hichin
turnhelp
determine
hygienepractices.
Even
incases
where
hygienepractices
arethe
proximate
cause,it
may
bem
oreappropriate
toachieve
betterhealth
throughim
provedfacilities
orim
provedeconom
icopportunities,
ratherthan
admonishing
peopleto
adoptbetterhygiene
practices.T
hesecom
plexinterrelationships
alsom
akeit
difficultto
analysethe
associationsbetw
eenenvironm
entand
diarrhoeam
orbiditystatistically
One
of
them
orecom
mon
techniquesem
ployedby
epidemiologists
islogistic
regression(A
rmitage
andB
erry,1987).
This
techniqueallow
ssim
ultaneousanalysis
ofdiarrhoea
prevalenceand
anum
bero
fpossible
explanatoryfactors.
Itis
generallypreferable
totechniques
which
examine
associationsbetw
eendiarrhoea
morbidity
andenvironm
entalconditions
oneby
one,in
thatit
avoidsfully
ascribingthe
same
diarrhoeacases
toa
number
of
differentfactors.
On
theother
hand,logistic
regressioncannot
capturethe
hierarchyo
finterrelationships
describedabove:
itcannot
model,
forexam
ple,the
way
inw
hichsocio-econom
icconditions
relateto
diarrhoeam
orbiditythrough
accessto
environmental
amenities.

80
Environm
entalP
roblems
andthe
Urban
Household
inthe
GA
MA
-Ghana
Table
8.5displays
thechildhood
diarrhoeaprevalence
among
8high
riskgroups
identifiedthrough
logisticregression.
Only
householdsw
ithchildren
undersix,
andhaving
information
onall
ofthe
relevantvariables,
areincluded
inthe
table.A
sindicated,
thedifference
between
thediarrhoea
prevalencein
any
on
eof
thesegroups
andthe
diarrhoeaprevalence
forthe
restof
thesub-sam
pleis
highlysignificantstatistically
(p<
.01).
Ta
ble
8.5:C
hild
ren
'sD
iarrh
oe
aP
reva
len
cein
Hig
hR
iskH
ou
seh
old
Gro
up
sId
en
tified
for
Lo
gistic
Re
gre
ssion
-Accra
.E
nvironmentalF
eatureH
ouseholdsin
Subsam
pleT
wo
Week
Diarrhoea
Prevalence
(%)
18.832.427.828.025.223.2
3033490132151125
Sh
are
toile
twith
>5
households
Use
Po
t for
Storing
Wa
ter
Op
en
Wa
ter
Sto
rag
eC
on
tain
er
Ou
tdo
or
De
feca
tion
·N
eighb.C
hildren
Ma
ny
Flies
inK
itchen
Do
no
tW
ash
Ha
nd
s-
be
fore
Food
Prep.
Wa
ter
Su
pp
lyIn
terru
ptio
ns
(time
of
day)329
17.9
Bu
yP
rep
are
dF
oo
dfrom
Ve
nd
ors
37416.6
Total
50013.8
Diffe
ren
ceb
etw
ee
nhigh
riskg
rou
pand
resto
fsam
ple
isstatistically
sign
ifican
t(p
<.01)
inall
cases.
Da
taS
ource:Q
ue
stion
na
ireS
urveyof G
AM
A-
1991
InT
able8.6
thediarrhoea
prevalenceis
presentedfor
householdsgrouped
accordingto
thenum
berof
highrisk
conditionsthe
householdsface.
The
associationvery
close.N
oneof
thehouseholds
facingless
thantw
oof
therisks
identifiedhad
children(under
six)w
ithdiarrhoea,
while
most
of
thehouseholds
facingm
orethan
fiverisks
hadat
leastone
childw
ithdiarrhoea.
One
would
notexpect
allthe
riskfactors
tobe
equallyclosely
associatedw
ithhigher
diarrhoeam
orbidity,how
ever.
Ta
ble
8.6:C
hild
ho
od
Dia
rrho
ea
Pre
vale
nce
by
Nu
mb
er
of
Hig
hR
iskC
on
ditio
ns
Ho
use
ho
ldF
aces.
Num
ber ofH
ighR
iskC
onditionsS
izeofS
ubsample
Tw
o-Week
Diarrhoea
Prevalence
(%)
No
ne
On
e
Tw
o
Th
ree
Fo
ur
Five
Six
Se
ven
195013311977682113
0.00.03.0
14.314.3
23.5
57.169.2
Da
taS
ource:Q
ue
stion
na
ireS
urveyofG
AM
A,
1991.

Benneh
etal.81
The
resultso
fthe
logisticregression
aresum
marised
inT
able8.7.
Even
enteredsim
ultaneously(and
alongw
ithvariables
forw
ealthquintile,
educationo
fthe
principalhom
emaker
andthe
number
of
childrenunder
six)all
of
therisk
factorsdisplay
statisticallysignificant
associationsw
ithdiarrhoea
morbidity
(p<.05).
The
oddsratio,
alsosom
etimes
referredto
asthe
approximate
relativerisk,
isan
estimate
of
theodds
of
havinghad
achild
(undersix)
with
diarrhoeaif
thefactor
ispresentover
theodds
of
havinghad
achild
with
diarrhoeaifthe
factoris
absent.F
or
allo
fthe
riskfactors,
itis
estimated
thatthe
oddso
fhaving
hada
childw
ithdiarrhoea
areat
leasttw
iceas
highif
thefactor
ispresent
thanif
itis
absent.
Table
8.7:S
um
ma
ryR
esu
ltso
fL
og
isticR
egressionR
elatingC
hild
ren
'sD
iarrhoeaP
reva
len
cew
ithE
nviro
nm
en
tal
Fa
ctors
inH
ou
seh
old
sw
ithC
hild
ren
Un
de
rS
ix.V
aria
ble
Use
po
tfor
storingw
ate
r
Wa
tersu
pp
lyinterruptions
Share
toiletwith
>5
households
Purchase
ven
do
rprepared
food
Open
wa
ter
storageco
nta
ine
r
Ou
tdo
ordefecation
Ma
ny
fliesin
kitchen
Don't
always
wa
shhands
before
preparingfood
Co
efficie
nt
1.47
1.12
.98
0.950.79
0.73
0.720.71
Sta
nd
ard
Erro
r
.48
.39A
O.45
.34.31
.32
.31
Sig
nifica
nce
.002
.004.015
.034
.022
.020.025
.023
Od
ds
Ratio4.34
3.06
2.66
2.582.19
2.082.05
2.03
Note:
Other
variablesincluded
inlogistic
regressionw
ereeducation
levelof
principalhom
emaker,
wealth
quintile,andnum
bero
fchildrenunder
six.N
oneof
thesevariables
were
statisticallysignificant
atthe
95%
confidencelevel,
however.
Environm
entalvariables
which
were
notincluded
dueto
alack
of
statistical
significancew
ere:w
atersource,
typeof
toiletfacility,
locationof
water
source,dirty
toiletfloor,
open
storageof
leftoverfood
observed,m
anyflies
inthe
toilet,and
crowding.
Data
Source:
Questionnaire
Survey
ofGA
MA
,1991.
These
resultsclearly
indicatethat
householdenvironm
entalfactors
playa
major
rolein
diarrhoeaprevalence,
andthereby
overallchild
morbidity
inA
ccra.A
llo
fthe
factorsidentified
throughthe
statisticalanalysis
aresuspected
contributorsto
thespread
of
faecal-oraldisease.
They
reflecta
number
of
differentpossible
routes,including
foodcontam
inationand
insects.Individual
coefficientsshould
notbe
givenundue
attention,how
ever.F
orexam
ple,the
highodds
ratioassociated
with
theuse
of
apot
forstoring
water
isbased
ona
verysm
allsubsam
pleo
fp
ot
users,and
inany
caseneed
notreflect
problems
with
potstorage
per
se.W
aterand
sanitaryconditions
areheavily
implicated,
butthe
most
comm
onindicators
of
accessto
water
andsanitation
(typeo
fw
atersource
andsanitary
facility)did
notem
ergeas
statisticallysignificant
inthe
multi-factor
analysis.T
heresults
conformto
theview
thataccess
tow
ater,rather
thanthe
qualityo
fthe
water
atsource,
iscritical
tohealth.
With
easyaccess
toa
goodw
atersupply,
therew
ouldbe
now
aterinterruptions,
noneed
tostore
water,
andas
notedabove
many
of
thehygiene
practicesidentified
would
befacilitated.
Similarly,
theresults
would
seemto
corroboratethe
viewthat
itisthe
quantityrather
thanquality
of
sanitationfacilities
which
iscritical.
Both
thelevel
of
sharingo
ftoilet
facilitiesand
theprevalence
of
outdoordefecation
bychildren
areclosely
linkedto
alack
of
toiletfacilities.

82E
nvironmentalP
roblems
andthe
Urban
Household
inthe
GA
MA
-Ghana
Three
of
thefactors
identifiedm
ayreflect
foodcontam
ination:w
ashinghands
beforepreparing
food,purchasing
preparedfood
fromvendors,
andthe
presenceo
fm
anyflies
inthe
kitchenor
foodpreparation
area.
8.3R
espiratoryIllness
Globally,
thelevel
ofm
orbidityand
mortality
causedby
respiratoryinfections
rivalsthat
fromdiarrhoeal
diseases.A
cuterespiratory
infection(A
Rl)
isparticularly
hazardousfor
children,especially
infants,and
theelderly
(Graham
,1990).
Viral
agentsaccount
forthe
majority
of
AR
Icases,
butbacterial
agentstend
tocause
more
severeinfections,
andaccount
fora
greatershare
of
fatalities(B
erman,
1991).A
lternatively,infections
affectingthe
lower
respiratorytract
tendto
bem
oresevere
thanupper
respiratorytract
infections.L
ikediarrhoeal
diseases,A
RI
isbelieved
tobe
aggravatedby
malnutrition
andspread
more
easilyunder
conditionstypically
associatedw
ithpoverty,
suchas
po
or
hygieneand
crowding
(Kirkw
ood,1991).T
heincidence
of
respiratorydiseases
hasalso
beenlinked
toair
pollution.T
hesurvey
undertakenfor
thisstudy
collectedinform
ationfrom
theprincipal
homem
akeron
respiratoryproblem
sam
ongchildren
undersix
andfor
therespondent
herself.F
or
thechildren,
thequestions
were
designedto
identifyA
Rl,
thoughthe
interviewers
were
nottrained
bym
edicalpersonnel.
For
theprincipal
homem
akers,a
serieso
ftracer
symptom
sw
ereem
ployed,w
hichw
ouldbe
expectedto
identifya
broaderrange
of
respiratoryproblem
s,including
chronicconditions.
As
with
diarrhoea,a
two
week
periodw
asem
ployed,and
theresults
forchildhood
prevalencerefer
tothe
shareo
fhouseholds
with
childrenunder
sixw
hereinat
leastone
casew
asidentified.
8.3.1A
cuteR
espiratoryInfection
among
Children
Under
SixY
earsO
ldO
verall,the
estimated
prevalenceo
fchildhood
AR
Iw
as11.8%
,roughly
comparable
with
thediarrhoea
prevalence.Indeed,
therew
asconsiderable
overlap:in
aboutone
thirdo
fthe
householdsreporting
diarrhoeao
rA
RI,
bothw
erereported.
Children
inp
oo
rhouseholds
or
poorareas
againseem
tobe
more
atrisk,
asindicated
inT
ables8.8
and8.9.
The
differencesare
lessstriking
thanin
thecase
of
diarrhoea,and
vergeon
beingstatistically
insignificant.O
nthe
otherhand,
mortality
differencesare
likelyto
bem
oreappreciable
thanm
orbiditydifferences.
Ta
ble
8.8:R
ela
tion
ship
Be
twe
en
We
alth
an
dC
hild
ho
od
AR
IP
reva
len
ce.
Wealth
Group
Lo
w
Me
diu
m
High
Total
Num
bero
fHouseholds
with
childrenunder6
4606023
543
Tw
oW
eekP
revalenceo
fAR
I(%
)
13.0
5.04.4
11.8
Da
tasource:
Qu
estio
nn
aire
Survey
ofG
AM
A,
1991.

Benneh
etaL.
Ta
ble
8.9:R
ela
tion
ship
between
ResidentialS
ecto
randC
hild
ho
od
AR
IP
revalence.
83
Area
RF
HD
LCS
HD
ISM
DIS
M-LD
MC
SLD
HC
S
Num
ber ofHo
use
ho
lds
with
child
ren
un
de
r6
2927982627022
Tw
oW
eekP
revalenceofA
RI
('Yo)
13.812.512.212.98.64.5
Key:
RF
=Rural
Fringe;
HD
LCS
=High
Density
LowC
lassS
ector;H
DIS
=High
Density
IndigenousS
ector;M
DIS
=Middle
Density
IndigenousS
ector;M
-LDM
CS
=Middle
toLow
Density
Middle
Class
Sector;
LDH
CS
=Low
Density
High
Class
Sector
(includingN
ewly
Developing
Sector).
Data
source:Q
uestionnaireS
urveyofG
AM
A,
1991.
Several
aSSOC
iatIOns
between
childhoodA
RI
prevalenceand
environmental
factorsw
eredescribed
brieflyin
previouschapters.T
able8.10
summ
arisesthe
AR
Iprevalence
inhigh
riskgroups
identifiedthrough
logisticregression.
Most
of
thevariables
previouslym
entionedare
included.Fuel
choiceis
not,how
ever,although
asindicated
inC
hapter7,
fuelchoice
issignificantly
associatedw
ithA
RI
prevalencew
henone-w
ayanalysis
isperform
ed(i.e.
novariables
otherthan
fuelchoice
areincluded).
Once
theother
explanatoryvariables
areincluded,
fuelchoice
doesnot
addsignificantly
tothe
explanatorypow
ero
fthe
equation.H
owever,
most
of
thehouseholds
usem
orethan
onefuel,
anda
largem
ajorityuse
charcoal,m
akingit
inherentlydifficult
todiscern
theinfluence
offuel
choice.M
oreover,tw
oo
fthe
variablesw
hichare
includedm
ayreflect
theeffects
of
airpollution:
whether
achild
isusually
presentduring
cooking,and
whether
cookingalw
aystakes
placeindoors.
Table
8.10:C
hild
ho
od
AR
IS
ymp
tom
Prevalence
inH
ighR
iskH
ou
seh
old
Gro
up
sId
en
tified
thro
ug
hL
og
isticR
egression.E
nviro
nm
en
talF
eatureH
ouseholdsin
Subsam
pleC
hildoften
presentduringcooking
137M
anyflies
inkitchen
161Less
than4
m2/ person
insleeping
room388
Water
supplyinterruptions
(time
ofday)348
Use
mosqU
itocoils
253N
evercook
outdoors258
Roof
leaksduring
rains224
To
tal
527
Tw
oW
eekA
RI
Prevalence
('Yo)
20.4"""18.6"""13.9""14.9"""15.4""13.61
5.2
"'11.8
Note:
Statisticalsignificance
ofdifferencebetw
eenhigh
riskgroup
andrest
ofsample:
C"forp
<.1)
CO"forp<.05)
COO"forp<.01).
Data
Source:
Questionnaire
Survey
ofGA
MA
-1991
Table
8.11sum
marises
thechildhood
AR
Iprevalence
accordingto
thenum
bero
frisk
factorshouseholds
face.A
gain,the
relationshipis
fairlyclear.
Overall,
theprevalence
among
the274
householdsfacing
threeor
fewer
highrisk
conditionsw
as4.4%
,while
thatam
ongthe
253households
facingfour
orm
orew
as19.8%
.

84
Environm
entalProblem
sand
theU
rbanH
ouseholdin
theG
AM
A-G
hana
Ta
ble
8.11:C
hild
ho
od
AR
IS
ymp
tom
Pre
vale
nce
by
Nu
mb
ero
fH
igh
Risk
Co
nd
ition
sH
ou
seh
old
Faces
Num
berofH
ighR
iskC
onditions
One
orfe
we
r
Two
Three
Four
Five
Six
or
mo
re
Num
berofH
ouseholdsw
ithC
hildrenU
nder6
51
106
117
1467433
Two-W
eekP
revalanceo
fAR
I
2.0
6.63.4
14.4
20.342.4
Data
source:Q
uestionnaireS
urveyofG
AM
A,
1991.
The
resultso
fthe
logisticregression
aresum
marised
inT
able8.12.
By
andlarge,
theresults
corroborateprevailing
wisdom
regardingrespiratory
infection.W
hilethere
isconsiderable
uncertaintyin
theodds-ratios
associatedw
ithparticular
variables,overall
theresults
indicatethat
environmental
factorsare
associatedw
ithappreciable
differencesin
AR
Im
orbidity.T
hestrong
associationbetw
eenA
RI
andchildren
beingpresent
duringcooking
shouldbe
interpretedw
ithcare.
Children
presentduring
cookingm
aybe
exposedto
hazardsother
thansm
oke.A
lso,w
omen
who
arem
oreoften
with
theirchildren
arem
orelikely
tobe
aware
of
theirhealth
problems.
The
prevalenceo
fdiarrhoea
(without
respiratoryproblem
symptom
s)is
alsohigher
among
householdsw
herechildren
arepresentduring
cooking,though
thisis
unlikelyto
berelated
tosm
okeexposure.
Thus,the
relationshipbetw
eenA
RI
andthe
presenceo
fchildren
duringcooking
shouldnot
betaken
asa
definitiveindication
of
thehazards
of
smoke.
On
theother
hand,outdoor
cookingis
alsostatistically
significant,and
theresults
dosuggest
thatthe
riskso
fsm
okeexposure
shouldbe
takenseriously.
Fliesin
thekitchen
andw
aterinterruptions
areboth
likelyto
indicatepoor
hygiene.W
hilem
oretypically
associatedw
ithdiarrhoeal
diseases,poor
hygieneis
alsoim
plicatedin
respiratoryinfection.
Inthis
context,it
isw
orthnoting
thatboth
of
thesevariables
remain
significanteven
ifcases
where
diarrhoeaw
asalso'
reportedare
excluded.C
rowding,
anotheroften
citedrisk
factorin
respiratoryinfection,
isalso
represented.H
avinga
leakyroof
may
reflectdam
pconditions,
which
canfacilitate
thespread
of
respiratoryinfections,
butcould
alsobe
takento
indicategenerally
lowquality
housing.T
heuse
of
mosquito
coilsis
nota
well
known
riskfactor
inA
RI,butdoes
ofcourse
contributeto
airpollution.

Benneh
etal.
Table
8.12:S
um
ma
ryR
esultso
fLo
gistic
Regression
Relating
Ch
ildre
n's
AR
IP
revalencew
ithE
nviro
nm
en
talF
actorsin
Household
with
Ch
ildre
nU
nderS
ix.
85
Variable
Co
efficie
nt
Standard
Erro
rS
ign
ifican
ceO
dd
sR
atio
Child
oftenp
rese
ntd
urin
gcooking
0.960.29
.0012.62
Ma
ny
fliesin
kitchen0.87
0.33.008
2.39L
ess
than4
m2/
pe
rson
insleeping
room0.83
0.42.049
2.29W
ate
rsupplyinterruptions
0.770.38
.0402.16
Use
mosquito
coils
0.600.30
.0481.83
Ne
ver
coo
ko
utd
oo
rs0.60
0.30.0
44
1.82R
oo
fleaks
duringrains
0.530.30
.0791.69
Note:
Other
variablesincluded
inlogistic
regressionw
ereeducation
levelof
principalhom
emaker,
wealth
qUintile,and
number
ofchildren
undersix.
Only
thenum
berof
childrenunder
sixw
asstatistically
significant atthe90%
confidencelevel.
Environm
entalvariablesw
hichw
erenotincluded
dueto
alack
ofstatistical
significancew
ere:use
ofcooking
hut,use
ofpum
p-sprayinsecticide,
principalcooking
fuel,observed
evidenceofdam
pnessand
selectedw
aterand
sanitationvariables.
Data
Source:
Questionnaire
Survey
ofGA
MA
,1991.
8.3.2R
espiratoryP
roblemSym
ptoms
among
PrincipalH
omem
akersA
full19.5%
of
the(956)
female
principalhom
emakers
reportedat
leastone
respiratoryproblem
symptom
,them
ostcomm
onbeing
drycoughs
(9.3%)
andsore
throats(8.8%
).A
sindicated
inT
ables8.13
and8.14,
theprevalence
of
respiratoryproblem
symptom
s(R
PS
)and
wealth
or
zoneo
fthe
cityare
somew
hatam
biguous.T
hehighest
prevalencesare
inthe
medium
wealth
groupand
them
iddleclass
zone.T
hisis
largelythe
resulto
fa
veryhigh
prevalencein
oneneighbourhood
within
them
iddleclass
zone,w
here13
of
the15
principalhom
emakers
interviewed
reportedat
leastone
respiratorysym
ptom.
Such
anextrem
eresult
isalm
ostcertainly
theresult
of
asingle
cause,and
shouldnot
betaken
asrepresentative.
The
neighbourhoodhas
beenexcluded
inthe
analysisw
hichfollow
s.A
lso,how
ever,the
riskfactors
forrespiratory
problemsym
ptoms
inprincipal
homem
akersare
notas
wealth-dependent
asthose
forchildhood
diarrhoeaand
AR
I.
Table
8.13:R
ela
tion
ship
Betw
eenW
ealthand
Principal
Hom
emaker
RP
SP
revalence.
Wealth
Gro
up
LowM
ediumH
igh
Total
Num
bero
fHo
use
ho
lds
with
female
PH
7811255
0
956
Tw
oW
eekP
revalenceo
fR
PS
('Yo)
18.228.816.0
19.5
Data
source:Q
uestionnaireS
urveyofG
AM
A,
1991.

86
Environm
entalP
roblems
andthe
Urban
Household
inthe
GA
MA
-Ghana
Table
8.14:R
ela
tion
ship
between
ResidentialS
ectorand
PrincipalH
omem
akerR
PS
Prevalence.
Area
RF
HD
LCS
HD
ISM
DIS
M-LD
MC
SLD
HC
S
Num
bero
fHo
use
ho
lds
with
Fem
aleP
H
4943716210815545
Tw
oW
eekP
revalenceo
fRP
S(%
)
14.318.514.816.731.615.6
Key:
RF
=Rural
Fringe;
HD
LCS
=High
Density
LowC
lassS
ector;H
DIS
=High
Density
IndigenousS
ector;M
DIS
=Middle
Density
IndigenousS
ector;M
-LDM
CS
=Middle
toLow
Density
Middle
Class
Sector;
LDH
CS
=Low
Density
High
Class
Sector
(includingN
ewly
Developing
Sector)
Data
source:Q
uestionnaireS
urveyofG
AM
A,
1991.
The
RPS
prevalenceam
ongprincipal
homem
akersin
highrisk
groupsidentified
throughlogistic
regressionis
presentedin
Table
8.15.A
gain,several
ofthe
variableshave
alreadybeen
mentioned
inprevious
sections,includingthe
useo
fpum
pspray
insecticides,w
hichis
associatedw
itha
surprisinglyhigh
prevalence.S
moking
isincluded
forobvious
reasons.It
istreated
hereas
adichotom
ousvariable
(eitherone
smokes
orone
doesnot),
althoughin
theregression
thenum
bero
fcigarettes
smoked
was
employed.
Generally,
smoking
among
females
isnotonly
relativelyrare,butthe
numbers
ofcigarettes
smoked
islow
:about
halfthesm
okersconsum
efive
orless
cigarettesa
day.T
heoverall
prevalencenoted
inT
able8.15
issom
ewhat
lower
thanthe
19.5%cited
abovedue
tothe
exclusiono
fthe
excessivelyhigh
prevalenceneighbourhood.
Table
8.15:F
emale
Principal
Hom
emakers'R
espiratoryP
roblemS
ymptom
Prevalence
inH
ighR
iskH
ouseholdG
rou
ps
Ide
ntifie
dth
rou
gh
Lo
gistic
Regression.
En
viron
me
nta
lFeature
Ho
use
ho
lds
inT
wo
Week
Subsam
pleR
PS
Prevalence
(%)
Sm
okescigarettes
3534.3**
Uses
pump-spray
insecticide101
39
.6"*
Water
Supply
Interruptions(lim
eofday)
61719.8
NeverC
ookO
utdoors482
21.2**R
oofLeaks
During
Rains
37421.7**
To
tal
93918.3
Note:
Statistical
significanceof
differencebetw
eenhigh
riskgroup
andrest
ofsam
ple:(*
forp
<.1)
(**for
p<.05)(***
forp<.01).
Note:
Households
with
missing
valuesfor
anyvariable,
or
without
female
principalhom
emakers,
are
excluded.D
ataS
ource:Q
uestionnaireS
urveyofG
AM
A,
1991.
As
indicatedin
Table
8.16,the
prevalencein
those(79)
householdsnot
inany
of
therisk
categoriesidentified
isonly
7.6%,
risingto
31.5%in
the(178)
householdsin
threeor
more
riskcategories
(only16
householdsw
erein
more
thanthree
categories).

Benneh
etal.87
Table
8.16:F
emale
RP
SP
revalenceb
yN
umbero
fHigh
Risk
Co
nd
ition
sH
ouseholdF
aces.
Nu
mb
ero
fHig
hR
iskC
on
ditio
ns
Size
ofS
Ubsam
pleT
wo-W
eekR
PS
Prevalence
(%)
None
One
Tw
oT
hreeor
more
79307
375178
7.611.719.731.5
Data
source:Q
uestionnaireS
urveyofG
AM
A,
1991
Table
8.17sum
marises
theresults
of
thelogistic
regression.T
heonly
higWy
significantvariable
(p<
.01)relates
tothe
useo
fpum
p-sprayinsecticides
(aerosolinsecticides
arenot
includedin
thiscategory).
This
fmding
clearlydeserves
furtherinvestigation.
Breathing
inthe
insecticidecould
bethe
causeo
frespiratory
'problemsym
ptoms,
andthe
useo
fpum
p-sprayinsecticides
would
notappear
tobe
restrictedto
anyparticular
parto
fthe
city,o
rassociated
with
otherknow
nrisk
factorsnotincluded
inthe
regression.Itw
ouldbe
premature
toassum
ethat
theuse
of
spraypesticides
isa
major
healthrisk.
But
acareful
assessment
of
theinsecticides
beingused,
them
ethodso
fapplication,
andthe
healthproblem
susers
faceis
clearlyw
arranted.S
houldpum
p-sprayinsecticides
bea
problem,
thereare
anum
bero
fmeasures
which
couldbe
taken.
Use
pu
mp
·spra
yinsecticide
Wa
ter
Interruptionsco
mm
on
atcertaintim
esof
da
y0.46
0.20.019
1.58R
oo
fleaks
duringrains
0.420.18
.0231.52
Ne
ver
cookin
opena
ir0.36
0.18.050
1.43C
iga
relle
ssm
oke
dp
er
da
y0.10
0.05.025
1.11
Table
8.17:S
um
ma
ryR
esultso
fL
og
isticR
egressionR
elatingP
HR
PS
Prevalence
with
En
viron
me
nta
lF
actors.-v-ar-ia-b-'-e--==..:...::.:.:='-'C:.;o:.;e:..:.ff:..:.ic::,:i.:;en:..:.;t=---_
_I....;s:.;t:=a:..:.;nd::a:.:.r.:.d.=E:.:.;rr:..:o:..:..r---Jl....-....::S:..:.i...gn:..:.;i""'fi.:;ca:.:n.:.,:c:..:e'--_
_.=O:..:d:..:d:=s....:.R.:,:a:..:.:ti:=o_
1.250.24
<.0013.49
Note:
Other
variablesincluded
inlogistic
regressionw
ereage
ofprincipal
homem
akerand
wealth
qUintile,
thoughneither
were
statisticallysignificant.
Environm
entalvariablesw
hichw
erenot
includeddue
toa
lackof
statisticalsignificance
were:
crOW
ding,use
ofcooking
hut,principal
cookingfuel,
observedevidence
ofdam
pnessand
selectedw
aterand
sanitationvariables.

88E
nvironmentalP
roblems
andthe
Urban
Household
inthe
GA
MA
-Ghana
Water
interruptions,leaky
roofsand
nevercooking
out-of-doorsare
allvariables
which
arosein
theanalysis
of
children'sA
RI.
RougW
y,they
canbe
takento
reflectpoor
sanitation,dam
pconditions,
andsm
okeexposure
respectively.In
interpretingthe
resultsfor
cigarettesm
oking,it
isim
portantto
bearin
mind
that,given
thesm
allnum
bero
frelatively
moderate
smokers,
onew
ouldnot
expecta
highstatistical
significance.F
urthermore
theodds
ratioapplies
tosm
okingone
additionalcigarette:
theequivalent
oddsratio
forsm
okingten
cigarettesw
ouldbe
closeto
three.

Benneh
etal.89
Bo
x8.1:
Ho
useh
old
En
viron
men
talC
on
ditio
ns
and
Health
N=34
0·12·3
4-56·7
nu
mb
ero
fhig
hrisk
con
ditio
ns
Fig
ure
8.1:Ch
ildh
oo
dd
iarrh
oe
ap
reva
len
ceb
yn
um
be
rofh
igh
riskco
nd
ition
s
The
figuresin
thisbox
graphicallyillustrate
theim
portanceo
fenvironm
entalriskfactors
toG
AM
Adw
ellers.
Diarrhoea
andrespiratory
infection
aretw
oo
fthem
ajorhealth
problems
inG
AM
A,and
areespe
ciallycriticalam
ongyoung
childrenand
infants.F
igures8.1
and8.2
arebased
onthose
householdsw
ithchildren
undersix,andillustrate
theclose
association
between
theprevalence
of
thesehealth
problems
inthe
pasttwo
weeks
among
childrenunder
six,and
thenum
bero
fenvironm
entalrisk
factorshouseholds
face.F
or
diarrhoea,the
conditionsidentified
(throughstatisticalanaly
sis)are
dominated
byw
ater,sanitation
andhygiene
problems,
which
aresuspected
riskfactors,
andare
clearlyassociated
with
poverty.H
owever,
while
thefactors
identified
arenot
surprising,the
differences
indiarrhoea
prevalenceare
striking.T
heconditions
associatedw
ithsym
ptoms
of
acuterespiratory
infection
among
small
childrenare
alsoall
susp
ectedrisk
factors.
Along
with
crowding,
andindica
torso
fpoorhygiene,thereare
several
factorsrelated
toexposure
toairpollution,including
smoke
fromm
osquitocoils.
Again,m
ostofthese
conditionsare
povertyrelated.
Respiratory
problemsym
ptoms
inw
omen
areshow
nto
berelated
with
aless
wealth-dependentseto
frisk
factors,see
Figure
8.3.S
mok
ingcigarettes
andusing
pump
sprayinsecticides,tw
oo
fthem
ostsignificantfactors,are
actuallym
orecom
m
onam
ongw
ealthierhouseholds.
>6
N=33
N=223
2t0
34
t05
number
ofh
igh
riskconditions
Oto
1
N=51
oL-~~J---+-
~60
fl50
c:Ql
~4
0eD
o30
~~2
0~c..
10
70
Fig
ure
8.2:Ch
ildh
oo
da
ccute
resp
irato
ryin
fectio
np
reva
len
ceb
yn
um
be
rofh
igh
riskco
nd
ition
s
N=
subsample
size
Listo
fhig
hrisk
con
ditio
ns
-childoften
presentduringcooking
-presence
of many
fliesin
kitchenattim
eofinterview
•less
than4
m'/person
insleeping
room•
experiencingw
aterInterruptionsatcertain
times
ofday-
useofm
osquitocoils
-nevercooking
outdoors•
leakingroofduring
rains
_6
0~Q
l
g50
..~e4
0D
oIII..o
30
'EIII
'S2
0
!10o
-l-----+
__
N=
69
70
N=subsam
plesize
Listo
fhig
hrisk
con
ditio
ns
-sharing
toilet with
>5otherhouseholds
-using
potforstoringw
ater-storing
water in
anopen
container•outdoordefecation
byneighbourhood
children•presence
ofmany
filesin
kitchenattim
eofinterview
-notwashing
handsbefore
preparingm
eals-experiencing
waterinterruptions
atcertaintim
esofday
-buyingprepared
foodsfrom
vendors
Data
source:Questionnaire
surveyo
fAccra,
1991.

90
Environm
entalProblem
sand
theU
rbanH
ouseholdin
theG
AM
A-G
hana
Box
8.1co
nt'd
70160
1~
I~
IG
l50
+uCG
l
J4
0l!!c.1Il
30
Q.
It:
!2
010oo
12
number
ofh
igh
riskco
nd
ition
s.
N=
178
>3
Figure
8.3:Fem
alere
spira
tory
pro
ble
msym
tom
sprevalence
by
nu
mb
ero
fhig
hrisk
con
ditio
ns
N=
subsample
size
Listo
fh
igh
riskco
nd
ition
s-
smo
kes
ciga
rette
s-
use
sp
um
p-sp
ray
inse
cticide
-e
xpe
rien
cing
wa
ter
inte
rrup
tion
sa
tce
rtain
time
s01
da
y-
ne
verco
okin
go
utd
oo
rs-le
akin
gro
old
urin
grains

Benneh
etal.
CH
AP
TE
RN
INE
91
9T
HE
EC
ON
OM
ICS
OF
HO
US
EH
OL
DE
NV
IRO
NM
EN
TA
LM
AN
AG
EM
EN
T9.11ntroductionT
hew
ayenvironm
entassets
arem
anagedhas
important
consequencesfor
theeconom
y,and
more
generallyhum
anw
elfare.E
quallyim
portant,econom
icconstraints
andincentives
helpdeterm
inehow
theenvironm
entis
managed.
This
holdsfor
boththe
largescale
problems
likeoutdoor
airpollution
andthe
more
localisedproblem
saffecting
urbandw
ellersin
ornear
therrhom
es,w
ithw
hichthis
studyis
primarily
concerned.It
hasbeen
demonstrated
thatnot
onlyare
many
of
theenvironm
entalconditions
verypoor,
butthe
healthrisks
aresubstantial.
This
chapterfocuses
onthe
concernso
ftheprincipal
homem
akers,and
inparticular
thevalue
theyplace
onenvironm
entalim
provement.
Ideally,such
concernsshould
providea
drivingforce
forenvironm
entalim
provement.
Unfortunately,
deficientinform
ation,structural
obstaclesand
inadequatepolicies
oftenprevent
suchconcerns
frombeing
formulated
appropriatelyor
actedupon,
eitherby
thehouseholds
ortheir
government.
Environm
entalrisks
andprocesses
canbe
difficultto
understand.A
sdem
onstratedin
thepreceding
chapter,the
healthim
plicationsof
environmental
degradationare
extremely
complex.
Households
may
practicepoor
hygieneor
governments
may
takeinappropriate
actionsbecause
theyare
poorlyinform
ed.It
ishoped
thatsom
eo
fthe
information
gatheredin
thecourse
of
thisstudy
will
providefor
betterdecisions.
How
ever,households
havean
intimate
knowledge
oftheir
surroundingsw
hichno
studycan
hopeto
capture.M
oreover,their
opinionsand
preferencesm
atter,even
ifthey
arenot
always
well
informed.
Even
inareas
where
householdsdo
notparticipatedirectly
indecision-m
aking,it
isim
portantnot
torely
on"expert"
judgementalone,butto
considerthe
prioritiesand
valuationso
fthose
most
affected.F
orsom
eeconom
icgoods,
people'spreferences
arerelatively
easyto
ascertain.If
someone
buysfood
for400
cedis,it
seems
reasonableto
assume
thatthey
areplacing
avalue
of
atleast
400cedis
onthat
food.O
nem
ayquestion
whether
400cedis
isw
orththe
same
todifferent
people,but
byand
largepeople
canbe
saidto
berevealing
theirow
npreferences
throughtheir
purchases.F
orenvironm
entalam
enities,the
situationis
typicallym
orecom
plicated.M
ostenvironm
entalam
enitieshave
publicbenefits,and
hencecan
bedifficult
tosell
evenw
henthe
benefitsoutw
eighcosts.
Itis
notpossible,
forexam
ple,to
provideindividuals
with
cleanerstreets
inproportion
totheir
voluntarypaym
ents.O
ncethe
streetis
clean,it
isclean
foreveryone
who
usesit.
Ifstreet
sweeping
were
putup
forsale,
therew
ouldbe
astrong
incentiveto
free-ride,and
hopeothers
paythe
costs.M
uchthe
same
appliesto
safew
astedisposal,
drainage,clean
outdoorair
andenvironm
entalinsect
control.O
neresult
isthat
many
environmental
amenities
arenot
soldin
theprivate
sector:their
provisionis
often,at
leastin
part,the
government's
responsibility.E
venenvironm
entalservices
which
aresold,
suchas
pipedw
ater,sanitation
andhousehold
waste
collection,have
publicbenefits.
For
thesequasi-public
goods,m
arketprices
may
exist,but
areunlikely
toreflect
thepublic
benefitso
fbettersanitation,w
astedisposal
andhealth.
As
partofthe
householdsurvey
undertaken,a
serieso
fquestionw
ereasked
inorder
toprovide
anindication
of
howm
uchpeople
valueenvironm
entalam
enities.

92
Environm
entalP
roblems
andthe
Urban
Household
inthe
GA
MA
-Ghana
There
areseveral
possibleapproaches
which
canbe
employed
forsuch
purposes.O
necan
attempt
toim
putevalues
fromthe
expensespeople
incurprotecting
themselves.
Rents
may
behigher
inareas
with
betterenvironm
entalquality,
andin
some
circumstances
itmay
bepossible
touse
rentdifferentialsto
estimate
thevalue
peopleplace
onenvironm
entalam
enities.People
may
boiltheir
water
beforedrinking,
andcost
incurredcould
betaken
toreflect,
roughly,the
valuethey
placeon
cleanerw
ater.U
nfortunately,the
scopefor
suchestim
atesis
verylim
ited,and
would
notprovide
comparable
resultsfor
differentenvironmentalam
enities.T
heapproach
employed
forthis
studyis
more
direct:the
principalhom
emakers
were
askeddirectly
what
theyw
ouldbe
willing
topay
forparticular
environmental
improvem
entsif
theyw
erefor
sale.T
histechnique
iscalled
contingentvaluation,
aspeople
areasked
toprovide
valuescontingent
ontheir
beinga
market
forthe
benefitsin
question.T
hetechnique
hasbeen
appliedextensively
inrecent
years,and
thereis
agrow
ingbody
ofliterature
onits
strengthsand
weaknesses
(seeM
itchelland
Carson,
1989).A
number
ofstudies
haveundertaken
contingentvaluation
ofw
aterand
sanitationtechnologies
indeveloping
countries(e.g.W
hittingtonet
al.,1990;
Altafetal.,
1992).The
purposehere,
however,
isnot
toevaluate
anyparticular
technologies,but
toascertain
howm
uchvalue
peopleattach
toenvironm
entalim
provements.
The
improvem
entsevaluated
cover:w
aterquality,
water
availability,solid
waste,
outdoorair,
indoorair,
andinsects.
Inorder
toprovide
abasis
forcom
parison,theim
provements
were
takento
berelatively
comprehensive,
andincluded
theelim
inationo
fhealth
risksw
henrelevant.
Sanitationim
provement
was
notincluded
dueto
difficultiesform
ulatingappropriate
questions(i.e.
notbecause
sanitationw
asconsidered
lessim
portant).R
atherthan
askingrespondents
open-endedquestions,
estimates
were
elicitedthrough
biddinggam
es.A
monthly
payment
of400
cedisw
asproposed.
Ifthe
respondentsw
ere"w
illingto
pay",the
bidw
asincreased.
Ifnot,
itw
asreduced.
This
processw
asrepeated
upto
fivetim
es,after
which
therespondent
was
askedto
estimate
them
aximum
theyw
erew
illingto
pay.R
espondentsnot
interestedin
theim
provementin
question,orunw
illingto
payanything,w
ereasked
why.
The
estimates
arisingfrom
thecontingent
valuationare
onlyintended
asa
roughguide
tohousehold
priorities.T
heyare
toouncertain
toprovide
asound
basisfor
cost-benefitanalysis
orthe
pricingof
environmental
services.H
ouseholdscannot
beexpected
tohave
aprecise
ideaof
what
anenvironm
entalim
provement
would
bew
orthto
them,
orto
beoverly
concernedw
iththe
accuracyo
ftheir
responses.Som
em
ayeven
beinclined
tooverestim
atein
thehope
ofprom
otingthe
improvem
ent,w
hileothers
may
underestimate
inthe
hopeof
avoidingfees.
Moreover,
differentm
embers
of
thehousehold
may
haveopposing
priorities.T
herespondents
were
theprincipal
homem
akers(96%
wom
en),w
hoare
likelyto
berelatively
knowledgeable
abouthousehold
conditions,but
may
nothave
comm
ensurateinfluence
overthe
householdbudget.
Inshort,
theestim
atesprovide
afirst
approximation
of
howthe
principalhom
emakers
valueenvironm
entalim
provement,
ratherthan
anaccurate
predictiono
fhow
much
householdsw
ouldactually
bew
illingto
allocateto
theim
provements
inquestion.
Econom
ics,as
well
ascom
mon
sense,suggests
thatw
ealthierhouseholds
arelikely
toplace
ahigher
monetary
valueon
environmental
amenities.
To
theextent
thatenvironm
entalam
enitiescan
alreadybe
purchased,this
isalready
reflectedin
thesuperior
environmental
conditionsin
wealthy
homes.
For
publicbenefits,
averagingvaluations
acrosshouseholds
will
tendto
placem
orew
eighton
the

Benneh
etal.93
prIOrItIes
of
thew
ealthy.T
hism
irrorsthe
realityof
goodsprovided
throughcom
petitivem
arkets.It
doesnot
necessarilyreflect
thepriorities
thegovernm
entw
ouldlike
torespond
to,how
ever.F
orthis
andother
reasons,in
most
of
thefollow
inganalysis
householdsare
stratifiedinto
low,
medium
andhigh
wealth
groups.In
additionto
havingopinions
aboutthe
valueo
fim
provement,
peoplehave
opinionsaboutw
ho,ifanyone,
needsto
act.C
rudely,one
canthink
ofthreelevels:
householdaction,
neighbourhoodaction
andgovernm
entaction.
Econom
ictheory
suggeststhat
theappropriate
levelof
actionis
relatedto
theextent
tow
hichthe
improvem
entsprovide
publicbenefits.
Reducing
indoorair
pollutionbenefits
principallythe
pollutinghousehold,
anddoes
notraise
theproblem
offree-riding.
Many
ofthe
benefitso
fbetter
solidw
astecollection
accrueto
thew
holeneighbourhood.
Reducing
outdoorair
pollutionsim
ultaneouslybenefits
aw
iderange
of
householdsliving
indifferent
partsof
thecity.
From
apublic-goods
perspective,this
suggests,again
verycrudely,
thatw
hilehousehold
actionm
aybe
adequatefor
indoorair
improvem
ents,neighbourhood
actionand
city-wide
actionare
more
likelyto
beappropriate
forsolid
\yasteand
outdoorair.
There
areother
relevantconsiderations,
however,
many
ofw
hichare
beyondthe
purviewof
economics,
narrowly
defined(e.g.
moral
responsibilitiesand
thecom
petenciesof
theinstitutions
involved).A
sin
thecase
ofvaluing
environmental
improvem
ent,household
perceptionsm
atter,not
onlybecause
theyinfluence
theoutcom
e,but
alsobecause
theyreflectopinions
which
shouldbe
takenseriously.
The
following
sectionsaddress
thefollow
ingissues
inturn:
1.In
which
areasdid
respondentsfeel
actionw
asneeded
andby
whom
?;2.
Inw
hichareas
were
respondentsw
illingto
payfor
improvem
ents,and
ifnot,
why
not?;3.
How
much
were
respondentsw
illingto
payfor
theseim
provements?
9.2W
hereis
actionneeded
byw
hom?
Inall
of
theproblem
areascovered,
more
thanthree
outof
fourhouseholds
perceiveda
needfor
action.A
sindicated
inT
able9.1,
however,
therew
eredifferences
among
theproblem
areas,not
onlyregarding
whether
actionw
asnecessary,buteven
more
asto
who
needsto
act.
Ta
ble
:9
.1:
Op
inio
ns
on
Wh
oN
ee
ds
toA
ct
by
En
viron
me
nta
lP
rob
lem
Are
a-
All
Ho
use
ho
lds.
Problem
No
Ind
ividu
al
Neighbourhood
Go
v'tN
oN
umbero
f
Area
Actio
nO
pinionH
ouseholds
(%)
(%)
(%)
(%)
(%)
#
Water
134
378
21000
Outdoor
Air
202
1656
61000
IndoorA
ir24
562
153
1000
Insects7
2721
441
1000
Garbage
116
2161
11000
Sanitation
913
3442
21000
Data
source:Q
uestionnaireS
urveyofG
AM
A,
1991.

94
Environm
entalP
roblems
andthe
Urban
Household
inthe
GA
MA
-Ghana
Inthe
two
areasw
herethe
largestshare
of
respondentsfelt
actionw
asnecessary,
insectsand
sanitation,there
was
alsothe
most
disagreement
overw
hoshould
takeaction.
Inboth
cases,the
largestshare
favouredgovernm
entaction,
butm
orethan
halfo
fthe
respondentsidentified
eitherindividuals
or
neighbourhoodsfor
insectcontrol,
andm
orethan
athird
feltthat
neighbourhoodsshould
takeaction
toim
provesanitation.
The
responsibilityfor
providingand
maintaining
sanitationfacilities
doesvary
considerably,w
ithneighbourhood
groupsoften
playingan
important
rolein
managing
comm
unaltoilets.
One
might
expectthat
householdsusing
comm
unaltoilets
opento
theneighbourhood
would
bethe
most
inclinedto
Identifythe
neighbourhoodas
theappropriate
locusfor
action.A
ctually,alm
osthalf
(49%)
of
these(389)
householdsreferred
togovernm
entaction;
theshare
referringto
neighbourhoodaction
(36%)
was
littledifferent
fromother
households.W
ithinthis
group,how
ever,there
was
asignificant
divergenceo
fopinion
between
thosew
ithcom
munal
KV
IPlatrines
andthose
stillusing
unimproved
pitlatrines.
The
(70)households
with
KV
IPlatrines
referredto
neighbourhoodaction
abouttw
iceas
oftenas
government
action,w
hilethe
reversew
astrue
of
the(243)
householdsw
ithunim
provedpit
latrines.It
would
seemthat
thosehouseholds
with
unimproved
pitlatrines
believeit
isup
tothe
government
toprovide
bettersanitation
facilities,and
quitepossibly
feelthey
havem
issedout
onrecent
improvem
entprogramm
es.Indoor
andoutdoor
airpollution
attractedthe
largestshares
of
respondentsfeeling
noaction
was
necessary,reflecting
arelatively
lowlevel
of
concern.T
hosew
hodid
want
some
actionw
erelikely
torefer
tothe
government
with
respectto
outdoorair
andindividuals
with
respecttoindoor
air.F
orindoor
air,there
were
noappreciable
differencesbetw
eenhouseholds
usingdifferent
cookingfuels
or
cookingin
differentlocations.
For
outdoorair,
residentso
fT
ema
were
substantiallym
orelikely
toperceive
aneed
foraction
(only6%
feltthere
~as
noneed
foraction),
presumably
becauseo
fconcern
aboutindustrial
emissions.
InG
a,on
theother
hand,w
heresolid
waste
burningis
comm
on,a
largershare
of
respondents(36%
)favoured
neighbourhoodaction.
Water
andgarbage
problems
hadthe
largestshares
of
respondentsreferring
togovernm
entaction,
thoughabout
onein
fivehouseholds
identifiedthe
neighbourhoodas
them
ostim
portantlevel
fordealing
with
garbageproblem
s.A
mong
vendorusers,
afull
97%w
antedaction
onw
aterproblem
s,though
unlikeother
groupsa
significantshare
of
vendorusers
(l0%)
referredto
neighbourhoodaction,perhaps
with
aview
towards
curbingvendor
profits.T
ables9.2
to9.4
summ
arisethe
responsesfor
householdsin
differentw
ealthgroups.
Generally,the
differencesare
notvery
substantial.H
owever,
inallproblem
areas,the
ratioo
fhouseholds
favouringgovernm
entaction
tohouseholds
favouringneighbourhood
actionis
highestam
ongw
ealthyhouseholds.
This
resumably
reflectsthe
factthatneighbourhood
actionis
consideredinappropriate
inw
ealthyareas,
andexpected
torem
ainso.
More
generally,m
osto
fthe
difficultiescan
beexplained
interm
so
ftheconditions
householdsatthe
differentw
ealthlevels
face.

Benneh
etal.
Ta
ble
:9
.2:
Op
inio
ns
on
Wh
oN
ee
ds
toA
ct
by
En
viron
me
nta
lP
rob
lem
Are
a-
Lo
w-W
ea
lthH
ou
seh
old
s.
95
Pro
ble
mN
oIn
divid
ua
lN
eighbourhoodG
ov't
No
Num
ber of
Area
Actio
nO
pinionH
ouseholds
(%)
(%)
(%)
(%)
(%)
#
Water
144
377
2818
Outdoor
Air
202
1755
6818
IndoorA
ir23
583
133
818Insects
727
2044
2818
Garbage
105
2064
1818
Sanitation
712
3544
2818
Data
source:Q
uestionnaireS
urveyofG
AM
A,
1991.
Ta
ble
:9.3:
Op
inio
ns
on
Wh
oN
ee
ds
toA
ct
by
En
viron
me
nta
lP
rob
lem
Are
a-
Me
diu
mW
ea
lthH
ou
seh
old
s.
Pro
ble
mN
oIndividual
Neighbourhood
Gov't
No
Num
bero
fA
reaA
ction
Opinion
Households
(%)
(%)
(%)
(%)
(%)
#
OutdoorA
ir23
115
565
131
IndoorA
ir30
510
181
131
Insects5
2926
391
131
Garbage
1610
2647
1131
Water
115
281
1131
Sanitation
1524
2634
1131
Data
source:Q
uestionnaireS
urveyofG
AM
A,
1991.
Ta
ble
:9.4:
Op
inio
ns
on
Wh
oN
ee
ds
toA
ct
by
En
viron
me
nta
lP
rob
lem
Are
a-
Hig
h-W
ea
lthH
ou
seh
old
s.
Problem
No
IndividualN
eighbourhoodG
ov'tN
oN
umbero
f
Area
Actio
nO
pinionH
ouseholds
(%)
(%)
(%)
(%)
(%)
#
Water
152
077
651
Outdoor
Air
196
665
451
IndoorA
ir28
430
290
51Insects
1025
2045
051
Garbage
238
1257
051
Sanitation
2810
2537
051
Data
source:Q
uestionnaireS
urveyofG
AM
A,
1991.
9.3W
illingnessa
nd
Ability
ToP
ayT
heim
provements
respondentsw
ereasked
toevaluate
included,briefly:w
atero
fa
qualityperfectly
safeto
drink(sam
esource
asat
present);w
ateravailable
inthe
home
without
interruption;outdoor
airclean
enoughto
poseno
healthrisk;
similarly
cleanindoor
air,elim
inationo
finsect
bornedisease;
comprehensive
solidw
astecollection
with
safedisposal.
Insom
ecases,
distinctionsw
erealso
made
in

96
Environm
entalP
roblems
andthe
Urban
Household
inthe
GA
MA
-Ghana
thescale
of
theim
provement
(e.g.just
forthe
household,for
thew
holeneighbourhood,
or
forthe
whoie
city).B
yand
large,how
ever,the
responsesw
eresim
ilarregardless
of
scale,so
onlythe
resultsfor
them
oreextensive
improvem
entsare
presentedhere.
Despite
thecom
prehensivenature
of
theim
provements,
some
respondentssaid
theyw
ereuninterested
inthe
improvem
entscited.
Am
ongthose
interested,som
ew
ereunw
illingto
payanything.
Table
9.5provides
abreakdow
no
fhouseholds
ineach
wealth
group,according
tow
hetherthey
were
willing
topay
anythingfor
theim
provements
andif
notw
hynot.
Overall,
fewer
householdsw
erew
illingto
paythan
advocatedaction.
Indeed,som
ehouseholds
who
advocatedaction
claimed
thatthe
situationw
asalready
adequatew
henasked
inthe
contexto
fm
akingpaym
ents.O
nthe
otherhand,
thedifferences
acrossthe
problemareas
aresim
ilar.Insects
standout
asthe
problemthe
largestshare
was
willing
topay
toim
proveupon,
while
bothindoor
andoutdoor
airattracted
onlyslightly
more
thanhalf
of
therespondents.
Also,
insectsw
asthe
onlyproblem
areaw
herealm
osthalf
of
thoseunw
illingto
paysaid
thatthey
couldnot
affordany
payment.
Inall
otherareas,
byfar
them
ostcom
mon
reasonfor
beingunw
illingto
payw
asthat
qualityw
asalready
sufficient.O
nlyfor
outdoorair
dida
significantshare
(13%)
of
therespondents
claimthat
theyw
ouldbe
unwilling
topay
becauseit
was
nottheir
responsibility.
Ta
ble
9.5:R
easonsfo
rU
n-W
illing
ne
ssto
Pay
for
Imp
rove
me
nts
by
Imp
rove
me
nt
Ca
teg
ory.W
ate
rW
ate
rO
utd
oo
rIn
do
or
Inse
ctsG
arb
ag
eQ
ua
lityQ
ua
ntity
Air
Air
Willing
toP
ay
for
Improvem
ent(%)
7273
5157
8775
Quality
already
sufficient(%)
1514
2331
514
Any
payment
is
toocostly(%
)8
912
106
5
Not
household'sR
esponsibility(%)
33
132
3
Unw
illingfo
r
Other
Reason(%
)2
22
TO
TA
L%
100100
100100
100100
(N)
10001000
10001000
10001000
Data
source:Q
uestionnaireS
urveyofG
AM
A,
1991.
Th
eshare
of
householdsw
illingto
payfor
improvem
entsdoes
notshow
aclear
associationw
ithw
ealth.A
sindicated
inT
able9.6,
theshare
willing
topay
declinesw
ithincreasing
wealth
forindoor
airand,
thoughless
significantly,for
garbagecollection.
Fo
rall
theother
areasthe
lowest
shareis
inthe
middle
wealth

Benneh
etal.97
group,w
iththe
highestshare
inm
ostcases
beingin
thehighest
wealth
group.T
hisis
perhapsnot
allthat
surprising.It
isquite
possiblethat
with
fewer
aspirationsthan
thew
ealthy,and
betterconditions
thanthe
poor,m
iddlew
ealthhouseholds
arethe
most
likelyto
besatisfied
with,
forexam
ple,the
existingw
atersupply.
What
ism
orestriking
thanthe
wealth-related
differencesis
thatam
ongall
thegroups
thehighest
sharew
asw
illingto
payto
alleviateinsect
problems
andthe
lowest
sharesw
erew
illingto
payto
improve
airquality.
Ta
ble
9.6:S
ha
res
of
Ho
us
eh
old
sW
illing
toP
ay
for
Imp
rov
em
en
tsb
yW
ealthG
rou
pan
dIm
pro
ve
me
nts
by
Categ
ory.
Water
Water
Ou
tdo
or
Ind
oo
rInsects
Garb
age
Qu
alityQ
uantityA
irA
ir
LowW
ealth
('YoW
illingto
Pay)
7274
5259
8876
Middle
Wealth
('YoW
illingto
Pay)
6864
4550
8173
High
Wealth
('YoW
illingto
Pay)
8579
4940
8972
All
Households
('YoW
illingto
Pay)
7273
5157
8775
Data
source:Q
uestionnaireS
urveyof
GA
MA
,1991.
Before
examining
theadditional
payments
householdsw
erew
illingto
payfor
improvem
ents,it
isw
orthreconsidering
howm
uchthey
were
alreadypaying
forsom
eo
fthe
existingservices.
As
indicatedin
Chapter
2,w
aterprices
were
regressive,w
ithp
oo
rhouseholds
generallypaying
more
pergallon
thanthe
wealthy.
Moreover,
pricesw
ereinversely
relatedto
thequality
of
theservice.
Fo
ra
householdusing
1,000gallons
perm
onth,the
costsranged
fromroughly
1,000cedis
perm
onthif
purchasedby
thebucket
toabout
250cedis
ifa
privateconnection
were
sharedbetw
eenthree
households.F
or
garbagecollection,
while
82%o
fthe
sample
saidthey
dumped
theirw
asteat
comm
unitycollection
pointso
rdum
ps,only
31%
of
theseclaim
edto
paya
levy.T
heofficial
chargefor
theuse
of
comm
unityrefuse
dumps
is2500
cedisa
year,o
rroughly
200cedis
perm
onth,in
Accra
and500
cedisa
month
inT
ema.
Only
about10%
of
householdsw
ereserved
bya
home
collectionservice.
The
chargesfor
home
collectionranged
from1000
cedisa
month
fora
100litre
containerto
3500cedis
am
onthfor
a240
litrecontainer.
How
ever,m
orethan
halfo
fthe
householdsw
ithhom
ecollection
saidthey
paidless
than1000
cedisa
month.
Table
9.7show
sthe
averageso
fthe
maxim
umm
onthlyw
illingnessto
payfor
improved
servicesfor
eachw
ealthgroup
(householdsunw
illingto
payanything
havebeen
ascribedzero).
Fo
rall
householdscom
binedthe
means
rangefrom
240cedis
perm
onthfor
indoorair
to446
cedisper
month
forinsect
control.T
hesefigures
areo
fcom
parablem
agnitudeto
monthly
payments
forw
aterand
solidw
asteservices.Individually
theym
ayseem
small,
butthey
would
representsignificant
sacrificeson
thepart
of
thehouseholds,
andsum
med
acrossthe
more

98
Environm
entalP
roblems
andthe
Urban
Household
inthe
GA
MA
-Ghana
than200,000
householdsin
GA
MA
,the
totalsare
appreciable(sum
ming
acrossim
provement
categoriesw
ouldyield
stilllarger
figures,but
would
probablyoverestim
atethe
combined
willingness
topay).
The
446cedis
perm
onthper
householdfor
insectcontrol,
forexam
ple,w
ouldtranslate
intom
orethan
onebillion
cedisper
annum(roughly
2.5m
illiondollars).
Inshort,
theresults
suggesta
considerabledem
andfor
improvem
ents,anda
willingness
tom
akereal
sacrificesto
achievethem
.In
most
cases,the
averagew
illingnessto
payfor
improvem
entincreases
substantiallyw
ithw
ealth.For
everyim
provementexceptindoor
air,the
richare,
onaverage,
willing
topay
them
ostand
thepoor
theleast.
Indeed,in.every
caseexcept
indoorair
thew
ealthyare
willing
topay
more
thantw
icew
hatthe
poorare
willing
topay,
despitethe
factthat
inseveral
categoriesthey
arealready
farcloser
tothe
improved
situation.T
hus,for
example,
thew
ealthyare
willing
topay
onaverage
anadditional
954cedis
perm
onthto
obtaina
reliableindoor
pipedw
atersupply,
despitethe
factthat
virtuallyall
of
themalready
haveindoor
pipedw
ater.T
helow
-wealth
householdsare
onlyw
illingto
payan
additional361
cedisper
month,
despitethe
factthat
most
nowhave
tofetch
water
byhand.
On
theother
hand,given
theprevailing
income
distributionin
GA
MA
,as
ashare
of
income,
them
eanw
illingnessto
payfor
thelow
-wealth
householdsis
almost
certainlyhigher
thanfor
wealthy
households.
Ta
ble
9.7:W
illing
ne
ssto
Pay
for
En
viron
me
nta
lIm
pro
vem
en
tsb
yW
ealthG
rou
pin
Ce
disIM
on
th.Low
Medium
Hig
hA
ll
Wa
ter
Qu
ality
332418
746365
(619)(670)
(1123)(668)
Wa
ter
Ava
ilab
ility361
441954
404
(594)(825)
(1357)(701)
Ou
tdo
or
Air
228298
466250
(638)(695)
(764)(654)
Ind
oo
rA
ir235
270245
240
(571)(573)
(554)(570)
Inse
ct417
462849
446
(597)(414)
(941)(608)
Solid
Wa
ste343
450809
382
(607)(518)
(1018)(634)
#H
ou
seh
old
s796
12453
973
Note:
nu
mb
ers
inbrackets
arestandard
deviations.
Data
sou
rce:
Questionnaire
Survey
ofG
AM
A,
1991.
Incontrast
tothe
differentoverall
levelso
fpaym
ent,the
relativevalue
attachedto
differentim
provements
remains
similar
acrossthe
wealth
groups.F
orall
householdscom
bined,the
highestw
illingnessto
payis
forinsects,
followed
byw
ateravailability,
solidw
astedisposal,
water
quality,outdoor
airquality
and

Benneh
etat.99
indoorair
quality,w
ithboth
of
theair
qualityfigures
considerablylow
erthan
anyo
fthe
othercategories.
With
theexception
of
afew
minor
reversals,this
same
orderapplies
toevery
wealth
group.P
oorhouseholds
placem
oreconcern
onindoor
thanoutdoor
airpollution,
presumably
becausethey
arethe
householdsusing
them
orepolluting
fuels.W
ealthyhouseholds'
willingness
topay
forw
ateravailability
ism
arginallyhigher
thanfor
insectcontrol,
possiblybecause
of
water
supplyinterruptions.
9.4Sum
mary
The
previouschapter
demonstrated
theclose
associationbetw
eenenvironm
entalinadequacies
andhealth
problems.
The
valuationso
fenvironm
entalunprovem
entpresented
inthis
chapterare,
byand
large,consistent
with
existingknow
ledgeo
fthe
healthburdens
imposed.
Malaria
isthe
most
evidenthealth
problem,
andinsect
controlw
asthe
most
valuedim
provement.
Diarrhoea
isalso
am
ajorhealth
if
problem,
andw
aterim
provements
were
alsohighly
valued.(S
anitationim
provements
were
notincluded
inthe
survey,but
thereis
everyindication
thatthey
toow
ouldhave
beenhighly
valued.)A
irquality
improvem
entsw
ereless
highlyvalued,
despitethe
importance
of
respiratoryinfection.
How
ever,the
linkbetw
eenair
pollutionand
respiratoryproblem
sis
probablyless
significantthanthat
between
water
anddiarrhoea.
Solid
waste
collectionw
asquite
highlyvalued,
despitehaving
avery
uncertainlink
tohealth.
Inthis
case,it
isprobably
bestto
assume
thathealthw
asnot
theprincipal
motivation.
Inthe
[mal
analysism
ajorenvironm
entalim
provements
atthe
householdlevel
requirepoverty
alleviation.T
heresults
supportthe
notionthat
peopleplace
considerablevalue
onenvironm
entalim
provements,
andare
willing
tom
akesignificant
economic
concessionsin
orderto
achievethem
.T
heeconom
icburden
of
payingfor
existingenvironm
entalservices
isconsiderable.
Inseveral
cases(e.g.
water)
po
or
householdsare
alreadypaying
highprices
foran
inadequateam
enity.U
ndersuch
circumstances,itis
anindication
ofthe
importance
peopleattach
tothe
householdenvironm
entthat
theyare
willing
topay
stillm
orefor
improvem
ents.H
owever,
itis
unrealisticto
expectto
achieveadequate
home
andneighbourhood
environments
without
significantim
provements
inthe
economic
statuso
fthe
majority
of
households.O
nthe
otherhand,
asnoted
atthe
starto
fthis
chapter,even
ifhouseholds
valueenvironm
entalbenefits,
individuallythey
oftenhave
relativelylittle
controlover
theenvironm
entthey
face.Indeed,
theim
mediate
economic
incentivem
aybe
todegrade
theenvironm
ent,despite
thecosts
thisincurs
onothers.
Such
problems
arisein
po
or
asw
ellas
wealthy
areas.O
utdoordefecation
inan
urbansetting,
forexam
ple,is
inpart
asym
ptomo
fsevere
poverty.B
utit
isalso
anindication
thatindividual
andcollective
interestsare
notin
harmony.
Similarly,
inadequatew
ateraccess
may
besym
ptomatic
of
poverty,but
povertydoes
notdictate
thatw
aterprices
shouldbe
especiallyhigh.
Econom
icssuggests
thatsom
eform
of
collectiveaction
may
berequired
when
publicbenefits
areinvolved.
Justas
householdsseem
edto
placea
higherpriority
onim
provements
which
would
havea
major
healthim
pact,so
alsohouseholds
tendedto
identifya
needfor
more
collectiveaction
them
orepublic
thebenefits.
.Indoorair
improvem
ent,w
hichbenefits
principallythe
householdm
akingthe
improvem
ent,w
asseen
principallyas
ahousehold
affair.F
or
otherproblem
s,the
respondentsm
ostoften
identifieda
needfor
government
action,though
neighbourhoodaction
receivedconsiderable
supportforgarbage,insectand
especiallysanitation
problems.

100E
nvironmentalP
roblems
andthe
Urban
Household
inthe
GA
MA
-Ghana
CH
AP
TE
RT
EN
10T
HE
INS
TIT
UT
ION
AL
ASPE
CT
SO
FU
RB
AN
EN
VIR
ON
ME
NT
AL
MA
NA
GE
ME
NT
10.1Introduction
As
indicatedin
theprevious
chapter,good
environmental
managem
entcan
onlybe
achievedthrough
appropriateinstitutions.
Itis
notenoughto
identifyproblem
sand
priorities.S
ocietyresponds
toproblem
sthrough
institutionsranging
fromm
arketsto
centralgovernments,
fromprivate
enterpriseto
non-governmental
organisations,from
kinshipnetw
orksto
politicalparties,
andso
on.A
llsuch
institutionscan
bepart
of
theproblem
orpart
of
thesolution.
Hence,
therole
of
existingsocial
institutionsin
environmental
managem
entneeds
carefulexam
ination.T
hepresent
chapterw
illexam
inew
hetherand
tow
hatextent
identifiablegovernm
ental,political,
non-governmental
andneighbourhood
organisationscan
make
significantcontributions
tothe
cruciallyim
portantenterprise
of
improving
environmental
managem
entatthe
householdand
comm
unitylevels.
10.2T
heG
overnment's
InstitutionalStructureW
ithinthe
metropolis,
acom
plexset
of
institutionsis
involvedin
thedecision
making
andpolicy-execution
processesw
hichhelp
determine
howthe
environment
ism
anaged.Each
hasan
importantrole
toplay
inprom
otinga
healthycity.
Butitis
throughthe
functionalinteraction
of
theseagencies
andorganisations
thathousehold
environmental
problems
canbe
effectivelym
anaged.E
nvironmental
problems
rarelyem
ergew
ithinthe
confineso
fanyoneinstitution:
theirvery
naturetypically
precludesa
simple
assignment o
finstitutionalresponsibilities.
10.2.1C
entralG
overnmentInstitutions
Clearly
thelarger,m
oreform
al,state
institutionshave
anim
portantroleto
play.A
sindicated
inthe
precedingchapter,
most
householdssee
thestate
asthe
most
important
actorfor
achievingenvironm
entalim
provement.
Already,
stateinstitutions
providethe
corestructure
forenvironm
entalservices,
tow
hichother
institutions,including
households,m
ustadapt.
The
roleo
fthe
statein
protectingthe
environment
isexpected
toincrease
relativeto
many
of
itsother,
more
traditionalroles.
How
ever,environm
entalresponsibilities
within
thestate
remain
dividedam
onga
largenum
bero
fm
inistries.T
herem
aybe
advantagesto
thisdivision
ofresponsibilities,butitcreates
anum
berofco-ordination
problems.
Atthe
governmentallevel,atleasteight ofthe
fifteenm
inistriesare
involvedin
onew
ayo
ran
otherin
environmental
managem
ent.A
tthis
macro-institutional
level,relevant
policiesare
adoptedand
decisionstaken
concerningthe
implem
entationo
fenvironm
entrelated
policies.T
hecritical
actorsin
theenvironm
entalarena
includethe
ministries
discussedbelow
.T
heM
inistryo
fFinance
andE
conomic
Planninghas
theoverall
tasko
fresource
allocationfor
researchinto
environment-related
issuesand
forthe
executiono
fenvironm
entalaction
plans.Financing,
personnelrecruitm
entand,
indeed,all
material
andhum
anresources
haveultim
atelyto
beaddressed
bythis
ministry.
The
effectivenesso
fenvironm
entalm
anagement
agenciesand
practitionersis,therefore,largely
dependentonthis
ministry.
The
Ministry
of
Works
andH
ousingnot
onlyengages
inconstruction
andm
aintenance,but
alsohas
asupervisory
rolein
almost
allpublic
construction

Benneh
etal.101
activities.T
heG
hanaW
aterand
Sew
erageC
orporation,a
serviceagency
within
thism
inistry,will
bediscussed
ingreaterdetailin
10.2.2.T
heM
inistryo
fL
ocalG
overnment
performs
basicco-ordinating
andharm
onisingroles.
Itstask
isto
ensurethat
what
ishappening
onthe
groundis
inline
with
regionaland
nationalpolicies
andguidelines
onenvironm
entalas
well
asother
issues.T
wo
keydepartm
entsw
ithinthis
ministry
arethe
Tow
nand
Country
Planning
Departm
entand
theE
nvironmental
Protection
Council.
The
former
isresponsible
forensuring
theplanned
development
of
them
etropolis,and
thelatter
forensuring
thatdevelopm
entprojects
takeproper
measures
tosafeguard
thequality
of
theenvironm
ent(A
muzu
andL
eitmann,
1991,p.
41).Indeed
anew
Ministry
of
theE
nvironment
hasbeen
createdw
iththe
inaugurationo
fthe
Fourth
Republic
onthe
7tho
fJanuary,1993.
The
Ministry
of
Industries,S
cienceand
Technology
hasan
organisingand
controllingrole.
This
ministry,besides
itsconcerns
forscientific
research,oversees
andcontrols
thesiting
of
newindustries
toensure
environmental
safety.A
mong
theinstitutes
directlyinvolved
inenvironm
entalm
attersare
theInstitute
of
Aquatic
Biology,
theW
aterR
esourcesR
esearchInstitute,
theF
oodR
esearchInstitute,
andthe
Building
andR
oadsR
esearchInstitute
(Am
uzuand
Leitm
ann,1991,p.38).
The
Ministry
ofM
ineraland
Natural
Resources
isresponsible
forensuring
thatthe
useo
fnatural
resourcesdoes
notlead
toundue
environmental
degradation.W
hilenot
centrallyconcerned
with
householdenvironm
entissues,
itis
acritical
actorin
theenvironm
entalarena.
The
Ministry
of
Agriculture
isnot
onlyconcerned
with
agriculturalproduction
butalso
with
thehealth
of
citizensand
safetyo
fthe
environment.
The
IrrigationD
evelopment
Authority
within
thism
inistry,for
example,
hasas
anobjective
ensuringthe
healtho
fpeople
livingin
targetareas.
The
Ministry
of
Transport
andC
omm
unicationhas
specificresponsibility
forcontrolling
andcontaining
airpollution.
Policieson
emissions
fromvehicles
areform
ulatedand
executed.T
heM
inistryo
fT
radeand
Tourism
,besides
regulatingtrade,
isconcerned
with
thedevelopm
ento
fthe
tourismindustry.
Developm
ento
ftourist
siteshas
totake
intoactive
considerationthe
possiblenoxious
environmental
consequences.G
iventhe
wide
rangeo
fm
inistriesw
ithdifferent,
andin
some
casesoverlapping,
responsibilitiesfor
environmental
managem
ent,problem
so
finter
institutionalco-operation
andco-ordination
caneasily
emerge.
Success
dependsas
much
onthe
harmonious
interactiono
fthese
differentm
inistriesas
onthe
qualityo
fany
on
em
inistry'sactions.
At
alow
erlevel
of
thisorganisational
structureare
theregional
anddistrict
administrations.
The
regionaladm
inistrationis
areplica,
atthe
Greater
Accra
Regional
level,o
fthe
institutionalstructure
outlinedabove.
Similarly,
thedistrict
administration
replicatesthe
regionaladm
inistrativestructure.
These
interconnectedinstitutional
structuresare
intendedto
ensurean
efficientflow
of
information
andinfluence,
andthe
effectiveform
ulationand
executiono
fenvironm
entalpolicies.

102E
nvironmental
Problem
sand
theU
rbanH
ouseholdin
theG
AM
A-G
hana
10.2.2H
ealthE
ducationT
heinstitutional
arrangements
thatare
inplace
inthe
studyarea
forhealth
educationand
managem
entare
discussedhere
with
respectto
thethree
healthrelated
issues:food
contamination,
airpollution
andinsect
vectorincidence.
Three
distinctgroups
ofactors
areassociated
with
thehealth
educationendeavour:
theM
inistryo
fH
ealth(M
OH
)and
itsvarious
preventivehealth
deliveryunits,
thedistrict
assemblies
ofthe
threedistricts
inthe
studyarea,
andprivate
organisations.including
NG
Os
andother
voluntaryassociations.
Inthe
studyarea,
healthcare
deliveryis
underthe
auspicesofthe
Ministry
ofHealth.
The
Ministry
of
Health
hasestablished
aH
ealthE
ducationD
ivisionw
hichis
chargedw
iththe
dissemination
ofinform
ationon
healthand
health-relatedissues
tothe
generalpublic.
Itsfunctions
arecarried
outthrough
seminars,
workshops,
talks,publiccam
paignsand
thelike.
The
Ministry's
Primary
Health
Care
Programm
eis
directedat
deliveringpreventive
healthcare,
andprom
otes,am
ongother
things,good
personalhygiene
andthe
implem
entationof
theE
xpandedProgram
me
ofIm
munisation
(EP
I)against
thesix
childhoodkiller
diseases(i.e.m
easles,tuberculosis,
poliomyelitis,
tetanus,diphtheria,
andyellow
fever).Public
educationto
helppeople
understandand
respondto
thepotential
dangersof
foodcontam
inationand
theuse
ofdangerous
chemicals
andsoaps
ispart
ofthis
preventivehealth
deliverysystem
.In
theA
ccraD
istrict,for
instance,prim
aryhealth
careand
outreachservices
froma
number
of
healthinstitutions
havebeen
established,to
ensurethat
healthprom
oting,preventive
andcurative
measures,
includinghealth
education,reach
residentsin
almostallneighbourhoods.
10.2.3T
heD
istrictAssem
bliesT
hethree
districtassem
bliesin
theStudy
areaare
theA
ccraM
etropolitanA
ssembly
(AM
A)
forthe
Accra
District,
theT
ema
District
Assem
blyfor
theT
ema
District,and
theA
masam
anA
ssembly
forthe
Ga
District.
General
Managem
entof
waste
andsanitation
isthe
responsibilityo
fD
istrictand
Municipal
Councils,
accordingto
Section7,
Sub-sectionI
ofthe
Local
Adm
inistrationA
ct.C
onsequently,in
thereform
edlocal
government
system,
theA
ccraM
etropolitanA
uthorityin
theA
ccraD
istrict,the
Tem
aD
evelopment
Corporation
andD
istrictA
uthorityin
Tem
aD
istrict,and
Am
asaman
Assem
blyin
Ga
District
areresponsible
forw
astem
anagement
intheir
respectiveareas
ofjurisdiction.
Inthe
caseof
Accra
District,
thethen
Accra
City
Council
setup
theW
asteM
anagement
Departm
entin
1985to
addressthe
acuteproblem
ofw
astem
anagement
causedby
run-down
facilitiesand
equipment.
This
was
supportedw
ithequipm
entand
fundingfrom
Germ
any(form
erlyFR
G).
This
institutionalstrengthening
hasgone
along
way
tostabilise
thedeteriorating
sanitationsituation
inthe
country,although
alotrem
ainsto
bedone
(Songsore,1992,p.11).
The
Accra
Metropolitan
Assem
bly,how
ever,encounters
anum
berof
difficultiesin
itshealth
educationm
anagement
efforts.D
espiteallof
them
easuresm
entionedabove,
lackof
supervisionand
enforcement
ofbye-law
soften
resultsin
verypoor
foodhygiene
practicesby
thenum
erouschop-bars
andrestaurants,
asw
ellas
foodand
water
vendors.B
ye-laws
regulatingm
eathygiene
arealso
notalw
aysenforced.

Benneh
etai.103
10.2.4T
heE
nvironmentalP
rotectionC
ouncil(E
PC
)T
heonly
regulatorystandards
forair
pollutionare
thoseset
bythe
EP
Cfor
ambient
airquality
inresidential,
comm
ercialand
industrialareas.
These
standards,sum
marised
inC
hapter7,
coverboth
indoorand
outdoorair
pollution.T
oensure
thesuccessful
achievement
ofsuch
standards,there
must
beadequate
information
onpresent
emissions
andconcentrations,
asw
ellas
futuretrends.
The
highrisk
sourcesand
locationsm
ustbe
identified.T
hegeneral
public,as
well
asthe
government,
must
knoww
henhigh
levelso
fair
pollutionoccur
andw
here.Public
educationis
allthe
more
criticalgiven
therelative
importance
of
exposureto
smoke
fromcooking
fires,w
hichaffects
mainly
wom
enand
children,and
isparticularly
severew
henw
oodand
charcoalare
usedw
ithpoor
ventilation.It
isdifficult
tocontrol
suchpollution
without
theactive
involvement
of
well
informed
users.Unfortunately:
"sinceits
establishment
in1974,
theE
PC
hasnot
createdany
formal
mechanism
forinvolving
thepublic
inenvironm
entalm
anagement,
exceptfor
theannual
observanceo
fthe
World
Environm
entalD
ay.O
nthis
day,institutions,
politiciansand
othersenior
officialsare
invitedto
participatein
lecturesand
discussionson
selectedthem
es.Form
alparticipation
islim
itedlargely
tothose
who
haveprofessional
andother
interestsin
environmental
matters.
The
media
isheavily
involvedin
theseevents
butthis
isnot
usuallysustained"
(Am
uzuand
Leitm
ann,1991,
p.44).H
owever,
Am
uzuand
Leitm
annalso
notethat
"...the
EP
C's
pastad-hoc
approachto
environmental
educationis
beingchanged
toone
ofpositive
actionthrough
theform
ulationo
ftheE
nvironmental
Action
Plan".
10.2.5E
nvironmentalSub-C
omm
itteesT
hereare
moves
toestablish
environmental
sub-comm
itteesw
ithinthe
District
Assem
blies,to
functionunder
thetechnical
guidanceo
fthe
EP
e.It
isanticipated
thatthese
sub-comm
itteesw
illtranslate
theobjectives
of
broadpublic
healtheducation
programm
eson
environmental
pollutionand
qualityinto
practicalactivities
atthegrassroots
level.
10.3D
eliveryA
genciesIt
isthe
responsibilityo
fthe
Ghana
Water
andS
ewerage
Corporation
(GW
SC
)to
make
potablew
ateravailable
tothe
citizenry.A
sindicated
inthe
chapteron
water
supply,actual
productiono
fpotable
water
islow
erthan
estimated
demand,
resultingin
widespread
water
supplyproblem
sin
largeareas
of
them
etropolis.A
neffort
torehabilitate
water
supplyinfrastructure
andexpand
productionis
anticipated.G
WS
Cfaces
am
ajorproblem
,how
ever,generating
revenue.Q
uiteapart
fromthe
problems
of
costrecovery
throughuser
fees,there
isthe
addedproblem
of
diversiono
frevenue
generatedin
GA
MA
tothe
Head
Office
ofG
WS
C,
which
re-allocatesa
shareo
fthe
fundselsew
here.T
hiscreates
furtherproblem
so
fmaintaining
supplysystem
sand
expandingcoverage.
The
GW
SC
isalso
involvedin
human
waste
disposal.In
Accra,
thelevel
ofsew
erageservice
providedranges
fromhouse
connectionsto
water-borne
systems,
septictanks,
KV
IPs,
pitlatrines
andirregular
nightsoil
collection.O
therparastatal
organisationsprovide
sewer
systems
andtreatm
entplantsin
variousparts
of
Accra,
e.g.S
tateH
ousingC
orporation,M
inistryo
fH
ealth,the
Military
establishment,
hospitals,etc.
As
describedin
previouschapters,
however,
thesanitation
systemrem
ainsinadequate,
especiallyin
lowincom
eareas
within
GA
MA
.A
gain,how
ever,revenueproblem
sm
akeitdifficultto
respondeffectively.

104E
nvironmental
Problem
sand
theU
rbanH
ouseholdin
theG
AM
A-G
hana
10.4P
oliticalOrganisations:
The
Com
mittees
for
theD
efenceo
ftheR
evolution(C
DR
s)T
heC
omm
itteesfor
theD
efenceof
theR
evolution(C
DR
s)w
ereform
edin
theearly
80s,w
iththe
adventof
theProvisional
National
Defence
Council
(PND
C).
They
areovertly
politicalorganisations.
Their
officialobjective
isto
involvethe
peopleatthe
grassrootslevel
inpoliticaldecision-m
aking,and
tobring
government
tothe
doorstepso
fthe
ordinarycitizen.B
ut,likeany
organisation,the
CD
Rs
haveadapted
totheir
physicaland
socialcontext.
Apart
fromtheir
more
overtlypolitical
activities,C
DR
salso
serveother
functions.T
ypically,they
areenvironm
entallyconscious,
andinstrum
entalboth
inenvironm
entaleducation
andin
planningcollective
localresponses
toexisting
environmental
conditions.T
heM
atehekoC
DR
isa
casein
point.
Box
10.1:E
nvironmentalM
anagementand
aN
eighbourhoodP
oliticalInstitution:
theM
atehekoC
DR
.
Although
theM
atehekoC
DR
isnotofficially
involvedin
protectingor
improving
theenvironm
ent,it
occasionallytakes
responsibilityin
ensuringa
safeenvironm
entfor
thecom
munity.
Itorganises
am
onthlyclean-up
tounblock
chokedgutters
anddrains.
The
surroundingsare
clearedo
fw
eedsand
allfilth
isrem
ovedto
preventoutbreak
of
epidemics.
Itensures
thatfood
sellerscover
theirfood
properlyand
adoptgood
hygienicpractices,
which
hasreportedly
broughtthe
incidenceo
ffood
poisoningto
verylow
levels.It
isin
chargeo
fthe
onlypublic
toiletw
ithinthe
comm
unity,and
ensuresa
veryhigh
levelof
cleanliness.It
alsoensures
thatthe
inhabitantsdispose
ofsolid
waste
inthe
collectioncan
provided.
Data
sou
rce:
Focus
Group
Discussion,
1992.
While
thisis
typicalof
anum
berof
theC
DR
sencountered
(e.g.those
inJam
estown,
Madina
andM
amprobi),
theC
DR
inD
arkuman
would
seemto
havegone
further.T
heD
arkuman
CD
Rhas
beenvisibly
comm
ittedto
ahealthy
environment,
akey
concernof
thegroup.
To
realisethis
objective,the
grouphas
establisheda
projectscom
mittee,
whose
primary
taskis
tom
obilise[m
andalresources
tom
eetoperational
costs.A
sanitationcom
mittee
hasbeen
setup
with
theresponsibility
oforganisingcom
munity
mem
bersto
become
activelyinvolved
inthe
managem
entof
theirenvironm
ent.R
egularclean-up
campaigns
havebeen
organised,along
with
publiceducation
initiativesto
createaw
arenessof
environmental
sanitation.T
henet
resultof
allthese
effortshas
beenpositive.
Residents
havenot
onlycom
eto
valuekeeping
theirsurroundings
clean,but
theyhave
alsoorganised
themselves
intosm
allw
orkgroups.
Regular
activitiesinclude
sweeping
thestreets
andcleaning
chokedgutters.
The
CD
Rhas
alsoem
barkedon
campaigns
educatingvendors
onthe
dangerso
ffood
contamination
andthe
importance
of
keepingtheir
surroundingsclean
andsafe.
Stubbornfood
sellersare
made
topay
fines.T
heeffects
areencouraging.
InD
arkuman,
environmental
consciousnessis
nowhigh,
atleast
inpart
asa
resulto
fthe
CD
Rpublic
educationefforts.
The
unitC
DR
isin
closecontact
with
theE
nvironmental
Protection
Council
(EPC
)and
assiststhe
Council
by,for
example,
puttingup
postersto
make
peoplebecom
em
orevigilant
aboutthe

Benneh
etal.105
environment.
(One
of
theposters
reads:K
eepyour
surroundingsclean
forgood
health.)activities
of
theC
DR
reinforcethe
message.
As
insom
eother
areasvisited,
theD
arkuman
CD
Rinteracts
positivelyw
ithother
neighbourhoodorganisations.
Such
interactionyields
gooddividends
interm
so
fenvironm
entalm
anagement.
Overall,
thecase
of
Darkum
anw
ouldappear
tobe
somew
hatexceptional.
Inno
othercom
munity
havethe
activitieso
ftheC
DR
sbeen
soeffective
increating
asustained
comm
itmentto
aclean
environment.
Indeed,the
unsanitaryconditions
inm
ostneighbourhoods
suggestthat
clean-upcam
paignsare
notbearing
thedesired
results.F
urthermore,
therew
ereindications
of
seriousinternal
difficultiesand
conflictsw
ithin·som
eC
DR
s,no
doubtlim
itingtheir
effectiveness.A
sfar
asenvironm
entalm
anagement
isconcerned,
itappears
thatm
osto
fthe
CD
Rs
haverun
outo
fsteam
inrecent
years.A
lso,their
futureis
uncertainin
thelight
of
theongoing
democratisation
process.A
lternativesocial
arrangements
toprom
otea
cleanenvironm
entare
thereforerequired.
Fortunately,
some
suchsocial
mechanism
salready
existw
ithinthe
studyarea,
eitheras
spontaneousneighbourhood
organisationsor
officialneighbourhood
socialstructures.
10.5O
fficialNeighbourhood
Groups
Acharacteristic
featureo
ftheG
hanaiansocial
structureis
theem
ergenceo
fgroups
respondingto
specificcom
munity
needs.S
ome
of
thesegroups
haveevolved
with
supportand
encouragement
of
thestate.
Such
organisationsare
referredto
asofficial
neighbourhoodgroups.
They
aresm
allscale
government
agencies.S
ome
of
thesegroups
haveenvironm
entalm
anagement
astheir
primary
objective.F
orinstance,
theA
shaiman
Waste
Managem
entC
omm
itteew
asinaugurated
inM
arch,1991,and
hasbeen
primarily
concernedw
ithenvironm
entalsanitation.
Specifically,the
main
objectivesare
toadm
inisterthe
sanitaryfacilities:
maintain
them,
desludgethem
when
theyare
full,and
generallym
akethem
accessibleto
thecom
munity.
This
grouphas
beeneffective
interm
so
fits
main
objectives.T
heachievem
entsof
thecom
mittee
duringthe
firstseven
months
of
itsoperation
includethe
effectivem
anagement
of
publictoilets,
theorganisation
of
clean-upcam
paigns,and
activeinvolvem
entin
thegovernm
entsponsored
face-liftproject
forA
shaiman.
Phase
1o
fthis
projecthas
alreadybeen
completed.
The
projectsunder
thisphase
includedrainage,
rehabilitationo
fexistingtoilets
aridthe
constructiono
fnew
ones,as
well
asthe
extensiono
fpipedw
atersupply
tosom
ehitherto
deprivedareas.
Similarly,the
Bogyia
ServicesL
imited
of
Accra
New
Tow
nis
agood
example
of
inter-organisationalinteraction.
Established
inD
ecember,
1987,through
theco
ordinatedefforts
of
theM
inistryo
fH
ealth,A
MA
,and
theG
erman
Governm
ent,the
grouphas
beenactively
involvedin
theplanned
disposalo
fliquid
andsolid
waste
within
theneighbourhood.
Such
technicaland
material
supportis
apositive
stimulant
forgroups
onthe
ground.T
heO
ldA
shaleB
otwe
Developm
entC
omm
itteeis
anothercase
inpoint.
With
thenecessary
assistancefrom
theD
epartment
of
Rural
Developm
ent,the
comm
unity,through
theleadership
of
theT
own
Developm
entC
omm
ittee,has
beenable
tobuild
fourK
VIPs.
This
hasim
provedsanitary
conditionsconsiderably.
Dynam
icgroups
of
thisnature
constitutecritical
socialstructural
variablesfor
effectiveenvironm
entalm
anagement.

106E
nvironmental
Problem
sand
theU
rbanH
ouseholdin
theG
AM
A-G
hana
10.6Spontaneous
Neighbourhood
Organisations
During
thecourse
of
thefield
work,
anum
bero
fspontaneous
neighbourhoodgroups
orclubs
were
identifiedw
ithinthe
studyarea.
These
include:Jerusalem
FunC
lub,T
ema
New
Tow
n;K
ungiyarN
asara(N
asaraC
lub),S
abonZ
ongo;M
aamobi
Islamic
Youth
Association,
Nim
a441
Muslim
Youth
Association,
theL
aM
ansaamo
Kpee
of
La
Tow
n(L
abadi),and
theN
ima
441W
elfareA
ssociation.T
heseclubs
emerged
spontaneouslyin
responseto
certainperceived
needsw
ithinthe
comm
unities.T
heyare
fonnalbut
voluntaryorganisations.
They
havespecific
goalsem
bodiedin
theirconstitutions,butm
embership
isoptional.
The
goalspursued
bythese
clubsvary.
How
ever,they
typicallyincorporate
comm
unity-wide
concerns.T
heJerusalem
FunC
lub,though
am
anifestlysocialising
neighbourhoodgroup,fosters
environmental
awareness
within
theT
ema
New
Tow
narea.
Furthennore,
inco-operation
with
otherclubs
inthe
area,it
activelyprom
otesenvironm
entalsanitation.The
Nim
a441
Muslim
Association,the
Maam
obiIslamic
Youth
Association
andthe
Kungiyar
Nasara
(Nasara
Club)
transcendtheir
imm
ediatereligious
concernsto
tackleenvironm
entalissues.
Indeed,concern
forthe
environment
isone
of
thefew
comm
onalitiesextending
acrossall
of
theseclubs.
Unfortunately,
theirdifferences
canm
askthis
comm
onconcern,
making
co-operationand
co-ordinationproblem
atic.T
wo
relativelysuccessful
neighbourhoodorganisations,
theN
ima
441W
elfareA
ssociationand
La
Mansaam
oK
peeo
fL
abadi(L
a),are
describedin
more
detailbelow
.
10.6.1N
ima
441W
elfareA
ssociationT
heN
ima
441W
elfareA
ssociationw
asestablished
inJuly,
1980.N
ima
isa
highdensity,
lowincom
eresidential
neighbourhood.S
anitationhas
beenan
endemic
problem.
The
objectiveso
fthe
Welfare
Association
includethe
promotion
andim
provement o
fsanitation
andthe
trainingo
funskilled
andunem
ployedpersons
soas
toenable
themto
become
gainfullyem
ployed.T
heassociation
hasachieved
considerablesuccess
inboth
regards.T
heassociation
hasbeen
ableto
trainthe
unskilledand
unemployed
invarious
skillslike
carpentry,dressm
aking,and
welding.
Group
mem
bershave
builta
clinicto
caterfor
thesick
inand
aroundthe
neighbourhood;they
havebeen
dealingw
ithenvironm
entalissuessuch
assolid
waste
disposal,desiltingo
fguttersand
sweeping
of
surroundings,and
organisingpublic
educationon
sanitationand
environmental
issues.A
24-seaterK
VIP
hasbeen
builtw
iththe
helpo
fa
Canadian
benevolentorganisation
(St.John).T
heassociation
derivesits
financesfrom
monthly
dues,special
contributions,revenue
fromthe
operationo
fthe
association'scom
-mill,
anddonations
fromthe
Netherlands
Em
bassy.G
iventhe
properenvironm
entand
thecom
mitm
ento
forganisational
mem
bers,there
isno
reasonthat
theeffectiveness
of
thegroup
shouldnot
besustained,
oreven
enhanced,to
thebenefit
ofsocial
andhum
andevelopm
entinthe
targetarea.
10.6.2L
aM
ansaamo
Kpee,
La
Tow
n(L
abadi)T
heL
aM
ansaamo
Kpee
(LM
K)
was
establishedin
1979by
eminentcitizens
of
thecom
munity.
The
objectiveso
fL
MK
includethe
provisiono
fa
forumfor
freediscussion
ofallthe
matters
thatw
illprom
otean
orderlyyet
vigorousdevelopm
ento
fthe
La
traditionalarea,
raisingthe
standardof
livingand
qualityo
flife
of
theinhabitants
of
La
byim
provingpublic
health,sanitation,
education,and
recreation

Benneh
etal.107
throughself-help
andvoluntary
serviceand
undertakingand
sponsoringdevelopm
entprojectsin
theL
aT
raditionalA
rea.
Box
10.2:E
nvironmentalM
anagementand
aS
pontaneousN
eighbourhoodA
ssociation:L
aM
ansaamo
Kpee
(LM
K).
The
effortso
fL
MK
tohelp
indeveloping
theL
atow
nby
way
ofim
provingpublic
sanitationhas
yieldedfour
publicw
atercloset
toilets(W
Cs),
onepublic
bathroom,
andthree
KV
IPtoilets
forsom
eschools
inthe
neighbourhood.A
lsothe
grouphas
beenable
tosetup
acom
munity
bank,which
isoperating
successfully.A
grantfrom
theA
fricanD
evelopmentFoundation
basedin
theU
.S.A
.,enabled
LM
Kto
establisha
revolvingfund
throughw
hichindividualhouseholds
areassisted
inbuilding
KV
IPsor
WC
sin
theirow
ncom
pounds.L
MK
bearsthe
fullconstructional
costw
hilethe
landlordor
owner
of
thehouse
isexpected
torepay
theloan
within
30m
onthsat
aninterest
of
11%
.C
reditadvanced
toeach
householdis
limited
to300,000.00
cedisper
project.A
tthe
mom
ent25
householdshave
benefitedfrom
thefund
andare
providingthem
selvesw
ithelectricity,w
aterandtoiletfacilities.
Da
taS
ource:F
ocusG
rou
pD
iscussionsand
Reports.
1992.
Th
eassociation
derivesfunds
fromm
anysources.T
heseinclude
monthly
dues,clan
houselevies,
grantsand
donationsfrom
organisationsabroad,
proceedsfrom
thehiring
outo
fa
cesspitemptier"a
tractorand
atipper
truck,and
profitsfrom
thecom
munity
bankw
hichare
investedinto
otherventures.
Th
eL
aM
asaamo
Kpee
iscertainly
asuccess
story.T
hissuccess
canbe
attributedto
severalfactors.
These
includethe
abilityto
generatefunds
fromm
embers
andresource
supportfrom
othersources,
theinteraction
of
theorganisation
with
otherlocal
andeven
internationalgroups,
and,o
fcourse,
them
embers'active
participation.S
pontaneousneighbourhood
groups,given
material
resourcesand
effectiveleadership,
canclearly
bevery
effective.E
nvironmental
managem
entis
anatural
focusfor
suchgroups.
As
such,there
alreadyexist
within
theA
ccram
etropolissocial
mechanism
so
rarrangem
entsthat
canhelp
promote
effectiveenvironm
entalm
anagement.
This
isan
opportunityw
hichenvironm
entalm
anagement
agenciesand
practitionersshould
capitaliseon
inthe
pursuito
ftheir
keyobjective:
ahealthy
city.
10.7H
ouseholds'Environm
entalRole
The
householdis
abasic
socialinstitution,
andcritical
toenvironm
entalm
anagement.
On
theone
hand,households
themselves
manage
ashared
space,and
oftenpeople's
most
criticaldecisions
regardingw
ater,sanitation,
cookingand
soon,
arevery
much
influencedby
thehousehold
context.O
nthe
otherhand,
householdsare
byno
means
always
harmonious
decision-making
units.H
ouseholdsare
theterm
inalfocus
of
many
of
thepolicies
andgovernm
entinterventions,
andm
anyenvironm
entalservices
takehouseholds
tobe
theirnatural
customers.
Needless
tosay,
householdperceptions
of,and
attitudestow
ardsenvironm
entalproblem
sare
vitalto
thesuccess
ofenvironm
entalprogram
mes.

108E
nvironmental
Problem
sa
nd
theU
rbanH
ouseholdin
theG
AM
A-G
hana
Inthe
Accra
context,it
isim
portantto
distinguishbetw
eensingle
householdunits
andm
ultiplehousehold
units.S
inglehousehold
unitsare
typicalo
fm
iddleand
highclass
areassuch
asA
irportR
esidentialA
rea,C
antonments,
East
Legon,
etc.Ironically,
inthese
singlefam
ilyhom
es,the
householdplays
arelatively
minor
rolein
environment
managem
ent.S
tateand
privateorganisations
playm
ajorroles
inthis
regard.T
herole
of
families
consistsin
depositingsolid
waste
inthe
appropriatecontainers
foreventual
disposalby
otheragencies
and,o
fcourse~.
ensuringthe
cleanlinesso
ftheim
mediate
surroundings-
atask
frequentlyexecuted
byhouse
maids.
The
situationw
ithinthe
lowincom
e,highdensity
residentialareas
isdrastically
different.S
uchareas
arecharacterised
byseveral
householdsliving
within
thesam
eresidential
unit,frequently
acom
poundhouse.
Residents
within
theseareas
typicallyexperience
them
oreacute
environmental
problems.
As
aresult
thehousehold
playsa
keyrole
inthe
maintenance
ofthe
environment.
Keeping
thesurroundings
cleanis
adaily
taskof
thehousehold.
Inm
ultiplehousehold
residentialarrangem
entsa
genderbased
divisionof
labourobtains
with
regardto
environmentaJ.
managem
ent.E
achhousehold
unitassum
esresponsibility
forits
imm
ediatesurroundings
-room
s,verandas.
Beyond
this,there
isshared
responsibilityfor
thelarger
compound
with
eachfam
ilytaking
turnsat
regularperiods
of
time
toensure
cleansurroundings.
Characteristically,
female
householdm
embers
of
variousages
performthis
vitallyim
portantrole.
The
more
conscioushouseholds
areo
fenvironm
entalissues,
thegreater
isthe
comm
itment
to,and
participationin,
environmental
managem
entat
thisbasically
micro-institutional
level.
10.8Sum
mary
an
dC
onclusionsA
lmost
everyinstitutional
levelhas
itsstrengths
andw
eaknesses.M
oreovernone
canoperate
effectivelyalone.
Success
dependsnot
onlyon
theefficiency
ofindividual
institutions,but
onhow
well
adaptedthey
areto
theinstitutions
which
surroundthem
.T
hisapplies
togovernm
entalas
well
asnon-governm
entalinstitutions.
The
government
clearlyhas
acritical
roleto
play.It
isalready
centralto
aw
iderange
of
environmental
services,and
most
respondentsfelt
thatthe
government
needsto
actto
addressa
rangeof
environmental
problems.
Within
thegovernm
entitself,
co-ordinationproblem
sarise,
giventhe
wide
rangeo
fm
inistriesresponsible
fordifferent
aspectso
fenvironm
entalm
anagement.
An
efficientsystemo
fco-ordination
andco-operation
would
certainlyenhance
theeffectiveness
ofenvironm
entalm
anagement
effortsat
thelevel
ofgovernm
entm
inistries,district
administration,
andthe
comm
unity.T
hereare,
however,
otherproblem
sw
hichm
akeitdifficultfor
thegovernm
enttorespond.
Given
thecurrent
financialcircum
stances,and
theim
perativeso
fstructural
adjustment,
financingenvironm
entalim
provement
isdifficult.
As
thew
ealthiestarea
inG
hana,it
isim
portantthat
GA
MA
doesnot
drainthe
nationaleconom
yto
solveits
localenvironm
entalproblem
s.U
nfortunately,local
taxesare
unlikelyto
providesignificant
amounts
of
additionalresources
inthe
nearterm
.O
nthe
otherhand,
giventhe
publicnature
of
most
environmental
amenities,
andthe
economic
statuso
fthe
householdsthem
selves,there
islim
itedscope
forcost
recoverythrough
userfees.
These
circumstances
make
itdifficultfor
thegovernm
enttotake
anythingnear
fullresponsibility
forproviding
environmental
servicesto
households,and
more
generallyensuring
thatenvironm
entalconditions
are

Benneh
etaI.109
adequate.D
evisingnew
andequitable
means
of
fmancing
improved
environmental
managem
entis
important.
Equally
critical,governm
entagencies
must
beable
tow
orkeffectively
with
non-governmental
institutions,w
how
illalso
continueto
playa
major
role.T
hereis
atendency
toportray
householdsas
direct"consum
ers"o
fenvironm
entalservices,
suchas
water,
garbagecollection,
sanitationprovision,
andso
on.In
GA
MA
,this
isnot
thecase,
particularlyin
poorareas.
Household
water
connections,hom
ew
astecollection,
andindividual
toiletsare
theexception,
notthe
rule.V
ariousinstitutions,
rangingfrom
informal
householdgroupings
toC
.D.R
.sm
ediatebetw
eenthe
householdsand
theservice
utilities.Im
provingthe
technicalefficiency
of
servicedelivery
andextending
theircoverage,
areclearly
important.
Providing
am
oreflexible
service,adapted
tothe
particularneeds
andinstitutional
contextoflow
-income
neighbourhoodscould
beequally
important.
Non-governm
entalinstitutions
arealso
important
inother
aspectso
fenvironm
entalm
anagement.
The
focusgroup
discussionsindicated
thatneighbourhood
organisationsare
dynamic
socialstructures,
takinga
wide
varietyo
fchangingform
s.E
nvironmental
managem
entagenciesand
practitionersw
illhave
totake
activeaccount
of
thesegroups.
They
arealready
involvedin
environmental
managem
ent,and,
giventhe
rightsupport,
coulddo
evenm
ore.L
ocalparticipation
inenvironm
entalm
anagement
istim
econsum
ingand
canbe
aburden.
But
itcan
alsoincrease
comm
itment
andappropriate
socialnorm
s,as
well
ashelping
ensurethatthe
prioritieso
flocalresidents
aretaken
intoaccount.
Fortunately,
theW
astesM
anagement
Departm
ento
fthe
Accra
Metropolitan
Assem
blyrecognises
theim
portanceo
fthe
complex
of
factorsin
environmental
managem
ent.T
heobjectives
ofthe
departmentinclude
thefollow
ing:
To
involvethe
comm
unityin
variousaspects
of
waste
managem
ent,particularly
inthe
areao
fparticipation,
clean-upcam
paigns/healthday
activities,maintenance
ofresidential
drainsand
paymento
ffees.'Involvem
ento
fthe
privatesector
andN
on-Governm
entalA
genciesin
thew
astem
anagementdelivery
sector.P
ubliceducation
of
thecom
munity
soas
toim
proveuser
habitso
fthe
facilities,thatis,containers,public
drainsand
toilets(A
MA
Docum
ent).
The
realisationo
fthese
statedobjectives
would
certainlyprom
otethe
effectivenesso
fenvironm
entalm
anagement
andcreate
therequisite
conditionsfor
ahealthy
Accra
City.
The
challengew
illbe
totum
themfrom
goalsinto
operatingprinciples.
With
regardto
environmental
educationthere
alsoappears
tobe
groundat
leastforqualified
optimism
aboutthe
future.P
upilsatthe
JuniorS
econdaryS
choollevel
areexposed
tocourses
onenvironm
entalstudies.
These
seminal
programm
eshave
thepotential
of
drawing
outthe
pupils'concern
forthe
environment,
andm
akingit
more
effective.T
ogetherw
ithother
neweducational
initiatives,such
effortscan
besignificantin
furtheringthe
causeo
fenvironmentalm
anagement.

110E
nvironmental
Problem
sand
theU
rbanH
ouseholdin
theG
AM
A-G
hana
CH
AP
TE
RE
LE
VE
N
11SU
MM
AR
YO
FP
OL
ICY
IMP
LIC
An
ON
S11.1
IntroductionT
heprincipal
purposeo
fthis
reportis
topresent
action-relevantfm
dings,not
tom
akespecific
policyrecom
mendations.
Effective
policiesem
ergefrom
politicalprocesses,
andcannot
bededuced
fromthe
resultso
fa
study.In
anycase,
identifyingand
evaluatingthe
rangeo
foptions
available,and
examining
acoherent
strategy,is
beyondthe
scopeo
fthis
study.E
venat
thisearly
stage,how
ever,it
ispossible
todraw
·some
conclusionsabout
thefonn
anappropriate
strategyw
ouldprobably
take,and
thepriority
problems
which
needto
beaddressed.
Household
environmental
improvem
entis
notsim
plyanother
concernto
beadded
tothe
longw
ish-listo
fany
urbancentre
suchas
GA
MA
.It
iscentral
toim
provingthe
well-being
of
thepopulation.
Previous
chaptershave
describedin
some
detail:
1.T
heserious
deficienciesin
households'environmentalconditions.
2.T
heclose
associationbetw
eena
number
ofthese
deficienciesand
ill-health.
3.T
hedisproportionate
shareo
fthe
environmental
healthburden
borneby
thepoor.
4.T
hehigh
valuepeople
placeon
improvem
ents,despite
severeeconom
icconstraints.
5.T
hecom
mon
perceptionthat
thegovernm
entshould
takethe
leadin
introducingim
provements
ina
number
of
areas.T
akentogether,
theresults
demonstrate
theim
portanceo
fdeveloping
anenvironm
ental-healthstrategy
forA
ccra.B
utperhapsm
oreim
portant,theyindicate
where
them
ostpressing
concernslie,
andcan
helpidentify
opportunitiesand
obstaclesw
hichan
effectivestrategy
mustconfront.
The
following
subsectionsreview
some
of
thepolicy
implications
ineach
problemarea.
The
Chapter
thenconcludes
with
abrief
discussiono
fthe
needto
developan
integratedstrategy
tohousehold
environmental
improvem
ent,and
some
ofthe
ways
inw
hichresearch
couldcom
plementsuch
developments.
11.2W
aterT
hedeficiencies
inthe
water
supplysystem
servinghouseholds
inG
AM
Aare
serious,but
probablyless
seriousthan
inm
osto
fthe
country.O
nlya
minority
of
householdshave
indoorpiping,
butm
ostlive
within
arelatively
shortdistance
of
aw
atertap.
The
qualityo
fthew
ateratthe
tapw
ouldgenerally
seemto
beadequate,
exceptperhaps
inpoor
neighbourhoods.G
AM
Ahouseholds
aredependent
onthe
pipedw
atersystem
,and
cansuffer
considerablyw
henthat
systemfails.
How
ever,such
failuresare
lesso
fa
burdenfor
GA
MA
residentsthan
thechronic
water
qualityand
quantityproblem
salm
ostcertainly
experiencedm
oreseverely
inother
partso
fG
hana.W
ithinG
AM
A,
accessto
water
iscurrently
am
oreserious
problemthan
water
qualityat
thetap.
The
resultsindicate
asignificantim
provement in
healthw
henthe
tapsare
locatedw
ithinthe
housecom
pounds,probably
dueto
thebetter
hygienepractices
easyaccess
tow
aterallow
s.A
lternatively,w
atersupply
interruptionsw
erevery
stronglyassociated
with
healthproblem
s.H
owever,
extendingthe
water

Benneh
etal.111
systemand
increasingthroughput
iscostly.
Given
prevailingeconom
icconditions,
providingall
householdsw
ithin-house
pipingm
ustremain
along
termgoal.
Inthe
medium
term,
providingstandpipes
tocom
poundhousing
unitsm
aybring
almost
equivalenthealth
benefitsat
considerablylow
ercost.
Even
inthe
shortterm
,efforts
toincrease
thew
atersupply
tolow
-income
areasare
warranted:
inaddition
tohealth
improvem
ents,a
greaterw
atersupply
shouldlead
tolow
ervendor
prices.T
heresults
clearlydem
onstratethat
theexisting
systemplaces
thegreatest
healthburden
onpoor
households,w
hoalso
oftenrely
onw
atervendors
andend
uppaying
thehighest
pricesfor
theirw
ater.T
hisis
verym
uchcounter
tothe
government's
intentions,and
deservesspecial
attention.W
hilem
anyvendors
..
chargehigh
pricesfor
water,
effortsto
controlvendors
directlyare
likelyto
becounter-productive.
Ifsanctions
decreasevendor
sales,for
example,
supplyproblem
sw
illbe
exacerbatedand
unofficialw
aterprices
may
actuallyrise.
Itshould
bepossible,
however,
touse
vendorprices
asan
indicatoro
fw
hichlow
incom
eareas
deservespecial
effortsto
increasew
atersupply.
Alternatively,
theexisting
water
tariff,w
hileintending
tobe
progressive,discrim
inatesagainst
householdsw
hichshare
water
connections.H
ighprices
arecharged
tolarge
consumers,
bothin
orderto
preventprofligate
water
use,and
becauselarge
consumers
areconsidered
wealthy.
When
severalhouseholds
sharea
meter,
however,
theycan
easilyhave
highm
eterreadings
despitea
lowper-household
consumption.
There
area
number
of
possiblem
eanso
fredressing
thisproblem
,ranging
fromarea-based
pricingto
formal
recognitiono
fsharedm
eters.A
largeshare
of
thew
atersam
plestaken
fromw
aterstorage
containersshow
edevidence
of
faecalcontam
ination.T
hisreflects
boththe
water
supplyproblem
sw
hichnecessitate
considerablein-house
storage,and
hygieneproblem
s(see
sub-sectionon
hygienebelow
).Households
usingpots
tostore
theirw
aterhad
asignificantly
higherlevel
of
childhooddiarrhoea.
While
itshould
notbe
assumed
thatstorage
inpots
isthe
causeo
fthis
ill-health,further
investigationis
clearlyw
arranted.S
houldpots
proveto
beleading
tow
atercontam
ination,there
area
number
ofrelatively
low-costpolicy
measures
which
couldbe
taken.
11.3Sanitation
an
dH
ygieneA
lleviatingthe
householdsanitation
problems
of
GA
MA
isclearly
apriority.
The
technologyprofile
may
lookrelatively
favourable,w
itha
comparatively
highshare
of
households(36%
)using
flushtoilets
andfew
(3%)
without
accessto
anytoilet
facilitiesat
all.H
owever,
fora
largesegm
ento
fthe
population,the
extreme
levelo
fcrow
dingnegates
anytechnological
advantageover
lessurbanised
settings.A
lmost
halfo
fthe
householdsshared
toiletfacilities
with
atleast
tenother
households.M
anycom
plainedthat
thequeues
fortheir
toiletsw
eresom
etimes
solong
asto
renderthem
unusable.In
additionto
causingunhygenic
conditionsin
thetoilets
themselves,
over-crowding
of
existingfacilities
leadsto
opendefecation,
which
isitselfan
importantpublic
healthhazard
inG
AM
A.
Indeedboth
thesharing
of
toiletsand
opendefecation
byneighbourhood
childrenw
erefound
tobe
closelyassociated
with
higherdiarrhoeal
prevalenceam
ongchildren.
Given
theseconditions,
increasingthe
quantityo
ftoilet
facilitiesavailable
isprobably
more
criticalto
publichealth
thanintroducing
improved
technologies.O
wing
tothe
comm
unalcharacter
of
alarge
shareo
fthe
facilities,the
government
andcom
munity
groupsare
alreadyinvolved
indeterm
iningthe
quantityo
ffacilities
available.M
osthouseholds
interviewed
feltthat
thegovernm
entneeds
totake
thelead
insanitation
improvem
ents,though
asignificant
sharefelt
actionat
the

112E
nvironmental
Problem
sand
theU
rbanH
ouseholdin
theG
AM
A-G
hana
neighbourhoodlevel
was
more
critical.U
ltimately,
thesuccessful
provisionand
operationo
fcom
munal
toiletsdepends
oneffective
collaborationo
fgovernm
ent(e.g.
theW
asteM
anagementD
epartment)
andlocal
groups.Identifying
additionalsources
of
fundsfor
expandingsanitation
provisionis
itselfa-priority.
The
pricingo
fcom
munity
toiletsis
relativelyhigh,
giventhe
lowincom
eso
fm
ostusers.
Insom
ecom
munities
chargeson
usingthe
toiletsare
employed
tohelp
financeother
environmental
clean-upactivities.
There
islittle
evidencethat
thesehigh
chargesare
anim
portantfactorin
dissuadingpeople
fromusing
toilets(people
were
more
likelyto
citethe
lengtho
fthe
queuesor
toiletsbeing
outo
forder
orclosed).
How
ever,given
theinsufficient
supplyo
fsanitary
facilities,the
diversiono
ffunds
which
couldbe
usedto
expandsupplies
isa
matter
of
concern.It
amounts
toa
taxon
aservice
which
providespublic
benefits,and
economics
suggestsshould
bepartially
fmanced
throughother
taxesor
publicrevenues.
More
generally,the
difficultiesencountered
atthe
locallevel
infunding
sanitationim
provementreflect
anunderlying
obstacleto
comm
unityenvironm
entalm
anagement.
User
chargesalone
cannotprovide
anefficient
means
of
fmancing
allenvironm
entalservices,letalone
environmental
improvem
entsnot
linkedto
servicedelivery.
Yet
fewcom
munities
havethe
capacityto
raisesubstantial
fundsthrough
otherm
eans.T
heresults
alsoindicate
thatgood
hygienebehaviour
isassociated
with
appreciablybetter
health.H
owever,
while
thegovernm
entis
directlyinvolved
inproviding
water
andsanitation
facilities,it
cannotprescribe
hygienebehaviour.
Moreover,
theresults
suggestthat
hygienebehaviour
isclosely
linkedto
theprovision
of
water
andsanitation
facilities,and
more
generallyeconom
icconstraints.T
hem
ostobviousdifference
between
thesituation
inpoor
andw
ealthyhouseholds
isnot
thatw
ealthyhouseholds
arem
oreaw
areo
fgood
hygienepractices,
butthat
theyhave
facilitiesw
hichm
akegood
hygienepractice
comparatively
simple.
Itis
oftennoted
thatw
aterand
sanitationim
provements
canfail
when
hygienepractices
remain
thesam
e.T
hereverse
isequally
true:education
andaw
arenessprograinm
esare
farm
orelikely
tobe
effectiveif
accompanied
byim
provedenvironm
entalservices.
11.4Solid
Waste
Accum
ulationso
fsolid
waste
createproblem
sat
thefm
aldisposal
sites,at
neighbourhooddum
pingsites,
andeven
within
people'shom
es.Financially
precariouscities
typicallyhave
difficultiesm
aintainingan
efficientw
astedisposal
system,
andA
ccrais
noexception.
With
Ghana's
economic
difficultiesin
thelate
70sand
early80s,
thew
astem
anagement
systemfell
intocrisis.
More
recently,som
eo
fthe
deficiencieshave
beenredressed,
butthe
Waste
Managem
entD
epartment
canstill
onlycollect
abouttw
othirds
of
thew
astegenerated,
andexisting
disposalsites
arealready
overused.O
nlyabout
10%o
fhouseholds
havehom
e-collection,andincom
pletecollection
typicallyleads
tolocal
accumulations
of
waste,
especiallyin
relativelypoor
neighbourhoods.Problem
sw
ithw
astestorage
within
peopleshom
esare
relativelyindependento
fthew
astecollection
system,but
canaffect
theindoor
environment.
The
surveyresults
indicate,for
example,
thatopen
storageo
fw
astew
ithinthe
homes
isassociated
with
ahigher
prevalenceof
insectsand
rodents.W
hilesolid
waste
problems
arenot
apriority
healthconcern,
therespondents
clearlyfelt
improvem
entsw
ereneeded,
andw
ereinclined
toidentify
thegovernm
entas
thekey
actor.A
lso,there
were
indicationsthat
while
peoplem
ay

Benneh
etai.113
notw
antto
payfor
apoor
service,they
arew
illingto
paysignificant
sums
forgood
service.A
sw
ithsanitation,
many
localgroups
arealready
somew
hatinvolved
insolid
waste
managem
ent,and
probablydeserve
more
support.S
uccessfullocal
managem
entcan
easilybe
inhibitedby
institutionalobstacles.
Unlike
comm
unaltoilets,
itis
difficultto
chargefor
comm
unalsolid
waste
managem
ent.Y
etlocal
groupsm
usthave
areliable
means
of
raisingfunds
iftheyare
toplay
anim
portantrole
overthe
longterm
.E
quallyim
portantis
areliable
municipal
waste
collectionservice,
anda
goodinterface
between
thecollection
serviceand
thelocal
managem
entsystem
.It
isdifficult
toenvisage
major
improvem
entsin
thesolid
waste
situationw
ithoutincreasing
thecollection
anddisposal
(and/orrecycling)
capacity.
11.5P
estsan
dP
esticidesInsects,
andespecially
malarial
mosquitoes,
areundoubtedly
am
ajorhealth
riskfor
GA
MA
residents.M
alariais
theprincipal
healthproblem
reportedby
out-patientclinics.
Fliesare
aknow
nhealth
risk,especially
when
sanitaryconditions
arepoor,
andstrong
associationsw
erefound
between
thepresence
of
fliesin
thekitchen
andhealth
problems
among
children.F
urthermore
,the
resultsindicate
thatim
provedinsectcontrol
isa
priorityam
ongthe
householdsthem
selves.U
rbanareas
generallyhave
acom
parativeadvantage
inm
alariacontrol,
asm
alarialspecies
arerelatively
poorlysuited
tourban
conditions.H
owever,
while
householdsspend
considerablesum
son
chemical
mosquito
control,relatively
littlehas
beendone
toexploit
GA
MA
'surban
advantagethrough
environmental
managem
ent.F
roma
householdperspective,
anem
phasison
chemical
controlis
understandable.It
isdifficult
forindividual
householdsto
identify,let
aloneelim
inate,breeding
sites.F
urthermore,
insecticidesand
insectrepellents
clearlytarget
themo~quitoes
threateningthe
householditself,
while
environmental
managem
entdoes
not.A
sa
result,effective
environmental
managem
entfor
mosquito
controlalm
ostinevitablyrequires
publicsector
support.C
hemical
insectcontrol
canitself
createenvironm
entalproblem
sand
healthrisks.
Associations
were
foundbetw
eenthe
useo
fm
osquitocoils
andthe
prevalenceo
frespiratory
illnessam
ongchildren,
andbetw
eenthe
useo
fpum
pspray
insecticidesand
theprevalence
of
respiratoryproblem
symptom
sam
ongfem
aleprincipal
homem
akers.W
hilethese
fmdings
shouldbe
interpretedw
ithcare,
thepossibility
thatcurrent
methods
of
insectcontrolare
contributingto
respiratoryproblem
sdoes
indicateanother
advantageo
fenvironm
entalm
anagement.
While
mosquito
controlthrough
improved
environmental
managem
entoften
hasbenefits
overand
abovea
declinein
malaria
prevalence,chem
icalcontrol
islikely
tohave
damaging
side-effects.T
hisis
notto
say,how
ever,that
chemical
controlshould
beuniversally
condemned.
Indeed,it
iscritical
todistinguish
between
differenttypes
of
chemical
control,and
differentiatebetw
eenthose
which
yieldan
acceptablerisk
andthose
which
donot.
An
effectiveprogram
me
of
mosquito
controlthrough
environmental
managem
entw
illrequire
farm
oreinform
ationthan
couldbe
collectedor
reviewed
inthe
courseo
fthis
study.The
newinsights
thatcan
bederived
fromthis
studyare
limited
byinherent
inaccuraciesin
self-reportedm
alariaprevalence,
andthe
lacko
finform
ationon
differentm
osquitospecies.
Past
studiesindicate
thatsom
em
alarialspecies
arebecom
ingbetter
adaptedto
breedingin,for
example,A
ccra'shousehold
water
storagecontainers.
The
resultso
fthis
studyindicated
asom
ewhat
higher

114E
nvironmental
Problem
sand
theU
rbanH
ouseholdin
theG
AM
A-G
hana
levelo
fm
osquitobiting
inhouseholds
storingtheir
water
indoors.T
heseresults
indicatethe
potentialim
portanceo
fcollecting
information
onm
osquitobreeding
andbiting
inA
ccra,but
onlybegin
toansw
era
number
ofcritical
questionsrelevant
toenvironm
entalm
anagement.
Fliesm
aynot
posea
healthhazard
comparable
tom
alaria,but
areim
portantdisease
vectorsnonetheless.
Fliesare
bothfilth-feeders
andfilth-breeders.
They
arem
echanicalcarriers
of
disease,and
posea
particularrisk
when
regularlyin
contactw
ithboth
human
faecalm
aterialand
food.T
hepresence
of
many
fliesin
thekitchen
was
foundto
beassociated
with
ahigher
prevalenceo
fchildhood
diarrhoea.H
owever,
them
ostobvious
means
todecrease
therisk
of
foodcontam
inationfrom
fliesare
improvem
entsin
sanitation,solid
waste
disposaland
foodhandling.
People
shouldbe
made
aware
of
thedangers
fliespose,
butthere
islittle
pointindesigning
policiestargeting
fliesin
particular.
11.6F
oodC
ontamination
The
contributiono
fmicrobial
foodcontam
inationto
ill-healthis
difficulttodiscern,
butcould
beconsiderable.
Three
of
thevariables
foundto
beassociated
with
ahigher
diarrhoeaprevalence
may
reflectfoodcontam
inationproblem
s:the
presenceo
fflies
inkitchens;
notalw
aysw
ashinghands
priorto
foodpreparation;
frequentingprepared-food
vendors.P
opularperceptions
clearlylin
kfood
toillness,
andalm
osthalf o
fthe
questionnairerespondents
whose
childrenhad
haddiarrhoea
identifiedbad
foodas
aprobable
cause.(F
oodeaten
out,rather
thanfood
preparedat
home,
was
typicallyblam
ed,how
ever).W
hileit
isunlikely
thatanything
likehalf
of
thediarrhoea
casesare
theresult
of
eatingcontam
inatedfood,
theresults
areconsistent
with
thenotion
thatfood
isone
ofthe
more
comm
onroutes
throughw
hich"w
aterdiseases"
arecontracted.
Unfortunately,
itis
difficultto
designpolicies
toim
provefood
handlingpractices.
Better
water,
sanitationand
solidw
astedisposal
arelikely
tohelp.Im
provedhygiene
educationis
possible.G
overnment
regulationo
fsm
allfood
vendors,however,is
likelyto
beineffective
andpossibly
counterproductive.O
nthe
otherhand,
some
localgroups
arealready
actingto
improve
thehygiene
of
foodvendors
intheir
neighbourhoods.Providing
supportfor
theselocal
activitiescould
wellbe
oneo
fthem
osteffectivem
eansofim
provingfood
qualitydirectly.
11.7H
ouseholdA
irP
ollutionC
ookingw
ithcharcoal
orfirew
ood,and
especiallythe
latter,gives
riseto
potentiallydam
aginglevels
of
pollutionexposure.
How
ever,conditions
areprobably
worse
inother
partso
fthe
country,w
herew
oodis
thepredom
inantcooking
fuel.W
ithinG
AM
Am
ostofthehouseholds
relyingprim
arilyon
wood
livein
therural
fringe,and
itisthere
thatexposureto
particulatesfrom
cookingfires
islikely
tobe
highest.In
some
circumstances,
however,
urbancrow
dingm
aylead
tocooking
indoorsin
small
poorlyventilated
rooms.
Inhouseholds
where
cookingw
asalw
aysdone
indoors,both
wom
en'sand
children'srespiratory
problems
were
more
comm
on,and
children'srespiratory
problems
were
alsom
orecom
mon
when
theyw
ereoften
presentduringcooking.
Prom
otingthe
increaseduse
of
LP
Gor
electricityfor
cookingw
ouldreduce
exposuream
onghouseholds
which
switched
tothese
fuels.H
owever,
subsidieslarge
enoughto
influencefuel
choiceare
likelyto
bevery
costly.M
oreover,the
healthbenefits
will
almost
inevitablyaccrue
primarily
tothe
relativelyw
ell-off.E
venif
theshare
of
householdsusing
LP
Gor
electricityas
theirprincipal
fuel

Benneh
etal.115
couldbe
trebledthrough
subsidiesm
ostpoorhouseholds
would
stillbeusing
wood
andcharcoal.A
tleastin
theshort
term,
improved
cookingpractices,
possiblyin
conjunctionw
ithim
provedstoves,
areo
fm
orerelevance
tothe
poorm
ajority.H
owever,
theresults
suggestthan
many
wom
enare
notconcerned
aboutexposure
tosm
okefrom
cookingfIres.
There
islittle
pointin
advocatingm
easuresto
reducesm
okeexposure
topeople
who
donot
perceivesm
oketo
bea
signifIcantproblem
.M
orethan
with
thehousehold
environmental
problems
examined,
educationshould
becentral
toany
seriousefforts
tocurb
smoke
exposure.S
uchinform
ationcould
beintegrated
intocam
paignsagainstsm
okingcigarettes.
11.8A
nIntegrated
Environm
entalStrategyA
successfulenvironm
entalstrategy
forG
AM
Am
ustcom
eto
terms
with
boththe
verysevere
environmental
problems
peopleface
intheir
homes
andneighbourhoods
andalso
city-wide
environmental
degradationand
theregional
impact
of
developments
inG
AM
A.
Itw
ouldbe
economically
inappropriateand
fmancially
infeasibleto
implem
enta
traditionalinfrastructure
programfor
GA
MA
onthe
scaleneeded
toaddress
allhousehold-level
problems,
evendisregarding
thebroader
environmentalim
plicationso
fsuch
anapproach.
On
theother
hand,partial
measures,
slowly
extendingthe
coverageo
fgood
qualityenvironm
entalservices,
riskfavouring
therelatively
well-off.
Itis
thereforecritical
toidentify
means
toassist
thepoor
majority,
who
will
nothave
indoorpiping,
individualtoilets,
or
householdw
astecollection
inthe
nearfuture.
.E
conomic
austeritym
akesit
allthe
more
important
thatpolicy
actionrespond
tolocal
prioritiesand
bebased
onthe
bestinform
ationavailable.
Under
existingconditions,
itis
notenough
forpolicy
analyststo
identifyserious
problems
andrecom
mend
actions.T
hegovernm
entcannotaffordto
takeon
allserious
problems.
DiffIcult
choiceshave
tobe
made.
The
perceptionsand
prioritieso
flocal
residentscan
helpguide
policydevelopm
ent.Inform
ationon
existingconditions
andhealth
riskscan
alsohelp
ensurethatim
provementefforts
arew
elltargeted.
With
tightconstraints
ongovernm
entexpenditures,
itis
alsoim
portantthat
environmental
strategiestake
fullaccount
of
non-governmental
institutions,and
theirpotential
rolein
environmentalm
anagement.
As
indicatedin
Chapter
10,thereare
aw
iderange
of
localinstitutions
working
with
varyingdegrees
of
successin
GA
MA
.T
hem
oresuccessful
examples
receivedat
leastsom
edegree
of
externalsupport.
Assisting
theseinterm
ediateinstitutions,
bothinstitutionally
andfm
ancially,is
oftenlikely
tobe
more
cost-effectivethan
simply
expendingresources
oninfrastructure
development.
Itshould
alsobe
keptin
mind,
however,
thatespecially
inrelatively
poorareas,
integratedim
provement
effortsare
more
likelyto
beeffective
thana
serieso
findependent
interventions.Physically,
theproblem
sare
closelyinterrelated.
Sanitation,w
ater,hygiene
andfood
contamination
problems
areso
intertwined
thattheir
bordersare
difficultto
defIne,and
most
problemareas
haveat
leastsom
einterconnections.
Refuse
canbe
abreeding
groundfor
flies,w
hichthen
leadto
foodcontam
ination.W
ater,including
householdw
aterstorage
containers,can
bea
breedingsite
form
alarialm
osquitoes.C
hangesin
cookinghabits
may
notonly
affectfood
contamination,
butalso
smoke
exposure.G
iventhese
closeinterrelations,
itiscritical
thatimprovem
entsbe
complem
entary.T
akentogether,
allo
fthese
considerationspoint
tothe
needfor
anintegrated
strategyfor
environmental
managem
entinG
AM
A.
The
problems
aretoo
severeto

116E
nvironmental
Problem
sand
theU
rbanH
ouseholdin
theG
AM
A-G
hana
beignored.
Econom
icand
fmancial
conditionspreclude
administratively
simple,
high-costsolutions.
Th
einstitutional
contextprovides
arange
of
opportunities,but
anum
bero
fco-ordination
andco-operation
problems.
Th
ephysical
interrelationspose
adifferent
seto
fco-ordination
problems
andopportunities.
Only
acoherent
strategycan
holdout
thehope
of
weaving
togetherthe
threadsin
thisw
eb.T
hisreport
hasonly
begunto
tapthe
policyrelevant
information
which
hasbeen
collectedin
thecourse
of
thisstudy.
There
areim
portantpolicy-related
issuesregarding
environmental
serviceprovision,
housetenure,
settlement
planning,gender
andepidem
iology,m
anyo
fw
hichcould
beexplored
with
thehelp
of
thedata
baseem
ployedhere.
Ina
fewareas,
thestatistical
associationspresented
needto
befollow
edup
with
more
detailedphysical
evaluations.The
associationbetw
eenpum
p-spraypesticides
andrespiratory
problems
isa
casein
point:there
isnot
enoughevidence
tocondem
nthese
insecticidesoutright,
thoughthere
ism
orethan
enoughto
justifya
carefulinvestigation
of
thechem
icalsand
practicesinvolved.
Perhaps
more
important
thanthese
extensions,how
ever,the
resultscould
beem
ployedin
thepolicy
development
processitself. It
would
bepossible
todevelop
aset
of
environmental
healthindicators
\yhichcould
beused
tohelp
monitor
endemic
environmental
healthhazards,
andsupport
targetedpolicies
designedto
improve
conditionsin
criticalareas.
Alternatively,
theresults
couldprovide
criticalinput
toevaluations
of
particularoptions,
suchas
investments
inim
provedsanitation
facilitieso
renvironm
entalcontrol
of
malarial
mosquitoes.
Inshort,
thisreport
neednot
beseen
asthe
end-producto
fa
researchproject
-it
couldalso
bethe
startingpoint
forrenew
edefforts
toim
provethe
environmental
conditionsfor
thepeople
of
GA
MA
.

RE
FE
RE
NC
ES
Benneh
etal.117
AM
A1991.D
epartmento
fHealth
AnnualR
eport.Accra
Metropolitan
Assem
bly,A
ccra.A
ccraP
lanningD
evelopmentP
rogramm
e,UN
DP
,HA
BIT
AT
.1992.
StrategicP
lan
for
theG
reaterA
ccraM
etropolitanA
rea.Volum
e1
(Draft).
Accra.
Agbodaze,D
.and
C.B
.O
wusu.
1989.Cockroaches
(Periplaneta
Am
ericana)as
carriersorbacterial
diarrhoeain
Accra,G
hana.C
entralAfrican
Journalo
fM
edicine35:484-486.
AltafA
,H
.Jam
aland
D.W
hittington.1992.
Willingness
toP
ayfo
rW
aterin
RuralP
unjab,P
akistan.Water
andS
anitationR
eport4.UN
DP
-World
Bank
Water
andS
anitationP
rogram.W
orldB
ank,Washington,D
C.
Am
uzu,AT
.and
J.Leitm
ann.1992
(Draft).
Environm
entalProfile
ofA
ccraC
aseStudy.
Prepared
forthe
Urban
Managem
entandE
nvironmental
Com
ponento
ftheU
ND
P/W
orldB
anklUN
CH
SU
rbanM
anagementP
rogramm
e.A
PH
A1985.
StandardM
ethodsfo
rthe
Exam
inationo
fWater
an
dW
astewater.
Am
ericanP
ublicH
ealthA
ssociation,Washington,D
C.
Arm
itage,P.and
G.
Berry.
1987.StatisticalM
ethodsin
Medical
Research
(2ndedition).B
lackwellS
cientificPublications,O
xford.B
enneh,G.,J.S.
Nabila,J.
Songsore,
P.W
.KY
anksonand
T.
Teklu
(eds.).1990.
Dem
ographicstudies
an
dP
rojectionsfor
Accra
Metrooplitan
Area.Final
Report,H
AB
ITA
T/A
ccraP
lanningand
Developm
entProgram
me,
Accra.
Bennan,S.
1991.Epidem
iologyo
fAcute
Respiratory
Infectionsin
Children
inD
evelopingC
ountries.R
eviewo
fInfectiousD
iseases13
(Suppl
6):S
454462.
Bradley,
D.,S.
Cairncross,T
.H
arphamand
C.
Stephens.
1991.AR
eviewo
fE
nvironmentalH
ealthIm
pactsin
Developm
entC
ountryC
ities.D
iscussionP
aper.U
rbanM
anagementP
rogram.W
orldB
ank,U
ND
P,U
NC
HS
.C
airncross,S.
1990.Water
Supply
andthe
Urban
Poor.In
Caim
cross,S.
etal
(eds).T
heP
oo
rD
ieY
oung:H
ousinga
nd
Health
inthe
Third
World,
Earthscan,L
ondon.C
hen,B.H
.,C.J.
Hong,M
.R.
Pandey
andK
R.
Smith.
1990.Indoorair
pollutionin
developingcountries.
World
Health
StatisticsQ
uarterly43:127-138.
Chinery,W
.A1969.A
Survey
ofm
osquitobreeding
inA
ccra,Ghana
duringa
two
yearperiod
oflarval
mosquito
control.G
hanaM
edicalJournal
8:475-488.C
hinery,W.A
1984.Effects
ofecologicalchanges
onm
alariavectors
Anopheles
funestusand
theA
nophelesgam
biaecom
plexo
fmosquitoes
inA
ccra,G
hana.JournalofT
ropicalMedicine
an
dH
ygiene87:75-81.
Dickson,K
B.
1969.AH
istoricalG
eographyo
fGhana.C
ambridge
University
Press,C
ambridge.
Ellegard,
Aand
H.
Egneus.
1992.Health
Effects
ofC
harcoala
nd
Wo
od
Fuel
usein
Lo
wIncom
eH
ouseholdsin
Lusaka.S
tockholmE
nvironmentInstitute,
Stockholm
.E
llegard,1993.H
ouseholdE
nergya
nd
Health
Issuesin
Maputo
(forthcoming).
Stockholm
Environm
entInstitute,S
tockholm.
Environm
entalM
anagementA
ssociatesL
td.1989.E
nvironmentalstudy
ofA
ccraM
etropolitanA
rea.S
tudyprepared
forH
AB
ITA
Tand
Accra
Planning
andD
evelopmentP
rogramm
e.A
ccra.

118E
nvironmentalP
roblems
andthe
Urban
Household
inthe
GA
MA
-Ghana
Esrey,S
.A.,R
G.
Feachem
andJ.M
.H
ughes.1985.
Interventionsfor
thecontrol
of
diarrhoealdiseases
among
youngchildren:
improving
water
suppliesand
excretadisposal
facilities.B
ulletino
ftheW
orldH
ealthO
rganisation63:
757-772.E
srey,S.A
.and
J.P.H
abicht.1986.E
pidemiological
evidencefor
healthbenefits
fromim
provedw
aterand
sanitationin
developingcountries.
Epidem
iol.rev.
8:117-28.G
hanaG
overnment.
1991.Ministry
ofH
ealthA
nnualReport1987
-19
90
for
Greater
Accra
Region.
Accra.
Graham
,N.1990.T
heepidem
iologyo
facuterespiratory
infectionsin
childrenand
adults:A
globalperspective.E
pidemiologic
Review
s12:149-178.
Hardoy,
J.E.,D
.M
itlinand
D.
Satterthw
aite.1992.
Environm
entalProblem
sin
Third
World
Cities.
Earthscan,L
ondon.H
ousingand
Urban
Developm
entAssociates.
1990.H
ousingN
eedsA
ssessment
Study.V
ol.I,II
andm
.S
tudyprepared
forH
abitatandA
ccraP
lanningand
Developm
entProgram
me,K
umasi.
Jebuni,C
.D., W
.KS
owa
andK
A.
Tutu.
1991.E
xchangeR
ateP
olicyand
Macroeconom
icP
erformance
inG
hana.A
ER
CR
esearchP
aper6.
Kenner,E
.E.
1978.F
aecalS
treptococciIndicators.In
Berg,G
.(ed.),Indicators
of
Viruses
inW
atera
nd
Food.
Ann
Arbor,M
ichigan,USA
.K
irkwood,
B.
1991.A
cuteR
espiratoryInfections.In
RD
.F
eachamand
D.T
.Jam
eson.D
iseasea
nd
Mortality
inSubsaharan
Africa.O
xfordU
niversityP
ress,Oxford.
Klaassen,C
.D.
1985.Principles
ofT
oxicology.In
Gilm
an,A.G
.et
al.(eds.)
TheP
harmacologicalB
asiso
fTherapeutics.
7thed..M
acmillan,N
ewY
ork.L
indskog,P.
andJ.
Lundquist.
1990.W
hyP
oorP
eopleStay
Sick:The
Hum
anE
cologyo
fChild
Health
an
dW
elfarein
RuralM
alawi.
Research
Report
No.
85.S
candinavianInstitute
ofA
fricanS
tudies,Uppsala.
McG
ranahan,G.
1991.E
nvironmentalP
roblems
an
dthe
Urban
Household
Inthe
Third
World
Countries.
Stockholm
Environm
entInstitute,Stockholm
.M
cGranahan,
G.
andA
.K
aiser.1993.H
ouseholdE
nergy:P
roblems,
Policies
an
dP
rospects.S
tockholmE
nvironmentInstitute,S
tockholm.
Mitchell,R
C.
andR
T.
Carson.
1989.U
singSurveys
toV
alueP
ublicG
oods:The
Contingent
Valuation
Method.
Resources
forthe
Future.W
ashington,D
C.
Plan
Consult.
1989.E
mploym
entandE
conomic
Characteristics
(oftheA
ccraM
etropolitanA
rea).F
inalReport.
Accra.
Sm
ith,K
R1987.
Biofuels,
Air
Pollution
andH
ealth:A
GlobalR
eview.P
lenumP
ress,New
York.
Sm
ith,K
1993.Fuel
Com
bustion,Air
Pollution,
andH
ealth:T
heS
ituationin
Developing
Countries.
InA
nnualReview
ofE
nergyand
Environm
ent18:529-66.
Songsore,
J.1992.
Review
ofH
ouseholdE
nvironmentalproblem
sin
theA
MA
,G
hana.Working
Paper.
Stockholm
Environm
entInstitute,Stockholm
.S
ongsore,J.
(Inpress).T
heU
rbanH
ousingC
risisin
Ghana:C
apital,theS
tateversus
theP
eople.G
hanaSocial
ScienceJournal.
Stren,
RE
.1989.
Urban
LocalG
overnmentin
Africa.In
RS
trenand
RW
hite(eds.).
African
Cities
inC
risis:M
anagingR
apidU
rbanG
rowth.
Westview
Press.

Benneh
etal.119
Tahal
(Consulting
Engineers
&A
rchitectural&
Engineering
Services
Corporation).
1981.Accra-T
ema
Water
Supplya
nd
Sewerage
Pro
jectR
eviewo
fMaster
Plan.
FinalR
eportVol.
2.Accra.
UN
EP
IWH
O.
1988.Assessm
entofU
rbanA
irQ
uality.GlobalE
nvironmentM
onitoring
System.
United
Nations
Environm
entProgram
,World
Health
Organization,N
airobi.V
anDerslice,J.
andJ.
Briscoe.
1993.All
colifonnsare
notcreatedequal:
Acom
parisono
fthe
effectso
fwater
sourceand
in-housew
atercontam
inationon
infantilediarrheal
disease.W
aterR
esourcesR
esearch.29:1965-1974.
Wellburn,A
.1988.A
irP
ollutiona
nd
Acid
Rain.L
ongman,H
arlow,
UK
.W
hiteR
R1989.T
heInfluence
ofE
nvironmental
andE
conomic
Factors
inthe
Urban
Crisis.In
RS
trenand
RW
hite(eds).
African
Cities
inC
risis:M
anagingR
apidU
rbanG
rowth.
Westview
Press,B
oulder.W
hittingtonD
, J.B
riscoe,Mu
Xinm
ingand
W.
Banon.
1990.Estim
atingT
heW
illingnessto
Pay
forW
aterS
ervicesin
Developing
Countries:
Acase
studyo
fthe
useo
fcontingentvaluationsurveys
insouthern
Haiti.
Econom
icD
evelqpmenta
nd
Cultural
Change
38:293-312.W
HO
.1984.
Gu
idelin
esfor
Drinking
Water
Quality.
World
Health
Organization,
Geneva.
WH
O.
1988a.U
rbanV
ectorP
estC
ontrol,Technical
ReportS
eriesN
o.767,
WH
O,
Geneva.

120E
nvironmentalP
roblems
andthe
Urban
Household
inthe
GA
MA
-Ghana
AP
PE
ND
IX1
Sam
plin
gP
rocedurefor
Questionnaire
SurveyT
hefIrst
orderstratifIcation
isdescribed
inthe
introductorychapter
of
thisreport.
The
selectiono
fneighbourhoods
tobe
sampled
fromeach
strataw
asa
modifIcation
ofthe
listemployed
inthe
Housing
Needs
Assessm
entStudy(H
ousingand
Urban
Developm
entAssociates,
1990).T
headditions
arestarred
inT
able1.6.
andare
intendedto
reflectthe
recentextensiono
ftheboundary
of
GA
MA
,and
theaddition
of
therural
peripherycategory.
For
Accra,
25o
fthe
52neighbourhoods
arerepresented,
forT
ema
8o
fthe
22neighbourhoods
arerepresented,
andfor
Ga
7o
fthe20
neighbourhoodsare
represented..
The
sample
was
apportionedam
ongA
ccra,T
ema,
andG
adistricts
soas
toreflect
theapproxim
aterelative
populationshares
ofthese
districts,·asestim
atedfor
1992(B
ennehet
al,1990).
Within
thestrata
of
eachdistrict,
thesam
plew
asapportioned
among
neighbourhoodsin
thesam
eproportions
asin
theH
ousingN
eedsA
ssessment
Study,except
forthe
newly
addedneighbourhoods
(i.e.those
starredin
Table
1.6).T
hesam
plesize
inthe
newly
addedneighbourhoods
reflectsthe
relativeshare
of
GA
MA
'spopulation
inG
aand
Tem
adistricts,
andthe
estimated
5%o
fG
AM
A's
populationliving
inthe
Rural
Periphery.T
heresulting
sample
sizein
eachneighbourhood
isgiven
inT
able1.6.
Within
theneighbourhoods,
clustersaveraging
fivehouseholds
were
selected.T
ocreate
theseclusters,
blockso
fan
estimated
onehundred
householdsfor
highdensity
areasand
fIftyhouseholds
forlow
densityareas
were
selectedw
ithinthe
neighbourhoods,the
number
of
blocksin
eachneighbourhood
beingindicated
inT
able1.6.
The
selectiono
fblocks
was
basedon
areconnaissance
of
thesupervisors.
(Ideally,the
blocksw
ouldbe
basedon
arandom
orstratifIed
sample
of
enumeration
areasfrom
theG
hanaStatistical
Office.
Sucha
procedurew
ouldpose
seriouslogistical
problems,
however).
During
theirreconnaissance
thesupervisors
identifIedthe
principaltypes
of
residentialareas
inthe
neighbourhood,estim
atedroughly
theshare
of
householdsliving
inthe
differentresidential
types,and
apportionedthe
blocksto
reflectthese
shares,and
alsoto
ensurethat
areasoff
them
ainroads
ando
fhighdensity
areadequately
represented.H
avingbeen
shown
theblocks,
theinterview
ersselected
householdsto
interviewby
systematically
walking
throughthe
blockand
interviewing
everytw
entieth(or
tenth)household.
The
interviews
were
doneat
times
when
peoplew
erenot
generallyw
orking,so
asto
avoida
biasagainst
householdsw
hereinthe
principalw
oman
works.
Ifthe
principalhom
emaker
was
nothom
e,the
surveyorcontinued
with
thenext
household,returning
laterto
attempt
aninterview
again.O
nlyafter
therest
of
thehousehold
interviews
inthe
blockhave
beencom
pleteddid
theinterview
erlook
fora
replacement
household(a
neighbouringhousehold).
Households
which
refusedto
beinterview
edw
erereplaced
imm
ediately.A
codew
asincluded
inthe
surveyto
ensurethatreplacem
enthouseholdscan
beidentifIed.

Benneh
etal.
Ta
ble
1:L
isting
ofN
eig
hb
ou
rho
od
sS
urveyed.
121
Ne
igh
bo
urh
oo
d
11O
su(A
)
12Jam
esT
own
(A)
13Labadi(A
)
Su
b-to
tal
HO
IS
21A
irportR
esidential(A)
22R
oman
Ridge
(A)
23R
ingway
Estate
(A)
24N
.Labone
Estate(A
)
Su
b-to
tal
LO
HC
S
31A
chimota
(A)
32T
esano(A
)33
Asylum
Dow
n(A
)34
Cantonm
ents(A
)
Su
b-to
tal
MO
MC
S
41D
ansoman
Estate
(A)
42K
aneshieE
state(A
)43
S.
Odorkor
(A)
44N
.T
eshieE
state(A
)45
Tem
aC
.4
&9
(T)
Su
b-to
tal
LO
MC
S
51S
portsC
.A
rea(A
)52
E.
LegonE
xtension(A
)53
Adenta
(T)
54H
aatcho(G
)
Su
b-to
tal
LO
NO
S
61M
ataheko(A
)62
Mam
probi(A
)63
Darkum
an(A
)64
Abeka
(A)
65*A
masam
an(G
)
66*K
po
ne
(nS
ub
-tota
lM
OIS
71S
abonZ
ongo(A
)72
Accra
New
Tow
n(A
)73
Nim
a(A
)74
Maam
obi(A
)75
Madina
(G)
76T
ema
New
Tow
n(T)
nA
shiaman
(T)
78*T
ema
C.
2(T
)
Su
b-to
tal
HO
LC
S
81*O
ldA
shalebotwe
(T)
82*D
anfa(G
)83
*Oyarifa
(G)
84*A
fienya(T)
85*O
ldO
fankor(G
)
Su
b-to
tal
RF
TO
TA
L
Sa
mp
leS
ize
70703017055552015151010502515202525110155553
0202035201010115806550808035353045510101010105
0
1000
No
.o
fB
locks
141463411114332210534552231116447422231613101616776912222210
200
NB
:A
=A
ccraD
istrict;T
=T
ema
District;
G=
Ga
District.

122E
nvironmental
Problem
sa
nd
theU
rbanH
ouseholdin
theG
AM
A-G
hana
AP
PE
ND
IX2
Methodology
forA
ssessmento
fWater
Quality
1M
aterialan
dm
ethodsH
ouseholdlocation
andw
atersam
plingusually
startedin
them
orningat
about0900hrs
andsom
etimes
endedatabout
1800hrs. An
averageo
fabout
7-10sam
ples.w
erecollected
aday.
Inthe
varioushouseholds,
thedrinking
water
sourcew
asfIrst
identifIedand
thequestionnaire
was
laterrun.
Paired
samples
ofw
atersource
andstored
water
were
taken.H
owever,
ifnorunning
water
sourcew
asavailable,
thensingle
storedw
atersam
plesw
eretaken.
Som
ehouseholds
didnot
havestored
water
andw
eretherefore
notcovered.A
llthe
samples
were
transportedin
anice-box
ata
temperature
rangeo
f0
4
0Cto
minim
isechanges
inbacterial
countsbetw
eensam
plingand
testing.
2W
aterSam
plingP
rocedureSam
plingo
fthe
pipedsupplies
andoverhead
tanksw
ascarried
outusing
asepticm
ethods(A
PH
A,
1985).F
orthe
collectiono
fw
aterfrom
householdstorage
containers,an
aluminium
cupw
asused
forsam
pling.'Ice-w
ater'dispensed
froma
cupw
aspoured
directlyinto
asterilised
bottleand
storedin
anice-box
at0-4
0C.
The
cellophane-packaged
"ice-water"
was
placeddirectly
inthe
icebox.
2.1B
acteriologicalExam
inationF.
coliand
faecalstreptococci
were
quantifIedusing
them
embrane
fIltrationm
ethod.T
heS
lanetzand
Bartley
agarm
ethodw
asused
forthe
examination
of
faecalstreptococci.
The
sample
was
fIrstfIltered
througha
mem
branefIlter,
afteradding
3.0
3.5m!
of
steriledistilled
water
tothe
petri-dishcontaining
thenutrient
pad.T
hem
embrane
fIlterw
asthen
placedon
thenutrient
padw
ithoutentrappingair
bubblesand
incubated.F
orthe
detectiono
fF.coli,
theM
FC
(Mem
braneFaecal
Coliform
)m
ediumw
asused
with
theincubation
temperatures
rangingbetw
een44
to44.5
0Cfor
22to
24hours.B
luecolonies
with
diameters
of
1-2m
mw
erecounted.
The
Azide
medium
was
usedfor
thedetection
of
faecalstreptococci,
with
incubationconditions
at37
0Cfor
24to
48hours.
Faecalstreptococci
formsm
all(approxim
ately1
mm
indiam
eter)red
toreddish
brown
coloniesw
hichhave
smooth
peripheries.

AP
PE
ND
IX3
Benneh
etat.123
Meth
odology
forA
irT
est1
Field
Operations
The
fieldoperation
beganafter
thefield
assistantsw
erecarefully
introducedto
thebackground
andthe
purposeo
ftheair
pollutionsurvey.T
heyw
erealso
introducedto
thepractical
aspectsof
thesurvey
with
aseries
ofinitial
test-runs
with
theequipm
entandtrial-testw
iththe
questionnairebefore
moving
intothe
field.T
herew
ere12
fieldand
2laboratory
assistants.T
hefield
equipment
was
packedin
nylonshopping
bags.Each
bagcontained:
********
aG
il-Air
S-C
Air
pump
chargedw
ithfIlter
cassettecontaining
filterw
itha
cyclone,carbon
monoxide
tubesw
ithclips,
screw-driver,
tapem
easure,beltfor
mounting
theair
pump,
Peak
Expiratory
Flowm
eter,P
eakE
xpiratoryFlow
cylindersand
aquestionnaire.
1.1F
ieldE
xposureM
easurements
Methods
The
method
ofcollecting
physicalinform
ationduring
thisinvestigation
was
byexposure
measurem
entusing
theperson-carried
equipment.
The
person-carriedequipm
enthas
theadvantage
ofensuring
thatthe
sampling
ofparticulates
andcarbon
monoxide
reflectthe
actualexposure
situations.It
alsodoes
nothinder
therespondents
intheir
normal
work
duringthe
monitoring
perioddue
toits
lightw
eightandportability.
The
equipmentused
forthe
investigationsam
plesthe
ambient
airw
hereverthe
respondentis.
Itgives
information
aboutthe
quantityo
fa
pollutanta
personhas
beenexposed
toduring
them
onitoringtim
es,and
henceaverage
concentrationsencountered,butno
information
aboutthepeak
concentrations.T
heexposure
was
monitored
fora
3hour
period,covering
thetim
eduring
which
therespondentcooked
theprincipal
meal.
a)P
articulateM
atterT
heG
il-Air
S-C
Air
pumps
were
fittedw
itha
cyclonew
hichcontained
afilter
tocollect
respirabledust
andparticulates.
Sinceit
hasbeen
establishedthat
most
emissions
frombiom
assfires
are0-51lffi
insize
(Klaassen,c.n.
1985),am
bientsettling
particlesof
otherorigin,
forexam
pleroad
dust,w
hichare
oftenlarger,
were
excluded.T
hesebattery
powered
Gil-A
irpum
psused
with
built-intim
ersdrew
airat
afixed
rateo
f1.9
litres/minute.
The
built-intim
ersw
ereused
tom
onitorthe
exacttime
thepum
psw
erein
operation.A
llpum
psw
erecharged
duringthe
nightand
theair
floww
asadjusted
with
arotam
eterbefore
use.B
eforethe
pumps
were
senttothe
field,the
filters(the
filtertype
isa
37m
mC
elluloseacetate
filterw
itha
porosityof
8J.1m
,M
illiporeSW
CP
03700)w
ereconditioned
atroom
temperature
andhum
idity24
hoursprior
tofield
useand
for24
hoursafter
fielduse.
After
conditioning,they
were
weighed
onan
electronicdigital
balance.T
oaccount
forthe
possiblevariation
ofthe
humidity
inthe
laboratory,blank
filtersw
erew
eighedtogether
with
thesam
plefilters.
The

124E
nvironmental
Problem
sand
theU
rbanH
ouseholdin
theG
AM
A-G
hana
monitoring
of
humidity
inthe
laboratoryw
ascarried
outusing
am
echanictherm
ohydrograph(Fischer).
No
monitoring
of
humidity
inthe
fieldw
ascarried
out.After
instructingthe
recipientas
tothe
useand
operationo
fthe
pump,
theequipm
entw
asattached
tothe
waist
andthe
fIltercontraption
was
fittedto
thedress
of
therecipient
asclose
tothe
breathingzone
aspossble.
After
monitoring
thetim
erso
fthe
pumps
were
recheckedand
theinform
ationnoted
inthe
questionnairein
thefield.
The
pump
airflow
was
re-checkedas
soonas
thepum
psw
erereturned
fromthe
fieldin
orderto
obtainthe
averageair
flowduring
them
onitoringperiod.
b)C
arbonM
onoxideT
hem
onitoringo
fcarbonm
onoxidew
ascarried
outw
ithdiffusion
tubes.A
fterthe
tipw
asbroken,
thediffusion
tube(D
rager6733191)
was
placedclose
tothe
breathingzone
ofthe
recipient.The
colourchange
ofa
reactivesalt
inthe
tubew
ascom
paredw
itha
printedscale
onthe
tubeto
determine
theextent
ofthe
recipient'sexposure
tocarbon
monoxide
gas.T
hescale
readingon
thetube
isin
ppmh.
Readings
were
donein
thefield
andcross-checked
inthe
laboratory,30
minutes
afterthe
completion
ofthe
monitoring.
c)P
eakE
xpiratoryF
lowW
hena
personis
exposedfor
along
time
toparticulate
andirritable
gases,obstruction
of
theairw
ayscan
occurand
may
causeinflam
mation
andphlegm
production.In
thisstudy
theim
pairment
of
airways
ofthe
respiratorysystem
was
measured
bythe
useo
ftheportable
Wright's
MiniP
eakF
lowM
eterto
measure
theP
eakE
xpiratoryF
low(PE
F).T
heP
eakE
xpiratoryF
lowis
proportionalto
thediam
etero
fthe
upperand
centralairw
ayso
fthe
respiratorysystem
andtherefore
indicatesthe
presenceo
fa
reductionin
theairw
aysdue
toinflam
mation
orblockage
byphlegm
(Klaassen,C
.D.
1985).T
heW
right'sm
iniPeak
Flow
Meter
hasa
directreading
of
them
aximum
flowin
litresper
minutes.
Anew
papercylinder
forblow
ingw
asfitted
tothe
flowm
eterfor
everyrespondent.
The
respondentw
asthen
taughthowto
exhaleinto
them
eterand
allowed
oneor
two
trainingexhalations.
After
this,three
exhalationsw
ereperform
edsequentially
bythe
respondentw
hilecatching
enoughbreath
between
theexhalations.
The
highestvalue
of
thethree
exhalationsw
asthen
takenas
theP
EF
value.
d)O
therM
easurements
The
heightofthe
respondentwas
alsom
easured.
1.2The
Questionnaire
An
additionalquestionnaire
was
appliedalong
with
theair
tests,designed
togive
information
on:
*Residential
areaand
conditions*fueltype
usedand
cookinghabits
*thehealth
statuso
ftherespondent
All
respondentsinterview
edusing
thequestionnaire
were
alsom
onitored.

Benneh
etai.
AP
PE
ND
IX4
Opening
addressT
hursdayD
ecember
9,1993
byHon.D
r.C
hristineA
moako-N
uamah
Minister
forthe
Environm
ent
125
At
theopening
cermony
ofthesem
inaron"E
nvironmentalProblem
sand
theU
rbanH
ouseholdin
theG
reaterA
ccraM
etropolitanA
rea"(G
AM
A)
heldat
The
Auditorium
,School
ofAdm
inistrationU
niversityo
fGhana
Mr.
Chairm
an,Y
ourExcellencies,
Distinguished
Ladies
andG
entlemen,
Itis
agreatpleasure
form
eto
addressthis
gatheringo
facademics
fromG
hanaand
theS
tockholmE
nvironmentInstitute,
representativesof
internationalorganizations
inG
hana,planners,
government
officials,environm
entalN
GO
'sand
comm
unitygroups
asyou
prepareto
deliberateon
theresults
of
am
ajorstudy
on"E
nvironmental
Problem
sand
theU
rbanH
ousehold"in
theG
reaterA
ccraM
etropolitanA
rea(G
AM
A).
The
slums
andshantytow
nso
fcities
inthe
developingw
orldare
growing
attw
icethe
rateo
fcities
inother
partso
fthe
world.
The
World
Bank
estimates
thatthe
bottomquarter
of
urbanpopulations
inm
ostA
fricanand
low-incom
eA
siancities
cannotafforda
minim
allevel ofperm
anenthousing.L
argesections
of
major
citiesin
developingcountries
arew
ithoutadequate
treatedw
ater,m
unicipalsew
erageor
solidw
astedisposal
systems.
According
tothe
World
Com
mission
onE
nvironment
andD
evelopment,betw
een1985
and2000
developingcountries
will
requirea
65percent
increasein
theircapacity
tobuild
andm
anageurban
infrastructure,including
transportationand
sanitationsystem
s,utilities,
schoolsand
hospitals.It
istherefore
imperative
thatdevelopm
entstrategies
bedeveloped
todeal
with
thecom
binationo
fpopulation
growth,
healtho
fthe
fragileecosystem
s,

126E
nvironmental
Problem
sand
theU
rbanH
ouseholdin
theG
AM
A-G
hana
appropriatetechnologies
andaccess
toadequate
human
andm
aterialresources.
The
primary
goalo
fanydevelopm
entstrategyin
thisregard
shouldinclude
povertyalleviation,
foodsecurity
andeducation
asw
ellas
goodhealth
andquality
of
life.T
heseissues
areo
fm
ajorconcern
tothe
urbanhousehold.
Consequently,
atthe
recentR
ioE
arthS
umm
it(U
NC
ED
),there
was
abroad
agreement
thata
"brown
agenda",w
hichfocuses
onenvironm
entalissues
andpoverty,
would
bevital
forurban
populationsif
citiesare
todevelop
ina
sustainablem
anner.It
isthis
concernfor
thesustainable
managem
ento
four
human
settlements,
thatled
theG
overnment
of
Ghana
tosupport
thedesign
of
theS
trategicP
lanfor
theG
reaterA
ccraM
etropolitanA
rea(G
AM
A)
which
was
thesubject
of
asem
inarheld
afew
weeks
ago.G
AM
Ahas
alsobeen
selectedfor
participationin
boththe
sub-regionaland
globalnetw
orkso
fsustainable
orhealthy
cities.T
oem
phasizethe
importance
of
thisconcern,
anothersem
inarheld
lastw
eekon
"Planning
andM
anagement
of
theU
rbanE
nvironment",
highlightedsom
egeneral
problems
associatedw
ithurbanization
andalso
proposedsom
estrategies
andoperational
arrangements
fortheir
solution.It
ishoped
thatresults
of
thisstudy,
empasizing
intra-urbandifferentials
inaccess
toenvironm
entalam
enities,thelinks
between
environmentalrisk
factorsand
healthoutcom
es,the
economics
of
householdenvironm
entalm
anagement
andfinally
institutionalissues
will
bethorougW
ydiscussed
atthat
seminar.
Itis
furtherhoped
thatout
of
thediscussions
concreteproposals
forinnovative
policiesfor
improving
urbanm
anagementshallbe
senttothe
Ministry
forconsideration.
Mr.
Chairm
an,ladies
andgentlem
en,as
youm
ayall
befully
aware,
thecom
mitm
ento
fthe
Governm
ento
fG
hanato
sustainabledevelopm
entis
unquestionable.T
heestablishm
ento
fthe
Environm
entalP
rotectionC
ouncilin
1974after
theS
tockholmC
onferenceon
theH
uman
Environm
entand
thecreation
of
theM
inistryfor
theE
nvironment
inthe
Fourth
Republic
underscoresthis
comm
itment.
On
thepart
of
theM
inistryit
might
pleaseyou
toknow
thatim
provement
tothe
urbanm
anagement
isa
major
priority.It
isfor
thisreason
thatthe
Ministry
issupporting
two
newprojects
aimed
atalleviating
livingconditions
inurban
centres.T
heseare
theS
ustainableC
itiesP
roject(S
CP
)and
theC
omm
unityB
asedE
nvironmentalM
anagementInform
ationS
ystem(C
EM
IS).
Many
more
of
suchprojects
aregoing
tobe
soughtby
theM
inistryin
asm
uchas
theM
inistryforesees
thaturban
centresin
Ghana
would
otherwise
beoverw
helmed
bysanitation
problems
bythe
tumo
fthecentury.
As
am
easureo
fassuring
sustainabilityo
fthe
improvem
entaim
edat
urbanm
anagement,
theM
inistryis
consideringpolicies
thatw
illlead
toprotection
anddevelopm
ento
fthe
ruralenvironm
entthrough
vastlyim
provedplanning
andm
anagement
of
over-allhum
ansettlem
entsand
otherland
usein
pursuito
fsustainable
nationaldevelopm
ent.O
nbehalf
of
theG
overnment
andpeople
of
Ghana,
asw
ellas
onm
yow
nbehalf,
Iform
allyw
elcome
youall
tothis
Sem
inar.I
extenda
specialw
elcome
t.oD
r.G
ordonM
cGranahan
of
theU
rbanE
nvironmental
Managem
entP
rogramm
eo
fthe
Stockholm
Environm
entInstitute.M
r.C
hairman,
Your
Excellencies,
Distinguished
Guests,
Ladies
andG
entlemen,I
nowhave
thepleasure
todeclare
theS
eminar
open.

SE
IB
oard
Ch
airman
:
Karin
Soder
Sw
eden
Prof
Um
bertoC
olombo
Italy
Dr
Peggy
Dulany
USA
ProfG
ordonT.
Goodm
anU
K
Mrs
Fatim
aA
hmed
IbrahimS
udan
ProfT
homas
B.Johansson
Sw
eden
Ms
Kerstin
Niblaeus
Sw
eden
Sir
Shridath
Ram
phalG
uyana
Dr
Katsuo
SeikiJap
an
Dr
Alvaro
Um
anaC
ostaR
ica
Dr
Alexi
V.
Yablokov
Russia
ST
OC
KH
OL
ME
NV
IRO
NM
EN
TIN
ST
ITU
TE
Telephone:
Telex:
Telefax:
Telephone:
Telex:
Telefax:
Director:
ProfM
ichaelJ.Chadw
ickV
iceD
irector:D
rL
arsK
ristofersonH
eado
fAdm
inistration:A
nn-Charlotte
Bradley
Information
Manager:
Dr
Arno
Rosem
arinL
ibrarian:K
risterS
vard
Sto
ckh
olm
En
viro
nm
ent
Institu
teA
ddress:Jarntorget
84,B
ox2142
S-10314
Stockholm
,S
wed
enInt
+468
72
30
26
019580
SEI
SInt
+468
72303
48
DirectorS
EI-B
oston:D
rP
aulR
askinD
irectorSE
I-Tallinn:
Dr
Tanis
Kaasik
SE
Iat
York
Address:
University
ofY
ork,H
eslingtonY
orkY
015D
D,
UK
Int+44
904432897
57933Y
OR
KU
LG
Int+44
90443
2898
SE
I-Boston
Address:
Telephone:
Telex:
Telefax:
11A
rlingtonS
treetB
oston,M
A02116-3411
US
AInt
+16172668090
279926E
SRG
BSN
DR
Int+1
6172668303
SE
I-Tallinn
Address:
Box
160E
E-0090
Tallinn
Estonia
Telephone:
Int+
3722
601844
Telefax:
Int+
3722
44
09
82
Stock
holm
En
vironm
entInstitute
The
Stockholm
Environm
entInstitute
(SE
I)w
asestablished
bythe
Sw
edishP
arliament
in1989
asan
independentfoundationforthe
purposeo
fcarryingoutglobalenvironm
entanddevelopm
entresearch.The
Instituteis
governedby
aninternationalB
oardw
hosem
embers
aredraw
nfrom
developingand
industrialized
countriesw
orldwide.
Central
tothe
Institute'sw
orkhave
beenactivities
surroundingthe
Rio
UN
CE
Dconference,
andprevious
tothis,
theB
randtand
Palm
eC
omm
issionsand
thew
orko
fthe
World
Com
mission
forE
nvironmentand
Developm
ent.Apartfrom
itsw
orkinglinkages
with
therelevantspecialized
agencieso
fthe
UN
system,a
particularfeatureo
fSE
I'sw
orkprogram
me
isthe
roleithas
playedin
thedevelopm
entand
applicationo
fA
genda21,the
actionplan
forthe
nextcentury.A
major
aimo
fS
EI's
work
isto
bringtogether
scientificresearch
andpolicy
development.
The
Instituteapplies
scientificand
technicalanalysesin
environmentaland
developmentissues
ofregionaland
globalim
portance.The
impacts
ofdifferentpolicies
areassessed,providing
insightsinto
strategyoptions
forsocially
responsibleenvironm
entalmanagem
entandeconom
icand
socialdevelopment.
The
resultso
fthe
researchare
made
availablethrough
publications,the
organizationo
fand
participationin
conferences,seminars
anduniversity
courses,andalso
throughthe
developmento
fsoftware
packagesforuse
inthe
explorationo
fscientificproblem
s.SE
Ihasalso
developeda
specializedlibrary
which
functionsas
acentral
catalystin
theshort-term
andlong-term
work
ofthe
institute.
Research
Program
me
Am
ultidisciplinaryrolling
programm
eo
fresearchactivities
hasbeen
designedaround
thefollow
ingm
ainthem
es,w
hichare
beingexecuted
viainternationally
collaborativeactivjties
with
similar
institutionsand
agenciesw
orldwide:
oE
nviro
nm
en
talR
esources,including
energyefficiency
andglobaltrends,
energy,e
nviro
nm
en
tanddevelopm
ent,and
world
wa
ter
resources;
oE
nviro
nm
en
talT
echnology,including
cleanproduction
andlow
waste,
energytechnology,
environm
entaltechnology
transfer,and
agriculturalbiotechnology;
oE
nviro
nm
en
talIm
pacts,including
environmentally
soundm
anagementoflow
-gradefuels,
climate
cha
ng
eand
sustainabledevelopm
ent,and
coordinatedabatem
entstrategiesfo
racid
depositions;
oE
nviro
nm
en
talP
olicya
nd
Managem
ent,including
urbanenvironm
entalproblem
s,sustainable
en
viron
me
nts
andcom
mon
propertym
anagement;
and
oP
OLE
ST
AR
,a
comprehensive
modelling
andscenario-based
activity,investigating
thed
yna
mics
ofa
world
with
10billion
peopleby
them
iddleof
thenext
century.
SE
l'sN
etwork
SE
Ihas
chosena
globalnetw
orkapproach
ratherthan
am
oretraditional
institutionalset-up.
The
work
programm
eis
carriedout
bya
worldw
idenetw
orko
fabout60full-
andpart-tim
eand
affiliatedstaffand
consultants,who
arelinked
with
theS
EIH
eadO
fficein
Stockholm
ortothe
SE
IOffices
inB
oston(U
SA
),Y
ork(U
K)and
Tallinn
(Estonia).S
EIhasdeveloped
alarge
mailing
registertocom
municate
tokey
mem
berso
fsocietyin
government,
industry,university,NG
Os
andthe
media
aroundthe
world.
~SE
I~:~~:~~~~NTIN
ST
ITU
TE
InternationalInstitute
forE
nvironmentalTechnology
andM
anagement
_
Postaladdress:
Telephone:
Telex:
Telefax:
E-m
ail:
Box
2142,S-103
14S
tockholm,
Sw
eden+
46-8-7230260
19580sei
s+
46-8-7230348
cdp!gn!pns!seihq