The 2dF Galaxy Redshift Survey: Luminosity dependence of galaxy clustering
Upload
khangminh22Category
view
5download
0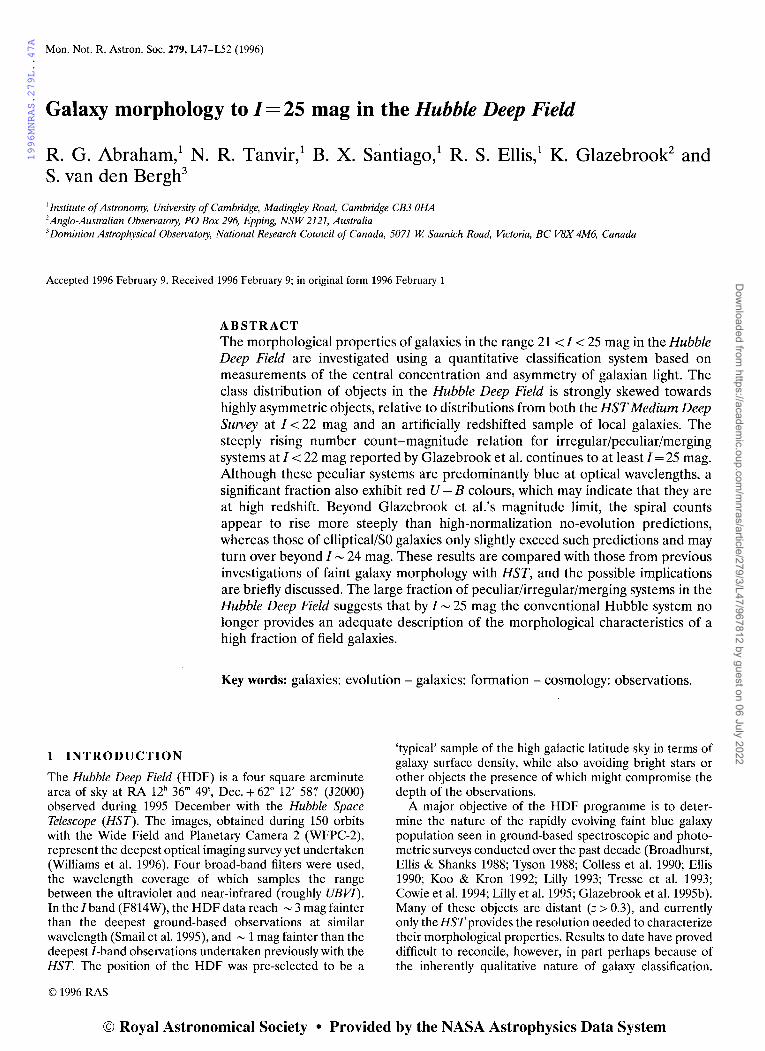
1996MNRAS.279L..47A
Mon. Not. R. Astron. Soc. 279, 1A7-L52 (1996)
Galaxy morphology to 1=25 mag in the Hubble Deep Field
R. G. Abraham/ N. R. Tanvir/ B. X. Santiago/ R. S. Ellis/ K. Glazebrook2 and S. van den Bergh3
1 Institute of Astronomy, University of Cambridge, Madingley Road, Cambridge CB3 OHA 2Anglo-Australian Observatory, PO Box 296, Epping, NSW 2121, Australia 3 Dominion Astrophysical Observatory, National Research Council of Canada, 5071 W. Saanich Road, Victoria, BC V8X 4M6, Canada
Accepted 1996 February 9. Received 1996 February 9; in original form 1996 February 1
1 INTRODUCTION
ABSTRACT The morphological properties of galaxies in the range 21 < I < 25 mag in the Hubble Deep Field are investigated using a quantitative classification system based on measurements of the central concentration and asymmetry of galaxian light. The class distribution of objects in the Hubble Deep Field is strongly skewed towards highly asymmetric objects, relative to distributions from both the HST Medium Deep Survey at 1< 22 mag and an artificially redshifted sample of local galaxies. The steeply rising number count-magnitude relation for irregular/peculiar/merging systems at I < 22 mag reported by Glazebrook et al. continues to at least 1=25 mag. Although these peculiar systems are predominantly blue at optical wavelengths, a significant fraction also exhibit red U - B colours, which may indicate that they are at high redshift. Beyond Glazebrook et al.'s magnitude limit, the spiral counts appear to rise more steeply than high-normalization no-evolution predictions, whereas those of elliptical/SO galaxies only slightly exceed such predictions and may turn over beyond I '" 24 mag. These results are compared with those from previous investigations of faint galaxy morphology with HST, and the possible implications are briefly discussed. The large fraction of peculiar/irregular/merging systems in the Hubble Deep Field suggests that by I '" 25 mag the conventional Hubble system no longer provides an adequate description of the morphological characteristics of a high fraction of field galaxies.
Key words: galaxies: evolution - galaxies: formation - cosmology: observations.
The Hubble Deep Field (HDF) is a four square arcminute area of sky at RA 12h 36m 49s, Dec. + 62° 12' 58~ (12000) observed during 1995 December with the Hubble Space Telescope (HST). The images, obtained during 150 orbits with the Wide Field and Planetary Camera 2 (WFPC-2), represent the deepest optical imaging survey yet undertaken (Williams et al. 1996). Four broad-band filters were used, the wavelength coverage of which samples the range between the ultraviolet and near-infrared (roughly URVI). In the I band (F814W), the HDF data reach ~ 3 mag fainter than the deepest ground-based observations at similar wavelength (Smail et al. 1995), and ~ 1 mag fainter than the deepest I-band observations undertaken previously with the HST. The position of the HDF was pre-selected to be a
'typical' sample of the high galactic latitude sky in terms of galaxy surface density, while also avoiding bright stars or other objects the presence of which might compromise the depth of the observations.
A major objective of the HDF programme is to determine the nature of the rapidly evolving faint blue galaxy population seen in ground-based spectroscopic and photometric surveys conducted over the past decade (Broadhurst, Ellis & Shanks 1988; Tyson 1988; Colless et aI. 1990; Ellis 1990; Koo & Kron 1992; Lilly 1993; Tresse et al. 1993; Cowie et al. 1994; Lilly et al. 1995; Glazebrook et al. 1995b). Many of these objects are distant (z > 0.3), and currently only the HST provides the resolution needed to characterize their morphological properties. Results to date have proved difficult to reconcile, however, in part perhaps because of the inherently qualitative nature of galaxy classification.
©1996 RAS
© Royal Astronomical Society • Provided by the NASA Astrophysics Data System
Dow
nloaded from https://academ
ic.oup.com/m
nras/article/279/3/L47/967812 by guest on 06 July 2022

1996MNRAS.279L..47A
U8 R. G. Abraham et al.
Number counts from a sample of 301 galaxies with 1< 22 mag taken from 13 WFPC-2 fields from the Medium Deep Survey (MDS) have been reported by Glazebrook et al. (1995a). These authors classified galaxies by eye and found the number-magnitude relationships for elliptical and spiral populations to be consistent with the predictions of high-normalization no-evolution cosmological models, but that the number of irregular/peculiar (possibly merging) galaxies was at least an order of magnitude greater than predicted by the same models. A similar conclusion was reached by Driver, Windhorst & Griffiths (1995) based on number counts from a single deeper MDS WFPC-2 field to 1=24.25 mag, and by Abraham et al. (1996) from automated morphological classification of 521 galaxies from a ·larger number (21) of MDS WFPC-2 fields to 1=22 mag.
In contrast, HST observations reported by Schade et al. (1995) of a small but spectroscopically complete sample of 32 galaxies from the Canada-France Redshift Survey (CFRS) indicate that the morphological mix at z ~ 0.75 is similar to that seen locally, except for a population of 'blue nucleated galaxies' (BNGs) which Schade et al. suggest comprise ~ 35 per cent of the faint blue galaxy population. The existence of another major new population of morphologically distinct objects, linear 'chain galaxies' which may be proto-galactic systems, has recently been reported by Cowie, Hu & Songaila (1995) on the basis of HST observations of faint objects (I> 23 mag) identified in the Hawaii Deep Survey.
A major advantage of the HDF data set over the earlier images of Glazebrook et aI., Schade et al., Driver et al. and Cowie et al. is the improved signal-to-noise ratio level arising from the considerably longer HDF exposure time. The exposure times available to those authors were 5-8 h in F814W, which is substantially less than the ~ 35 h devoted to the HDF in this filter. The improved signal-to-noise ratio at faint limits enables us to extend the work already begun with the MDS, the wider spatial coverage of which nicely complements the HDF data.
Although interesting questions (which the HDF may ultimately answer) concern the very faint (I> 25 mag) galaxy counts, in this short note we are concerned with understanding the morphology and colour distributions of the ~ 300 objects brighter than 1=25 mag. As described below, at this limit the bulk of the galaxy population is detectable in all four HDF passbands, and morphological classifications are as robust as was the case in our earlier analyses of the MDS data to 1=22 mag.
The plan ofthe paper is as follows. In Section 2 we review our morphological classification techniques in the context of the HDF data. Section 3 discusses the colour distribution as a function of morphology and, in Section 4, we combine our data set with that of the MDS, enabling us to extend Glazebrook et al. (1995a)'s morphological galaxy count diagram 3 mag fainter. A number of new trends appear, the implications of which are briefly discussed.
2 MORPHOLOGICAL ANALYSIS OF THE HUBBLE DEEP FIELD
Working with the 'dithered' (resampled by a factor of 2.5 and stacked) version 1 HDF images released by the Space Telescope Science Institute, we constructed a source cata-
logue using the APM faint-object photometry software (Irwin 1985). At very faint (I~ 27 mag) levels, the number of objects in the resulting catalogue depends sensitively on the smoothing scale, detection threshold, and minimum object area used by the software, but in the regime where morphological classification is reliable (I < 25 mag) the final catalogue is robust. The photometry was calibrated on the instrumental magnitude system defined by Holtzman et al. (1995). Glazebrook et al. (1995a) used the same I-band calibration in their MDS analysis, and thus the results are directly comparable. The structural properties of galaxies in the I-band frame in the magnitude range 21 < 1< 25 mag were investigated with the automated morphological analysis system used by Abraham et al. (1996) to characterize objects from the MDS. Visual classifications were also made by two of us (RSE and SvdB) using the classification system discussed by Glazebrook et al. (1995a). The reader is referred to these earlier papers, and to Abraham et al. (1994), for further details of these procedures beyond the outline given here.
In the automated classification procedure, the galaxy images were first isolated from the sky background by extracting contiguous pixels at least 10' above the sky level. For each galaxy an asymmetry index, A, was measured by rotating and self-subtracting the galaxy image from itself. A second parameter in the classification procedure, the central concentration C, was determined from measurements of the intensity-weighted second-order moments of the galaxy images. Asymmetric or disturbed galaxies generally have. high values of A and low values of C, ordinary spirals have intermediate values of both parameters, and early types are distinguished by high central concentration.
In order to compare directly the measurements of C and A obtained from 'dithered' HDF images with those obtained from the MDS, the 23 galaxies in the HDF with 21 < I < 22 mag (the magnitude limit of the Medium Deep Survey) were rebinned to the original sampling of the WFPC-2 and degraded by adding Poisson noise to simulate the appearance of these objects under typical (~5000 s) MDS exposures. A comparison of measurements from the original and degraded images indicated that the HDF dithering procedure introduces a small systematic change in the measured asymmetry value of the HDF data, AA =0.053 ± 0.02, relative to undithered MDS data. This small offset was therefore subtracted from the measured asymmetry values when comparing the HDF and MDS. It is emphasized that applying this correction decreases the total number of asymmetric objects in the HDF. Random errors were determined by Monte Carlo simulation (cf. Abraham etal. 1994, 1996) and are no larger than L\C=AA =0.07 to 1=25 mag. Both C andA depend on the rest-frame isophote level at which the measurements are made. The 10' limiting isophote of the HDF data ( ~ 26.5 mag arcsec- 2) is 1.5-2 mag arcsec-2 deeper than the corresponding limiting isophote for more typical HST data (e.g. from the MDS), so bright galaxies in the HDF are probed to larger radii than corresponding objects in the MDS. Strong (1 +Z)4 cosmological dimming is expected roughly to synchronize the restframe limiting isophotes for the MDS and HDF samples at faint magnitudes, but a detailed assessment of this effect must await redshift information (discussed below).
© 1996 RAS, MNRAS 279, IA7-L52
© Royal Astronomical Society • Provided by the NASA Astrophysics Data System
Dow
nloaded from https://academ
ic.oup.com/m
nras/article/279/3/L47/967812 by guest on 06 July 2022
1996MNRAS.279L..47A
Galaxy morphology in the Hubble Deep Field L49
Hubble Deep Field (21 < I < 25)
o
lD o I
< ~ I
bO o ....
~
I
C\2 I
Irr/Pec/Mrg
Q
Spiral
-O.B -0.6 -0.4
log C
Q
Q
Q :
E/SO
-0.2
Q
o
Figure 1. Asymmetry versus central concentration for galaxies in the Hubble Deep Field. RSE's visual morphological classifications are denoted by the plot symbols: E/SOs are shown as ellipses, spirals earlier than Sd are shown as spirals, and irregulars/peculiars/mergers are shown as asterisks. The sectors subdivide the diagram into regions where each of these morphological types dominates. Representative error bars are shown. The dotted polygon shows the 'convex hull' enclosing the artificially redshifted local sample of objects described in the text.
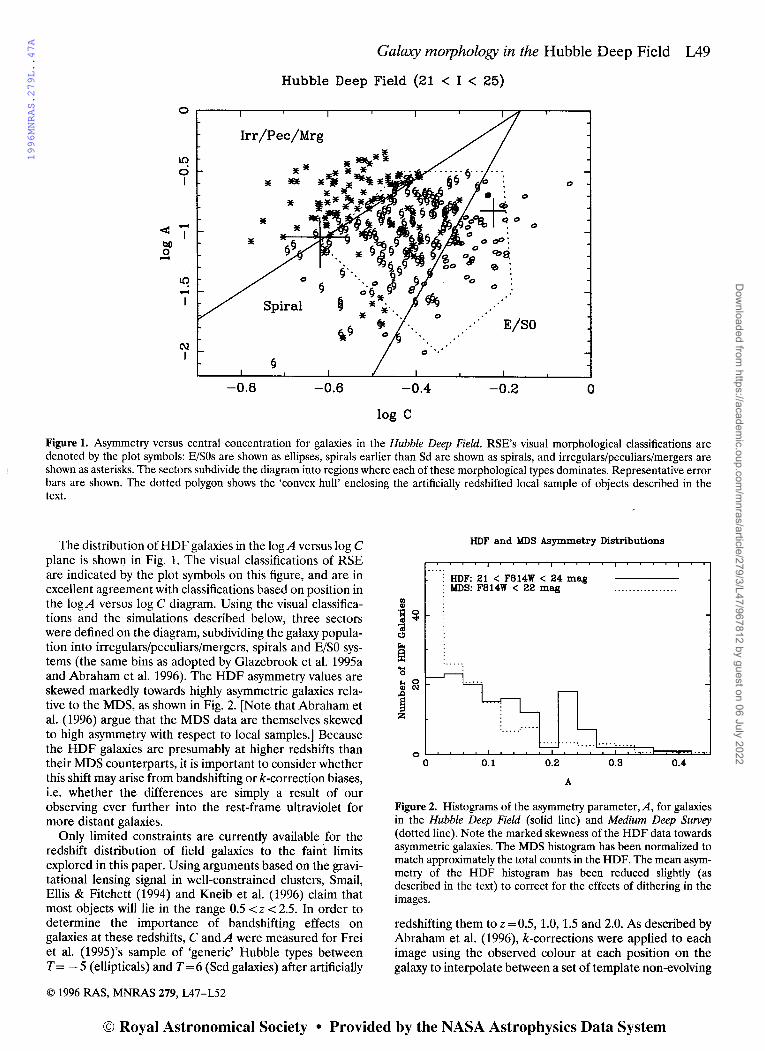
The distribution of HDF galaxies in the log A versus log C plane is showl} in Fig. 1. The visual classifications of RSE are indicated by the plot symbols on this figure, and are in excellent agreement with classifications based on position in the 10gA versus log C diagram. Using the visual classifications and the simulations described below, three sectors were defined on the diagram, subdividing the galaxy population into irregulars/peculiars/mergers, spirals and E/SO systems (the same bins as adopted by Glazebrook et al. 1995a and Abraham et al. 1996). The HDF asymmetry values are skewed markedly towards highly asymmetric galaxies relative to the MDS, as shown in Fig. 2. [Note that Abraham et al. (1996) argue that the MDS data are themselves skewed to high asymmetry with respect to local samples.] Because the HDF galaxies are presumably at higher redshifts than their MDS counterparts, it is important to consider whether this shift may arise from bandshifting or k-correction biases, i.e. whether the differences are simply a result of our observing ever further into the rest-frame ultraviolet for more distant galaxies.
Only limited constraints are currently available for the redshift distribution of field galaxies to the faint limits explored in this paper. Using arguments based on the gravitational lensing signal in well-constrained clusters, Smail, Ellis & Fitchett (1994) and Kneib et al. (1996) claim that most objects will lie in the range 0.5 <z < 2.5. In order to determine the importance of bandshifting effects on galaxies at these redshifts, C and A were measured for Frei et al. (1995)'s sample of 'generic' Hubble types between T = - 5 (ellipticals) and T = 6 (Scd galaxies) after artificially
© 1996 RAS, MNRAS 279, LA7-L52
HDF and MDS Asymmetry Distributions
A
Figure 2. Histograms of the asymmetry parameter, A, for galaxies in the Hubble Deep Field (solid line) and Medium Deep Survey (dotted line). Note the marked skewness of the HDF data towards asymmetric galaxies. The MDS histogram has been normalized to match approximately the total counts in the HDF. The mean asymmetry of the HDF histogram has been reduced slightly (as described in the text) to correct for the effects of dithering in the images.
redshifting them to z = 0.5, 1.0, 1.5 and 2.0. As described by Abraham et al. (1996), k-corrections were applied to each image using the observed colour at each position on the galaxy to interpolate between a set of template non-evolving
© Royal Astronomical Society • Provided by the NASA Astrophysics Data System
Dow
nloaded from https://academ
ic.oup.com/m
nras/article/279/3/L47/967812 by guest on 06 July 2022

1996MNRAS.279L..47A
LSD R. G. Abraham et at.
spectral energy distributions (SEDs) (kindly supplied by A. Aragon-Salamanca). The artificially redshifted galaxies occupied the region ofthe 10gA versus log C diagrain within the dotted polygon shown in Fig. 1, which therefore maps out the portion of this diagram that is expected to be occupied by distant non-evolving galaxies with Hubble T-types between - 5 and 6. It appears that the majority of objects in the irregular/peculiar/merger sector of Fig. 1 correspond to one or more of the following: (i) Hubble types later than Sd; (ii) significantly evolved intermediate Hubble-type spirals; and (iii) a family of objects outside the Hubble system (i.e. merging or peculiar galaxies).
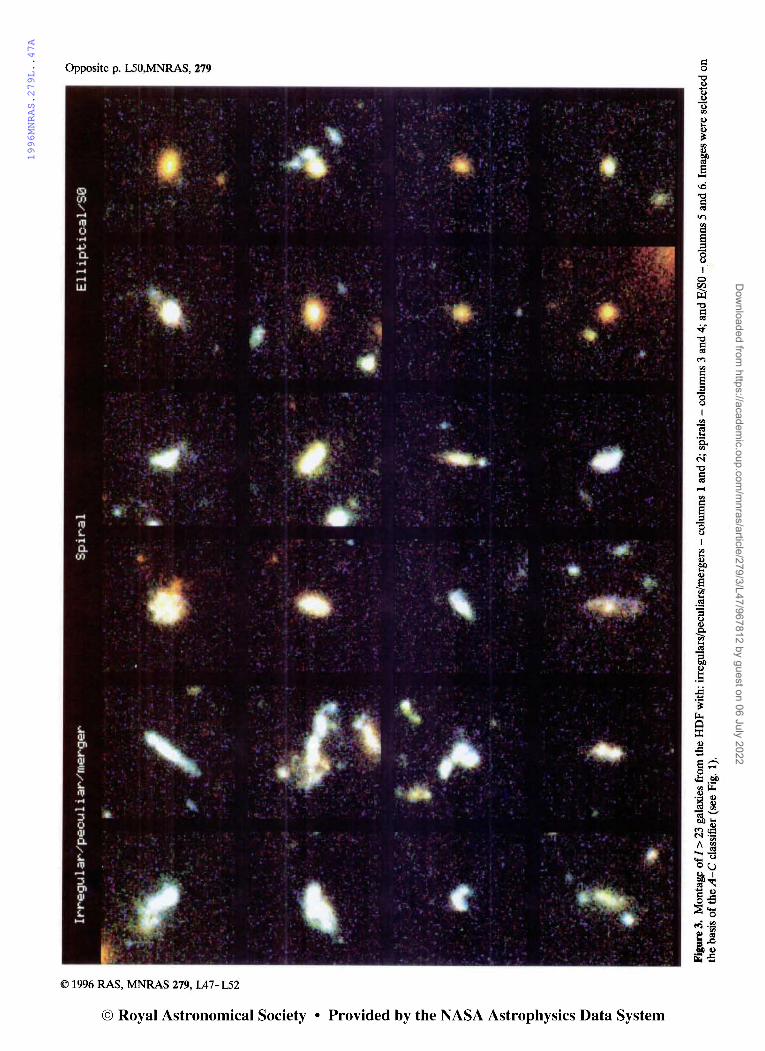
At this point we introduce the visual classifications made for the sample by RSE and SvdB. These classifications are in good agreement with classifications from the A-C scheme on a one-to-one basis, and reproduce well the boundaries of the classes identified from the simulations discussed above (Fig. 1). Agreement was particularly good for the spheroidal systems and, where differences between visual and machine classifications were found, they generally lay at the boundaries of the three categories. Both SvdB and RSE noted that beyond I~24 mag an increasing proportion of the faintest spheroidal and spiral galaxies were less regular than brighter examples, and, in particular, there was a notable absence of 'grand-design' spirals. Asymmetries in galaxies often resulted from one or more off-centred knots of activity, suggestive of either increased star formation or an ultraviolet signal in very distant sources (and emphasizing the importance of accounting for bandshifting effects). A montage of typical galaxies with I > 23 mag is given in Fig. 3 (opposite).
Although some, of the irregular galaxies in the HDF appear spectacularly 'chain-like', the surface density of strictly linear systems with multiple knots and narrow transverse extents to 1=25 mag is ;$ 2.5 arcmin -2, i.e. a relatively small fraction of the total number of irregulars. There are a larger number of objects that have a bright nucleus and a faint, one-sided tail, and the properties of these 'tadpolelike' galaxies (which are possibly related to the chain-like systems) will be described in a future work (van den Bergh et al., in preparation).
3 COLOURS
A very significant advantage of the HDF over earlier data is the extensive imaging conducted in F300W (hereafter U), F450W (B) and F606W (V). In the following we will use instrumental magnitudes for the UBV system, since our discussion is based only on relative colours. The 1=25 mag limit for the present investigation corresponds not only to t.hat point where sound morphological classifications can be determined (Section 2), but also to that limit at which most of the galaxies are reliably detected in all four bands; the U band is the shallowest exposure and is essentialy complete (30') at U ~ 27. Thus only a few very red objects (U - I> 2) in our 1<25 sample are undetected in U.
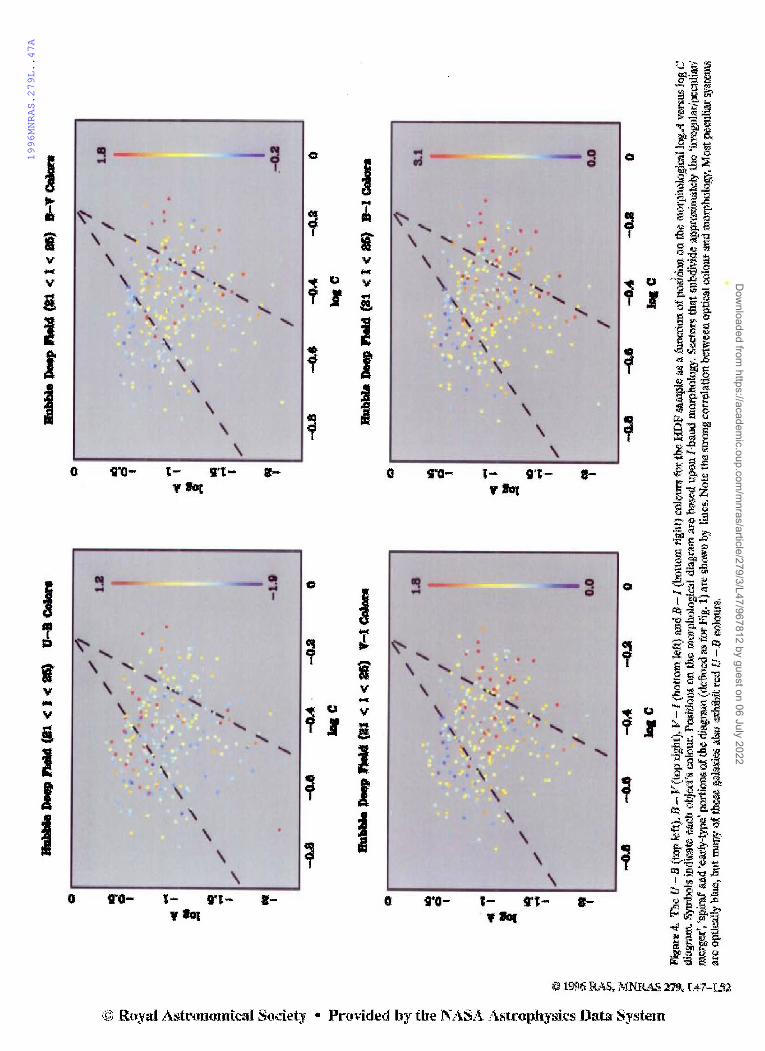
Fig. 4 (opposite p. LS1) presents the U-B (F300W - F450W), B - V (F450W - F606W), V - I (F606W - F814W) and B-1 (F450W - F814W) colours, obtained through OA-arcsec apertures, for the HDF sample as a function of position on the morphologicallogA versus log C diagram. The colour of an individual galaxy is repre-
sented by the colour of the corresponding symbol on this plot. The trend from one set of passband colours to the next is remarkably similar. The dominant colour axis appears horizontal, as expected from the close correspondence between central concentration and bulge-to-disc ratio (Abraham et al. 1994). The 'faint blue galaxies' determined from optical colours correspond to low central concentration, highly asymmetric objects as originally claimed by Glazebrook et al. (1995a). Objects classified as early types are predominantly red, indirectly supporting the accuracy of classifications made on the basis of C and A, and in agreement with observations suggesting that the early-type population in the field remains old even at faint flux levels.
The distribution of irregular/peculiar/merger objects in the U - B diagram exhibits an interesting behaviour (shown more clearly in Fig. 5). 19 of 83 objects in this morphological category (determined from Fig. 1) have blue optical-nearinfrared colours (V-I <: 0.6) and comparatively red UVoptical colours (U - B > - 0.2). In fact, objects that are red in U - B tend to have high asymmetry irrespective of morphological class - a trend which is not present in other colours. They are also faint, with only two of the' U - Bred, V - I blue' objects being brighter than 1=23 mag. One possibility is that a significant fraction of asymmetric objects have z > 2.3, corresponding to the Lyman discontinuity entering the U filter. Alternatively, this may be the result of reddening from dust catalysed by mergers or interactions; this seems less likely, as it would produce a trend in the other colours.
4 NUMBER COUNTS
The high signal-to-noise ratio of the HDF data and the reliability of the morphological classifications allow us to extend the morphologically segregated galaxy counts 3 mag deeper than was possible with the Medium Deep Survey. This dramatic improvement reflects the fact that signal-to-noise ratio is the prime limitation in image analysis; the increase in angular diameter distance corresponding to the 3-mag improvement is probably very small. Fig. 6 combines the HDF and MDS number counts (with error bars based on Poisson statistics). Also shown are the no-evolution predictions for each type constructed as described in Glazebrook et al. (1995a), adopting Schechter luminosity functions (LFs) with parameters- given by Loveday et al. (1992), and a high normalization (¢* ;:::0.03 h3 Mpc-3). The predicted counts for the elliptical galaxies are based on a flat slope (0(= -1) for the faint end of the LF, rather than the turnover originally found by Loveday et al. The very small differences between the counts determined using theA- C classifications and those determined visually by RSE and SvdB are also indicated in the figure.
The HDF counts extend the trend already identified by Glazebrook etal. (1995a) to much fainter magnitudes. The over-abundance of irregular/peculiar/merging systems continues to the 1=25 mag limit, at which point these systems represent 30-40 per cent of all galaxies. As discussed above, a significant fraction of these systems may lie beyond a redshift z ~. 2.5, and there appears to be a general evolution of increasing asymmetry with redshift. Significantly, some new trends emerge from Fig. 6. Beyond 1=22 mag the spiral
© 1996 RAS, MNRAS 279, lA7-L52
© Royal Astronomical Society • Provided by the NASA Astrophysics Data System
Dow
nloaded from https://academ
ic.oup.com/m
nras/article/279/3/L47/967812 by guest on 06 July 2022
1996MNRAS.279L..47A
Opposite p. LSO,MNRAS, 279
© 1996 RAS, MNRAS 279, LA7-LS2
© Royal Astronomical Society • Provided by the NASA Astrophysics Data System
Dow
nloaded from https://academ
ic.oup.com/m
nras/article/279/3/L47/967812 by guest on 06 July 2022
1996MNRAS.279L..47A
@
~
0 '< e:. >
'Jl ..... .., 0 =
0 :3 ... ~ ~ - 'JJ. 0 ~ ... 1'0 .....
'< • ""C .., 0 < ... ~ 1'0 ~
C'"
'< .....
C'"
1'0 Z >
'JJ. > >
'Jl ..... .., 0 "C
C'"
'<
@
'Jl ...
......
~
~
'Jl ~
0'1
~
~ .....
~
'JJ.
s:::
'<
Z
'Jl
~ .....
1'0
:3 'J
l t.
>
-..I ~ S
I c: IV
JIaN
IIe
Dee
p r
JeI4
(81
< I
< I
I)
U-B
Co
lan
B
abb
le D
eep
IWd
(81
< I
< I
I)
B-Y
Co
lan
0 0
/'1
/'
1
1.8
1
.8
11
De
/ /
~ lID
~
/ /
~ -
,/
0 ~
~ ,/
[J
.,-/
/ 0
" .
., I
[;1
~
-"
.. -/
c:lI
".
.-. /
... ""
,/
~
II ...
[l
,/
:')
~I
.,:
) I
~I
"J
[]
~
/ . ::
] J
~ .
/ J
• a J
• •
I
J /
u:
/ ".:
l J
,/
[J
r'" -I
-..
" 1
•
.q
/ .q
/
~ ./
L
I a
./
... /
a L
... /
u I
[]
I /
~
/ ~
/ D
/
~
'i'l
/ ~
-1.1
01
/
[]
.-0.8
I
/ D
/
-0.8
-0
.8
-004
-0
.8
0 -0
.8
-0.8
-0
."
-0.8
0
IoIC
la
iC
Bu
bb
le D
eep
IWd
(81
< 1
< I
I)
Y-I
Co
lan
B
ub
ble
Dee
p IW
d (
81 <
1 <
II)
B
-1 C
ola
n
0 0
/'1
/'
1
1.8
8.
1
11
a ::
Il
. /
/ lID
~C1
/ /
n ",
0 ./
D
• ..
/ []
a.,a: .
/
c:
~"']
. ",'
I rn
./
-/
.::J
)1.
.-./
./
. ~ •
• ..
,/
"'.
r;; -
n /'
""'I
.,'
jn
,.tI
. -...
~
... ~I
/ •
cI
'"
I'
~I
/ '.
J ;1
q-
• I;
[]
..ll
. -
. •
J'
:J :J
J .:J.
J ,/
UI
---l
I ..
a J
,/
(]..Ja"~
/ _ .
. ~:lI
. ~
..
(]
. .. .
-.q
/
"J
q.,
.q
/ D
n
·
• n
D
[]
-/
[]
..(]
./
...
/ ...
/ []
I /
(]
~ I
/ t]
a n
~ /
[]
/ ~
'i'l
/ 0.
0 01
/
,~
0.0
I
/ r
/ -0
.8
-0.8
-0
."
-0.8
0
-0.8
-0
.8
-0."
-0
.8
0
IoIC
la
iC
Fig
ure
4. T
he U
-B
(to
p le
ft),
B -
V (
top
righ
t), V
-I (
bott
om l
eft)
and
B-1
(bot
tom
rig
ht)
colo
urs
for
the
HD
F s
ampl
e as
a f
unct
ion
of p
osit
ion
on th
e m
orph
olog
ical
logA
ver
sus
log
C
diag
ram
. Sy
mbo
ls i
ndic
ate
each
obj
ect's
col
our.
Pos
itio
ns o
n th
e m
orph
olog
ical
dia
gram
are
bas
ed u
pon
I-ba
nd m
orph
olog
y. S
ecto
rs t
hat
subd
ivid
e ap
prox
imat
ely
the
'irre
gula
r/pe
culi
ar/
mer
ger',
'spi
ral'
and
'ear
ly-t
ype'
por
tion
s o
fth
e di
agra
m (
defi
ned
as f
or F
ig. 1
) ar
e sh
own
by l
ines
. Not
e th
e st
rong
cor
rela
tion
bet
wee
n op
tica
l col
our
and
mor
phol
ogy.
Mos
t pec
ulia
r sys
tem
s ar
e op
tical
ly b
lue,
but
man
y of
thes
e ga
laxi
es a
lso
exhi
bit
red
U -
B c
olou
rs.
Dow
nloaded from https://academ
ic.oup.com/m
nras/article/279/3/L47/967812 by guest on 06 July 2022

1996MNRAS.279L..47A
N
10 ci
Colour-Colour Diagram Highlighting Low C/High A Objects
-1
o o
'b 0 0
o U-B
o 0
2
All Types (a)
* lIDS • HDF
Keck
18 20 22 24
I (F814W)
18 20 22 24
I (F814W)
Galaxy morphology in the Hubble Deep Field L5I
counts now show a significant excess over the no-evolution predictions. A weaker trend is seen for the spheroidal systems (the counts of which are only marginally above the noevolution prediction), and there is some evidence of a turnover in the last magnitude interval.
The interpretation of Fig. 6 depends crucially on both the redshift distribution of the data and the faint-end slope of the luminosity function. If the local luminosity function were reliably determined from recent faint surveys (cf. Ellis et al. 1996) and the Lyman limit were always present in
Figure 5. The V-I versus U - B colour-colour diagram for all objects with I < 25 mag. Filled symbols denote objects in the irregular/peculiar/merger sector of Fig. 1. The small number of objects with no U - B colour are represented by lower limits. Note the plume of objects with blue V-I and red U - B colours.
Elso (b) • Ellis x van den Bergh o Machine
18 20 22 24
I (F814W)
Irr/Pec/Mrg (d) • Ellis x van den Bergh o Machine
18 20 22 24
I (F814W)
Figure 6. The number-magnitude relations for morphologically segregated samples of galaxies from the HDF and MDS. Open circles indicate counts obtained from automated classifications determined from Fig. 1; filled circles indicate the results from the visual classifications of RSE; and crosses indicate the results from the visual classifications of SvdB. The MDS counts are indicated by the stars on each panel. The no-evolution 0=1 curves from Glazebrook et al. (1995a), extrapolated to 1=25 mag, are superposed. The dashed line on the E/SO diagram shows the effect of assuming 0 = 0.1. The dotted line in panel (a) shows the I-band number counts determined by Smail et al. (1995) from two deep fields imaged with the Keck telescope.
© 1996 RAS, MNRAS 279, U7-L52
© Royal Astronomical Society • Provided by the NASA Astrophysics Data System
Dow
nloaded from https://academ
ic.oup.com/m
nras/article/279/3/L47/967812 by guest on 06 July 2022
1996MNRAS.279L..47A
L52 R. G. Abraham et al.
distant galaxies, the spiral excess would appear to imply luminosity evolution for disc galaxies in the interval 1 <z < 2.5. The flattening of the spheroidal galaxy counts beyond 1=24 mag in both the visual and automated catalogues is an interesting, although currently uncertain, result. As this population is predominantly red, 'minimal evolution is implied to quite high redshift, and steepening IX would make this result yet tighter. The effect of curvature here is slight; in the absence of luminosity evolution, the bulk of the I ~ 24-25 spheroidals are expected to lie within z < 2. In this respect, the decline in the counts is a puzzling result, although it may indicate that the precursors of many present-day spheroidals lie in one of the other morphological categories.
The large fraction of irregular/peculiar/merger systems detected at faint magnitudes in the HDF supports earlier suggestions that beyond I ~ 24 mag the conventional Hubble system no longer provides an adequate description of the structural characteristics for a significant fraction of galactic (and possibly proto-galactic) systems. This has important implications for forthcoming number count and correlation analyses of the Hubble Deep Field. The results from fainter investigations may depend strongly on the prescription used to define galaxies amongst collections of clumpy subcomponents. Although the magnitude limit in this paper was chosen deliberately so as to minimize this ambiguity, the peculiar structure and obvious distortion of conventional galactic features seen in many systems at 1<25 mag inevitably result in some difficulties when trying to connect these objects to local counterparts. At I < 25 mag it still seems useful to exploit the (approximate) connection between sectors on the A - C diagram and conventional galaxy classifications in order to determine number counts that can be directly compared with those for the Hubble system. For fainter galaxies, however, it may prove more useful to model the distributions of C and A (or other structural parameters) directly, and no longer require galaxies to be directly mapped on to bins corresponding to local archetypes. A quantitative characterization of the morphologies of faint galaxies, based on measurements of physically meaningful structural parameters, provides an objective route forward when the conventional 'syntax' of morphological description, based on the Hubble system and references to local archetypes, has broken down.
ACKNOWLEDGMENTS
We thank Bob Williams for devoting such a large fraction of Director's Discretionary Time to the HDF project, and we are grateful to the staff of STScI and ST -ECF for mobilizing in order to ensure that the HDF data were reduced and available quickly. We also thank the UK HST Support
Facility for help in obtaining the HDF data, Daniel Durand of the Canadian Astronomy Data Centre for help with displaying the images at DAO, and the members (and former members) of the Cambridge APM group, especially Steve Maddox and Mike Irwin, for useful discussions with regard to catalogue construction with the APM software.
REFERENCES
Abraham R. G., Valdes F., Yee H. K C., van den Bergh S., 1994, ApJ, 432, 75
Abraham R. G., van den Bergh S., Glazebrook K, Ellis R S., Santiago B. X., Surma P., Griffiths R, 1996, ApJ, submitted
Broadhurst T., Ellis R., Shanks T., 1988, MNRAS, 235, 827 Colless M., Ellis R S., Taylor K, Hook R. N., 1990, MNRAS, 244,
408 Cowie L. L., Gardner J. P., Hu E. M., Songaila A, Hodapp K W.,
Wainscoat R. J., 1994,ApJS, 94, 461 Cowie L. L., Hu E. M., Songaila A J., 1995, AJ; 110, 1576 Dressler A, Oemler A, Butcher H. R, Gunn J. E., 1994, ApJ, 430,
107 Driver S. P., Windhorst R. A, Griffiths R. E., 1995, ApJ, 453, 48 Ellis R. S., 1990, in Kron R. G., ed., ASP Conf. Ser. Vol. 10,
Evolution of the Universe of Galaxies. Astron. Soc. Pac., San Francisco, p. 248
Ellis R S., Colless M., Broadhurst T. J., Heyl J. S., Glazebook K., 1996, MNRAS, in press
Frei Z., Guhathakurta P., Gunn J., Tyson J. A, 1995, AJ, in press
Glazebrook K, Ellis R., Santiago B., Griffiths R., 1995a, MNRAS, 175, L19
Glazebrook K, Ellis R. S., Colless M. M., Broadhurst T. J., Alling-ton-Smith J. R., Tanvir N. R, 1995b, MNRAS, 273, 157
Griffiths R. F. et aI., 1994, ApJ, 437, 67 Holtzman J. A et aI., 1995, PASP, 107, 1065 Irwin M. J., 1985, MNRAS, 214, 575 Kneib J. P., Ellis R. S., Smail I. R., Couch W. J., Sharples R M.,
1996, ApJ, submitted Koo D. C., Kron R., 1992, ARAA, 30, 613 Lilly S. J., 1993, ApJ, 411, 401 Lilly S. J., Tresse L., Hammer F., Crampton D., Le Fevre 0., 1995,
ApJ, 455, 108 Loveday J., Peterson B. A, Efstathiou G., Maddox S. J., 1992, ApJ,
390,338 Schade D., Lilly S. J., Crampton D., Hammer F., Le Fevre 0.,
Tresse L., 1995, ApJ, 451, 1 Smail I., Ellis R. S., Fitchett M. J., 1994, MNRAS, 270, 245 Smail I., Hogg D. W., Yan L., Cohen J., 1995, ApJ, 449,105 Tresse L., Hammer F., Le Fevre 0., Proust D., 1993, A&A, 277,
53 Tyson J. A, 1988, AJ, 96,1 Williams R. E. et aI., 1996, in Benvenuti P., Macchetto F. D.,
Schreier E. J., eds, Science with the Hubble Space Telescope -II. STScI, Baltimore, in press
© 1996 RAS, MNRAS 279, L47-L52
© Royal Astronomical Society • Provided by the NASA Astrophysics Data System
Dow
nloaded from https://academ
ic.oup.com/m
nras/article/279/3/L47/967812 by guest on 06 July 2022
Copyright © 2022 FDOKUMEN