
MAG VLF INDUCED POLARIZATION HEM MAXMIN RPT
73
CiEOSICi Inc. EXPERTS-CONSEILS EN GEOPHYSIQUE FREEWEST RESOURCES CANADA INC. Magnetometer, VLF, Induced Polarization and HEM-MaxMin surveys Project 160.20 August 25th, 2005 on Sungold property, Wye Lake Grid, Powell Lake Area claim map G-0549 Thunder Mining Division Ontario 52B07 Work Report Simon Tshimbalanga, Eng. 3700, boul. de la Chaudiere, Sainte-Foy (Quebec), G1X 4B7 Telephone: (418) 877-7382 Telecopieur: (418) 877-4054
-
Upload
khangminh22 -
Category
Documents
-
view
2 -
download
0
Transcript of MAG VLF INDUCED POLARIZATION HEM MAXMIN RPT

~ CiEOSICi Inc. EXPERTS-CONSEILS EN GEOPHYSIQUE
FREEWEST RESOURCES CANADA INC.
Magnetometer, VLF, Induced Polarization and HEM-MaxMin surveys
Project 160.20
August 25th, 2005
on Sungold property, Wye Lake Grid,
Powell Lake Area claim map G-0549 Thunder Mining Division
Ontario 52B07
Work Report
~ l~
Simon Tshimbalanga, Eng.
3700, boul. de la Chaudiere, Sainte-Foy (Quebec), G1X 4B7 Telephone: (418) 877-7382 Telecopieur: (418) 877-4054

CONTENTS I. INTRODUCTION ......................................................................................................... 3
2. PROPERTY LOCALIZATION AND ACCESS .......................................................... .3
3. CLAIMS ........................................................................................................................ 4
4. FIELD WORKS, PROCEDURE AND INSTRUMENTS ............................................. 4
4.1 Magnetometer and VLF-EM ............................................................................... .4
4.2 Induced Polarization (lP) .................................................................................... .4
4.3 llEM-MaxMin ..................................................................................................... 5
5. MAGNETOMETRIC SURVEY ................................................................................... 6
5.1 Purpose of the Magnetometric survey ................................................................. 6
5.2 Presentation of results .......................................................................................... 6
5.3 Results of the Magnetometric survey .................................................................. 6
6. VLF-EM SURVEy ......................................................................................... " .............. 6
6.1 Methodology ........................................................................................................ 6
6.2 Presentation of results .......................................................................................... 6
6.3 Results of the VLF-EM survey ............................................................................ 7
7. INDUCED POLARIZATION SURVEY ...................................................................... 7
7.1 Purpose of the IP survey ...................................................................................... 7
7.2 Presentation of results .......................................................................................... 8
7.3 Usefulness of the Normalized Chargeability (NC) .............................................. 9
7.4 Probability of IP anomalies .................................................................................. 9
7.5 Description of the IP survey ................................................................................. I 0
7.5.1 Resistivity ............................................................................................................ 10
7.5.2 Chargeability ........................................................................................ , ................ 10
7.5.3 Normalized chargeability ..................................................................................... 11
7.5.4 Description ofIP anomalies ................................................................................. 11
8. HEM-MAXMIN SURVEY ........................................................................................... 11
8.1 Methodology ........................................................................................................ 11
8.2 Presentation of the results .................................................................................... 11
8.3 Description of the HEM-MaxMin results ............................................................ 12
9. DISCUSSION OF THE RESULTS AND RECOMMENDATION .............................. 13
10. CONCLUSION .............................................................................................................. 14
- DESCRIPTION TABLES OF IP ANOMALIES
- Certificate of Qualifications - Claim map and Claim abstracts + Equipment specifications
GEOSIG Inc.
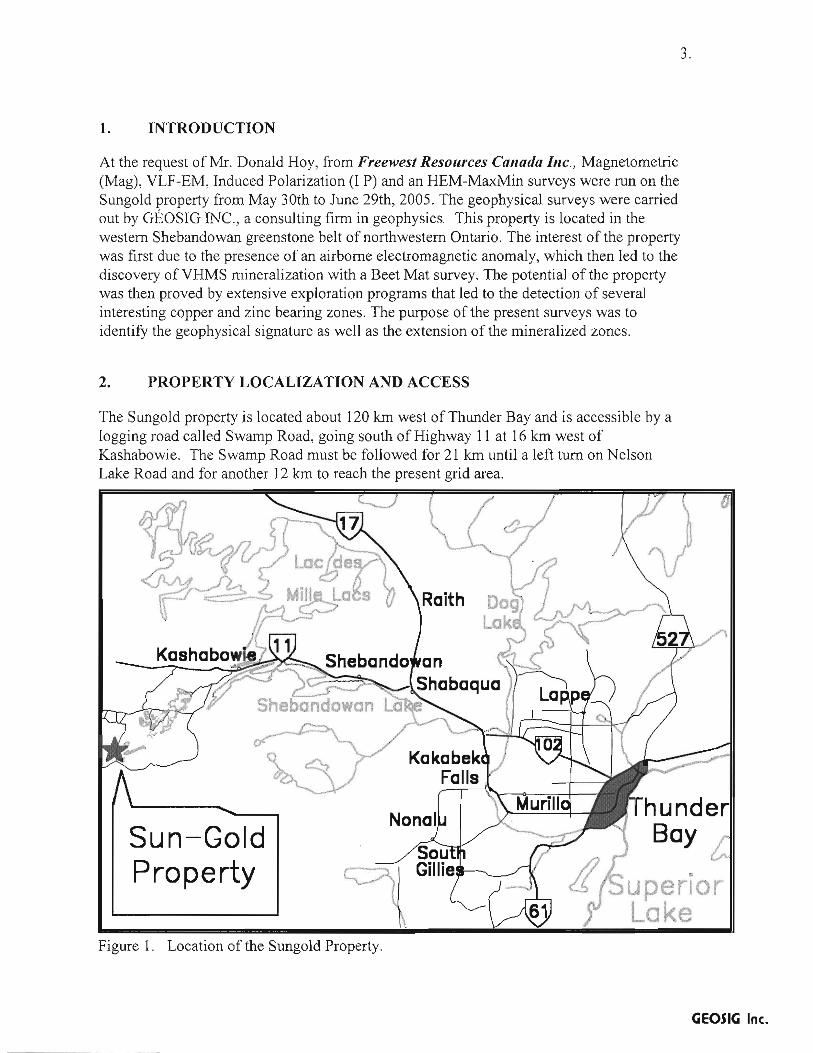
1. INTRODUCTION
At the request of Mr. Donald Hoy, from Freewest Resources Canada Inc., Magnetometnc (Mag), VLF-EM, Induced Polarization (I P) and an HEM-MaxMin surveys were run on the Sungold property from May 30th to June 29th, 2005. The geophysical surveys were carried out by GEOSIG INC., a consulting firm in geophysics. This property is located in the western Shebandowan greenstone belt of northwestern Ontario. The interest of the property was first due to the presence of an airborne electromagnetic anomaly, which then led to the discovery ofVHMS mineral ization with a Beet Mat survey. The potential of the property was then proved by extensive exploration programs that led to the detection of several interesting copper and zinc bearing zones. The purpose of the present surveys was to identiry the geophysical signature as well as the extension of the mineralized zones .
2. PROPERTY LOCALIZATION AND ACCESS
The Sungold property is located about 120 kIn west of Thunder Bay and is accessible by a logging road called Swamp Road, going south of Highway 11 at 16 kIn west of Kashabowie. The Swanlp Road must be fo llowed for 21 kIn until a left tum on Nelson Lake Road and for another 12 km to reach the present grid area.
___ ?--~~~~~Shebando';,an
3.
•
Sun-Gold Property uperlor
Lake Figure 1. Location of the Sungold Property.
GEOSIG Inc.

4.
3. CLAIMS
The Freewest 100%-owned Sungold property comprises 4 660 hectares and it is composed of contiguous, unpatented mining claim blocks located within the Thunder Bay Mining Division (Appendix A). The geophysical surveys covered only a section of the property (3 claim blocks). The claim abstracts and the portion of the Powell Lake claim sheet G-0549 which covers the Sungold Property are given in Appendix A.
The geophysical surveys partially covered the 3 claim blocks listed below: 3001635 3001638 1216479
4. FIELD WORKS, PROCEDURE A~D INSTRUMENTS
The 17 kilometers grid lines extend in a Northeast-Southwest direction. It includes Northwest-Southeast oriented lines 1 O+OOW to 5+00E. Lines are cut with 50-meters spacing and a base line intersects the grid at 0+00. The IP survey using a 6-separation dipole-dipole array at 25-meters spacing, totaling 16.3 km, was run on all lines except on lines 4+50E and 5+00E. The Mag-VLF and the MaxMin surveys covered the whole grid, totaling 17 kilometres. The preliminary results of all the surveys were processed on the field for a quality control.
4.1 Magnetometer and VLF-EM
The total magnetic field and VLF surveys were run by Jason Chadore, technician and Pierre Simoneau, geol M.Sc.
The Magnetometric equipment included a magnetometer EDA-Scintrex (base station), sin 254116, and two GSM-19WV (field units), sin 612627 and 66573. The GSM equipments are manufactured by GEM System Inc. (Richmond Hill, Ont.). This magnetometer system measures the value of the total magnetic field with a precision of ± 1.0 nT. Field readings ofthe earth's total magnetic field were taken every 12.5 meters, while the base station readings were recorded every 15 seconds. Diurnal corrections and instrument drifts were then automatically computed when the data of both instruments was dumped to a computer.
Measurements for the total magnetic field were taken in a mobile Mag mode with a three (3) seconds sampling readings and label readings taken each 12.5 meters.
4.2 Induced Polarization (IP) The IP survey was performed in the time domain mode with a standard waveform: 2 seconds ON, 2 seconds OFF. We used a dipole-dipole array, with a 25 meters electrode spacing, and readings were taken at every separation (n= 1, 2, 3, 3, 5 and 6).
GEOSIG Inc.

5.
Steel pin electrodes were used for the receiver and the transmitter. On the receiver electrode spreads, stainless steel pin electrodes were used in order to improve the signal-to-noise ratio. The following equipment was used:
Receiver: Elrec-6 built by IRISIBRGM, sin 33
Transmitter: T3P 217 1,8 kW built by Instrumentation GDD Inc.
The receiver read out chargeability (M) within 0.1 msec on ten windows, which were added up with the following formula:
NORMALIZED IP CURVE (Newmont standard IP decay curv~
N = (l60M l Kl + 160M2K2 + 160M)K) + 160M)K3 + 160MSKS + l60M6K6 + 160M7K7 + 160MS KS +
160M9K9 + 160M lOKIO) I 1600.
The party chief for the IP survey was George Tiliki, MBA. He was assisted by the following technicians:
Jason Chadore, technician,
- Chad Atwood, technician,
Murray Hutchins, technician,
Brian Hall, technician,
Tom Clason, technician,
Maps and pseudo-sections were drawn by Pierre Simoneau and finalized by Donald Saindon.
4.3 HEM-MaxMin
Readings of the horizontal loop electromagnetic survey (HEM-MaxMin) were taken every 25 meters on all the lines. The integrated components of the MaxMin system consist of following items: - Electronic notebook: MMC made by Apex Parametrics (Toronto) nls 382 - Receiver: MaxMin II-5 made by Apex Parametrics (Toronto) nls 780 - Transmitter: MaxMin II-5 made by Apex Parametrics (Toronto) nls 779 The HEM-MaxMin team was composed of:
Pierre Simoneau, geol. M.Sc., Jason Chadore, technician
Simon Tshimbalanga, Eng. made all the geophysical interpretations and wrote the report.
GSOSIG Inc.

6.
5. MAGNETOMETRIC SURVEY
5.1 Purpose of the Magnetometric survey Magnetic surveys are useful in exploration as magnetic anomalies mostly represent changes in the physical properties of subsurface rocks. The property of a rock determines its magnetic effects and the intensity of its magnetization. During a survey, we measure the total magnetic field and, the resulting total field map allows the definition of near-surface magnetic bodies and the vertical gradient helps to trace their contacts.
5.2 Presentation of results All the MAG data has been plotted on maps at a 1:2 500 meters scale, using computer software programs: Geosoft and MicroStation. On map no. 7836, the total field magnetic results are presented as profiles and posting. The profiles appear as red lines at a vertical scale of 2000 nT per centimetre, with a base value of 57 700 nT. A total magnetic field colour contour map has also been drawn at the same scale on map no. 7837.
5.3 Results of the Magnetometric survey The property magnetic background is around 57 760 nT with a maximum of 69256 nT and a minimum of 53654 nT. The Magnetometric colour contour map shows that the magnetic is very active in the area. This magnetic activity has provided several magnetic horizons with a predominant northeast-southwest trend. The ground magnetic survey seems to confirm the geological trend.
6. VLF -EM SURVEY
6.1 Methodology
A total of 17 km of lines was covered with the electromagnetic survey. The parameters in-phase and out-of-phase components (both as a percentage of the field strength) and the total electromagnetic field were read and recorded for two frequencies: 24.0 kHz (NAA, Cutler) and 24.8 kHz (NLK, Seattle). All readings were automatically recorded assuring an accuracy of more or less 0,1 %. Readings were taken every 12.5 meters on all the lines.
6.2 Presentation of results
All the results are presented on maps at a 1: 2 500 scale. The profiles of the two frequencies and the total electromagnetic field with the interpretation ofthe MaxMin and IP surveys are shown on maps no 7838 (24.0kHz) and no 7839 (24.8kHz). The profiles of both components of the two frequencies are plotted at a 1 em for 60 % scale where as the profiles of the total electromagnetic field are plotted at a 1 cm for 5 pT for the 24.0 kHz and I cm for 10 pT for the 24.8 kHz. In-phase profiles are in red and full lines while out-ofphase profiles are in bleu and dashed lines. The total electromagnetic field is in green.
GEOSIG Inc.

7.
6.3 Results of the VLF-EM survey
The VLF-EM survey was conducted to confirm the presence of bedrock conductors detected with an airborne EM survey and to determine the geophysical signature and the extension of a copper-zinc showing found with a Beep Mat survey.
More than sixteen (16) electromagnetic anomalies were detected. Both frequencies have detected good anomalies but the 24.S kHz (NLK, Seattle) frequency seems to have a better electromagnetic coupling. The EM conductors have the same trend than the magnetic horizons (NE-SW).
The best conductors produce the anomalies VLF-J to VLF-3, VLF-6 to VLF-8 and VLF-IO and VLF-12. The EM anomalies VLF-6 to VLF-S, VLF-JO and VLF-12 follow closely the airborne EM anomalies and they seem to correspond to the area of interest. These good conductors represent the first priority for the drilling investigation.
Anomalies VLF-J to VLF-3 occur in the northeast corner of the grid and VLF-J and VLF-2 partly correspond to IP anomalies. These J 50-m to 300-m long anomalies are all three strong EM conductors and they represent good drilling target
Anomalies VLF -4 to VLF -S and VLF -13 occupy the central part of the grid, which is the area of interest due to the proximity of the VHMS mineralization showing detected with the Beet Mat. Their length vary from 50 meters to 550 meters. VLF-6 to VLF-8 and VLF-13 partly correspond to magnetic horizons and to IP anomalies. The anomalies VLF -6 to VLFS reflect strong EM conductors and they are probably representative of a near surface massive sulphide body. They therefore deserve drilling investigation.
Anomalies VLF -9 to VLF -12 are located in the southwestern corner of the grid and they all represent good 200-m or more EM conductors. VLF-IO to VLF-12 correspond to IP anomalies. They are also probably representative of massive sulphide body and they deserve drilling investigation. Anomalies VLF -14 to VLF -16 occur in the southeast corner of the grid. They represent three weak electromagnetic conductors that have possibly an extension to the east. VLF -14 mimics partly an IP anomaly and VLF-16 corresponds to a magnetic horizon.
7. INDUCED POLARIZATION SURVEY
7.1 Purpose of the IP survey
An IP survey is usually done in order to detect conductive and/or polarizable materials such as sulphides or graphite. Therefore, the survey consists in measuring the chargeability (M) and the apparent resistivity (R) along the grid lines surveyed. Theoretically, the resistivity map should pinpoint conductive sulphides or graphite bodies. In reality, resistivity maps usually reflect variations in the conductivity and thickness of the overburden. The chargeability (M) measurements do allow the detection of sulphides or
GEOSIG Inc.

graphite bodies, either massive or disseminated, as the overburden seldom if ever shows any chargeability. In areas of variable overburden conductivity, chargeability "anomalies", even over massive sulphides bodies, are subdued where the surface conductivities are high. Readings may be lower over sulphides bodies covered by clays (as low as 3 msec) than over non-mineralized but highly resistive volcanic outcrops (10 to 20 msec). To interpret an IP survey with such variations, both sets of measurements, chargeability and resistivity, must therefore be studied together. This is why we prepared normalized chargeability (NC) maps as they reflect better the actual distribution of sulphides and other polarizable materials. Resistivity and raw chargeability maps are also drawn.
7.2 Presentation of results
8.
The results of the survey are represented at a 1: 2 500 meters scale. On map no. 7832, we plotted the three profiles at the following scales:
Chargeability (M) Surface resistivity (R)
30 msec/cm Logarithmic scale: 1 to 1 000000 Q-m, 2 cm per decade 1000 Q-meters centred on the line
Normalized chargeability (NC) 15 mhoseclcm
The NC filter were calculated from M and R with the following formula:
NC R
where: NC R M Vp I a n 9,58
9,58 * M/-JR TI * a * n (n+l) * n (n+2) * Vp/I
= normalized chargeability, mho sec apparent surface resistivity, Q-meters chargeability read on the receiver display, msec.
= voltage between receiver electrodes, mvolts = current transmitted, mill i-amperes = electrode spacing, meters
number of separations normalization factor
We gave the name of mhosec to the normalized chargeability as it is obtained by multiplying the conductivity (I/R) measured in mhos by the chargeability (milliseconds), or mhosec. By combining those two parameters, we created the new name, mhosec. The resistivity, chargeability and the normalized chargeability, also at the first separation, have been contoured and they respectively appear on maps no. 7833, 7834 and 7835. The six separations are presented as colour contoured pseudo-sections at the 1: 2 500 meters scale. The interpretation of the IP survey is based on the pseudo-sections, which was then transferred on the profiles.
GEOSIG Inc.

9.
7.3 Usefulness of the Normalized Chargeability (NC)
An IP survey consists in measuring the apparent resistivity and chargeability between four electrodes in order to predict the distribution of sulphides and other polarizable materials such as graphite. From those two parameters, we calculate the Normalized Chargeability using the formulas mentioned above. In areas of variable overburden conductivity, the application of the NC filter compensates for the high background charge ability observed in areas of high resistivity (outcrops or outcrops covered by very thin overburden) or the extremely low background chargeability observed in areas of swamps and conductive overburden. The purpose of the exercise is to refine the NC so that a given mass of sulphides is represented by an anomaly of at least very approximately the same amplitude, whatever the nature and depth of the surface overburden.
7.4 Probability of IP anomalies
In an attempt to clarifY our reports, we add one parameter to the description of each anomaly. In geophysics, we may express the probability that a bedrock source anomaly exists. Here is an explanation of that parameter we will use to better describe the anomalies of our surveys:
- A 0.9 probability indicates that the anomaly is actually present in the bedrock and that it will be intersected in more than nine out of ten attempted drill holes. A miss on such an anomaly means that there is either a mistake in chaining, or that the drill hole crossed the anomaly through a dyke, a faulted offset, or a local "barren" hole. Anyone with experience in a mine will testifY that such occurrences can occasionally happen.
- A 0.5 probability means that the signature of the anomaly is somewhat doubtful, the signal-to-noise ratio is less than 3, either because the overburden is deep or because of the interference of an adjacent stronger anomaly. The probability that the anomaly corresponds to a target is therefore lowered to a point where only one in two of such drill holes will hit a target. For example, if a target is small but of cylindrical shape, a drill hole collared too far away may completely miss the anomaly if the cylinder has a lateral rake. Any target having a 0.5 probability should be drilled if the local geology is favourable or if targets are few or far between. Out of the thousands of drill holes that we have recommended up to now, only six have resulted in mining operations. For three out of these six mines, the first drill hole was spotted on a doubtful anomaly where the probability was about 0.5 or, in other words, there was only one chance out of two to explain the anomaly by a bedrock source. And yet, most DDH are drilled on anomalies that have a probability of 0.9.
CiEOSICi Inc.

10.
- A 0.2 probability means that, on the average, only one drill hole in five will intersect a sulphides concentration important enough to explain the anomaly. It is often much better to drill such weak IP anomalies if the geology is favourable than to select diamond drill targets at random, or even to select magnetic anomalies or VLF targets. When comparing targets for example, we believe that the probability is much less than 0.1, that an "average" magnetic anomaly will correspond to sulphides or graphite and, if we consider VLF anomalies in clay areas, the probability is lower than 0.05, or hardly better than luck. However, VLF anomalies where the overburden is resistive may be just as reliable as MaxMin or Pulse surveys in outcrop areas, or where the overburden is non conductive.
7.5 Description of the IP survey
7.5.1 Resistivity
The apparent resistivity on this area varies from 63 a-meters to 82 000 a-meters. The average value in this area is higher than 7500 a-meters. As mentioned earlier, the resistivity maps usually reflect variations in the conductivity and thickness of the overburden. The variation of the resistivity on an IP survey is also often associated with the different types of rocks where the overburden is shallow. The higher resistivity zones reflect areas of outcrops or outcrops covered by very thin overburden.
The colour-contoured map of resistivity (7833) shows mostly a high resistivity area, which occupies the whole property, with intercalated lower resistivity horizons that often correspond to either EM conductors or IP anomalies.
7.5.2 Chargeability
The background chargeability, on map no. 7834, varies from 4 milliseconds in the northeast part of the grid to 7.5 milliseconds in the rest of the surveyed area. The chargeability colour contour map seems to outline two different geological formations. The north part shows a weakly polarizable unit where as the south part reflects a much stronger polarizable unit, probably an ultramafic one. IP anomalies are identified as an increase of chargeability in respective background and, on this property, most of the anomalies stand out of their respective background.
CiEOSICi Inc.

8.
11.
7.5.3 Normalized chargeability The background NC values vary from 0.5 to L.O mhosec. Generally, with such low reference levels, even small amounts of sulphides give a clear anomaly. The individual anomalies are described in the table below.
7.5.4 Description of IP anomalies The IP survey led to the localization and description of 35 IP anomalies. Most of the anomalies have a roughly Northeast-Southwest trend and, some correspond or are in the vicinity of magnetic horizons with the same trend. The annexed table summarizes the main characteristics of the IP anomalies of this survey. In the priority given in the description table, only the geophysical characteristics are considered.
HEM-MAXMIN SURVEY
8.1 Methodology
A total of 16.3 km of lines was covered with the horizontal electromagnetic survey.
A MaxMin 11-5 portable unit was used in the maximum-coupled mode (horizontal loops ) with two different reference cables, a 100m and a 200m. The parameters (in-phase and out-of-phase components of the secondary field) were read and recorded for three frequencies: 444, 1 777 and 3 555 Hz. All readings were automatically recorded with an MMC electronic notebook assuring an accuracy of more or less 0,1 %. Readings were taken every 25 meters on all the lines except lines 4+50E and 5+00E.
8.2 Presentation of the results
All the results are presented on two maps at a 1: 2 500 scale. The maps no 7838 (100m) and 7839 (200m) show the profiles of the three frequencies with the interpretation of the MaxMin, VLF and IP surveys. The profiles of both components of the three frequencies are plotted at a 1 cm for 15 % scale. In-phase profiles are in full lines while out-of-phase profiles are in dashed lines. The lowest frequency (444Hz) is in bleu, the intermediate one (1 777Hz) is in green and the highest frequency (3555Hz) is in red. The interpretation and qualification of anomalies were done using the 1777Hz frequency.
GEOSIG Inc.

12.
8.3 Description of the HEM-MaxMin results The MaxMin survey was also conducted to confirm the presence of bedrock c:onductors detected with an airborne EM survey and to determine the geophysical signature and the extension of the high grade zinc and copper discovery.
A better electromagnetic coupling have been obtained with the 100m reference cable than the 200m one. Six (6) electromagnetic anomalies were detected MM-l to MM-6. The theoretical conductivity and depth to the conductors axis were determined, when the data permit it, but these calculated values are given only as indicators and could be wrong.
The best HEM anomalies are MM-l to MM-3 with respectively conductivities of7, 18 and 4 mhos and depths of 18, 23 and 27 meters. Anomaly MM-5 is also of interest due to the proximity of the Zinc-copper showing.
Unfortunately, the survey does not give clearly the dip of the conductors. On several lines, anomalies have not been totally covered. However, MM-l on line 7+50W and MM-4 suggest a dip to the northwest. Anomalies MM-l, MM-2, MM-5 and MM-6 correspond to IP anomalies and all six HEM anomalies except MM-3 correspond to VLF conductors. They also seem to be related to magnetic horizons.
MM-l This anomaly runs through line 6+50W station 0+62S to line 8+50W station 1 + 12S. The best intensity of the anomaly is on line 7+50W at station 0+87S. This 200 meters long anomaly is clearly following the North boundary of a magnetic horizon.
MM-2 This short 50 meters long anomaly runs through line 5+50W to line 6+00W at station 0+12S. It is most definite and stronger on line 5+50W. It also corresponds to the North contact of a Mag layer.
MM-3 and MM-4 These two short conductors are isolated and they occur respectively on line 5+00W, station 0+50N and line 4+00W, station 0+25N.
MM-5 MM-5 is a short 50 meters long anomaly that extends from line 0+00 to line O+50W, at station 0+25N. It reaches its best intensity on lines 0+00. This 25m large anomaly probably represents a multiple conductor horizon. It corresponds to magnetic high on line 0+00 and it is located very close to the showing.
MM-6 This weak anomaly runs through line 9+00W to line 10+00W at about 2+258. It has a possibility of extension to the west.
GEOSIG Inc.

13.
9. DISCUSSION OF THE RESULTS AND RECOMMENDATION
Magnetometric The sunTey area is characterized by strong magnetic contrasts that allow the discrimination of different geological structures.
Induced Polarization and HEM-MaxMin Numerous IP anomalies caused by weak to high IP values have been detected. For the interpretation, Geosig Inc. used the map of the total magnetic field as a guide to help for the correlation from line to line of the IP anomalies. This correlation may not be the best one. An alternative correlation based on geophysical and geological information could be different. Some of the IP anomalies are correlated to magnetic horizons. Most of the IP anomalies that show a correlation with magnetism are located at the contact of high magnetic bodies.
The IP survey has detected much more anomalies than the other methods, and most of these IP anomalies are located south of the base line. This area is probably underlined by ultramafic rocks with disseminated sulphides. At the opposite, the EM surveys did not detect all IP anomalies, but this is a more normal situation since the IP survey has the capability to detect disseminated non conductive polarizable materials as well as massive conductive or non conductive ones. For the investigation of target with DDH, priority must be given to area where combined geophysical anomalies extend in the vicinity of the high grade zinc-copper discovery.
GEOSIG Inc.

14.
10. CONCLUSION
This geophysical campaign gave very interesting information about this Property.
The Magnetometric survey gives a good image of the geology and helps to discriminate numerous magnetic horizons. Some of the magnetic layers correspond to IP anomalies.
The HEM-MaxMin survey was useful in confirming the presence of electromagnetic conductors on the Sungold property. Six HEM-MaxMin anomalies were detected by this survey.
The VLF-EM survey on this property uncovered sixteen electromagnetic conductors among which nine major anomalous axis are identified.
The IP survey led to the detection and description of 35 anomalies, some of which correspond to magnetic layers, to VLF-EM and to HEM-MAXMIN conductors. IP-3, IP-5 and IP-7 may represent the IP response and the extension of the high grade zinc-copper Discovery zone as they align themselves with it.
Since zinc-copper mineralization may often be poor conductors, all the anomalies should be considered even if marginal.
GEOSIG Inc.

LIST OF MAPS
Scale: 1: 2 500
IMap# Title 7832 Induced Polarization Survey
Profiles and Posting 7833 Induced Polarization Survey
Resistivity Contours 7834 Induced Polarization Survey
Chargeability Contours I
7835 Induced Polarization Survey Normalized Chargeability Contours
7636 Magnetometric survey Profiles and Posting, Total Field
·7837 Magnetometric survey Total Field Contours
7838 HEM -MaxMin survey Profiles and Posting, Reference cable: 100 meters
7839 HEM-MaxMin survey Profiles and Posting, Reference cable: 200 meters
7840 VLF-EM survey Profiles and Posting, 24.0kHz (NAA, Cutler)
7841 VLF -EM survey Profiles and Posting, 24.8kHz (NLK, Seattle)
CiEOSICi Inc.

Description table of IP anomalies
# From To Length Target IP Resist. NC Proba- Prio- Comments Ln/Stn Ln/Stn (mete Ln/Stn (msec) (Q-m) (mhosec) bility rity
rs) I back I back I back
IP-l O+SOW 4+00E 450 2+S0E 13/3.5 753/> 10k 4.3/0.5 0.9 1 Long and moderate IP anomaly showing strong 2+2SN 1+S0N 2+12N ! resistivity drop on L- 2S0E. Corresponds to a high
Mag horizon and partially to VLF -1 and VLF -3 conductors. Possible extension to the NE.
IP-2 6+00W 6+00W - 6+00W 22.0/7.0 587 / 10k 8.6/0.5 0.7 2 Strong but not well defined IP anomaly showing 0+37S 0+37S 0+37S ! strong resistivity drop. Very close to VLF -6 and on the
SW nose of a high Ma.-& zone.
IP-3 I+S0W I+S0E 300 1+00W 22.0/7.0 1373/> 10k 5.6/0.5 0.9 1 Weak to moderate IP anomaly showing strong 0+62N 0+62N 0+62N ! resistivity drop. Corresponds partially to VLF-6
conductor and to a high Mag. Located very close to the showing. Skips LSOE.
IP-4 3+S0W 6+00W 250 4+00W 30/7.0 459/ >3k 13.0/0.5 0.7 2 Weak to strong IP anomaly showing resistivity drop. 0+62N 0+12S 0+62N ! Not well defined. Corresponds to VLF-6 and MM-2
conductors and to a high Mag. On strike with IP-3.
IP-5 3+S0W O+SOW 300 O+SOW 25.0/7.0 564/ >3k 10.0 /0.5 0.9 1 Moderate to strong IP anomaly showing resistivity 0+2SS 0+37N 0+37N ! drop on east part that partially correspond to VLF -7
and MM-S conductors. Probably the signature and extension of the zn-cu showing. Represents probably the same horizon than IP-7 and IP-21.
IP-6 2+00W O+SOW 150 2+00W 36.0/7.0 8k / uniform 3.7/0.5 0.7 2 Moderate IP anomaly intermixed with nearby 1+00S 1+12S 1+00S anomalies. Located on the contact of a high Mag.
IP-7 O+OOE O+SOE 50 O+OOE 27/7.0 434/ >5k 12/0.5 0.9 1 Strong increase of IP associated to a resistivity drop. O+OON 0+2SS O+OON ! Corresponds to VLF-8 & MM-S EM conductors.
Probably the signature and extension of the zn-cu showing. On strike with IP-S.
IP-8 1+00W 1+00E 200 O+OOE 43.0/7.0 8743 / contact 4.4 / 0.5 0.8 1 Moderate to strong IP anomaly intermixing with 0+37S 0+7SS O+SOS nearby IP anomalies. Corresponds to a High Mag. In
the vicinity of the showing.

" m e a 5" !'
#
IP-9
IP-I0
IP-ll
IP-12
IP-13
IP-14
IP-15
IP-16
IP-17
IP-18
From Ln/Stn
1+50W 0+75S
0+50W 1+37S
1+00E 1+25S
3+50W 1+25S
3+00E 2+00S
2+50E 2+50S 3+50E 3+00S
O+OOE 2+75S 1+50W 2+50S
2+00E 3+75S
To Length Target Ln/Stn (mete Ln/Stn
rs) 1+00E 250 l+OOW l+OOS 0+87S
0+50W - 0+50W 1+37S 1+37S
2+50E 150 2+00E 1+62S 1+50S
1+50E 500 3+50W 1+87S 1+25S
4+00E 100 3+50E 1+62S 1+75S
4+00E 150 3+00E 2+12S 2+25S 4+00E 50 3+50E 3+12S 3+00S
3+00E 300 1+00E 3+62S 3+00S 3+00E 450 3+00E 3+87S 3+87S
3+50E 150 3+50E 4+25S 4+25S
3.
Description table of IP anomalies
IP Resist. NC Proba- Prio- Comments (msec) (Q-m) (mhosec) bility rity I back I back I back
65/7.0 7k / > 14k 7.4 / 0.5 0.9 1 Strong IP anomaly showing weak resistivity drop. On
t high Mag zone contact. Intermixed with nearby IP anomalies. Located not far from the Discovery zone.
47.0/ 10 7k / > 11k 5.3 / 1.0 0.7 2 Strong IP anomaly occurring in a high resistivity area.
t Intermixed with nearby anomalies. Corresponds to a high Mag.
30.0/5.0 4462/> 11k 4.2/0.5 0.9 1 Strong IP anomaly showing a weak resistivity drop.
t Located on the contact of a high Mag zone. Partially corresponds to VLF -14 conductor. Probably the same horizon than IP-9.
40/7.0 5.5K / > 9k 5.1 /0.5 0.8 1 Moderate to strong increase of IP in a complex
t resistivity pattern. Corresponds to a low Mag.
20/5 3400 / gradient 3.2 /0.5 0.4 3 Weak IP anomaly on a resistivity gradient. Corresponds to a high Mag zone. Possible extension to the east.
15/5 6.3k / complex 1.7/0.5 0.3 3 Weak IP anomaly in complex resistivity pattern. Skips line 3+50E.
22/5 11 k / complex 1.9 / 1.0 0.4 3 Weak IP anomaly in a complex resistivity area. Possible extension to the east. Corresponds to high Mag zone.
41/7 4.7k / uniform 5.7/0.5 0.7 2 Moderate to strong IP anomaly partially associated to a Mag high.
43/7 1441/>5k 11 / 1.0 0.9 1 Strong increase of IP intermixing with nearby IP
t anomalies and showing weak resistivity drop. Located on the contact of h!gh Ma..£
34/5 4k / uniform 5.1/0.5 0.8 2 Moderate to strong IP anomaly not totally covered. Intermixed with IP-17. Possible extension to the east.

4.
Description table of IP anomalies
# From To Length Target IP Resist. NC Proba- Prio- Comments Ln/Stn Ln/Stn (meters) Ln/Stn (msec) (Q-m) (mhosec) bility rity
I back I back I back
IP-19 2+00W O+50W 150 2+00W 27/10 9.7k / gradient 2.6/0.5 0.5 3 Weak to moderate increase of IP intermixed with IP-2+00S 2+00S 2+00S 35. Skips line l+OOW. On strike with IP-29.
IP-20 lO+OOW 5+50W 450 7+00W 24/5 7.4k / > 20k 2.7/0.5 0.7 2 Moderate to strong increase of IP on a high O+12S O+62N O+37N t resistivity area. Mag association. Skips line 8+00W.
Disseminated sulphides or magnetite. Possible extension to the SW.
IP-21 6+00W 4+00W 200 4+50W 34/7.0 5.2k / > 8k 4.4 / 1 0.7 2 Weak to moderate IP anomaly with weak drop of 1+25S O+50S O+75S t resistivity in surface. On strike with IP-5. Mingles
with IP-24.
IP-22 8+00W 6+50W 150 7+00W 20/5 947/> 4k 6/0.5 0.5 2 Moderate to weak IP anomaly showing good drop of O+87S O+75S O+75S t resistivity. Corresponds to VLF-6 and MM-2 EM
conductors. Located on the contact of a Mag high. On strike with IP-2, IP-4 and IP-27.
IP-23 7+00W 6+50W 50 6+50W 27/5 4.5k / contact 3.7/0.5 0.5 2 Moderate increase of IP intermixing with nearby IP. 1+12S l+OOS 1+00S
IP-24 6+00W 4+00W 200 5+00W 40/7 7k / unifonn 4.5 / 1.4 0.7 2 Strong increase of IP associated to a Mag high. 1+37S O+75S 1+00S !'v1ingles with nearby IP anomalies.
f---.
IP-25 6+50W 4+00W 250 6+50W 44/7 6.8k / > 10k 5/1.4 0.8 2 Moderate to strong increase of IP intermixing with 1+75S O+87S 1+75S t nearby anomalies. On strike with IP-30 & IP-31.
IP-26 5+50W 4+50W 100 5+50W 40/7 10k / unifonn 3.8/1.4 0.8 2 Moderate to strong increase of IP intermixing with 1+62S 1+50S 1+62S nearby anomalies. Corresponds to a high Mag body.
IP-27 lO+OOW 8+50W 150 9+50W 26/7.0 3.7k / > 12k 4/0.5 0.9 1 Moderate to strong increase of IP showing drop of 1+50S 1+37S 1+37S I resistivity in a high resistivity area. Corresponds to
J, VLF-IO and MM-l EM conductors on L850W. Mag association. Possible extension toward SW.
IP-28 7+00W 7+00W - 7+00W 38/7.0 3.5k / > 12k 6.1/1.4 0.7 2 Strong increase of IP corresponding to a low Mag. 1+50S 1+50S 1+50S t Mingles with IP-23.

5.
Description table of IP anomalies
# From To Length Target IP Resist. NC Proba- Prio- Comments
Ln/Stn Ln/Stn (meters) Ln/Stn (msec) (Q-m) (mhosec) bility rity I back I back I back
IP-29 IO+OOW 3+00W 700 8+50W 50/7.0 6.8k / complex 5.8/1.4 0.9 1 Moderate to very strong increase of IP in a complex 3+25S I+87S 3+12S resistivity pattern. Intermittent Mag association. On
strike with IP-19. Possible extension to the SW.
IP-30 8+50W 7+50W 100 7+50W 35/7.0 659/> 2.4k 13/0.5 0.9 1 Strong IP anomaly showing a good resistivity drop. 2+00S 1+87S 1+87S t Corresponds to VLF -11 conductor and to a weak
Mag high on line 8+50W. On strike with IP-25.
IP-31 9+00W 7+00W 200 9+00W 30/7.0 224/> 3k 19/0.5 0.9 1 Strong IP anomaly showing a good resistivity drop. 2+I2S 2+I2S 2+I2S t Corresponds partially to VLF-I2 & MM-6 EM
conductors and to weak Mag high. On strike with IP-25.
IP-32 9+00W 8+50W 50 9+00W 45/7 10k / contact 4.2/1.4 0.9 1 Strong IP anomaly intermixing with nearby IP 2+87S 2+75S 2+87S anomalies.
IP-33 IO+OOW 5+50W 450 27/7 63/> lk 32/0.5 0.9 1 Strong IP anomaly showing strong drop of resistivity 2+37S 2+I2S 9+50W t on L950W & LIOOOW where it corresponds to VLF-
2+37S 12 and MM-6 EM conductors and to a weak Mag high. Intermixed with nearby IP anomalies. Possible extension to the SW.
IP-34 9+50W 8+00W 150 9+00W 42/7 20k / uniform 2.8/1.4 0.7 2 Strong increase of IP not totally covered by the 3+62S 3+37S 3+62S survey. Possible extension towards both sides.
IP-35 3+00W I+50W 150 2+00W 48/7 1634/> 9k 11 / 0.5 0.9 1 Strong IP anomaly showing a good drop of 2+37S 2+25S 2+25S t resistivity and a Mag association. Not totally
covered. Intermixed with nearby IP anomalies. Possible extension towards SW.

CERTIFICATE of QUALIFICATIONS
I, Simon Tshimbalanga, 1064, rue du Domaine, Cap-Rouge, Quebec, hereby certifY:
1. I am a graduate ofUniversite Laval at Quebec (1979) with an Engineer degree in Geology.
2 .I have been employed as an exploration Engineer and Geologist on a full time basis since 1977.
3. I am presently employed as a project Geologist with GEOSIG Inc. of3700 boul. De la Chaudiere, Sainte-Foy, Quebec, since 1980.
4. I own no direct, indirect or expect to receive any contingent interests in the subject properties or shares or securities of Freewest Resources Canada Inc.
5. I am a member of l'Ordre Des Ingenieurs du Quebec (OIQ), the Association Professionnelle des Geologues et Geophysiciens du Quebec (APGGQ), and of the (AEMQ) Association de 1 'Exploration Miniere du Quebec.
6. I have disclosed in this report all relevant material which, to the best of my knowledge, might have a bearing on the viability of the project and the recommendations presented.
Simon Tshimbalanga, Eng.
Geosig Inc.
Dated at Sainte-Fay, Quebec, this 25th day of August, 2005
GEOSIG Inc.

Appendix A
Claim Abstracts and Claim Map
GeOSIG Inc.

Mining Lands - Mining Divisions of Ontario
® Ontario Page 1 de 1
MinlSIl)' of N ortbern Development and Mines
central site I Feedb~ck I searo:h I site map I fr.m~ais i WHO WE ARE I MINES AND MINERALS I NORTHERN DEVELOPMENT I THE MNDM NETWORK NEWS RELEASES
Location: Ministry Home> Mines and Mineral Division Mining Lands> Mining Claims Information Thursday, August 18th, 2005
Active Mining Claim Abstract I Main MCllll I Back I
TlItNDF.:n. BA \ "lining Divi5ioll Claim No: TB 3001635 Status: ACTIVE
Due Date: 2005-NOV-12 Recorded: 2002-Nov-12
Work Required: $ 5,600 Staked:
Total Work: $ 5,600 Township/Area: POWELL LAKE (G-0549)
Total Reserve: $0 Lot Description:
Present Work Assignment: $ 21.060 Claim Units: 14
Claim Bank: $0
Claim Holders H.ecordrd llolder(s) Percentage RESSOURCES FREEWEST CANADA INC.. FRE.EWEST RESOURCES CANADA INC. ( 100.00 %)
Transaction Listing Type Ilate STAKER 2002-Nov- 12
STAKER 2002-Nov-12
WORK
OTHER
2004-Nov-12
2005-Mar-23
Claim Reservations
Applied
$ 5,600
f)C'ocriplion RECORDED BY RICHARD, MARTIN JOSEPH (K23012) RICHARD, MARTIN JOSEPH (302673) RECORDS 100.00 % IN THE NAME OF RESSOURCES FREE WEST CANADA INC., FREE WEST RESOURCES CANADA INC. (300786)
WORK APPLIED (ASSAY, GCHEM, JP, LC) APPROVED: 2004-NOV-25
WORK PERFORMED (ASSAY, PROSP) APPROVED: 2005-JUN-14
01 400' surface rights reservation around all lakes and rivers 02 Sand and gravel reserved 03 Peat reserved 04 Other reservations under the Mining Act may apply 05 Including land under water
Last modified: dimly 25/02/2005
cent[~Lsile I feedback I seard, Site I W_Q<LWl'Ar, I ~~~".!.~Minerals I N.Qrthern Devcloj)!lli;lll .!.= • .!2±>."""~"".!!"""" I News Relea~ I
@Ontario This site is m~intained by the Government of OntHio, Canada_
Comments. feedback, lecl1nical and general inquiries 10: cglQ,mb§,[email protected]
intbrrnation:© Queen's Printer for Onlario, ~005 Lwks Disclaimer I General Disclaimer
Client Number 300786
PrrformNI 'iumbu R0240.04465 R0240.04479
W0440.0 1763
$21,060 Q0540.00512
http://www.mci.mndm.gov.on.caJClaims/Cf Claims/elm _csd.CFM?Claim View Claim Num'&.~O~-~ 18

Mining Lands - Mining Divisions of Ontario
® Ontario Page 1 de 1
MinislIyof Northern Development and Mines
central ~iie I feedback I ~earch I site m.3p I fraru;ais I WHO WE ARE I MI'KES AND MINERALS I NORTHER'K DEVELOPMENT I THE MNDM NETWORK I NEWS RELEASES
Location: Ministry Horne> Mines and MineralDivision > Mining Lands> Mining Claims Information
Active Mining Claim Abstract I MainJy1~nll ! Back I
Thursday, August 18th. 2005
fliliNDEI< BA Y 'lining Division Claim No: In 3001638 Status: ACTIVE
Due Date: 2005-NOV-12 Recorded: 2002-Nov-12
Work Required: $ 6,400 Staked:
Total Work: $ 6,400 Township/Area: POWELL LAKE (G-0549)
Total Reserve: $0 Lot Description:
Present Work Assignment: $ 2,332 Claim Units: 16
Claim Bank: $0
Claim Holders Rcmriled Holder(s) PCl'I'('utage RESSOURCES FREEWEST CANADA INC., FREE WEST RESOCRCES CANADA INC. ( 100.00 %)
Transaction Listing Type Date STAKER 2002-Nov-12 STAKER 2002-Nov-12
WORK 2004-Nov-12 OTHER 2005-Mar-23
Claim Reservations
Applied
$6,400
Description RECORDED BY RICHARD, MARTIN JOSEPH (K230I2) RICHARD, MARTIN JOSEPH (302673) RECORDS 100.00 % IN THE NAME OF RESSOURCES FREEWEST CANADA INC. FREE WEST RESOURCES CANADA INC (300786) WORK APPLIED (ASSAY, GCHEM,IP, LC) APPROVED: 2004-NOV-25 WORK PERFORMED (ASSA Y, PROSP) APPROVED 2005-JUN-I4
01 400' surface rights reservation around all lakes and rivers
02 Sand and gravel reserved
03 Peat reserved
04 Other reservations under the Mining Act may apply 05 Including land under water
Last modified: d/m/y 25102/2005
I ccntral I feedback I search I site map I fran,ais I Who We Are I Mines am Minera!s I t-/Qx!hem De.Y~n!llenll TILC.MNDM Nctw_Qrk I News Rele,,,;~s I
@Ontario This site is m"lntained b~, the Government of Ontario, Can.adL
Comments, feedback, technical and general inquiries to: COIQrnt)eJ1I..Di\[email protected]).ca
Copyright information:\\:) Queen's Printer for Ontario, 2005 External Links Disclaimer General Disclaimer
C:lient Number 300786
Performed Numbl"r R0240.04465 R0240.04479
W0440.0 1763 $ 2,332 Q0540.00512
hrtp:llwww.mci.mndm.gov.on.ca/Claims/CC Claims/c1mcsd.CFM?Claim _ View Claim Nurnb~.~()ij~-dgSt 8

Mining Lands - Mining Divisions of Ontario
® Ontario Page 1 de 1
MinIstry of Northern Development and Mines
,:e rot ral sit e I fee dback I s .;,arch I site map I fr an~ais I WHO WE ARE I MINES AND MINERALS I NORTHERN DEVELOPMENT I TEE YfNDM NETWORK I NEWSRt:LEASES
Location: Ministry I {orne> Mines and Mineral Division> Mining Lands> Mining Claims Information Thursday, August 18th, 2005
Active Claim Abstract I MaiDM~m!· I
THl:\l)EH BA \ 'VI ining Ilivision Claim No: TU 1216479 Status: ACTIVE
Due Date: 2009-MAR-18 Recorded: 2002-Mar- I 8
Work Required: $900 Staked:
Total Work: $ 37,500 Township/Area: POWELL LAKE (G-0549)
Total Reserve: $0 Lot Description:
Present Work Assignment: $0 Claim Units: 16
Claim Bank: $0
Claim Holders Recl)rdl.'u f1older(~) Percl'rltagr HACKL, JOE ( 50.00 %)
Client Number 140414
HACKL, JOEY CHRISTOPHER ( 50.00 %) 221607
Transaction Listing Type nate Applied Description Performed STAKER 2002-Mar-18 STAKER 2002-Mar-18
OTHER 2004-Mar-17
WORK 2004-Mar-17
ORDER 2005-Mar-16
WORK 2005-Mar-23
Claim Reservations
$ 6.400
$ 31,100
RECORDED BY HACKL. JOEY CHRlSTOPHER (E33501) HACKL, JOEY CHRISTOPHER (221607) RECORDS 50.00 % IN THE NAME OF HACKL, JOE (140414) WORK PERfORMED (ASSAY, PROSP) APPROVED: 2004-JUL-22 Previously $ 6,400 11955 WORK APPLIED (ASSAY, PROSP) APPROVED 2004-JUL-22 Previously: 11955 RECORDER EXTENDS TIME UNTIL AND INCLUDING 2005-MAR-25 FOR WORK AND FILING THEREOF. WORK APPLIED (ASSA Y, PROSP) APPROVED: 2005-JUN-14
01 400' surface rights reservation around all lakes and rivers 02 Sand and gravel reserved 03 Peat reserved 04 Other reservations under the Mining Act may apply 05 Including land under water
Last modified: dimly 25/02/2005
I central site i feedback I search I site map I fran9ais I I W1HL';Vc Are I MineS and Minerals I Nort.h.CIIJ Development I The MNDM Network Il\cvsUl.cleasl'§ I
®Ontario This site is maintained by the Government of Ontario, Canada
Comments, feedback, technical and general inquiries to: [email protected]
Pnntcr for On!a rio, ~005 Di.s.l,lal1:ner I General DisclaimCl'
Number R0240.00855 R0240.00856
Q0440.00416
W0440 00416
D0540.00069
W(l54000512
http://vrvvw.mci.mndm.gov.on.ca/Claims/CfClaims/c1m csd.CFM?Claim View __ Claim Numb~~O~,;-dg~i 8

"Thc!IooI whihng 10 tt»ift l'l'Iil'tlftt ~ anoolod ~Jr MTt; m,. PrnvlndM II.Iarung RKad"- on..:. al the 1wI ...... .ty 01 Norttoom o.w.Il;IplJl ....... IWlId um_,... :.ddIJlnrutI Inbmallon tl1'I tnAtIUilUtI MII1e I.l'Kla 1IhoWt, hM..on T'hII ",ep ._nQlir!CIIIfI(l4IIJ for nEoIigllliQl'lAi. __ .,.,. , Of liIorId 11I. oMI4II'minllllon ~u 1h4>~ fI'I<Wm 01'1 thls mlllP I .. caupllO!d from ... ..,,,.ourau. CotrIfJIel.enoM..,<I acGJfitcy am no( gua11Ulleoitd . ... ~itionaI lnfarma!JfJt\ m..y.uo M abI~ I1ItoI.IgtlltM 1aa6 Lana l i .or RegJ.ry~. or tt,.,. .... «ry of N4IUf-.I R...oyte-.
n.. ... ~ ~ .. derr...cl tiWn diIOiIM 4aIUJ "' '' ... ..,1. '" Ihol) PrIJYlflCi~ MIniniI R.9cDn:ltlrll· OI1Ice .1 (hoi bPi,", ot dU.wlkleling "unl tt,. Wlnl-.ry of rjflttn.n ~"'''''IIfKIMIn .. '''' ..
Gen6rallnfOflTt~l ion lII"'1d Lim itation::. C«lUri:lrn~: Tal Fr.. M -I1J ~ NAO 83 Pn Mnci .. lalilng ReotJtdlilH'OtIc;.;: T~: 1 (8M,,, 5-91!-t 5 "JI15711'Bl!ed],an. UTN ,e tI.....-, w-... G'~1 Mll1« ce.~* 833 ~ La" Kc ... ;: ru: lla l1l UfO- l4-4-4 To pognl/HliC Daw S OUUJu .. LaM infurm.--ulon Ol1t~ SuclPury OM PlE f.B5 ~ 1.40'1<1 T MUrQ SOurce: PrtNinGIII MIfIII'I9 ~iIIf.· 0IIcw: Home p.g«, _ .mndm 9O'#.an .CllaIM"WAoeINESA.AND~~"'OV_tltlPl
f _
TNI f" l,'IP mil,. f'tal "'0. UIV!lOI .... tJd land l--.w" ~ InI~ In WId indlJdIfIO catam p fl l .-,tt". kta'Ulll. .. .......,... "oM r;JIw"y,.. IoodIng r¥tI ... ~ ar oItJ1W tonne Of ~JGn 0("etD IIl1CI ~; ... frQrlt IJ)eo Crowm. ~~" btl'td l..wre IH"I4IM'1d !J'" IhM ~ or proh .blt I'r~ ,"17y to ... rmn'"1l ~m.y "O( b. "'.ct>Qd.
ON~IO CANADA
... /IIISTR .... O f NORTHUtlil DEVfLDP_ftT NIIO MINes
PROVINCIAL MIlliNG RECORj)E;R"'S OFRCE
Dl'Ile I Time of I S~tJe : Mon Jul11 11 :05:15 EDT 2005
TOWNSHIP I AREA POWELL LAKE AREA
Mining Land Tenure Map
PLAN G-0549
ADMINISTRATIVE DISTRICTS I DIVISIONS
Mining Division
Land Titles/Registry Division
Ministry of Natural Resources District
TOPOGRAI'tlIC --'--""" ...-........
C4;:tI»U1 --~
_ ........... -. ""'" , ... _Goo_ ~
+ '-
Thunder Bay
THUNDER BAY
THUNDER BAY
_.-
_om _ .... -
1~
LAND TENURE WITHDRAWALS
-.. ... .....
~w ____ ,..,~
I<.'-"QAtJAW~ T~
!II.f _""-U" ....... a a..IIDo~Oor,~
....... ~09.~
DW Irl COUfII:II ............... I~ ......... ~ItlgIa~ ~~O.,~
\IrfIIIIt; .... t»r---
E IMPORTANT NOTICES
CLAIM MAP
SUNGOLD PROPERTY WYE LAKE GRID 2005

Equipment Specifications
GEOSIG Inc.

GSM-190verhauser
Magnetometer / VLF
GSM-19 overhauser magnetometer Features
... Sensitivity = 0.02 nT + Absolute Accuracy = 0.2 nT
+. Sample Rates up to 5 Hz
+. Low Power Consumption
General
"Overhauser" Once you experience it, you'll never go back to proton. Overhauser technology brings you sensitivities one to two orders of magnitude better than proton, yet in a light weight package. This is because the overhauser magnetometer consumes less power than proton magnetometer, allowing a lighter weight for batteries.
What is the Overhauser technique? The Overhauser sensor contains the electrons' fluid that has been added to a hydrogen rich in the form of "free radial". The resulting mixture yields a sensor with 5000 times gain in proton polarization. Since the Overhauser polarization effect does not require static magnetic fields, but uses radio frequency fields transparent to protons, measurement can be done concurrently with polarization. The result is a sensor with much greater sensitivity, that can be sampled much more rapidly than the standard proton sensor.
Overhauser magnetometer systems therefore maximize resolution while minimizing power consumption. Even with Walking Gradiometer systems, sampling at rates of once per second;
Even in cold temperatures of - 40 zero degrees Celsius and greater, the internal rechargeable battery can still be relied on for a 10 hour day, or longer.
The GSM-19 Overhauser is a State-of-the-Art Magnetometer / VLF system and offers the data quality, reliability, and extensive list of capabilities, and options, that allow it to meet a very wide spectrum of applications.
Instrument Description
"Physical Overview"
The parts of the GSm-19 magnetometer/gradlometer are as follows:
The sensor is a dual coil type designed to reduce noise and improve gradient tolerance. The coils are elec-
trostatically shielded and contain'a proton rich liquid in a pyrex bottle, which also acts as an RF resonator.
The sensor cable is coaxial, typically RG-58/U, up to 100m long.
The staff is made of strong aluminium tubing sections (plastic staff optional). This construction allows for a
selection of sensor elevations above ground during surveys. For best precision the full staff length should be
used. Recommended sensor separation in gradiometer mode is one staff section (56cm from sensor axis to
sensor axis), although two or more sections are sometimes used for maximum sensivity.
The console contains all the electronic circuitry. It has a 16 keys keyboard, a 4 x 20 character alphanumeric
display, and sensor and powerlinpuUoutput connectors. The keyboard also serves as an ON-OFF switch.
The power/inpuUoutput connector also serves as RS232C inpuUoutput and optionally as analog output
and/or contact closure triggering input.
The keyboard, front panel, and connectors are sealed i.e. the instrument can operate under rainy
conditions.
The charger has 2 levels of charging, full and trickle, switching automatically from ont to another. Input is
normally 110V 50/60Hz. Optionally, 12 VDC input can be provided.
The all-metal housing of the console guarantees excellent EMI protection.
"Software Version 4.0"
There are several major versions of software for the GSM-19. As of August 92, GEM Systems added a major software upgrade to its GSM-19 family, enhancing its capabilities. This new generation of software (version 4.0) has the following advantages:

i . 1 I
' !' 1 ., I
. I. , ,
I i
. i . .1' .:: L .
Specifications Dynamic Range
Tuning Metllod
'1·
AutomatiC Fine Tuning .
..
Display Resolution processing Sensitivity Statistical Error Resolution Absolute ACCUracy
Standard Memory Capacity Totat Field or Gradient 1ie·Line Points Base Station
DIsplay
RS 232 Serial I/O Interface Gradient TOlerance Test Mode
Sensor
Gradient sensors
Sensor Cable
...
Cycling Tll11e IBase Station Model
operating Environmental Range power Supply
Battery Cartridge/ Belt life
WelglltS and Dimensions Instrument ConSOle Only
i I
NICad or Alkaline Battery (arerldge Nicad or Alkaline Battery Belt Lead·Acld Battery Cartridge Lead·Acld Battery Bel t Sensor Gradient sensor
(0.5 m separation 'standardl Gradient Sensor
11 .0 m separation· optlonall . . Standard Systel11 COl11plement
Base Station Option Gradlometer Option
!:. I I I
'18.000 to 110.000 gammas. RolI·over disPlay feature sUlllJresses first significant digit upon exceeding 100.000 gammas. Tuning value Is calclilate(l accurately utilizing a specially developed tuning algoritlll11 . ± 15% relative to amoient field strengtl, Of last stored v31ue 0.1 garnmJ ± 0.02 gamma 0.01 gaml11a ± 1 gamma at 50,000 ~Iamrnas at 23°C ± 2 gal11ma over total temperature range
1.200 data IJlockS or sets of readings 100 data blocks or sets of reaclings 5.000 data blocks or sets of readings custom·designe(l. rU(lgedized liquid crystal display witl' an operating t€mperrltllre filllge from -/looe to + 55°(. TI"le displflY .conlClins six mil neriC digits, decill1;J1 point, tJ3ttery st;'1tus monitor, signill (lecav f;)te i1l1d signal .1mplitude monitor and function descriptors. 2~00 IJauCi. 8 data IJits. 2 stop bits. no parity 6.000 gammas per meter ifiel,1 provenl A. Diagnostic testing (clata and programmalJle memoryl B. self Test illardware) Qptill1izeclllliniilture clesiql1. MflQnetlc cle;:mliness is consistent will' tile speciliecJ JIJsolute aCcur;1CY. 0.5 meter sensor sep:lr.lt1on (stJndarcli. norm:llizecl to gammas/ meter. 0lJtiollal1 .0 meter sensor separation avallalJle. Horizon!;" sensors optioml. Relllillns flexible irllp.1l1uerJwre f(lllge speciriecl, includes str;Jln·relief cormector progrJIllJ1lZlble (rom 5 secollels UP to GO minutes in1 second irlcrenlellts -ao'( to + 55'C; 0-100% relative l,ul11idity; weatllerproof Non·magnetlc recl,argealJle sealed lead·acid battery carcriclge or belt; recllargealJle NiCad or DiSpOSillJle battery cartridge or IJelt; or 12V DC power source option for base station operation. 2,000 to 5.000 readings, for sealeclleacl acielpower supply. depending lIPon JmlJlent temperature and rate of readings
2.8 kg, 238 x 150 x 250ml11 1.2 kg, 235 x 105 x 90nll11 1.2 kg. sao x 100 x aOml11 1.8 kg. 235 X 105 x 90111111 1.8 kg. 540 x 100 x 40111111 1.2 kg, 56ml11 diameter x 200nll11
2.1 kg, 56p''11 diameter x 790111111
2.2 kg. 56111m dial11eter x 1300111111 Instrument consOle; sensor; 3'llleter CiJble. aluminulll sectional sensor staff, power supply, Ilarness <1ssembly. operations 1l1anual. Standard system plus 30 meter calJle St,mdClrcl systern Dlus 0.5 meter sensor
E 0 fI Ill r,l n 1111Crll <; 11lC. 11 rllOm( IHr~ Piltk Drive lorrmln.Olu,"lriO C;m il(l.1 MIIH 11-11 lrl(>l(, 06 2.522 2 eOA TOR (.ll)IP: 11l<;( rulllE'litS Toronto III I I)I 1I25 7800
111 U.S A . £ Ii 1\ 111 0;1 fluHrllfe; 11lC. '.i 10; I w.lIn RO.ld Whr:H I\'irlqr. (010r.1(lo U SA BOnn r:~ o.~) 1\22 9112
Prlllte(1ln Ci1Ili1(IJ
.. _--- -- ---. - - - - ----

.,.. .. .•
The Tx II 1400-W I.P. Transmitter Specifications
GENERAL • Size: 21 x 34 x 39 cm • Weight: approximately 20 kg • Operating temperature: -40·C to 65·C
ELECTRICAL CHARACTERISTICS • Used for time-domain I.P. : 2 sec. ON , 2 sec. OFF • Output current range: 0.005 to 10 A • Output voltage range: 150 to 2000 V
CONTROLS • Power ON/OFF • Output voltage range switch: 150 V, 350 V, 500 V,
700 V, 1000 V, 1400 V, 2000 V
DISPLAYS • Output current LCD: reads to ± 0.001 A • Standard LCD heater for very cold weather • Total protection against short circuits even at zero
(0) ohms • Indicator lamps:
- High voltage ON/OFF - Output overcurrent - Generator over or undervoltage - Overheating - Logic failure - Open loop protection
POWER • Recommended motor/generator set:
standard 120 V / 60 Hz backpackable Honda generator (650, 1400, or 1900 W)
Instrumentation GDD inc.
3700, boul. de fa Chaudiere Sainte-Foy (Quebec) Canada G1X 4B7
Tel. : (418) 877-4249 Fax: (418) 877-4054
E-mail : [email protected] Web site: www.gddinstrumentation.com
© Copyright 1997 Instrumentation GOD inc.

ELREC 6 (1'1'-8 MULTI C,.. ... NNEl lP/RESISTlVIT'Y RECEIVER
Si_ simull ..... IlOUs dipoles • Twel\ly proQ,.."m.ablol d\argUbilit y wondows . fioli' acClKoiCy.nd saoslllY'!",
Gen,ral
ELREC-6 by IRIS Orlean, France
E:JU:C 6 IS iI I; ' dipole TItIl' com.1!' Indueed Poi il nr,)"orl/Ru IUlv,ty Ree., ~ er dUII; I"ICId for I'wgI1 producHvity SUNOl'S in miner~1 <lnd gro un d ..... ! •• e_ploriltOn
ELREC 6 is ilv"';l.bIe in t wo models : t .... ,.,.." op t ion includes twent y pr09rimm.lble wondows in r ..... Oom~ mocJI , t .... iKon(! providn bo th t en proqr.,.,.,.bkI wmcklw~ iI'I Ti ..... Oom.,n mode .1 w .. lIS Ihl "r~y Domain mod .. .
81 .. dipolu
e.e,idll Ih .. Cl assic. prlselloglli tm.;c .and ¥ith ..... tic modlts, ELREC 6 also or,.,., vp tel IWl!tIlty foUl' ,ndejlendflflt pr09,ammtble WIndows which tn. Oper;Jtor C.., defin. by hims,,1f .cco"f ...... to thl "'IV he ",,,,t$ to u mptll the IP decAy curve.
Automo!lttc mlasuring process
• microprOCl1 sor f~y controls the synchrCor'Wz;Jtion, th , .. ,in ranging, the It.ckinq, .nl:l the dlSpI~y of tho ,,,s lits inclo,Jd,ng the .~.rent res,stlvlty.
Monitoring dts:plo!lV
0'"'9 the acqui sitoon, 11'10 eh'fge.clUl., 0' I .... s ilo dipc lll~ c ;on M displ .. ye c! llmvlteneously on tho LCO dlJp~y for iI gklb~ ~tSU"'l.l'on or t ....... dings ; the standMd d ...... tions of then chargedtiel C., . so b. displily~ Sllnul tilneousfy for .. rul ,,,.. monitOMg of t .... ~ .. li ty of the onqol'lg ,,,dings .
Specifications
Input Channels : Six
Signal waveform: Time Domain (ON+, OFF, ON-, OFF) wi th pulse duration of 0.5, I , 2, 4, 8 seconds
iP Chargeabllity Windows: Up to twenty arithmetiC, logarithmic, or fully program- mabie
Apparent Resistivily Computation: Average chargeability and standard deviation.
Input Impedance: 10 Mohm
Input Overvoltage Protection: up to 1000 valls
Input Voltage Range : Each dipole: 10V max sum of voltage of dipoles 2 to 6: 15v max
Automatic SP Bucking: ± lOV with linear drift correction up to 1 mV/s
Power Line Rejection : SO to 60 Hz
Sampling Rate : 10 ms
-Common Mode Reject ion: 100 dB ( for RS = 0)
Grounding Resistance : Measurement from 0.1 to 467 Kohm
Battery Test: Manual and automatic before each measurement
GEOSIG Inc.

APEX MAXMIN 11-5 EM SYSTEM D Designed for geoengineering applications and groundwater and mineral exploration,
continuing and expanding the concepts of the earlier and highly popular MaxMin models.
D Frequency span is extended to ten octavely spaced frequencies from 222 to 3555 Hz, with increased range and number of coil separations. These and other developments result in greater performance, with more applications and enhanced interpretation.
D Advenced spheric and powerline interference rejection is still further improved, resulting in faster and more accurate surveys, particularly at the larger coi I separations.
D MaxMin Computer or MMC, which is described in a separate data sheet, is offered for digital data processing, display, storage and transfer. The MMC displays and stores the in-phase and quadrature readings, their standard deviations, and the corresponding apparent ground conductivity values. Rough terrain surveys are also simplified with the MMC.
D Data interpretation and presentation programs are available for layered earth parametric ~~~ and discrete conductor done with MaxMin EM.
Transmitter Receiver + MMC

MAXMIN 11·5 ELECTROMAGNETIC SYSTEM SPECIFICATIONS:
APEX MAXMIN COMPUTER MMC IJ The MMC i terfaces with MaxMin EM System receivers for digital data
processing, display, storage and transfer, enhancing survey productivity and data accuracy.
IJ Digital display and logging of in-phase (real) and quadrature (imaginary) readings with standard deviati ns, the corresponding apparents groung conductivity values, line station, terrain slope and coil tilt information.
IJ Easy fi ngertip operation by read and store switches on MaxMin receiver front panel, with digital averaging fo r improved signal to noise ratio,
IJ Rough terrain surveys are simplified with the use of built-in-tilt meter, slope entry and computed coil orientation and separation information.
D Data transfer, formatting, correction and viewing programs are supplied fo r personal computers . Program for computing multi-frequency best-fit apparent conductivities and fit error is provided.
El Data interpretation and presentation programs are available for multi-layer parametric or geometric soundings and discrete conductor surveys done with MaxMin EM.
Receiver + MMC Transmitter
•

MAXMIN COMPUTER MMC SPECIFICATIONS:
OPERATING SYSTEM :
DISPLAY:
KEYBOARD :
BE EPER:
CLOCK CALENDAR :
COIL TILT :
IN-PHASE & QUADRATURE
APPARENT CONDUCTIVITY :
PROCESSOR :
MEMORY :
PHYSICAL SIZE:
WEIGHT :
BATTERIES :
CONNECTIONS:
TEMPERATURE RANGE:
Menu driven user-friendly hierarchial operationg system. Interfacing with MaxMin EM System receiver and with personal computers.
Liquid Crystal Display, with two lines of 24 alphanumeric characters each.
18 tactile pushbutton keys .
To provide audible operator guidance and to speed up operations , especiaUy in very cold weather.
Date and Time (year, month, day, hour and minutes).
Tilt display, with built in tilt sensor and circuitry, with 0 ± 99% grade range and with 1 % resolution.
o ± 199. 99% autoranging programmable gain system with 0.1'% resolution for displayed data and 0.01% resolution for stored data.
0.1 to 3276 milliSiemens ( miUimho ) per metre available conductivity range. with conductivity arrived at using the quadrature, in-phase, frequency and coil separation data ..
16 bit low power CMOS CPU and bus at 6 Mhz clock rate.
ROM: 16 Kb expandable to 64 Kb RAM; 256 Kb, static CMOS
24.2 x 17.3 x 4.3 em, to fit inside MaxMin receiver leather case notebook pocket.
1.0 Kilogram.
Two 9 Volt - 0.57 Ampere-hour alkaline batteries. Battery life 28 hours continuous duty, less in cold weather. Optional 1.2 Ah lithium batteries recommended for very cold weather operation. One lithium 3 Vall back-up battery, type 2032 .
19 pin bayonet connector receptacle to connect to MaxMin receiver with the supplied aluminum tube connectors.
One each of OB258 and 0698 data transfer cords aupplied for downloading data to personal computer serial port.
Minus 30 to pJus 60 degree Celsius. Temperature sensor and temperature display built-in.
1993-10-04

RES 100K
1 I 1
IP 30_
NC 30
. .
-~ .. \ . -- ----- . ---./ ,- .. ,--=-.--:-.-, ....... ~/ ...
lOooi 1 .. ,,-,_ . . . /7-'~~~~~-~-~.;..,...,-~~
'" /
0_ o
I 1
IOJ
TOPOGRAPHY
RESIST IVITY
(OHM-M)
CHARGEABILITY
(msec)
INTERPRETATION
NORMALIZED
CHARGEABIL ITY
-.
,,' n=2
,,' n=5
n=6
n=1
,,'
,-6
NC=CH.9.58/SQRT(Resis) 0=1
n=2
0=3
n=4
,·5
"'-
... '4~ 1181 762 lSI
l+fKJS
"
IP-29 , .,
J.oo S 2+50 5 , .. , 5.f -.40 18
eoso t 0 tware or t e ort clences
911 21K
9.7 9,9
1+,50 S l1Xl S 14K 24K Wi 12K
1+505 ,<00 5 , , " . 1.8 5
= l+~S ,;00 5 , ,
u u . 40 .40
15K 7975 2{1( 2et:
""" 5 U 9.6
••
..
19 U
18 \ U
"
IP-20 0 ,
0<00 , 1.2 .40
NC :JO
o
-30
,,' ,=2 ,., ,,' 11=5
n=6
n=1
,.,
IP _30
_0
RES
rlOOK
I ~
~ 1000 I ~
_-:JO l lO
TOPOGRAPHY
RESISTIVITY
(OHM""')
CHARGEABILITY
(msec)
INTERPRETAT ION
NORMALIZED
CHARGEABILITY
n=1 NC=Oi+9.58/SORT(Resis)
n=2
n::3
n=5
rl=6
Line 10+00 W Dipole-Dipole Array
o o
" ' , ' , ' ~, /' 0 = 25 M
, ' \:0' n = 1 ,2,3,4,5 , 6
plot point
Profi es N= 1
Logarithmic 1 1 5 2 3 5 7 5 10 Contours . , • , , ., , ..
loslrumenls Rx : ELREC -6 # 33 Tx : Tx-II 1800W GOD #
Genera t or: Hondo 1000W
IR;S
207
Field Work ~y : Pierre Simoneau , Geol .
-= =
"'"
INTERPRETAT ON
Strong & sure IP croTl'Jly( D.9 > P > 0.7 ) often with reSist ivity decrease
Prooable IP o1omoly (0.7> P > 0. 4 ) Moderate , often wlhout resistivity decrease.
Possib'e IP anomaly ( 0.4 > P > 0 2 ) Poor y defined, no resistivity feature
Week IP inc'ease ( P < 0.2 ) close to noise evel - or in hgh resistivity
SCALE 1 :2500
Line 10+00 W
Freewest Resources INDUCED POLARiZATION
SungolcJ Property Powell Lake Area
Dote: 05/07/08 '1"5.: 528/07 nte"Preted by: S. Tshim:.aiango. erg. Project 160.20
GEOSIG Inc.

RES IP NC NC IP RES Line 9+50 W lOOK.., 30_ 30 30 _30 r'OOK
I ~~ J ~ /-, --, y I Dipole-Dipole Array
j ~ , \ -- ........ /' ~ - ..
. \ / ,,_// . -~ . -
I I , 00 , , , , 1000~ 0_ 0
" . ...:.-..-c " I 0 _0 ~ 1000 r>l ~ I
. \ / I . ,
j \./ ~ , ,
- . , , , .~
, , I I
, , a = 25 M , , , lOJ -30_ -30 -30 _-.30 LlO ' ' n = 1,2,3,4 , 5,6 •
plot point
TOPOGRAPHY , , , , , , , , , , , TOPOGRAPHY Profles N~I
RES IST IVITY """ "'" 5 '''" 5 2iD S h!:(lS 1<., 5 OtpOS "'f» RESISTIV ITY , , , , , , , , ,
Logarithmic 1 (OHM-M) '" "' ,~ ,~ "" "
,., '" ". 1m ,~ 2S1( 19K '1K ,~ •• (OHM-M) 1.5,2,3,5,7.5, 1O, .. Contours ,
n= 1 '~'\~"~~ ~"'~( I mu\'"')''' ",>'''-::::; '"
,., ,., 1.\j( ~ 710~ liJl 2~ " 4 ' 1521 ~ 121( \ 6211' \\lG1f (~ lJK -llK l7K ,-,
W/', I~~~ ~~ ~ rl=.3 Instruments Rx ELREC-6 # 33 IR S ,., 12K ~)':;.r; 1864 2696 141' ~ lCJ2 =-: 7~ IlK 5963 2iK WI w: JD( @. /',//~ /'" ~, ~ '- - \ 'I
"' ( Ie' /~IO~~\;~~",~ '''~ '~r:'" Tx Tx -II 1800W GOO " 207 ,.+ ,=+ " ,·5 ''';J ~,~ ,. ,~~ "'. ~ om W t' ::\;. .. n=5 Gene'o l or: Hondo 1000W
n=6 ,~-0i ,. _ '" ,. / ""~ .. ~'1i. 'i \~ 1K \...)'" ~ \ \ '" 1\=6
Field Work by Pierre Simoneau, Geol .
NTERPRETATION CHARGEABILITY ""5 "'" 5 ''''' 5
,<00 5 1tSOS ,<00 5 "'" 5 "'" CHARGEABILITY Strong & sure IP anomoly{ 0.9 > P > 0.7 ) , , , , , , , , , ,
" " " " 1 " " ••• " " " 1 I I. , ~ ., (rnsec) -(msec) often w'th resis~'v'ty decreose
,., "Jli.: ~ I.' Y r2?" _-.,' /" "?T ~2 \ ./ ~/" \ • \" ,=, = Probo:)le IP ancrr0t:h ( 0 7 > p > 0.4 ) ,., ~----. _w----'~ " ,~-p ~ >\~2 ~~ )" ,=, t.~ode(cte, after wi out resist:'~ily decreose.
,., m l'f ~ {!l "k~w~" " . n:;J = Possible IP anomoly ( 0, t > P > 0 2 ) ,., ' ~'I , ,. . ~ 12 " ,,~ "~" _J.1 / ,0" n=+ Poo~ly oe1ined, no resistivity feature - ~;. ~ .I , . ,·5 ~ '1' ~ N ~Cl'~\~ .'~" "~w,. n=5
""'" Weak IP increase V < 0.2 ) ,·6 :~;~ 31.IS ' , 21' 8.~ a 12 18 Si! '211 n=6 close to 'loise level - or :n igh resistivity
IP-34 IP-29 IP-33 IP-27 IP-20 SCALE 1 :2500 INTERPRETATION -SSSsS , , , • , , , • , , , , Cl , INTERPRETATION
Line 9+50 W
NORMALIZED "'" 5 "'" 5 ',,"5 ,.00 5 1+50 5 ,<00 S "'" 5 "'" NORMALIZED , , , , , , , , , , , ,
CHARGEABILITY 2 , 2 1.1 • 2.' • .. , .~ .m • •• .m .10 . m 1.1 •• CHARGEABILITY Freewest Resources NC=CH.9 . 58/SQRT(Resis) n=1
"~ /~~;'~~-@I ~ \~rm" '.~ I " n=1 NC=CH.9.58/SQRT{Resis)
n=2 ,., INDLICED POLAR!ZKION u «.7.6 4.2 u=.~ V~~2.2 2.7 .1!l,\ .1O ,.. ... ; __ ;..10 1. 1 S,-onCold Property - -.vye _oke Grid
n=.3 S.' ----" ,' ) s .• YP'\""(~2"~N_ ,'",' I , n=J °o,."e l , Lakp. Arec n=4 ", \"f0" .J\ s.s 'P,(\ 12-" ~ ." ,., ,·5 It\~ 4 ,-::Jt'·"J.l U:J" 3 .• _2~·\.r\~\ . g()
,·5 Do,e 05/07/15 NTS.: 52B/07 , .. ,-6 ·mer:)reted by: S. Tsrimbolo'19o, eng. Fro;ect 160.20
GEOSI G Inc, easa r ':>0 Iware or me t:.ortn SCiences

RES IP NC 100K
1 30- 30
I ' --' /'--------" -......,-- ........ ---:,.
1 .':'-... ;/ .. "":"/ .-- . ------
1000~ ---- ----0_ 0 .~" . / I ----
-.../
1 I
10" -30_ -30
TOPOGRAPHY
RESISTIVITY (OHM-M)
.' .5 .' ~, l-tOO S Otfll S
CHARGEABI LlTY (m",,)
IN TERPRETAT ION
NORMALIZED CHARGEAB I LITY
NC=CH.9 .58/SORT(Resis)
0"'1 ,-, n=3
n=4
n=S
n=6
,=1 ,=, ,=3 , .. ,=5 ,.,
,·1 n=2
,=5 0=6
"" ,. ..
" "
IP-34 -
eoso 0 wore or e or clences
"'" , , 16 \J
IS\ SSI ,-"'" , , 210 s
"
14K 26K 40!81 IJI( I&:: ilK
".
,>00 5 1+50 S """ , , ! .1 5.3 31 II
I" D
IP-20 n I . I
1>00 , 1+50 S , u ." ." .m .< .0 .40 2,J
NC 30
0
-30
n=1 ,., ,=3 ,-. ,-5 n=6
,.1 ,-, ,·3 "",4
n=5
",=6
,-I ,., n=3
, .. ,-5 ,.,
IP RES _30 r 'OOK
I I
_0 I 1' 000
I I
_-30 clO
TOPOGRAPHY
RESIST IVITY (OHM-M)
CHARGEABI LI TY (msec)
INTERPRETATION
NORMALIZED CHARGEABILITY
NC=CHt9.58/SORT(Resis)
Line 9+00 W Dipole-Dipole Array
, ' , ' , " " ,," a = 25 M
, ' w" n = 1,2,3.4,5,6
plot point
2.30876 Prafles N=l
Logarithmic 1 1 5 2 3 5 7 5 10 Contours "',"" .
InstruOlents Rx : EL,EC-6 .# 33 Tx : Tx-II 1800W GCD #
IR S 207
Gene'ator: Honda 1000W
Field W~rk by : Pierre SiMOr"1eaU, Geol .
-=
"'"
INTERPRETATION
Strong & sure IP onomaly( O. 9 > :J > 0.7 ) often w:th res;s(vity cecreose
P'oboble IP 0001"01, ( 0 7 > P > 0.4 ) Woderote, often w:{hout resistivity decrecse.
Fossibe IP anomaly ( O,! > P > 0.2) Poorly defined. no resis:ivity feature
Weak IP increase ( P < 0 \ 2 ) close to '1oise evel - or ir rigr resistivity
SCALE 1: 2500
Line 9+00 W
Freewest Resources INDUCED IOCLARIZA,ION
S'.JnC;oIO Property Wye Lcke '-~rid -'oweil Lcke /\rec
Ja,e' C5/07/15 NTS ., 528/07 nterYeted by: S. Tshmbcl::l"1ga, e'lg. Project 160 28
GEOSIG Inc.

RES IP
10"1 JO_
I 1 -
10001 D_
I 1 -
lOJ -30_
TOPOGRAPHY
RES IST IVI TY (OHM-M)
CHARGEABIL ITY (msec)
I NTERPRETATION
NORMALI ZED CHARGEABILI TY NC=C~9. 58/SORT(Resis)
NC JO
O
-30
.. ,
.. , n=6
n=l
n=2
n=3
.·6
.. f-c-" . /:-", . /~". - - -" '\.
,
... 6376 15K 12" '"
• . "
',' '-.. . '-
..
,
''''' s , 222~ 6'\
''''' s , " ,
,
~~ - ~~ ... / . . . ", /
/' -/'
, , ,
'" 10\' 2QII; .. ..
'<50 S ,<00 S O>50S , I. 5.1 5.1 7.1 "
" /'
"
IP-34 29 32 33 31 30 IP-27 IP-20 mw s;ssss ""
3<OOS , ",",S ''''' S , 1+50 S , ,<00 S , 0.
150 S
3,7 ~, 8 I .' 1.6 8,4 8.8 " ." ." .. , 3.1 '\ U u s ~ \ a.~.e,--,-\~. It -, { • \ ,\~.;?.... .0 /50:;. ( 2
4,5\ $.1_5.9 U H'--~ ~.l . ~., .3 ~ 1.1 hi .30 ,0 I 1.4
/: , ~ J7:\i-' ~ y,> \t" , 5.8 'u I U U 2-.., U 1$ ~ . '... .01 ,I :'\ /\ 'I' ~ ........ _/
Iln)" •.• ('.j~\(~ y';' /. j.\~-." 1~ . J. 12 )) U 2.3 ~ ' ............ u 5,5 U 1.9
~10 /"'5 , 4 <"""2.J 2.1'5.8 3.8 \ J
•• 3
eosorr ::;,orr ware ror me t:.ortn ::'Ctences
NC 30
0
-30
0=1
n=2
n=3
n=5
n=6
.=, • -2
.·3 .. ,
.=5 .. ,
rI=1
rI=2
rI=3
n=4
n=5
IP RES _30 , 'OOK
I - r _0 f lOOD
I -i
_-30 L' 0
TOPOGRAPHY
RESISTIVITY (OHM-M)
C HARG EAB ILI TY (msec)
INTERPRETAT ION
NORMAL IZED CHARGEAB ILITY
NC=CH.,g,58/SORT(Resis)
Line 8+50 W Dipole-Dipole Arroy
0 00 0 , , ,
M r?J , , , , , , , , , , a = 25 M , , ,
" ,
n = 1,2 ,3,4,5,6 plot point
Profiles N=l
Logarithmic 1 1 5 2 ' 5 7 5 10 Contours' . , ,,,,!, , . , '"
InstrJrrents Rx E_REC-6 # 33 Tx Tx- I 1800W GDC #
Gene r otor: Yondo 1000W
IRIS 287
Fie:d Work by Pierre Simoneau, Geol ,
-=
NTERP RETATION
St~O'lg & Sl.re IP anoMoly( O. 9 > P > 0.7 ) of:er'l with resistivity decrease
Prooool, P ooomoly (0.7> P > 0.4) Moderate, often witl1cut resistivity decrease .
Possible IP oflonaly (0.4> P > 0.2 ~ Poorly defined, no ~esistiv;ty 'eature
Weak IP ;f"lcrease . (P < C, 2 J C ose to nOise level - or Ir 11gh (eSls: v ty
SCALE 1 :2500
Line 8+50 W
Freewest Resources INDUCED DOU\RIZATION
SunGolo ?cooeny Wye L 1ke Gr:c POl;'. ell I_oke A..-;:o
Dote: 05/07/15 NTS. : 528/07 Interpretec by: S, Tsh'mbcmngo , eng, Projecl' 60,20
GEOSIG Inc,

RES ,p NO NO IP RES Line 8+00 W ,OOKl
30_ 30 30 _30 r ,OOK
1 ~~
1 Dipole-Dipole Array 1 . ... _ .. --...-....-.- ....... r~'-
. r ~~
......... :-::: /", 0 no 0
'000 1 1'000 , , , ,
D_ ° .......... ;-.., ......... ,
! ° _0
M 1 ..
"- I ~ 1 '_I 1 . , , , 1 . .. .. .. . r , , , , , ,
0= 25 M
,oJ l,o , , , ,
-30_ -30 -30 _-30 ~' n - 1,2,.3,4,5,6 plot point
TOPOGRAPHY , , , , , , , , , , TOPOGRAPHY =>rofiles N= ,
RESIST IVITY Jt?ls 2+f-Vs 2tfO S 1+~S l1fXl S Olf-Os RESISTIV ITY , , , , , , , (OHM-M) 5~ ' 5 "" '" "" II! 71~ .... .,
"" .. "' "" ". (OHM-M) Logarithmic 1 1.5, 2, 3, 5, 7.5, 10, .. Contours ,
", 591~, r J 14K . r ~ 7140 } r)f I ~ \\ '\ 48f.} ~~~~_7OJI ,-,
,,' ... ,e'" ~/"~' )I~~I I~\\""~'~"'~"" ,,' Insi.rumerts "x ELREC-6 # 33 IRIS ,'3 1S71~!9XI @ 11 _ Ili 1114 r:s 1162, ~)!3 ,'J
/' n / /1 III ~ I \ \ I - Tx-I 18GOW GDO # 207 ,,' "" -uYlf.:l;i,.. = ~~\\ ~~ ", x
,,' 2611 ~ 1~ 0. ~ t802 I $1J) 3m 1022 - 10eQ ,,' Ge'lerator: Honda IOOOW /~ /"/ / --,=s 1343 ~ 1311 .. 2145 2862 ~ "ao 5211 - j411 n=6
Field Work by : Pierre Simoneau, Geol.
IWE"P"E- ATION CHARGEABIL ITY 3>00, "'"" ,<00 , ,"" , ,<00 , ~, CHARGEAB ILITY , , , , , , , , , , , I S:rO'l9 & sure IP ol'lomoly( 0.9> P > 0.7)
(msec) ~ " • ~ • • • " 7 ,., 71 5.' 5.' (msec) - o:ten with resistivity decrease
"I 't, " ,,~ .' -. ""--Z_.U~~\51 ", = P'oboble P ,ro'110~ ( 0 7 > P > 0 4 ) , , 2 .-.~ • /_ • ~ 0,1 ~17 "., ,=2 Moderate, o:ten wi out res'stivity decreose.
"J ~(. ~ '?,{(~tt \" '[' , "'::::0::" ,-3 = Poss:b'e 1° anomoly (0. 4> P > 0 2) ,-, ~ . 1. 1 " "~~Y ~ ,", Poorly cef"ned, no resist"v'ty featu'e
"S • n 4S •. ~\ a 22 -::~ ;& 18 Ii 7II'\!21 '0\.& U
,-, "'" Weak IP increase ~ P < 0 \ 2 )
"s " ,"s close to no~se level - or in igh reslst:v:ty
IP-34 29 33 IP-31 30 IP-22 SCALE 1 :2500 INTERPRETATION S§\W is M IS5-5S! , , n , , INTERPRETAT ION
Line 8+00 W
NORMALIZED 3>OOS "'" S 2<00 S '<00 , ,<ll S ~, NORMALIZED , , , , , , , , CHARGEABILITY ' .7 '.1 1.5 U '.1 • 7.5 U . ~ , .. " .~ .~ CHARGEABIL ITY Freewest Resources
NC=CI-MI.58/SOOT(Resis) "I ,., u ,H, U J .2 4 ~5~.\ \~'V ~~~\. .~ ", NC=Q-t.9.58jSORT(Resis)
, , 2 ••• ~~~ ,. \.. '\~ I ~~~. ,,2 'NDUCED POLARIZATION SunGold Prape'ty - Wye La .. Grid
,'J H U U U 2~ 4.3'-.., 7 \ 2.3\ I I --:: ~~~ u ,-J Powe!~ :.:."It..:e Are~ ,.---:-:--..........,~ / y. ~ ,,' 1, 1 U " ~l.2 4.1'-.1..1 U ": , lI) .70 ,,'
/ ~ / ~~' "S Dcte: 05/07/15 NTS.: 52B/07 ooS 10 ,. '/ 2.1 ~ 3.3, 2.2 ~ 1--: .10
"s "s Interpreted Iif S. Tsh'mbo'o"'lo, e"'l. Project; 60 .20 « ,)~ S.I 4.& 2.J 2 2.7 1.2
GEOSIG Inc. Geosott Software tor the tartfl sCiences

RES IP NC NC looK1
JO_ JO JO '/',
I I \ 1 ,....--. -"""""':-"""",,- - ;\
'000 I / '---
1 0_
I 1
,oJ -JO_
TOPOGRAPHY
RESISTIV ITY (OHM-M)
CHARGEABIL ITY (msec)
INTERPRETATION
NORMALIZED CHARGEABI LITY
t>t;=CH.9.58/ SCRT(Resis)
0
-JO
"" ,~
n-' 8JOJ ,., ,.J , .. ,.,
,., ,., ,., ,.. ,·5 ,.6
,., ,., ,.J , .. , ' 5
, ·6
><00, • ~
~
~
"
29 ~
l 2.1
eoso 0 ware or e ar clences
-- ",--
-......... -_/ 0 \ '!
\/ /
-JO
'<00, , 121( 8729 2561 1!>1tS
n=6
"'" , ,<00, ,.." ,"" , "''''' ".., , , , , , ~ ~ • » • " " • •• u ••• • "
» » » 'l "~" r-;:" " ~ lfrJJf" ,.,
.0 J8 /l /'i /" "''' , ~ ('·C ""~ 41/J " ,., "'----- , , " r ,. \ ;). /' ~ ifjJii-iW " ,., ./1. u • \ 14/12 18_13 U -1' 14 , .. 6J 41 f' \ ' " - ~ '( fl' lit) '-" ( : ;, .. - ,· 5 -- " • J" , M /) - .• • .• ,.6
IP-33IP-31 30 IP-20 Isss:s;:5
,<00 , ,.so , ' <00 , , , , 7.4 9.2 U 5.1
O>so , , .1:1 .30
,r::
.10 U
,., , .. ,·5 ,.6
IP RES _JO r100K
I ~
_0 I ' 000 I I ~
_- 30 I " '0
TOPOGRAPHY
RESISTIVITY (OHM-M)
CHARGEAB ILI TY (msec)
INTERPRETATION
NORMAL I ZED CHAR GEABIL ITY
NC=Q-I,g .58/SORT(R"')
Line 7+50 W Dipole- Dipole Array
0 no 0
r<?J r!J , , , , , , -• , , a = 25 M , -, .' n - 1 . 2,,3,4.5,6
plot point
Profi es ~='
Logarithmic I I 5 2 3 5 7 5 10 Contours . I , I I ., , .•
Inst rJmeols Rx : ELREC-6 # 33 IRIS 207 Tx : Tx- I 1800W GOO #
Generator: Hondo 1000IY
Field Work by : Pier-e Si"1oneou, Geol .
-=
INTERPRETAT ON
Sirong & sure P oro..,oiy( 0.9 > P > 0.7) ofter with res'stivity cecrease
Probable IP onomal, ( 0.7 > P > 0.4 ) Mode~ote, often wi(hout resist vity decrease.
Possiole IP anomaly ( 0.4 > P > 0.2 ) Poorly defined, no res istivity feature
Weak IP increase ( P < 0.2 ) close to noise :evel - or in hi9n resistivity
SCALE 1 :2500
Line 7+50 W
Freewest Resources NDUCCD "OLARIZATION
~L;nGotc Prcs-erty Wye LCK( Gr;o Powell L~ke A'eo
Date: 05/07/15 "fS.: 52B/07 Inte--preted by: S. Tshi....,:>ocngo, eng. Pro;ect 160.20
G EOSIG In c.

RES IP lOOK., ,,-
I j I
1000~ 0_
I j I
,oJ -30_
TOPOGRAPHY
RESISTIVITY (OHM-")
CHARGEABIL ITY (msec)
INTERPRETATION
NORMALIZED CHARGEABILITY NC""C~9. 58/SQRT(Resis)
NC
"
0
-30
n=1
0-2
0-3
0-'
0=5
n=6
n=1
n"'2
n=3
n=4
0-6
n=1
0-2
0=5
~--- ~ --.. . "'-~-', ./ ':>-<.'
}tOO S 2~ S 2+fO 5 \&1( 12!( 71ft1. 11K 2830 1](
,~
"'" , ,
29 \W
2.' 2.5
•
IP-33 iSSMSSl
" 2
"
IP-31 ~
"
2<00 , , •••
eoso 0 wore or t e or h clences
" '-
.. ,
~- -./ "- /' "-/..., . /' "---~" / : . '- --"--" /.
lt~S h005 I ,
1m 21K lJI( 6T.l6 1J72 JIK 5347
,"" , ,
''''' , ,
,
, .•
"'" , , "
hS$SS:l
"'" , • •••
•••
"50' , • •
" " .., ...
•• S
IP-20 I · I
""" , , •• L' 2 , •• .00
••
NC
"
0
-JO
n=2
"",,3
0-' 11"'5
n=6
0='
0=2
n=3
n=4
n=5
11",6
0='
0=2
11=4
IP RES _30 r 'OOK
I f I
_0 f'OOO I f I
_-30 LlO
TOPOGRAPHY
RES ISTIV ITY (OHM-M)
CHARGEABILITY ("""')
INTERPRETATION
NORMALIZED CHARGEABILITY ~=CH'9. 58/SORT(Resis)
Line 7+00 W Dipole-Dipole Arroy
0 00 0
M ~ , -, -, , , , , 0= 25 M , , ,,' n = 1,2,3,4,5,6
plot point
Profiles N=l
Logarithmic 1 1 5 2 3 5 7 5 10 Contours ,.,",., , ..
Inscrur'1ents Rx : ELREC-6 # 33 ,RIS 207 Tx Tx-I I 18CCW GCD #
Genera t or: I-"anda 'GODW
=-ielc Work by : :::J'erre Simoreau, Geol .
-=
Strano & SiJre IP aroro ly( 0 .9 > P > a 7 ) otlen "with resisiivi:y cecrease
Probable :P anomoy (07) ::l > 0.4) t.loderote . often without resistivity decrease
Possible P anomaly (0.4> P > J.2 ) Poorly defined . ro resistivi:y feo tu'e
Weak IP increase ( P < 0.2 ) close to noise evel - 0' in hig~ resistivity
SCALE 1 :2500
Line 7+00 W
Freewest Resources INDUCED POLARIZATION
SlY1Goio Property - Vlye Lql-e Grid Powell LGke Area
Dc\e: 05/07/15 N"'S.: 528/07 Inte'pretec by: S. TS'1im:JO argo. erg. Project 160.20
G EOS I Gin c.

RES lOOK,
NC 30
/' " "' /--I j --- / ~~-~- ---_~~~__ I
-" I
'--""" '/ .. ~-~ ...
I 10001
I j I
10J
TOPOGRAPHY
RESISTIVITY (OHM-M)
CHARGEABIL ITY (msec)
INTERPRETATION
NORMALIZED CHARGEABIL ITY
NC",CH.9.58/SOOT(Resis)
0_ o
-30
n=1
0='
0·3
0='
0=5
n=6
"",1
n=2
n=3
":4 n=5
0='
0=' n",S
n=6
.~ .
"'" S U J.7
2.5 J.7 __
/' 2.9 j' U
0../ 2'
eoso 0 wore or e or clences
""" "00 N 11K 21K ljPp( 9350 S7'9S 11K 665J 4567 320 22l( m 191< 11K 14K .. '"
''''' S ,
2+50 5 , U 2.2
,>00 S , " Q
,<00 S
1.5 4.2
2.6 2.2 /. E\3 4
'.2
U 3.1 U ••• 2' ! .. , ...
2.2 )1.4 ' .7 ••• '.2 '.7 '.7
""
,"" S , G1DS 1+jXl N
" ~ 1l q 12 ~.2 . " ~.1 U
~ \8,,~ ,.,
" S"\~\' ,. . " " •
15 r--'5 ( "
IP-20 IS'$'SI
\+50 S , '<00 S , 0+,50 S ""ON , 1<00 N , 5 J.l 3.1 3.7 U .20 .411 .30 2.3 1.5 .20 .30
5 3.I--.,J.1 3.7 ~_u//.\O .~ ''' '( 8- 1.5 \ " ',20 .30 r /A //~, :y , ./ \, , 4.5 2.6 l.t U 1.4-1.5 ~,50 .20'; JL-....-1.4 1 \ \ ,.10
/' ,. - \\ , II / \ f,., '(.;' " ... \~~lJ ' .. '.">" ..-1- ' .~ I ~ ~"-' '7~ r ,-, U 2.6 B 3.7 3.2 .50 - - ;rr.~~'81 .70· .90 / ..----.--- \, ih~-\ {. ... G.8 5.2 2.8_2.2 U .&'I _,io'W~ L5 ~",,$(I .70
/j //' "' \~!{. /I( , l.4 ' 5.S 1.7 1.8 1.9 - 1.9 - U - 2.1 1. '.$(1
NC 30
o
-30
0=1
11",2
0=3
11:4
0=5
n=6
0='
n=2
0·3
0='
0='
0='
1'1=2
n=J
11=4
11=5
n=6
_0
RES r 100K
I f I f'OOO
_-30 LIO
TOPOGRAPHY
RESISTIV ITY (OHM-M)
CHARGEABILITY (m",,)
INTERPRETATION
NORMALIZED CHARGEABILITY
t-.K:=CH.9.58/SQRT(Resis)
Line 6+50 W Dipole-Dipole Array
a
, , , ,
a
, " " /' a = 25 M , ,
'~ n - 1,2,3,4,5,6 p lot point
Profiles N=1
Logarithmic 1 1 5 2 ' 5 7 5 10 Contours ., ,..J, , " ".
IrstruMents ~x : ELREC-6 # 33 IRIS 207 Tx : Tx-II 1800'11 GDJ #
Gene rctor: ~Qrda IOOOW
Field Wo rk by : Pierre S:moneou, Geol.
-=
NTERPRETAT ON
Strong & sure I=> aromaly( 0.9 > ? ) 0.7 ) o·ten with resistivity decrease
PraooDle P onomqlv ( 0.7 ;> .P. > O. Ii ) Mocerate, often w ftlout ressi:vlty decrease.
Possib le p anomoly ( 0 :.4. > P > 0.2 ) Poorly defmec. no resistivity feature
Weak IP i1creose ( P < 0 .2 ) c:cse to 'lcise :evel - or ;'1 "'igh resist'vity
SCALE 1 :2500
Line 6+50 W
Freewest Resources 'NDUCED POLARIZATION
SunGuld Property - Wye LaKe Grid Powell Lake Area
Cote; 05/07/15 NTS.: 528/07 .nterpre-ied by; S. Tshimbclanga . eng . Project 150.20
G EOS I Gin c.

RES IF NC NC IP RES Line 6+00 W lOOK., 30_ 30 30 _30 r 100K
I '.,----..:.. /--- ~ I Dipole-Dipole Array /' .-- --j . I-~~" ... ~.--~.~---. . .......... . . I
. .. . . . ~ I --- . , , I , 00 ,
A " , , ,
1000~ 0_ 0 . . .... . . I 0 co ~ 1000 M r?l ,
I .
'- I -.I . , j ~
, , . . . . . . , , , ,
I I , , a "" 25 M , ,
, , ,oJ -30_ -30 -30 _-30 L, o ' ' n = 1 ,2,3,4,5,6 •
plot point
TOPOGRAPHY , , , , , , , , , , , TOPOGRAPHY Peci' les ~=I
RES IST IVITY 2~S ,<00 5 1+':() S ,<00 5 O+,SJS 0<00 ,,."" RESIS TIVI TY , , , , , , , , , , (aHM-M) \~ "" ~15 •• ,. \~ 2$ .. Ii' , ... ~, >II .. '" 2~ .. (OHM-M) Logarithmic 1 1.5,2,3,5,7.5, 10, .. Contours ,
,-, 11K 1W 531~ _ 0150 _ 12P:_ 11~<');\-~r; III!C· ~56)'~i~ ,22K I"' ,-, / /. \ ------.:. r: :y / r = "" . ,-, 74M M4II ~ 6122 e581 lllK ~ /I,l(?; 4~ lUg - 1093 SD ~;lQK :lSK
il ,. ,· 2
,-3 // '0 \ r---.. It! /---"'0.--7 ~ "" ~ . nstrunents Rx EL,EC-6 # 33 IRIS 7162 /" 161( 1211 Dll Ii509 J9I( _ 201( ~ :m. - 12J8 I 2347 _ lSi! . 51K", l K ,·3 , 1 \ I (I ,,,,; ,//~ \ --=r " Tx Tx-II 180011 GDD # 207 ,-. 20( ,/1,1( / ~ ~ IJI< ~{? 1~ 2288 4106 ~ ~~ ~ ,-.
,-5 161( ,sm 7J93~S37~ t662 2167 , ~_~\~890 '=5 Generator: Honda 10DO W
n=6 11K 7Il92 ~"" 50!5 - 2488""') 420.3 ~ 2450 4342 ( 11K - mCl n=6
F'eld Work by Pierre SiMoneo....: , Geo
INTERPRETATION CHARGEABILITY "'" 5 "'" 5 ''''' 5 '<00 5 ",.lS 0<00 "'50' CHARGEAB ILITY , , , , , , , , , , , ,
Strong & sure IP onomaly( O. 9 > p > 0 7 ) (msec) n w • " • ~ ~ " " " "
,., I.' U I.' '.5 (msec) - ofter with res'stivity cecteose
,=, ~ • ., "oM. ~~ 18 :-tr';~,K JI . ' 11 18 "' 2:1 -~8.\ n _ u ... 5.5 "",I P~obob le I;) o"'lomolh ( 0 7 > p > 0 4 ) -" ' . = n=2 ~ ,,\ ~' ~ ',~ '~~ (rn~ . ~) 0 " '-" n=2 tJQdero le, often w"t QUi 'esistivity decrease.
n=,3 ' ~:52 , m ft p ' " ~ ~ "~\~' " " " ,-3 = Possi~;e P onorr.oiy ( 0 " > P > 0.2 ) . . C) ' ~ ~ ~ a n=4 » JI5 ~ 0.5,l4: " U 1.1 12 \4 n=4 Poo'ly defined, ro resistivity f eatu ~e
n=5 " " " »r:f ,r "'. \~ k ~~- 11",5
""" Weak P increcse ~ P < 0.2 ) n=6 u ...,. • - SJ all _ \.-; 11 14 ~ U 1 n=6 close to 'loise level - or if' igh resistivity
IP-29 IP-33 25 2421 2 4 IP-20 SCALE 1 :2500 INTERPRETATION '\\'l , ISS , , S5I , , , , .,,'S! ~ I NTE R P R ETATIO N
Line 6+00 W
NORMALIZED "'" 5 "'" 5 1+50 S ,<00 5 "'505 """ -, NORMAL IZED , , , , , , , , , , , CHARGEABILITY
, ,., U 5.' U '-' ... ... .. , , .. , 5 .~ .~ •• ." CHARGEAB ILI TY Freewest Resources NC=CH0r9,58/SORT(Resis) ,-1 , '.'~' '-'~ '-' 7'-' ... ""-':---:; I.' '--'-.~ .• •• ." ,'1 NC=CHt9.58/SORT(Resis) , INDU::ED POI.ARIZATION ,-2 -;T-J 2 ~4.\ H tn-J.1; 'l,g~~.4n:-_: .70 •• n=2
•. , j 2 2'~SW' 2' /' A "\~-~~l; SunGold f'roperty Wye .o',c Grid "",3 .ro ,-3 ,-:'oweH Lokf.' Area ,a, 2.5 U) 4.3 '- ,7 \ 2.J 2.4 4.9_5.3 \1.t&-.10" u ~.!50 ,a, ,.5 ./ , ,,/ .0 \\ '~, '\K n",5 Date 05/07/15 'I'S.: 52B/07 J H 4.t~8~ U H H 1.4~ . .!91 U 1.1
n"'6 /0 /, '-- \...",' n=6 Interpreted by: S. Tshimbalonga, erg. ° ro.;ect 160. 20 4 4.1 2.1 7.1 5.4 2 2.4 U 1.8 .. ..... 60 - 1.7.
GEOSIG Inc. Geosoft Software for the tortn SCIences

RES IP NC NC IP RES Line 5+50 W 100K_ JO_ " .30 _'0 _lOOK
I I Dipole-Dipole Array J - -----"""" /-- l - //. ...........-'-~.---.- ."'- /. -
I ~~-~-- ~
L I 0 no 0 , , , , 1000J
\ ° _0 Lloee
~ r®l 0_ ° ... . . . . , . . . . . ',C/' ..
I I J l , , , ,
- . . . . . . . . . . . ... .. - , , I I , , , , a = 25 M
LID , ,
,oJ , -.30_ -'0
, , -JO _-30 '.' n - 1,2,3,4,5,6 plot point
TOPOGR A PHY TOPOGRAPHY
P ro~e~ ,
6 , , , , , , , , ~lv0
, , • RESISTIV ITY ,..JS M' S ,"" S ,<Xl 5 "'.JS """ "'SO N RESISTIVITY , , , , , , , , , , , ,
Logarithmic 1 (aHM-M) ,., "" ." .." '" ~ro "" .. ,~ ,. 7116 .. ""
,~ ,~ (OHM-M) 1.5,2,3,5,7.5, 10, .. Contours , .. , ~ ",1009"-:'2 _ e!!OII ,~ ,70 ~ ' ~ '-At?:18))) eel/II~7\\ lZ '" .-, .. , "" r~'" - .., ~'" ,. ~"':/ ~A"~ ) "'" ..... .. .-,
\ I -::---,. - ~/.O r // / --.: InSiruments Rx E_REC-6 # 33 IRIS .. , 46S4 \ ~131( (\~~ ,/~9698 \507(r~/«/ /: _ 47il
.. , - Tx- I 1800W GDC # 207 n=4 ~,,~ /'\' ~ \ ,. K:):2~iLj.'~ ,"t / 'Y' ~ .. , X
n=5 ... - ,~ .n ~ ,"\\ "'~/(i\'''' /)J) /" !,''' .·s Generator: rloodo 1000W n=6 ~ am --;); .. 9167 231( un - 11182 &966 1 k n=6
Field Wor~ by Pierre S:moneau ,Geol .
I~ TERPRE-ATION CHARGEABI LI TY ,.so S
""" 5 1~50 S ,<Xl 5 "'.JS """ "'SON CHARGEABILITY Str0'19 & sure IP onomaly( O. 9 > P > 0.7 ) , , , , , , , , , , , , -(msec) -.E .. " • ro " " ~ • .. .., H " U • (msec) often with resistivity decrease
n=1 -!lQ,/ 15 ,
56 ~ 40 . t:"~ .34~ _16 ( 6.1 ~ U '~J ~ n=1 = PrO:Jobie IP aromaly ( 0.7 > P > 0 4 ) 18 f f ~ ' , , X . ~ '( ~ n=2 Modero:e, often wi:hout res:stivilY cecrease. .. , " ,!O 59 • If ~ ~ . ) '1 ~ 1 H 13 14 __ 1~ .. , .. i q' 'c» • -. zI ~ ~ ' ~~/" .. , = Possible IP ancmaly (0. 4 > P > 0.2)
••• ' ~' ~\ ~ \ , ,, D~'" ,;~, ~~ '\ " 1'1=4 Poorly defned, no res:stivi ty feature
.·5 - 'l1~ lZ ', ' 45 ~ ,\' ~ J:,l6 . , 20~, ,,~:\ 7.,,\ 15 n=5
""'" Weck IP 'n~reQse ~ P < 0 2 ) .. , .u ~ 'I!'r- 2!J1 nl - ~ 22. ~ U .. , close to noise level - or in igh res:stivity
IP-29 33 2625 24 21 4 IP-20 SCALE 1 :2500 IN TE RPRETATION I ISsSMS' SS$SSI I I I"S'S"
1 '" INTERPRETATION , , ,
Line 5+50 W
NORMALIZED 2>SO s ''''' 5 ''''' 5
,<Xl S "'." """ "'SO N NORMALIZED , , , , , , , , , , CHARGEABILITY - .10 ", , .. ••• Ll >.8 ••• , ..
" .~ •• Ll , .. .~ '.J CHARGEABILITY Freewest Resources
NC=CH.9.58/SQRT(Resis) .. , -""-",,'" ~", •.• ~'Z::/'. ~ ,,-=,.'-~; )~,.\~_; Ll .. , NC=a-l.g.58/SQRT(Resis)
INDUCED POLARIZATION "., ~... u~, . ,~ •.• l' .., /'~'" ,,) u_u .. , SunGold Prope,-Iy Wye .oke Gr'd
n=3 "-"';'\~")' Ll '~~~"7 0 n:3 Powell Lake I\n;c .. , u~, •. , \1~~' ... J--;:,' •.• ~l0' "",4
1'1=5 2.1_/ \~~0 1(9 2.J\f )~~IJJ~, 1.5 n=5 Cole: 05/07/15 NTS.: 528/07 .. , Interpreted by: S. Tshirrbalongo, eng. Projecl 160.20 n=6 4.3 M -u 5.3 1.8 U 2.4 U 2.5'''' .30
GEOSIG Inc. eoson "::Jorrwore or rne I:.ort 1 "::Jclences

RES IP lOOK, '0_
-1000_ 0_
I j I
'OJ -30_
TOPOGRAPHY
RESISTIV ITY
(OHM-M)
CHARGEABILITY
(msec)
INTERPRETAT IO N
NORMALIZED
CHARGEABILITY
NC=CH.9.58/SORT(Resis)
NC '0
°
-'0
n=1
"=, "-, "-, "-5 "-6
"=2 n=3
"=, 11=5
n=5
///-., / /'/
'"---......:... __ .. -' . _J
''''' 5 3197 3474 m
''''' 5 ''''' 5 "00 5
" .. . , «
,
IP-29
''''' 5 ''''' 5 5.2 ' .J L' 1.8 4. 7 •
ease; a twore ar e or clences
.",---,..-.....
"-." '\ \ --
24 21 I ~ a.8 1.9
"'." u , .. 5.' L.
NC '0
°
-'0
n=5
n=6
n=1
""' n=5
11=6
"=,
"=,
"=6
IP RES _'0 _lOOK
I f I
_0 r 1000
, "
_-JO LID
TOPOGRAPHY
RESISTIVITY
(OHM-M)
CHARGEABILITY
(msec)
INTERPRETATION
NORMALIZED
CHARGEABIL ITY
NC=CH.9.58/SORT{Resis)
Line 5+00 W Dipole-Dipole Array
0 no 0
I!J Cj , , , , , , , , , a = 25 M , , , '. , n - 1,2,3,4,5,6
plot point
0raf'les N = 1
Logarithmic, 1 5 2 3 5 7 5 10 Contours . , , , • ., , .
Ins:rcnents Rx : ELREC-6 # 33 Tx : -x-II 1600W GJD #
IRIS 207
Generato r : ronda 1000W
Fielc Work by : Pierre S'''T1orecu, Geol.
-= =
Streng & sure IP aroMaly( 0.9 > :J > 0 7 ) o'~en with resistivi:y decrease
Probabie .p onomo:y ( 0.7 > P > a 4 ) Moderate . often w' thOJt res'stivity decrease.
Possible IP onomo), ( 0.4> P > 0.2 ) poorly def neo, no resis(v ty feotu'e
Weak IP I''lcrease ( P < 0.2 ) close to noise level - 0' in high '€sisf'lity
SCALE 1 :2500
Line 5+00 W
F reewest Resources INDUCED POlJ'.RIZAT!ON
SunGold Propere> - Wye L·J<e Or id Poweil loke Area
Dote' 05(07/15 NTS .. :28/07 In:erpreted oy. S. T shlmbo 0("\90, €()g. P'oject 160.20
GEOSIG Inc.

RES IP 100K
l 30_
I " I
IOOo~ 0_
I 1 I
'00 -30_
TOPOGRAPHY
RESISTIV ITY (OHM-M)
CHARGEABILITY (msec)
NC 30
0
- 30
n=1
,=2
'"' n=5
n=6
,., ,,2
,,' n=5
n=6
/"
/-..... /'" / '- "-. "'-., .... : :'-:--' . /. '" ;/ ~/" ---
1~ S 1+fXl S 0+,50 S
"'" s ,,;0 S ,>00 S , , . " . " "
• 29 24 21
INTERPRETATION
NORMALIZED C HARGEABI LlTY
NC=CH.9 . 58/SORT(Resis) n=1
n=2 ,., ,., ,,6
w
'.7
eoso 0 wore or e or clences
'''''51
"'" s ,,;0 S , , 4.7 U 2.' L.
NC 30
0
-30
n:1
n=2
n=3
,", ,,' n=6
,., ,,2
,., ,., n=6
n=1
n=2
n=3
n=4
,,6
IP RES _30 _lOOK ,
L
, "0 _1000
_-30 _'0
TOPOGRAPHY
RESIST IVITY (OHM-M)
CHARGEAB ILITY (msec)
INTERPRETATION
NORMALIZEO CHARGEA8 1LITY
NC=CH. 9.58/SQRT(Resis)
Line 4+50 W Dipole-Dipole Arroy
0 00 0
~ r!J , , , , , , , , , a = 25 M , , , .' n - 1,2,3,4,5,6 plot point
" rofles ~=1
Logarithmic 1 1 5 2 J 5 7 5 10 Contours . , , , , ., , ..
Instru'11ents Rx : ELREC-6 # 33 Tx : Tx - II 1800W GDD #
IRIS 207
Gene ro l or: Honda 10001'1
Field Work by : P:erre Si'11oneou, Geol .
-=
Strono & sure IP anomoly( 0.9 > P > 0 7 ) ofter "w'th resistivity dec'ease
Proboble IP onomo., ( 0 7 > P > 0.4 ) Moderate , often ,·..:fhoui resistivity decrease
Possible iP cnomaly (0 .4> P > 0.2) Poorly defi'led, ro resistivity feotJre
Weak P inc'eose ( P < 0.2 ) c,ase to noise evel - cr ir high ~esistivity
SCALE 1 :2500
Line 4+50 W
Freewest Resources INDUCED POLARIZATiON
SLlnG~)ld Property Wye Luke Grid Pow"li Lake AreL
Oak 05/07/15 NTS. 528/07 nterpreted by: S. Tshimbolango, erg . Project 160 .20
GEOSIG Inc.

RES ,p lOOK..., '0_
I J I
1000J 0_
I J I
lOJ -30_
TOPOGRAPHY
RES ISTIVITY (OHM-M)
CHARGEABIL ITY
(msec)
INTERPRETATION
NORMAL IZED CHARGEABIL ITY
NC=CH.9.58jSQRT(Resis)
NC
"
0
-3D
", n=2
n=4
n=5
n=6
",
------.....,........-~---
~14 9617
''''' S , • •
1+50 S . 9396 11K
1+505 I
" "
11K 68:l1
,"" S , " .
--/ /
«. '"
O1lS • v
IP-29 "i
''''' S 1+50 S ,"" S """ S I I I I ,., " ", ". " ,., ".
,., 5.2-U' 2.1 ~J.2-tU ,-, ", '(;' '5 5~ n=3 ... (/"'w frt 1..1 .
2.8 U / n//,,?,-1 .90 ). n=4
,-5 5.l;;4~2 e ~ '~ .~y;(/ n=6
eoso t 0 wore or the ortn clences
--" "-~ / ", /
\ '--
/'
""" N 1<'" N 431( 14K ., '" m 951
""" , 1'00 N , , i.7 JO ~.1 1.6
IP-4 •
0<00 """ N 1<'" ,
I I I
.~ .10 ,. , IJ •• •
"
.----/---..;-'./.'" .~-,.
1+50 N "'" N , ,
"" "" 9260 m
,.so, I
u u U 3.8
,.,
1+50 N ''''' , I I
•• •• •• • • •• • W •• •• I
•• •• , .~ . ... - ......
• W •• • • .~ , I
.10 '. , l) •• , , )0 ""- . M •• , ---.90- '.10
13K 1439
2<51" I
" 5.'
5.' 5.' 1.' ,.,
1.'
1.1
''''' , I
•• •• •• , .•
. ~ •• ,~
.M
NC
"
0
-'0
,=,
,=. n=5
n=6
,., n=2
,-, , .. ,·5 ,.,
,-, ,-, ,., n=4
n=5
n=S
,p RES _3D _lOOK
I l I
_0 L1000
I l
_-30 _10
TOPOGRAPHY
RESISTIV ITY
(OHM-M)
CHARGEABI LI TY
(msec)
INTERPRETATION
NORMALIZED
CHARGEABILITY NC=CH.g .58jSQRT(Resis)
Line 4+00 W Dipole-Dipole Array
a oa a
CJ M , , , , , ,
, , , , a = 25 M , , , ,
" n'" 1 ,2,3,4,5,6 plot point
Prof' es N= 1
Logarithmic 1 1 5 2 3 5 7 5 10 Contours . , , , , ., , ..
nstruments Rx : ELREC-6 # 33 IRIS
207 Tx Tx-II 18GOW GOD # Generator : Hondo 10GOW
Field Work by P·er .... e Simo'1ecu, Geo:
-= =
\lTERPRET ATION
Strol"g & SJre P ol'1omaly( 0.9 > :J > 0.7 ) often with resisiidy decrease
Proboble IP ooomoly (0.7> P > 0.4) Moderate . often wifhout res'stivi ty decrease .
Possible IP anomaly ( O. A. > P > 0.2 ) Poorly defined, 1"0 resisfvily feature
Week IP increase ( P < 0.2 ) c'ose to noise evel - o~ "') high resistivity
SCALE 1 :2500
Line 4+00 W
Freewest Resources INDUCED POLARIZATION
SUr'lGolc Property Wye Lake Grid Powe t.:JKe .il.reo
Dote: 05/07/12 NTS.: 528/07 Interpreted by: S. Tshmbolo"lgo, eng. ;Jroject 160.20
GEOS IG I n c.

RES IP lOOK., 30_
[
~ [
1000~ 0_
[
~ [
lOJ -30_
TOPOGRAPHY
RES IS TIVITY
(OHM-M)
CHARGEABILITY
(msec)
INTERPRETATION
NORMALIZED
CHARG EABILITY
NC=C~9. 58!SQRT(Resis)
eoso 0 wore or e a
NC '0
0
-'0
c-,
n=6
c-,
n=2
c- 3
Co,
coS
c-6
ne::l
n=2
ne::3
ne::4
n=5
c=5
~-' . . . ,./- . :--~-. r, _./ -/' --~ ........ _/
, ~
l~S ltOOS , 1091 sm 181( 131: 8JT.l 2311
,<00 S 1+50 S '<00 S """ S "'" , , , , , " " " • " ,., , • U " "
"
IP-29 12 , , I SS$~I
''''' S '<00 S , ,
• .. , ••• •• .<10 2.3
clences
/-,------:
- /- _""-
""" , "'" , 20'1 134!1 !1m 11K
"'" , '<00 , , , ••• " 11 •
IP-4 , • ,
""" , , , I.' U .50
~-:.-..---~~ . .,,-~
1+50 N , ,~ '"
. ,
••
,"", , '-'
1+50 N , . ~
...
2JK 25j(
,<00 ,
" "
U
,<00 , , •• ••
. . .
MlN , 9410 n53
••
••
''''' , ,
J
1.1
''''' , ,
••
NC '0
0
-30
C"
n=6
n=1
n=2
n=3
Co,
n=5
c·5
c_,
ne::3
c·,
IP RES _'0 r 100K
[
[ _0 L100a
[
f [
_-30 Ll0
TOPOGRAPHY
RESISTIVITY
(OHM-M)
CHARGEABILITY
(msec)
INTERPRETATION
NORMALIZED
CHARGEABILITY
NC=a-t.g.58/SORT(Resis)
Line 3+50 W Dipole-Dipole Arroy
0 co 0
M ~ , , , , , , , , , , , o ::: 25 M , '. , n = 1,2,3,4 , 5,6 plot point
Pro'iles ~ = 1
Logarithmic 1 1 5 2 3 5 7 5 10 Conlours . , , , , ., , ..
Instru'llent. Rx : ELREC - 6 # 33 Tx : Tx-II 1800W GDD #
IRIS 207
Generoto' : Hondo . OOOW
Field Work by : Pierre Simoneau, Geol .
-= =
INTERPRIO ATION
SHorg & SJre IP onemo y{ :).9 > P > 0 7 ) often with resistivity dec~eose
Probable? anomaly ( 0.7 > P > 0 4 ) Moderote, often wifhout resistivity decrease.
Possible IP anomaly ( 0,4 > P > 0.2 ) Poorly defi'led, ro resisfvity femure
Weak ;p increase ( P < 0.2 ) close to noise evel - or in high resisti ... ity
SCALE 1 :2500
Line 3+50 W
Freewest Resources INDUCED POLARIZATION
Sur:Gc:d Propedy Wye Lake Grid Powel! L.ol(e Area
Oaie: 05/07/15 NTS.: 520/07 Interoreted by: S. Tshimbolo'lgo . eng . Project 160.20
G EO 5 I Gin c.
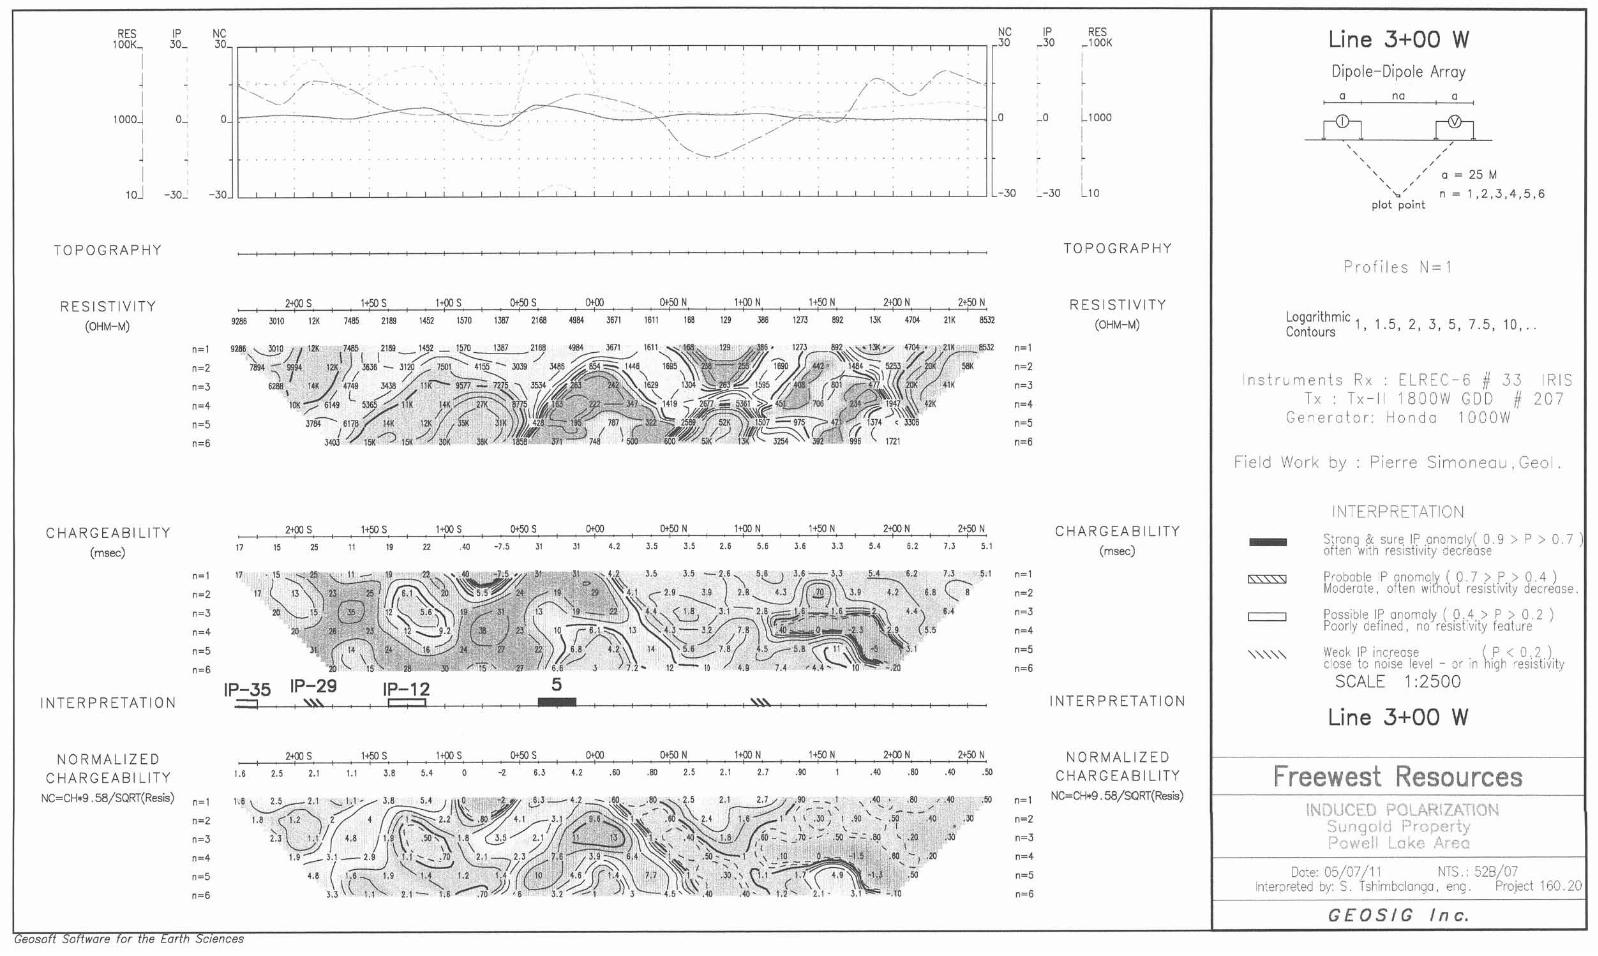
RES IP NC NC IP RES Line 3+00 W lOOK.., 30_ 3O 3O _3O _lOOK
J ' .-:-" ,--' Dipole-Dipole Array . r-- -' /-~. /' :--.... . , ,_/ ........ , L--:"'--.... I ._ , no ,
I , , , - ---- --/ -- LlOoo 1000_ 0_ ° " . >/ ° _0
r!J r!J "- // J '- ,
-,./ , , - .. - , , , , , , o = 25 M , ,
, , '0_ '3'L -3O ·30 _-30 _'0 " n _ 1,2.3,4,5.6
plot point
TOPOGRAPHY , , , , , , , , , TOPOGRAPHY Profiles N=1
RESISTIVITY 2<00 , ,"" , l'?JS "'" , """ 0<50' "00 , 1+50 N ,<00, ''''' , RESISTIVITY , , , , , , , , , , , , , , , , , , (OH"-") " .. ",. ,u "" ". 1<52 1~70 I.' ". , .. 0" 1611 I. '" .. "" •• I~ "" ." .," (OHM-M) Logarithmic 1 1.5, 2, 3, 5, 7.5, 10, .. Contours ,
,-I , .. ~'J.j. I~ ,.. ". '''' _ '~ I.' ". .... "" lOll ~~. "" !!&~ "" /. '" "" n=1
" It I -/~ / ~:-._/ "~l ~;)F~'" ~~ ,-, IBM - 1211 J6J6 _ "2(l 1501 41~ .Xll9 ~ ~ \~ 1~ - 1110 "42' 144' -... ~ /? 5tJI( '"' , - 3 ~, ::J. "~ W '--';;;;-= '"' :\ ~~~ \ / ~ ~~~ " ~(7;71~(.. ." n=J nstruments Rx ELREC-6 # 33 RIS ,-, '~/""~'" 1~?)l~A ~-~'~'''')~=:~ ,. ~IM'~'~ ,-, Tx Tx-II 1800W GDD # 207 ,-, J"'--' "71 /. I~ '0" 111 fjl.,,~~~~ ~;t3'r.' -,:.\?,:,,( (( r,;:-»\~ ,,' Ge'lera t o r . Honda 1000W n:6 ,.jl. 1~0,"/" "/,, ",'::!.J,j \ .. if'1IJi!,.(/ '=~ .('1" (lnl n=6
Fie,d Work oy : Pier re Sirroneoo. Geol.
IWE'<PRETATION CHARGEABILITY 2<00, ."" , ,"" , O<'os ,.., "'" , 1<00' H50N ,<00, ''''' , CHARGEABILITY , , , , , , , , , , , , , , ,
S:rcrg & sure IP onol1cly( 0 . 9 > P > 0 7 ) (m"",) II " ~ II " n .~ ·u J\ J\ .., J.' J.' U , .. ... J.J U I.' U '.1 (msec) - often wi~h resistiviiY decrease
,-I " ,,'~'\J~ "~")~rf 11~~J~,.~21'~s~~$ ~ •• Co 5.1 ,-, = P'obobl. P onomo~ ( 0 7 > P > 0.4 )
,,' ,-, Moderote, o'!en wi ou t resisrvity decrease.
,-3 ~ "8 ~l'i"(i. 10"_,, ' ~,56 /J'-\\f'}'J~~""" ''( •• ,-3 = Possible IP anomaly ( 0.4 > p > a 2 ) ,-, .,:/ .. >j ' \'L~J'J:oj2J~\OrSI~~'J-Y,{Jj ~ ....... / ,55 ,-. Poorly defined , no resisr vily feat Jre ,-, . , (('\yt ~~ - J ),~':\ ,,~~,y iY"~"," n=5
""""" Weak IP increase ~ P < 0.2 ) , _6 XI\" IS Ii .JI '"'5' U J ), . .. 12 - 11 U 7.4 '4.4~ \0 -.20 ,,6 c·ose to noise level - or'n igh 'esistivity
IP-35 IP-29 IP-12 5 SCALE 1 :2500 INTERPRETATION ===- I ~ ' , j j , , , I , , , , I ~ , , , , INTERPRETATION
Line 3+00 W
NORMALIZED 2<00 , ,"" , 1<00' ""'" ,.., "'" , 1<00' \.50 H 2<00' ''''' N NORMALIZED , , , , , , , , , , ,
CHARGEABILITY 1.8 , .. '.1 1.1 J.' ,., • ., '.J .., •• .m '.5 '.1 .., .m I .m .m . m • • CHARGEABILITY Freewest Resources NC=CH-9.58/SQRT(Resis) ,-,
'.~" ~7itfid/~~:J~,~J_" _m _.~~~.m -,I ,~ .• ,m .m ", NC-CH09.58/50RT( .... ) /. "" /. - _, / /..-_,' ,'oJ_ .. INDUCED POLARIZATION ,-,
1.8 '0 l • ~' %/~~~l' '/F-~ ,,\~, '<~_ 'j~ '-,m ,m ,-,
Sungulc PrrJperty ,-3 '.J 1.1/ '~' ~I .• , ... l.1 ~ (,' \l I·, .~~ .• -, .~.- .• --.m '.m .~ n=J
-::!/ \ - \ ~ / ~ ~} ,~- ~(- " ,- Powell l.cke Area ,,' 1.1_,.1_2.1 1.1 ..... ,70 2"-::::72.3 1.' /u e.4 \",_.~._ 1 \ ,10 0 -1.5 1 .eo ,.20 ,-, ,,~ I. II"" ,'" ':;~- '-", .s (,.~. I.t... " :d ~-?JR~~"-,"'~,~~ .m
,-, 00:.: 05/07/11 NTS.: 528/07 ,-, l.J\\ 1.1 2.1- U~)V'I J.t -I ))) H~~.4O .40- 1.2 .... 2.\' J.I - .10 ,-, n:ef":)rete<l by: S. T st"imbclongo , e'19. Project 160.20
GE OS I G Inc, eoson sonware for me conn ::;,clences

RES IP lOOK
1 '0_
J1
10001 0_
j lOJ -,30_
TOPOGRAPHY
RESIST IV ITY (OHM-M)
CHARGEABILITY (mse<:)
INTERPRETATION
NORMALIZED CHARGEABI L ITY
NC=CH.9 .58/SQRT(Resis}
eoso 0 ware or e 0
NC 30
0
-30
,-, ,., ,.,
n= 1
n=2
n=3
n=4
n=5
n=6
,-, ,-,
n=4
,·s ,.,
/. ~ '-.,"'"-' .. . ... _-.." / ---- "-"- ' .......... :- .~ /'
21Xl S ~ ~m 19K 9161 1'OeO 1929 1(1( 164,j 281J 826 1633
'<00 , " " "
IP-35
'>50, , 1+00 5 OI-fAl S
9.1 2~ 28 S.! -2.6 13
IP-12 =
,<0 ,
5 ''''''*
,<00, Ot,5O S .50 - .10 2.2 "'" ,
clences
"-~
l+~N , 190 m " n NIl Hl41
1+00 N 1+~ H , 1. 1 \ .8 - .20 ~ .l
'''.IN ,<00, 1+50 N , , 1.9 -. 20 1.2
I
/
1161 1117
,<00,
,<00, , ••
(-:-
,>50 , ,
2tSO N , B.6 7.1
NC 30
0
-30
n=1 ,., n=3 ,-. '=5
1.1 n- l
•• 2t5O N ,
n=4
n=5
n=6
,., n=2 ,=, , .. ,· 5 ,.,
IP RES _30 r 'OOK
1
r _0 LIOOO
_-.10 !,...l Q
TOPOGRAPHY
RESISTIV ITY (OHM-M)
CHARGEABILITY (msec)
INTERPRETATION
NORMALIZED CHARGEABILITY
NC=CH>09.5B/saRT(Resis)
Line 2+50 W Dipole- Dipole Array
o
, , , , ' , ' , ' '/
plot point
o
(J = 25 M
n = 1,2,3,4,5,6
Profiles N= l
Logarithmic 1 1 5 2 3 5 7 5 10 Contours ' ""." . .
Instrcments Rx : ELREC-6 # 33 Tx : Tx- I I 1800 W GDD #
IRIS 207
Gene r a t or: Hondo 1000 W
Fie ld Wo rk:::>y Pierre Simonecu, Geo
-=
""""
'ITERPRETATICN
Streng & sure IP cnomoly( 0.9 > P > 0.7 ) often wit') resistivity decrease
Proboble P ono'11 ol, ( 0 7 > P > 0 4 ) Moderate . often wi[hout resistivity decrease.
Possib'e lP anomoly ( 0.4 > P > 0.2 ) Poor y defined, no resist"vity fea tu re
Weok IP i"lcrease ( P < 0.2 ) C ose to noise level - or 'r high resistivity
SCALE 1 :2500
Line 2+50 W
Freewest Resources INDUCED POLARIZATION
SUI1Gold Properly Wye Lake Grid Powell L::ke hoo
Dote: 05/07/15 WS .: 528/07 n:erpretec by: S. Tsh·mbala~o . e.,~. Project 160.20
GEOSIG Inc.

RES 100K_
IOOOJ I J I
IOJ
TOPOGRAPHY
IP NC 30_ .}O
o
-30
RESISTIV I TY
(OHM-M) - -- . - --- - . .
CHARGEABILI TY
(msec)
INTERPRETATION
NORMALIZED
CHARGEABILITY
NC=CH.9.58!SORT(Resis)
o-s n=6
n=1
n=3
0-4
0-5
0- 6
"
0-' n=4
eoso a /ware or e orf clences
,.."
,<00 , , 11 U
I,",'
10 27
I+&1S l+OOS 1>50' 0000 I I , ,
.70 2.B 3.1 3.5 LI -.50 1 5.5
Ot;'IJ N 1+00 N 1+50 N 2t50 N , 224 .lI!2 217 9QJ
'"
0>5Q N 1+00 N 1+50 N ,.." ,.." , I ,
B .70 La 4.9 U 2.1 "
1<00 , 1+50 N ,<00 , 2+5(1 N , , , , l .• 1.1 .00 1.1 U t.O .10
NC IP RES 30 _30 _'OOK
o
0- 1
0- '
0_'
0-'
0-5
n=6
0-'
_-30
l I L1000
I l I LIO
TOPOGRAPHY
RES IST IVITY
(OHM-M)
CHARGEAB I LITY
(msec)
INTERPRETATION
NORMALIZED
CHARGEABILITY
n= 1 NC=CH-9. 58jSQRr(Resjs)
Line 2+00 W Dipole-Dipole Array ,
"' ,
~ r®l , , , , , , , , , , o = 25 M , , ,
" n"" 1 ,2,3,4,5,6 plot point
Profiles N=1
Logarithmic 1 1 5 2 3 5 7 5 10 Contours . • , • • ., .. .
nstrements Rx : ELREC-6 # 33 RIS 207 Tx Tx- II 'soow GOD #
Gererotor: Hondo 100aW
Fie ld 'Nork by p'erre Si1l"oneau, Ceol.
-=
INTERPRETATION
S~rong & sure IP anomaly( O. 9 > P > 0.7 ) after with resistivity decrease
P(obable P anomoy ( 0 7 > P > 0.4 ) Moderate , otten wirhou t resistivity decrease.
Possible IP anomoly (G.e > P> 0.2 ) Poor y cefined, no resisr vily fea ture
Weak IP increase ( P < 0.2 ) close to noise level - or 'r high resistivi ty
SCALE 1 :2500
Line 2+00 W
Freewest Resources INDUCED POLARIZATION
SunGcl,j Property ,- Wye Lake Powell Lake Area
Crid
Date: 05/07/15 NTS.: 528/07 n:erpretec by: S. T sh'mbolongo, en<;. Project 160.20
GEOSIG In c.

RES IP l00K
1 30_
i I
,oooi 0_
I i I
'OJ -30_
TOPOGRAPHY
RES ISTIVITY
(OH" - M)
CHARGEABILITY (msec)
INTERPRETATION
NORMA LI ZED
C HARGEABILITY
NC=Cl"(.g .. 58/SORT(Resis)
NC 30
0
- JO
,-, ,_2 ,-J ,-, ,-, ,-,
,-2 ,-J ,-, ,-5 ,.,
/~,
/ , ~~ ,/ ~
2+50 S , CtjXIS
1245 164J 1286
2+50 5 , » " 11 21
'I. .. < »
,.so 5 , 1+fXlS
" "
~.
,«> 5 ,
'..,5 , &.3 J1
''''' 5 5.'
eoso 0 wore or e or Clences
--~ ~ --- "- / ~- , / ~-
->: ~~
\ I '/
""" 0>50' '''''' , , 19k till '"
'''''' 5 "'SO , ' 000 , , , » " 11 1.e J.J 16 10 19 U 1 4
'000 S "'505 """ 1>50' ,.00, , , , l.' , .0 ." '.5 •. < u ."
'-"-
'-
1+50 N ,
1+50 N
, 1 2.' ••• ,'-' •
NC 30
0
-JO
n=2
n=3
,-, ,-5
,-, ,·2 ,-J ,., ,.5 ,.,
,-, ,'2
,.J ,-, ,·5 ,-,
IP RES _30
r lOOK
I f
_0 flO00
r I
_-30 L10
TOPOGRAPHY
RES ISTIVITY (OHM-M)
CHARGEAB ILI TY (m"",)
INTERPRETATION
NORMALIZED CHARGEAB ILITY
NC=CH.9 .. 58/SORT(Resis)
Line 1+50 W Dipole-Dipole Array
0 00 0
~ ~ , , , , , , , , , 0= 25 M , , , ,
' .. n - 1 .2.3.4.5,6 plot point
~ro' es N=l
Logarithmic 1 1 5 2 3 5 7 5 10 Contours .,",., , ..
rst'emerts Rx . ELREC-6 # 33 IRIS 207 Tx x- I '80QW GDO #
Generoto': ~01da 1000W
Fielc Work by ; p"erre Simorecu, Geol.
-=
"'"
INERPRE~AT ON
S:rcng & sure P oncmcy{ 0.9 > P > a 71 ofte1 with resisfv-[y decreose
Protobie IP o'lomal'y ( 0 .. 7 > j > 0 .. 4 ) Modero:e. often w:{~Ol,.t resistivity decrecse ..
PossQle IP anomaly (0.4> P > 0 .. 2) Poorly oefjred, no resistiviw feoture
Weak IP increase ( P < 0 .. 2 ) case to noise evel - o~ :T') hgh resis:ivity
SCALE 1 :2500
Line 1+50 W
Freewest Resources NL"CED ?JLAR!LI\[lON
~ J uO j O;l,F' Y 'Nyt v I\t;> l'f I..
I lwe: .c'.(e Al'e(J
Jote: C5/07/, 5 WS. 528/07 Irterpreted oy: S. TsI"irrbolo1go. e"g Project 160 20
GEOSIG Inc.

RES IP 100K
1 30_
I i I
loooi 0_
I i I
10, -30_
TOPOGRAPHY
RESISTIVITY (OHM-M)
CHARGEAB I LITY (msec)
INTERPRETATION
NORMA LIZED CHARG EABI LITY
NC=CH'9.5B/SORT(Resis)
NC 30
0
-30
",2
n=3
n=5
n=6
0,1
0,2
0-3
0-'
",5
"-6
n=2
0,3
n=4
n=6
-----./. ':'-...._ ...,.-: ---.,
X /' .
~s ,., ... ,.
Qil <
~.
SS\S"
2+50 S , " S.3 1.6
14K 19K
9.1 17
2<00 S , .70 1.1
1+50 S ,
1+50 S , 17 11
= 1+50 5 ,
1.7 1.1
eOSQ t Q ware or e or clences
--.--:-" ,.,... - :--.... ;./ --- \ .-" -
"" ... ,~ '" HQJ 1313
'<00 S "'." """ N , , , • • 10 H " .
ISSSMS' ,,51 ISSSMSl
0+,50 5
3.2 1.4 3 •. 1 .80 .20 3.1 5.6
. --- - ,
. /" . " I ., / "-
"----
1<00 N lt~N , ,
'" "" IIZ36 616
1<00 N 2<00 N
U 1.8 10 ~.1
2<00 N , 1.8 .50 .50 .20 .50 U
---
2+50 N ,
2+50 ~ , 2.6 1.7
1.1
2t50 N ,
1.2
NC 30
0
-30
n=4
n=5
n=6
n=1
n=2
n=3
0-'
0-5
n=6
n=2
n=6
IP RES _30 r lOOK
I r I
_0 r1DOO
I r I
_-30 Ll0
TOPOGRAPHY
RES ISTIVITY (OHM-M)
CHARGEAB ILI TY (msec)
INTERPRETATION
NORMALIZED CHARGEABILITY
NC=CH'9.58jSORT(Resis)
Line 1+00 W Dipole-Dipole Array
0 "' 0
~ M , , , , , , , ,
, , a = 25 M , , , ' .' n - 1,2,3,4,5,6
plot point
Prof i les N='
logorithmic 1 1 5 2 3 5 7 5 10 Contours "",""
Inst-umeots Rx : ELREC-6 # 33 Tx : Tx-II 1800W GDD #
Generato r : Honda 1000 W
RIS 207
Field Werk by : P:erre Sirroneou, Geol.
-=
II'> TERPR::TATION
Strong & sure IF onomoly( 0 . 9 > P > 0 7 ) ofte'1 wi th resistiv' ty decrease
Proboble IP onomol, ( 0 .7 > P > 0 4 ) Moderate, often without resisl ivity decrease .
Possible IP ancmaly (0.4> P > 0.2 ) POD-Iy de'ined. no resistivity leaiUre
'Neol, IP :rcrease ( P ( 0.2 ) close to noise level - or i1 '1igh resis;:iv'ty
SCALE 1 :2500
Line 1+00 W
Freewest Resources INDUCED POLAR'ZATiON
S:.mGold Properiv - Wyt:~ Lo;(f' PoweH .Qke Arp'('
Dote: 05/07/' 5 I>/IS.: 528/ 07 Irterpreted by: S. T shimbalongo , en<J. D(oject 160.20
GEOSIG In c.

RES lOOK.,
I j I
1000~
I j
I lOJ
TOPOGRAPHY
RESISTIVITY
(OH"-")
CHARGEABIL ITY (msec)
,p 30-
0_
NC 30
- 30
,.1 ,-, ,-. ,-5 n=6
n=1
,-, ,-. ,-5 ,_6
19&1 9J6O 19K
16 21
2DK 11K 131( 1100
1t~S , " ~ 14 47
HOO • , """ , '<OON , 24Xl N 2+::0 N 6J11 I3/( 10K lSI( 14K 41~ ... "" 1154 'i196 lSi! HI( Z2J( 3415 .3870 98e
~s 2t!(l N , " ., • • \l 8.1 J 5.2 U 6.6 5.1 U
IP-17 INTERPRETATIO N
NORMA LIZED CHARGEABIL ITY
, .. I.' ''''' 5 ,
I.'
= 2<00. ,
2.1
KUSSI
1+50 S , 1.9 5. J .. ,
_'5SSSI
HOO. , .. , """ . , 3.5 2.7 -,
_sssS!
10
I>50N , I<OON , •• ••
1+50 N , ,>00 N , ••
2t!(l N , .10
NC=CH.9.58/SQRT(Resis) 0,,1
n=2
,-3 , ..
'1\ ~ L\'~\ .. 2'/ )'/ ~~7~-'\'I"S~ 2' ~'_:YI\~ z:~'~ .. ~ ,."--""-,.~ '~g. 'l -="~ , ,'. 5.1 \ ... tz ~.......-')'9 /)4 2.5 / 9.8 J 2.S 2.1 H tL.J U=j\'7 ' \\\1 ,.~69 . . 20 ,lO .~::;".&:l J.f~.20
--... \ ~ I f / /. ../ ~" , I ) _'! l..'"' ''." ,~ _ . U 2.7 1.4 1.6 /3.1 1.5 ~6.4 ~ 2.1 5.1, l.6_J Q\/1. _ .20 .10 .30 < .. . go 1.2"'1.8
U 3.6 \~, J.l 1.5 /5.6 5.1 4.! 2.1 (1.1 ~~' U U 2.8 1.2" .20 1)0 -.to . .9:1
n:5
n=6
e050 0 ware or t e or clences
\ ,.....; ~ \ 1 4;:;~ ~ ~ ~ ,' l ~. 4.S ~_~6 ~$ ,/5.9;. ~J.5 U \\\\~ .10~(t::.5'j ///\'\ 2.8 ~,\O , 'i~ ~ ;2 .\,_" '_' ,1".;' C
3.8 5.8 U 6 4 2.8 4.1 3. .10 '.lI 8.S 1.5 \.5 n U .$ M
NC 30
°
-30
,·1
n",4
n"'5
n=6
n"'l
n"'2
,=3 ,=. ,-5 ,.6
,p _30
RES r 100K
I f I ~1000
I f I
_-30 LIO
TOPOGRAPHY
RESIST IVITY
(OH"-")
CHARGEAB I LITY
(m.eo)
INTERPRETATION
NORMAL IZED CHARGEABILITY
n"" 1 NC==CH"9. 5B/SQRT(Resis)
n=3 ,-. n=5
n=6
Line 0+50 W Dipole- Dipole Array
, , , , ' , ' , ' ,- ' plot point
o = 25 M
n - 1.2,3.4,5,6
Prof i les N~ 1
Logarithmic 1 1 5 2 3 5 7 5 10 Contours . , , , , ., , .
Instruments Rx : EL,EC-6 # 33 Tx : Tx- II 1800W GOD #
RIS 207
Generator: Honda 1000W
Field Work by : Pierre Simoneou, Geol .
-=
"''''
INTERPRETATION
SHong & sure IP onomaly( 0.9 > P > 0.7 ) often with resistivity decrease
Probable IP onomol.y ( 0.7 > P > 0 4 ) Moderate, often without res istivity decrease.
Possible IP anomaly (0 .4> P > 0.2) Poorly defined, no resistiVity feature
Weak IP 'ncrease (p < 0.2) close to noise level - or in high resistivi ty
SCALE 1 :2500
Line 0+50 W
Freewest Resources INDUCED POLARIZATION
SunGold Property - Wye Lake Grid Powell l..)ke Area
Dote: 05/07/15 NTS.: 528/07 Interpreted by: S. Tshimba1ongo, eng. Project 160.20
G EO S I Gin c.

RES 100K
1 I 1
lOooi I 1
IOJ
TOPOGRAPHY
RESISTIVITY
(OHM-M)
IP 30_
C HARGEAB I LITY
(msec)
INTERPRETAT ION
NORMALIZED
CHARGEABIL ITY
NC=CHt·9.58/SORT(Resis)
NC 30
o
-30
"=,
"=J "=4 n=5
n=6
",' n=2
n=3
n=4
n=5
",'
",' ",'
",4
",6
><Xl , , 21 22 " "
IP-1716 S\\SW , !
><Xl , ,.." , , 2.3 .9Cl
'-'
eoso a ware or e 0 h clences
2+?J S
'''' ""
2+pl 5
" .
12
1. 1 2.8
1+,50 5
,.." ,
"'" , ,
,<00 , , 25 II . "
'<00 , "''''' , 1.8 2.1 H U U 12
''''' , , Hzt $111 1m +407 1241 ~642 17K 21K 5001 IID1 3781 ZJOJ
"" , , S.3 1\
n
"'''' , ,
2.1 2.1
'<00 N , , 4(1 .JO
''''' ' , 4.4 3.S
,.." , 1. 1 .ro
,<00 , , ~.2 7.1
,<00 , , .:10 ,40
''''' N , 11 1.7
1 0 ,
, .• " , U 1.1
><Xl N ,
.50 .70
3iflIN 19K 90\84 1348 121( "' ""
.. '" N , 2.9 S.' '"
5.;
.<0 .JO ,)0 .40 .40 .7U
NC 30
-30
n=1
"::2
n=3
n=4
"=5 n=6
"-, n=2
"=,
n=6
",'
"-J "-4 "-5 "-6
IP _30
_-30
RES r'OOK I r ~ 1000 I r LIO
TOPOGRAPHY
RESISTIVITY
(OHM-M)
CHARGEABILITY
(msec)
INTERPRETAT ION
NORMALIZED
CHARGEABILITY
NC=O-l.,g.5B/saRT(Resis)
Line 0+00 Dipole-Dipole Arroy
o o
, ' , ' , ' , ' \ ' 0 = 25M , ' ,~; n = 1,2,3,4,5,6
plot point
Profi es N~1
Logarithmic 1 1 5 2 3 5 Contours . , • , ,7.5, 10,.
Instruments Rx : ELREC-6 # 33 Tx : Tx- I 1800W GOD #
IRIS 207
Generator: Hondo 1000W
Field Work by : Pierre Simoneau, Geo
INTERPRE-ATION - Strong ~ sure. ? .onomoly( 0.9 > P > 0 of:en With res sbvlty decrease
-, I I
Probable IP anomoly (0.7> P > 0.4) Moderate, often without res istivity decrease .
=
"'"
Possible IP anoMa ly ( 0. 4 > P > 0.2 ) Poorly de/ired, no reSistivity feature
Weak IP increase ( P < o. 2 ) close to noise level - or ir high res;st iv·ty
SCALE 1 :2500
Line 0+00
Freewest Resources INDUCED POLARIZATION
SunGold Property - Wye Lake Powell Leke Area
Grid
Dote: 05/07/15 i'I1S.: 526/07 Interpreted by: S. Tshirrbolonga, eng. Project 16:).20
GEOSI G In c.

RES 100K
l I 1
1000~ I 1 I
10"
TOPOGRAPHY
RES I STIV ITY
(OHM-")
CHARG EAS I Ll TY (msec)
INTERPRETATION
NORMALIZED CHARGEAS I LITY
NC 30
o
-30
0-'
0-3
0-' 0-5
n=6
n=1
0:2
0=3
n=4
n=5
0-6
NC=CH.g . 58/SQRT(Resis) n_l
n=2
0=4
n=6
•••
easo 0 ware or e or clences
,<00 S , " . 47 7.9 l.9 1.7
IP-1716 IN"
"'" S ''''' S '-' '.1 ...
,<00 , , !llZ 2110 $JlJ 2937 2752 91S8 J(I( 231( 21K 1«2
1+50 S 1+00 S I ,
.Ill .110 -U 14 . " 18 U .. , 7.8 J.'
9 8 7 ISS SS$SSI
0<00 "'" , , , . ~ . 20 -1.\ '-' '.2 . ~
.~ '. ,/ \ ,/ "--/ .
''''' , ~, .' .' .' ., 4+50 N , "' .
2.2 .20
•• 1+50 N ,
• 1m _ _ _ _ _ n _ ,.
"' ""
,<00 , 1.7 1.8
,.00 , , .. 2 ••
2i5() N , U 10
IP-1 dSS! ,
2t5iO N , 22
"'" , ,
"'" , ,
"'" , ""' , .. SO , , , , 1.5 3.2 3.1 S.7
••
,.,
I '" ,
"SO, .. SO , , •• •• •• •• •• .40" .$0
•• /50 - .... -'0
.50 . ,Xl .0:£ .... 80 I... I'"
.40 1 .60'-',50' ,," 1 I ,,---- ....... "Il!'" / f.2 !.3 . ,/~
.40 • 1.3 1.2
NC 30
o
-30
n=1
0='
n=J
n=4
n=5
n=6
0-' 0-2
0"
0=5
n=6
IP _30
RES
rlOOK
,
~O
I r I 1'000 I r I _-30 _10
TOPOGRAPHY
RES IST IVI TY (OHM-M)
CHARGEABILITY (msec)
I NTERPRETATION
NORMALIZED CHARGEABI LI TY
n= 1 NC=CH.9 . 58/SQRT(Resis)
n=J
n=4
Line 0+50 E Dipole-Dipole Array
o o
, ' , ' , ' , ' , ,/ a = 25 M , ,
'",'" n = 1.2,3,4,5,6 plot point
Profiles ~~ 1
Logarithmic 1 1 5 2 ' 5 7 5 10 Contours ,." .), , ., •.
Inst'uments Rx : ::LREC-6 # 33 RIS 207 Tx : Tx-I I 1800W GJD #
Geeerator: Hondo 100JW
Field Work by : Pierre Simoneau . Geo
-= '\.'\,'-."
INTERPRETATION
StrO'lg & sure IP onomaly( 0.9 > P > 0.7 ) often with res'stivity decrecse
PrObable IP anomoly (0.7> P > 0. 4 ) Moderate, often wi(MJt resistivity decrease.
Possib le IF enelT'oly ( 0.4 > P > 0 2 ) Poorly defined, no resistivity feature
Weok IP increase ( P < 0.2 ) close to noise level - or in high resisi"v:~y
SCALE 1 :2500
Line 0+50 E
Freewest Resources INDUCED POLARiZATiON
SunGold Property 'NY" La<e Grid Powell Lake AreG
Dote: 05/07/15 ~TS.: 52B/07 Interpreted by: S. T shi11calonga, eng. Projec: 160. 20
GEOSIG I nc.

IP 30_
TOPOGRAPHY
RESIST IVITY
(O"M-M)
CHARGEABILITY (msec)
I NT ERPRETATION
NORMALIZED
CHARGEAB I LITY t\C=c~g. 58jSQRT(Resis)
0_ o
-30
11=1
"-4 n=5
0=6
11=2
n=4
n=5
n=6
.-,
"_4 "=, n=6
3m ~95 4168 47~ 7212
"'" , ,.., , " " "
ISSM S5I
L' 1.1 J.7 ,.,
eoso 0 wore or e ar clences
._-_.-:----:----.-'\ "/...--:---:-.-. . . : . , . \'
/ \
1<00 N , 16K 11K 9791 5163 1116 lJ5t; 236~ 16K 9Utl 18K ~K 19K 11K 251(
" 2+50 S
, ..
2+~S ,
1+50 S
• " "
, -S$"!
2<00 S ,.."
~.5 6.5
,<00 , '"'IN " , .. .. , , .. •••
S"S"
''"'' "'" N ,<00 N , 4.5 Z.4 1.8 .iO ,,JO .20 .,Xl .50 ,~ .20
l+!:o N
1+50 N
"
1+50 N 2<00 N , , 1. 1 1. I 2.4 1.4
'"
•
NC 30
o
-30
n=2
n=3
n=5
n=6
.-, n=2
n=3
n=4
.=,
n=l
n=2
n=:3
n=4
n=5
.-6
IP _30
RES r 'OOK
_0
I r I rlOOO
I r I
_-)0 Ll0
TOPOGRAPHY
RES ISTIV ITY (OHM-M)
CHARGEABILITY (ms<c)
I NTERPRETATION
NORMALIZED CHARGEABILITY
NC=CH.9 .58jSQRT(Resis)
Line 1 +00 E Dipole-Dipole Array
o 00 o
o = 25 M
n = 1 ,2,3,4,5,6
Profl,s N=l
Logarithmic 1 1 5 2 3 5 7 5 10 Contours . , , , , . I , •.
nstrumerts R, : ELREC-6 # 33 RIS Tx Tx-II 1800W GOD # 207
Generator: Hondo 1000W
Field Work by : Pierre Simoneau, Geol.
-=
INTERPRE~ATION
Strong & sure P on0:110Iy( 0 9 > P > 0.7 ) often w"th resistivity aecreose
Probable IP anomaly ( 0 7 > P > 0.4 ) Mode'ote . often wifhout resistivity decrease.
Possib;e IP onomaly (0,4> P > 0.2) Poor y defined. no resistivity feature
Weak IP increase ( P < 0.2 ) close to noise level - or i1 nigh 'esis~ivity
SCALE 1 :2500
Line 1 +00 E
Freewest Resources INDUCED "OLARIZATIDN
SunGo'd r~rClJerty - 'llye .oke Po HE' I Lc:-<~ Area
Do:,: 05/07 /15 ~S.: 528/07 Interpretea by: S. Tshimbolanga, eng. Project 160 20
GEOS IG In c.

RES 100K_
IP ,,-
I J I
,oooJ I J I
,oJ
TOPOGRAPHY
RESISTIVITY (OHM-M)
CHARGEABILITY
("""")
IN TERPRETATION
NORMALIZED CHARGEABILITY ~=C~9. 58/SORT(Resis)
0_
,., ,., ,·3 ,., ,·S ,.,
,.,
,.,
NC 30
, ...---. --,-:- .-:'" ':--
1-----0./ --'-
~s 2+50 S , 2t!iQ N , 2,?,S '?S ''''' N 1+50 N , "'" S ''''' N ,
tJOO 4111 2644 12K 121( 17K 16K '" I~ 241( \I'JK J6IC 12~ '" .. 147 m ... ".
"'" S , 2+50 S , ''''' S MlN , "'" S ''''' S , "'" N , ''''' N
1+50 N ''''' N , "'" S
" . " 10 13 • » 4.9 4.1 . " 1.1 S. I l.6 Z.t J.2 J U 2.J
"','" .' B'--.:'..~1C _ ,~ "'~D '\~\;;;:. , ., •.• '/ ...... 1;1 Yo "'J" I.' /'r--'.2.J'/ •.• ".1 1I 37 24 19\~ II 21 21 ~2:2 za,-!~'·lrU 3.8 U lG 11 &.2 U J.2 ~~ U 1.1
~12 '1 ~, t 21 ............. R-21 -'1< <> \ 'I" U ( 4.1 3.1 ].1/ I' 7.4"'--...!:-2/ I u~J)'B ~.4 U U , )...k. ,-- _ ........ "';'\... ' ( ::/ _ / (,
I 20, 31 i:lf~ XI~t' If ) 14 H ........... It " l 3U~ ~ i.!" 12 \ ~ ' l.4 l.J U 7. I U /. U U J ~ 1.4 U
to-,20,,~l .'lS )2t)~ 12 lJ ........... Z,~»" 'U~ \I, U B 1,4 1.2 1.8/4/ l.J U ".1 1.5_7.4
21 \I ' c» \5l .. 14 12 11 12 11 • 11· ' 7.. ') U 7 ~.l U 4.5 ~.. U 1.1 U
IP-17 16 IP-12 11 IP-3 IP-1 IS SI ISS
"'" s 1.1 I.' , .. 1.2 2.' '.1
\\\\G
, .. 2.2 ." ''''' s , .~
"'" s , .~ .~ .M .M
.~
. ~
.M
0 ,
"'" N , .~
''''' N , .0
1+50 N , 1.1 1.1
, n I
''''' N ''''' N , , 2.5 I.' .~
.311. \ ,.; ,.40 ,~,/,.1 }.1~ I tz \ .~
.10 ,,* .~",_ .~ ?[.-·;;~;l.2l )1.2 :~.0~ ... -\~ htD'" /1 .•
.KI ,~, .JCI '~I LI. ........ 5 ;19, .20.~~~\ 1.1 I ....... • I .~
.10 .XI .JCI ,20/I / U 1.4 / .I!)I .» .~:,,/U II I " /I ....... ,
.0
,30 .1I .2111,-:,.,.1 ,.3 .; .99'1 ,JII ,])\(2 .• ,II, ..r ",1 '.
.to .20 ,I", 1.3 r .1fJ .19' ,20 .&0
eoso 0 wore or e or clences
NC 30
o
,., n=6
,., ,.,
,.,
IP _30
RES _1OOK
-, L
_-30
TOPOGRAPHY
RESISTIVITY (OHM-M)
CHARGEABILITY
("""")
IN TERPRETAT ION
NORMAL IZED CHARGEABILITY
t>C=CH-9.58/SQRT(Resis)
Line 1 +50 E Dipole-Dipole Array
a no a
, ' , ' , "
.... ", ,'0 = 25 M , ' .' plot point
1'1 = 1,2,3 ,4,5 , 6
pref'les ~= 1
Logarithmic 1 1 5 2 ' 5 7 5 10 Contours . . . o. . .. , ..
rs:rcmerts Rx : ELREC-6 # JJ IRIS 207 Tx : -x-II ' 808W GOD #
Generatar: "01do 1000W
Field WQf"k by . =>ierre S'moreou ,Geal
-=
"""
NTER"RGATION
Streng ~ su~e. If:> .cr~rnaly( 0.9 > ;J > C. 7 ) often ~Itn res stlvlty detretse
Pro~oble IF cromaly (0.7> P > 0.4) Moderate . often w;,nout resistivity decrease.
Possible iP cncmaly ( 0.4 > F > 0.2 ) POO'IY de''led. no resis:\.jty feature
Weak IP mcreose ( P < 0,2 ) close to noise level - or ir hgh '€s:st"vity
SCALE 1 : 2 500
Line 1+50 E
Freewest Resources !NDUCE.D PCLAR'ZAT'O .
S;J d'~_ ~ ~'''op"rty - '1iy€. _(,. e Gnd po .... '! I '.GI..e A.re=
Dote 05/07/15 NTS.: 528/07 nterpreted by: 5. Tshimbolongo, e'lg. Pro.:ec: 160.20
GE OS I G In c ,

RES 100K~
IP 30_
I J I
1000J
I J I
lOJ
TOPOGRAPHY
RES ISTIVITY
(OH"- ")
CHARGEABILITY (msec)
INTERPRETATION
NORMALIZEO CHARGEABILITY NC=CH~9. 58/SORT(Resis)
0_
NC 30
°
-30
,-, n=2
""'3 n=4
"",5
0=6
,.,
n=4
n=5
"=:6
n=1
,-5
--......... -----, .--. -- -- .-- ......... r-- _._-7"' ___ / -.......;..;.-..,.......,___ /. ~--.--.~.-:-- ."'-... .. , . -:--- ______ - ---.._/ .,"" ,r-.... ..........
11K 5166 4MI ~ 7939 1:/l(
7.5 HI
7.5/ 19 /'
I"$SS
~s . " 22 16
"iM'
,f(l U 4.2 4.7 1.3 1.3
9151 191
''''' S , U 12
.40 ,!113
;
1+~S , 1&16 11K &112 ~1 .. ,. 1(»( 121<
21JS "'50S , IS 14 6.5 5.2
ISS
,.., S 1+50 S , '''''' S , 0.150 S
1.4 1.3 3.2 4.2 . 40 . .lO
14K 21K
1>00 , 3.2 5.1
1>00 , .20 .30
.. 2.
0>5IJ N , 4.7 5
0>5IJ N , .20 .:10
m 31K
.. '" N , U 17
'''''' N , .40 .90
. -- /. ---,.....-!..-J
1+50 N 2tfXl N
16K 12&l 1166 1:141
1+50 N , 11 .110
1+50 N , .80 .10
2.5 4.5
.50 1.1
2+50 N , 9139 368J
19 11
\ 19 I 11
1~ '-.15
"
IP-1 =
''''' N , U 1.6
e050 a tWQr8 or e or clences
NC 30
°
-30
n=2
0=3
,-4 n=5 n::6
n=1
,-, ,_4 ,"5
n=1
n=2
,-4 n=5
n=5
IP _30
RES _lOOK
_0
I l I Llooa I l
_-30 I LlO
TOPOGRAPHY
RESISTIV ITY
(OH"-")
CHARGEABILITY (msec)
INTERPRETATION
NORMALIZED CHARGEABILITY
NC=CH-9.58/SORT(Resis)
Line 2+00 E Dipole-Dipole Array
a
, , , , ~, ~~ a = 25 M
, ' .' plot point n = 1,2,3,4,5,6
Profi les N ='
Logarithmic 1 1 5 2 ' 5 7 5 10 Contours " ,..J"" '"
InSHUMen t s Rx ELREC-6 # 33 PIS 207 -x : Tx-I I 1800W GOD #
Gene r ator : Hando 1000W
Fie d Work by : Pierre S;moneou, Geol.
-= , ..................... ,
NTE'F'RE':'ATION
S:rong & SLre IP onomcly{ 0, 9 > P > 0,7 ) often w'th res:stivity decrease
Probable IP onomoly ( 0,7 > P > 0,4 ) Moderate , often witnout resistivity decrease,
Possible IP anomaly ( 0, d > P > 0,2 ) poorly cefined, no resist:vity featu re
WeakP increase ( P < 0,2 ) close to noise level - or ;n nig~ -esistiv'ty
SCALE 1 :2500
Line 2+00 E
Freewest Resources INDUCED POLAHIZATION
SunG',)id Propertj - Wy"'! L~l',.(e Grid Powe: Loke Area
Do;e: 05/07/15 NTS . 526/07 :rterpretec by: S, Tshimbotongo, eng, Projec: 160.20
GEOSIG In c.

RES ,oOK1
IP JO_
NC JO
--.......... --' ---'--1
1 --, -------- -, -- ---, -------- ,------- ,- . .., -- . "
'0001 1 1
lOJ
TOPOGRAPHY
RES ISTIVITY
(OH"-")
CHARGEABILITY
(=)
INTERPRETATION
NORMALI ZED CHARGEABILITY
NC=C"",. SB/SCIRT(R,sis)
0_
,., ,., ,., ,-5 n:6
,., ,., ,., ,., ,-5 ,-6
,., ,., ,., ,., ,-5 ,.6
o
"" "S> ... ""
_S , 12 13 lJ 10
IP-181716
4+?lS 1.5 U
\51
"5IIS ,
eoson ~orrware for rne I;,artn ::'Clences
It!:O S , 121< III( 5107 5057 3216 1m2
"'" S "'" S 2<XlS 1+!lJ S 1<X1 S , , , , U 10 11 17 U 21
= ! "SMN !
"'" S , Zt?ls 1+50 S , 1100 S , "'" S I •
.50 .10 1.4 2 1.1 U 5.8 1.8 .30 .30
' ''' N , \+50 N 2+50 N ,
11K 11K .. ,. 19K 11K .. "" 141< HI( "" '" "" ,.
1+50 N ""IS , 0."" '''' N , 4.1 U ' .2 4.l 5.2 U J. 1 1J 18 G.!
IP-1 , -'U"
"'" N 0+,50 S 1+50 N ,
.30 .30 ,30 . .10 .20 .30 .40 .40 .40 .30 .40 U 1.5 .50
. ~ .~ .~ •• .~ .~
•• . ~ . m •• • • .~
.m .m . m .J<> •• ••
NC JO
o
-'0
n=1
n=2
n=J
11"=4
,-5 n=6
,-, ,., ,., ,-5
,., ,., n=3 ,., ,-5 ,-6
IP _JO
RES
rlOO'
_0
1
r 1 1000 r 1
_-30
r L,o
TOPOGRAPHY
RESISTIVITY
(OH"-M)
CHARGEABILITY (msec)
INTERPRETATIO N
NORMALIZED CHARGEAB ILITY
NC==CI-\>t9 .58/SORT(Resis)
Line 2+50 E Dipole-Dipole Arroy
o
,
'0 o
, ' , ' , ' , ' , .; o=25M , ' '/
plot point n - 1 ,2,3,4,5,6
Prof'les N=l
Logarithmic 1 Contours ' 1.5.2,3,5,7.5, 10, ..
1nst ru ments Rx EL REC-6 # 33 '800W GOD #
IRIS 207 Tx - x - II
Ge'lerator: Horda 1000W
~ie d Wor'.<. by :lierre S;'110neou. Geo .
-= =
"'"
INTE'<PRETATION
St~OI'lC & sure IP anomcly( 0 9 > P > 0,7 ) often Jw'th res:sti .... ity decrease
Probable IP oncmqly ( C. 7 > P > 0.4 ) Moderate , ofte., wl{hout resisti .... ;ty decrease
Pcssbe IP oror-·cly (0.4> P > 0,2) Poorly defined, no resisti .... ity feature
Weak P increase ( P < 0.2 ) close to noise level - or in high resistivi ty
SCALE 1: 2500
Line 2+50 E
Freewest Resources INDUCED POLA.R!-·:ATlO~
3W1GOII] Property Wyc L'll'(e r-r'jd Pcwe'l Lake AI en
Date: 05/07/15 NTS. 526/07 Interyeted ';)y. S. T srimbolanga, eng. Projec~ 160,20
GEOSIG Inc.

RES 100K
1 I j I
IOOOi
I j I
IOJ
TOPOGRAPHY
RESISTIV ITY
(OH"-")
CHARGEABILITY (msec)
INTERPRETATION
NORMALIZED CHARGEABILITY
NC=CH.9.58jSQRT(Resis)
NC 30
o
-30
11",1
n=2
1I'="3
n=4
11=6
1:-. -----
++?lS Jt!XlS 24J4 1441 1799 ~91 7100 7346 6J52 5862 ., 1+50 S ,
4040 1140 41322 ~ 12<
OIjOS I~ I~ I.
..." 1+50 S "'" , "'"' "'" , • • • • • . .. 10 6.1 Il 15 13 g.7 6.1 4.7 U 2.~ .. , 4.} 4.2 4.7 U
~ :4J; ~ -.,14 10~ 13 15 13 97~6'~ 41~ ~~) 41 4 43 4.2
18 ,33' JO ~ \2 . 13 __ 16l 14 14 IS 13 a 1 \ 2.6 5.6 J \ 3.5 3.1 J 8 4.5
\,~ \;~ ¥ €;)' 15 12 If:'\ 12' \J~~~\64 25 '3" l.1 4.4 U
'1\ \r~ JO~ \17 0,) 1J 12 \J 1~11 \& ' 1&\,,,\" ~~1'15 17~5.2 4~~25 \35 ,.8 3.8 U 4.1 •. 1
, \ \ ' .~ \ ~ " .C 1& '31~ ~'I,I' 12 15 1l I. _ 16 11 67 1.7' ')5 25 21 1 U
14K 92~2
5.4 ~.I
It!:l,l N ,
I,,"' •
6.2 6.S
2<00 , """ • -I .. 12 8.2 4.8
IP-1B 17 16 IP-14 13 IP-1 =""
n=1
n=2
n=3
"=4
w
"
$I
I. ' I.. '''"' • 1.1
"'" , l.'
1+!(l S , u
1<00 , "'" , "'"' • • .< .< ." ."
.30 .JQ .~
.20.1CI
.20 .XI .30
, .10 ::sa !20 ~ ,l() .JQ
.20 ; 2(1
1<00 , • .w .w ." ."
1+50 N , .4lI -.ea
"'" , • , .. "'" , •
. " .N . .50"" .50 r,·40 ':;;I:'; -I'l' 2.4d .->: ~ .~
.:10 .50 ",'.40 ~ -.00 "Z2V J.-6 r ~ "'12 [1 ," I' /,\
.20 ,:lG .40 ' ~ ~'j {~L _1.5 .«1
.w
11' ",,' .30 .:10 .20 .30 ~2 1 i1.5 1,,-;.4(1
. . 30 .30 .10 'II' -4 ti1.s .t::>. ;;/ / .~ .J(! .30 .3Cl M 1.1 I .80
eoso 0 ware or e ort clences
NC 3IJ
o
-30
n=1
n=4
n=6
"=2 n=J
n=4
n=5
n=1
n=2
_-30
RES r 'OOK
I f I r1DOO
I f I LlO
TOPOGRAPHY
RESIST IVITY (OHM-M)
CHARGEABILITY (m"",)
INTERPRETATION
NORMALIZED CHARGEAB ILITY NC=C~9. 58/SORT(Resis)
Line 3+00 E Dipole-Dipole Array
o co o
, ' , ' , ' , ' , ' , ' a = 25 M ,../ n = 1,2,3,4 , 5,6
plot point
Pro'iles N ~1
Logorithmic 1 1 5 2 3 5 7 5 10 Contours . , , , , . I , .
Inslrumen t s Rx : ELREC-6 # 33 Tx Tx- II 1800W GOD #
Generoto': Hondo 1000W
IRIS 207
Field Work by : Pierre Simoneau. Geo
-=
INTERPRETATION
Strong & sure P onomoly( 0.9 > P > a 7 ) often with res i s~ i 'li ty decrease
Probable IP anoMoly ( 0.7 > P > O. i.. ) Moderate, often wifhout resistivity decrease .
Possible IP onorroly ( 0.4 > P > 0.2 ) Poorly defined, ro resistivity feature
Weak IP increase ( P < 0.2 ) close to noise level - or h high resistivity
SCALE 1 :2500
Line 3+00 E
Freewest Resources INDUCED POLARIZATiON
SunCold Property - Wye Lake Powell Leke Area
Grid
Dme: 05/07/15 NTS : 528/07 Interpreted by: S. Tshimbolcngo, eng. Project 160.20
GEOSI G In c.

RES lOOK.,
IP 30_
I j I
1000~
I j I
IOJ
TOPOGRAPHY
RES IST IVITY (OHM-M)
CHARGEABILITY (msec)
INTERPRETATION
NORMALIZED CHARGEABIL ITY NC=C~9. 58/SQRT(Resis)
, , , O~ o
-30
n"-'l
n=2
n=i
n=6
,_I
n=4
"-5
n=l
n=2
"-3
'<Xl S , 2+50 S , 4076 3741 4374 \&SII 11K 2]{ 7141 55S6 •• J<OO 1601 1911
"'" S 3.3 6,1 15 15 " ro 15 U
"~)I 1\,~.7 /:22 ;2( ." 15 ... 15 15 2(1 15
~11" 2S '~17 ~ , '23'>..18/ \1 ~ 13 ,,\:M 2J ---. \9 17 20 2?) 12 Il 12 11
"\' «)" \"f7~!''''''' f"\," "18,,, 11 >\lB~ 7.2~'3 \ . ,g \ g .~ U , 13
18 , ~ .~ 10 -.] ) IS 18 ~ 11 10
IP-18 IP-15 IP-13
"'" S ,
= 2+50 S ,
= 2<Xl S , 1+5:) S , ... 5.1 1.7 .40 1.5 1.9 1.5 1.1 1.9 2.5 3.2 u . ~
eosoft Software for the t.ortn ::,clences
--- -------" -~-- -- -_/ ..., " -. - , -" . '\
1956 81\6
1;00 S
2.7 2.2
"00 S , .50 ,20
,~ 1m
0+,50 S
' .4 ' .1
.30 .40
11K 18K
4.3 4.J
,XI . .lO
0>50 N , ,. ""
0>50 N , 3.7 4.3
0>50 N , ,XI ,40
17K \SI(
1<Xl N , '.4 S.1
,<00 N , .30 ,40
1tSON , ,~ ...
''''' N , 5.4 IJ
,"" N , .30 1.4
612 311 21l IJ88
2<Xl N 2"" N , , 9 5. l -.&0 .JO
.~
U 2.& -.40 0
NC 30
o
-30
n=1
n=3
n=4
n=5
n=6
n=1
n=5
n=6
IP _30
RES r 100K
_0
, ,
I
f I f'oOO I f I
_-30 LlO
TOPOGRAPHY
R ESI STIV ITY (OHM-M)
CHARGEABILITY (m,.,,)
INTERPRETATION
NORMALIZED CHARGEABILITY
NC=CH"g.58/SQRT(Resis)
Line 3+50 E Dipole-Dipole Array
, , '''" ,"
" ,,,' a = 2S M , , '16 n = 1,2,3,4,5,6
plot point
Profles N= I
Logarithmic 1 Contours '
1.5,2,3,5,7.5, 10, ..
Instruments Rx ELREC-6 # 33 IRIS 207 Tx Tx-I I 1800W GDD #
Gererotor: Hordo 1000W
Field Work by Pierre Simoneau, Geol .
-= =
Strong & sure IP onomaly( 0.9 > P > 0.7 ) often with resistivity decrease
Probob e IP anomoly ( 0.7 > P > 0 4 ) Macerate, often withOJt resistivity decrease.
Possibe IP anomoly (0 . 4 > P ) 0.2) Poorly defined, no resistivity feature
Weak IP increase ( P < 0.2 ) close to no:se level - or in nigh resistivity
SCALE 1 :2500
Line 3+50 E
Freewest Resources INDUCED POLARIZATION
SunGold P,-operty Wye Lake Grid Powel! :.oke Area
Dcte: 05/07/15 NTS . 528/07 Interpreted by S. T shimbolongo. eng. Project 160.20
GEOSIG Inc.

RES lO{)K
l IP '0_
1 1
'000 1
l 1 1
0_
lOJ -"'-
TOPOGRAPHY
RESISTIVITY (OHM-M)
CHARGEABILITY (msec)
INTERPRETATION
NORMALIZED CHARGEABILITY NC~CH09. 58/SORT(R";')
NC '0
"'" S MlS
"" ,.,
"'" S MlS ,
I' 18 " . 11 7.2
......
21l S "., S
3.1 U 11 ! .•
1+::05
2140 ~
' ' ''' S , 10 7.5
". '"
5.1 0
OIfAlS 1125 1491 "" .... 1211 HI(
""" S ""'" , , 1.1 U 1.1 U
"00 , 1~ 14K
'<00, , 5.5 l.!I
,.."
"" '"
1+50 N , U II
417~ 502 nal 2211
U .&0 2.1 1.1
.. '/..13 g. I!.J 7.2~ ~,' ,:,,:\ '2 ~ 1.4 _ 10 )5 /,51 ~; ..,.~ ;// "'",,~ 1.9 4.2\.)5 3;'r: 9\ 11 ~\i'~\:) t'_1.9
11 ~0\ ' 2 15 \'').'_8.5 "~ \ IS-U )82'\, 4.5 U~" . .ol~~ ,'I) 2.3 H 5 ;//~ ~ 14 ~~1.9 17 ' IS-..J! xl I' 12:-"""",);U( ~)I\ 7.\\.1 4.I~'!.l~<CI:;;2~ 4 U i' /88) 12 )O/ l~_1J
= 4<OOS ,
2.1 3.3
.. I ( 12 1.' 13 12 a 15-1 g7 7.5\ 3 4.5~"q r ~I~,lO ~.I~ 4 1 4 ~ 7.7 U ( ) 1 """-;- 7.1_52
\4 ~ i 78 12 1 3~ 15 I/rry lJ \ 811 \ij )~~~ 002.2 -t I' '.~ \~-..;J9 ( 7 1 ~I'\, 9'l('(5f 'ii ~ 11 r~~";... 11 ' ~.I' It'/ If ) { ( ~;\ '4 ' 97 ) l}¢'~~ U , -2.1 .0 ",1.8 ~ro"'" U~ 1.4 a.,\..:::: u u
2.2 1.4
IP-15 o
2.1 1 "'" S ,
. 5G 1.3
IP-1 4 IP-13 n~O ,
''''' S 1+50 S
1.4 1 l. a 2.4 ''''' S """ S ,
U 0 .I!1l .:iII .20 .11) .10 .XI .:iII .70
IP-1 =
It!O H , 1.4 3.4 ... .20 . .0 .XI
eoso {:,O ware or the earth SCIences
NC
'"
-'0
n=2
n=J
n= 4
n=5
0-4
IP _'0
RES r'OOK
_0
1
r 1 1000 r 1
_- 30
r Lo
TOPOGRAPHY
RESISTIVITY (OHM-M)
CHARGEAB ILITY (msec)
INTERPRETATION
NORMA LI ZED CHARGEAB ILITY
NC= Q-t.9. sa,lSCm(Resis)
Line 4+00 E Dipole-Dipole Arroy
o 00 o , I I ,
, , , , , , , , " ' , ' '/
plot point
c==25M
n - 1,2 . 3 ,4 , 5,6
Profiles N = 1
Logarithmic 1 Contours ' 1.5, 2, 3, 5, 7.5, 10, ..
nSlrU"1e1ts R, ::LREC-6 # 33 IRS 207 TN TN-I 1800W GDD #
Generator: Hondo 'OOOW
Field Work by , :Jiert'e Simoneau, Geol .
-= =
"'"
INTERPRETATIOl',
Strorg & swre P anomoly( 0.9> P > 0.7) often with res:s,:v:ty decrease
P"bobl, IP anomaly ( 0.7 > P > 0." ) MQde'ote, oHen wirhout resistivity decrease
Possible IP anomoly (0. 4 > P > 0.2 ) Poor'y defined, no resistivity feature
Weak IP inc.reose . (.P < 0 \ 2 J close to nOise level - or In hgh (es lstlvlty
SCALE 1 : 2500
Line 4+00 E
Freewest Resources INDUCED POLARIZA:'ION
SunGoirl Property - Wye Lake Grid Po.'ell Lcke Arec
Date: 05/07/15 ~TS.: 528/07 Inlerpreted 0'1: S. T shim.JClcnga, eng. Project 160. 20
GEOSIG Inc.

';
SUNGOLD Property
Kokobeko Falls
Nono lu
~:=:::: ' I I,
" Muri ll o
i
?/ ii. .'
',' '://')G' i" '._' I
n . .:
53E5000 mN
I N +
GEDPHYS CAL LEGEND
strong and sure IP anomaly, Often with resistivity dec ,-ease. I 0.8 ) P ) 0.7 )
! $ $ $ $ $ 1 Probable IP anomaly . Moder ate often without resistivity decrease, I 0.7 ) P ) 0.4 )
Possib le IP anamoly. Poorly defined, no res istivity feature ,
10.4> >0.21
\\\\\ Weak IP anoma ly. IP increase, close to nOise level ar In high resi 'I y. I 0 • 2 } P I
". ... , ......... IP Ax:s ••••••••••
• • Strong VLF conductor
--0------0- Weak VLF conductor
......... '-...... Strong MaxMin anomaly
" .. .... Medium MoxMin anamo ly .. .
rJ t; 2.5 Conductiv ity in mhos
' .... \ '. \ \, I ' \/ \/
D=5 Apparent Deep in meter
\ \,
j'.t1/ II D • L, ,-'
, J
LaKe
, '/ Vvye
INSTRUMENTS
{
{
{
, {
{
l nl,:e _ ....., r , ......
GEOPHYSICAL LEGEND
10 10'
r--~==~I ==~ __ ~ ! I:) irll.3ec}
RS lor m- m;
-60 - 30 0
') \, (
IP (Chargl3obility) 2.1 ) Re8i~tivity fi05
30 60
! I 4.4 Nor molized ChorgeabilitJ-..
I r . , , 2 0 , '8 , 4 ") iJ \.1 I < \
~-~-'I----'I NC (mh 05ec) -30 -15 o 15 30
76
The coordoncte ~Y:ltem I" in Uni\ler~a l Tron"ver~ e Mer~!Jtcr ( L TM ) grid, N,A .D, 83, Zone 15.
INDUCED POLARIZA TION SURVEY
MAP Profiles and Postings
0=25 n=1
SUNGOLD PROPERTY FOR
FREEWE§T RE§OU"lRCE§
GR ID
A.REA
DISTR ICT
N.T.S.
SCALE I' 2500
Geosig
Executed Wye Lake
Powell Lake
by P. Simoneau Geoph. Georges Tlllkl, MBA
Thunder Boy, Ontario Inferpreted by S. Tshimbclungc, EJ~.
52 B/07 Geomottc by Donala Saindon, Gecg,
Map no 7832 01.1 _.;2i::?=,,:5~p __ 7;,:5=~I(P m, Project no 160.20
DA TE
20~8 -0 8
2005- 06

SUNGOLD Property
,~~:-,?('
./
!2,.. \ ,1 Kakabeka
Fells ,~ _ ,..-'t,.
Nonalu
(- '--co ( -., >~" -,
, \
SOUi
Gill ie~,p-~_J
~EOPHYSICAL LEGE '<D
! /
,I
l~ Ij P( " . r
.'. u i, ( '
i'
53650COmN
I IN t
Strong o . 9
and sure If anomaly. Often with resistivity decrease. PO .7 )
(SS5SS) ,"robable If anomaly, > 0 .4 )
Moderate Jften wihout resistivity decrease, I D. 7 P
Possible IP anamoly, Poorly defined, no res istivity fectcJre,
\\\\\
."" --........ _-., •••••••• ••
• •
0,4 P 0.2)
Weak ( 0 . 2
If anomcly, )
IP Axis
IP hcrease,
Strong VLF conductor
-0---0- Weak VLF conductor
..... ~ Strong McxM'n anomaly
,. ... - "" ~ Mecium MaxMin anomaly
a- t; 2.5 Conductivi-y in mhos
53
'''' l ' I, '\. , , \ ) \ /"-
-.c
0=5 Apparent Deep i1 meter
close to nOise level or In high resisti ity,
I .' [ ,-r /'( e _ ,A , ..
INSTRUIv1ENTS
I , ,
, , , ,
by GOD Tx= TX-II no, 207, R>:= ELREC-6
GENERA TOC\~
IBOOW no, 33 HO~IDA
(BRGM) 1000W
I ,"' (' , _ I {I<.F~ ._ ........ ' , .V
w E o
100000 BOOOO 60000 40000 20000 18000 16000 14000 12000 10000 9000 BODO 7000 6000 5000 4000 3500 3000 2500 ' 2000 1500 1000 900 800 700 650 600 550 500 450 400 350 300 250 200 -50 100
70 40 10
The coordonote SY5terr 13 In Uni v~ 1 ~\JI Tnllsverse Merculor' ( UTM ) yr'id, N.A.D. 83) Zone 15
INDUCED POLARIZA TION SURVEY
MAP Resistivity Contours a=25 n=1
§UNGOLD PROPERTY FOR
FREEWE§T RESOlJlRCE§
GRID
AREA
DISTRICT
NTS,
SCALE
I : 2500
Wye Lake
POlvel1 Loke
Geo:::::oig
Executed by p, Simaoe" Geaph, Goorges Tiliki, MBA
d Ontar l'o Interpreted by S, Tshimbalcn'la, Eng, Thun er Bay,
52
o Isoa
8/07
25 50 I
75 100 m. I
~eamatic
Mop no Project
by
no
Donald Salrd)n, Geog,
7833 160,20
DATF
2008-08
2005-08

.' !
!
1 ,
I
--~ SUNGOLD Property
\
GEOPHYSICAL LEGEND
)1 .'
.' v
5J65DDDm l~
I ~
t
Sll'o ng and su r e P Jlomoly . Often with res istivity decrease, 10,9>P 0,7
iSSSSS' Probable IP anomaly, > n. ~ I
Moderate often without resist ivity decrease. ( n, 7 > P
Poss ible IP
0.4 P anoma ly.
0, I ) Poorly defir ed, no resistivit y fea ture
\\\\\ Weak IP ( 0,1 > P
anomaly . )
IP increase, close to nOise level or
". ...... ,,-- ... IP Ax 's •••• • •••••
• • strong VLF cond ucto r
-0--0- Weak VLF conductor
,"" _ Strong MoxMin ancna ly
..... -.... Medium MaxMin anomaly
nr. ... •u
.. . . " Weak MaxMin anomo ly
0' t = 2.5 Conductivity in mhos
0=5 Apparent Deep in meter
I
/ __ , I • .. ~ I ( .,.~ ',"_ • ..1 1\ C.
\. "-. ... ---_.-.-.----. ,--------
in high
--"
re
YV\le v
, , ,
<"'9.;
o~(' 0,
c2/ 0' OJ'
CJ' CJ' "{:/ , ,
INSTRLMENTS
Tx= TX-II no. 207, Rx= ELREC-6
GENER.<'I TCR=
ISOOW no . 33 HONDA
, , , ,
-- .- -_ .... -.- -- .----.... -- -'--
"
c:; /' ,-! -F' (-. V I I c.~ 0 I ) .. ,
50.0 45.0 40.0 35.0 30.0 28 . 0 26 . 0 24.0 22.0 20.0 19.0 18.0 17.0 16.0 15 . 0 14.0 13.0 12.0 11 .0 10.0 9.5 9.0 8.5 8.0 7.5 7.0 6.5 6 . 0 5 .5 5.0 4.5 4.0 3.5 3.0 2 . 5 2 . 0 1.5 1.0 0 .0
- 2.0
! ,..- .. k ~':J LtJi,I,._
The coordonoje sYltem is in Unlv"rso l Trcnsver~e Mercator ( UTM ) grid, N.AD. 83, Zon9 15.
INDUCED POLARIZA TION SURVEY
MAP
GRID
NTS.
SCALE
I : 2500
Chargeability Contours 0=25 n=1
§UNGOLD PROPERTY
FREEWE§1~ RESOURCES Geos i g
Wye Lake Executed by P Simoneau Geoph. Geor£es mki, MBA
Powe ll Lake
Ont" r l' a Interpre ted by S. Tshimbolongo, Eng. -'.T ,'.!hC',u n"Cd",e'l.r_B='-".o '1..>1 '_='-'''''-'''--
o I
52 B/o7
25 50 I
75 I
Geomotic by Donald SOlndon, Geog.
Map no I~O m. Project ~o
7834
160.20
DATE
2008-08
2005-08

SUNGOLD Property
.' '- ", 17 I " '", } ,-- .
/ L~I ~ l d0" ...:\ ) , , I •• , I
'.
Kokobeko Falls
Nonol"
GEOPHYSICAL LEGEND
Strong and sure IP anoma ly. Often ( 0,9 PO.7 )
.,
5J 65000m N . '.
l. ~
I IN t
wi th res istivity dec re a s e.
IS ss S S1 Probable IP anomaly. Moderate often without resistivity decrease. 0.7 P>D.4)
Foosible IF anamo ly Foorly def ined, no resistivity feature .
\,,\\
tJ1III""" ;.. , ... - ..... 1 •• 111 ••••
0. 4 P 0.1)
Weak I 0'.1
IF > P
IP Axis
ono maly . I
IP
• • Str'ong VLF condUCTor
-0--0-- Weak VLF conductor
""P""'- ...... - s tr ong MoxMin anamo ly
.. '" - .... Medium Max Min anoma ly
CJ't = 2 05 Conductivity in mh os
incre:Jse,
D=5 Apparent Deep in meter
53
I ~ •• -",
\ -'-'-'-'-' ........... --- . . ...,.--...... .-
.. ' .. --
---/' "
/ /
.~ ,/
J /
./
close to noise Ie 'I e I or in high
.-.. _ .. - -_.-.- ---
Lo .k;?
resisti ity .
1,11 '/ 6 VI! 'f' '
v
!' /'
/
(~ '010.(' 0,
rf/ 0' </)'
0' ()I
v:,'
INSTRUMENTS
, , 1 1
, , ,
Tx= T X-II no. 207, 1800W no . 33 HONDA
by GDD (BRGM)
IOOOW Rx= ELREC-6
GENERA TOR=
w t:
80 a 70 a 60 a 50 0 40 0 30 0 25 5 21 a 16 5 10 a
7 .5 7 .0 6 5
5 5 5 . 0 4 5 4 a 3 5 3 a 2 5 2 3 2 2 2 2 a 1 8
7 5 4 J 1
a a 8 a 7 a 6 a 4 a 3 a a a
- 2 0
'. 70
The coordonat e systerr IS In Uni'lersa l Trmsverse Mercato· ( UTM ) grid , N.A.D. 83, Zone 15.
INDUCED POLARIZA TION SURVEY
MAP Normalized Cha rgeabi lity Contours 0=25 n=1
ECT
§UNGOLD PROPERTY
FREEWE§T RESOURCES
GRID
ARC: A
DISTRICT
NTS.
SCALE
1,2500
Wye Lake
Powe ll Lake
Thunder Boy,
a ,
52 B/07
25 I
50 I
Geosig
Ontar io
75 Iqo m. I .
Executed
Interpreted
GeomoTic
Map no Project
I nco
by p. Simoneouk
Geoph. Georges Tili i, MBA
by S, Tshimba langa, Eng.
by Donald Saindon, 03"9,
7835 no 160.2'0
DATE
2008-08
2005-08

.. --
SUNGOLD Property
!
\ !.; rc,i,/ j
t a . j.t r
l ., , !,.
i Kokobeko .( ' .. ~F~ol~l s-\C"71--.;;:t=i~ II'·: -.-
Murillo I'I'I:I),I/Thunder Nonolu J~. ,!: . ./ Boy
GEOPHYSICAL LEGEND
5365000mN
l N t
Strong and sure P o10maly . Ofte l with resi stivity de crease. I 0.9 ) P ) 0.7 )
ISS S S s, Proboble IP onomoly. Moderate often without res istivity decreose. I 0.7 > P > 0.4 )
Possible IP anomaly . Poorly defi ned, no r esistivity feature. I U ) P ) 0.2 )
\\\\\ Weak IP anoma ly. IP increase, close to no ise leve l or in high I 0.1 ) P J
"". ~ ,_ ...... I" Axis ••••••••••
• • strorg VLF conductor
--()----{)-- Weak VL F conductor
~ Stra ng MaxMin anamo ly
.. " -..... Medium MoxMin anomaly
••••••••• ~. Weak MaxMin anomaly
0' t = 2 . 5 Conductivity n mhos
D=5 Apparent Deep in meter
536
I' , "-. \ .. \ ". , , \ ) \/
.. ,---' ,
,//
( )
/ .I
II f
/ /
/ L._
.'~ "" \ I. ; .. \.
) "
/ \, ,r/ \
._/'~. \
, j I !lv' If e
0" .l .r
'-...,
j i
/ , F
/ , ,,,?
/
(~ \
--~--. "'--. ;1 \
i I \ ~'-.
-~--.'
Lake
iJiv' \ F Ll ! .Y~'
I •
L ",.:-:") __ __ -11\ L
INS TRUMENTS
Mobiles magnetomelier s- VLF GSM-19WV, nunbers 612627 and 66573
by GEM Systems Base mognetalmeter
number 254116 by EDA-Scintrex
(, I ',e:
'0 tb", 1:>,
c/!/ ",' '1;1 (JI (J'
"<,'
1 , ,
, /
) , ,
, I
,
, /
I ,
---_.-.. -.-.- --, .. ~ --.-
I.oke
w E
/ ) ke
_ .. _-_ ..
GEOPHYSICAL LEGEND
53700 57700 6' 708 QommoG
2" 30816' Th~ cilordenote system is in Universal Transverse Mercctor ( UTM ) grid, N.A.D. 83, 2o~e 15.
MAGN ETOMETER SURVEY
MAP Profiles and Postings
TOTAL FIELD
§UNGOLD PROPERTY FOR
FREEWEST RESOURCE§
GR ID
/IREA
DISTRICT
N.T.S.
SCALE I : 2500
Geosig I nco
DATE Wye Lake Executed by P. Simoneau, Geoph. Powell Lake
Thunde r Bey , Ontario Interpreted :)y S. Ts~inbo l ongo , Eng. 2008-08
52 B/07 Geomotic by Donold Soindon, Geog.
Mop no 7836 0., _.;2j;'~=~~l;,O_..;71::,5=~I~O m. Project no 160.20

,e
/'~ i,
'i .. II Koshabowie
:'
L
f I, Raith
!~. _.
Shebondow n Shoboquo
:1
~1.c>l::I' h "li '.1
SUNGOLD Property
~ Kokobeko
~F ol~lsl ~~ili/II II I~III'\ ~'~h u n:e-r Nonolu L II! Boy
GEOPHYSICAL LEGEND
5365000mN
I IN! t
Str ong and sure IP anoma ly, Often with re sist ivity decrease . I O,g > P > D.) I
ISS ss S! ProbablE IP anoma ly. Moderate often without resistivity dec-ease, (0,»P>0.41
Possible IP anomaly. Poorly defined, no resistiv ity feoture.
( 0.4 > P > 0.2 I
,\\" Weak IP anomaly. IP incr eose, close t o noise level or in high res i ( O. Z > P I
",., .... ,--~ 1° Axis .- .. ... ... .
• • Stron g VLF conductor
--0---0- Weak VLF conductor
", ~ Strong MoxMin anamo ly
,,- .... Medium MoxMin anamoly .- . • ...... . .... Weak MaxMin anomaly
0- t = 2.5 Conductivity in mhos
D=5 Apparent Deep in meter
536:,W00m
\ ,.; V
.---~
/ /
__ .. r" ....... " ... ---,
, )
/ ! I ( f
/ l
/' ~/
\ \
( , i \
)
'\ \.
'-,,\
\ I
/ I
I
---....1
YV~- e
) I
/ /
;'
/ <l'
./
~--\ , I
l, ~"----
-~---.- --
Lalli?
y.
/lilye
!
! \.
! - I.::.> lL .. /~r-
INSTRUlviENTS
---
I', ; 111' If ..
'--"
(
) , I
~
Mobiles magnetometers-VLF GSM-19WV, nunbers 612627 and 66573
by GEM Systems Base magnetometer
number 25411 6 by EDA-Scintrex
/',.--;'
/
I \
-_ . ...-/_ .. _--
" ;
(
,
(
)
, I , ,
, I
-.., /.-\ /"".,/
\ .... --------
-........ "'-.. ---.. -.. --........ "
'-
...-----/,--"'" -"' ....
--~--~'
"-.. \
\.
1.~.J ,.- -( __ , ; i f 1 .;;1 I) I L) /
58794 58683 58577 58491 58416 58362 58301 58244 58190 58150 58102 58056 580 11 57976 57934 57892 57851 57819 57778 57738 57698 57657 57625 57584 57542 57500 57465 :1 57420 57374 57.326 57286 57232 57175 57114 57060 56985 56899 56793 56682 56485
, ",
LakE:
Th e ccordonllte aY9tem is in Universel TrOliSlIO'!rse MO'!rcator ( UTM ) grid, N.A.D. 83, Zone 15.
MAG N ETO METER SURVEY
MAP
Total Field Contours / ',-, 1~--------------------------------------------4
/ §UNGOLD PROPERTY
FOR
FREEWE§T RESOURCES
GRID
AREA
DISTRICT
N.T.S.
SCALE
1,2500
Geosig
Wye Lake Executed by P. Sirroneou, Gecph.
PJwe 11 Lake
T Onto r 'lo Interpreted by S. Tshimbalonga, Eng. hunder Boy,
52 B/07 Geomatic by Donold Soindon, Geog.
Mop no 7837 o 25 50 75 100 m. 1 .... _.,1== .. 1 __ I====il Project na 160.20
DATE
200B-08

.. -- 17 rJ)
L ... ~/d')-" L rJ:: 'i i/
"
/
"
,-
~-<
I fl., " t . ! 1.;'Jr.) '1.(\ ....... , , I' " ("I.,J '. .~.:..:,-,---
Raith l n" - ~ f. " ~ " "'_ -' '''.., \~
\ .~" ~ 1) " ," I; . _,
I , _- -' · 1
Kaka beka Fa lls '
f
, .
.I
Nonalu
Sou '-
Gi Iii e 5,,-____ ___
5365000m N
j IN +
SUNGOLD Property ~: ;.,~, ,- • 0 r
/. ':J '. e
GEOPHYSICAL LEGEND
stro ng and sure IP anoma y, Ofte n with resistivity decrease , ( O,g ) P , 0.7 )
'S S S S s, Probab le IP anomo ly, Macerate often w·thout res istivity deer.ease , (0 ,)'P'O,4)
Possible IP I 0,4 , P ,
onomaly.
0.1 I
Poor ly defined, no resistivity feature.
\\\\\ Weak IP anom aly, IP inc r ease, close to noise level or in high I 0. 1 , P I
" ~ ,--... IP Axis ._ II.· ••••
• • Stro ng VLF conductor
-0---0- We ok VL F conductor
" ,... Strong MaxMin anomaly
.. ' - ..... Medium MaxMin anoma ly
• •• 1:1"... .... \A'eak MaxMil anomaly
() t = 2.5 Conductivi ty in mhos
D=5 Appa r ent Deep In meter
I,i/. , 'J' b if \/ t;: i (l k (.:l
-.
/lilye LoAe
,
«
, I , ,
~ o V<" 0,
Cf/ eo'
Ib ' U I U I
"<" , ,
I , I
,
\
INSTRUU,ENTS
, , , ,
by GDD ''-._. --. (BRGM) ',. ,.._ . '--- .. 1000W ~---,
Tx= TX-II ro. 207, 1800W Rx= ELREC-6 no. 33
GENERA TOR= HONDA \ I
"
....... _-_.
MAP
" ... ~.
w E o o o co
FreqJency 4 44 Hz
Fr equency 1777 Hz
/7 e 0' /~O)(
GEOPHYSICAL LEGEND
- 30 - 15 0
In- Phase
Fr equency 3555 Hz: ~ I O~~~~P~SB \V" --
I " \II \ \ \ \ ,',
.-
I ,..!~.,... I I,' \ i-:1 _.1... J ......
- 15 - 3Er.
Oul-of- Pho!e
The cOll rdonoie SySi l'ffi is in Unive rsol Trons'oJeree M!!rr070r ( UTM ) grid , N.A.D. 83, Zene 15.
HEM-MAXMIN SURVEY
Profiles and Postings Reference cable 100m
-. ....--
I~--------------------------------------------~
§UNGOLD PROPERTY FOR
FREEWE§Pf RESOURCES
GRID
AREA
DISTRICT
N.T.S.
SCALE
I I 2500
Geos i g I n Ce
Wye La~e
Powell Lake
Thunder Boy, Ontor ia
52 B/o7
o 25 50 75 100 m. .I--"I====~I----'~~I
Executed by P. Sirroneou, Geoph.
Inte rp reted by S. Tshim,alanga, Eng.
Geomatic
Mop no Project
by Donald Saindon, Geog,
7838 na 160.20
DATE
200B·08
2005-08

SUNGOLD J Property
Kakabcka Fa lls
Nona lJ
\ ,"
GEOPHYSICAI_ LEGE~~D
ISS(S5i
Strang and ( 0 • 8 > p >
sure 0.7 I
II-'
Probable IP aroma ly. ( 0 • 7 P 0.4 )
anomaly. Often
Moderate often
Possible IP anom aly. Poorly define ci, o • 4 P 0.2 )
\\\\\ Weak IP anomaly. IP Increase, close ( 0.2 > P )
" a-. ~". ....... IP Axis •• ••••••• •
• • Strong VLF conductor
--0------.0- Weak VLF conducTor'
~ Strong MaxMin anomoly ",....- ~
... ".... Medium MaxMin anomoly .. . • ....... .. . Weak MaxMin anomo Iy
(J't = 2.5 Conductivity in mhos
D=5 Apparent Deep In meter
with
53 65000m ~,I
, '"
-esistivity
I 1M +
decrease.
without rcsidivity decrease.
no resistivity feJ~ure"
noise lev el ar In hgh
)
(
resisti ity.
( '·AD L. .• ~ C!,\c"
I I
I I
I
I I
I~STRUMENTS
Tx= TX - II no" 207, 1800W no 33 HONDA
Rx= ELREC-6 GENERATOR=
; I
;
I I
I I
I
"'~ , ""-----"""
LiJ E
o o
GEOPHYSICAL
-30 -15 a
=requency 444 Hz
I " III
.\i 1 \ \
)"' In-Pho!l( ?ii l .l I Jut-of-PMBe
FreqJem:y 1777 H;z ///
~5~; In-P'asa
FreqJency 3555 Hz -":--~£ Out-of-Phose ~ ~ .... ./ - -
'"\""8 r- , .J V 'i .( 6 - - ,
Th~ coordonch system is in Universol TrQn9Ver~e Mercator ( UTM ) grid, N.A.D. 83, Zone 15.
HEM-MAXMIN SURVEY MAP
Profiles and Postings Reference ca ble 200m
SUNGOLD PROPERTY FaR
FREEWE§T RESOURCES
GRID
AR EA
DISTRICT
N.T.S .
SCALE I : 2500
Wye Lo,e Executed by p" Simoneau, Geoph.
Powe II Lake
Thunder Boy, Olllolio Interpreted by S. TshimboJlanga, Eng.
o
52 B/07
25 I
5J I
75 I
Geomatic by Donald Saindon, Geog.
Map no 100 m.
I P'oject no 7839
160.20
DATE
2008-0E
2005-08

53
(
// ,....'::.- :-,/ " ".' I
'~.- . ~~ ,/
" 5365000IT~~
--< "'~' I ( ,.'.-' I ,1-, . ,r J
-, \... t
I~'l~~~" f ,/. _:!.r-_ ;..:-:~' ,,- -' h ')i-'~ \ \\. ;JP2?;'"
r" , ,
, ~'-
L ----....... -~
SUNGOLD Property
Kakabeka Foils -,,'
Nonolu 'i Murillo
GEOPHYSICAL LEGEND
l~"'!L.f Pt;'-' i / 0 , LUi': .;;.
St-ong and sure I'" ancmaly, Often with resistivity decrease. I 0.9 > P ) J.7 )
iSSSS" Pracoble IP anamoly. 'v1aderate often without resistivity decrease. (0 .7>P> O, 41
Possible I" cnomaly. Poorly cefined, no resistivity featJre.
( 0.4 > P > 0.2 I
\\\\\ Weak IP anomaly. IP increase , close to noise level or in high resi ( 0.2 , P )
~ .... ,_ ....... IP Axis ••••••••••
• • Strong VLF conductor
-0---0- Weak VLF conductor
..,......,,-... Strong MaxMin 'Jnomoly
... " '"" ... m Medium MaxMin anomaly
• a"""'.. Weak MoxMin anomaly
(J't; 2.5 Conductivity in mhos
D=5 Apparent Deep Ir meter
, , i'
/
I '1 .-' V / \/ e "
, </'
/'1'1 /. ,~ J PI \;. ... 1 ._,_ (:. t.,
, ,
l (~.. // ./"" L . ... .i l\ I:;;
INSTRUME~ns
Mobiles magnetometers - VLF GSM-19VN nunbers 612627 and 66573 ,
by GEM Systems Ba~e magnetometer
number 254116 by EDA-Scihtrex
, , , (, ,
',?,; '- ~, v (' 0,
cP/ ",'
Q) , (j' CJ' "/ , ,
,
, , , ,
'~--.----.-.... -.. ----- .---.----.~-~-... ~, .. < ... _----........ - --... _" .... , ...........
-"
GEOPHYSICAL LEGEND
PhuGe Outp~[se
-6D 0 +60%
I! i I 1
" L , \ )
5 (;S2 ,,, 3C8 7o~ '
lO 15 %
The !;oordande 5ylltem i~ in Univeraal Tran SVer3!! Mercator ( UTM ) grid, N.A.D. 83, ZOrJe 15.
VLF-EM SURVEY MAP
Profiles and Postings 24 .0 kHz NM, Cutler
ECT
§UNGOLD PROPERTY FOR
FREEWE§T IlE§OTJRCE§
GRID
AREA
DISTRICT
N. TS
SCALE
I' 2500 o I
OATE Wye Luke Execut0d by F. Simoneau, Geoph,
Powe II Lake
Thunde - Bav. Ontario Interpreted by S, Tshimbalanga, Eng. 2008-08
52 B /07 Geomotic by Donold Solndon, GeoS. 200,- 08
Mop no 7840 25 50 75 100 m.
I I I Project no 160.20

53
SUNGOLD Property
/
Kakabeka =-all s
Nanalu
GEOPHYSICAL LEGEND
r ,. 5355000mN
"' If
" ",
I IN]
+
Strong and sure IF anomaly, OfTen with resistivity decrease, ( O,g ) P ) 0,) I
is,,S,, Probable IP onama ly, Moder ate a"jer withcd resistivity decrease, ID,»P>0,41
Possible IP anomaly. Poorl y defined, no res istivity feature. I 0,4 ) P ) 0,2 I
\\\\\ Weak IP anoma ly, IP increase close to noise leve l 0" in h' gh ( 0,1 > P )
"" --,,,.- .... IP Ax is 1 1 • 1 •
1 ••••
• • Strang VLF conductor
--0-0- Weak VLF conductor
",.......-.... Str ong MaxMin anamoly
... --... Med ium lv1axMin anomaly " m
....... Weak Max lv1in anomaly II! " a :I
(J" t = 2.5 Conductivity in mhos
D=5 Apparent Deep in meter
----. ". "
/ ;_. !" (..:J t.-.Ul\ ......
I 4 i '/!/ 1/ C ( J r.:;;
INSTRUMENTS
Mobi les magnetDmeters- VLF
, ,I f I , \".,
'''"
GS\.1 -1 9WV, nunbers 612627 and 66573 by GEM Systems Base magnetometer
.lumber 254 11 6 by EDA-Sc intrex
"
, , , I
I
, , I
'~ !
GEOPHYSICAL LEGEND
~ -...,--. -~ Oulphose
--" -'- '. _. '" .- "_.
Phase Outph~se
-60 0 +60%
5 15 25%
Tr/ul r i ~ ld
, .'
L(lAe
Thl! cMrdanotl'! syst!!m i~ in Univl!r.'lol Trol'1s'Jerse M!!rciltor ( UTM ) grid, N.A.D. 83, Zane 15.
VLF-EM SURVEY MAP
Profiles and Postings 24 . 8 kHz NLK. Seattle
§UNGOLD PROPERTY FOR
FREEWE§T RE§OUR(~E§
GRID
AREA
DISTRICT
NTS.
SCALE
I' 2500
Wye Lake
Powe ll Lake
Thunder Bay,
52 B/07
o 25 50 ! ! :
Geosig In c,
Executed by P. Sinoneou, Geoph.
Ontario Interpreted by S. Tshimbolonga, Eng.
Geomatic by Donold Soindon, Geog .
Mop no 7841 7!) 100 m.
! I Project no 160.20
DATE
2003-08
2005 -0B