axial dispersion and mass transfer
291
AXIAL DISPERSION AND MASS TRANSFER IN MOBILE-BED CONTACTING by Ram Tirth Khanna A Thesis Submitted to the Faculty of Graduate Studies and Research in Partial Fulfilment of the requirement for the degree of Doctor of Philosophy. Chemical Engineering Department McGill University Montreal May 1971
-
Upload
khangminh22 -
Category
Documents
-
view
3 -
download
0
Transcript of axial dispersion and mass transfer
AXIAL DISPERSION AND MASS TRANSFER
IN MOBILE-BED CONTACTING
by
Ram Tirth Khanna
A Thesis Submitted to the Faculty of Graduate Studies and Research in Partial Fulfilment of the
requirement for the degree of Doctor of Philosophy.
Chemical Engineering Department McGill University Montreal
May 1971
Chemical Engineering
AXIAL DISPERSION AND MASS TRANSFER
IN MOBILE-BED CONTACTING
Ram Tirth Khanna
ABSTRACT
Ph.D.
A study of mobile-bed contacting with a 5.5-inch dia
meter column packed with low density (0.15 gm./cc.) spheres,
was carried out with countercurrent gas and liquid flow rates
in the range 200 < G < 3,600. and 4,000 ( L < .25,000 lb.lhr.sq.-ft.
Aspects studied include hydrodynamic parameters - minimum fluid-
ization velocity, Gmf , bed expansion, h, liquid holdup, and axial
mixing of liquid, Pe, for four sizes of spheres, 0.5,0.75,
1.0 and 1.5-inch, and mass transfer parameters including effec
tive interfacial area and "true ll liquid-phase mass transfer co-
efficients for 0.75-inch spheres.
Liquid mixing and liquid hOldup were determined by pulse
testing using finite bed transfer function analysis. The hy
drodynamic results are presented as relationships between G - G
liquid-phase Peclet number and the stirring number, L = G mf mf
correlations for Gmf and h, and graphical representation for
liquid hOldup.
Three separate modes of mass transfer, those for
droplets, films and bubbles, were identified. The relation be
tween the new process of mobile-bed contacting and the well-
known contacting techniques in packed beds, aerated vessels, and
spray columns has been established. Correlations for interfaciat
area and mass transfer are given for use in design.

1 1
ACKNOWLEDGMENTS
The author wishes to express his sincere appreciation
for all assistance received during.the course of this investiga
tion, and in particular to the following:
• Dr. W.J.M. Douglas of the Chemical Engineering
Department for counsel, guidance and encouragement.
• Pulp and Paper Research Institute of Canada
for assistance in the form of equipment grants and for the
extensive use of their facilities.
• McGill University for financial assistance in
the form of University Graduate Fellowships.
• Graduate students and staff, both academic
and technical, of the Chemical Engineering Department for their
help. The stimulating discussions with Dr. Jiri Tichy con
cerning gas-liquid contacting were especially appreciated.
TABLE OF CONTENTS
ACKNOWLEDGMEN TS
LIST OF ILLUSTRATIONS
LIST OF TABLES
LIST OF SYMBOLS
1. INTRODUCT ION
1.1 MOBILE BED CONTACTORS
.,. LITERATURE SURVEY
2.1 LIQUID HOLDUP
i i
vii
x
xi
5
5
2.1.1 Liquid Holdup in Packed Beds 5 2.1.2 Liquid Holdup in Mobile-Bed Contactors 6
2.2 INTERFACIAL AREA
2.2. 1
2.2.2 2.2.3
2.2.4 2.2.5
Dry, Wet and Effective Interfacial Areas Measurement of Interfacial Area Effective Interfacial Area by Absorption with Chemical Reaction Influence of Liquid Properties Interfacial Area in Mobile-Bed Contact ing
8
8
9 10
15 16
2.3 LlQU 1 D-PHASE MASS TRANSF ER IN PACKED BE os 16
2.3.1 Experimental Studies 2.3.2 Theoretical Studies
16 17
2.4 RESIDENCE TIME DISTRIBUTION AND AXIAL 22 MIXING
2.4.1 Cha(~cterizat;on of Axial Dispersion 22
2.4.1.1 2.4.1.2 2.4.1.3
Diffusion Model Tank-in-Series Model M ixed Mode 1 s
i i i
2.4.1.4 Statistical Models 27 2.4.1.5 Evaluation of Model Parameters 28
2.4.2 Axial Dispersion in Packed Beds 29
2.5 MASS TRANSFER CALCULAT/ON MODELS W/TH 38 AXIAL M/XING
2.6 SUMMARY 41
III. THEORY 44
3.1 TRANSFER FUNCT/ON METHOD OF EVALUATION 44 OF PECLET NUMBER AND RESIDENCE T/ME
3.1.1 Transfer Funct ion Analys is for 45 Infinite Length Boundary Conditions
3. 1.2 T ransfer F unct ion Ana 1 ys i s fo r 47 Finite Length Boundary Conditions
3.2 EVALUATION OF MASS TRANSFER COEFFICIENT 50 IN THE PRESENCE OF AXIAL DISPERSION
IV. EXPER IMENTAL
4.1 DESIGN OF EXPERIMENTS
4. 1 • 1
4.1.2
4. 1 .3 4.1.4
4.1.5
General Determinants of the Experimental program Basic Elements of the Experimental program Mixing and Holdup Study Determination of Effective Interfacial Area Liquid-Phase Mass Transfer Coefficient
57
57
57
59
59 60
62
4.2 INTRODUCTION TO EXPERIMENTAL PROGRAMS 64
4.3 EQU/PMENT AND PROCEDURE FOR MIX/NG STUDIES 64
4 .3. 1 L i qu id Flow S y stem 67 4.3.2 Gas Flow System 69 4.3.3 Tracer Injection System 71 4.3.4 Instrumentat ion 73
4.3.4.1 Conductivity Cells 73 4.3.4.2 Conductivity Measuring Circuit 74
4.3.5 Procedure 79
IV
V.
4.4 EQUIPMFNT AND PROCEDURE FOR MASS TRANSFER STUDIES
4.4.1 4.4.2 4.4.3 4.4.4
Liquid Flow System Gas Flow ·System Sampling and Analys is System Procedure
CORRELATION OF EXPERIMENTAL DATA ANC DISCUSSION OF RESULTS
5.1 HYDRODYNAMIC EFFECTS
5.1.1 Minimum Fluidization Velocity 5.1.2 Bed Expansion in Mobile-Bed
Contacting 5.1.3 Liquid Holdup
5.1.3.1 Liquid Holdup in F ixed Beds 5.1.3.2 Liquid Holdup in Mobile-Bed
Contacting
5.1.4 Liquid Mixing
5.1.4.1
5.1.4.2 5.1.4.3
Fvaluation of Peclet Number and Mean Residence Time Liquid Mixing in Pack2d Beds Liquid Mixing in Mobile-Bed Contactor
v
83
85 85 86 88
89
89
90 96
106
106 108
117
117
119 123
5.1.5 Conclusion 143
5.2 MASS TRANSFER EFFECTS 144
5.2.1 Results for rffective Interfacial Area 144 5.2.2 Results for Liquid Phase Mass Transfer 159
5.2.2.1 Evaluation of Volumetrie Liquid- 160 Phase Mass Transfer Coefficients
5.2.2.2 Correlation and Discussion of 161 kLa Data
5.2.3 Conclusion
VI. SUMMARY AND CONTRIBUTION OF KNOWLEDGE
SUGGESTIONS FOR FUTURE WORK
181
183
189
190
199
llST OF REFERENCES
AUTHOR INDEX
APPENDICES
APPENDIX 1. Experimental Data and Calculated A-l Results
1.1 Axial Dispersion Data 1.2 Interfacial Area Data 1.3 Mass Transfer Data
APPENDIX Il. Computer programs
Il.1 Smoothing of the Experimental Data
Il.2 Flow Diagram and Calculation of Liquid Mixing Results
Il.3 Calculation of Interfacial Areas of Mass Transfer
Il.4 Calculation of Physical Mass Transfer Coefficients
A-30
APPENDIX III. Specifications and Operating In- A-57 structions for Electronic In-struments
1 Il.1 Operating In~tructions for A-57 Ampl if ier-Demodulator
1 Il.2 Circuit Diagram for Amplifier- A-59 Demodulator
1 Il.3 Operating Instructions for Dymec A-61 Data Acquisition System
APPENDIX IV. Absorption of Carbon Dioxide A-63 and Evaluation of Physico-Chemical Data for Carbon Dioxide-Sodium Hydroxide System
vi
Figure 2.1
Figure 2.2
Figure 2.3
Figure 2.4
Figure 2.5
F i gu re 3. 1
Figure 4. 1
Figure 4.2
Figure 4.3
Figure 4.4
Figure 4.5
Figure 4.6
LIST OF ILLUSTRATIONS
Typical Concentration Profiles in the Liquid Film Near the Gas-Liquid Interface for a Reacting System
Mass Transfer with Second Order Chemical Reaction in the Liquid Phase
Material Balance Components of the Dispersion Model
Axial Dispersion Data for Liquids in Single Phase Flow in Random Beds of Spheres, e: = 0.4
Axial Dispersion Data for Liquid in Two-Phase Countercurrent Flow
Material Balance Over a Differentiai Section of Countercurrent Two-phase Flow System
vi i
19
20
24
30
32
51
Flow Diagram of the Experimental Set-Up 66
Photograph of L iquid Dtstributor 68
Typical Gas Flow Profiles in the Column 70
SKetchmatic Representation of the Tracer 72 Injection System
Photograph of Conductivity Monitoring 75 Cell (Lower) and Samplers (Upper).
Basic Electronic NetworK for Conductivity Measurements
76
Figure 4.7
Figure 4.8
Figure 4.9
Figure 4.10
Figure 5.1
Figure 5.2
Figure 5.3
Figure 5.4
Figure 5.5
Figure 5.6
Figure 5.7
Figure 5.8
Figure 5.9
Figure 5.10
Typical Breakthrough Curve
Variation of Pulse Response with Liquid Flow Rate for Fixed Bed Operation
Variation of Pulse Response with Gas Flow Rate for Mobile Bed Operation
Photograph of the Instrument Panel, Gas Analysis System and the Test Section
Variation of Minimum Fluidization Velocity with Liquid Flow Rate and Packing Size for Mob i le Bed Operat ion
Correlation of Minimum Fluidization Velocity for Mobile Bed Operation
Correlation of Bed Expansion of Mobile Bed Contactor
Comparison of the Literature Data on Bed Expansion of Mobile Bed Contactor and the Present Study
Liquid Holdup in Packed Beds
Liquid Holdup in Mobile Bed Contactors
Evaluation of Peclet Number Using Transfer Function Analysis
Correlation of Axial Mixing for Liquids in Trickle-Bed Operation Through Beds of Spheres
Generalized Correlation of Axial Mixing Data for Liquids in Trickle-Bed Operation
Variation of Liquid-Phase Peclet Number with Liquid Flow Rate and Packing size for Mob,le-Bed Contacting
vii i
Page
80
81
82
84
92
95
99
101
107
110
118
122
124
127
Figure 5.11
Figure 5.12
Figure 5.13
Figure 5.14
Figure 5.15
Figure 5.16
Figure 5.17
F i gu re 5. 18
Variation of the Ratio Pe/Pe with Stirring Number and packing 0 Size
Comparison of the Data on Axial Dispersion in Mobile-Bed Contacting
Variation of Effective Interfacial Area of Mass Transfer with Gas and Liquid Flow Rates in Mobile-Bed Contacting for 0.75-in. Diameter Packing
Correlation of Data on Effective Interfacial Area of Mass Transfer for Mobile-Bed Contacting
Variation of VOlumetric Mass Transfer coefficient, kLa, with Gas and Liquid Flow Rates in Mobile-Bed Contacting for 0.75-in. Diameter Packing
Correlation of Data on Volumetric Mass Transfer Coefficient for MobileBed Contacting
Variation Mass Transfer Coefficient, k L, with Gas and Liquid Flow Rates in
Mobile-Bed Contacting
Comparison of Experimental Values of Mass Transfer Coefficient, with calculated Values from Proposed Correlation
ix Page
131
139
146
150
163
168
173
176

x
LIST OF IA~LfS
TABLE 4. 1 Scope of Experiments
TABLE 5.1 Minimum Fluidization Velocity 91 for MBC
TABLE 5.2 Mass Transfer and Effective 154 Interfacial Area in a Spray Column
TABLE 5.3 Typical Mass Transfer Data for 165 Conventional Contactors
TABLE 5.4 Liquid Phase Mass Transfer in 166 Bubble rolumns
TABLE 5.5 Constants and Exponents in 169 Equation (5.22)
TABLE 5.6 Mass Transfer in Aerated Systems 179
a
A
[Bl
c
c*
c
d
o
F (s)
9
G
Ga
xi
LIST OF SYMBO LS
f 2 3
e fective interfacial area, cm. Icm.
2 3 specific surface area of the packing, cm. Icm.
wetted area of the packing, cm. 2 /cm. 3
cross sectional area of tower, sq.ft.
concentration of solute B in the bulk of 1 iquid, gm.mole/liter
concentration in the fluid phase, gm.mole/l iter
concentration of dissolved gas at the gas-l iquid i n ter fa ce, gm. mo 1 el 1 i ter
dimensionless concentration
diameter of packing particle (or characteristic dimens ion), inches
diameter of a sphere having the same volume as that of the part icle, 6vp/s p
column diameter, inches
diffusivity, also, effective dispersion coefficient, cm. 2 /hr.
transfer function
acceleration due to gravit y, 32.2 ft./sec. 2
~ravitational conversion fac~or, 32.2 (lb.mass)(ft)/(lb.force.sec. )
gas mass velocity, Ib./(hr.-ft. 2 )
d3gp2 Gallileo number, -- dimensionless
2 u
minimum fluiSization gas mass velocity, lb./(hr.-ft. )
h
L
m
M
n
dimensionless bed expansion for MBC
static bed height, ft.
Henry Law constant, gm.mole/liter-atmos. also, bed height, ft.
operating, static and total hOldup, ft. 3/ft. 3
xii
height of liquid phase transfer unit, k ~ ,ft. L PL
height of mixing unit, *, ft.
second-order reaction velocity constant, liter/(gm.mole.sec.)
volumetrie gas-phase m~ss transfer coefficient, gm.mole/(sec.-atm.-cm. )
liquid-film mass transfer coefficient in absence of chemical reaction, cm./sec.
liquid-film mass transfer coefficient ~ith chemical reaction, cm./sec., also cm./hr.
volumetric liquid-phase mass transfer coefficient, (Ib.mole/cu.ft.)/(hr.-Ib.mole/cu.ft.)
2 liquid mass velocity, lb./(hr.-ft. )
equilibrium constant, cL = mcG,also a constant
a variable
number of perfectly-mixed tanks-in-series, also a constant, dimensionless
H PG kLa number of gas-phase transfer units, G dimensionless
actual number of liquid phase transfer units, H P k a t L , dimensionless

P,Pe
r
R
Re
s
t
u
u
v
x
x
y
z
z
v
plug flow number of 1 iquid phase transfer units, dimensionless
xii i
liquid-phase Peclet number, Udp , dimensionless °l
Peclet number, ug , dimensionless
specific rate of ~onsumption of tracer, gm.mole/(sec.-cm. )
rate of gas absorption, gm.mole/sec., also resistance of the solution in the conductivity ce Il, ohms
Reynolds number, dl or ul dl , dimensionless u
G
specific rate of ~roduction of tracer, gm.mole/(sec.-cm. ), also Laplace variable
surface of particle, ft. 2
time, sec.
mean velocity, ft./sec.
superficial velocity, ft./sec.
volume of particle, ft. 3
volume of the contactor, ft. 3
distance, ft.
dimensionless distance, x/H, also abscissa
ordinate
stoichiometric ratio
reaction parameter,
of the Z c'-'0
A cBDS
react;on, dimensionless
, dimensionless
volumetric Flow rate, ft. 3 /sec.
cr
y
e
,.
u
p
x
(J
~~~~~!:l~~~
A,B
G
L
o
a constant k
L react ion factor, ,d imens ion Jess k O
L
exponent
void fraction, dimensionless
t ime, second
residence time, second
. t' . . U f 2/ klnema IC VISCOSlty, -, t. sec. p
viscosity, Jb./(ft.-hr.)
density, Jb./ft.
G - c: mf stirring number, , dimensionJess Gmf also a differential
specific rate of absorption function
surface age distribution function
surface tension, dynes/cm.
component A and B respectiveJy
gas phase
component l, also ith dimension
liquidphase
fixed bed condition
xiv
1. INTROOUCT ION
1.1 MOBILE-BEO CONTACTORS
A recently developed method of gas-l iquid contacting
involves countercurrent flow of these two phases through a bed
of low density packing which is kept in a state of violent motion
by the combined action of the gas and 1 iquid flow. Typically
the packing consists of plastic spheres of density about O.15-g/c.c.
1 1/2-inch orless in diameter. Hollow, molded p~lyethylene ,
or poJypropyJene spheres and foamed polystyrene balls have
been used. The vigorous movement of the packing has a strongly
beneficiaJ effect on the region in the vicinity of the gas
liquid interfaces which is so important in processes involving
interfacial transport. The ability of the bed to expand provides
an additional advantage over contactors with fixed beds in that
much higher gas and Jiquid mass velocities may be used. In
comparison with conventional columns with fixed beds of packing
it is therefore possible in mobile-bed contacting to obtain higher
rates of gas absorption and heat transfer in columns of signi
ficantJy smaller diameter. A practical feature of great utility
is the self-cJeaning feature of mobile-beds when used with gases
or 1 iquidS which contain materials that deposit on the packing
of fixed-bed contactors.
As a new technique, this type of operation has been
described by a variety of names. The technique is Known in-
dustrially primariJy under two trade names, Turbulent Contact
Absorbers (TCA) or F loat ing-Bed Wet Scrubbers (14é-7).
2
Although Douglas and co-workers have referred to the process
in the past as "turbulent-bed contacting", or "three-phase
fluidization", the generic term "mobile-bed contacting" has now
been adopted as the most generally descriptive name (25,29,115,149\.
For convenience the designation MBC will therefore be used in
this thesis.
The new technique was invented by Kielback (l46,148)
who had been concerned with a specifie gas-l iquid contacting
problem at the smelter of the Aluminum Company of Canada at
Arvida, Quebec. During the production of aluminum by the
electrolysis of alumina dissolved in cryolite and other
fluor ides, a hot tarry mist is evolved which contains hydrogen
fluoride, carbon dioxide and particulate matter. Conventionally,
the gas was treated in a large grid-packed tower which required
frequent and expensive maintenance because of fouling by the
particulate matter. This problem provided the stimulation for
the solution conceived by Kielback of using a bed packed with
low density spheres which would be kept free of foui ing by
the self-cleaning action of the motion of the balls. The use
of low density spherical packir.g gave a low pressure drop, which
is one of the main limitations in most scrubbing applications.
Further development and appl ication to other chemical process
problems was carried out by a group at Howard Smith Paper Co.,
Cornwall, Ontario. Douglas et al. (147) reported a modification
to Kielback's version of the contactor for use in the pulp and
paper industry for the carbonation of treated sulphite J iquor
3
in the production of vanillin, and in the preparation of
various pulping 1 iquors: sodafite, semi-chemical 1 iquor,
and the 1 iquor for the new Magnefite process.
A number of workers (25,28-9,146-52) have publ ished
prel iminary data which are helpful in the design of MBC for
industria1 appl ications. The 1 imited design procedures
availab1e are based primari1y on the"operating experience
of units already insta11ed. While a good record of industria 1
appl ications has been achieved, the avai1abil ity of a general
ca1cu1ation mode1 would make it possible to design with
greater confidence and economy for new appl ications, and to
optimize design procedures and operating conditions.
As the majority of gas-1 iquid contacting operations
are conducted for the purpose of effecting mass transfer be
tween the fluid phases, and as the only mass transfer studies
pub1ished for MBC are of an extremely 1 imited nature (147,149),
a thorough investigation of mass transfer in MBC was needed.
Mass transfer, or any interfacial transfer operation, is
affected rather sensitively by the conditions of axial mixing
in the contacting vessel. Unfortunately, most published mass
transfer studies do not properly account for the effect of mixing
on mass transfer. Published transfer coefficients therefore fre
quently are strong1y affected by the extent of axial mlxlng ln
the experimental equipment used. ln order that this error
4
be avoided in the present study, an extensive study of axial
mixing was carried out in the same equipment as used for
the mass transfer study.
Along with the mass transfer study, the interfacial
area in MBC was also determined. Knowledge of the effect of
processing conditions on this variable is in itself valuable,
and in addition the determination of interfacial area made
it possible to obtain and examine an area-based mass transfer
coefficient rather than the volumetric-based coefficient which
is more commonly available.
The need to have sorne information on the hydrodynamics
of MBC in order to carry out a sound mass transfer investigation
leadsto extending the determination of physical characteristics
to include studies of bed expansion, minimum fluidization
velocity, and 1 iquid holdup.
These, then, were the specifie features of a
study which was oriented to providing the basis of a more
efficient and reliable method of design of industrial mobile
bed contactors.
Il. llTERATURE SURVEY
This chapter contains a brief survey of the
publ ished 1 iterature relevant to this thesis.
2.1 llQUIO HOlOUP
5
liquid holdup is one of the basic liquid-side de
pendent variables in the operation of fixed- and mobile-bed
contactors. The importance of hoJdup in the mass transfer
process is demonstrated by the number of attempts made to
correlate and explain data on the basis of 1 iquid holdup ( 1-10).
Holdup has been shawn to have a direct influence on Jiquid
phase mass transfer (6-9), on loading behaviour (7) and on
the gas-phase pressure gradient (7).
2.1.1 liguid HoJdup in Packed Beds
The two types of procedures by which holdup in packed
beds has been measured may be designated as:
di~ect method (2,9-18)
indirect method (6,22-27)
Using the direct method, early workers identified
two components of total holdup, i.e. operating and static
holdup. In the more recent indirect method, the amount of
1 iquid retained is obtained by tracer techniques with transient
response, a method which gives total holdup under actual
6
operating conditions with the advantage of not requiring
interruption of the flow.
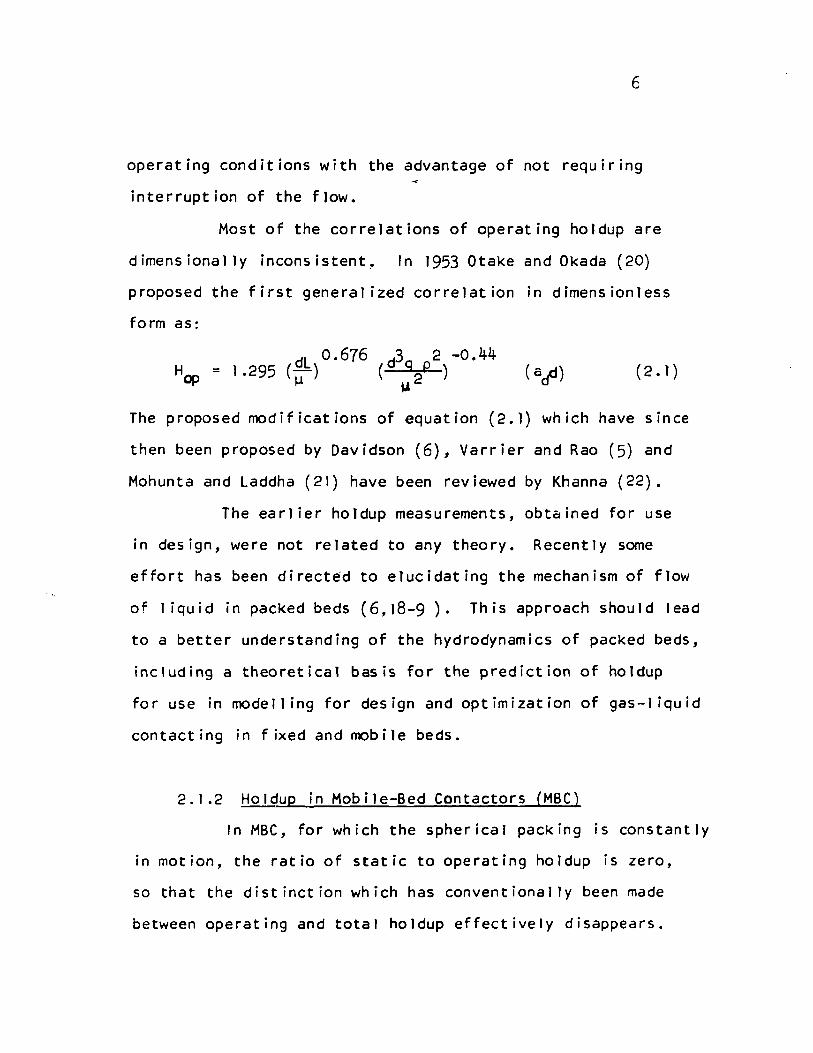
Most of the correlations of operating holdup are
dimensionally inconsistent,. In 19530take andOkada (20)
proposed the first general ized correlation in dimensionless
form as:
= 1.295 (dL)0.676 (d3g p2)-0.44 H~ ~ ~2 (2. 1)
The proposed modifications of equation (2.1) which have since
then been proposed by Davidson (6), Varrier and Rao (5) and
Mohunta and Laddha (21) have been reviewed by Khanna (22).
The earlier holdup measurements, obtdined for use
in design, were not related to any theory. Recently sorne
effort has been direct~d to elucidating the mechanism of flow
of 1 iquid in packed beds (6,18-9). This approach should lead
to a better understanding of the hydrodynamics of packed beds,
including a theoretical basis for the prediction of holdup
for use in modelling for design and optimization of gas-I iquid
contacting in fixed and mobile beds.
2.1.2 Holdup in Mobile-Bed Contactors (MBC)
ln MBC, for which the spherical packing is constantly
in motion, the ratio of static to operating holdup is zero,
so that the distinction which has conventionally been made
between operating and total holdup effectively disappears.
7
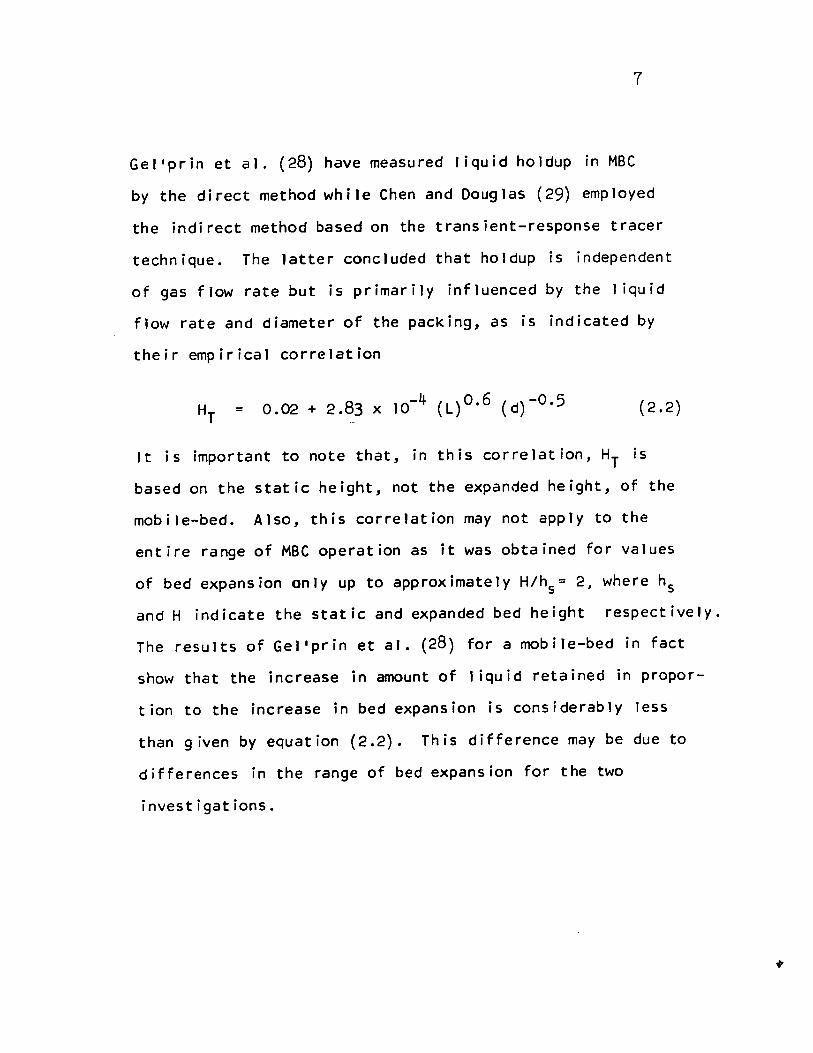
Gel 'prin et al. (28) have measured liquid holdup in MBC
by the direct method while Chen and Douglas (29) employed
the indirect method based on the transient-response tracer
technique. The latter concluded that holdup is independent
of gas flow rate but is primarily influenced by the 1 iquid
flow rate and diameter of the packing, as is indicated by
their empirical correlation
= 0.02 + 2.83 x 10⁻⁴ (L)O.6 (d)-0.5 (2.2)
It is important to note that, in this correlation, HT is
based on the static height, not the expanded height, of the
mobile-bed. AIso, this correlation may not apply to the
entire range of MBC operation as it was obtained for values
of bed expansion only up to approximately H/hs = 2, where hs
and H indicate the static and expanded bed height respectively.
The results of Gel'prin et al. (28) for a mobile-bed in fact
show that the increase in amount of liquid retained in propor
tion to the increase in bed expansion is considerably Jess
than given by equation (2.2). This difference may be due to
differences in the range of bed expansion for the two
investigations.
8
2.2 INTERFACIAL AREA
Although earl ier work concerning mass transfer in
gas-I iquid contactors involved the use of volumetric-based
transfer coefficients, the trend to put mass transfer on a
more theoretical foundation has brought the need to separate
the interfacial area term from the more basic area-based
transfer coefficient. As it is this approach which has been
used in this thesis, the li·terature on interfacial area
will now be reviewed briefly.
2.2.1 Drv, Wet and Effective Interfacial Area
For packed beds various workers (10,30-46) have
estimated the wetted area per unit volume, a , and the w
effective interfacial area for ~ass transfer per unit volume,
a. The relationship between these values and ad' the surface
area of the dry packing, is in general
a ( aw ( ad
The difference between a and a der ives from the fact that the w
1 iquid associated with sorne of the wetted area remains nearly
saturated and thus effectively unavailable for absorption. This
difference has been reported to be greater for the case of
small rings. Davidson (6) has suggested that this effect i5
due to the retention of a comparatively large volume of
relat ively stagnant 1 i~uid between the rings by surface ten-
9
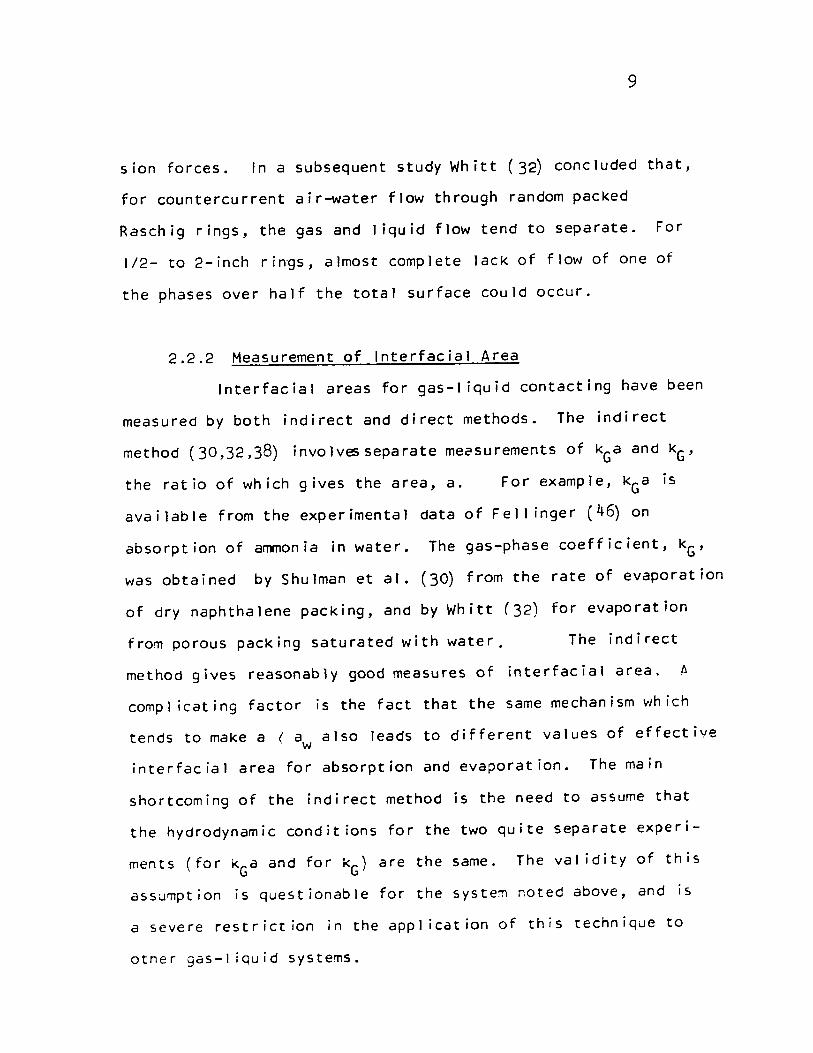
sion forces. In a subsequent study Whitt (32) concluded that,
for countercurrent air~ater flow through random packed
Raschig rings, the gas and 1 iquid flow tend to separate. For
1/2- to 2-inch rings, almost complete lack of flow of one of
the phases over half the total surface could occur.
2.2.2 Measurement of Interfacial Area
Interfacial areas for gas-l iquid contacting have been
measured by both indirect and direct methods. The indirect
method (30,32,38) involv~separate measurements of kGa and kG'
the ratio of which gives the area, a. For example, kGa is
available from the experimental data of FeIl inger (46) on
absorption of ammonia in water. The gas-phase coefficient, kG'
was obtained by Shulman et al. (30) from the rate of evaporation
of dry naphthalene packing, and by Whitt (32) for evaporation
from porous packing saturated with water. The indirect
method gives reasonably good measures of interfacial area. A
compl icating factor is the fact that the same mechanism which
tends to make a (a also leads to different values of effective w
interfacial area for absorption and evaporation. The main
shortcoming of the indirect method is the need to assume that
the hydrodynamic condit ions for the two quite separate experi-
ments (for kGa and for kG) are the same. The val idity of this
assü~ption is questionable for the system noted above, and is
a severe restrict ion in the appl ication of this technique to
otner gas-I iquid systems.
10
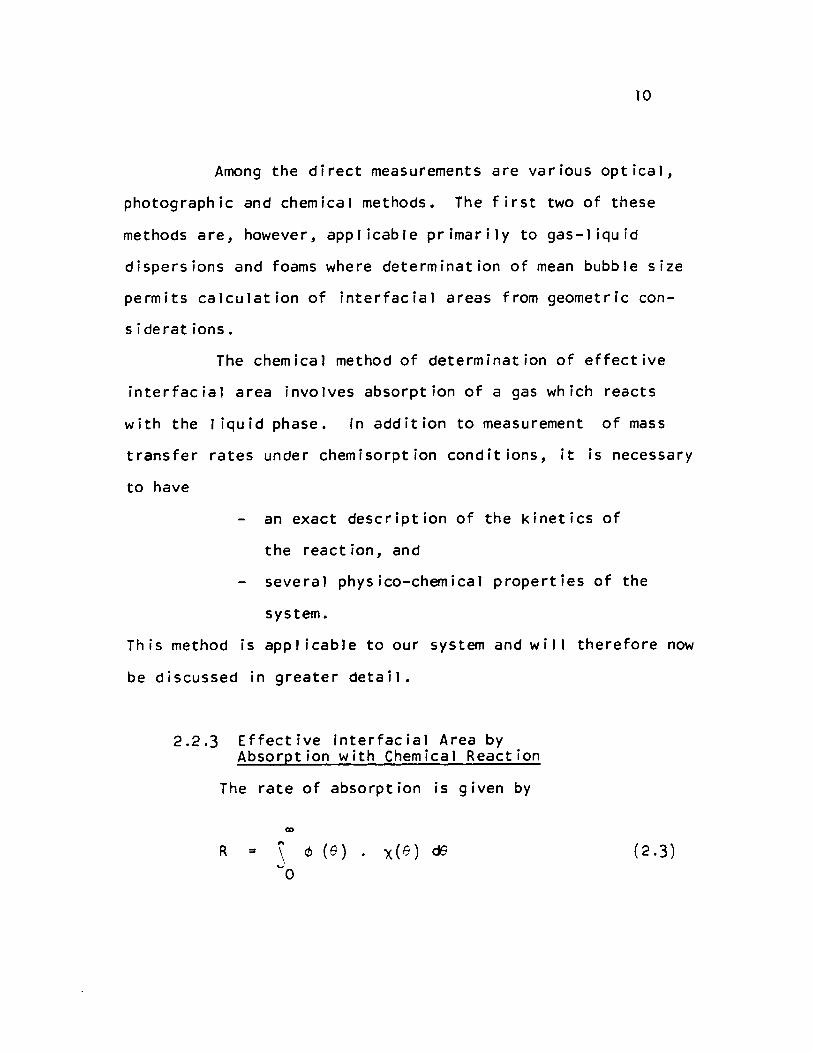
Among the direct measurements are various optical,
photographie and chemical methods. The first two of these
methods are, however, applicable primarily to gas-liquid
dispersions and foams where determination of mean bubble size
permits calculation of interfacial areas from geometric con
siderations.
The chemical method of determination of effective
interfacial area involves absorption of agas which reacts
with the 1 iquid phase. In addition to measurement of mass
transfer rates under chemisorption conditions, it is necessary
to have
an exact description of the kinetics of
the reaction, and
several physico-chemical properties of the
system.
This method is appl icable to our system and will therefore now
be discussed in greater detail.
2.2.3 Effective Interfacial Area by Absorption with Chemical Reaction
The rate of absorption is given by
CD
R ::: ,. \. r!> (6) . X(9) d9 '"'0
(2.3)

1 1
where 1>(e) is the surface-age distribution function and
l(e) is the rate of absorption per unit area at any instant
e. The function 1> depends on the physical properties and
hydrodynamics of the system. The function X will take
different forms according to the behaviour of the liquid
and gas. It is in fa ct estimated from the solution of
appropriate partial differential diffusion equations with
the required boundary conditions. However, Danckwerts (47)
has shown that this laborious process is not always necessary.
Both Higbie (48) and DanckWerts (49) have made
postulates about the nature of the function 1>. Higbie's
assumption of a constant exposure time is improbable unless
the physical nature of the contacting apparatus imposes this
constraint on the system. In Danckwerts surface-renewal mOdel,
1>, represents the fraction of fluid elements that remain at a
phase interface for a period of time e, and the displacement
of fluid elements From the interface is assumed to be com-
pletely random. This gives
1>( e ) -se = s e (2.4)
and co
R = \ 1>( e ) . ~(8) de ·~O
co -se = 5 \ e x(e) d3 '.
(2.5) ~'O
J2
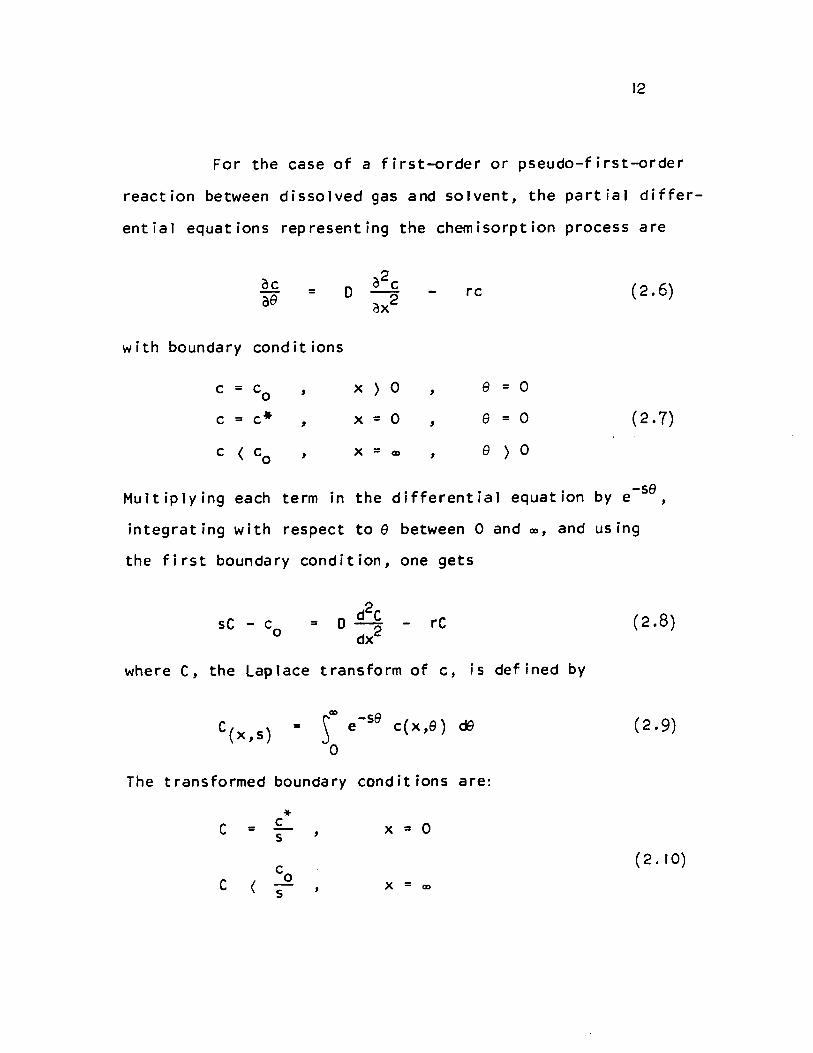
For the case of a first-order or pseudo-first-order
reaction between dissolved gas and solvent, the partial differ
ential equations representing the chemisorption process are
oc = D a2c rc ae ax2 (2.6)
w ith boundary conditions
c = Co , x ) 0 e = 0 , c = c* x = 0 e = 0 , , (2.7)
c < Co , x = CD , e ) 0
Multiplying each term in the differential equation bye-se,
integrating with respect to e between 0 and CD, and using
the first boundary condition, one gets
sC - c o
where C, the Laplace
C(x,s) ..
= rC
transform of c,
SCD e -58 c (x ,8 )
0
The transformed boundary conditions
* C .. c .. 0 s , x
Co C ( x = CD
S
(2.8)
i 5 defined by
d3 (2.9)
are:
(2. 10)
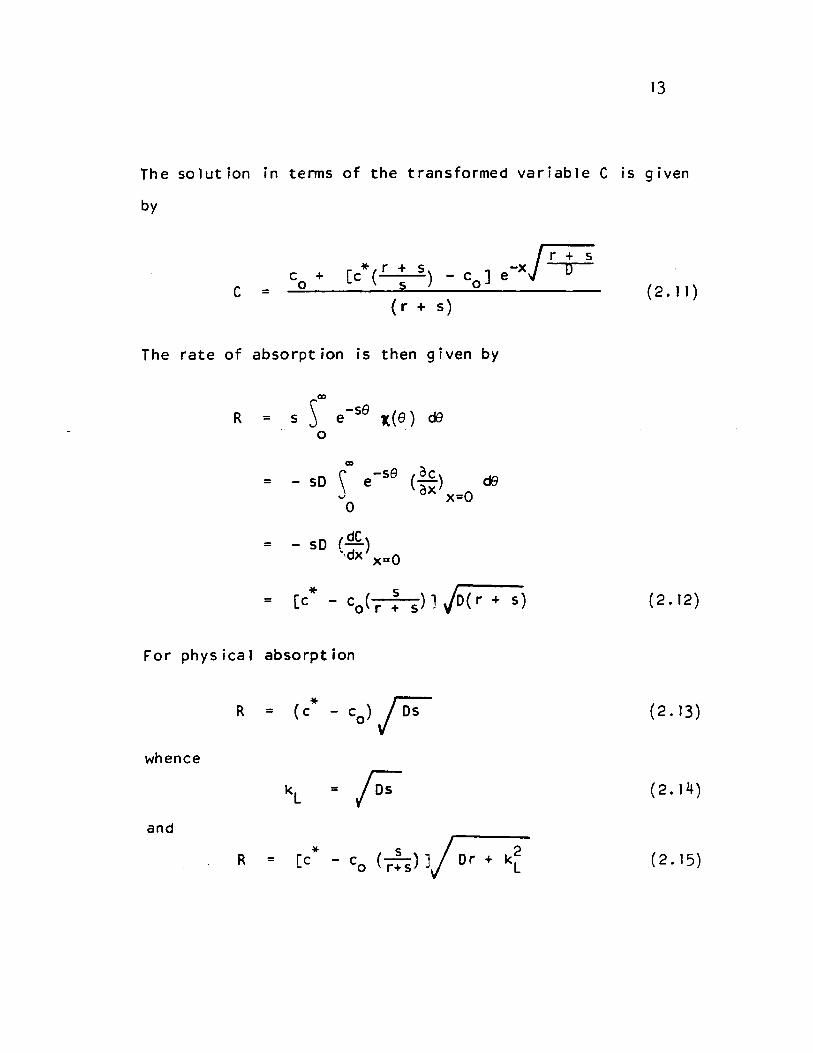
13
The solution in tenns of the transformed variable C is given
by
F+i c + [c*"(r: s) - c ] -x 0 e C 0 0 (2.11) =
(r + s)
The rate of absorption is then given by
R s Sm -se l(e) de = e 0
Q)
- sO S -se (~) de = e ox x=O
0
= - sO ( dC) ,dx x=o
*" - co( r
s 5) J jo( r + s) (2.12) = [c +
For physical absorption
* Co)p R = (c - (2.13)
whence
kL
= F (2.14)
and
* (r!sl li Dr k2 R = Cc - c + (2.15) 0 L
14
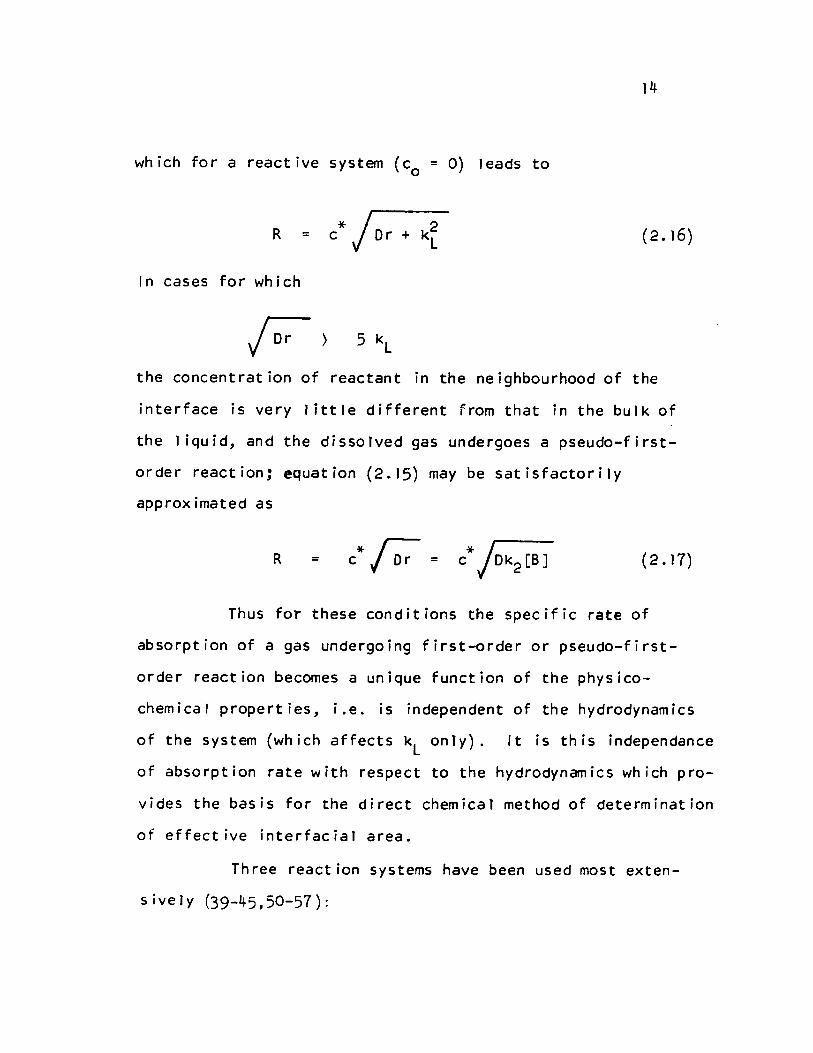
which for a reactive system (co = 0) 1 eads to
c* j Or + R = k2 (2.16) L
ln cases for which
F ) 5 k L
the concentration of reactant in the neighbourhood of the
interface is very 1ittle different From that in the bulk of
the 1 iquid, and the dissolved gas undergoes a pseudo-first
order reaction; equation (2.15) may be satisfactorily
approximated as
R = (2.17)
Thus for these conditions the specifie rate of
absorption of agas undergoing first-order or pseudo-first
order reaction becomes a unique function of the physico
chemical properties, i.e. is independent of the hydrodynamics
of the system (which affects kL
on1y). It is this independance
of absorption rate with respect to the hydrodynamics which pro
vides the basis for the direct chemica1 method of determination
of effective interfacial area.
Three reaction systems have been used most exten-
s ive 1 y (39-45,50-57):
- .. carbon dioxide-carbonate bicarbonate
buffer solution
oxygen-sodium sulphite solution, and
carbon dioxide-sodium (or potassium)
hydroxide solution
15
Success in the determination of effective interfacial area
by this method depends entirely on the availabil ity of re
liable physico-chemical data. For example, the results of
de Waal et al. (~9-40) are probably .. in error because of the
uncertain kinetics of sodium sulphite oxidation (58).
2.2.4 Influence of Liguid Properties
The dependence of effective interfacial area on
fluid properties has not been studied. Sharma et al.
(42-3,57) have shown that, provided the liquid properties
such as viscosity, surface tensÎon and ionic strength are
kept nearly equal, the effective interfacial area as deter
mined by the direct, chemisorption method remains practically
independent of the nature of the reacting species and of
the kinetics of the reaction. Detailed quantitative investiga
tion of the influence of 1 iquid properties is however essential
before the interfacial area results presently available can be
fully utilized.
16
2.2.5 Interfacial Area in Mobile-Bed Contacting
ln addition to the measurements for fixed-bed packed
columns already noted, interfacial area has been evaluated
for many other types of gas-I iquid contacting devices - sieve
trays (52,55,56,59,60), bubble trays (52,54,61), stirred
tanks (40-1,62-5), bubble columns (57), cocurrent horizontal
and vertical flow (66), flow through hel ical coils (66), aerated
mixing vessels (67-8), and spray columns (69). However, no mea
surements of interfacial area haveyet been reported for the
important new technique, mobile-bed contacting.
2.3 LIQUID-PHASE MASS TRANSFER IN PACKED BEDS
Having considered interfacial area as a separate
variable, it is now appropr iate to review the developments
concerning area-based mass transfer coefficients.
2.3.1 Experimental Studies
The basic correlation for volumetrie liquid-phase
mass transfer coefficients in a packed column has been the one
derived by Sherwood and Holloway from their measurements of
rates of desorption of oxygen, carbon dioxide and hydrogen
from water (70):
= 1 a.
(2.18)
17
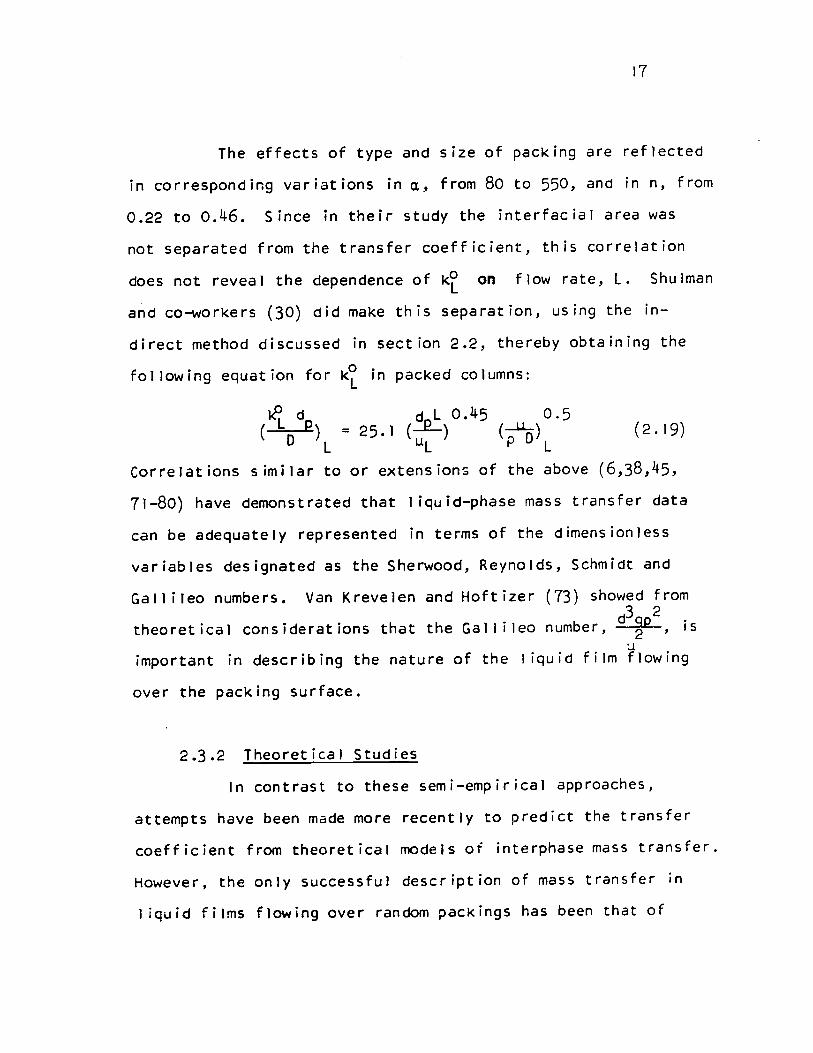
The effects of type and size of packing are reflected
in corresponding variations in a, from 80 to 550, and in n, from
0.22 to 0.46. Since in their study the interfacial area was
not separated from the transfer coefficient, this correlation
does not reveal the dependence of kE on flow rate, L. Shulman
and co-workers (30) did make this separation, using the in
direct method discussed in section 2.2, thereby obtaining the
following equation for k~ in packed columns:
.eL d dnL 0.45 0.5 ( p) = 25. 1 (~) (~)
o L uL P D L (2. 19)
Correlations similar to or extensions of the above (6,38,45,
71-80) have demonstrated that 1 iquid-phase mass transfer data
can be adequately represented in terms of the dimensionless
variables designated as the Sherwood, Reynolds, Schmidt and
Gall ileo numbers. Van Krevelen and Hoftizer (73) showed From d3gp2 .
theoretical considerations that the Gallileo number, 2 ' IS
U important in describing the nature of the 1 iquid film flowing
over the packing surface.
2.3.2 Theoretical Studies
ln contrast to these semi-empirical approaches,
attempts have been made more recently to predict the transfer
coefficient from theoretical models of interphase mass transfer.
However, the only successful description of mass transfer in
1 iquid films flowing over random packings has been that of
18
Davidson (6), who predicted the mass transfer coefficient, ~,
from a theoretical analysis of a packed bed using the penetra
tion model of mass transfer. Agreement between experimental
data and his theory is quite good. By contrast, the recent
second-order stochastic model of Schmalzer and Hoelscher (82)
fails to explain mass transfer in packed beds.
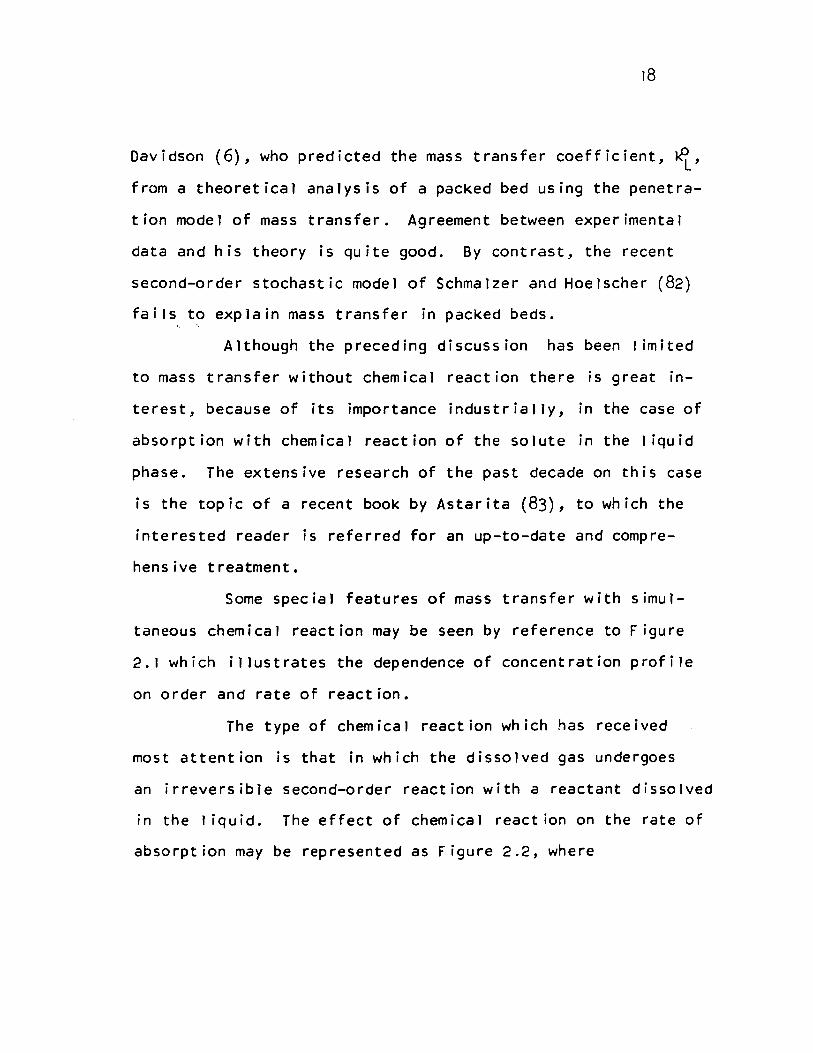
Although the preceding discussion has been 1 imited
to mass transfer without chemical reaction there is great in
te res t, because of i ts importance indus tri a' 1 y, in the case of
absorption with chemical reaction of the solute in the 1 iquid
phase. The extensive research of the past decade on this case
is the topic of a recent book by Astarita (83), to which the
interested reader is referred for an up-to-date and compre
hensive treatment.
Some special features of mass transfer with simul
taneous chemical reaction may be seen by reference to Figure
2.1 which illustrates the dependence of concentration profile
on order and rate of reaction.
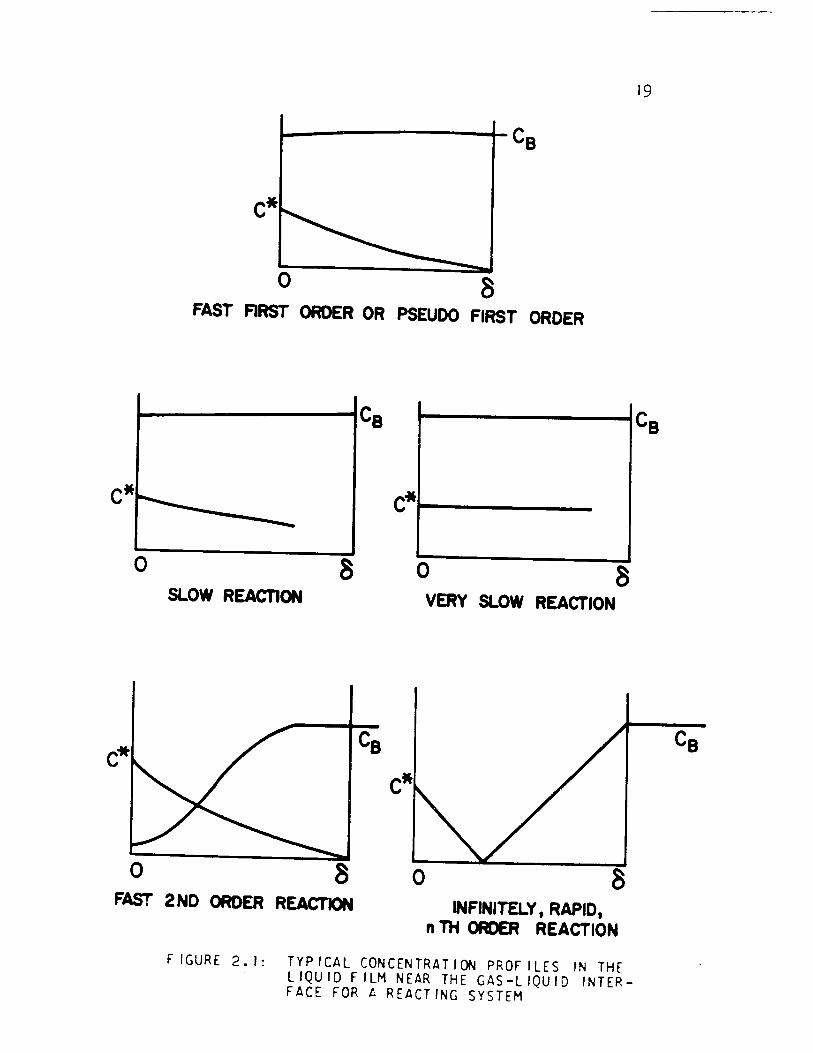
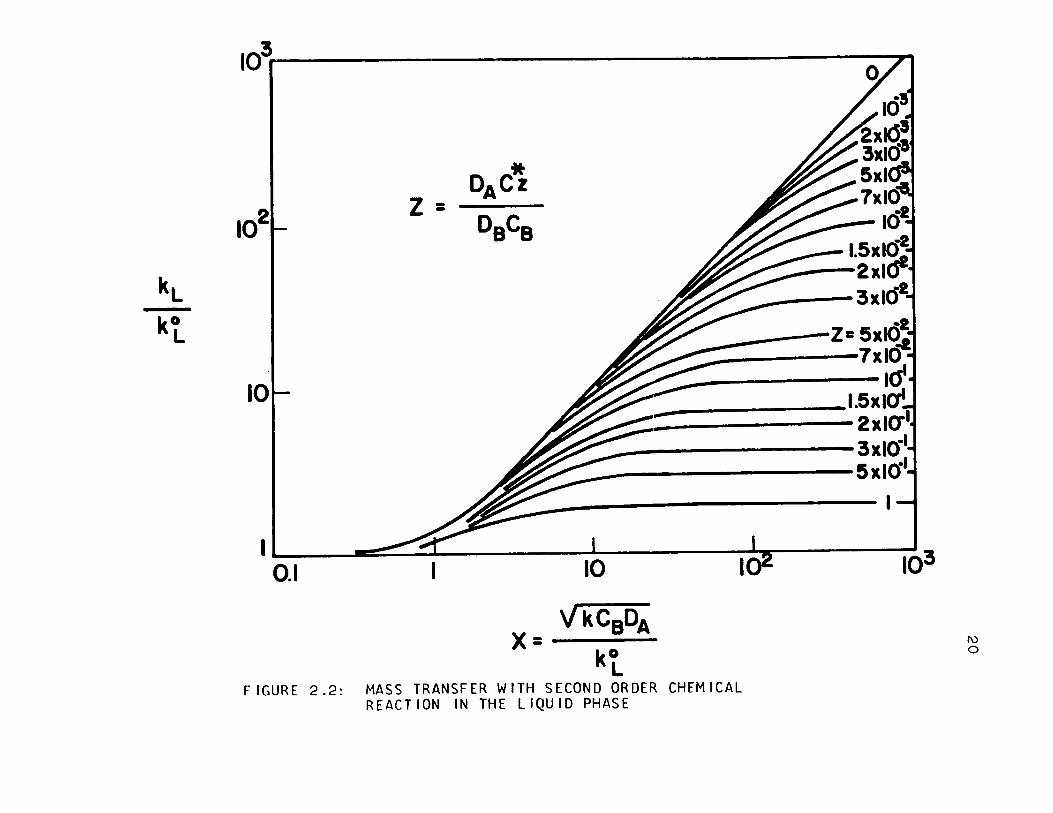
The type of chemical reaction which has received
most attention is that in which the dissolved gas undergoes
an irreversible second-order reaction with a reactant dissolved
in the 1 iquid. The effect of chemical react ion on the rate of
absorption may be represented as Figure 2.2, where
19
~------------~Ce
c*
o 8 FAST FlRST OROER OR PSEUDO FIRST OROER
~------------~CB Ce
C*~ C*~------------o 8 o 8
SLOW REACTION VERY SLOW REACTION
o 0 FAST 2 ND OROER REACTION INFINITELY t RAPID t
"TH OROER REACTION
FIGURE 2.1: TYPICAL CONCENTRATION PROFILES IN THE LIQUIO FILM NEAR THE GAS-LIQUIO INTERFACE FOR A REACTING SYSTEM
kL -kt
IO~------------------» •
102 z =
10
* DACz
DaCa
1 0.1 .........-= ==J 10 1Ô2 103
FIGURE 2.2:
VkCaDA X=----kO L
MASS TRANSFER WITH SECOND OROER CHEMICAL REACTION IN THE LIQUID PHASE
1\)
o
21
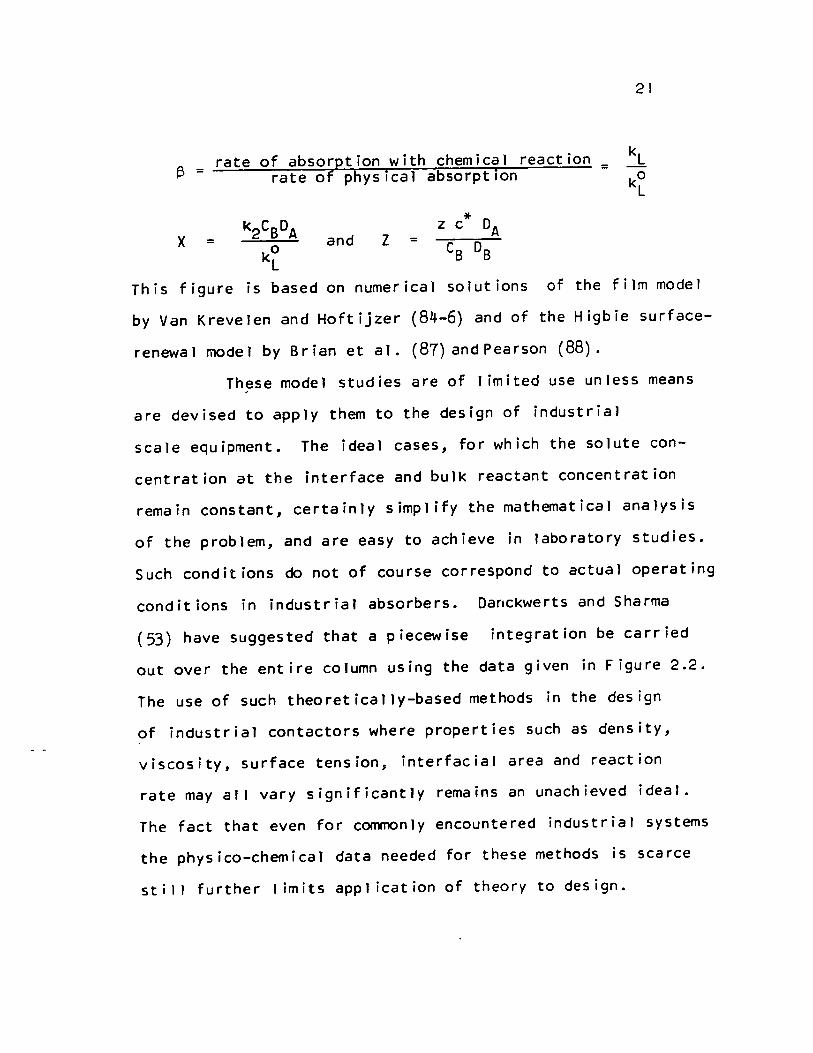
~ = rate of absorption with chemical reaction = kL rate of physical absorption kO
L
x = and z
This figure is based on numerical solutions of the film model
by Van KreveJen and Hoftijzer (84-6) and of the Higbie surface
renewal mode 1 by Brian et al. (87) and Pearson (88).
These modeJ studies are of limited use unless means
are devised to apply them to the design of industriaJ
scaJe equipment. The ideaJ cases, for which the solute con
centration at the interface and bulk reactant concentration
remain constant, certainly simpl if y the mathematical anaJysis
of the problem, and are easy to achieve in laboratory studies.
Such conditions do not of course correspond to actual operating
conditions in industrial absorbers. Danckwerts and Sharma
(53) have suggested that a piecewise integration be carried
out over the entire column using the data given in Figure 2.2.
The use of such theoreticaJly-based methods in the design
of industrial contactors where properties such as density,
viscosity, surface tension, interfacial area and reaction
rate may ail vary significantly remains an unachieved ideal.
The fact that even for commonly encountered industrial systems
the physico-chemicaJ data needed for these methods is scarce
still further 1 imits appl ication of theory to design.

22
2.4 RESIDENCE TIME DISTRIBUTION AND AXIAL MIXING
The distribution of ages of the various fluid elements
as they leave a process vessel is generally determined by the
transient response method, the spread of residence times re
flecting the phenomenon of axial mixing.
RTD does not, however, completely describe the flow.
It gives the ages of the different elements but tells nothing
about their history during flow through the vessel. An extensive
1 iterature has accumulated on liquid mixing in the case of
single phase flow through straight pipes, packed and fluidized
beds and for countercurrent gas-l iquid flow through packed beds.
Those aspects which are relevant to axial mixing of the 1 iquid
phase in mobile-bed contactors are now reviewed.
2.4.1 Characterization of Axial Dispersion Phenomena
A mathematical mode 1 must be constructed to describe
in seme simplified way the flow behaviour of the system. For
most real flow systems of interest, for example, a packed bed,
the flow behaviour is too complex to be described as it actually
is. The formulation of a model is therefore compl icated by con
fI icting requirements for
a realistic representation of the actual
flow behaviour, and
ease of mode 1 parameter evaluation and of use
of the model in engineering design.
23
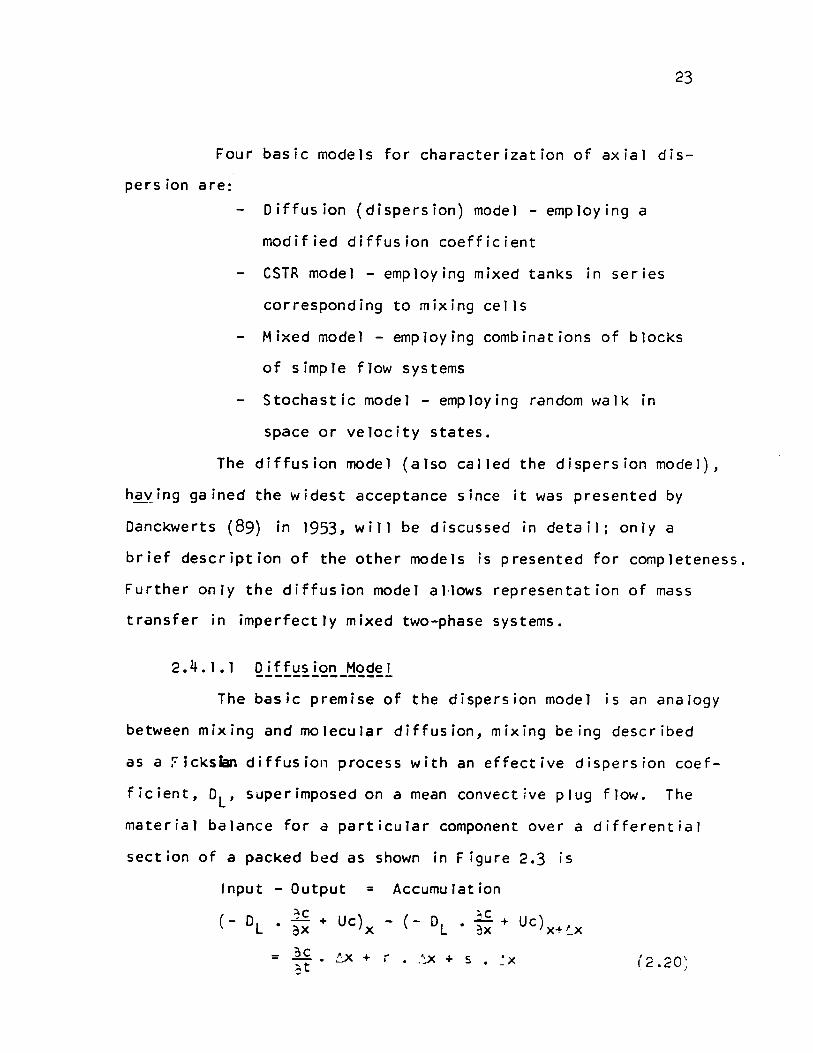
Four basic models for characterization of axial dis-
pers ion are:
Diffusion (dispersion) model - employing a
modified diffusion coefficient
CSTR model - employing mixed tanks in series
corresponding to mixing cells
Mixed model - employing combinat ions of blocks
of simple flow systems
Stochastic model - employing random walk in
space or velocity states.
The diffusion model (also called the dispersion model),
ha'{ing gained the widest acceptance since it was presented by
DanckWerts (89) in 1953, wi 11 be discussed in deta il; only a
brief description of the other models is presented for completeness.
Further only the diffusion model al·lows representation of mass
transfer in imperfectJy mixed two-phase systems.
2.4.1.1 Diffusion Model
The basic premise of the dispersion modeJ is an analogy
between mixing and molecular diffusion, mixing being described
as a ::ïcksian diffusion process with an effective dispersion coef
ficient, DL' superimposed on a mean convective plug flow. The
materiaJ balance for a particuJar component over a differential
section of a packed bed as shown in Figure 2.3 is
Input - Output = Accumulation
(- DL ~c + UC)x - (- DL .if + Uc) x+ ~x ox . jx
= oC ~x + r .':.X + 5 ~x - . . . ?:t '" "0' Ie:.e: )
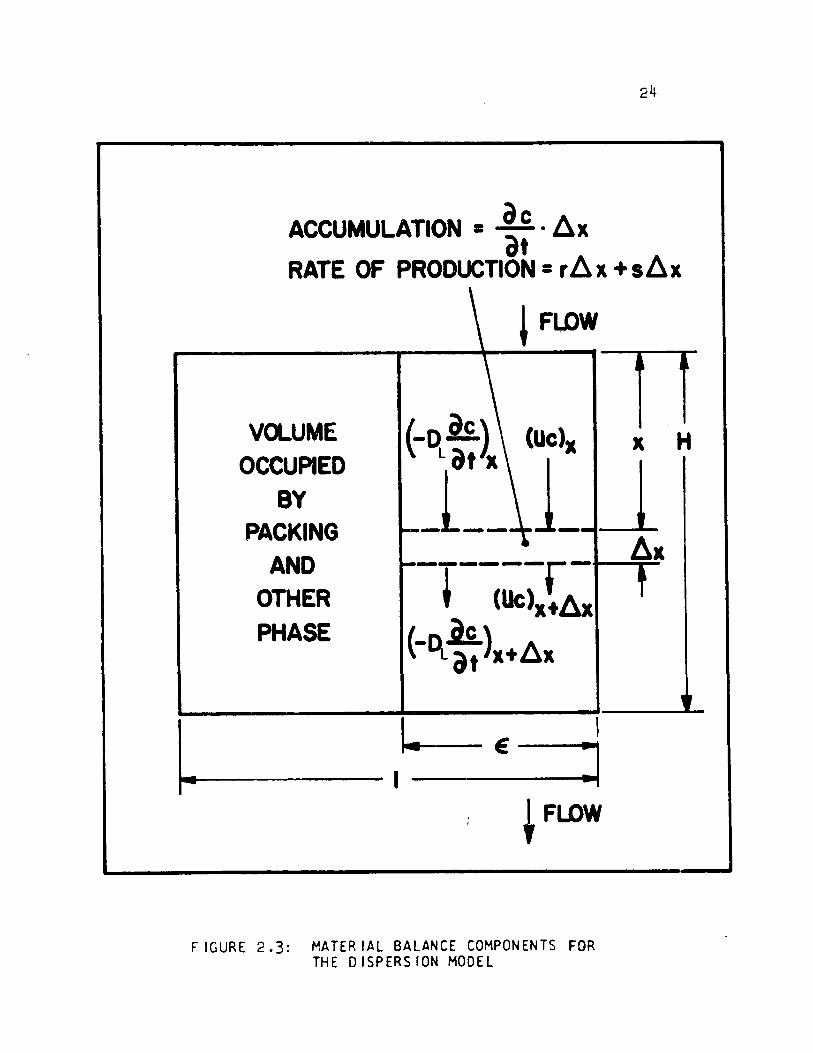
24
ACCUMULATION· i~' 8x RATE OF PRODUCTION = r~x +s~x
VeLUME OCCUPIED
BY PACKING
AND OTHER PHASE
~FLDW
FIGURE 2.3: MATERIAl BALANCE COMPONENTS FOR THE DISPERSION MODEl
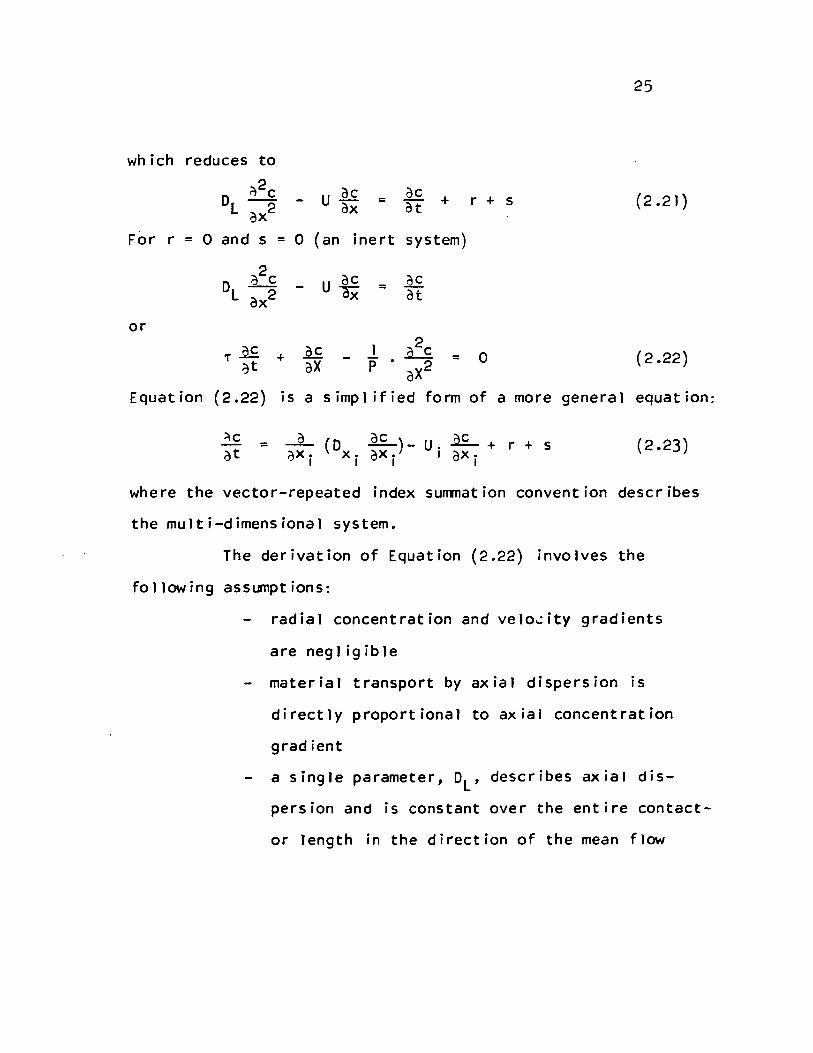
25
which reduces to
,,2c U~ ac Dl 2 = TI + r + s
ax ax (2.21 )
For r = 0 and s = 0 (an inert system)
a2c U ac (jC Dl2 = at ox 1";(
or
,..2.f. + ~ 1 Q2C = 0 - p :,t aX • 2
aX (2.22)
Equation (2.22) is a simp1 ified form of a more general equation:
~c
at = a~. (Dx. ~~.)- Ui ~~. + r + s 1 1 1 1
(2.23)
where the vector-repeated index summation convention describes
the multi-dimensiona1 system.
The derivation of Equation (2.22) involves the
fo 1 low ing assumpt ions:
radial concentration and velo~ity gradients
are neg 1 i 9 i b 1 e
material transport by axial dispersion is
directly proportional to axial concentration
gradient
a single parameter, DL' describes axial dis
persion and is constant over the entire contact-
or length in the direction of the mean flow
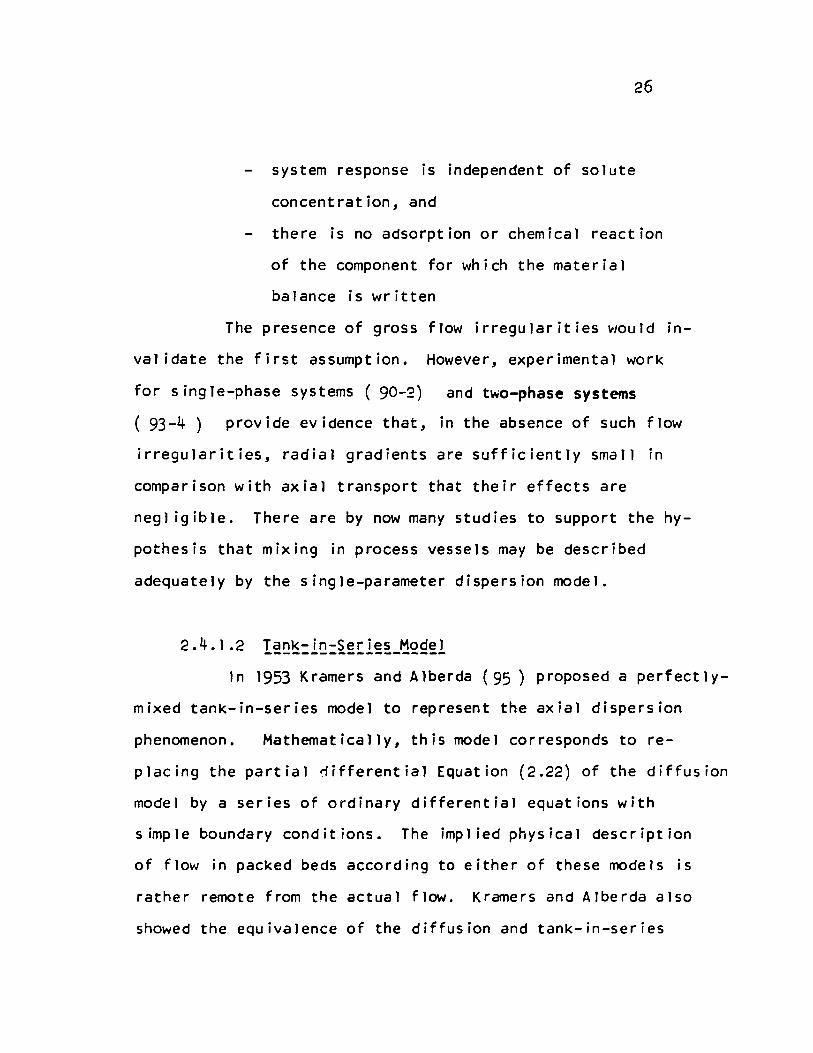
26
system response is independent of solute
concentration, and
there is no adsorption or chemical reaction
of the component for which the material
balance is written
The presence of gross flow irregularities would in
val idate the first assumption. However, experimental work
for single-phase systems (90-2) and two-phase systems
( 93-4) provide evidence that, in the absence of such flow
irregularities, radial gradients are sufficiently small in
comparison with axial transport that their effects are
negl igible. There are by now many studies to support the hy
pothesis that mixing in process vessels may be described
adequately by the single-parameter dispersion model.
2.4.1.2 Tank-in-Series Model --------------------ln 1953 Kramers and Alberda (95) proposed a perfectly-
mixed tank-in-series mode 1 to represent the axial dispersion
phenomenon. Mathematically, this model corresponds to re-
placing the partial ~ifferential Equation (2.22) of the diffusion
mode 1 by a series of ordinary differential equations with
simple boundary conditions. The implied physical description
of flow in packed beds according to either of these models is
rather remote from the actual flow. Kramers and Alberda also
showed the equivalence of the diffusion and tank-in-series
models as:
UH DL
=
27
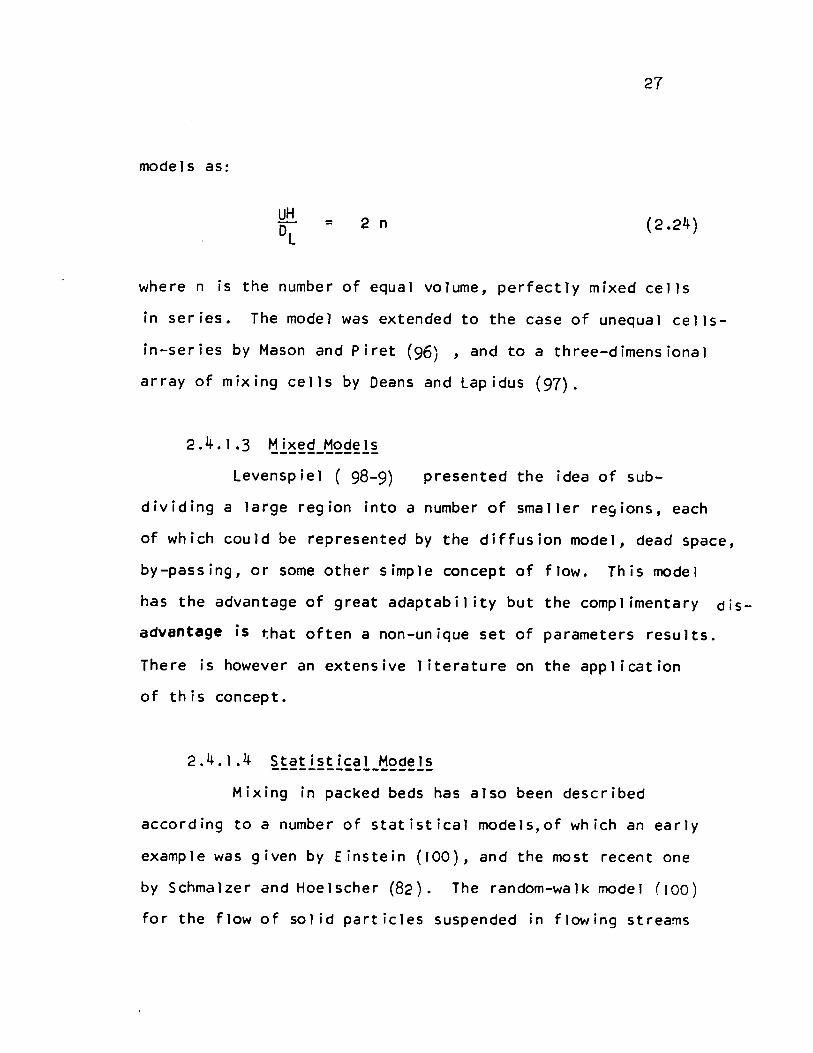
2 n (2.24 )
where n is the number of equal volume, perfectly mixed cells
in series. The model was extended to the case of unequal cells
in-ser ies by Mason and P iret (96) , and to a three-dimens ional
array of mixing cells by Deans and Lapidus (97).
2.4.1.3 Mixed Models ------------Levenspiel ( 98-9) presented the idea of sub-
dividing a large region into a number of smaller re9ions, each
of which could be represented by the diffusion model, dead space,
by-passing, or some other simple concept of flow. This mode 1
has the advantage of great adaptabil ity but the complimentary dis
advantage is ~hat often a non-unique set of parameters results.
There is however an extensive literature on the application
of this concept.
2.4.1.4 ~~~~i~~i~~!_~Q~~!~
Mixing in packed beds has also been described
according to a number of statistical models,of which an early
example was given by Einstein (100), and the most recent one
by Schmalzer and Hoelscher (82). The random-walk mode) (100)
for the flow of sol id part icles suspended in flo...lÎng streams
28
was extended by Jacques and Vermeulen ( 101-2 ) and Cairns
and Prausnitz (92). This model, as weIl as the one based
on mixing-cells, approach the simple diffusion~odel at high
flow rates.
The recent study of Schmalzer and Hoelscher (82)
described a second-order stochastic model for a packed bed.
They considered fluid packets to change velocity states
according to a given set of transition probabil lties. The
multi-parameter nature of this model makes it particularly
convenient to fit experimental mixing data.
2.4. 1.5 ~y~!~~~iQ~_Qf_~Q9~!_e~[~~~~[~
Considerable attention has been paid to the problem
of evaluation of the parameters of models from transient
response experiments. The parameters must be evaluated from
sorne modification of the solution to the mode 1 differential
equations. Methods of moments and slope at the mid-point of
the breakthrough curves are easy to apply but limited in
accuracy for systems with a high degree of mixing. Recent
developments (103-105) extended these concepts to yield
more accu rate estimates even with imperfect tracer inputs.
Lees (104) has proposed a simpler method of obtaining moments
of the impulse response of a complex mode 1 directly from its
transformed equations instead of the solution. However, these
quick methods of parameter estimation are still 1 imited to the
case of ;nfinite beds.
29
2.4.2 Axial Dispersion in Packed Beds
The case of single-phase flow of 1 iquid through
packed beds is now quite well documented, as is indicated
by the representation of these data on Figure 2.4 Although
not directly relevant to this thesis, it is at least of
interest to note that the data from ~ number of studies of
single-phase flow of gas through packed beds are also rea
sonably coherent. The remaining uncertainties primarily
concern the effect of particle size, shape and packing
arrangement.
By contrast, the present state of knowledge of
axial mixing for countercurrent two-phase flow through packed
beds is quite unsatisfactory. In large part, this
situation reflects the considerable increase in experimental
difficulty which is associated with carrying out transient
response studies on one phase in the presence of a counter
current flow of the other phase. For example, the choice of
a suitable tracer material and the problem of sampI ing one
phase From a two-phase Flow system both add to the experimental
difficulties. AIso, the methods of analysis of transient
response curves which have been available did not give very
rel iable estimates of the mixing parameter for RTD curves
w i th long te ils.

-.J
~ z
10~i ------------------------------------------------------------
HIBY( NaCI IN WATER) CAIRNS ET AL.
} ---~--EBACH ET AL. STRANG ET AL. ~ """.."....".
JACQUES ET AL. " ~ "."." \.
LILES ET AL ---.;--==-~...-- ...... _- ---------- ---., --- --------------------- CARBERRY ET AL.
MILLER ET AL. AVERAGE VALUE
0.1. 1 1 1 1 1
0.01 0.1 1.0 10 100 1000
NReL
FIGURE 2.4: AXIAL DISPERSION DATA FOR LIQUIDS IN SINGLE PHASE FLOW. IN RANDOM BEDS OF SPHERES, € - 0.4
LV o
31
There is considerable disagreement between the
results of the relatively few studies which have been reported
of axial dispersion for 1 iquid-phase Flow through packed beds.
The striking differences between the results of various in
vestigators are evident by reference to the representation
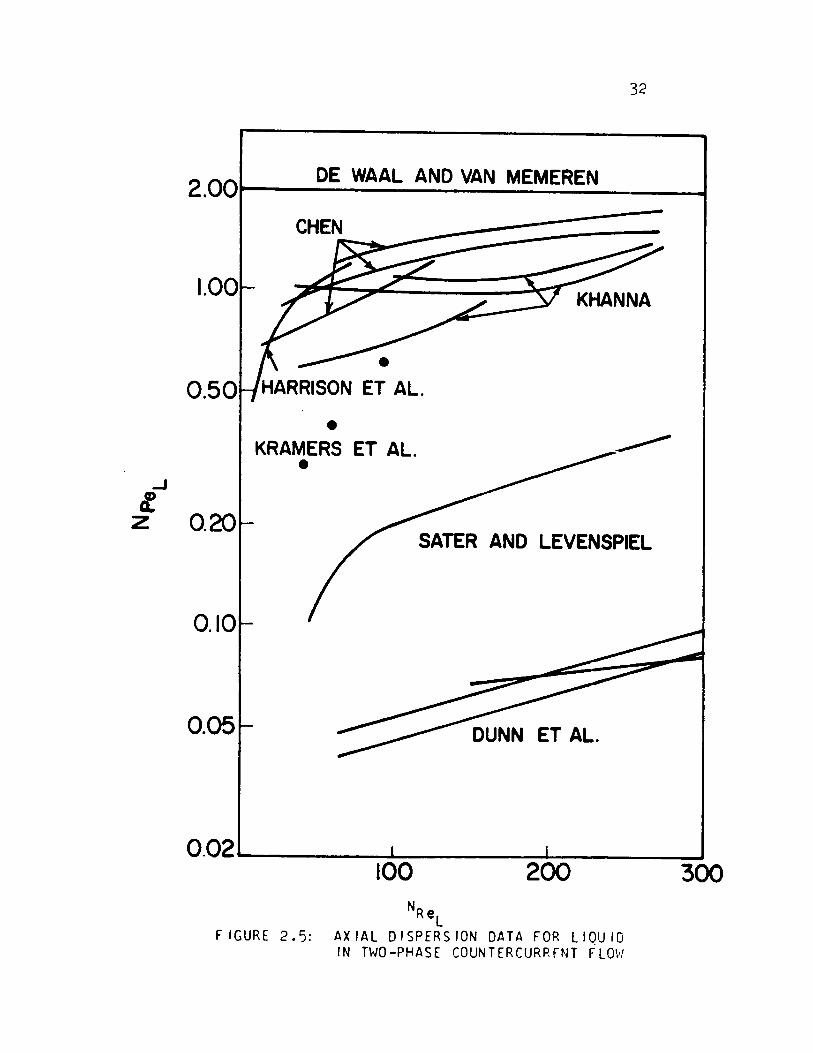
of these data given on Figure 2.5. The first of these studies,
that of Kramers and Alberda ( 95),reported the RTD in a 15-cm.
diameter column packed to a height of 66-cm. with 10 mm.
Raschig rings. The spread of experimental data for gas-phase
dispersion for two-phase Flow through packed beds is equally
as wide as that for the liquid phase, thus providing further
evidence of the difficulty of obtaining rel iable mixing data
for two-phase Flow systems. For the condition of zero gas
Flow (often referred to as a trickle-bed contactor), they
observed the packing Peclet number Ud/D L, to increase From 0.3
to 0.5 as liquid flow rate was increased over the range 3200
to 6900 lb./(hr.-sq.ft.).
ln 1958 Otake and Kunugita (16) correlated their
1 iquid-phase mixing data in term of the dimensionless variables,
Peclet, Reynolds and Gall ileo numbers. For Flow of water in a
laboratory column filled with 7.85- and 15.5~. Raschig rings
for the 1 iquid phase Reynolds number range of 70-100 and gas
flows From zero to 13 lb./(hr.-sq.ft.), the correlation
obtained was:
...J
l
32
DE WAAL AND VAN MEMEREN 2.00t-------------------I
1.00
CHEN
• KRAMERS ET AL .
•
z 0.20 SATER AND LEVENSPIEL
0.10
0.05
0.02'---___ ---'-____ ......L.-___ ----'
100 NRe l
200
FIGURE 2.5: AXIAL DISPERSION DATA FOR LIQUIO IN TWO-PHASE COUNTERCURRFNT FLOw
300

33
dU 0.5 ~ 2 -0.333 l .895 (-~) (ct'gp)
IJ L ~2 (2.25)
As the gas f10w rate was always below the 10ading point, it is
not surprising that they observed no effect of gas flow rate.
They conc1uded that essentially plug flow prevai1ed for long
beds, high mean liquid velocity and smal1 packing. Hoogendorn
and Lips (106) confirmad this for trickle columns of 1.33-ft.
diameter and 5- and 10-ft. height packed with 1/2-inch porce1ain
Raschig rings. These observations are in general agreement
with those~ Schiesser and Lapidus (24). Hofmann (108)
working with industrial size columns found the above equation
to be inapplicable, and Weber (109) referred to the experi
ments yielding much higher values for the dispersion coefficient
than those ca1cu1ated From the correlation.
ln 1962 Harrison et al. (110) carried out an
interesting test of the use of the diffusion model for mixing
in packed beds. They model1ed a packed bed as a continuous
vertical string of spheres and conc1uded that the simple
diffusion model does indeed provide a fairly good representa
tion of the axial dispersion of the 1iquid. Tail ing of the
breakthrough curves was attributed to transfer from regions
of 10w velocity or stagnation.
Stemerding (111) in 1961 reported dispersion mea
surements in a 10-ft. co1umn filled with 13 mm Raschig rings.
The dispersion coefficient was observed to be essentially con-
34
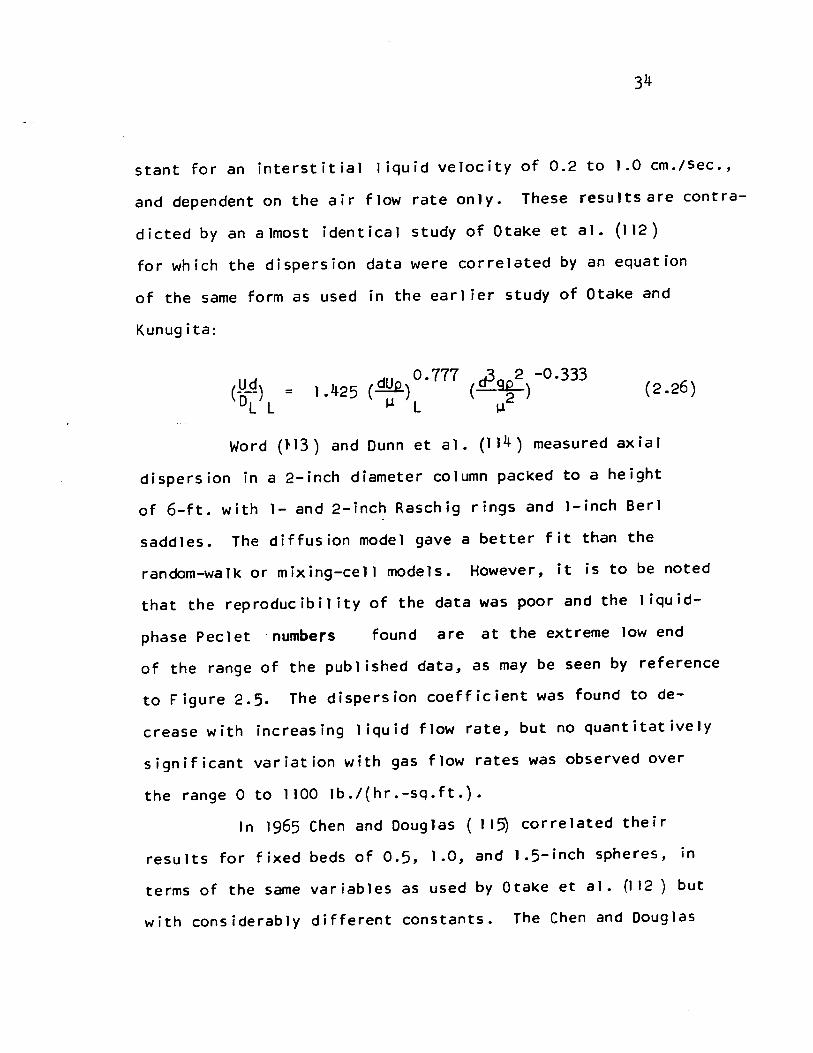
stant for an interstitial 1 iquid velocity of 0.2 to 1.0 cm./Sec.,
and dependent on the air flow rate only. These resultsare contra
dicted by an almost identical study of Dtake et al. (112)
for which the dispersion data were correlated by an equation
of the same form as used in the earl ier study of Dtake and
Kunugita:
= dU 0.777 d3 2 -0.333
1.425 (~) (-~) 1.1 L 1.12 (2.26)
Word (.13) and Dunn et al. (114) measured ax ial
dispersion in a 2-inch diameter column packed to a height
of 6-ft. with 1- and 2-inch Raschig rings and I-inch Berl
saddles. The diffusion model gave a better fit than the
random~alk or mixing-cell models. However, it is to be noted
that the reproducibility of the data was poor and the liquid-
phase Peclet 'numbers found are at the extreme low end
of the range of the published data, as may be seen by reference
to Figure 2.5. The dispersion coefficient was found to de
crease with increasing liquid flow rate, but no quantitatively
significant variation with gas flow rates was observed over
the range 0 to 1100 Ib./(hr.-sq.ft.).
ln 1965 Chen and Douglas (115) correlated their
results for fixed beds of 0.5,1.0, and 1.5-inch spheres, ln
terms of the same var iables as used by Dtake et al. (J 12 ) but
with considerably different constants. The Chen and Douglas
35
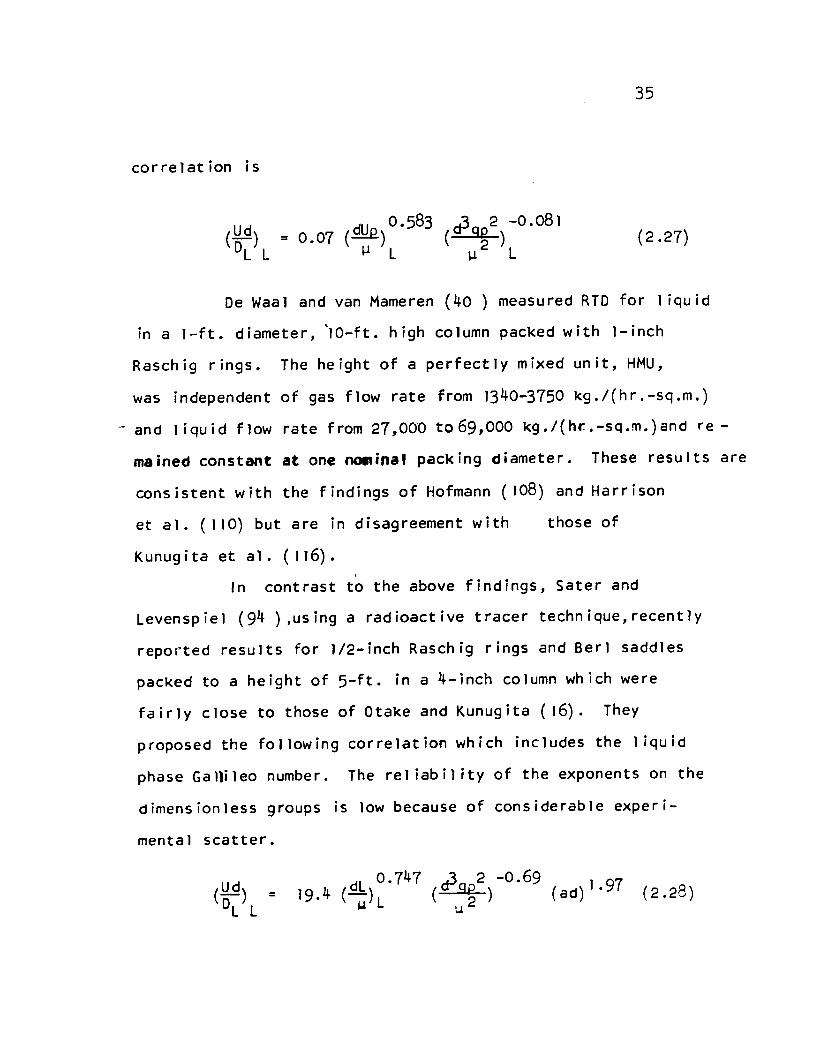
correlation is
(2.27)
De Waal and van Mameren (40 ) measured RTD for 1 iquid
in al-ft. diameter, )O-ft. high column packed with l-inch
Raschig rings. The height of a perfectly mixed unit, HMU,
was independent of gas flow rate From 1340-3750 kg./(hr.-sq.m.)
.. - and 1 iquid Flow rate From 27,000 to69,000 kg./(h.-:.-sq.m.)and re
mained constant at one ~ina' packing diameter. These results are
consistent with the findings of Hofmann (108) and Harrison
et al. (110) but are in disagreement with
Kunugita et al. (116).
those of
ln contrast to the above findings, Sater and
levenspiel (94 ) ,using a radioactive tracer technique,recently
reported results for 1/2-inch Raschig rings and Berl saddles
packed to a height of 5-ft. in a 4-inch column which were
fairly close to those of Otake and Kunugita (16). They
proposed the fOllowing correlation which includes the liquid
phase Gallileo number. The rel iability of the exponents on the
dimensionJess groups is low because of considerable experi-
mental scatter.
= dl 0.747 ~qp2 -0.69 (ad)I.97
19.4 (1:1) l (;2 ) (2.28)
36
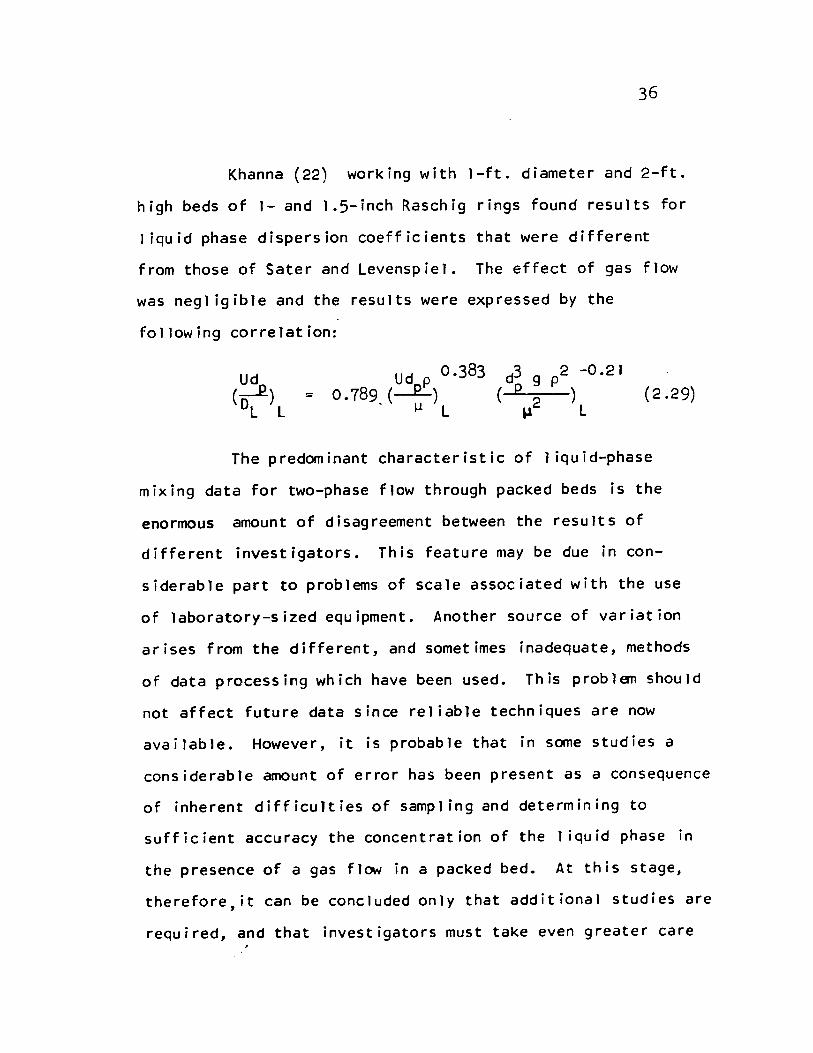
Khanna (22) working with l-ft. diameter and 2-ft.
high beds of 1- and 1.5-inch Raschig rings found results for
1 iquid phase dispersion coefficients that were different
from those of Sater and Levenspiel. The effect of gas Flow
was negl igible and the results were expressed by the
following correlation:
= (2.29)
The predominant characteristic of 1 iquid-phase
mixing data for two-phase flow through packed beds is the
enormous amount of disagreement between the results of
different investigators. This feature may be due in con
siderable part to problems of scale associated with the use
of laboratory-sized equipment. Another source of variation
arises from the different, and sometimes inadequate, methods
of data processing which have been used. This problem should
not affect future data since reliable techniques are now
available. However, it is probable that in sorne studies a
considerable amount of error has been present as a consequence
of inherent difficulties of sampling and determining to
sufficient accuracy the concentration of the 1 iquid phase in
the presence of agas Flow in a packed bed. At this stage,
therefore,it can be concluded only that additionaJ studies are
required, and that investigators must take Even greater care
37
than in the past in order that reliable results may be obtained.
Most of the mixing studies for both single and two
phase systems have been carried out with non-reacting tracers.
The results, however, are used for the cases where chemical
reactions occur. The reliabil ity of such a procedure is
unknown. Pearson et al. (117) have in fact proposed that
RTO be determined by measuring the conversions obtained with
first-order reactions when one experimentally varies the rate
constant. Lelli (118) has shown that RTO could be derived
from the unsteady behaviour of chemical reacting systems.
General appl icationandtesting of these more advanced concepts
also remains as a problem for future work.
2.5 MASS TRANSFER CALCULAT/ON MODELS W/TH AXIAL M/X/NG
Past practice with respect to mass transfer was to
process experimental data from laboratory packed-bed contactors
in terms of a model which assumed plug flow, then use these
transfer coefficients and correlations for the subsequent
design of industrial packed-bed contactors, again using a
design model based on plug flow. Such a procedure ignores
the fact that the flow characteristics for the laboratory
and industrial contactors will each differ to a different
extent from the plug-flow mode 1 . During the past decade
considerable effort has been directed to obtaining and testing
models which allow for the occurrence of axial mixing. Such
models are required in the processing of experimental data,
so that the resulting mass transfer coefficients are not at
the same time some kind of a measure of the specifie axial
mixing characteristics of the contactor used. They are
requ i red aga in in the use of such Il t rue" mass t rans fer
coefficients in the design of industrial contactors for
the specifie mixing conditions appl icable to the latter. The
more significant steps in the development of such calculation
models will now be reviewed.
Both Sleicher (119) and Miyauchi andVermeulen (93)
used the diffusion model as the basis for incorporating the
effect of axial mixing into a mass transfer calcuJation model.
Consequently, they arrived at the same differentiaJ equations
and boundary conditions. Sleicher presented a computer solution
39
in graphical form and gave an empirical formula for the ratio
of the number of "apparent ll transfer units to the number of
Iitruell transfer units. Miyauchi, McMullen and Vermeulen (120)
extended the concept of van Deemter, Zuiderweg, and KI inkenberg
(107) for chromatograph ic separat ions to the des ign of mass
transfer equipment with axial mixing, and developed a calcul
ation method for countercurrent extraction systems in which
the height of a true transfer unit could be obtained from a
summation of those due to the apparent transfer unit (plug
flow) and axial mixing. Both Sleicher and Miyauchi proposed
approximate semi-empirical equations for rapid estimation of
the effect of axial dispersion. Stemerding and Zuiderweg (121)
and Rod (122-3) have presented further simpl ification of the
analysis of the Sleicher-Miyauchi equations by approximating
their solution in the form of a simple nomogram.
ln a subsequent study Dunn et al. (114) appl ied a
modified form of above analysis to the earlier data of both
Fellinger (46) and Sherwood and Holloway (70), thereby
establ ishing that axial mixing of liquid had occurred in both
cases to an appreciable extent. For liquid-side controlled
absorption the following empirical relationship was developed:
= (2.30)
40
When applied to the oxygen desorption data of Sherwood
and Holloway (70) and arrmon ia absorpt ion data of FeIl inger
(46), s ignificant differenccs between the "truell and
Il appa rent" numbe r of t rans fer un i ts was obta ined. Howeve r ,
it should be recalled (cf. section 2.4, Figure 2.5) that experi
mental results for m:xing in packed beds of Dunn et al. show
exceptionally high degrees of 1 iquid-phase dispersion. AI
though their precise results are subject to future verification,
they did nonetheless provide a significant quantitative model
which allows for the effect of axial mixing in the 1 iquid
phase for the case of liquid-side controlled absorption
processes.
By working out two examples using the data of Tepe
and Dodge (124) and FeIl inger (46) Sater 025) in 1963
showed that mixing can cause a large difference between the
mass transfer coefficient ca1culated assu~ing plug flow, and
the "truell coefficient determined by taking into account the
axial mixing by the use of dispersion model. Mecklenburgh
and Ha rt 1 and (126-130) have recen t 1 Y P res~nted a ser i es of
papers in which they have used the diffusion mode 1 to allow
for the effect of axial dispersion on mass transfer in two
phase systems. These authors have furnished a detailed
an01ytical solution for stagewise as weIl as differential
contactors.
41
Further measures of thp. magnitude of the effect of
axial mixing on mass transfer coefficients are given by two
recent st ud i es. 1 n app 1 yi ng the two-phase di spe r sion mode 1
to the study of distillation columns with axial mixing,
Furzer and Ho (131) found that meaningful results could be
obtained only when the available values ofl iquid-phase Peclet
number were increased by a factor of 8. Sullivan et al. (132)
found that in a mechanically agitated absorption tower,
correction for axial mixing results in mass transfer coef
ficients which are 7 to 25 percent larger. There is thus
ample evidence of the need in aIl future mass transfer studies
to extract the transfer coefficients using a procedure which
adequately allows for the influence of axial mixing on transfer
rates.
2.6 SUMMARY
Holdup in packed beds has been fairly weil correlated
on a semi-empirical basis. Recently, the prediction of holdup
from basic considerat ions of fluid mechanics has been attempted.
The holdUp data for mobile-bed contactors presently available
dO not cùver the entire range of industrial interest, and
there are large differences between the re~ults of the only
two studies which have been publ ished. Further study of
hoidup in mobile-bed contactors is therefore required.
42
Proven methods are now available for direct
measurement of effective interfacial area of mass transfer,
i.e. based on absorption of agas which undergoes a pseudo
first-order reaction on dissolution. Data are available for
a variety of aqueous systems for fixed beds, but no informa
tion is available for mobiJe-bed contactors. There is also
need for further study of the effect of fluid properties
on effective interfacial area, and on the measurement of
interfacial area for organic systems.
The industrially important case of gas absorp
tion with chemical reaction has been analysed theoretically,
especially absorption with second-order chemical reaction. One
of the main difficulties in appl ication of the theory of mass
transfer with chemical reaction to the design of industrial
reactors is the scarcity of physico-chemical data required
by the models.
The diffusion model is the most widely-used
mode 1 for representing axial dispersion in single-phase and
two-phase systems. In the case of two-phase flow through
packed beds, the spread of experimental results between dif
ferent investigators is enormous, apparently due in large part
to the extremely difficult experimental probJems associated
with such measurements.

43
Calculation models are now avaiJabJe which
incorporate the effect of axial mixing into the anaJysis
of integral mass transfer equipment. The successfuJ use of
such models for two-phase contactors is however restricted
by the present uncertainty concerning the quantitative results
for mixing in gas-liquid contactors. This approach has not
previously been applied to the important new technique,
mobile-bed contacting.

III. THEORY
3.1 TRANSFER FUNCTION METHOD OF EVALUATION OF PECLET NUMBER AND RESIDENCE TIME
44
ln 1970 Ostergaard (105) and Michelsen and Ostergaard
(103) presented a transfer function analysis for the deter
mination of Peclet number from the concentration-time records
at two points in a flow system. This analysis is particularly
useful in that it el iminates the need to evaluate Peclet
number by the method of direct trace matching or from
simpl ified relations obtained from the solution of model
equations. Because of the boundary conditions used in their
ana,ysis however, their method is limited, in theory, to
contactors which are sufficiently long that they may be ade
quately described mathematically with the boundary conditions
for an infinite length contactor. This assumption is fre-
quently not tenable and, in particular, is not val id in the
case of mobile-bed contactors where the bed height is relatively
small. The developm€nt of a transfer function analysis for
finite length boundary conditions follows. The finite bed
analysis is appl ied sûbsequently to the experimental program
for a mobile-bed contactor, but is completely general for any
flow system. It is necessary for continuity to present first
the essential features of the analysis of Michelsen and
Ostergaard for the infinite-bed boundary conditions, fol Jowing
which the extension to the finite-bed case is shawn.
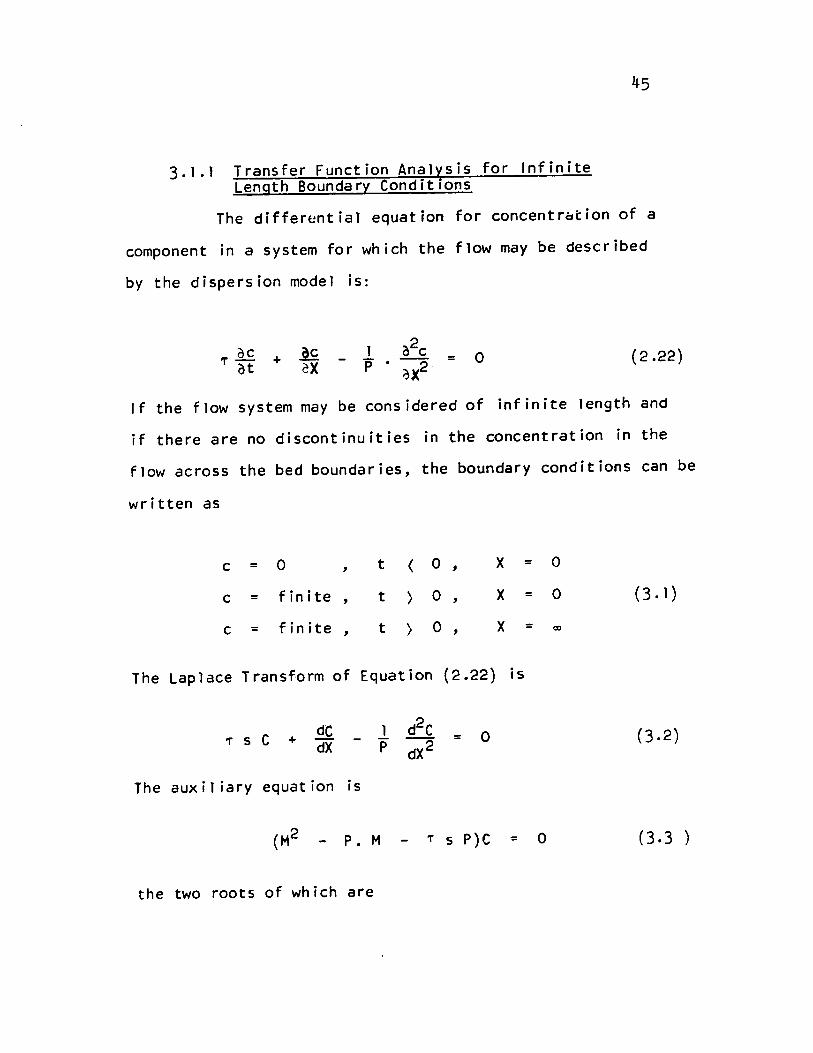
3.1.1 Transfer Function Analysis for Infinite Length Boundary Conditions
45
The differential equation for concentration of a
component in a system for which the flow may be described
by the dispersion model is:
= o (2.22)
If the flow system may be considered of infinite length and
if there are no discontinuities in the concentration in the
flow across the bed boundaries, the boundary conditions can be
written as
c = 0 t ( 0 X = 0 , c = finite t ) 0 X = 0 , , (3.1)
c = finite t ) 0 X = CD , ,
The Laplace Transform of Equation (2.22) is
'T' s C + dC 1 d2C = 0 dX - P dX2 (3.2)
The aux il iary equation is
P. M T 5 P)C = 0 (3.3 )
the two roots of which are
= P [l + 2
J4 ~ T]
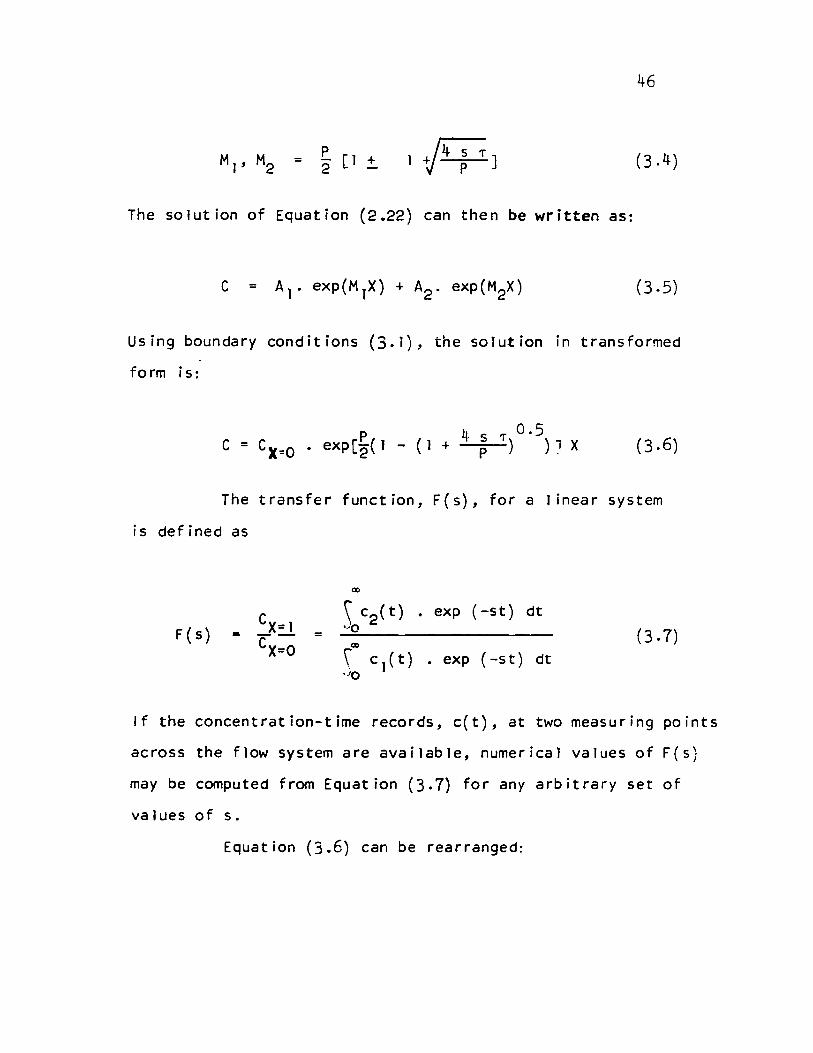
The solution of Equation (2.22) can then be written as:
46
(3. 4 )
(3.5)
Using boundary conditions (3.1), the solution in transformed
form i 5:
P 4 0.5 C = CX=o • exp[2( l - (l + ~ T) ) J X (3. 6)
The transfer function, F(s), for a 1 inear system
i s def ined as
F (s) \ c2(t) • exp (-st) dt vO
(3.7) ,= cl ( t) • exp (-s t) dt .Jo
If the concentration-time records, c(t), at two measuring points
across the flow system are available, numerical values of F(s)
may be computed from Equation (3.7) for any arbitrary set of
values of s.
Equation (3.6) can be rearranged:
:e n ( 1 IF ( s )) = T S
( 1, n ( 1 IF ( s ) ) ) 2
1 - p
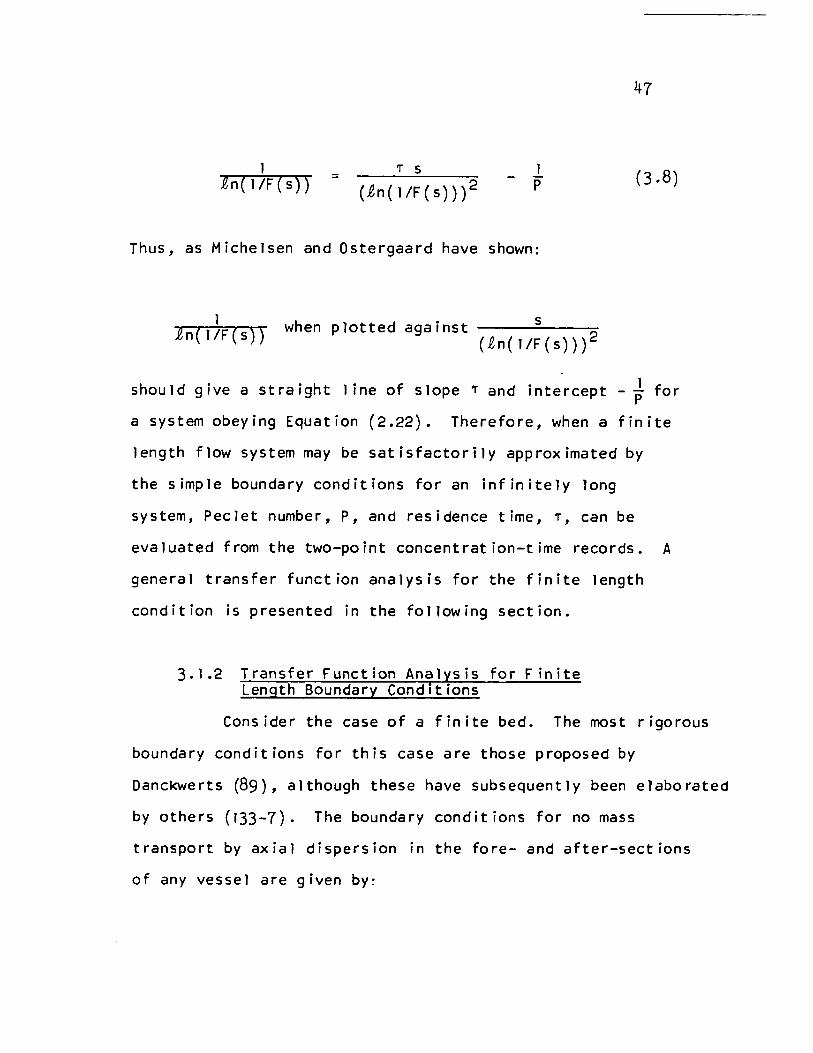
Thus, as Michelsen and Ostergaard have shown:
:e n ( 1 IF ( s ) ) when plotted against s
( p, n ( 1 IF ( s ) ) ) 2
47
1 should give a straight line of slope T and intercept - - for P
a system obeying Equation (2.22). Therefore, when a finite
length flow system may be satisfactorily approximated by
the simple boundary conditions for an infinitely long
system, Peclet number, P, and residence time, T, can be
evaluated From the two-point concentration-time records. A
general transfer function analysis for the finite length
condition is presented in the following section.
3. , .2 Transfer Function Analysis for F inite Length Boundary Conditions
Consider the case of a finite bed. The most rigorous
boundary conditions for this case are those proposed by
Danckwerts (89), although these have subsequently been elaborated
by others (133-7). The boundary conditions for no mass
transport by axial dispersion in the fore- and after-sections
of any vessel are given by:
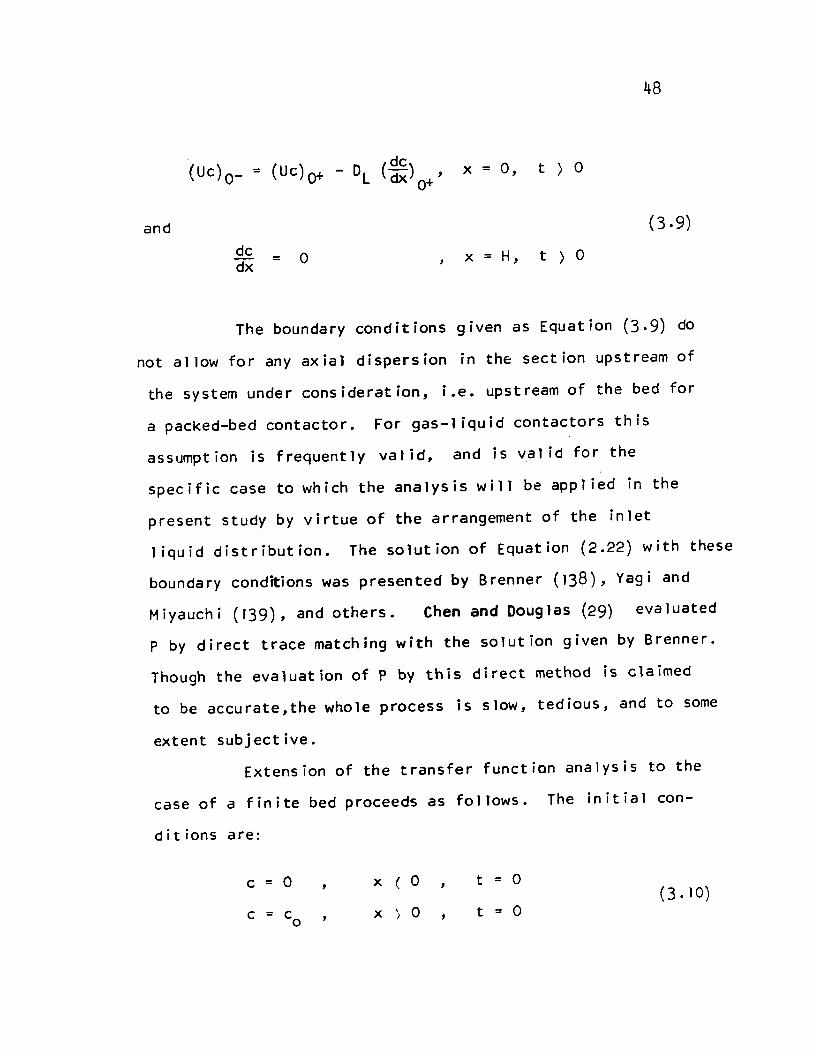
48
(Uc)o- = (Uc) 0+ - DL (:) , x = 0, t ) 0 0+
and (3.9) dc 0 H, t ) 0 dx = x =
The boundary conditions given as Equation (3.9) do
not allow for any axial dispersion in thé section upstream of
the system under consideration, i.e. upstream of the bed for
a packed-bed contactor. For gas-liquid contactors this
assumption is frequently val id, and is val id for the
specific case to which the analysis will be applied in the
present study by virtue of the arrangement of the inlet
1 iquid distribution. The solution of Equation (2.22) with these
boundary cond~ions was presented by Brenner (138), Vagi and
Miyauchi (139), and others. Chen and Douglas (29) evaluated
P by direct trace matching with the solution given by Brenner.
Though the evaluation of P by this direct method is claimed
to be accurate,the whole process is slow, tedious, and to some
extent subjective.
Extension of the transfer function analysis to the
case of a finite bed proceeds as follows. The initial con-
dit ions are:
c = 0 x ( 0 t = 0 (3.10)
x '> 0 t = 0
49
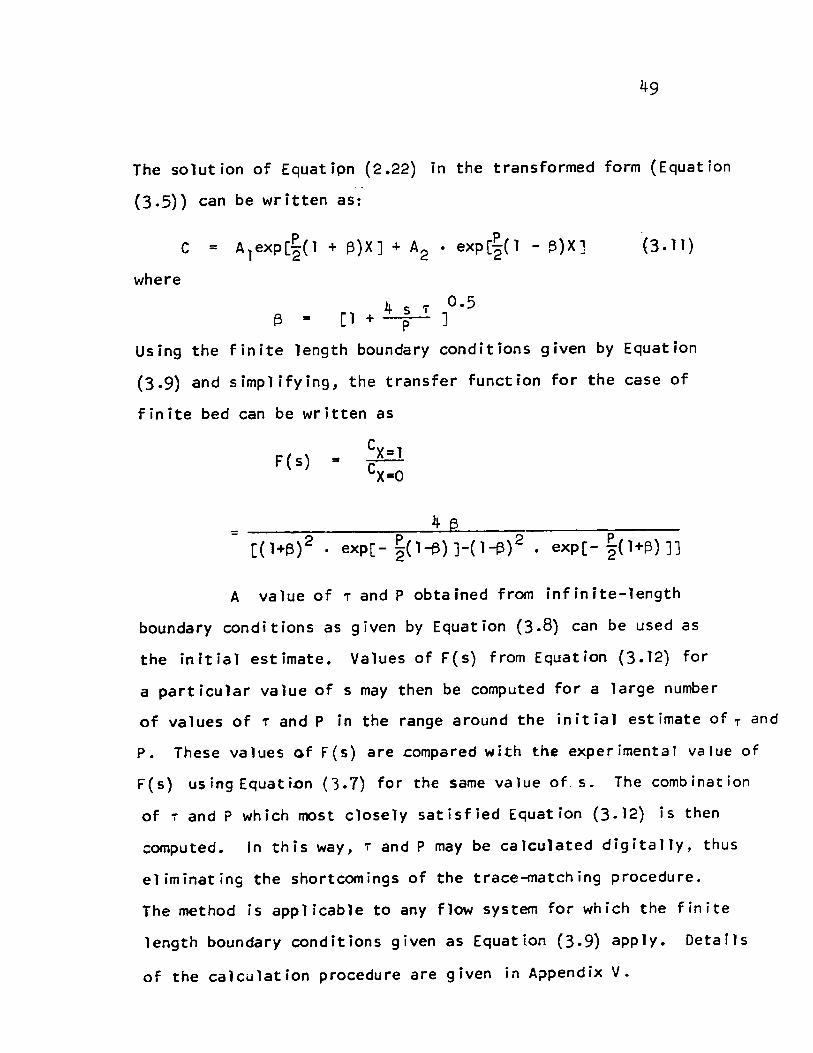
The solut ion of Equat ipn (2.22) in the transformed form (Equat ion
(3.5)) can be written as:
(3. 11)
where
4 ,.. 0.5 [1 + ~ 1 J
Using the finite length boundary conditions given by Equation
(3.9) and simplifying, the transfer function for the case of
finite bed can be written as
F (s) ..
= ____ ~------~~~4~ê~----~------=_-----[(l+~)2 . exp[- ~(1~)J-(1~)2 • exp[- ~(l+~)JJ
A value of ,. and P obtained From infinite-length
boundary conditions as given by Equation (3.8) can be used as
the initial estimate. Values of F(s) from Equation (3.12) for
a particular value of s may then be computed for a large number
of values of T and P in the range around the initial estimate of T and
P. These values of F(s) arecompared with tne experimental value of
F(s) using Equati.on (3.7) for the same value of. s. The combinat ion
of 7 and P which most closely satisfied Equation (3.12) is then
computed. In this way, T and P may be calculated digitally, thus
eliminating the shortcomings of the trace~atching procedure.
The method ;5 applicable to any flow system for which the finite
length boundary conditions given as Equation (3.9) apply. Detarls
of the calculation procedure are given in Appendix V.
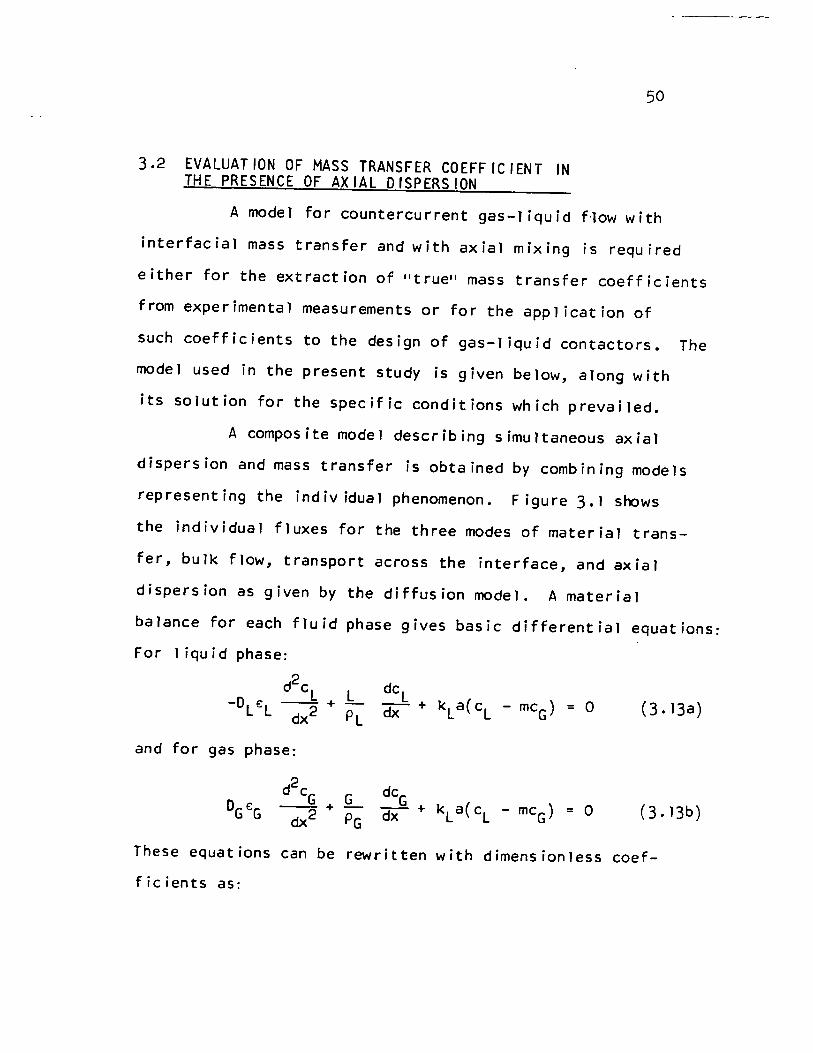
3.2 EVALUATION OF MASS TRANSFER COEFFICIENT IN THE PRESENCE OF AXIAL DISPERSION
50
A mode 1 for countercurrent gas-liquid f'low with
interfacial mass transfer and with axial mixing is required
either for the extraction of "true" mass transfer coefficients
from experimental measurements or for the application of
such coefficients to the design of gas-liquid contactors. The
mode 1 used in the present study is given below, along with
its solution for the specifie conditions which prevailed.
A composite modeJ describing simultaneous axial
dispersion and mass transfer is obtained by combining modeJs
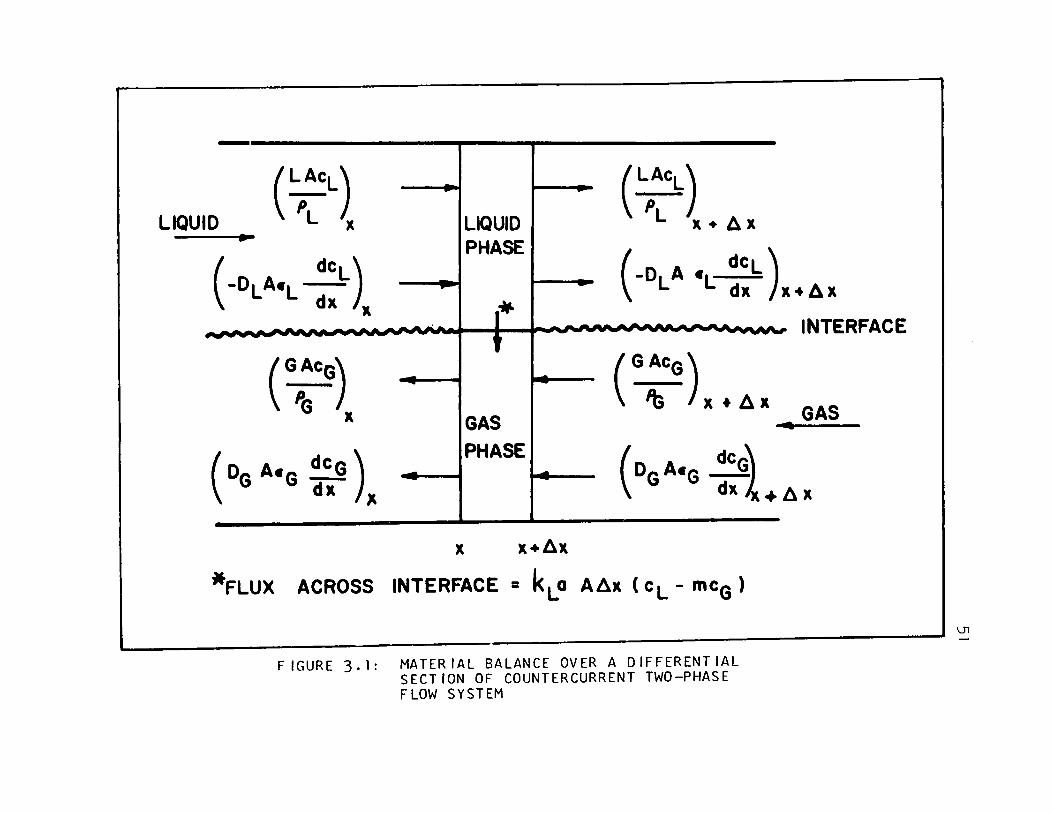
representing the indiv idual phenomenon. Figure 3.1 shows
the individual fluxes for the three modes of material trans-
fer, bulk fJow, transport across the interface, and axial
dispersion as given by the diffusion model. A materiaJ
balance for each fluid phase gives basic differential equations:
For
and for gas phase:
dC L -- + dx
dCG -- + dx
(3.13a )
(3.13b)
These equations can be rewritten with dimensionJess coef-
fic ients as:
LIQUI
-(L,:CL) -.. (L,ACL)
0 x LIQUID L x + âx ~
PHASE
(-DL A cL ::L) ( dCL) -OLAcL . -dx x *"
x+âx
..-.......-. - -- _ ..... -- --. .... _ .... .-. .... -~ -- t - ---- - -- -- INTERFACE
C,:CG) - (GACG) ~ x. âx x GAS GAS ~--
(0 Ac dCG) PHASE (DGACG dCGt - -G G ëiX dx + "
x x+âx
*FLUX ACROSS INTERFACE = kLQ Aâx (cL - mCG )
FIGURE 3.1: MATERIAL BALANCE OVER A DIFFERENTIAL SECTION OF COUNTERCURRENT TWO-PHASE FLOW SYSTEM
âx
V1
" '"ft.,., "' ..
52
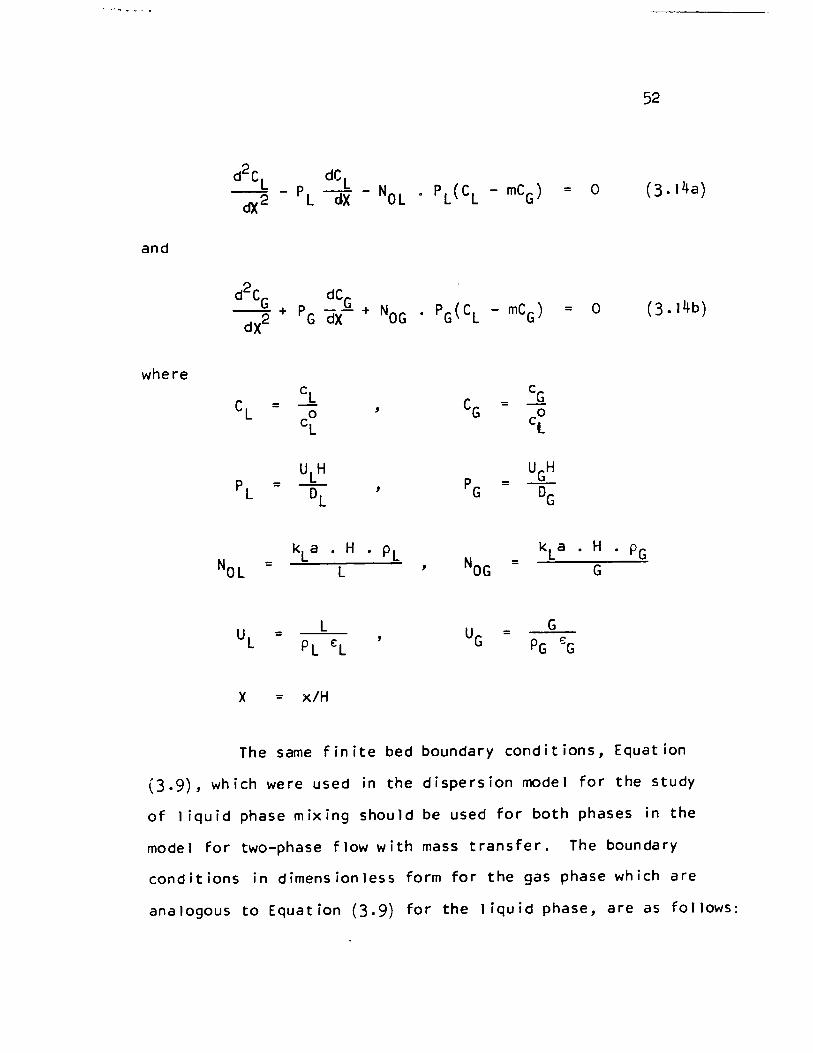
d2C dC L L . PL(C L - mCG) 0 (3. 14a) d)(2 - PL dX - NOL =
and
d2C dCG __ G_ + PG dX- + NOG . PG(C L - mCG) = 0 (3. 14b)
dX2
where
CL = cL
CG = cG
0 ,
CO cL l
PL = ULH
PG =
UGH
DL , DG
kLa . H • PL kLa . H . PG NOL = NOG = L , G
= L = G
x = x/H
The same finite bed boundary conditions, Equation
(3.9), which were used in the dispersion mode 1 for the study
of 1 iquid phase mixing should be used for both phases in the
mode 1 for two-phase flow with mass transfer. The boundary
conditions in dimensionless form for the gas phase which are
analogous to Equation (3.9) for the 1 iquid phase, are as follows:

53
(Cl)o- ( Cl) 1 dC l = - Pl (dX ) + 0+ 0
X = 0 dCG = 0 dX
dCG (3. 1 5)
(CG) (CG) H-l = - PG
(-ax)H-H+
X = dC l = 0 ëiX
The application of the finite bed boundary conditions
for gas flow through packed beds was tested by Wehner and
Wilhelm (134) for the case of a first-order reaction in a
continuous-flow reactor. Bischoff (81) has shown their
val idity for reactions of any order. A critical evaluation
of these and alternative boundary conditions as applied to
single-phase flow through tubular flow reactors has been
presented by Fan and Ahn (136). Although only homogeneous
single-phase reaction systems have been studied the same
reason ing app 1 ies to the case of two-phase f low systems. 'n
fact these boundary conditions have been successfully used
for the cases of countercurrent extraction (141),mechanically
agitated countercurrent absorption (132), and dist illation
columns (131).
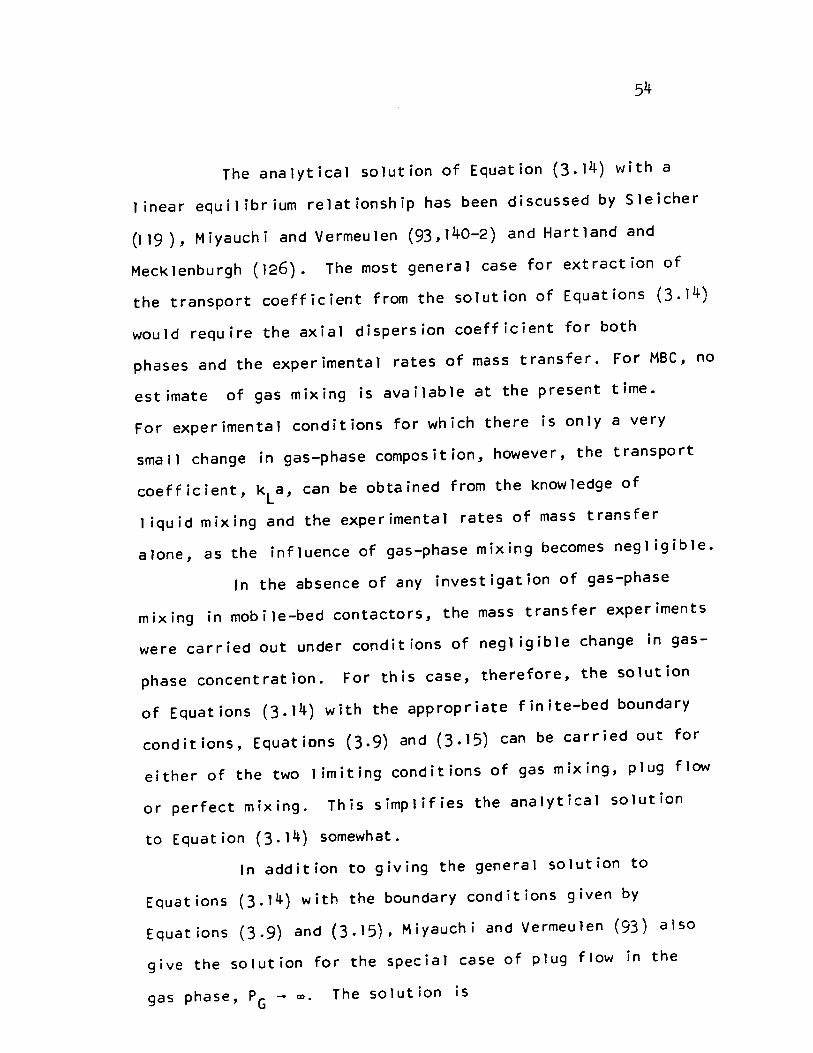
The analytical solution of Equation (3.14) with a
1 inear equilibrium relationship has been discussed by Sleicher
(119), Miyauchi and Vermeulen (93,140-2) and Hartland and
MecKlenburgh (126). The most general case for extraction of
the transport coefficient from the solution of Equations (3.14)
would require the axial dispersion coefficient for both
phases and the experimental rates of mass transfer. For MBC, no
estimate of gas mixing is available at the present time.
For experimental conditions for which there is only a very
small change in gas-phase composition, however, the transport
coefficient, KLa, can be obtained from the Knowledge of
1 iquid mixing and the experimental rates of mass transfer
alone, as the influence of gas-phase mixing becomes negl igible.
ln the absence of any investigation of gas-phase
mixing in mobile-bed contactors, the mass transfer experiments
were carried out under conditions of negl igible change in gas
phase concentration. For this case, therefore, the solution
of Equations (3.14) with the appropriate finite-bed boundary
conditions, Equations (3.9) and (3.15) can be carried out for
either of the two 1 imiting conditions of gas mixing, plug flow
or perfect mixing. This simplifies the analytical solution
to Equation (3.14) somewhat.
ln addition to giving the general solution to
Equations (3.14) with the boundary conditions given by
Equations (3.9) and (3.15), Miyauchi and Vermeulen (93) also
give the solution for the special case of plug Flow in the
gas phase, PG - m. The solution is

= i=3 L
i = 1
i=3 = L
i = 1
A. , exp (>" .X) ,
a .A. • exp (>"., X) , ,
which for the terminal condition X = 1, becomes:
or
where
• cl _
1 •
cl - mCG co mc'
l - G
A. , =
=
=
1 - À2 /P
Àrexp( À2 )
55
(3.16)
(3. 17)
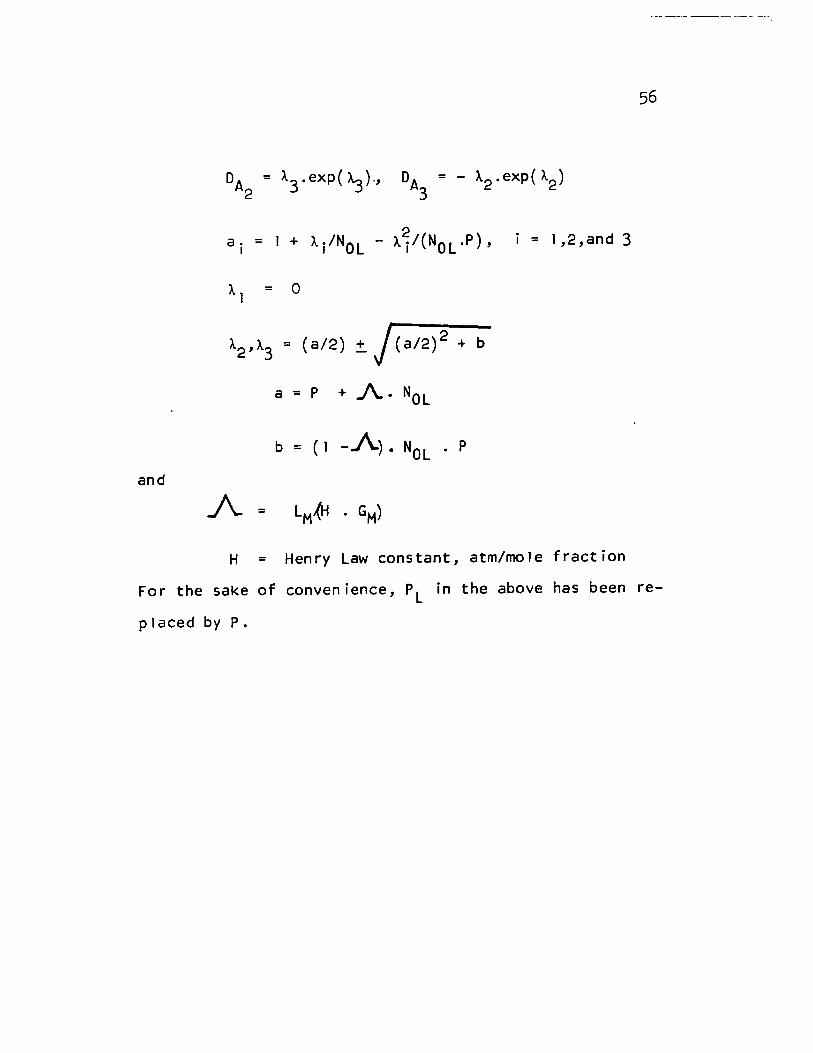
and
À1
= 0
À2 ,À3 = (a/2) + J'(a/2)2 + b
a = P +~. NOL
b = (1 -A). NOL • P
= 1 ,2,and 3
H = Henry Law constant, atm/mole fraction
56
For the saKe of convenience, PL in the above has been re
pl aced by P.
57
IV. EXPERIMENTAL
4.1 DESIGN OF EXPERIMENTS
An outline fol10ws of the rationale behind the experi
mental program, and of the key factors which determine the sel
ection of the experimental techniques of particular systems used.
4.1.1 General Determinants of the Experimental program
8ehaviour of packed columns with respect to mass trans
fer has general1y been characterized in terms of volumetric-based
transfer coefficients, kLa and kGa, or their equivaJent. The
basic shortcoming of this procedure is that the relationship be
tween the system variables and area-based coefficients, kL and
kG' may be quite different from that which applies for interfacial
area, a. Thus measurement of kGa and kLa determines only the
composite effect which, for that reason, tends to obscure an un
derstanding of the basic processes occurring in gas-liquid con
tactors. AIso, different scaJe-up criteria may apply to inter
facial area and to the area-based transfer coefficient.
Another consideration which influenced the design of
the experimental program is that mass transfer theories predict
the area-based transfer coefficient, kL or kG' for simple fJows.
These theories may be used as a guide in modeJJing transport
under more complex hydrodynamic conditions. This approach re
quires that the functionaJ dependence of the hydrodynamic para
meters of the contactor be determined for kL and kG' not kLa
and kGa. The interfacial area, on the other hand, depends on
the geometry of the packing, the physical and fJO\oI properties
58
of the flùids and on the mode of contacting. The fa ct that no
generalized theoretical prediction of interfacial area appears
yet to be feasible does not, however, detract from the value of
determining "its functional dependence on the system variables
separately from that for the transfer coefficients.
The independent det~rmination of interfacial area and
an area-based transfer coefficient requires in turn that the
volumetric-based mass transfer coefficient from which it is
derived be properly corrected for the effect of axial mixing
(section 3.2). Only by allowing for axial mixing is it possible
to obtain values of the area-based transfer coefficient which re
flect purely the influence of fluid flow on mass transfer. Al
though one study has been published of axial mixing for the
liquid-phase of a mobile-bed contactor, it was done on a dif
ferent sized column, using a more difficult, less accu rate
method of data processing than is now available, and did not
cover as wide a range of mass velocities as was desired for the
present mass transfer study. Thus, in order to have the re
quired mixing data available with maximum accuracy and over
the entire range of conditions of interest, the present study
incorporates an extensive study of liquid-phase mixing in the
same column as was used for the studies of mass transfer and in
terfacial area.
A 5.5-inch (1.0.) column with spheres of sizes 0.5,0.75,
1.0 and I.5-inches was used for aIl studies of the hydrodynamics
of MBC. The relatively large 1.5-inch spheres were included be-
59
cause this is the size most used in industry and also to facili-
tate comparison with results of Chen. The size of the ·column·'was
limited by chemical consumption and the facilit!es required for
the mass transfer study. AlI mass transfer experiments were per
formed with O.75-inch spheres only.
4.1.2 Basic Elements of the Experimental program
Experiments were designed which provided:
• liquid-phase axial mixing data; since liquid holdup
could be obtained from the same experiments, measurement of hold
up became part of the experimental program,
• effective interfacial area of mass transfer, 'a',
• true liquid-phase volumetric mass transfer coeffic
ient, kLa, determined with appropriate allowance for the effect
of axial mixing,
• area-based 1 iquid-phase mass transfer coefficient from
kLa k L = a
The design of each of these sub-studies is now presented.
4.1.3 Hlxing and HOldup Study
Axial mixing and holdup of the liquid phase (sections
2.4.2,2.5,3.1) were studied by measuring the RTD of the 1 iquid
phase by the transient-response method. This technique requires
selection of an input signal from the alternatives of a step, im-
pulse, sinusoidal or random variation of sorne property such as
color, temperature or concentration. For the present study a
pulse injection of potassium chloride solution was chosen for the
fOllowing reasons:
60
• step input gives cumulative breakthrough curves
from which the information required for determination of RTD
must be extracted by numerical differentiation, a process
which inherently introduces inaccuracy.
• sinusoidal input requires freedom from higher
harmonies, which involves the use of sophisticated injection
equipment; the use of more comp1ex input functions requires
more complex analysis and offers no advantage for t~is system
over the simpler inputs.
• the results from a pülse input give the desired
data directly and accurately; the use of this input function
was restricted in the past by the requirement that a satis
factorily pure pulse be produced; a1though it was found possible
to do so in the presence case, this was not, however, essential
because the method of ana1ysis emp10yed cou1d use any kind
of input.
• equipment for monitoring e1ectrical conductivity
of potassium chloride solutions was avai1able from a previous
study.
4.1.4 Determination of Effective Interfacial Area
Among the avai1able systems for determination of
effective interfacial area by absorption of agas which under
goes a pseudo-first-order reaction in the 1 iquid (section 2.2.3),
the carbon dioxide-sodium hydroxide system was chosen because
61
• the physico-chemical constants of the reaction
can be est imated with a satisfactory degree of reliabil ity;
the kinet ics of oxidation of sodium sulphite, a possi ble
alternate system, is questionable.
• the reaction velocity constant of the CO 2-DH
reaction step, k2 , is large; the small values of k2 which
apply for.the alternative system carbon dioxide-carbonate
buffer solution limits the application of that previously
used system to cases with a small rate of surface renewal (ard
thus, small mass transfer coefficient). With a low reaction
rate constant and high rates of surface ren~/al there could be
appreciable buildup of carbon dioxide in the bulk of the
1 iquid phase such that the reaction would no longer be pseudo
first-order, as is required by the theory for this method of
determination of interfacial area.
• air diluted with carbon dioxide can be used
and a correction made for gas-side resistance which is not
possible in other systems.
• specifie rate of absorption, R, is independent
of the hydrodynamics of the system and a single ~easurement
of absorption rate is necessary. Other systems require a
simultaneous variation of k2 and the measurement of absorption
rate for the evaluation of k L before lai can be obtained (see
Equation (2.16)).
62
For the system chosen, absorption of carbon dioxide
from air into sodium hydroxide solutions, it is essential to
allow for the gas-phase resistance. This can be done by mea
suring the gas-phase mass transfer coefficient for a system
which is entirely gas-film controlled, such as the sulphur
dioxide-alkali, acetone~ater and ammonia~ater systems. The
system sulphur dioxide-sodium hydroxide was chosen because
of the similarity of analysis procedure to that for carbon
dioxide-sodium hydroxide.
The surface area may then be calculated from the
expression for additivity of resistances:
1 = 1 + 1 1
( 4. 1) KGa kGa HkLRa
w ith exper imental values of KGa (C0 2-NaOH system) and kGa
(S02-NêOH system), along with kLR from the theory, and the
physical property, H.
4.1.5 Liguid-Phase Mass Transfer Coefficient
ln most systems of industrial interest the main resis-
tance to mass transfer is in the liquid-phase. Thus a study of
1 iQuid~pha~ mass transfer for this new gas-liquid contacting
technique was considered to have the highest priority. The
system used for determination of kLa was desorption of carbon
dioxide from saturated water. Actuallya dilute solution of
ethylene gl~col in water was used 50 as to match the viscosity
63
of the 1 iquid phase to that of the sodium hydroxide 1 iquor
used in the determination of~ interfacial area, thus minimizing
differences in hydrodynamic effects and physical properties
of the two systems. Desorption of carbon-dioxide was chosen
instead of absorption because
• it is more accu rate to measure large concentra
tion changes in the liquide
• absorption would require either pure carbon
dioxide (at ~ 200 cfm) or a high concentration in the air
for significant absorption in the 1 iquid. The supply of such
large flows of carbon dioxide is major disadvantage.
• the absence of static holdup; differencesbetween
values of 'a' for the two cases of absorption and vaporization
in packed beds are reported to be due to static holdup. As
the static holdup for MBC is quite negl igible relative to the
operating holduPI kLa could be determined for either system.
The liquid-phase mass transfer coefficient, kLa,
was determined using the model which allows for the actual
extent of axial mixing in the l iquid phase, as determined
from the mixing study. Finally, the close physical matching
of the systems used for determination of interfacial area
and of liquid-phase mass transfer coefficient makes it
possible to determine the area-based transfer coefficient by
simple combinat ion of the results from these two extensive __ kLa
sub-studies , i.e. kL a
64
4.2 INTROOUCT ION TO EXP ER IMENTAL PROGRAMS
The experimental program was carried out in three
pa rts:
1. Axial mixing investigation, involving deter
mination of residence time distribution by the use of pulse
inputs in the liquid phaso.
2. Measurement of interfacial area by absorption
of carbon dioxide and sulphur dioxide from air mixtures into
solutions of sodium hydroxide.
3. Measurement of liquid-phase mass transfer co
efficients by desorption of carbon dioxide from aqueous
solution into air.
The exper imental facility as used for the
mixing study is described first, then those modifications
which were required for the absorption and desorption experi
ments.
4.3 EQUIPMENT AND PROCEDURE FOR MIXING STUOIES
Figures 4.1 a~d 4.2 show a schematic representation
and photograph of the experimental equipment. The test
column was made of 6" 0.0. by 1/4" thick plexiglas pipe,
designed so that the spacing between grids could be varied
continuously from 5.5 to a maximum of 30 inches by sliding
teJescopic joints. The lower supporting grid ... ,as retained
between the flanges which connect the gas distribution system
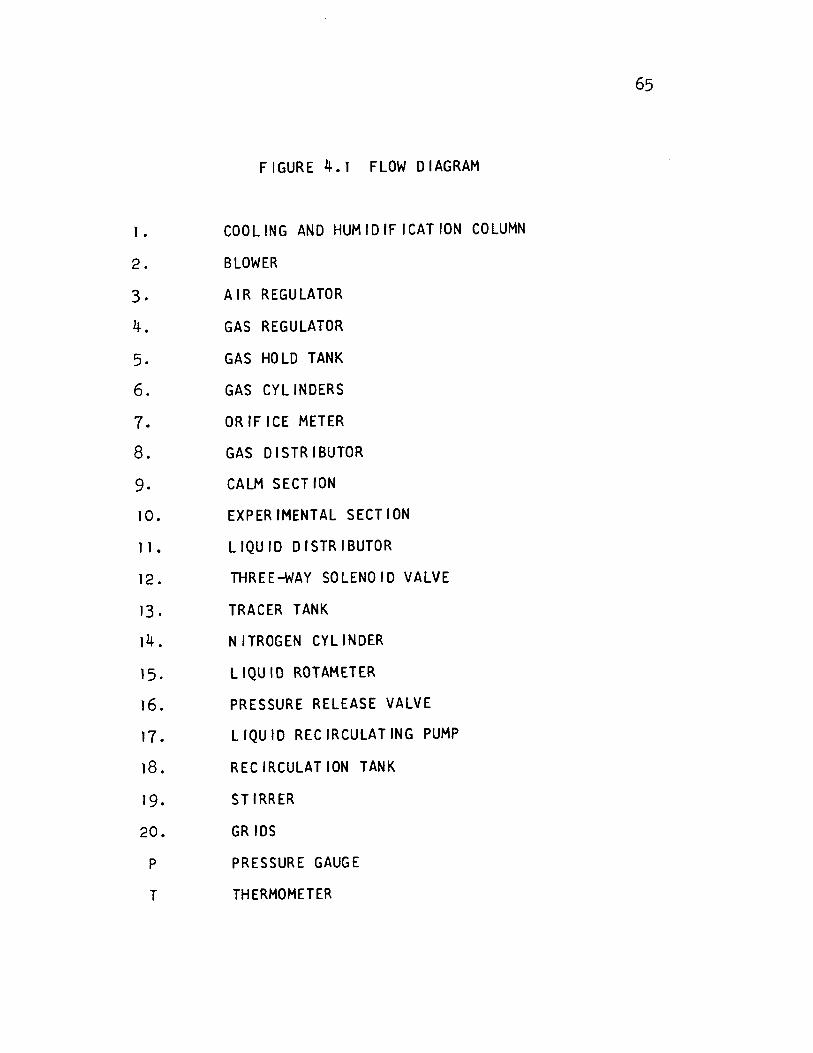
65
FIGURE 4.1 FLOW DIAGRAM
1. COOLING AND HUMIDIFICATION COLUMN
2. BLOWER
3. AIR REGULATOR
4. GAS REGULATOR
5. GAS HOLD TANK
6. GAS CYLINDERS
7. ORIFICE METER
8. GAS DISTRIBUTOR
9. CALM SECTION
10. EXPERIMENTAL SECTION
Il. LIQUID DISTRIBUTOR
12. THREE4WAY SOLENOID VALVE
13. TRACER TANK
14. NITROGEN CYLINDER
15. LIQUID ROTAMETER
16. PRESSURE RELEASE VALVE
17. LIQUID RECIRCULATING PUMP
18. RECIRCULATION TANK
19. STIRRER
20. GRIDS
P PRESSURE GAUGE
T THERMOMETER

COlO WATER IN
Q)
TO DRAIN
10 DRAIN
__ .L --1---4---+ -.:1
-"
1 1
EXHAUST
! ""'''''1 -® 1 L. __
TO DRAIN
1 1 1
,.J...,
FIGURE 4.1: FLOW DIAGRAM OF THE EXPERIMENTAL SET-UP
WATER-IN
m m
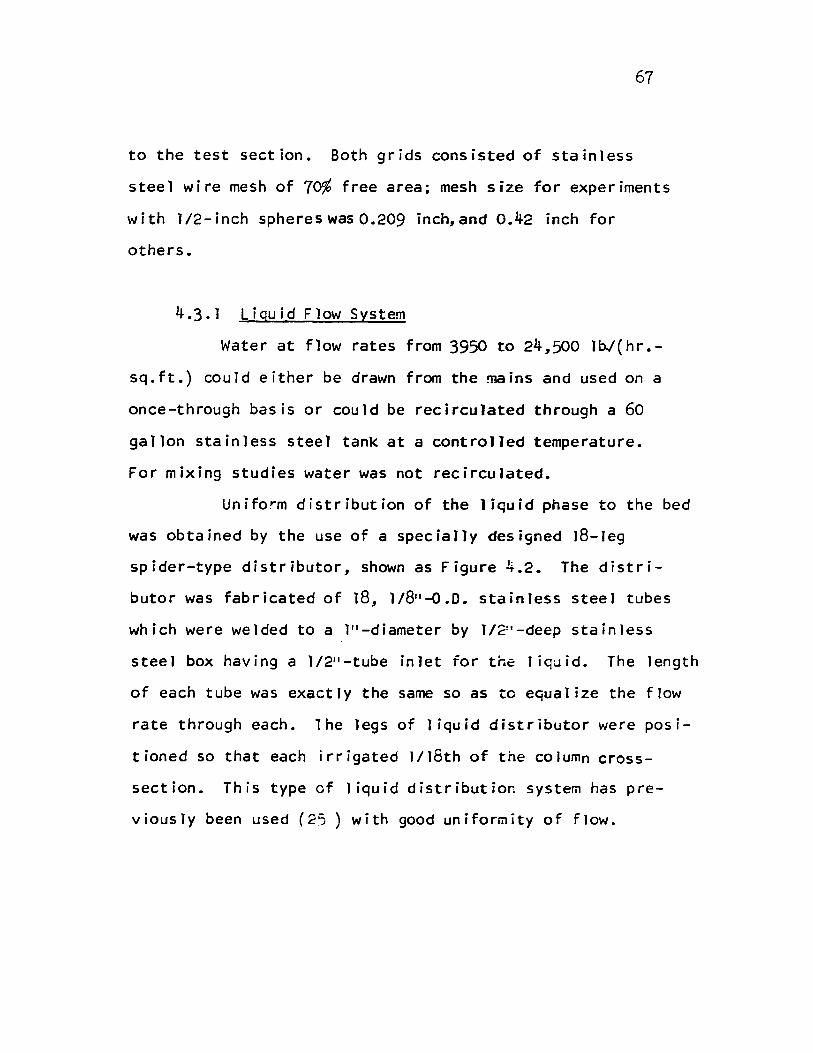
67
to the test section. Both grids consisted of stainless
steel wire mesh of 70% free area; mesh size for experiments
w i th 1/2- inch spheres was 0.209 inch, and 0.42 inch for
others.
4.3.1 Liquid Flow System
Water at flow rates from 3950 to 24,500 Ibl(hr.
sq.ft.) could either be drawn from the mains and used on a
once-through basis or could be recircuJated through a 60
gallon stainless steel tank at a controlJed temperature.
For mixing studies water was not recirculated.
Unifo~m distribution of the Jiquid phase to the bed
was obtained by the use of a specially designed 18-leg
spider-type distributor, shown as Figure 4.2. The distri
butor was fabricated of 18, 1/8"-0.0. stainless steel tubes
which were welded to a l"-diameter by 1/2"-deep stainless
steel box having a 1/211 -tube inlet for the liquide The length
of each tube was exactly the same 50 as te equalize the flow
rate through each. The legs of liquid distributor were posi
tioned so that each irrigated J/l8th of the column cross
section. This type of 1 iquid distributior. system has pre
viously been used (25 ) with good uniformity of flow.

68
FIGURE 4.2: PHOTOGRAPH OF LIQUID DISTRIBUTOR
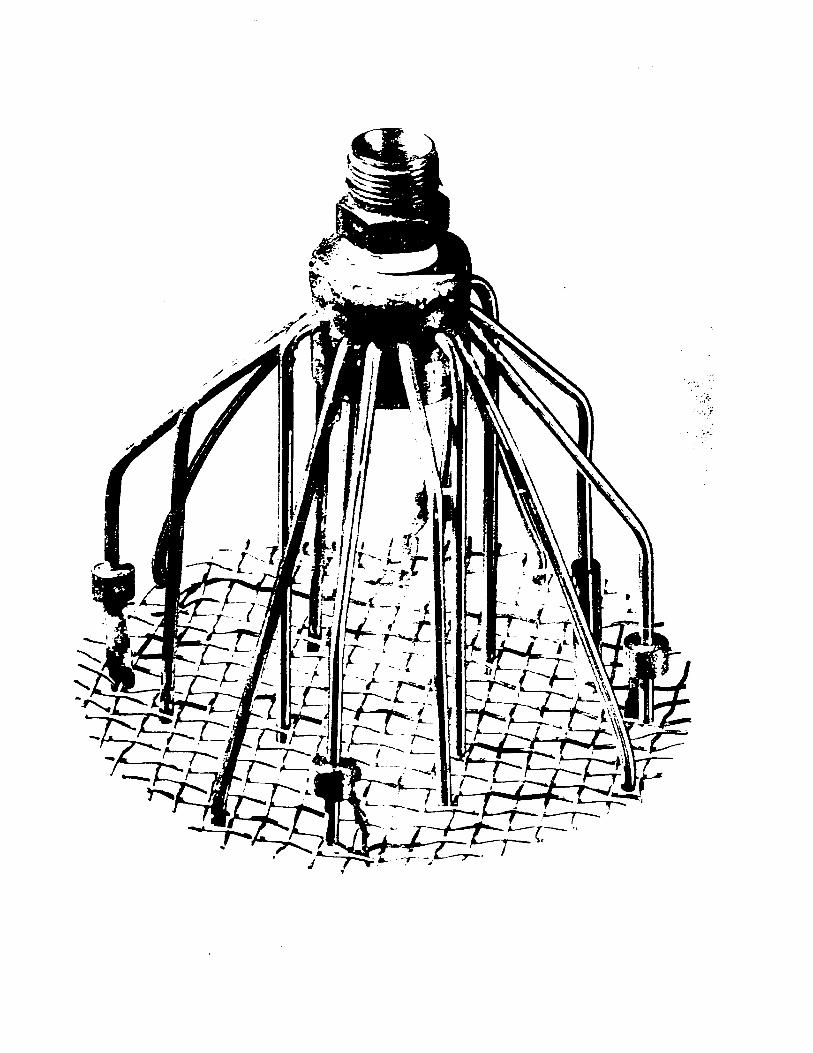
69
4.3.2 Gas Flow System
Air was drawn through a humidifying tower by a
5 H.P. blower and monitored by an orifice meter before it
entered the gas distributing system. The humidification
tower consisted of a similar MBC unit containing l/2-inch
spheres. It was provided primarïly for mass transfer experi
ments to cool and saturate air.
The gas distribution section was designed so that
a nearly flat velocity profile" at the bed entrance could be
obtained. The gas passed first through a cylindrical section
12-inch diameter by 12 inch high, then through a converging
conical section 12 inch high. In the cylindrical section
the air passed through air filters before emerging from a
bundle of 32 plexiglas tubes, each 3/4-inch in diameter.
The filters were made of rubber and-had open cell structure.
By adjusting the amount of filter material at different
points on the cross-section, a uniform distribution of gas
was obtained. Figure 4.3 shows typical gas flow profiles
measured at the level of lower supporting grid using a
standard lIB-inch pitot tube and a pressure indicator
(Barotron). The gas was exhausted through the telescoping
pipes to the roof level. Gas mass velocities up to 4000
lbl(hr.-sq.ft.) could be employed.
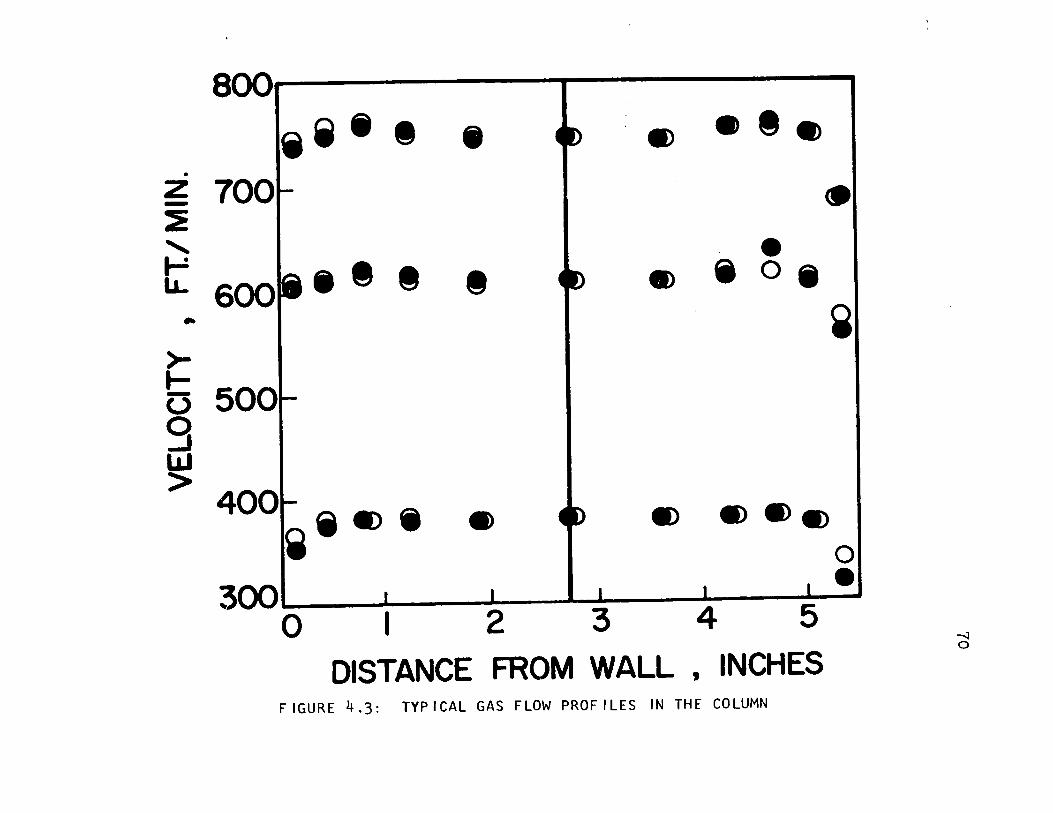
800 1
ii· , -- • tI) e8. 1 .
~ 700r :E 1 -, ~ t • ~ ~ .. 600 .8, - 8) ~ 0_
~ >-.... -u 9 lJJ > 4nnl-
i.:>- ., f ~ tI) tI) ~
0 300· 1 . ••
0 1 2 3 4 5 -.:J
DISTANCE FROM WALL, INCHES 0
FIGURE 4.3: TYPICAL GAS FLOW PROFILES IN THE COLUMN
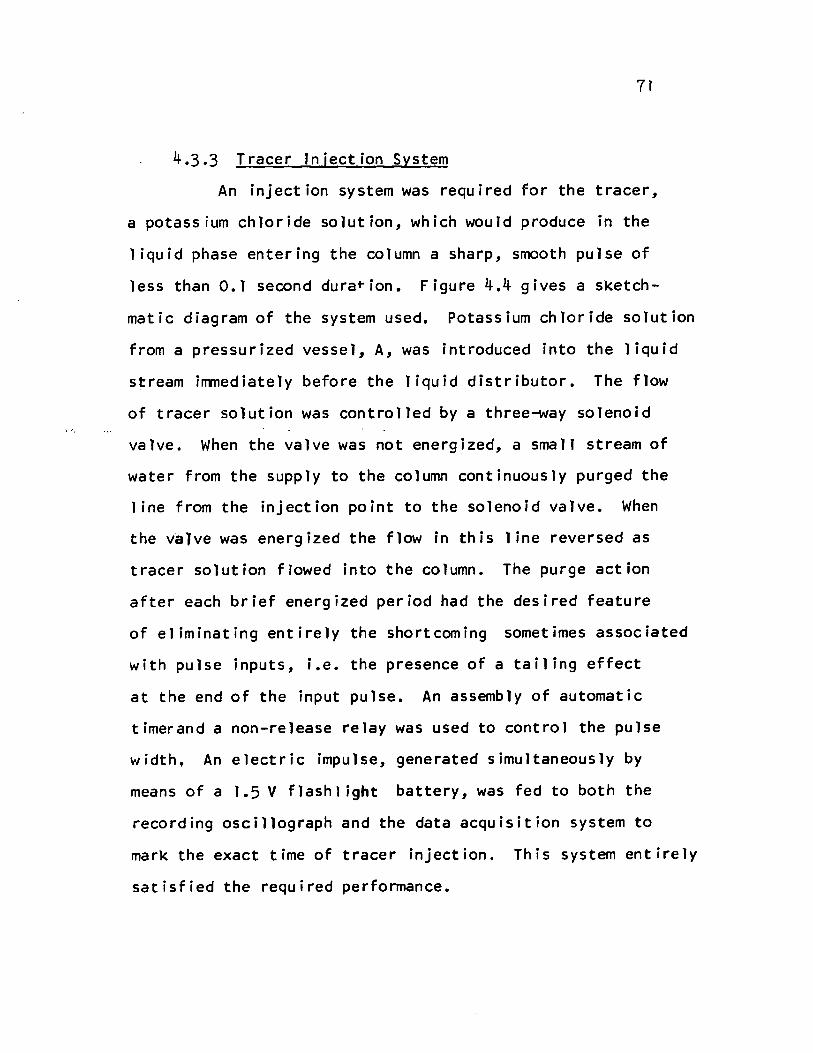
". ~.
71
4.3.3 Tracer Injection System
An injection system was required for the tracer,
a potassium chloride solution, which wouJd produce in the
liquid phase entering the column a sharp, smooth pulse of
less than 0.1 second duration. Figure 4.4 gives a sketch
matic diagram of the system used. Potassium chloride solution
from a pressurized vessel, A, was introduced into the liquid
stream immediately before the liquid distributoï. The flow
of tracer solution was controlled by a three~ay solenoid
valve. When the valve was not energized, a smalJ stream of
water from the supply to the column continuousJy purged the
line from the injection point to the solenoid valve. When
the valve was energized the flow in this line reversed as
tracer solution flowed into the column. The purge action
after each brief energized period had the desired feature
of eJiminating entirely the shortcoming sometimes associated
with pulse inputs, i.e. the presence of a tailing effect
at the end of the input pulse. An assembly of automatic
timerand a non-release relay was used to control the pulse
width, An electric impulse, generated simultaneously by
means of a 1.5 V flashl ight battery, was fed to both the
recording oscillograph and the data acquisition system to
mark the exact time of tracer injection. This system entirely
satisfied the required performance.
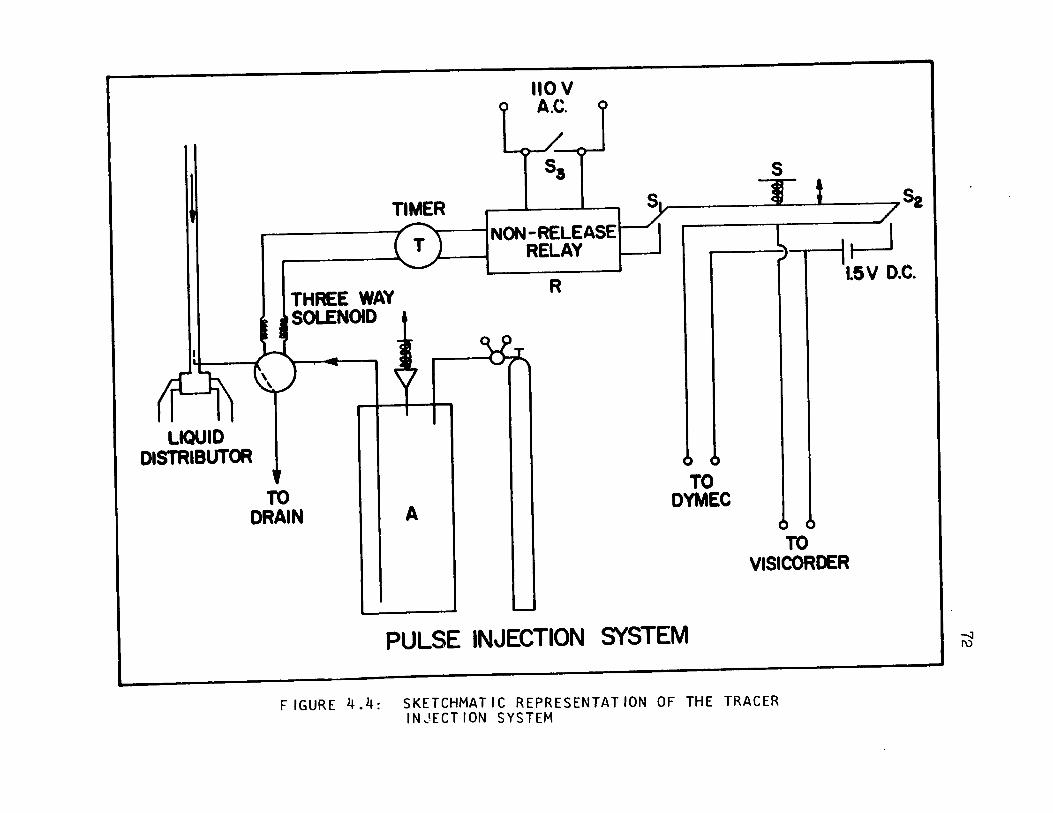
LIQUID DISTRIBUTOR
TI MER
IIOV A.C.
Sa
, INON-RELEA5E RELAY
THREE WAY R
SOLENOID
5
'1 ...., 1 52 , 7
r------~ i Il 1
l5V D.C.
TO DRAIN A
TO DYMEC
PULSE INJECTION SYSTEM
TO VISICOROER
FIGURE 4.4: SKETCHMATIC REPRESENTATION OF THE TRACER IN .. !ECT ION SYSTEM
-..;J 1\)
73
4.3.4 Instrumentation
The concentration of potassium chloride was deter
mined by the measurement of electrical conductivity. Cairns
and Prausnitz (92), Hennico et al. (143), Kramers and
Alberda (95) andothers have used similar concentration mea
surement methods in their respective studies. AIso, the
equipment requ ired for accurate, fast and continuous recording
was available from a previous study (25).
4.3.4.1 Ç~~2~~~1~1~~_Ç~!!~
Each conductivity cell consisted of a pair of l-mm.
diameter platinum electrodes embedded in a l-mm. slot of a
cyl indrical body, O.5-cm. diameter x 1.3-cm. long. Each
probe was constructed by immersing a U-bed of platinum wire
of l-mm. diameter x I.2-cm. long, into liquid Epoxy resin
contained in a cylindrical brass mould. The bend was posi
tioned 2-mm. from the end of the mould. The resin setting
was slotted at the U-bend,thus cutting a sharp l-mm. wide by
5-mm. deep gap in the epoxy resin and platinum wire perpen
dicular to its length. In this way, pairs of plane-paraI leI,
circular platinum electrodes of I~. diameter with a gap of
I~. were prepared. Copper leads were soldered to the
platinum wires prior to immersion in the resin.

74
One probe was used at each end of the test section.
At the Tnlet section the probe was attached directly to one ,
of the legs of the liquid distributor so that the entire amount
of liquid emerging from the tube passed between the electrodes.
The conductivity monitoring cell at the outlet was mounted in a
liquid sampler, shown in the lower photograph of Figure 4.5. This
sampler could be moved in all directions, but was positioned at
the centre-line at a distance of O.5-cm. below the supporting
screen. liquid flowed continuously th,rough flexible tygon
tubing (not shown in the photograph) attached to the lower end
of liquid sampler. An adjustable pinch-cock was used to regu1ate
the f10w of liquid to the maximum value consistent with the
complete exclusion of gas flow, as the presence of any gas dis
rupted the monitoring of liquid concentration at the e1ectrodes.
This arrangement for continuous measurement of the concentration
of l-cu.mm. elements of the liquid stream essentially e1iminated
time lags in the determination of the transient response of the
liquid phase.
4.3.4.2 Ç~~~~~!lyi~ï_~~~~~~l~g_~l~f~i~
A basic network, such as illustrated in Figure 4.6,
has been used successful1y by a number of investigators
(22,25,91,92,113) for the continuous measurement of e1ectrica1
conductivity with fast response times. Basical1y the method
involves connectlng a constant-voltage audiorange oscillator
across the electrodes and the resistor 'r ' • If 'ri is chosen
such that its values is small compared to the resistance of

FIGURE 4.5: PHOTOGRAPH OF CONDUCTIVITY MONITORING CEll (lOWER) AND SAMPlERS (UPPER)
75
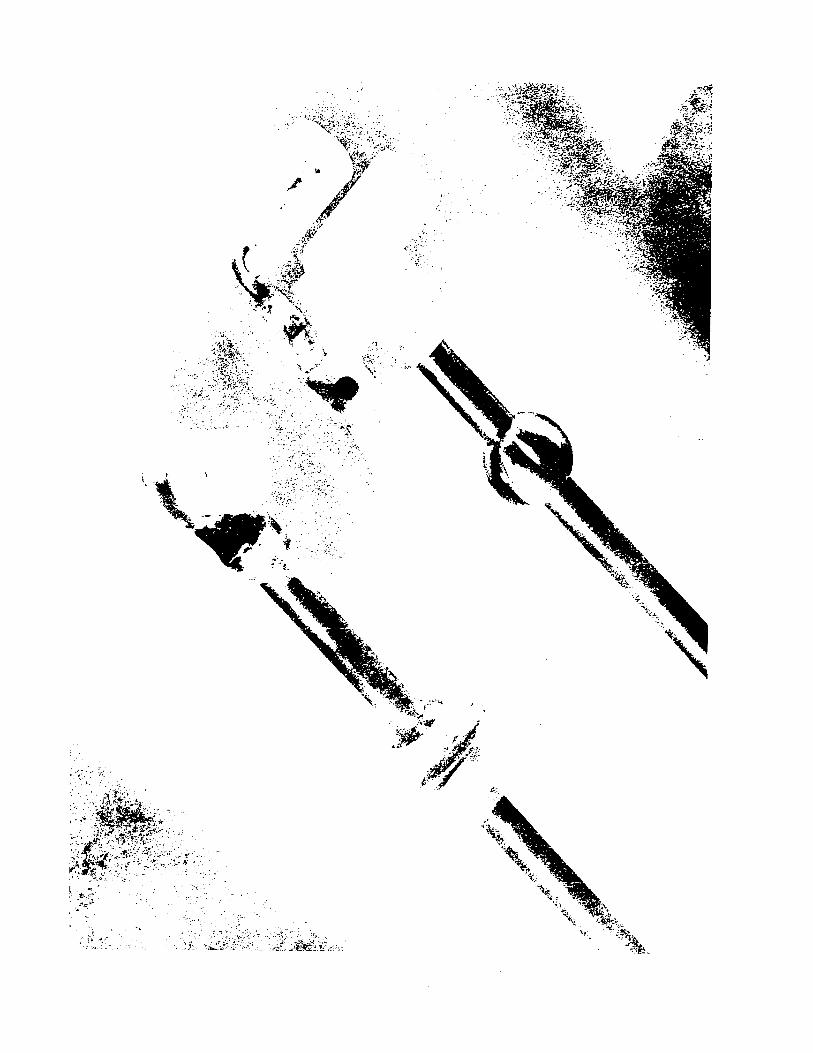
, .... ~
-'.".,,\,
:' "': .~ ~-".'
"1~:1;:'i~~~:; ~~_
, ........ .. ~
,.'

FIGURE 4.6: BASIC ElECTRONIC NETWORK FOR CONDUCTIVITY MEASUREMENTS
--J 0-.
77
the solution, the potential, Vr , across Ir l becomes propor
tional to the current passing through it, and hence prQ
port ional to the conductance of the solution between the
electrodes. POlarization of the electrodes was eliminated
by using the audio range of frequency. For the present
study Ir l was set at 51 ohms which was only 2% of the
smallest value of cell resistance encountered during the
experiments. The voltage Vr , was amplified and demodulated,
thus giving a D.C. voltage directly proportional to the
total conductivity of the solution. The signal from a
reference channel containing an electrode dipped in tap
water was subtracted from that of measuring channels to get
net D.C. voltage signaIs which were proportional to that
part of the conductivity of the solution due to the pre
sence of salt tracer.
The time record of this conditioned signal, be ing
proportional to tracer concentration, provides the basic
data for the mixing analysis. The signal from the cell at
the 1 iquid exit from the bed was recorded digitally on
analog-to-digital data acquisition system, (Dymec Model 20108
made by Hewlett-Packard) which provided two outputs, a
printed record and a punched paper tape. For this purpose
the unit was operated at its fastest speed, i.e. with agate
interval of 0.01 second.

78
The time record of the signal from the conductivity
cell at the liquid inlet to the bed could, however, not be
digitized directly by the data acquisition unit because its
maximum speed was approximately the same as the duration of
the input pulse. This signal was recorded instead with a
1 ight-beam recording oscillograph (a Heiland type, Model 916C
IIVisicorder", made by Honeywell). The signal from the input
event marker was of course fed to both recording systems.
The conditioned signal from the inlet conductivity cell
drove the electromagnetically dampled moving-mirror type
galvanometers which had a sensitivity of 1.2 mv./inch. The
time constant of the system was adjustable by suitable
choice of series and shunt resistors for the galvanometers.
The galvanometers were critically damped 50 that a pulse
as short as 11.4 milliseconds could be reproduced with
amplitude fidelity.
The Visicorder was operated at a chart speed of
5-inches per second and 100 timing lines per inch. The
inlet-pulse record from the Visicorder was digitized manually
and the data punched on computer cards. The complete linear
ity of this system had been establ ished earlier in a test
by Chen (25).
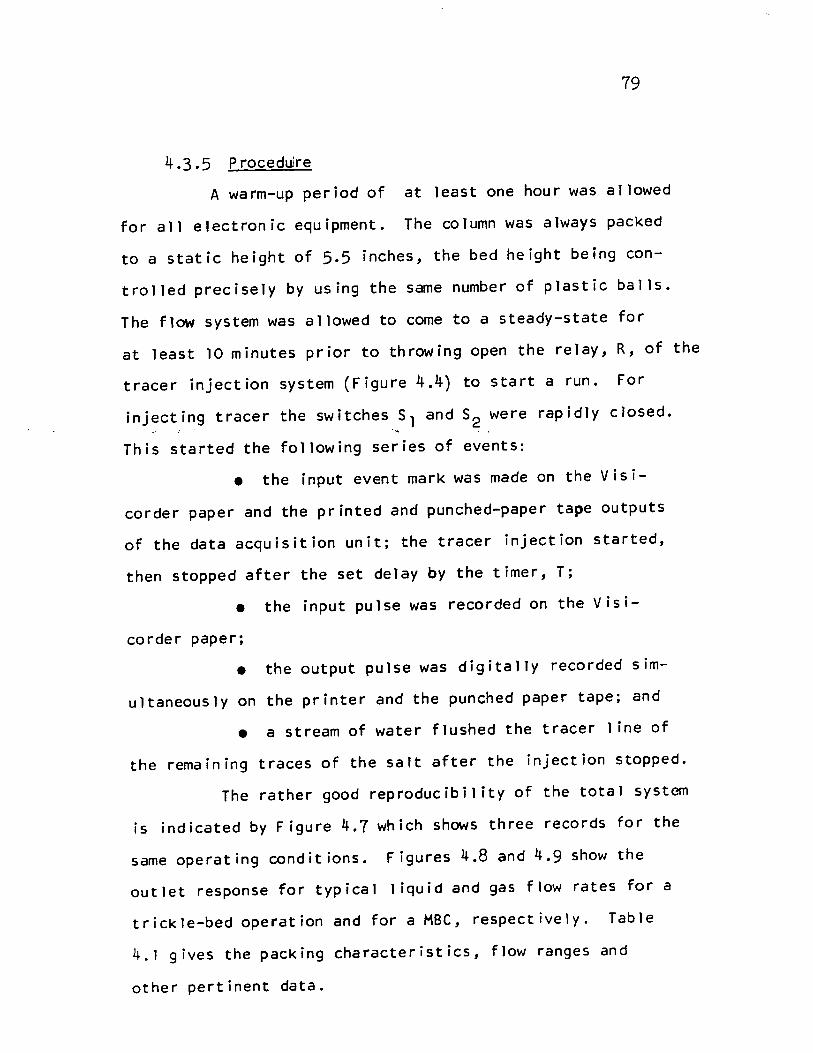
79
4.3.5 Procedure
A warm-up period of at least one hour was allowed
for aIl electronic equipment. The column was always packed
to a static height of 5.5 inches, the bed height being con
trolled precisely by using the same number of plastic balls.
The flow system was allowed to come to a steady-state for
at least 10 minutes prior to throwing open the relay, R, of the
tracer injection system (Figure 4.4) to start a run. For
injecting tracer the switches 51 and 52 were rapidly closed.
This started the following series of events:
• the input event mark was made on the Visi
corder paper and the printed and punched-paper tape outputs
of the data acquisition unit; the tracer injection started,
then stopped after the set delay by the timer, T;
• the input pulse was recorded on the Visi
corder paper;
• the output pulse was digitally recorded sim
ultaneously on the printer and the punched paper tape; and
• a stream of water flushed the tracer l ine of
the remaining traces of the salt after the injection stopped.
The rather good reproducibility of the total system
is indicated by Figure 4.7 which shows three records for the
same operating conditions. Figures 4.8 and 4.9 show the
out let response for typical l iquid and gas flow rates for a
trickle-bed operation and for a MBC, respectively. Table
4.1 gives the packing characteristics, flow ranges and
other pertinent data.
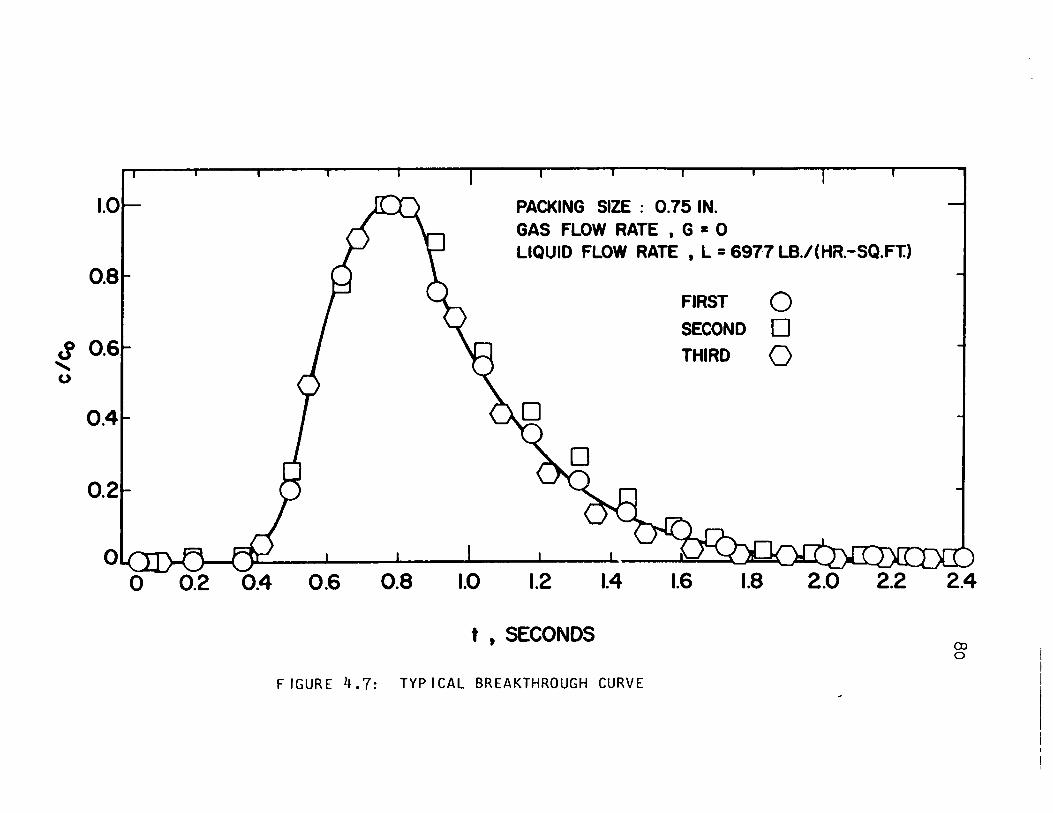
1.0
0.4
0.2 0.4 0.6 0.8
PACKING SIZE : 0.75 IN.
GAS FLOW RATE • G • 0 LlQUID FLOW RATE • L = 6977 LB.I(HR.-SQ.FT.)
1.0 1.2 1.4
t t SECONDS
FIRST 0 SECOND 0 THIRD 0
1.6 1.8 2.0 2.2
FIGURE 4.7: TYPICAL BREAKTHROUGH CURVE
2.4
Q) o

o ~ u
0.8
0.4
0.2
PACKING SIZE : 0.75 IN. GAS FLOW RATE tG· 0
LIQUID FLOW RATE
L LB./(HR:-SQ.FT.) SYMBOL
3944 15319
20856
o o 6
o 1 I.LA r-r-1 fT :, d'j,=-t.J:( ~ ,. ~, al '-.5
0.2 0.6 1.8
t t SECONDS FIGURE 4.8: VAR IATION OF PULSE RESPONSE WITH LIQUIO
FLOW RATE FOR FIXEO BEO OPERATION
(X)
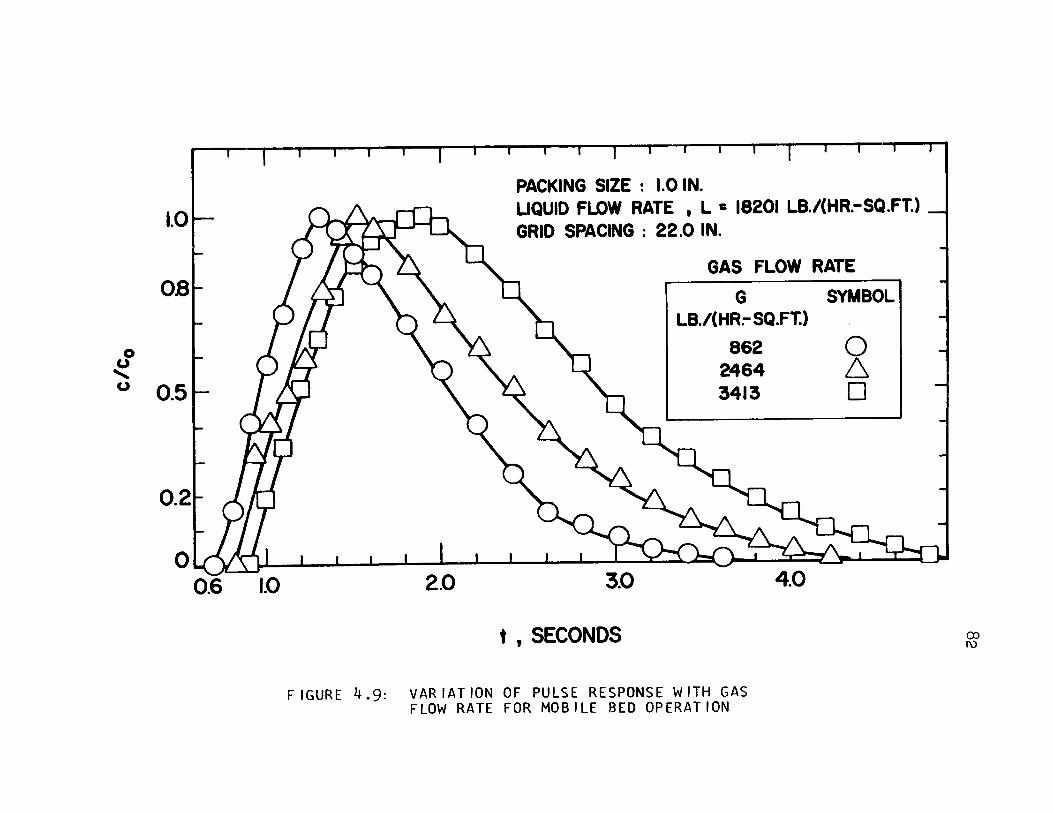
o u
" u
1.0
OB
0.5
0.2
o '-.../c.-..r.....J
0.6 1.0
PACKING SIZE : 1.0 IN. UQUID FLOW RATE • L 1: 18201 LB./(HR.-SQ.FT.) GRID SPACING : 22.0 IN.
GAS FLOW RATE
G SYMBOL
t , SECONDS
LB.I(HR.- SQ.FT.)
862 2464 3413
FIGURE 4.9: VARIATION OF PULSE RESPONSE WITH GAS FLOW RATE FOR MOBILE BED OPERATION
o 6 D
(X) 1\)
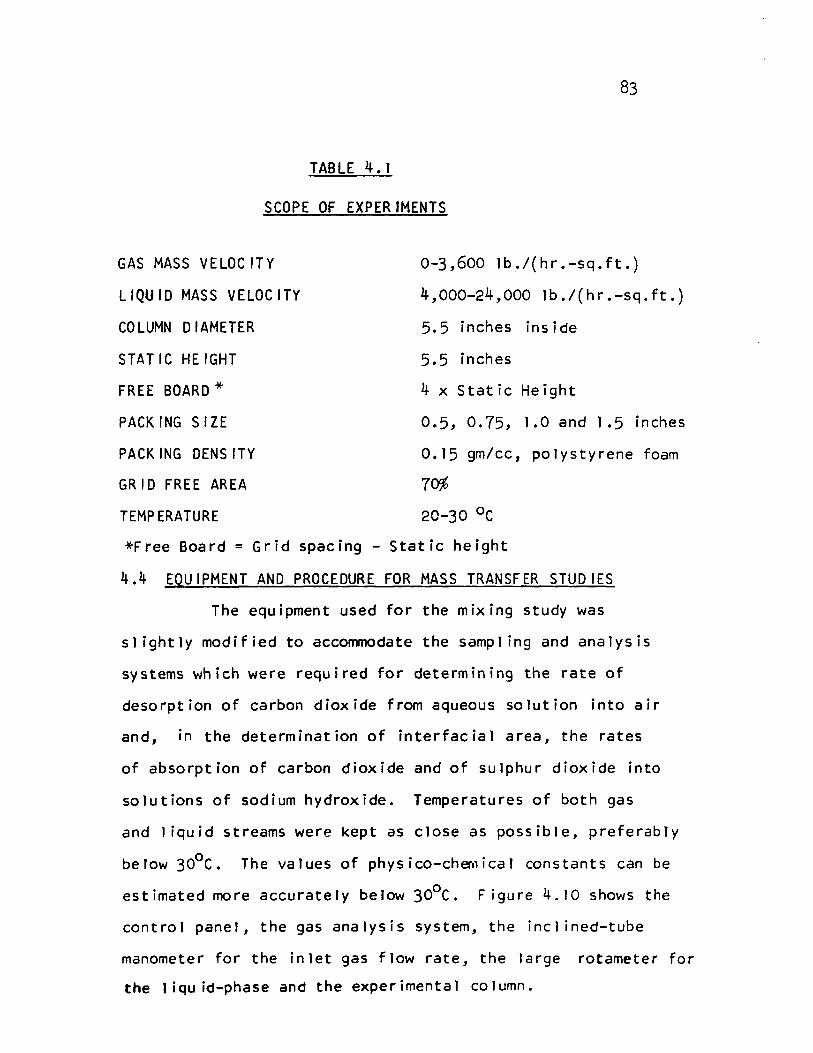
83
TABLE 4.1
SCOPE OF EXPERIMENTS
GAS MASS VELOCITY
LIQUID MASS VELOCITY
CO LUMN D 1 AMETER
STATIC HEIGHT
FREE BOARD * PACKING SIZE
PACKING DENSITY
GRID FREE AREA
TEMPERATURE
0-3,600 Ib./(hr.-sq.ft.)
4,000-24,000 lb./(hr.-sq.ft.)
5.5 inches inside
5.5 inches
4 x Static Height
0.5, 0.75, 1.0 and 1.5 inches
0.15 gm/cc, polystyrene foam
70% 20-30 Oc
*Free Board = Grid spacing - Static height
4.4 EQUIPMENT AND PROCEDURE FOR MASS TRANSFER STUDIES
The equipment used for the mixing study was
sI ightly modified to accommodate the sampI ing and analysis
systems which were required for determining the rate of
desorption of carbon dioxide from aqueous solution into air
and, in the determination of interfacial area, the rates
of absorption of carbon dioxide and of sulphur dioxide into
solutions of sodium hydroxide. Temperatures of both gas
and liquid streams were kept as close as possible, preferably
below 30oC. The values of physico-ch~lical constants can be
est imated more accurately below 30oC. Figure 4.10 sho ... ,s the
control panel, the gas analysis system, the incl ined-tube
manometer for the inlet gas flow rate, the large rotameter for
the tiqu id-phase and the experimental column.
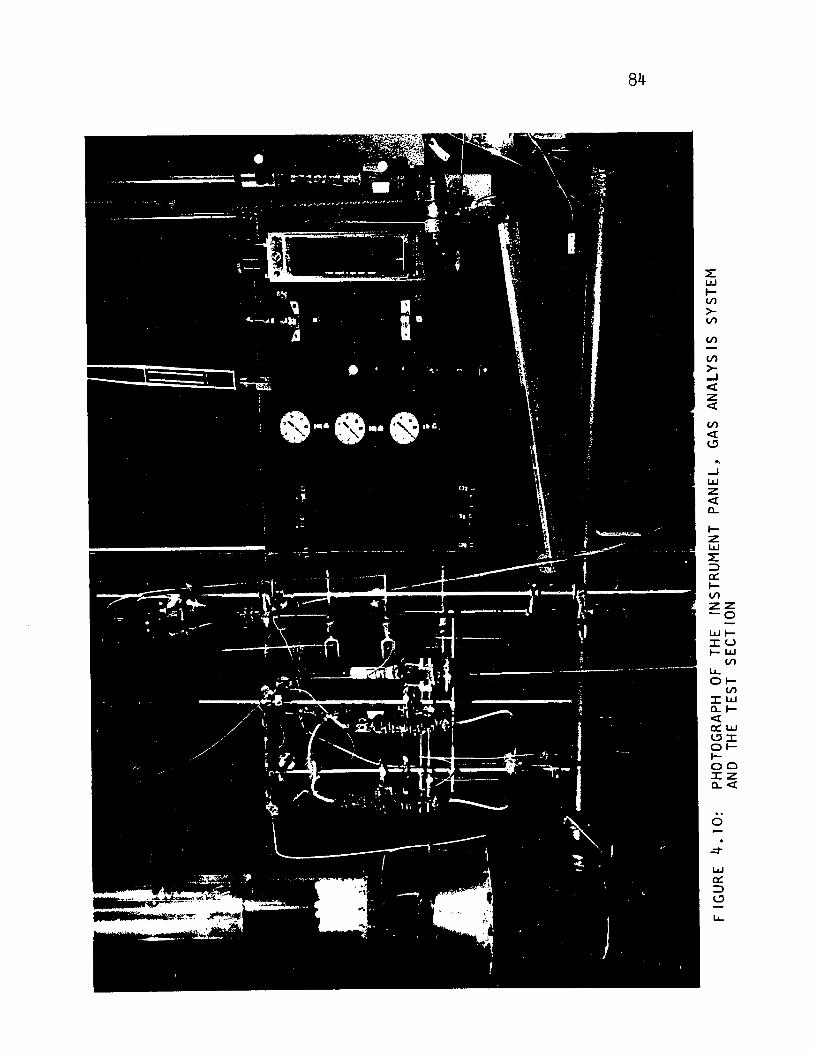
84
~ LLJ lV')
>V')
V')
V')
>-' « Z « V')
« <.!l
-J LLJ Z « a.. 1-Z LLJ ~ => a: l-V')
ZZ -0
LLJIIU I-UJ
V')
lL. 01-
V')
ILLJ a.. 1-« a:LLJ <.!lI 01-1-00 IZ a..«
o
.' ,~
'''''<WT; .'
\~~~_;i..R>_~;i."';"'~< ... """ ...
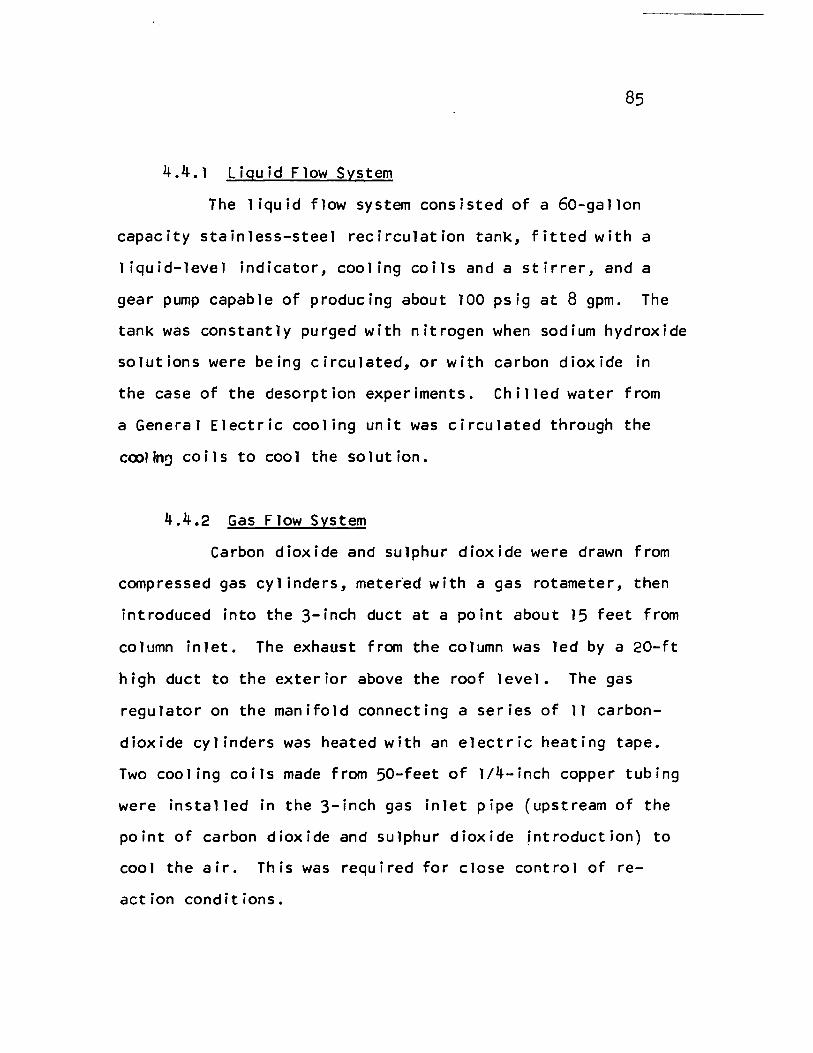
85
4.4.1 Liguid Flow System
The liquid flow system consisted of a 60-gallon
capacity stainless-steel recirculation tank, fitted with a
liquid-level indicator, cooling coils and a stirrer, and a
gear pump capable of producing about 100 psig at 8 gpm. The
tank was constantly purged with nitrogen when sodium hydroxide
solutions were being circulated, or with carbon dioxide in
the case of the desorption experiments. Chilled water from
a General Electric cooling unit was circulated through the
cool in~ co ils to coo 1 the so 1 ut ion.
4.4.2 Gas Flow System
Carbon dioxide and sulphur dioxide were drawn from
camp ressed gas cy 1 i nders, meter"ed w i th agas rotamete r, then
introduced into the 3-inch duct at a point about 15 feet from
column inlet. The exhaust from the column was led by a 20-ft
high duct to the exterior above the roof level. The gas
regulator on the manifold connecting a series of 11 carbon
dioxide cylinders was heated with an electric heating tape.
Two cooling coils made fram 50-feet of 1/4-inch copper tubing
were installed in the 3-inch gas inlet pipe (upstream of the
point of carbon dioxide and sulphur dioxide ~ntroduction) to
cool the air. This was required for close control of re
action conditions.
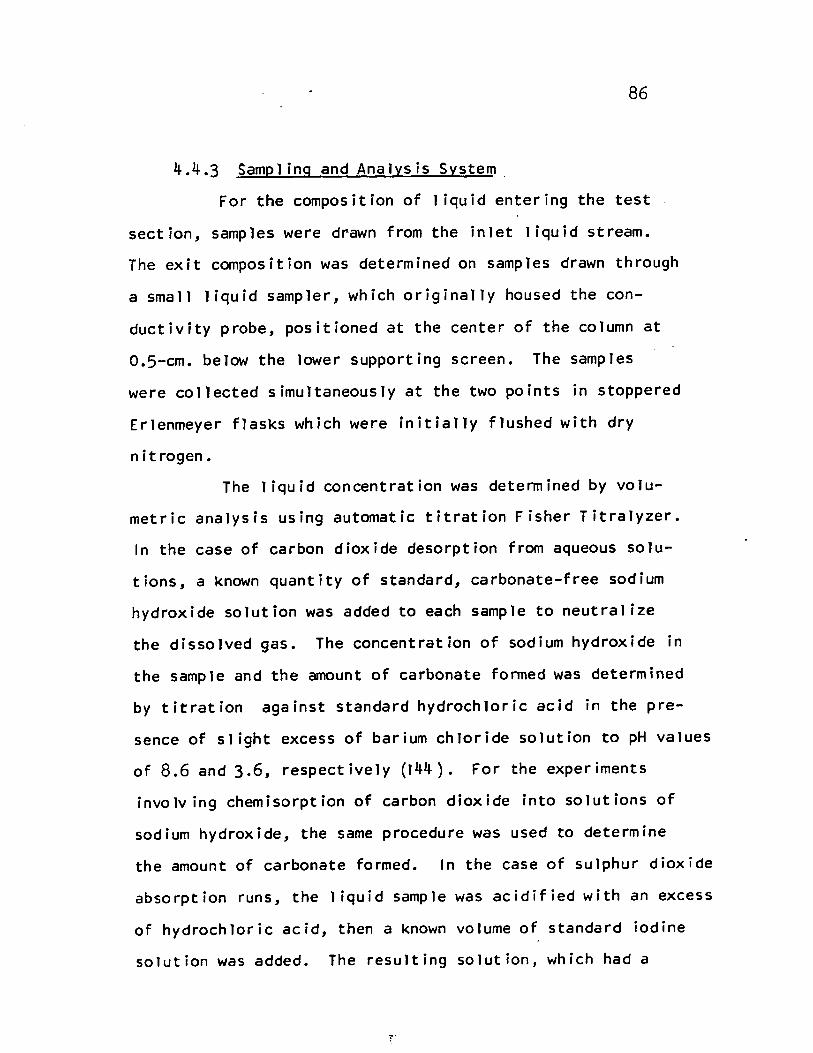
86
4.4.3 Sampling and Analysis System.
For the composition of liquid entering the test
section, samples were drawn from the inlet liquid stream.
The exit composition was determined on samples drawn through
a small liquid sampler, which originally housed the con
ductivity probe, positioned at the center of the column at
O.S-cm. below the lower supporting screen. The samples
were collected simultaneously at the two points in stoppered
Erlenmeyer flasks which were initially flushed with dry
nitrogen.
The liquid concentration was determined by volu-
metrie analysis using automatic titration Fisher Titralyzer.
ln the case of carbon dioxide desorption from aqueous solu
tions, a known quantity of standard, carbonate-free sodium
hydroxide solution was added to each sample to neutralize
the dissolved gas. The concentration of sodium hydroxide in
the sample and the amount of carbonate formed was determined
by titration against standard hydrochloric acid in the pre
sence of slight excess of barium chloride solution to pH values
of 8.6 and 3.6, respectively (144). For the experiments
involv ing chemisorption of carbon dioxide into solutions of
sodium hydroxide, the same procedure was used to determine
the amount of carbonate formed. In the case of sulphur dioxide
absorption runs, the liquid sample was acidified with an excess
of hydrochloric acid, then a known volume of standard iodine
solution was added. The resulting solution, which had a
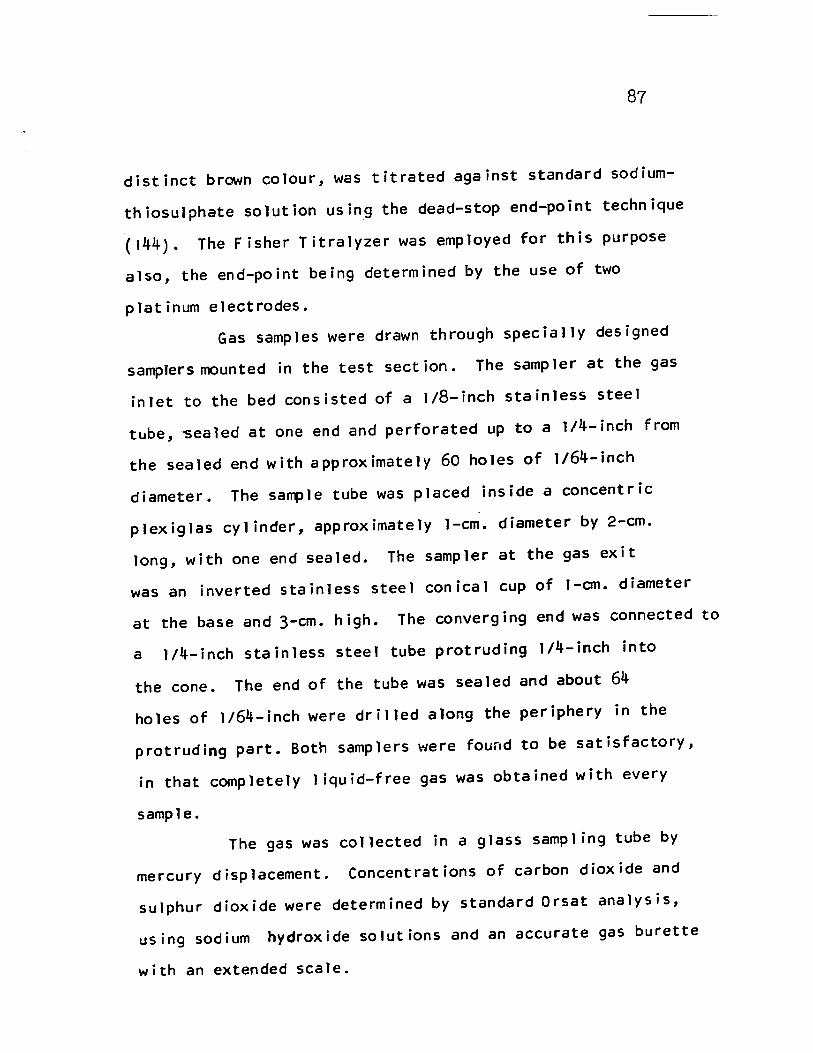
87
distinct brown colour, was titrated against standard sodium
thiosulphate solution using the dead-stop end-point technique
(144). The Fisher Titralyzer was employed for this purpose
also, the end-point being determined by the use of two
platinum electrodes.
Gas samples were drawn through specially designed
samplers mounted in the test section. The sampler at the gas
inlet to the bed consisted of a 1/8-inch stainless steel
tube, ~ealed at one end and perforated up to a 1/4-inch from
the sealed end with approximately 60 holes of 1/64-inch
diameter. The sample tube was placed inside a concentric
plexiglas cyl inder, approximately l-cm. diameter by 2-cm.
long, with one end sealed. The sampler at the gas exit
was an inverted stainless steel conical cup of l-cm. diameter
at the base and 3-cm. high. The converging end was connected to
a l/4-inch stainless steel tube protruding 1/4-inch into
the cone. The end of the tube was sealed and about 64
holes of 1/64-inch were drilled along the periphery in the
protruding part. Both samplers were found to be satisfactory,
in that completely 1 iquid-free gas was obtained with every
sample.
The gas was collected in a glass sampling tube by
mercury displacement. Concentrations of carbon dioxide and
sulphur dioxide were determined by standard Orsat analysis,
using sodium hydroxide solutions and an accurate gas burette
with an extended scale.
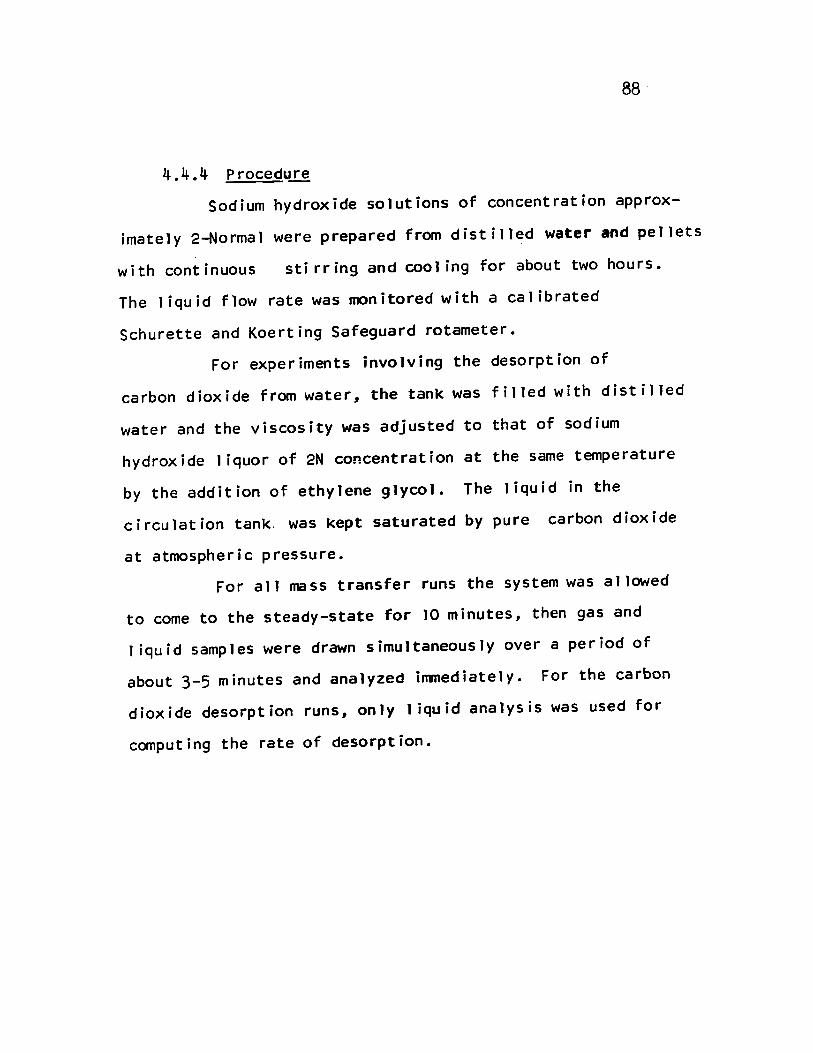
4.4.4 Procedu~
Sodium hydroxide solutions of concentration approx-
imately 2-Normal were prepared from distilled water and pellets
with continuous stirring and cool ing for about two hours.
The liquid flow rate was monitored with a calibrated
Schurette and Koerting Safeguard rotameter.
For experiments involving the desorption of
carbon dioxide from water, the tank was filled with distilled
water and the viscosity was adjusted to that of sodium
hydroxide liquor of 2N concentration at the same temperature
by the addition of ethylene glycol. The liquid in the
circulation tank. was kept saturated by pure carbon dioxide
at atmospheric pressure.
For aIl mass transfer runs the system was allowed
to come to the steady-state for 10 minutes, then gas and
1 iquid samples were drawn simultaneously over a period of
about 3-5 minutes and analyzed immediately. For the carbon
dioxide desorption runs, only liquid analysis was used for
computing the rate of desorption.
v. CORRELATION OF EXPERIMENTAL DATA AND DISCUSSION OF RESUlTS
89
The results are grouped in two basic categ9ries:
1. ~rodynamic Effects. liquid holdup and axial
dispersion of the liquid, both determined by the impulse testing
transient response technique, and expansion of the mobile bed,
determined visually in the present study.
2. Mass Transfer Effects. True 1 iquid-phase mass
transfer coefficients i.e. with axial mixing appropriately
allowed for, and the effective interfacial area of mass transfer.
5.1 HYDRODYNAMIC EFFECTS
The complex interaction between the sOlid, liquid
and gas phases, aIl of which are in quite vigorous motion in
mobile-bed contacting, determine the physical behaviour of MBC,
including such measures as the degree of mixing and the holdup
of each fluid phase, the bed expansion and the pressure drop.
Although complicated by the additional presence of a down
flowof liquid, MBC operation is somewhat analogous to agas
fluidized bed. Based on the experience from that operation, the
minimum fluidization velocity, Gmf , at which the bed just begins
to expand From the static condition has been used also as an
important correlating variable for MBC. The results for
minimum fluidization velocity will be presented first as this
90
variable enters into subsequent correlations. The results
follow for bed expansion, which is correlated in terms of
minimum fluidization velocity. The bed-height correlation
is in turn required for the normalization of 1 iquid holdup
data with respect to bed volume. Presentat ion of various
hydrodynamic effects concludes with correlation of the data
on axial mixing in the liquid phase.
5.1.1 Minimum Fluidization Velocity
The previous work of Chen (25,29) has established the
method of determining the minimum fluidization velocity for
mobile-bed contacting by extrapolation of the linear relation
ship between bed height and gas mass velocity to the limiting
value of the static bed height. Likewise, the similarities
and differences between mobile-bed contacting and the mu ch
more thoroughly studied operation, fluidization with a single
fluid phase has been treated fully in the works noted above.
The new data from the present study have been obtained following
the pattern set by Chen, and may therefore be presented without
reviewing in detail the just ification for the treatment used.
The new data for height of a mobile bed are reported
in full in Appendix 1.1, Table III. As before, a least squares
straight-line fit to the data for bed height as a function of
gas velocity gives the value of minimum fluidization velocity,
Gmf , the extrapolated value of G which corresponds to the static
bed height, hs. The height of the expanded bed was determined
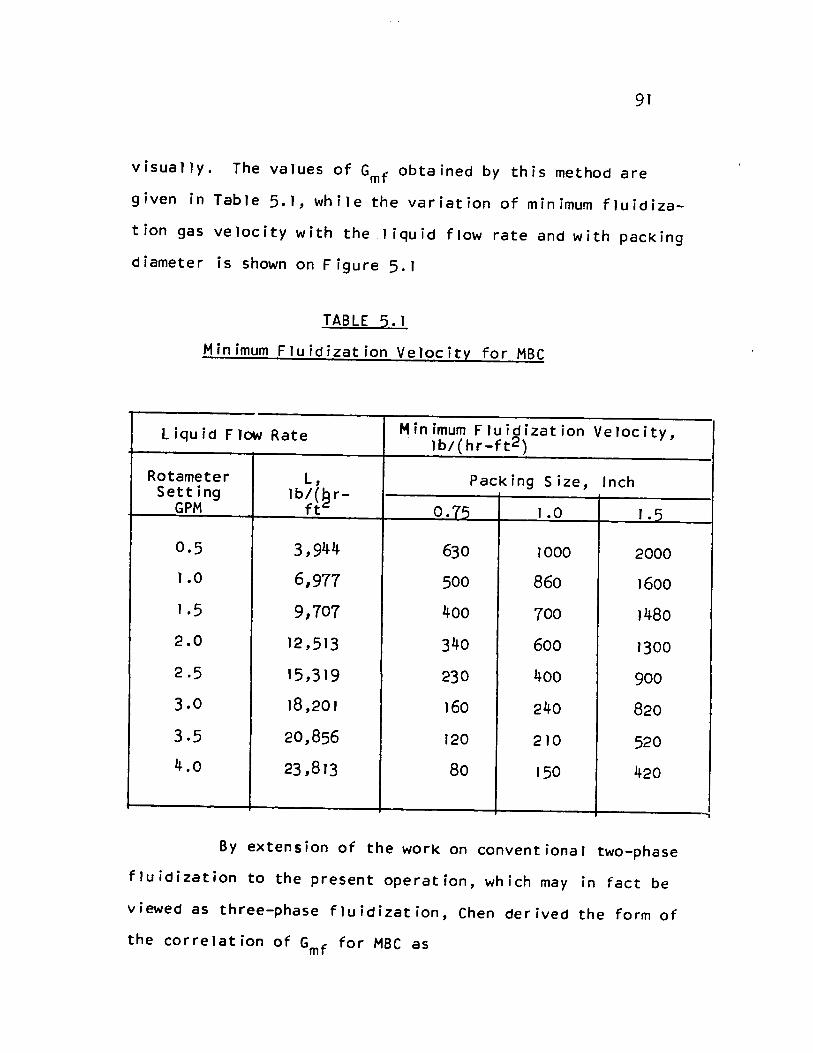
91
visually. The values of Gmf obtained by this method are
given in Table 5.1, while the variation of minimum fluidiza
tion gas velocity with theliquid flow rate and with packing
diameter is shown on Figure 5.1
TABLE 5.1
Minimum Fluidization Velocity for MBC
Liquid Flow Rate Minimum Fluidization Velocity, lb/(hr-ft2)
Rotameter L, Packing Size, Inch Sett ing Ib/(ê r -
0.75 1.5 GPM ft 1.0
0.5 3,944 630 1000 2000
1.0 6,977 500 860 1600
1.5 9,707 400 700 1480
2.0 12,513 340 600 1300
2.5 15,319 230 400 900
3.0 18,201 160 240 820
3.5 20,856 120 210 520
4.0 23,813 80 150 420
By extension of the work on conventional two-phase
fluidization to the present operation, which may in fact be
viewed as three-phase fluidization, Chen derived the form of
the correlation of Gmf for MBC as
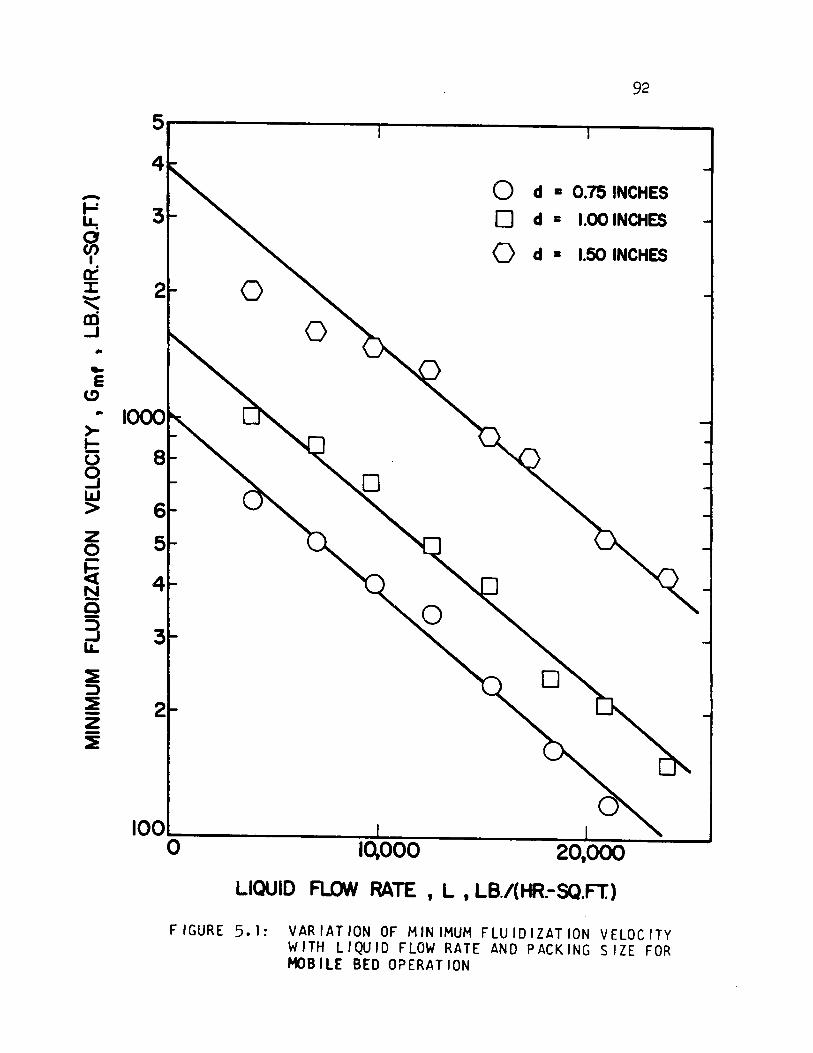
-.-= ~ a (J) 1 a::
:I:
"' ai ...J
,. ~
E (!)
>-t:: 0
9 lAJ > z 0
fi N ë5 3 1L.
:E :::> ~ z :i
92
5----------------------------------__ ------__ _
0 d • 0.75 INCH ES 3 0 d 1: 1.00 INCHES
0 d • 1.50 INCH ES
0
0
8
6
5
2
IOO~------------~~----------~ __ --~~ o 10,000 20,000
LIQUID FLDN RATE , L , LB./(HR.-SQ.FT.)
FIGURE 5.1: VARIATION OF MINIMUM FLUIDIZATION VELOCITV WITH LIQUID FLOW RATE AND PACKING SIZE FOR MOBILE BEO OPERATION
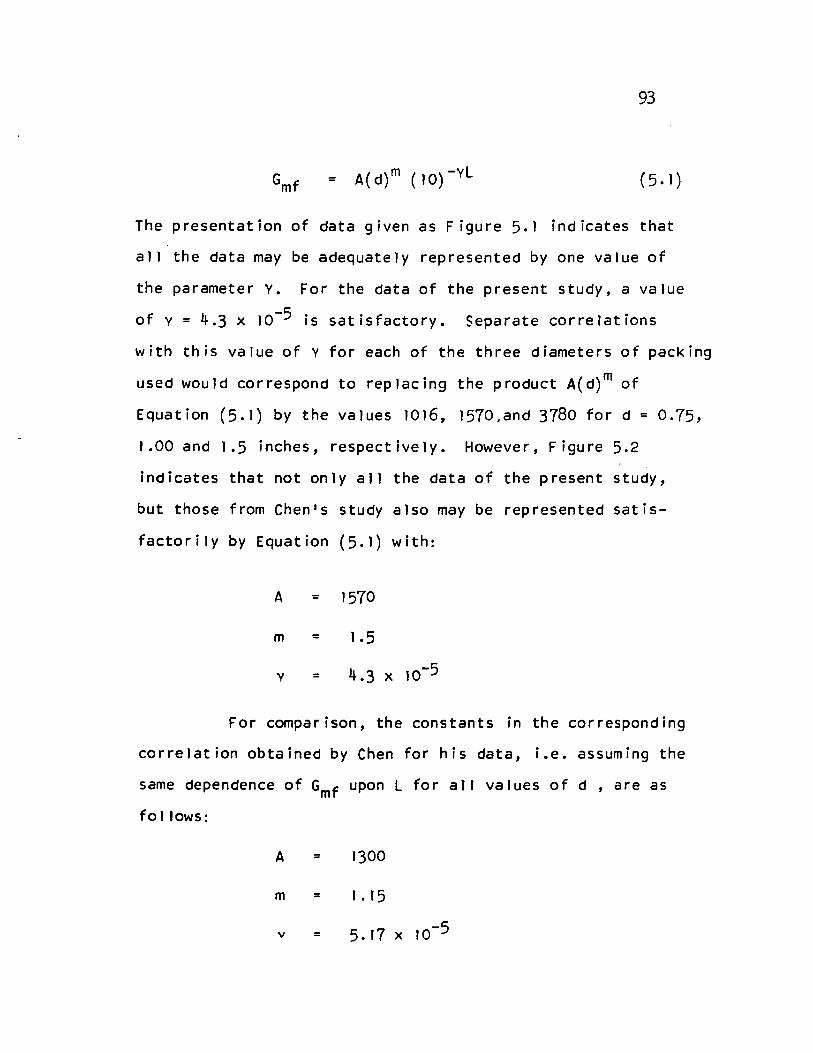
93
( 5. 1 )
The p resentat ion of data 9 iven as F i gu re 5. 1 i nd icates that
aIl the data may be adequately represented by one value of
the parameter Y. For the data of the present study, a value
of y = 4.3 x 10⁻⁵ is satisfactory. Separate correlations
with this value of y for each of the three diameters of packing
used would correspond to replacing the product A(d)m of
Equation (5.1) by the values 1016, 1570,and 3780 for d = 0.75,
1.00 and 1.5 inches, respectively. However, Figure 5.2
indicates that not only aIl the data of the present study,
but those from Chen's study also may be represented satis
factorily by Equation (5.1) with:
A = 1570
m =
y =
For comparison, the constants in the corresponding
correlation obtained by Chen for his data, i.e. assuming the
same dependence of Gmf upon L for aIl values of d , are as
follows:
A = 1300
m = J. 15
v = 5.17 x 10⁻⁵
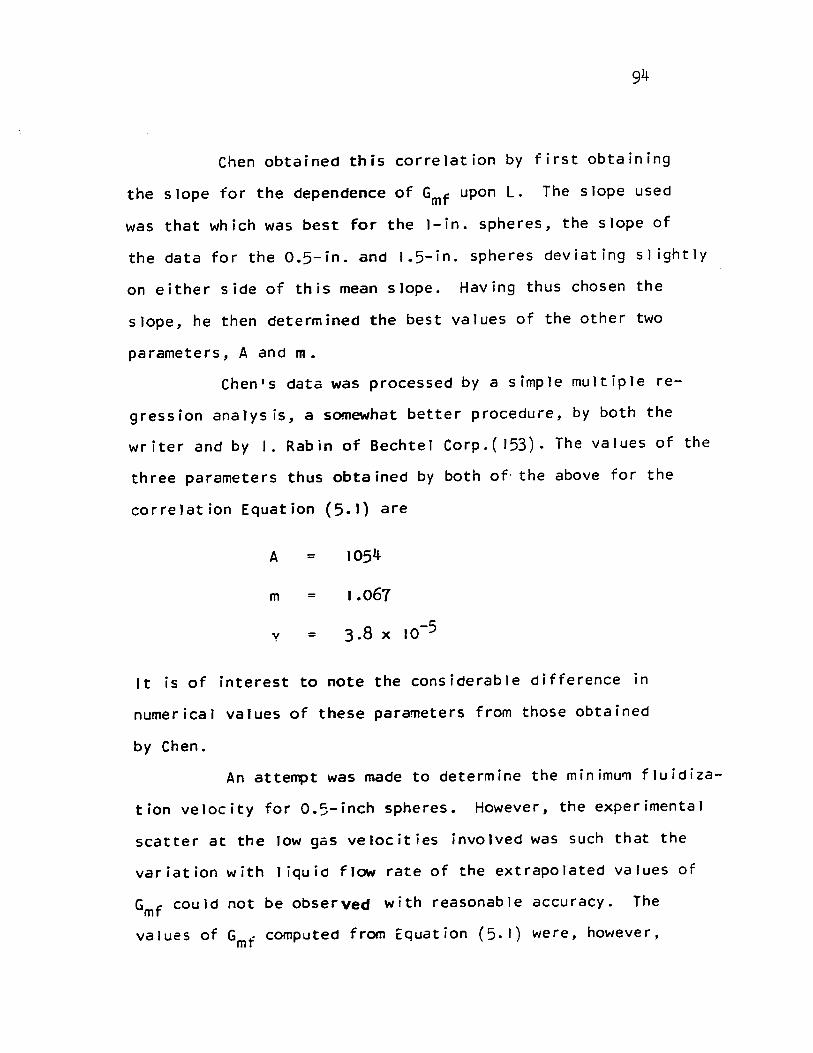
94
Chen obtained this correlation by first obtaining
the slope for the dependence of Gmf upon L. The slope used
was that which was best for the l-in. spheres, the slope of
the data for the 0.5-in. and 1.5-in. spheres deviating 51 ightly
on either side of this mean slope. Having thus chosen the
slope, he then determined the best values of the other two
parameters, A and m.
Chen's data was processed by a simple multiple re
gression analys is, a somewhat better procedure, by both the
writer and by 1. Rabin of Bechtel Corp.( 153). The values of the
three parameters thus obtained by both of· the above for the
correlation Equation (5.1) are
A
m
y
=
=
=
1054
1.061
3.8 x 10⁻⁵
It is of interest to note the considerable difference in
numerical values of these parameters from those obtained
by Chen.
An attempt was made to determine the minimum fluidiza
tion velocity for 0.5-inch spheres. However, the experimental
scatter at the low gas velocities involved was such that the
variation with 1 iquid flow rate of the extrapolated values of
Gmf could not be observed with reasonable accuracy. The
values of Gmf computed from Equation (5.1) were, however,
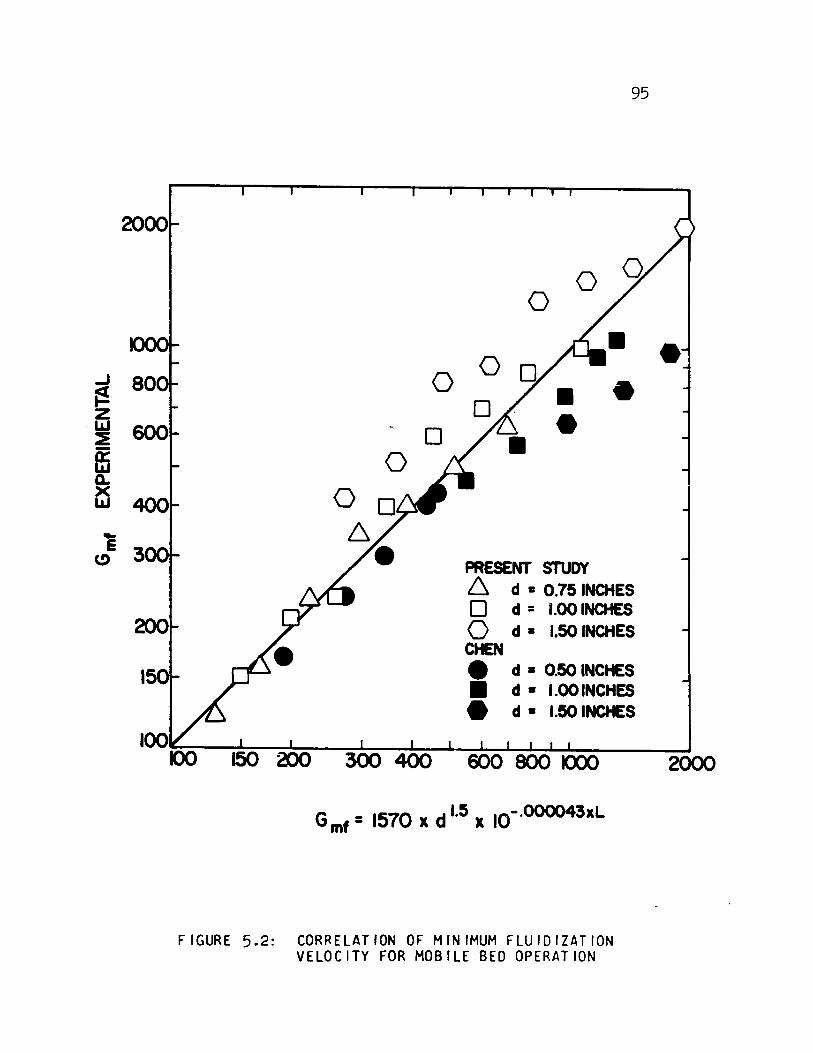
-' ~ Z LLJ :E
ffi a.. x LLJ
o
95
o o
o 0 • • • o
PRESENT STUDY 6 d· 0.75 INCHES o d = 1.00 INCHES o d· 1.50 INCH ES
CHEN • d· 0.50 INCHES • d· 1.00 INCHES • d· 1.50 INCIES
FIGURE 5.2: CORRELATION OF MINIMUM FLUIOIZATION VELOCITY FOR MOBILE BEO OPERATION
2000

96
judged to be sufficiently close to the experimental data that
this correlation could be used where necessary for the
evaluation of Gmf for O.5-inch spheres.
As the column diameter in the present study was
one-half that used by Chen, the new data for small packing
are expected to be the closest to those of Chen. Thus the
O.75-inch packing of the present study corresponds to about
the same ratio of d/dt as the 1.5-inch packing of Chen. It
may be seen from Figure 5.2 that the results for O.75-inch ~ -.
spheres are indistinguishable from Chen's results, while
those for 1.5-inch spheres diverge significantly. This
behaviour provides strong indication of the presence of wall
effect even for the relatively stationary condition at incipient
fluidization.
5.1.2 Bed Expansion in Mobile-Bed Contacting
ln the correlation of results for holdup, mixing,
mass transfer and interfacial area it is essential to know the
true height of the bed. As it is evident that bed height is
also one of the important variables in design, a correlation
was sought for the data obtained on bed expansion.
As bed height was found by Chen and again in the
present study (Section 5.1.1) to increase 1 Înearly with the
gas flow rate, the fOllowing statements may be made:
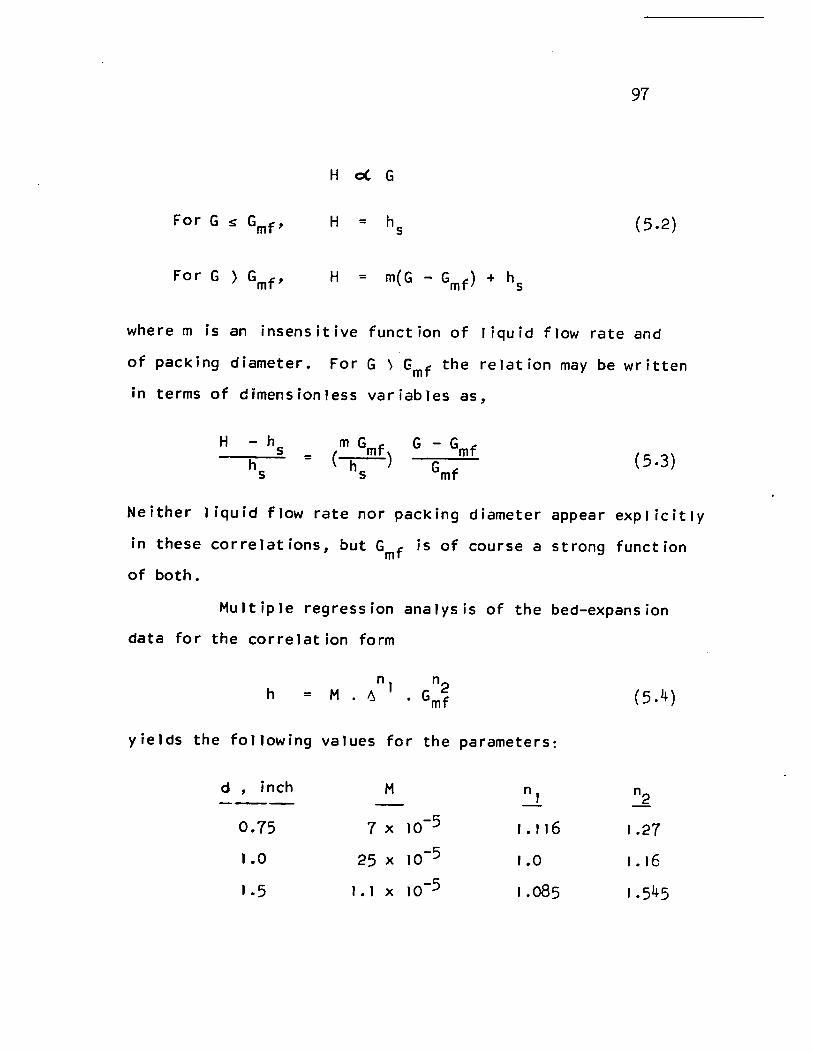
97
H c:( G
H = (5.2)
Fo r G ) Gmf , H =
where m is an insensitive function of liquid flow rate and
of packing diameter. For G ~ Gmf the relation may be written
in terms of dimensionless variables as,
H - h s = (5.3)
Neither 1 iquid flow rate nor packing diameter appear explicitly
in these correlations, but Gmf is of course a strong function
of both.
Multiple regression analysis of the bed-expansion
data for the correlation form
h = M • 6 ni
(5. 4 )
yields the fOllowing values for the parameters:
d , inch M n, n2 -----0.75 7 x 10⁻⁵ 1 . 1 16 1.27
1 .0 25 x 10-5 1.0 1. 16
1.5 1.1 x 10⁻⁵ 1.085 1.545
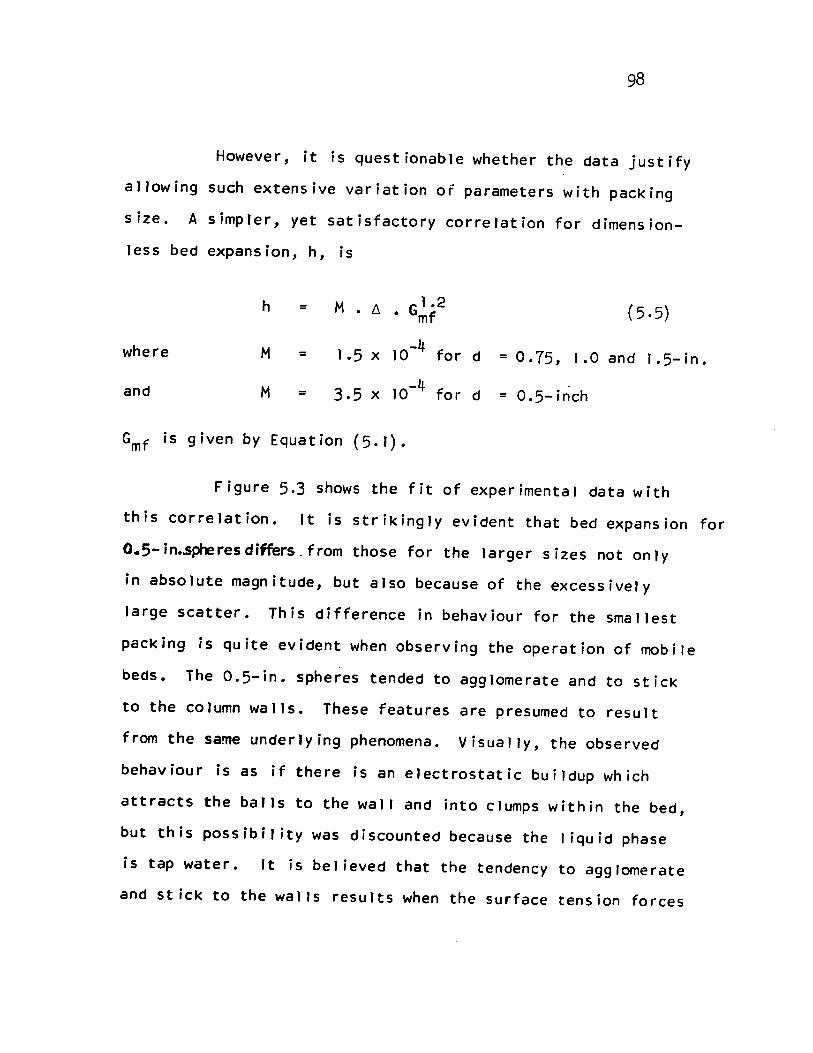
98
However, it is questionable whether the data justify
allowing such extensive variation of parameters with packing
size. A simpler, yet satisfactory correlation for dimension-
less bed expansion, h, is
h = M . 6, G1.2 (5.5) • mf
where M = 1.5 x 10⁻⁴ for d = 0.75, 1.0 and 1 .5- in.
and M = 3.5 x 10⁻⁴ for d = 0.5-inch
Gmf is given by Equation (5.1).
Figure 5.3 shows the fit of experimental data with
this correlation. It is strikingly evident that bed expansion for
O.5-in • .spheresdiffers.from those for the larger sizes not only
in absolute magnitude, but also because of the excessively
large scatter. This difference in behaviour for the smallest
packing is quite evident when observing the operation of mobile
beds. The 0.5-in. spheres tended to agglomerate and to stick
to the column walls. These features are presumed to result
from the same underlying phenomena. Visually, the observed
behaviour is as if there is an electrostatic buildup which
attracts the balls to the wall and into clumps within the bed,
but this possibility was discounted because the liquid phase
i s tap water. 1 t i s be 1 i eved that the tendency to agg lome rate
and st ick to the walls results when the surface tension forces
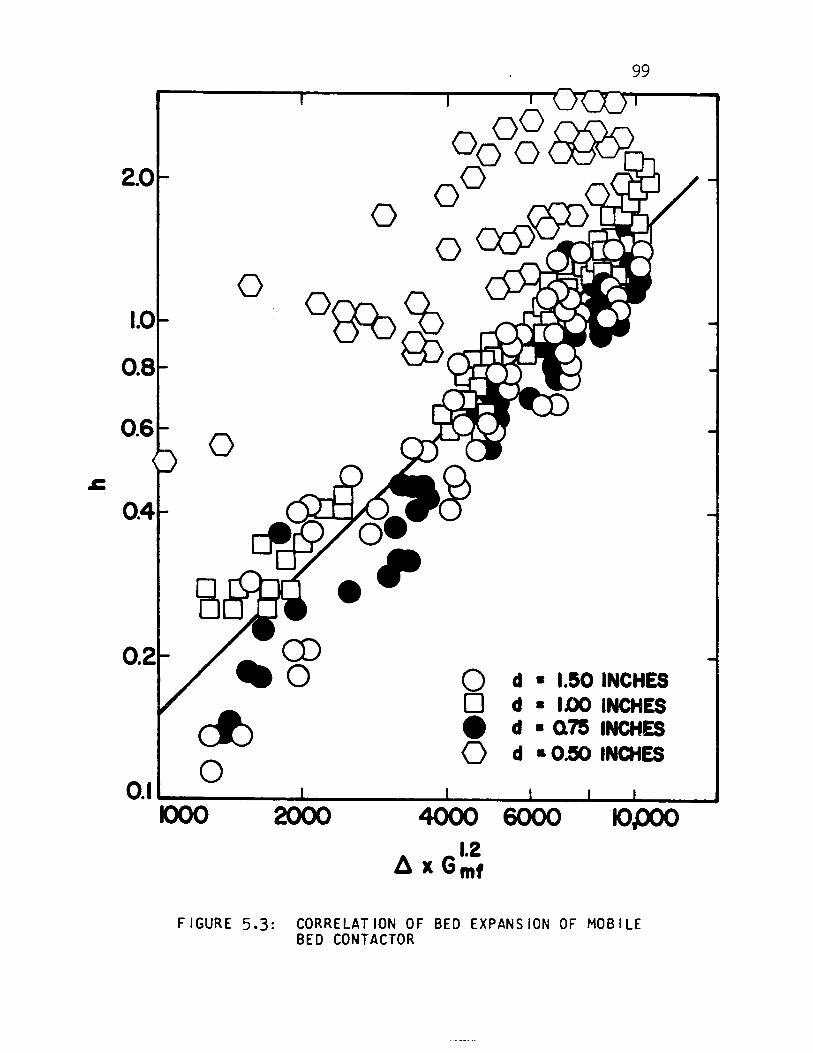
2.0
1
0.8
o
99
o
o
o. _~ o d· 1.50 INCHES
~ o d· 100 INCHES e d· Q7S INCHES o d· O~ IN04ES o 0.1 ~ ___ ---L. ____ ~ __ ..I..-_"-~_----I
1000 2000 4000 6000
A GI.2 ~ x mf
10,000
FIGURE 5.3: CORRELATION OF BEO EXPANSION OF MOBILE BEO CONTACTOR
100
in the packing~ater-packing regions of contact become
comparable to the weight of the sphere. Spheres only 0.5-in.
diameter, of density 0.15 gm/cc, weigh only 1.29 gm. This
tendency to stick together and to the column walls became
much less pronounced at higher 1 iquid flow rates. The
additional l iquid loading on each baIl at higher 1 iquid rates
would reduce the relative importance of surface tension forces
at aIl liquid-solid interfaces. The packing of large dimen
sions neither displayed this phenomenon nor gave larger than
normal scatter in bed expansion, as may be seen from Figure
5.3. It is for this reason that the results for 0.5-in.
packing are excluded from the general correlation given above.
It is .apparent from the scatter of the 0.5-in. data that the
constant given for the correlating Equation (5.5) for this
packing can indicate nothing more than an order-of-magnitude
value of bed expansion.
The correlation for the data of the present study
is compared on Figure 5.4 with the data of both Chen (25)
and Blyakher et al. 050). Chen presented no correlation of
his extensive observations of bed height; a straight 1 ine has
been drawn through his data for the ease of comparison with the
present correlation. The correlation of Chen's data is lower
by 30 to 40% than that obtained in the present study. However,
a comparison of Figures 5.3 and 5.4 indicates that the scatter
of each set of data around the corresponding correlation
(excluding the data of the present study for 0.5-in. packing)
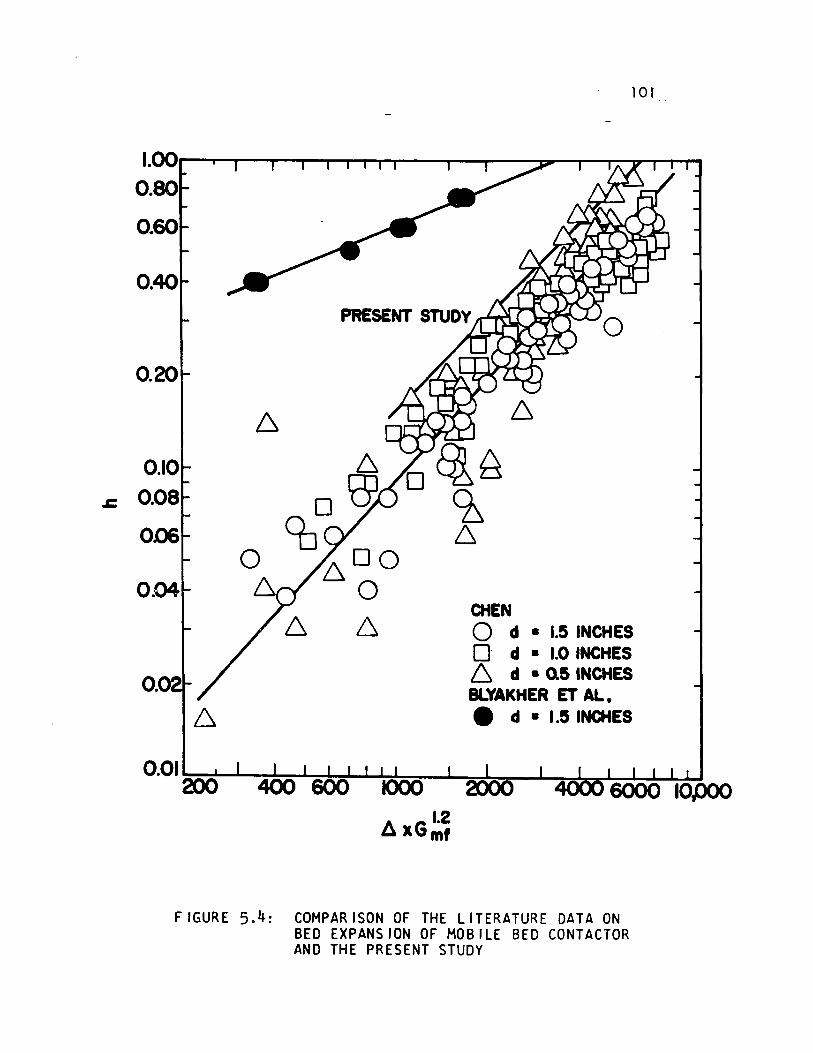
oC
0.40
o
Cb DO 6
0 6
L2 âXGmf
101
CHEN o d • 1.5 INCHES o d· 1.0 INCHES 6 d· Q5 INCHES BLYAKHER ET AL. • d • 1.5INCHES
FIGURE 5.4: COMPARISON OF THE LITERATURE DATA ON SEO EXPANSION OF MOBILE BED CONTACTOR AND THE PRESENT STUDY
102
is in fact somewhat greater than the difference between the
correlations. In spite of the considerable degree of overlap
for the data from the two studies, the fact that the correlation
of Chen's data is appreciably lower may at least in part be
due to the use of a different criterion in the measurement of
bed expansion. The problem is complicated because of the fact
that bed height is far from uniform across the cross-section
at any instant, and it fluctuates between maximum and minimum
heights. The height reported is the average of the maxima in
bed height, time averaged over 5 minutes of observation. In
fact, a pointer mounted on the side of the column was adjusted
to correspond to average height of the top of the fluctuating
bed across the entire cross-section. The height of the pointer
recorded was based on 5 minutes of observation at steady-state
conditions. Chen (25) notes that he averaged the bed height
over a period of not less than 30 seconds. As both criteria
are subjective and the fluctuation of bed height is quite large,
appreciable differences between observers may be expected. Use
of a quantitative criterion based on statistical fluctuations
in true bed height would be preferable, but such must be based
on some instrumental method of determining height of the mobile
bed, as the visual method is inadequate.
The only other published data for bed expansion for
the three-phase mobile-bed type of operation are those of
Blyakher et al. (150). They correlated their data in the
alternate form
103
H = ~
1.17 + A (G - Gmf ) 1.25 (5.6)
in which A is a coefficient which is dependent upon the liquid
loading. However, the main interest in their work is not the
alternate form of correlation, but the fact that their results,
expressed as dimensionless bed expansion, h, are larger by a
factor of from 3 to 15 than the results of Chen or of the
present study. This difference appears to be due to differences
in the criteria used for bed height, large differences in the
grid which supports the bed, and packing density.
The criterion probably used by Blyakher et al. is the
maximum height attained at any point in the cross-section over
a significantly long period of observation. If 50, this
criterion would correspond to decidedly higher values of bed
expansion than that used for either of the other two studies.
Also, there is sorne doubt about the packing used. They re
ported having used two densities of packing, 0.09 and 0.18
gm/cc, but have failed to indicate which density appl ies for
their bed expansion observations.
Another important variable affecting bed expansion
is the opening in the grid which supports the bed. In the
case of Blyakher et al. the free area of the combined support
and gas-distributing grids for the four different arrangements
they used was 19,30,41 and 90.%. Their upper grid had, in aIl
cases, 90% free area. Unfortunately, it is not clear which
104
bottom grid was used when the bed expansion data were recorded.
Based on the total open area, the 1 inear gas velocity through
the grids of Blyakher would be approximately 3.7,2.3, 1.7,
and 0.78 times that from our grid, (70% free area). Linear
gas velocities, larger by such amounts, would produce signi
ficantly higher bed heights.
Chen used a supporting grid of thin wire of unspecf
fied mesh size. However, the wire diameter of the grid was
less than 0.5-mm. The free ~rea o~ ~is grid could have been
higher than the 70% which appl ies in the present study. The
influence of reduced linear gas velocity from a grid with
higher free area on the operating characteristics of MBC
cannot be estimated quantitatively. But it could be a signi
ficant reason for the lower bed heights obtained by Chen.
Chen made no mention of any agglomeration or sticking
behaviour for his experiments with 0.5-in. packing. The fact
that there is no abnormal scatter in his bed expansion data
further confirms the absence of this problem in his study.
The rat~o of wall surface area to bed volume for Chen's 12-in.
column is sI ightly less than half that of the 5.5-in. column of
the present study. The lower ratio of wall area to bed volume
for the larger column greatly reduces the relative effect of a
few balls adhering to the wall. In the 5.5-in. column by con
trast, the same percentage of wall area covered by balls makes
a larger reduction in column cross-section, hence causes larger
fluid mass velocities in the remaining cross-section, which in
105
turn leads to abnormally high bed expansion.
The results for minimum fluidization velocity and
for bed expansion clearly indicate the existence of two sepa
rate effects related to packing size. For the largest spheres
(I.S-in.) used in the present study, for which the ratio dt/d
is only 3.7/1, it appears that the results for minimum fluid
ization velocity are affected by the "wall effect" as it has
been understood in work on fixed-bed columns. On the other
hand, the smallest spheres (O.S-in.) were not uniformly dis-. . . . ~ , . ,,~ ,". '" .... . ~ .
tributed in the column due to the tendency of the se 1 ight
weight spheres to stick to the walls of the column as well
as to agglomerate into clumps of balls within the column.
It will be appropriate therefore in each sub-study of the
thesis to check for the presence of either or both of these
effects. The results for minimum fluidization velocity and
for bed expansion certainly indicate that results for any
mobile-bed experiment with either 0.5 or 1.5-in. spheres in
a 5.5-in. diameter column should be examined carefully for
further evidence of these effects. Conversely, it appears
that results of any experiment using 0.75 or I.O-in. spheres
in a 5.5-in. column may be effectively free of either effect.
It is relevant in this connection to note that the 5.5-in.
column was chosen to obtain high gas mass velocities with an
available blower, and also because of the large consumption
of chemicals for mass transfer studies in a larger unit.
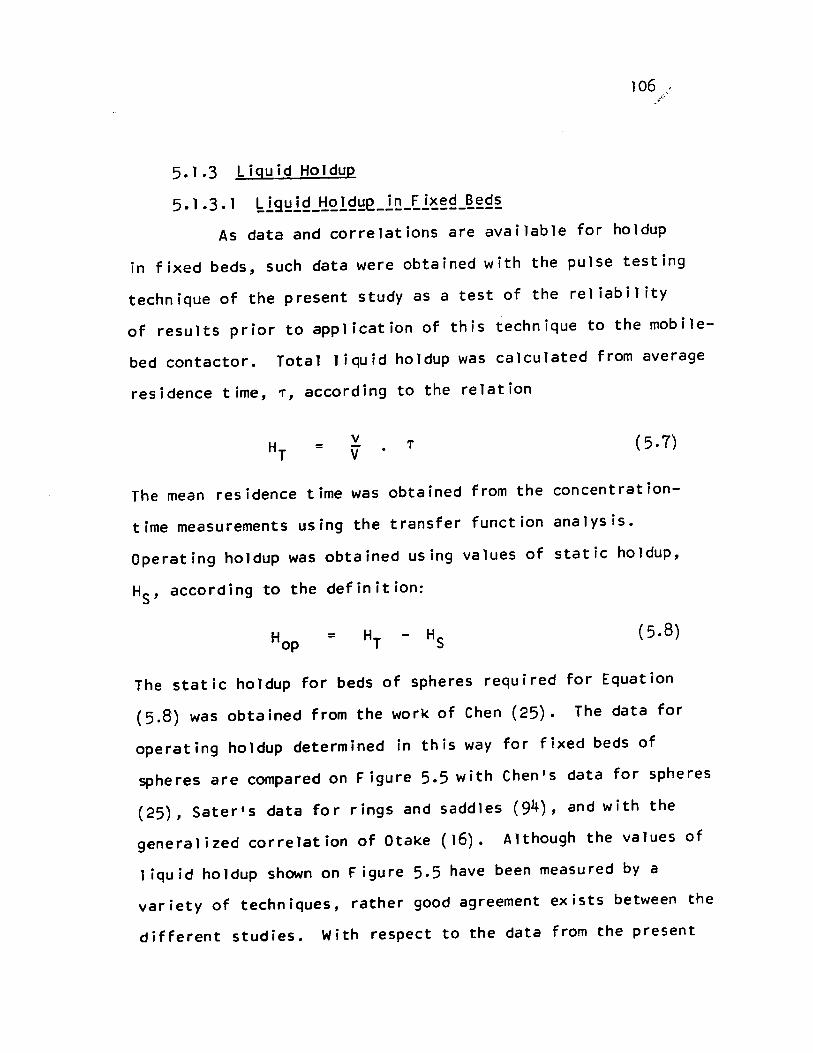
106 '
5.1.3 Liguid HOldup
5.1.3.1 blg~1~_tlQ!~~e_lŒ_El~~2_~~2~
As data and correlations are available for holdup
in fixed beds, such data were obtained with the pulse testing
technique of the present study as a test of the rel iability
of results prior to application of this technique to the mobi1e
bed contactor. Total liquid holdup was calculated from average
residence time, T, according to the relation
= v V (5.7)
The mean residence time was obtained From the concentration-
time measurements using the transfer function analysis.
Operating holdup was obtained using values of static h01dup,
HS ' according to the definition:
= (5.8)
The static holdup for beds of spheres required for Equation
(5.8) was obtained from the work of Chen (25). The data for
operating holdup determined in this way for fixed beds of
spheres are compared on Figure 5.5 with Chen's data for spheres
(25), Sater's data for rings and saddles (94), and with the
generalized correlation of Otake (16). Although the values of
1 iquid hOldup shown on Figure 5.5 have been measured by a
variety of techniques, rather good agreement exists between the
different studies. With respect to the data from the present
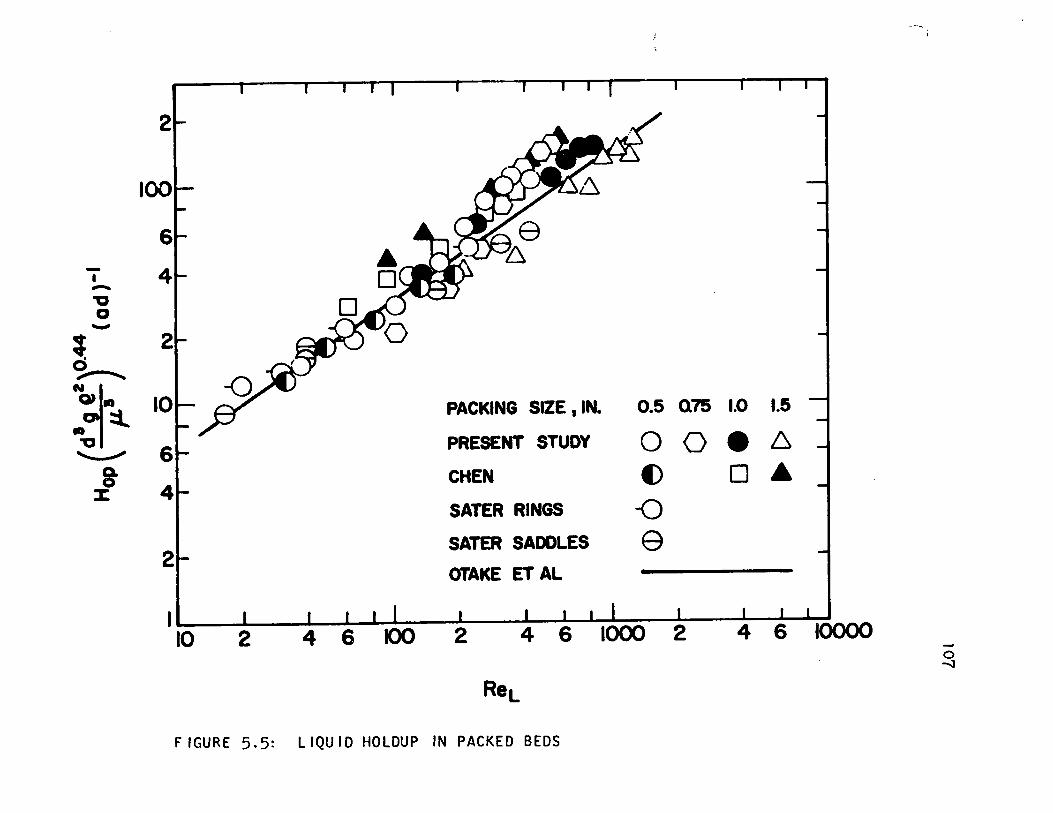
-'0 a -
~ ~
~.:L '---"'
8-x
2
PACKING SIZE ,IN. 0.5 Q75 1.0 1.5
PRESENT STUDY ooe 6 CHEN t) 0 • SATER RINGS -0 SATER SADDLES e OTAKE ET AL
2 4 6 100 2 ILI ____ ~ __ ~~~~~ ____ ~ __ ~~~~~~--~--~~~~~ 10 4 6 1000 2 4 6 10000
ReL
FIGURE 5.5: llQUIO HOlOUP IN PACKEO BEOS
o -;J

108
study, it is s ignificant that there is no strong trend
with respect to sphere diameter over the range .0.5 to 1.0 inches.
ln terms of Otake's correlation, the holdup for 1.5-in.
spheres is in the order of 30% lower than for the smaller
spheres. As the ratio dt/d is only 3.7/1 for this packing, it
would be surprising if holdup were not affected by the wall
effect. It is interesting that this effect is in fact sur
prisingly small for packing which is quite large relative to
the column diameter. However, as the basic objective is to
study mobile beds, the main conclusion of the work with fixed
beds is that the satisfactory agreement with the results of
investigators who used different methods of determining holdup
confirms the accuracy of the pulse testing technique as used
in the present study.
5.1.3.2 blg~12_tlQ!~~2_1~_~Q~1!~:~~~_çQ~~~~~1~g
Chen and Douglas (29) noted that in mobile-bed con
tacting the distinction between operating and total holdup
disappears because there is in this case no static or in
effective holdup. Thus the results for holdup for MBC derive
directly from Equation (5.7). the transfer function analysis
of the concentration transients, and the volume of the bed, V,
as determined from the correlation for bed expansion given as
Equation (5.5). The designations "operating" and "total" that
were used for holdup in fixed beds have been dropped in the
109
presentation of results in MBC. For the tour packing sizes
tested these results are given on the series of plots,
Figure 5.6.
The new results for holdup may best be considered
in detail for l-in. packing because the results for bed ex
pansion and minimum fluidization ve10city indicate that in
MBC, the hydrodynamics for 1-in. packing in a 5.5-in. column
arenot distorted by either of the effects which were observed
for the largest and smallest spheres. While it appears that
results with O.75-in. spheres are a1so free From these
effects, Chen obtained dat~ for holdup in MBC for l-in. but
not for 0.75-in. spheres. Although Chen's results cover a
more limited range of gas and liquid mass ve10cities, they
provide a valuable reference for the extension made in the
present study.
A central feature of the correlation for holdup in
MBC by Chen and Douglas (29) is that h01dup is independent
of gas velocity. ~owever, reference to the new data for 1-in.
packing given on Figure 5.6 indicates a significant effect
of gas velocity. The effect of 1 iquid velocity is as before,
i.e. holdup increases with increasing 1iquid rate. The over
lap in conditions used by Chen occurs only for the lowest
two of the seven values of 1 iquid mass velocity From 6977 to
23813 lb./hr.-sq.ft., used in the present study. Although the
representation by Chen and Douglas of their data for five

0.301-
Oo25r t ::j u "'-t ::j 00201 U .. (l. :::J 0
O.l5r -1 0 X
0 5
O.l0t-Q -1
0.05
o
A\ L SYMBOL L SYMBOL l.B.I(HR:-SQ.FT.) LBJ(HR.-SQ.FT.)
 6977 0 CHEN
~ 12513 6 7560 rn 18201 • 10760 <D
A \ 23813 Â
*\ ~ ~. PACKING SilE : 0.5 IN.
Â
'UJ , rn~ Â -- - - --- ---
LU (I),n ~ r-n....u ~ \..U... • • ~~D w
1\
1000 2000 3000
GAS MASS VELOCITY , G, La/{HR.-SQ.F"t)
FIGURE 5.6(a): LIQUIO HOLOUP IN MOBILE BEO CONTACTORS d = O.5-inch
Â
6
4000
o

t-= "-::) u "-t :j 0 .. ~ ::J
d 7;
0 -::J 0 ~
0.301- PACKING SlZE : 0.75 IN. 1 L SYMBOL LB./( HR:-SQ.FT.)
6977
0.25
0.20
0.15
OJ0t- ~ 0 0
1000 3000 0.05~O-___ -;n!:~----=~--------...-...L---_...J
4000 2000
GAS MASS VELOCITY t G t LB./( HR.-SQ.FT.)
FIGURE 5.6(b): L/QUIO HO LOUP IN MOBILE BEO CONTACTORS d = O.75-inch
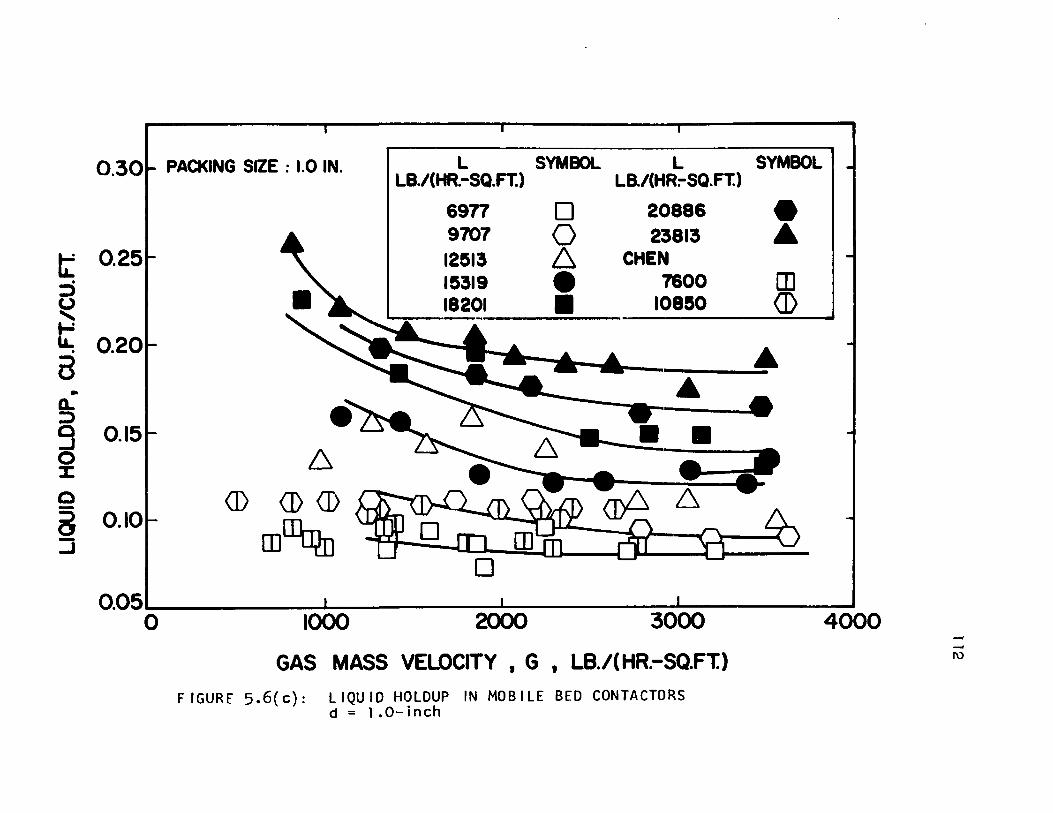
0.301- PAO<ING SilE : 1.0 IN. 1 L SYMBOL L SYMBOL LB./(HR.-SQ.FT.) LB./(HR:-SQ.FT.)
6977 0 20886 -9707 0 23813 Â t O.
25r h 12513 6 CHEN . 15319 e 7600 OJ :::> ~ 18201 • 108!S0 ID t 0.20 .
 a + -.. • Q. :::> 9 0.15 0 :a:: 0 a 0.10 ::J
0.05 0 1000 2000 3000 4000 --GAS MASS VELOCITY , G , LB./( HR.-SQ.FT.) 1\)
F IGURf 5.6( c): LIQUID HO LOUP IN MOBILE BEO CONTACTORS d = 1 .0- inch
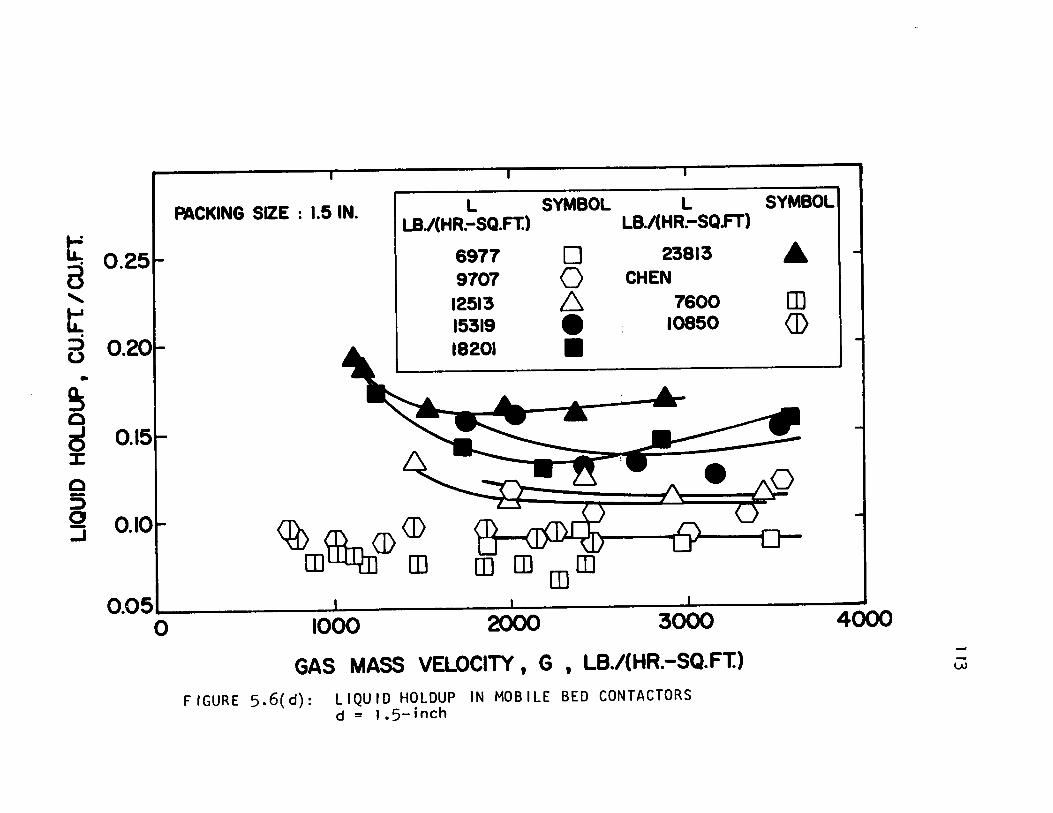
PACKING SilE: 1.5 IN. L SYMBOL L SYMBOL
t LBj(HR.-SQ.FT.) LB./{HR.-SQ.FT)
6977 0 23813 • a 0.25 9707 0 CHEN
"- 12513 6 OJ ~ 7600
15319 e 10850 <D ::) 0.20 .... 18201 • u .. ~ 0
~ 0.15 :J:
0 5 0 O.lor <lli ffiIm CD CD -.J
OJ rn rn OJ []] rn 0.05
0 1000 2000 3000 4000
GAS MASS VELOCITY t G t LB./(HR.-SQ.FT.) ----U>
FIGURE 5.6(d): LIQUIO HOLOUP IN MOBILE BEO CONTACTORS d = '.5- inch

114
values of 1 iquid rate over the range 1840 ( L ( 10850 as in
dependent of gas velocity at values greater than Gmf • For the
two lowest values of 1 iquid rate in the present study, the
moderate decrease of holdup with gas velocity is in fact not
unI ike that displayed by Chen's results. However, the new
results at the higher liquid mass velocities which are of
importance in industrial practice show clearly that holdup
decreases with gas velocity at values above Gmf .
T.he same fe.ature~ displayed by the results for l-in.
spheres are seen also on the plot of results for 0.75-in.
sphe res • A new feature seen he re, howeve r, i s that at the
h igher values of liquid velocity, the holdup passes through a
shallow minimum at an intermediate/value of gas velocity,
then begins to increase again at higher values of gas velocity.
The results for the smallest and largest packing
must now be examined critically for evidence of deviations
with respect to holdup analogous to those noted in the previous
sections. Because of the dependence of holdup on gas velocity,
the data for 0.5-in. spheres may most conveniently be compared
with that for 0.75 and l-in. spheres by making comparison at
constant values of gas velocity. At G = 2000 lb./hr.-sq.ft.,
for example, the 1 iquid holdup for 0.5-in. spheres at every
value of liquid velocity tested is about 3 to 4.5 volume per
centage points less than for 0.75-in. spheres. Thus for L = 6977,
115
the volume fraction liquid holdup decreases from about 0.09
to 0.06 when the sphere diameter is reduced from 0.75 to
0.5-in. This decrease is anomalous, because the Chen and
Douglas correlation for MBC shows holdup to be inversely
proportional to dO•5 • It will be recalled that the bed ex
pansion data of the present study for··0.5-in. spheres was
anomalously high (Figure 5.3) due to the lack of uniform dis
tribution of these beds. As the value for bed volume used
to obtain liquid holdup on a volume fraction basis cornes
directly from the bed expansion data, poor performance w.th
respect to bed expansion is reflected also in the data for
hôldup. Thus the holdup results for 0.5-in. spheres deviate
from the predicted trend for packing diameter, and deviate in
the direction expected as a result of the already noted problem
of non-uniform distribution of 0.5-in. balls in the 5.5-in.
column. The holdup data for 0.5-in. spheres must therefore be
rejected as not indicative of holdup in a mobile-bed which has
a satisfactorily uniform distribution of packing.
At the other extreme of packing size, i.e. for 1.5-
in. spheres, the holdup data in the lower range of liquid
velocities used appear to be affected by a wall effect. Again
choosing G = 2000 lb./hr.-sq.ft. to make the comparison, the
present results for L = 6977 and 9707 Ib./hr.-sq.ft. indicate
an increase of 1 to 1.5 percentage points in the volume percent
liquid as one goes from 1 to 1.5-in. spheres. By contrast,

116
according to the previously observed inverse dependence of
holdup with dO. 5 , the holdup would be expected to decrease by
about 1.5 points in volume percent. These significantly higher
than expected valuesof holdup are bel ieved to derive from a
wall effect associated with a value of dt/d = 3.7. Interest-
ingly enough this effect on the results for holdup disappears for
the higher range of 1 iquid velocities. Thus at l = 12513
lb./hr.-sq.ft., and G = 2000, the holdup for d = 1.5-in. is no
longer higher then at d = l-in., but is essentially unchanged.
At the highest values of 1 iquid rate tested, i.e. l = 18201
and 23813 lb./hr.-sq.ft., and for G = 2000, the holdJp con-
tinuously decreases as packing diameter increased from 0.75
to 1.0 to 1.5-in., in reasonable accord with the d-O. 5 depend
ence. Thus for 1.5-in. spheres there appears to be an
appreciable wall effect which increases holdup when the bed
is only mOderately expanded from the fixed-bed condition.
This wall effect however gradually decreases at very high
liquid mass velocities which correspond to a greatly agitated
mobile-bed type operation. At the condition of highly agitated
bed, the movement of packing could be expected to be less
influenced by the presence of the column wall.
Returning to the question of the rel iabil ity of the
data for 0.75-in. packing it is significant that the change
in holdup between 0.75 and 1.0-in. spheres is in aIl cases
in general accord with the inverse dO. 5 dependence of the Chen
and Douglas correlation.
1 17
Due to the complex relations apparent between the
variables hOldup, bed expansion, packing size, and gas and
liquid mass velocities, no general correlation is offered
at this time. However, the new data point out that the hold
up correlation of Chen and Douglas (29) must not be used for
1 iquid velocities outside the range for which it was derived.
With respect to the new holdup data, it is bel ieved that aIl
of the results with 0.75 and 1.0-in. packing, sorne of the
results with 1.5-in. packing, and none of the results for
0.5-in. packing may be taken as indicative of holdup in
mobile-beds which are not significantly affected by problems of
uniform distribution or wall effects.
5.1.4 ~id Mixing
The appl icability of transfer function analysis
to the study of axial mixing is examined first, then the
results for liquid mixing in fixed beds and in mobile-bed
contacting are discussed.
5.1.4.1 Evaluation of Peclet Number and ~ean-ResTdenëe-fTmë-------------------------------
The transfer function analysis used to compute
Peclet number and mean residence time of liquid in the MBC
also provides a test of the appl icability of the diffusion
mode' for 1 iquid mixing in MBC. The concentration-time data
for both inlet and out let tracer pulses are used to evaluate
the transfer function from Equation (3.7) fur arbitrary values
of parameter s. The ordinate and abscissa values for Equation
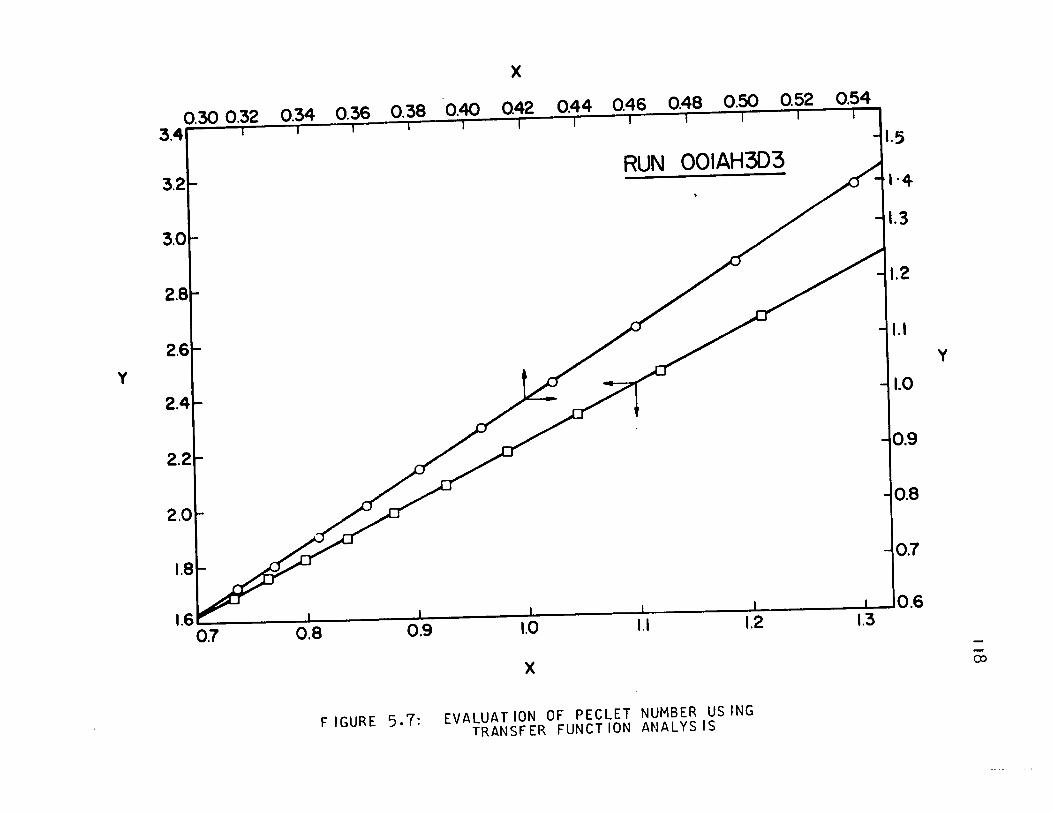
y
x
1.5
3.2 RUN OOIAH3D3
"4
3.0 1.3
2.8 1.2
2.6 1.1
2.4 1.0
2.2 0.9
0.8
0.7
, , , 1 1 1 10.6
"'- 0.8 0.9 1.0 1.1 1.2
x
FIGURE 5.7: EVALUATION OF PECLET NUMBER U51NG TRANSFER FUNCTION ANALY515
1.3
y
CX>
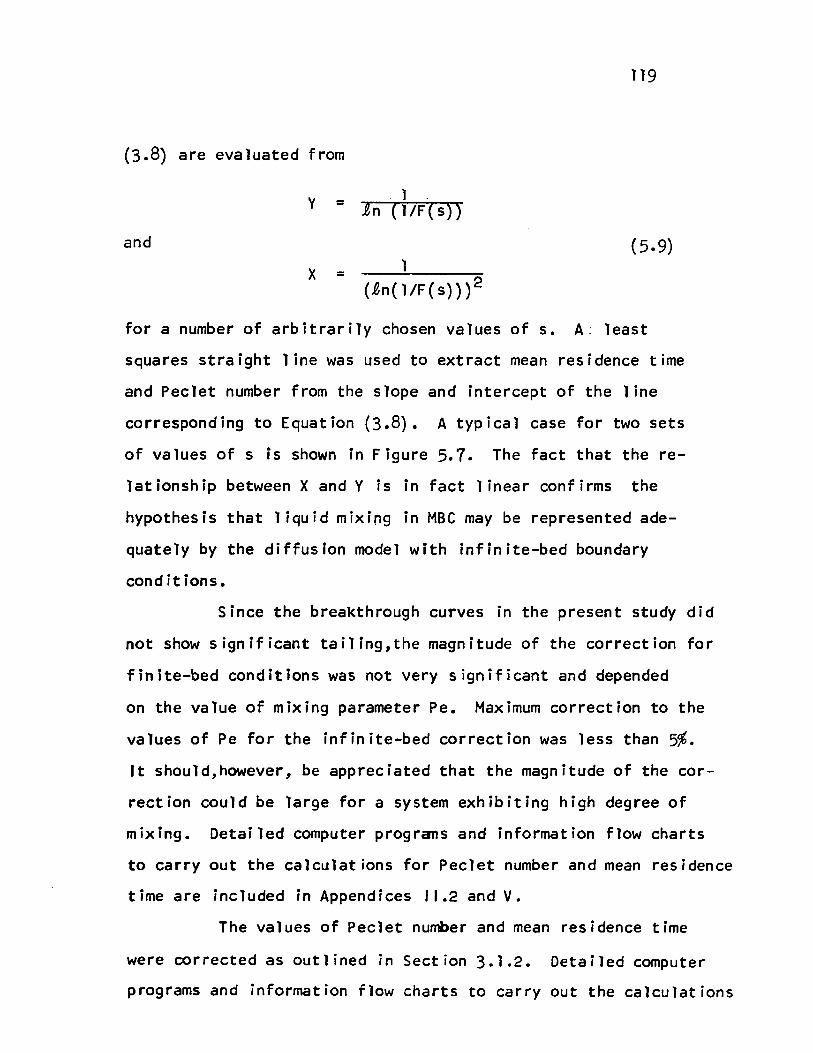
119
(3.8) are evaluated from
y 1 = ]n (l/F(s»
and (5.9) x = 1
(ln(1/F(s)))2
for a number of arbitrarily chosen values of s. A: least
squares straight line was used to extract mean residence time
and Peclet number from the slope and intercept of the line
corresponding to Equation (3.8). A typical case for two sets
of values of s is shown in Figure 5.7. The fact that the re
lationship between X and Y is in fact linear confirms the
hypothesis that liquid mixing in MBC may be represented ade
quately by the diffusion model with infinite-bed boundary
conditions.
Since the breakthrough curves in the present study did
not show significant tailing,the magnitude of the correction for
finite-bed conditions was not very significant and depended
on the value of mixing parameter Pee Maximum correction to the
values of Pe for the infinite-bed correction was less than 5%.
It should,however, be appreciated that the magnitude of the cor-
rection could be large for a system exhibiting high degree of
mixing. Detailed computer programs and information flow charts
to carry out the calculations for Peclet number and mean residence
time are included in Appendices Il.2 and V.
The values of Peclet number and mean residence time
were corrected as outlined in Section 3.1.2. Detailed computer
programs and information flow charts to carry out the calculations
1l9a
for Peclet number and mean residence time are included in
Append ix "'.2.
5.1.4.2 b~g~lg_~I~IQg_IQ_~~S~~g_~~~~
The results for liquid mixing in the trickle-bed
type operation were compared in order to establ ish the relia
bi1ity of the pulse testing technique used in the present study.

120
Earlier Chen (25) and Harrison et al. (110) studied liquid
mixing in trickle-bed operation with packed beds of spheres
using the transient response technique. The variables studied
by Chen were essentiallY the same as in the present study; his
results were correlated as
= (5.10)
Multiple regression analysis between these dimensionless
numbers and the combined data of Chen and the present study
gave the fOllowing correlation for liquid mixing in trickle
bed operation through beds of spheres:
= 1.06 (5.11)
Representation of these data on Figure 5.8 indicates a reason
ably good fit for correlation in this forme
The effect of packing size is of particular interest.
ln this connection it is to be noted that there is relatively
little spread in the data of the present study for 0.5,0.75
and I.O-in. spheres, and within the experimental scatter there
is no systematic trend with respect to packing size. As may
readily be obtained from equation (5.11), the Peclet number
for trickle-bed operation at constant liquid flow rate in-
. 1 dO• 125 creases proportrona to .
One can visualize this increase of Peclet number
with packing diameter as occurring due to the less tortuous
path taken by the liquid for the larger packing. The more
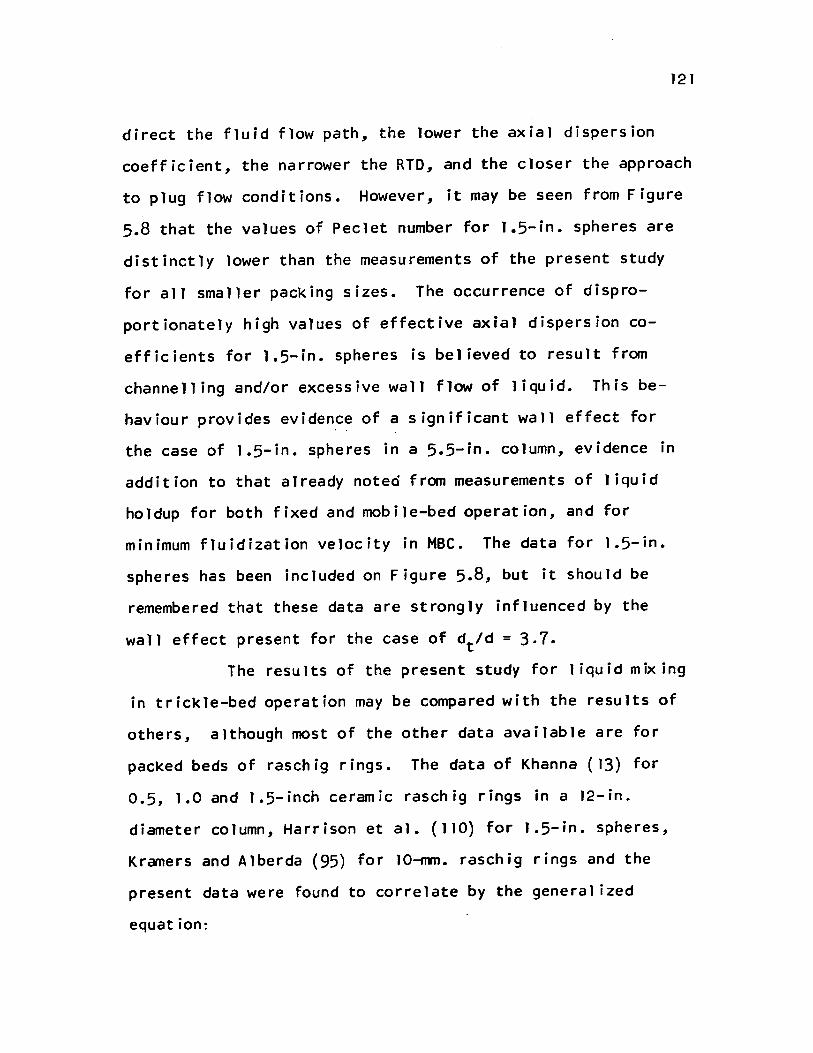
121
direct the fluid flow path, the lower the axial dispersion
coefficient, the narrower the RTD, and the closer the approach
to plug flow conditions. However, it may be seen from Figure
5.8 that the values of Peclet number for 1.5-in. spheres are
distinctly lower than the measurements of the present study
for aIl smaller packing sizes. The occurrence of dispro
portionately high values of effective axial dispersion co
efficients for 1.5-in. spheres is believed to result from
channelling and/or excessive wall flow of liquide This be
haviour provides evidence of a significant wall effect for
the case of 1.5-in. spheres in a 5.5-in. column, evidence in
addition to that already noted from measurements of liquid
holdup for both fixed and mobile-bed operation, and for
minimum fluidization velocity in MBC. The data for 1.5-in.
spheres has been included on Figure 5.8, but it should be
remembered that these data are strongly influenced by the
wall effect present for the case of dt/d = 3.7.
The results of the present study for liquid m~ ing
in trickle-bed operation may be compared with the results of
others, although most of the other data available are for
packed beds of raschig rings. The data of Khanna (13) for
0.5, 1.0 and 1.5-inch ceramic raschig rings in a 12-in.
diameter column, Harrison et al. (110) for 1.5-in. spheres,
Kramers and Alberda (95) for 10~. raschig rings and the
present data were found to correlate by the general ized
equation:

$ o ......
a C!) -...... o l. -
3O~i----~--~--~~~~~----~--~--~~~~~----~--~
• • • PACKING SIZE IN. 1.5 1.0 015 0.50
PRESENT WORK ~ CD 0 6 CHEN e 0 Â
I~, ______ ~ _____ ~ __ ~~~~ __________ ~~ __ ~~~~ ______ ~ __ ~ D 100 1000
Rel FIGURE 5.8: CORRELATION OF AXIAL MIXING FOR LIQUIOS IN
TRICKLE-BEO OPERATION THROUGH BEOS OF SPHERES 1\) 1\)

123
= (5.12)
This correlation is essentially the same as Equation (5.11)
with the additional parameter lad l to account for the shape
of the packing. Figure 5.9 illustrates the fit of data to
the proposed correlation. Although the data for 1.5-in. spheres
from the present study has been included on both Figures 5.8
and 5.9, it should be remembered that these data are signifi
cant only in showing the extent of the wall effect on axial
mixing for the case of dt/d = 3.7. For the purpose of the
present study, however, favorable comparison of the new data
obtained with the pulse testing technique with results obtained
by a variety of other methods for the trickle-bed operation
provided further support for the use of this method to evalu
ate mixing in MBC.
Axial mixing in MBC occurs as a result of the same
basic flow phenomena encountered in packed or trickle-bed
operation, but with an additional contribution due to the
interaction between the phases and the packing which in this
case is generally in a state of vigorous motion. The follow
ing dimensionless numbers have been identified (16,112) as
important in describing liquid mixing for gas-liquid flow
through packed beds: Peclet number, Reynolds number of the
gas and the liquid phase, GalliJeo number and the diameter ratio
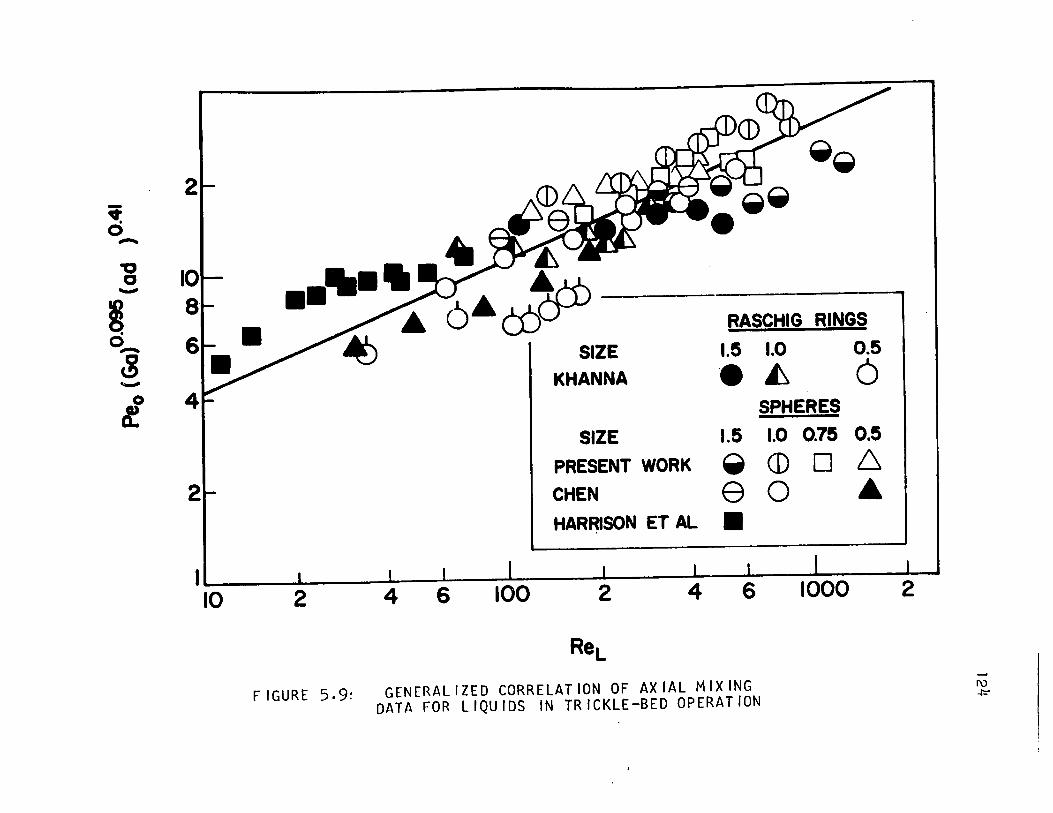
.. o -~ o -
8 0_
~ -o ct
2
....... ~ •
2
SIZE
KHANNA
SIZE
PRESENT WORK
CHEN
HAR~SON ET AL
. -.-' RASCHIG RINGS
1.5 1.0 0.5
eL 6 SPHERES
1.5 1.0 0.75 0.5
.,CD06 e 0 •
• 2 I~io~--~--~~~~~----~--~--+---~--~~ 2 4 6 100 2 4 6 1000
Rel
FIGURE 5.9: GENERALIZED CORRELATION OF AXIAL MIXING DATA FOR LIQUIDS IN TRICKLE-BED OPERATION
1\)
~
dt/do The 1 iquid mixing characteristics may therefore be
represented by a functional relationship between
Pe, Rel' ReG' Ga and dt/do
125
Fox fixed beds, it has been shown (95) that the flow of gas,
below loading point, does not influence mixing of the liquid
phase. The gas phase Reynolds number has therefore been
omitted for the case of fixed beds. Otake and Kunugita (16)
investigated the effect of aspect ratios, dt/d and H/dt
, and
concluded that the influence of dt/d between 4.3 - 6.9 and
H/dt from 14 to 24.2 on liquid mixing was not significant
and proposed a correlation of the form:
peo
= 1.895 (Rel)0.5 (Ga)-0.333 (2.24)
Thus, for packed beds one can write,
Peo = Al (Rel)B (Ga)C (5.13)
As mobile-bed contacting may be viewed as an ex
tension of the fixed-bed system, it may be assumed that a
similar functional relationship between these dimensionless
variables would apply for MBC, plus an additional parameter
for the effect of gas f low. Thus, for MBC,
Pe _ ( B - A2 Rel) (Ga)C f(G) (5.14)
On dividing equations (5.14) by (5.13), one gets
Pe = f(G) (5.15) peo
Chen and Douglas (115) successfully used this
approach in correlating their data for axi~J mixing of the
liquid phase in mobile-bed contacting. The function f(G)
hG - Gmf was taken as t e stirring number, 6 =
Gmf
126
The stirring number is the dimensionless gas flow rate above
that required for incipient fluidization. ft was thought that
this is the gas flow variable which best represents the effects
on mixing in MBC. On the basis of their successful use of this
model, the same approach was used for the present study which
extends considerably the range of flow rates for the MBC oper
ation.
The results are presented in terms of both Pe, and
the ratio Pe/Peo ' on Figures 5.10 and 5.11, respectively. As
the stirring number increases, the rapid increase in liquid
mixing as reflected by the corresponding sharp decrease in
Peclet number on Figure 5.10 is a consequence of the increased
turbulent mixing in the contactor. This measured effect con
curs with that anticipated from visual observation of MBC
operation.
The effect of motion of the packing for the case of
MBC is to give greater mixing than for a fixed-bed contactor.
Thus, in the representation of results given on Figure 5.11,
the data in general lie in the region Pe/Peo < 1.
The effect of packing size was of particular interest
in discussion of results for trickle-bed operation, and is 50
again for the mobile-bed case. Referring to Figures 5.10 and
5.11, it can be seen that the results, with fewexceptions,
fall in the following ranges:
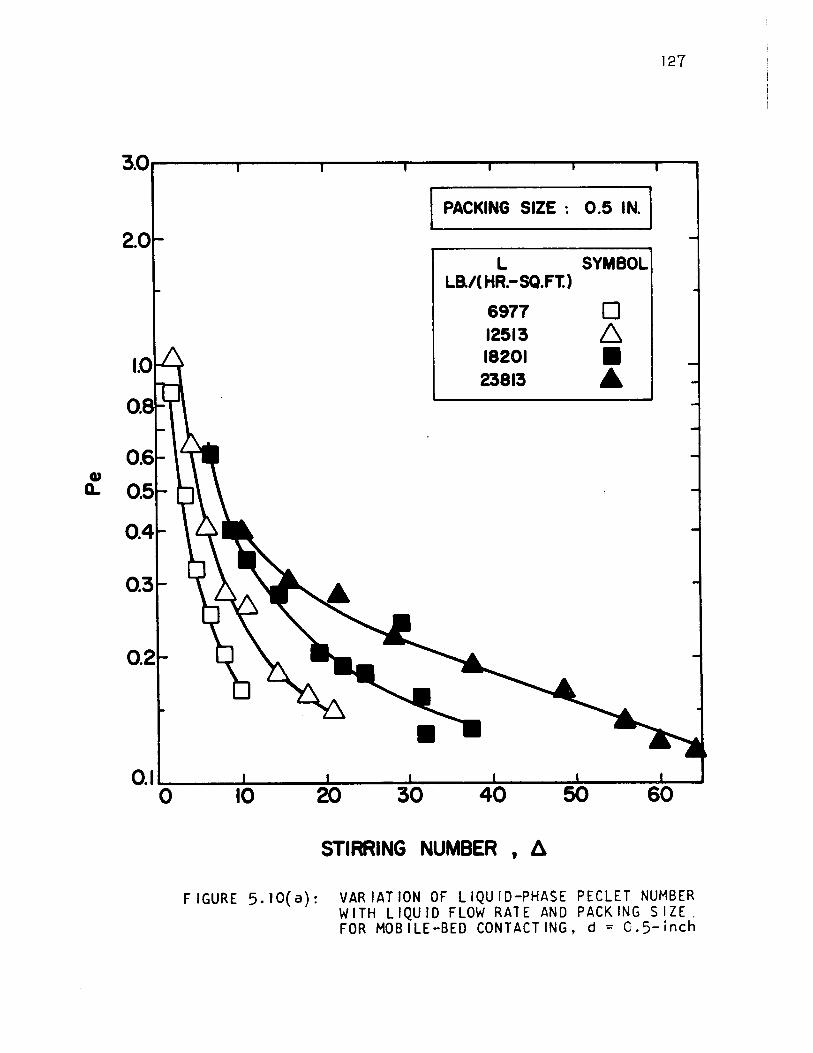
1 PACKING SIZE: 0.5 IN. 1
l SYMBOl la/( HR.-SQ.FT.)
6977 0 12513 6 18201 • 23813 Â
127
O.l~_~~_~~_--=~_~~_~~ __ -,--~ o 10 20 30 40 50 60
STIRRING NUMBER , â
FIGURE 5.10(a): VARIATION OF LIQUID-PHASE PECLET NUMBER WITH LIQUID FLOW RATE AND PACKING SIZE. FOR MOBILE-BED CONTACTING, d = O.5-inch

128
2.0 PACKING SIZE: 0.75 IN. 1
L SYMBOL LB./l HR.-SQ.FT.)
6977 0 12513 6 18201 • 23813 Â
0.2
QI~ ____ ~ ____ L-____ L-____ L-____ ~ ____ ~ __
o 10 20 30 40 50 60
STIRRING NUMBER , â
FIGURE 5.10(b): VARIATION OF LIQUID-PHASE PECLET NUMBER WITH LIQUIO FLOW RATE AND PACKING SilE FOR MOBILE-BEO CONTACTING, d = O.75-inch
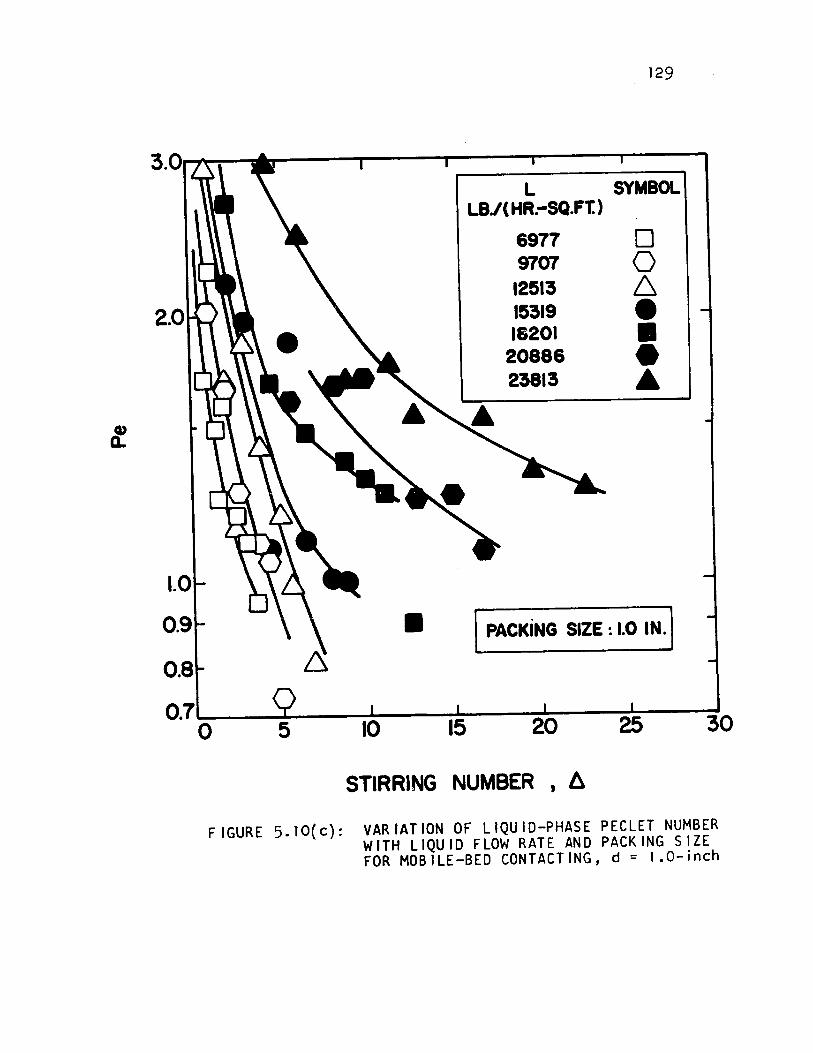
•
129
L SYMBOL LB./( HR.-SQ.Ft)
6977 0 9707 0
12513 6 15319 e 16201 •
20886 e 23813 •
PACKING SIZE: 1.0 IN.
0.7 ________ """""-__ """'---__ ~--........__.--~ o 10 15 20 25 30
STIRRING NUMBER t il
FIGURE 5.10(c): VARIATION OF LIQUID-PHASE PECLET NUMBER WITH LIQUID FLOW RATE AND PACKING SIZE FOR MOBILE-BED CONTACTING, d = 1.O-inch
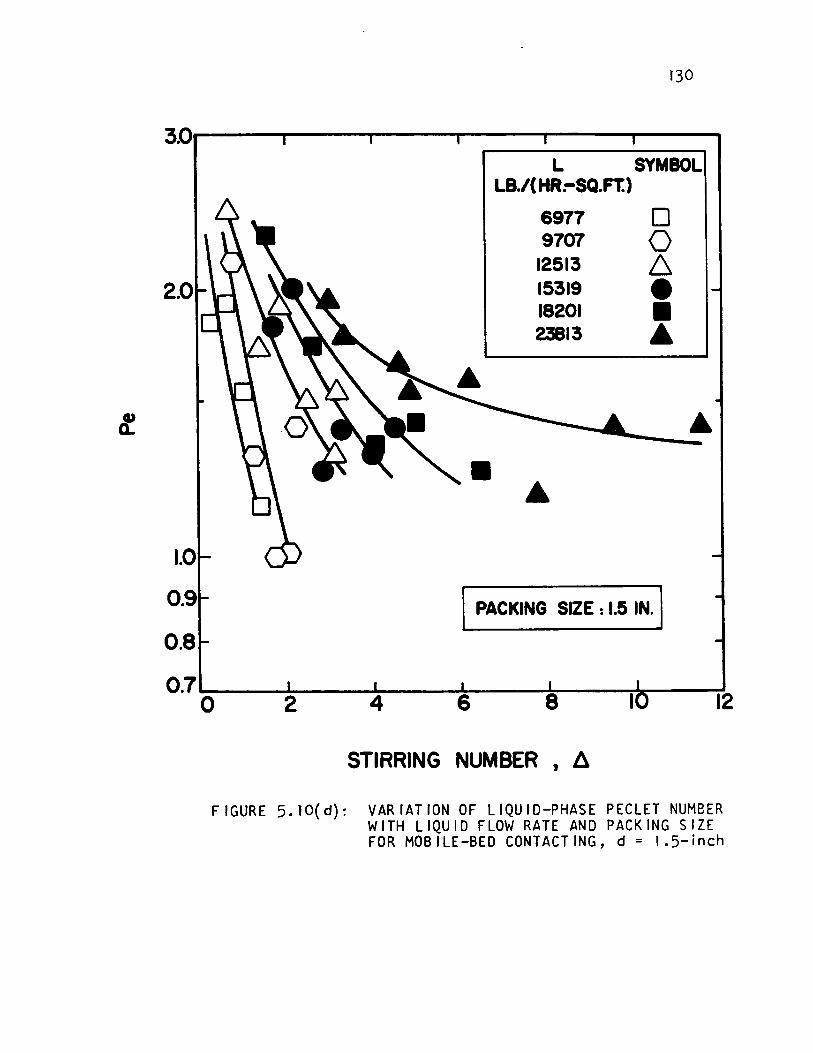
130
~Or-----r-----~----~--~~--~~--~
L SYMBOL LB./( HR:-SQ.FT.)
6977 0 9707 0
12513 6 15319 e 18201 • 2!813 Â
PACKING SilE: 1.5 IN.
O.7~ __ ~ __ ~ __ ~ __ ~:---_---=", ____ ~
o 2 4 6 8 12
STIRRING NUMBER t !l
FIGURE 5.10(d): VARIATION OF LIQUID-PHASE PECLET NUM8ER WITH LIQUID FLOW RATE AND PACKING SIZE FOR MOBILE-BEO CONTACTING, d = 1.5-inch
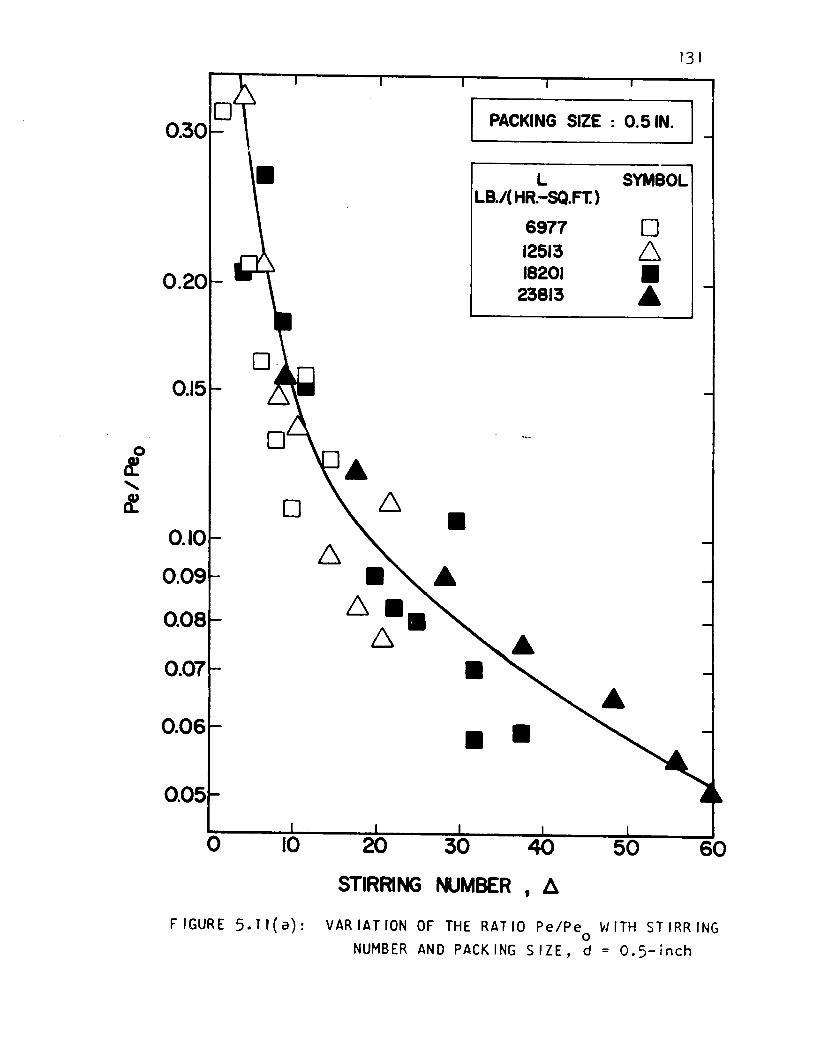
0.20
0.15
0.10
0.09
0.08
o
o
F 1 GUR ES. 11 ( a) :
131
PACKING SIZE : O.5IN. 1
• • Â
6 •• 6
L LB./( HR.-SQ.FT.)
•
6977 12513 18201
23813
• •
STIRRING NUMBER , il.
SYMBOLI
o 6 • Â
VARIATION OF THE RATIO Pe/Pe WITH STIRRING o
NUMBER AND PACKING SIZE, d = O.S-inch
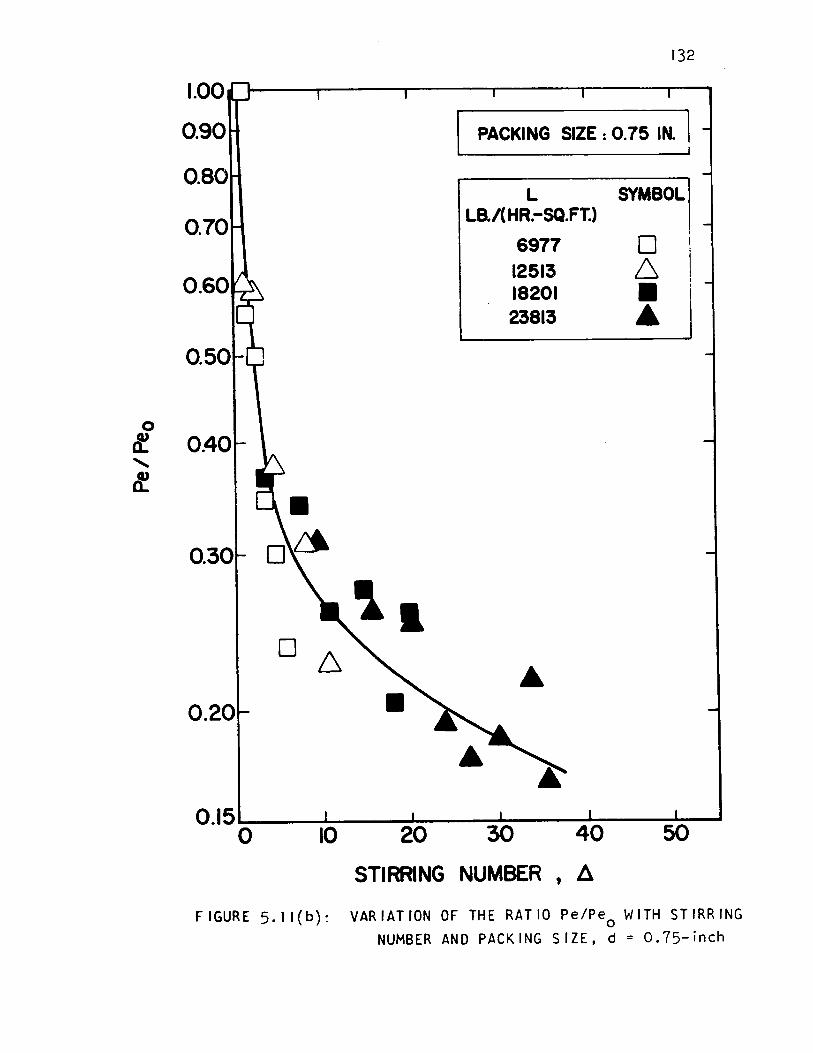
o
1.00
0.90
0.80
0.70
0.60
132
PACKING SilE: 0.75 IN. ! L SYMBOL
La/( HR.-SQ.Ft)
6977 0 1
12513 6 ! 1
18201 • ,
23813 • cf 0.40
" cf
o 6
0.20
O.l5~ __ I...0-__ '--_""""' ___ ~_""""' __
o 10 20 30 40 50
STIRRING NUMBER , il
FIGURE 5.11(b): VARIATION OF THE RATIO Pe/Peo WITH STIRRING NUMBER AND PACKING SIZE, d = O.75-inch
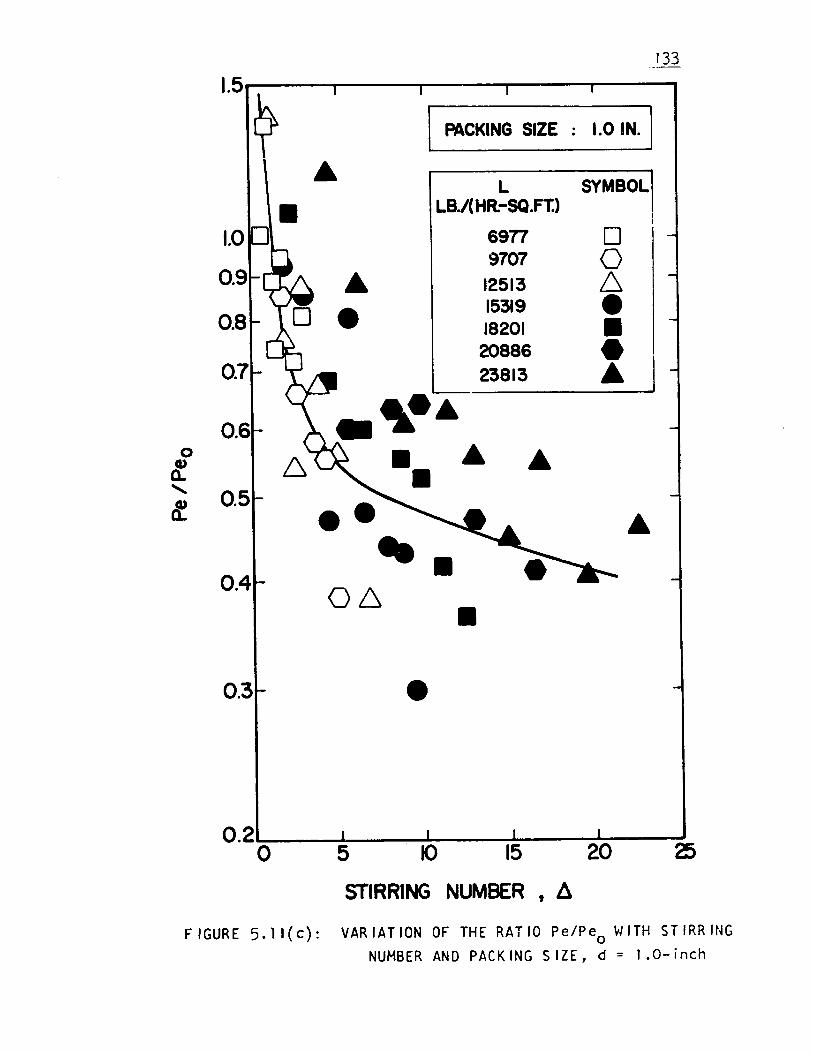
133
PACKING SIZE 1.0 IN. 1
L SYMBOL
1.0 • LB./(HR-SQ.Ft) 1
6977 0 9707 0
12513 6 15319 e 18201 • 0.8
20886 e 23813 Â
0
6 CI)
a. ......
0.5 cf ee
-- • 0.4 06 •
0.3
0.2~ ____ ~ ____ ~ ____ ~ ____ ~ __ ~ o 5 10 15 20 25
STIRR1NG NUMBER t â
FIGURE 5.1J(c): VARIATION OF THE RATIO Pe/Peo WITH STIRRING NUMBER AND PACKING SIZE, d = J.O-inch
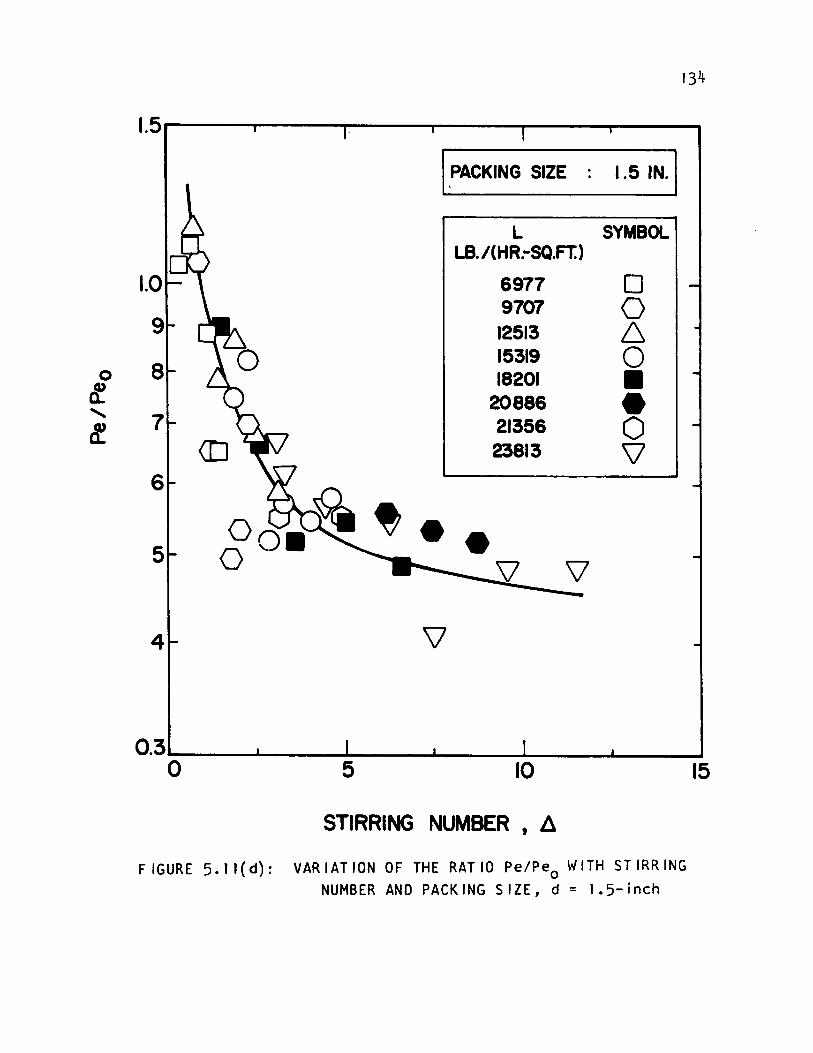
134
1.5r-----,r-------r--~-----,--------
l ,PACKING SIZE 1.5 IN.I
L SYMBOL LB. /(HR.-SQ.FT.)
6977 0 9707 0 12513 6
8 15319 0 18201 • 20886 -21356 0
<D 23813 '\]
••• 4
O.3-=-_---' __ ~----1..--.......1..----'---...J o 5 15 10
STIRRING NUMBER t il
FIGURE 5.11(d): VARIATION OF THE RATIO Pe/Peo WITH STIRRING NUMBER AND PACKING SIZE, d = 1.5-inch
packing Size, in.
0.5
0.75
1.0
1.5
Range of Pe
0.15 - 1
0.4 - 2.5
0.7 - 3
- 2.5
135
Range of Pe/Peo
0.05 - 0.3
0.17 -
0.4 - 1
0.5 - 1
Equation (5.11) indicates that, at constant liquid flow rate,
Peo increases with dO•125 • The steady increase in the ratio
Pe/Pe with packing diameter indicates that, at constant liquid o
flow rate, Peclet number for a mobile-bed contactor also in-
creases with packing size, but is rather more strongly in--
fluenced by packing size than is the case for trickle-bed
operation. When we recall that the effect of packing size on
Peclet number for a fixed-bed appears as a consequence of a
less obstructed path for 1 iquid flow with larger packing, the
trend of results for MBC is seen to form a consistent pattern
because the liquid flow path becomes less obstructed yet when
the bed expands in mobile-bed operation. The results reported
in previous sections do in fact show that bed expansion, h,
increases with packing size at constant gas and liquid flow
rate. A more expanded bed allows the liquid to follow a less
tortuous path, thus permitting the appreciable increase in
Peclet number with packing diameter in mobile-bed type oper-
ations.
It will be recalled that for 1.5-in. spheres,
mixing data for trickle-bed operation indicated a large wall
136
effect which causes experimenta1 values for Pec1et number to
be significant1y less than would be predicted by the correlation
equation (5.11). The same effect is displayed for the MBC oper
ation. In the tabulation of values of Peclet number given above,
large increases in Pe with packing size may be noted over the
range 0.5 to 1.0-in., whereas there is essentially no change
in Pe from 1.0 to 1.5-in. spheres. It is thus apparent that
there is a large wall effect in the data for MBC operation with
1.5-in. packing just as there was for the trickle-bed case.
Although the continuous motion of balls acts in the direction
of maintaining a uniform distribution of liquid flow over the
column cross-section, the larger the balls are, the less effect
ive they become in reducing wall flow and channelling of liquide
For the case of 1.5-in. balls in a 5.5-in. diameter
mobile bed (dt/d = 3.7), therefore, the conditions unfortun
ately fall in the region of strong wall effect. Consequently,
the data for 1.5-in. spheres on Figure 10(d) must not be taken
as representative of results that would be expected for 1.5-in.
balls in a larger diameter column. Likewise, the data for
Pe/Peo for 1.5-in. spheres on Figure lld represent the ratio
of results for two experiments, both of which were strong1y
inf1uenced by wall effect. Little significance shou1d the re-
fore be attached to this plot. Although the analysis of data
for the effect of packing diameter, and thereby to the deter
mination of wall effect for 1.5-in. diameter spheres, has
proceeded on the basis of Figures 5.10 and 5.11, aIl con
clusions reached may be substantiated by more precise com-
parisons based on the data for Peclet number, and gas and liquid mass velocities as tabulated in Appendix 1.1.
137
It was hoped that representation of mixing data as the ratio Pe/Peo on Figure 5.11 would eliminate the effect of }iquid flow rate. Comparisons between Figures 5.10 and 5.11 indicate that this objective has been to a considerable extent, but not entirely achieved. For reasons which are not understood this representation is least successful for 1.0-in. spheres. Although only one curve has been shown on Figure 5.11(c), the data for liquid flow rates L = 20886 and 23813 Ib./hr.-ft. 2 and some of the data for L = 18201 Ib./hr.-ft. 2
lie in one region, above the curve shown, while the results at the ]ower liquid flow rates could be correlated reasonably weIl by a second curve located below the one shown.
For the representation of Pe/Peo given as Figure Il, it is of interest to note that these four plots couJd each show the value Pe/Peo = 1 at ~ = -1, i.e., the trickle-bed condition. Work with gas-liquid flow through fixed-bed contactors indicates that the Peclet number for the liquid phase is not much affected by gas flow rate. Thus, a plot of Pe/Peo for operation between the trickle-bed andthe onset of the mobile-bed condition should be approximated by a horizontal 1 ine at Pe/Peo = 1 for -1 s ~ s O. Figure JJ(c), for 1.0-in. spheres, thus indicates that the ratio Pe/Peo may pass through a maximum in the operating region just above the minimum fluidization limite The region for which Pe/Pe ) 1 corres-o
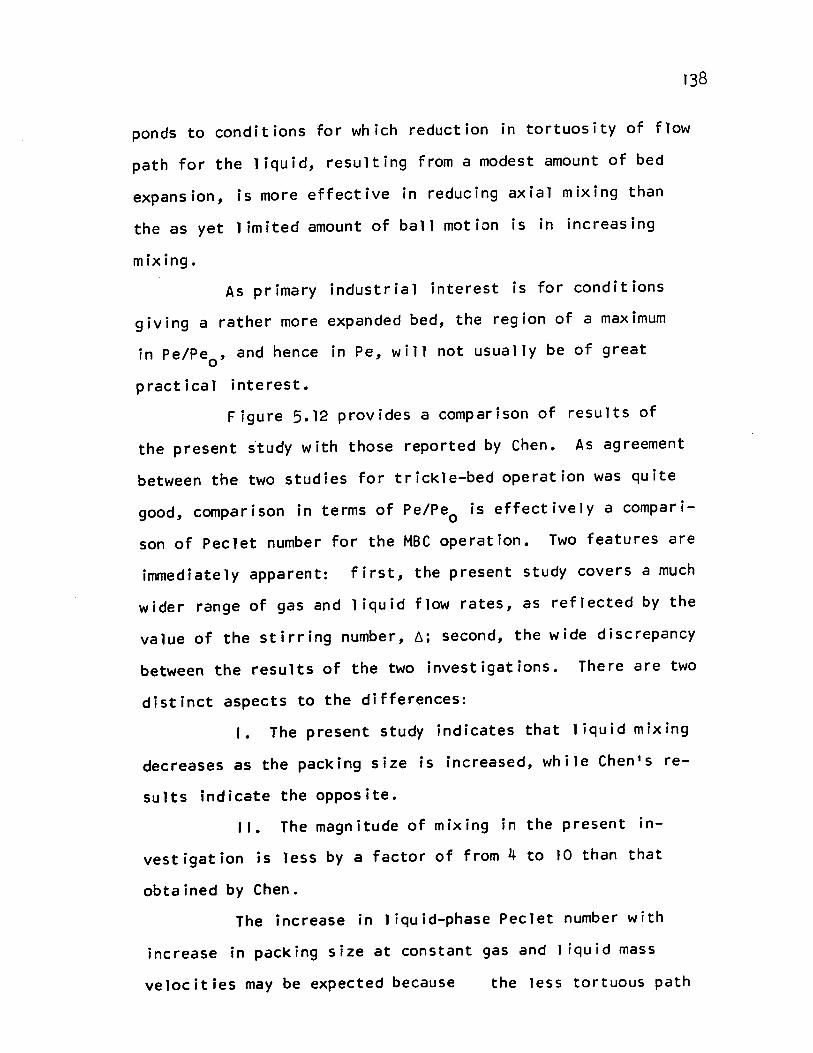
ponds to conditions for which reduction in tortuosity of flow
path for the liquid, resulting from a modest amount of bed
expansion, is more effective in reducing axial mixing than
the as yet limited amount of ball motion is in increasing
mixing.
As primary industrial interest is for conditions
giving a rather more expanded bed, the region of a maximum
in Pe/Pe , and hence in Pe, will not usually be of great o practical interest.
Figure 5.12 provides a comparison of results of
the present study with those reported by Chen. As agreement
between the two studies for trick1e-bed operation was quite
good, comparison in terms of Pe/Peo is effectively a compari
son of Pec1et number for the MBC operation. Two features are
immediately apparent: first, the present study covers a much
wider range of gas and liquid flow rates, as reflected by the
value of the stirring number, ~; second, the wide discrepancy
between the results of the two investigations. There are two
distinct aspects to the differences:
1. The present study indicates that liquid mixing
decreases as the packing size is increased, while Chen's re
sults indicate the opposite.
Il. The magnitude of mixing in the present in
vestigation is 1ess by a factor of from 4 to 10 than that
obtained by Chen.
The increase in liquid-phase Peclet number with
increase in packing size at constant gas and 1 iquid mass
velocities may be expected because the Jess tortuous path
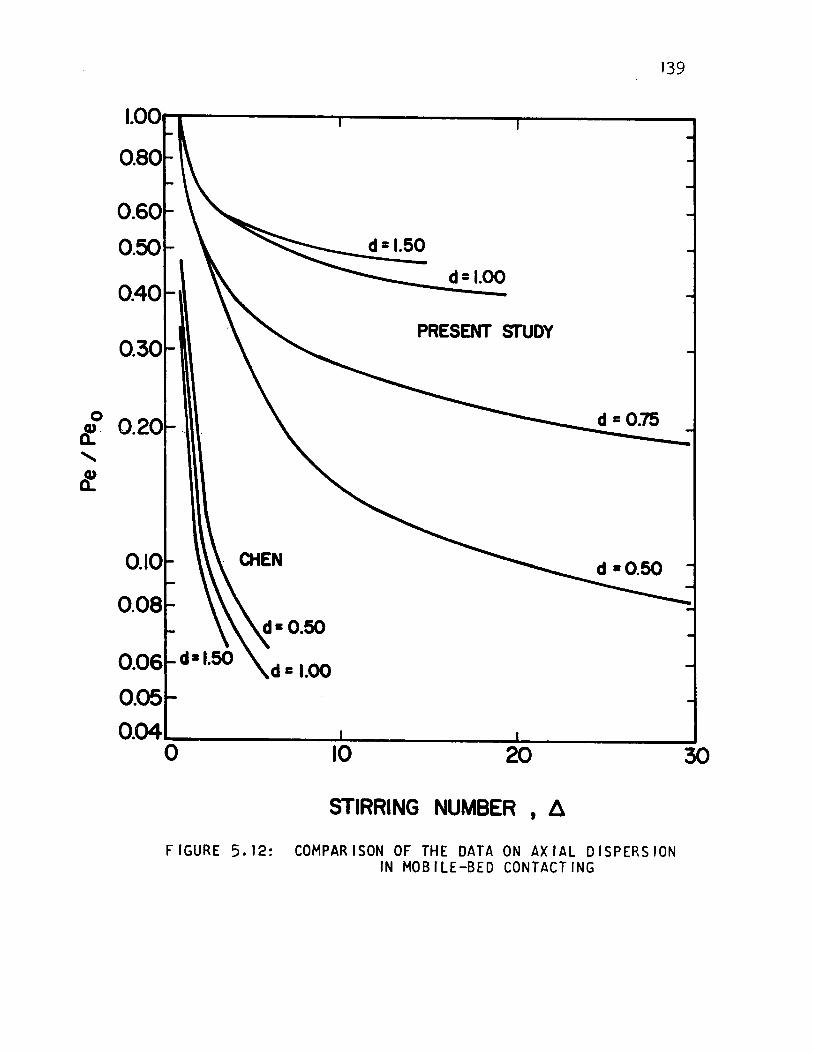
139
1.00r-r--------,--------.,.--------.
d = 1.50
d = 1.00 0.40
PRESENT sruOy 0.30
o d=O~ 8!.. 0.20 . .
" 8!.
0.10 . CHEN
0.08
d = 1.00
10 20
STIRRING NUMBER , Il
FIGURE 5.12: COMPARISON OF THE DATA ON AXIAL DISPERSION IN MOBILE-BED CONTACTING
30
140
reduced number of interactions of liquid in the case of the
larger packing. The physical picture of mixing in a mobile
bed contactor is thus in agreement with the results of the
present study, while those of Chen show a trend with packing
diameter opposite to that which would be predicted.
Reference to Figure 5.12 indicates, however, that
the spread of Chen's resu1ts with packing size is modest com
pared to the much 1arger differences between the relatively
narrow region in which all his resu1ts 1 ie and the results of
the present work. Pos~ible sources of such differences will
now be examined.
Although carried out in the same laboratory, the
present study was performed with a different mobile-bed
facility, with a different liquid distributor, tracer in
jection system, design of conductivity cells, and basic data
processing procedure. Any of these aspects could influence
the results and, as the present study fo1lowed that of Chen's,
it is believed that improvements were achieved in each. The
liquid distributor used by Chen gave four times the holdup
of tracer of the one now used, and as his liquid flow rates
covered a range one-half that used here, there could have
been some tailing in the input function which was treated as
a pure step-function in his data processing. Any such effect
would give results with a higher apparent value of mixing.
141
Based on Chen's experience, the conductivity cells
and liquid sampler used in the present study were redesigned.
The cells used here were one-half the diameter, the sampler
one-third the diameter, and the liquid holdup in the sampler
before the liquid reaches the electrodes was about one-fifth
that of Chen's setup. It is relevant to note that Chen's
measurements show step-input tails as long as the mean resi
dence time in the present case. Such tailing could occur as
a combinat ion of liquid holdup and mixing in the liquid dis
tr.ibutor and the samplers, and has the effect of indicating
more mixing in the bed than actually occurs.
Development for the present study of the technique
of measuring Peclet number by transfer function analysis for
finite-bed boundary conditions made possible the use of
simultaneous two-point measurements under actual flow con
ditions. At the time of Chen's study it was necessary to
consider end effects as consisting only of a time delay in
injection. Thus it was necessary for him to determine this
correction for the trickle-bed mode of operation without gas
flow, th en apply this correction to the measurements for
MBC operation.
There is no way of knowing whether the various
improvements which were possible since the time of Chen's
study have reduced any source of experimental error which
was of sufficient magnitude to affect his results. What is
known is that each of the changes made was in the direction
142
of removing a source of error which, if present, would in
every case give erroneously high mixing (i.e., incorrectly
low Peclet numbers). As there is a significant difference
in results, the evidence is strongly in favor of the present
results which have the advantage of additional development
and newer techniques.
An exception is the case of results for 1.5-in.
spheres, which are shown on Figure 5.12 only for comparison.
As already noted, these results are incorrectly low in Peclet
number because of a wall effect problem associated with the
5.5-in. diameter column.
No more general correlation of axial mixing in MBC
is presented than is shown as Figure 5.12. By reference to
equation (5.1) it may be seen that the effect of diameter on
·Peclet number enters in three ways - through liquid phase
Reynolds number, Gallileo number, and stirring number. Due
to the limited number of variables which have yet been studied
it is considered inappropriate at this time to propose a cor
relation more general than the representation of Figure 5.12.
Further investigation of mixing in MBC with meticulous
attention to every detail is necessary to arrive at a cor
relation of all the variables. Reference to the enormous
differences in liquid-phase mixing in pacKed bed shown on
Figure 2.5 and discussed in the review of previous work does
in fact indicate the great experimental difficulties of accur
ate measurement of mixing in counter-current gas-l iquid flow.

A number of physical characteristics of mobile
bed contacting have been established by study of four as
pects of the hydrodynamics of this process, namely, minimum
fluidization velocity, G , bed expansion, h, 1 iquid holdup, mf
Ht , and 1 iquid mixing as given by the Peclet number, Pee
New insight into the mechanism of liquid flow in MBC has
thereby been provided. Also, these four important para
meters of MBC can now be predicted with reasonable accuracy
over the entire range of mass velocities of gas and liquid
flowof industrial interest. The investigation shows that
mixing conditions are considerably further in the direction
of plug flow limit than had previously been thought, and
this, of course, further increases the economic attractive
ness of this new gas-liquid contacting technique. L iquid
mixing in MBC has also been found to be more strongly de
pendent on size of packing than is the case for fixed-bed
contactors. The scale effect associated with the importance
of relative size of the packing and the column has, however,
not been completely resolved. Until this effect has been
investigated further, care should, therefore, be exercised
in using this mixing data in the design of mobile-bed con
tactors of industrial size. Thus, the need remainsfor more
mixing studies for both liquid and gas phase in MBC, in
particular, the influence of size of packing, diameter of
column, and effect of physical properties.

144
5.2 MASS TRANSFER EFFECTS
The perfonmance of a mobile-bed contactor as a
mass transfer device is presented and analyzed in this sec
tion. Effective interfacial area in MBC is considered first,
then the results for "true" liquid-phase mass transfer, i.e.
values of kLa corrected for effect of liquid mixing. Finally,
the variation of the area-based transfer coefficient, kL,is
examined as a further indicator of the relationship between
flow behaviour and mass transfer characteristics of MBC.
5.2.1 Results for Effective Interfacial Area
The central feature to a basic analysis of mass
transfer behaviour in MBC is that the total effective inter
facial area is the summation of three types of interfacial
area, and that the mass transfer occurring across each of these
types of interface contributes in a different way to the
total mass transfer. The types of interfacial areas are
Bubb 1 e a rea - due to swa r~ eX sma 1 1 gas bubb 1 es
dispersed in the liquid
Droplet area - due to liquid droplets produced by
the turbulent conditions
Film area - due to liquid flowing as a film and to
fragments of liquid larger than droplets.
It is important to note that the direct chemical
reaction technique used in the present study measures the
cumulative area due to aIl three types of interface. Varia-
145
tion in the relative importance of these types provides the
key to understanding the mass transfer characteristics of MBC.
The values of effective interfacial area of mass
transfer as determined by absorption of carbon dioxide from
air into sodium hydroxide solutions were corrected for gas
phase resistance using the rates measured under identical
flow conditions for the absorption of sulphur dioxide into
sodium hydroxide solution. The techniques have been used
successfully for determination of effective interfacial area
(37,39,47) and were described in Sections 2.2 and 4.1.4. The
computer program for calculation of physico-chemical proper
ties of the system and processing of the data is recorded in
Appendix Il.3. Details of the calculation of physico
chemical data are given in Appendix IV. Bed height for the
O.75-inch spheres used was obtained from equation (5.5). The
complete results for interfacial area are given in Appendix
1.2, Table IV.
The experimental results for effect of gas and
liquid mass velocity on interfacialoea are plotted with
linear and logarithmic representation on Figure 5.13(a) and
(b) respectively. The large increase of interfacial area
with gas and liquid flow rate is immediately evident. In the
upper range the values of interfacial area may be seen from
Figure 15(a) to increase continuously, the limit of which
would be the conditions for which the packing would be carr
ied to the top of the bed and the tower would flood. The
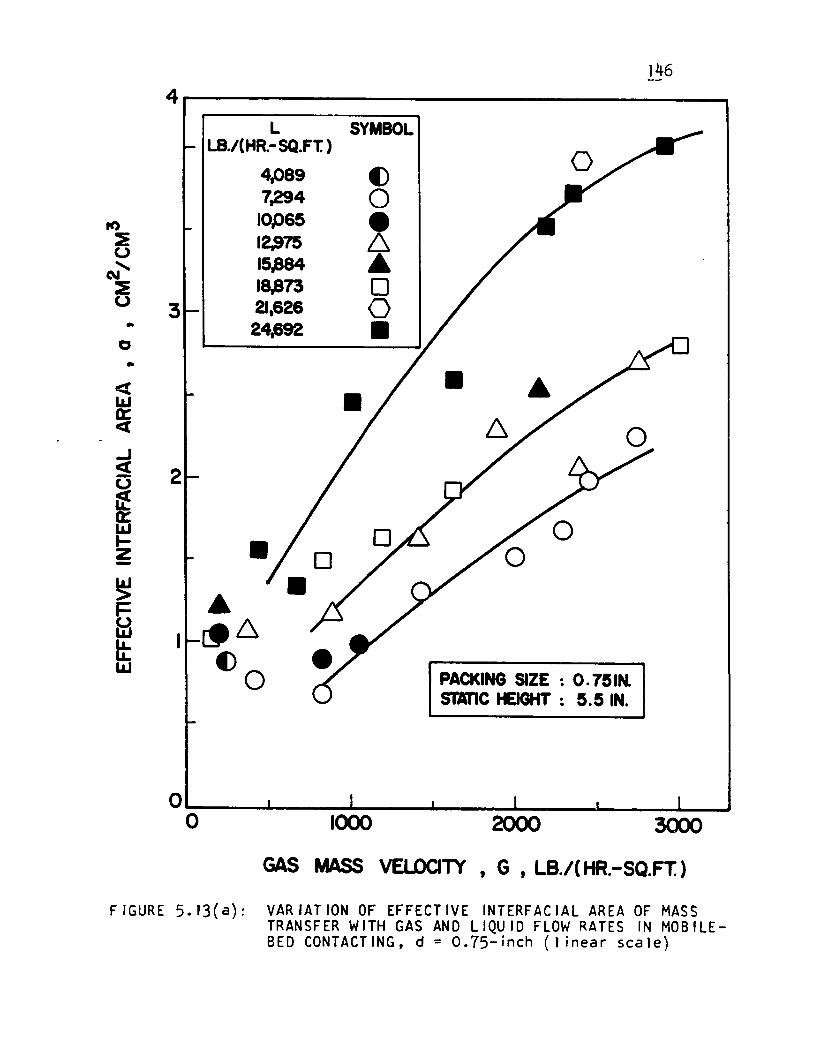
146
4
L SYMBOL LB./(HR.-SQ.Ft )
4.089 () 7,294 0
ft) 10.065 • :E 12.975 6 0 15.884 Â N ......
:E 1s.s73 0 0 3 21.626 0 .. 24,692 • 0 .. <[ L&J • Â a: cr ...J « 2 Ü ~ a: L&J ~ Z
~ Â F
frl ~6 lt ()O L&J
PACKIHG SlZE : O. 751H. STATle HElGHT : 5.5 IN.
o~ ____ ~ ____ ~ ____ ~ ____ ~ ______ ~ ____ ~~ o 1000 2000 3000
GAS MASS VELOCITY t G t LB.!( HR.-SQ.FT. )
FIGURE 5.13(a)= VARIATION OF EFFECTIVE INTERFACIAL AREA OF MASS TRANSFER WITH GAS AND LIQUID FLOW RATES IN MOBILEBED CONTACTING, d = O.75-inch (1 inear scale)

If)
~ u 5 N' ~ 4~ 0 .. 0 .. <[ lJJ ct: cr:
ci 2 -
1 -&LI 1.0 ~ üJ li.. li.. l&J 0.6
4
PACKING SIZE : 0.75 IN. 1
Il
L SYMBOL LB./( HR:-SQ.Ft)
7294 0 10065 e 12975 6 15884 Â 18873 0 21626 l8J 24692 Il
6 1000 2 3 4 6
GAS MASS VELOCITY t G t LB./(HR.-SQ.FT.)
FIGURE 5. 13(b): VARIATION OF EFFECTIVE INTERFACIAl AREA OF MASS TRANSFER WITH GAS AND llQUID F~OW RATES IN MOBllEBED CONTACTING, d = O.75-inch (log scale)
lqooo
:..... ~
-.;J
148
highest gas and liquid velocities of the present study
approach this limite The effective interfacial area may be
observed to increase with gas velocity continuously as this
limit is approached.
The limiting condition in the region of low values
of interfacial area is the trickle-bed operation, i.e. G = o.
Yoshida and Koyanagi (37) have in fact measured effective
interfacial area in a sphere-packed column in trickle-bed
operation. Interpolating from their results, the value of
effective interfacial area of 0.84 am: l may be obtained for
L = 1294 lb./hr.-ft~, which is the lowest liquid rate at
which extensive area measurements are available from the
present study.
From Figure 15(a) it may be seen that it would be
quite consistent with the data to terminate the line for the
new measurements with L = 7294 at the value of a = 0.84 am: l
at G = o. AlI lines shown on Figure 15(a) must of course
terminate along the ordinate at the value corresponding to
trickle-bed operation. The seven measurements made of inter
facial area in the range G ( 500 lb./hr.-ft~ may be noted on
this plot. However, as these values cover the full range of
liquid flow rates, 4089 ( L ( 24692, there is insufficient
data to define interfacial area accurately in the transition
region near the minimum fluidization velocity. For 0.75-inch
spheres it is of interest that the range for minimum fluidiza
tion velocity is approximately 90 ( Gmf ( 700 lb./hr.-ft~

149
for the range of 1iquid f10w rates used. As the transition
region near G = Gmf is not the region of primary industria1
interest, it was not studied in detail, and the 1ines on
Figure 15(a) are therefore not extended into this region.
Figure 5.13(b) shows on logarithmic scales the
variation of effective interfacial area for MBC with fluid
flow rates. As the seven data points for the transition
region close to minimum fluidization have been omitted from
Figure 5.13(b) for the reasons just noted, the straight 1 ines
which represent the data on logarithmic coordinates for the
fully developed mobile-bed conditions must not be extrapola
ted into the transition region. The equation which corres
ponds to the correlation on Figure 5.l3(b) is
a r=t:. -6 = 7.7'-1 X la (5.16)
Figure 5.14 shows the adequacy of fit of experimental data
with the proposed correlation.
As noted at the outset, the interfacial area in MBC
comprises the contributions of areas of gas bubbles, liquid
droplets and liquid films. One can therefore interpret the
results by reference to aerated liquid systems, spray columns
and packed beds.
A packed bed is characterized by flow of liquid as
thin films on packing surfaces while the gas phase remains as
a continuous phase occupying most of the free space. Droplet
and bubble formation begins to occur only in the loading

If)
~ N'
400~ ~ 0
PACKING SIZE : Oo751Noi .. 0 ..
~ 0 ~ a: « .-J 2.0
~ L SYMBOL
i LB./(HR:-SQ.FT.)
~ 7294 0
10065 -~
1.0 12975 6 15884 •
~ 18873 0 21626 ~
24692 • W
0.5 ---- -- ------ - -
5 105 2 5 106 2
L 0.6 X GO.9 1
l--
FIGURE 5.14: CORRELATION OF DATA ON EFFECTIVE INTERFACIAL AREA ~
OF MASS TRANSFER FOR MOBILE-BED CONTACTING
151
region close to the.flooding point. Interfacial area, as
weIl as the transport and other properties of a packed bed
below the loading point, are therefore influenced primarily
by liquid flow rate, the effect of gas flow rate usually
being insignificant (37,42,47).
Danckwerts and Sharma (53) have summarized for a
number of packings the data for effective interfacial area,
a, and liquid phase mass transfer coefficient, kL, for ab-
·sorption of carbon dioxide. Typically, the effective inter
facial area increases relatively rapidly with liquid flow
rate, in the low range of flows, probably due to difficulty
with fixed-bed contactors of wetting all the packing surface.
Effective interfacial area approached that of dry packing
below the loading point while at high flow rates, beyond the
loading point, effective interfacial area may eventually be
greater than that of the dry packing. It is probable that
sorne droplet and bubble formation occurs for the rather un
stable conditions above the loading point. The region for
fixed-bed contactors near the flooding point has not however
been adequately studied.
An interesting point of comparison for the results
of the present study may be made at L = 7294 Ib./hr.-ft~ At
this liquid flow rate the review of Danckwerts and Sharma (47)
indicates that effective interfacial area for columns packed
with various industrial packings (rings and saddles) is in
the range of 1 to 3.5 cm: 1• This comparison is somewhat mis-
151
region close to the flooding point. Interfacial area, as
weIl as the transport and other properties of a packed bed
below the loading point, are therefore influenced primari ly
by liquid flow rate, the effect of gas flow rate usually
being insignificant (37,42,47).
Danckwerts and Sharma (47) have summarized for a
number of packings the data for effective interfacial area,
a, and liquid phase mass transfer coefficient, kL, for ab
sorption of carbon dioxide. Typically, the effective inter
facial area increases relatively rapidly with liquid flow
rate, in the low range of flows, probably due to difficulty
with fixed-bed contactors of wetting aIl the packing surface.
Effective interfacial area approached that of dry packing
below the loading point while at high flow rates, beyond the
loading point, effective interfacial area may eventually be
greater than that of the dry packing. It is probable that
. some droplet and bubble formation occurs for the rather un
stable conditions above the loading point. The region for
fixed-bed contactors near the flooding point has not however
been adequately studied.
An interesting point of comparison for the results
of the present study may be made at L = 7294 lb./hr.-ft~ At
this 1 iquid flow rate the review of Danckwerts and Sharma (47)
indicates that effective interfacial area for columns packed
with various industrial packings (rings and saddles) is in
the range of 1 to 3.5 cm: l • This comparison is somewhat mis-
1~
leading, however, in that it is only possible to reach inter
facial areas in the order of 3.5 cm: 1 with 0.5-inch packing,
and such small packing has rather restricted application
because of the correspondingly 10w flooding velocities.
Interestingly enough, the interfacial area at L = 7294 is
effectively the same for 0.75-inch spheres in mobile beds
near the minimum fluidization condition, as it is for 1.5-
inch Raschig rings in fixed beds. As liquid flow rate in-
creases above this value, interfacial area increases more
rapidly for the MBC, and liquid rate for MBC can of course
be increased to much higher values before flooding (L )
25000 lb./hr.-ft~) than is the case for a fixed-bed column.
The dependence of interfacial area on liquid flow
rate provides another point of comparison between mobile-bed
and fixed-bed contactors. The correlation of results pro
posed here, equation (5.16), indicates that interfacial area
in MBC increases with LO.6, while Shulman et al. (30) report
that the exponent for a fixed-packed column is 0.45. As MBC
is characterized by much more highly turbulent flow condi
tions than those in a packed bed, it is not surprising to
obtain a higher exponent for liquid flow rate in our case.
The dependence of interfacial area on liquid flow
rate may also be compared with the variation of liquid holdup
with liquid flow rate. The results for 0.75-inch spheres
given in Section 5.1.3.2 indicate that liquid holdup in MBC
increases approximately proportional to LO.7 • The fact that

153
the dependence on liquid flow rate in the case of interfacial
area is somewhat less than it is for holdup is in fact a re
flection of the same phenomena which cause the reduction in
axial mixing of the liquid as liquid flow rate increases (cf.
Section 5.1.4). Thus although liquid holdup increases app
roximately with LO.7, interfacial area does not increase in
direct proportion to the increase in holdup because the
liquid flow conditions are changing in the direction of less
axial mi~ing associated with less tortuous flow path provided
by the more expanded bed. The result is less interfacial
area per unit amount of holdup, and thus a 10wer exponent for
interfacial area.
The contribution and effect of that fraction of the
interfacial area which is contributed by droplets will next
be examined. The recent results of Mehta and Sharma (69) for
interfacial area in a spray column are reproduced in Table 5.2;
the results tabulated for mass transfer coefficients will be
discussed in the subsequent section. It may be noted that
interfacial area in a spray column is relatively 10w and not
strongly dependent on either gas or liquid flow rate. An
estimate of the importance of drop let interfacial area may be
obtained from an order of magnitude calculation. Typical
values for holdup of the liquid and solid phases in MBC are
0.15 and 0.3 volume fraction, respectively, which correspond
to 0.55 volume fraction for gas-phase holdup. If 1 cm: 1 is
taken as a generously high estimate of droplet interfacial
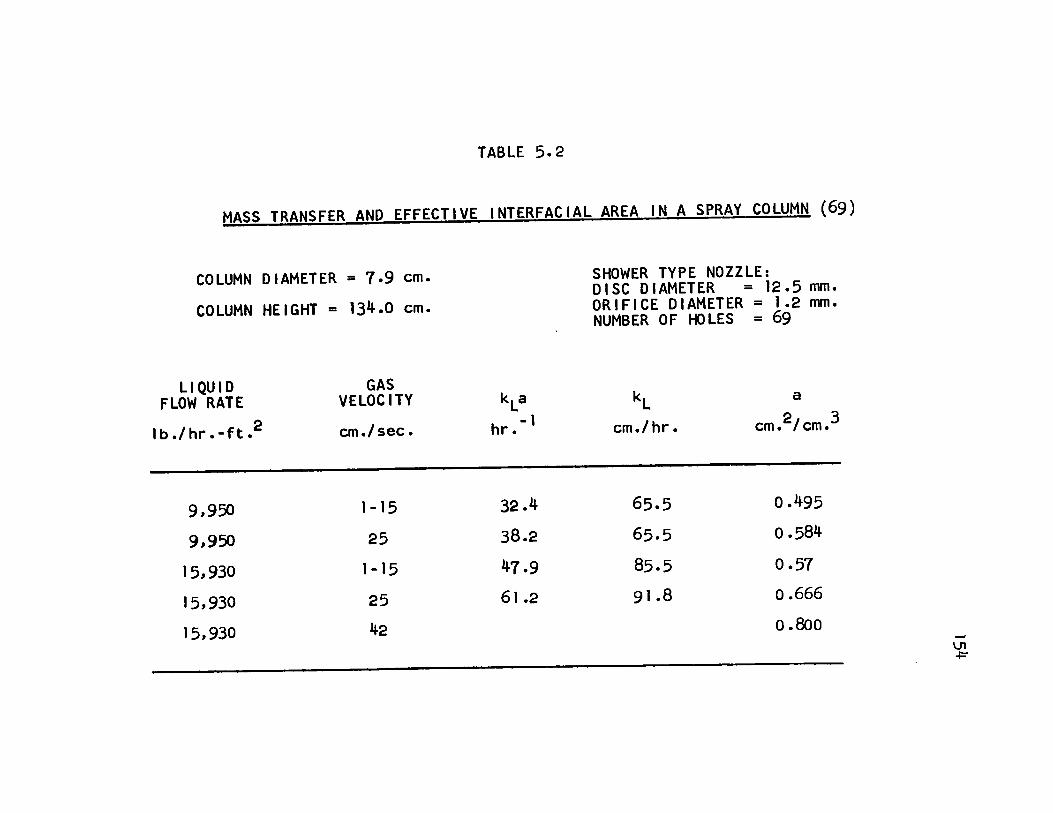
TABLE 5.2
MASS TRANSFER AND EFFECTIVE INTERFACIAL AREA IN A SPRAY COLUMN (69)
COLUMN DIAMETER = 7.9 cm.
COLUMN HEIGHT = 134.0 cm.
LI QUI 0 FLOW RATE
2 lb./hr.-ft.
9,950
9,950
15,930
15,930
15,930
GAS VELOCITY
cm./ sec.
1-15
25
1-15
25
42
kLa - 1 hr.
32.4
38.2
47.9
61.2
SHOWER TYPE NOZZLE: DISC DIAMETER = 12.5 mm. ORIFICE DIAMETER = 1.2 mm. NUMBER OF HOLES = 69
kL cm./ hr.
65.5
65.5
85.5
91.8
a
cm.2/cm.3
0.495
0.584
0.57
0.666
0.800 --\J1 .po

155
area in a spray column at high gas and liquid velocitires,
and it is assumed that droplet concentration in the gas
space in MBC is as high as in a spray column, then an upper -1 bound of 0.55 cm. follows for the contribution of inter-
facial area from droplets in MBC. As experimental values of
total interfacial area for MBC would be about 3 cm: l for
flow conditions corresponding to those for which the value
of 0.55 cm: 1 has been estimated, it is apparent that area
from drople~s qontributes a rathersmall amount to the total
interfacial area. Thus, in view of the low percentage of
total area which derives from droplets, combined with the
relative insensitivity of this contribution to gas and
liquid flow rate, it may be concluded that the strong effect
observed for gas flow rate on total interfacial area (a otGO.9)
must originate from the third source of interfaciaJ area,
namely, from bubbles. InterfaciaJ area from Jiquid fi Ims as
they occur in normaJ packed bed operation cannot of course
provide any significant amount of this dependency on gas flow
rate because, as aJready noted, Jiquid phase behaviour in
packed beds (holdup, axial mixing, interfaciaJ area) is
essentialJy independent of gas velocity.
Gas bubbJes are the source of interfacial area for
the generaJ class of equipment referred to as aerated con
tactors. This cJass of contactor may be taken as including
sparged reactors, bubbJe columns, sieve and bubbJe trays
where gas bubbles rise through a continuous liquid phase. In
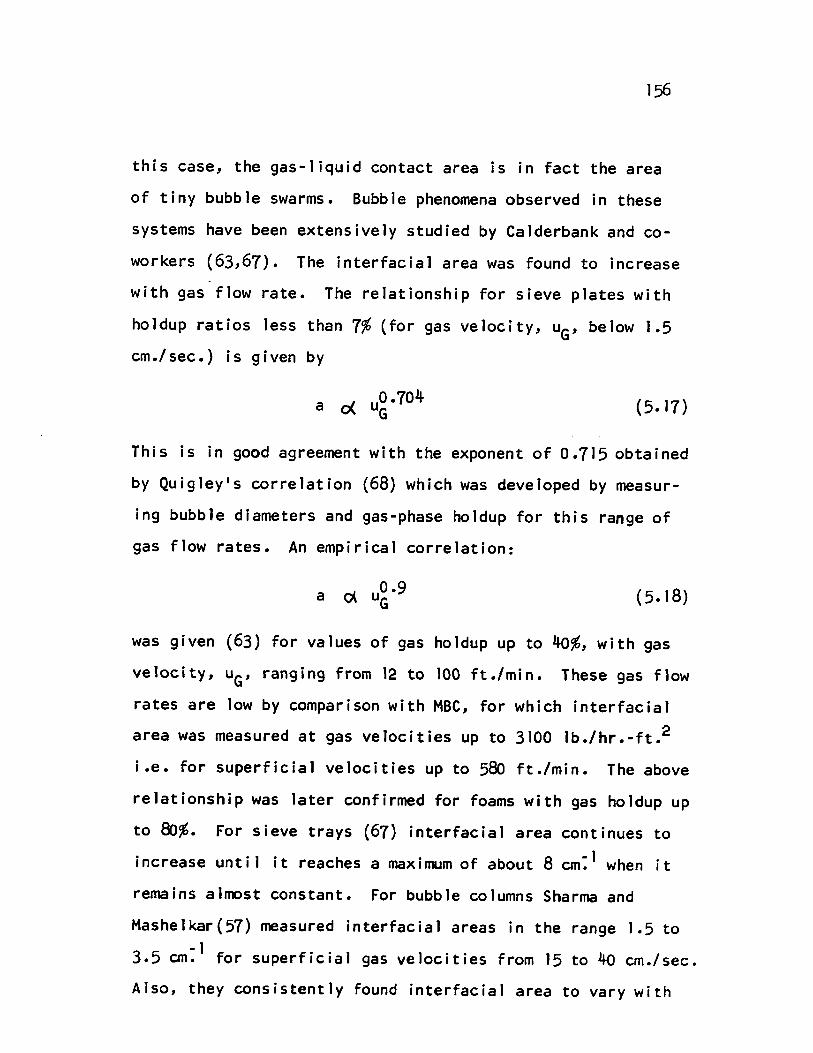
this case, the gas-liquid contact area is in fact the area
of tiny bubble swarms. Bubble phenomena observed in these
systems have been extensively studied by Calderbank and co
workers (63,67). The interfacial area was found to increase
with gas flow rate. The relationship for sieve plates with
holdup ratios less than 7% (for gas velocity, uG' below 1.5
cm./sec.) is given by
a 0( u~· 704 (5.17)
This is in good agreement with the exponent of 0.715 obtained
by Quigley's correlation (68) which was developed by measur
ing bubble diameters and gas-phase holdup for this range of
gas flow rates. An empirical correlation:
a (5.18)
was given (63) for values of gas holdup up to 40%, with gas
velacity, uG' ranging from 12 ta 100 ft./min. These gas flow
rates are low by comparison with MBC, for which interfacial
area was measured at gas velocities up to 3100 Ib./hr.-ft.2
i.e. for superficial velocities up to 580 ft./min. The above
relationship was later confirmed for foams with gas holdup up
to 80%. For sieve trays (67) interfacial area continues to
increase until it reaches a maximum of about 8 cm: 1 when it
remains almost constant. For bubble columns Sharma and
Mashelkar(57) measured interfacial areas in the range 1.5 to
3.5 cm: l for superficial gas velocities from 15 to 40 cm./sec.
AIso, they consistently found interfacial area to vary with
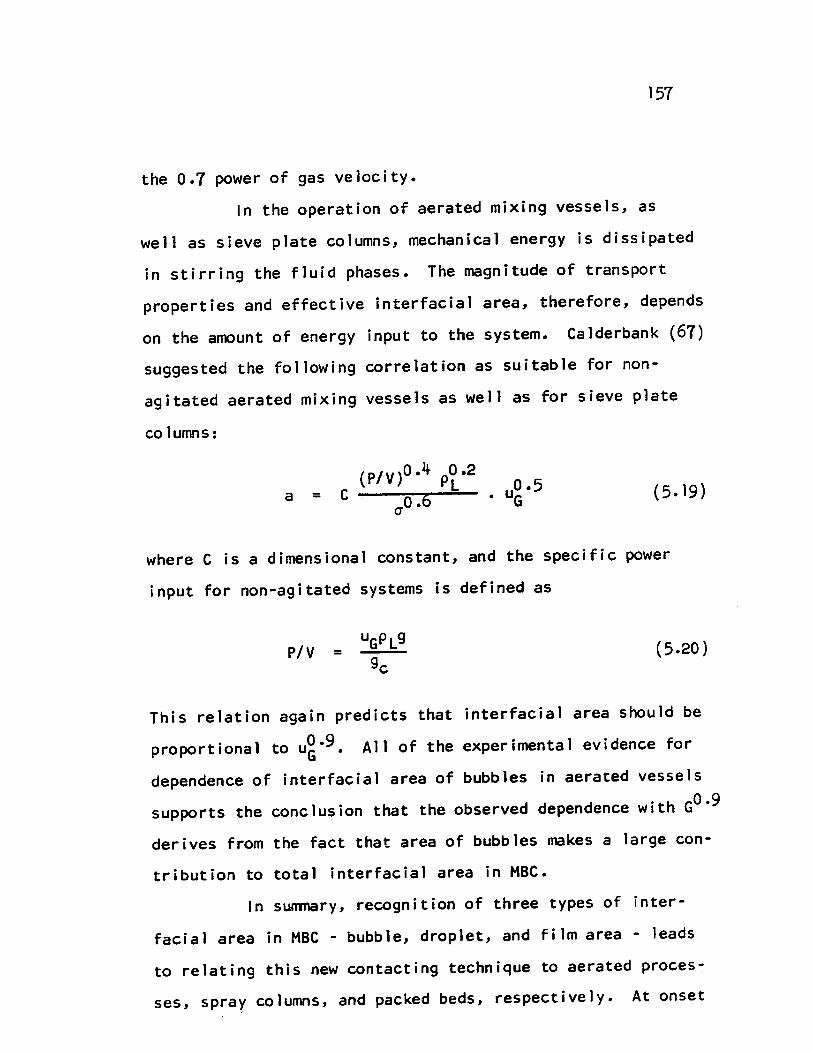
157
the 0.7 power of gas velocity.
ln the operation of aerated mixing vessels, as
well as sieve plate columns, mechanical energy is dissipated
in stirring the fluid phases. The magnitude of transport
properties and effective interfacial area, therefore, depends
on the amount of energy input to the system. Calderbank (67)
suggested the following correlation as suitable for non
agitated aerated mixing vessels as well as for sieve plate
columns:
a = (5.19)
where C is a dimensional constant, and the specifie power
input for non-agitated systems is defined as
PlV = (5.20)
This relation again predicts that interfacial area should be
proportional to ug·9 . AlI of the experimental evidence for
dependence of interfacial area of bubbles in aerated vessels
supports the conclusion that the observed dependence with GO.9
der ives from the fact that area of bubbles makes a large con
tribution to total interfacial area in MBC.
ln summary, recognition of three types of inter
facial area in MBC - bubble, droplet, and film area - leads
to relating this new contacting technique to aerated proces
ses, spray columns, and packed beds, respectively. At onset
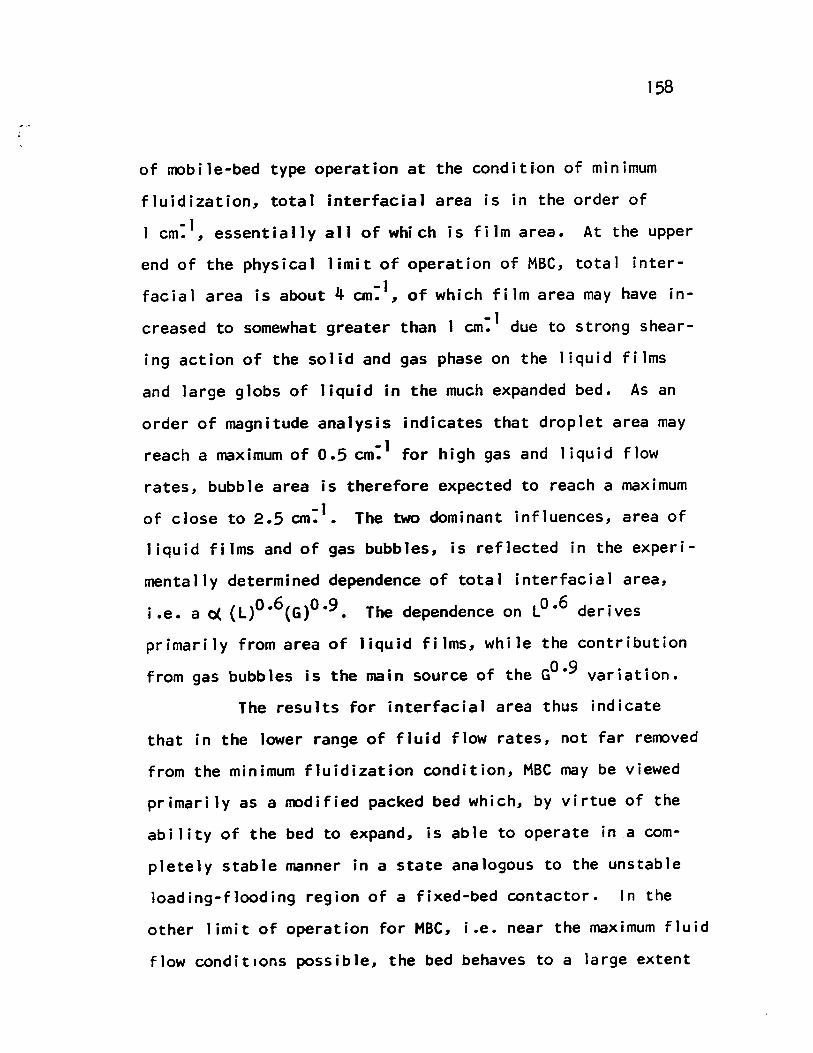
158
of mobile-bed type operation at the condition of minimum
fluidization, total interfacial area is in the order of
1 cm: l , essentially ail of which is film area. At the upper
end of the physical limit of operation of MBC, total inter
facial area is about 4 cm: 1, of which film area may have in
creased to somewhat greater than 1 cm: 1 due to strong shear
ing action of the solid and gas phase on the liquid films
and large globs of liquid in the much expanded bed. As an
order of magnitude analysis indicates that drop let area may -1 reach a maximum of 0.5 cm. for high gas and liquid flow
rates, bubble area is therefore expected to reach a maximum
of close to 2.5 cm: l • The two dominant influences, area of
liquid films and of gas bubbles, is reflected in the experi
mentally determined dependence of total interfacial area,
i.e. a ~ (L)0.6(G)0.9. The dependence on LO.6 derives
primarily from area of liquid films, while the contribution
from gas bubbles is the main source of the GO.9 variation.
The results for interfacial area thus indicate
that in the lower range of fluid flow rates, not far removed
from the minimum fluidization condition, MBC may be viewed
primari ly as a modified packed bed which, by virtue of the
ability of the bed to expand, is able to operate ina com
pletely stable manner in astate analogous to the unstable
10ading-flooding region of a fixed-bed contactor. In the
other limit of operation for MBC, i.e. near the maximum fluid
flow conditions possible, the bed behaves to a large extent
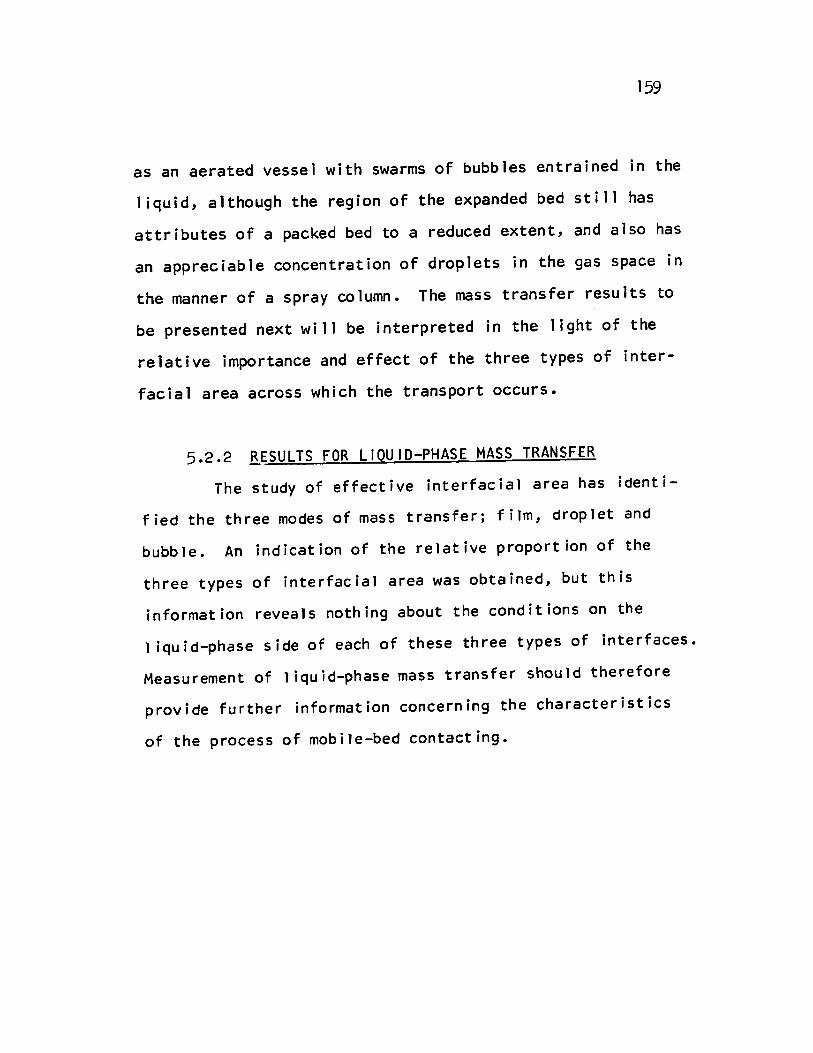
l~
as an aerated vessel with swarms of bubbles entrained in the
liquid, although the region of the expanded bed still has
attributes of a packed bed to a reduced extent, and also has
an appreciable concentration of droplets in the gas space in
the manner of a spray column. The mass transfer results to
be presented next will be interpreted in the light of the
relative importance and effect of the three types of inter
facial area across which the transport occurs.
5.2.2 ~ESULTS FOR LtQUtO-PHASE MASS TRANSFER
The study of effective interfacial area has identi
fied the three modes of mass transfer; film, droplet and
bubble. An indication of the relative proportion of the
three types of interfacial area was obtained, but this
information reveals nothing about the conditions on the
1 iquid-phase side of each of these three types of interfaces.
Measurement of liquid-phase mass transfer should therefore
provide further information concerning the characteristics
of the process of mobile-bed contacting.
160
5.2.2.1 SY~1~~112Œ~2f_~21~~;1~1~_blg~12:E~~~~ Mass TransTer CoeTTIClents ----------- --------------
Mass transfer coefficients for desorption of carbon
dioxide from water in a mobile-bed contactor with O.75-in.
spheres were calcu1ated with appropriate al10wance for the
effect of axial mixing in the 1 iquid phase. Equation (3.17)
gives outlet 1iquid composition as a function of 1iquid
Peclet number, P, and the number of mass transfer units, NOL.
Fffective height of the mob-ile bed was computed from Equation
(5.5) and Peclet numbers were obtained from Figure 5. l1(b).
Iterations were performed by changing NOL to converge at the
measured value of 1 iquid concentration at the exit from the
bed. The computer program for calculation of mass transfer
results is included in Appendix Il.4; complete results are
tabulated in Appendix 1.3, Table V.
Equation (3.17) with the assumption of plug flow in
the gas phase has been used as the ca1culation model. It is,
however, important to appreciate that the use of this mode 1
does not imply that there is no bacK-mixing of the gas phase
in a MBC, nor that thisbacK-mixing does not affect the per
formance of the contactor, including the mass transfer
coefficient. It is just that for the case of negl igible
overall change in gas phase concentration, as for the conditions
of this investigation, bacK-mixing in the gas phase does not
affect the driving force for mass transfer. Axial mix ing of
gas is no doubt present, and the calculated values of transfer
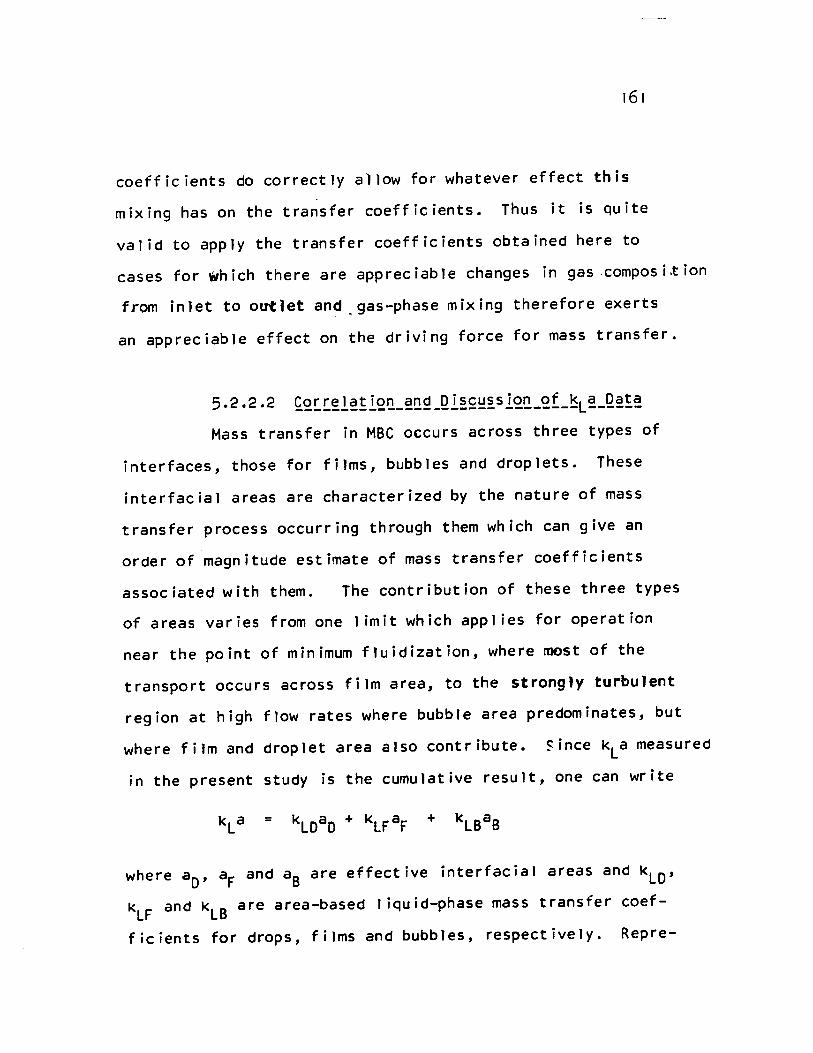
161
coefficients do correctly allow for whatever effect this
mixing has on the transfer coefficients. Thus it is quite
valid to apply the transfer coefficients obtained here to
cases for which there are appreciable changes in gascomposi.tion
from inlet to outlet and .gas-phase mixing therefore exerts
an appreciable effect on the driving force for mass transfer.
5.2.2.2 ÇQ~~~!~!lQQ_~Œ~_~l~~~~slQQ_Qf_~L~_~ê!~
Mass transfer in MBC occurs across three types of
interfaces, those for films, bubbles and droplets. These
interfacial areas are characterized by the nature of mass
transfer process occurring through them which can give an
order of magnitude estimate of mass transfer coefficients
associated with them. The contribution of these three types
of areas varies from one 1 imit which applies for operation
near the point of minimum fluidization, where most of the
transport occurs across film area, to the strongJy turbulent
region at high flow rates where bubble area predominates, but
where film and droplet area also contribute. 5ince KLa measured
in the present study is the cumulative result, one can write
= +
where aD' aF and aB are effective interfacial areas and KLD ,
KLF and k LB are area-based liquid-phase mass transfer coef
ficients for drops, films and bubbles, respectively. Repre-

sentation of the overall transfer coefficient in this manner
is the Key feature of the analysis and interpretation of
results for liquid-phase mass transfer.
Figures 15(a) and 15(b) show linear and logarithmic
variation of KLa with flow rates in a mobile bed pacKed with
O.75-inch spheres. Before analyzing the results in detail,
however, it is interesting to compare the mass transfer co
efficients for MBC with those of other gas-liquid contactOiS.
Thus Tables 5.3 and 5.4 show t~pical data for spray, bubble
and pa~ked columns while additional mass transfer data for
spray columns appear in Table 5.2 given earl ier. The following
general characteristics become apparent form these figures
and tables:
a) volumetric mass transfer coefficients for MBC
are considerably larger than those for pacKed beds or other gas-
1 iquid contactors (Tables 5.2,5.3 and 5.4),
b) volumetric mass transfer coefficients for MBC
increase strongly with liquid flow rate but are only slightly
dependent on gas flow rate. After decreasing somewhat with
gas velocity in the lower range of velocities, there is sorne
indication that at high gas flow rates, the volumetric transfer
coefficients may approach a constant value which ischaracter
ist ie of the liquid flow rate used.
An empirieal correlation was developed by cross
plotting the experimental data (Figure 5.13(b» and is given by
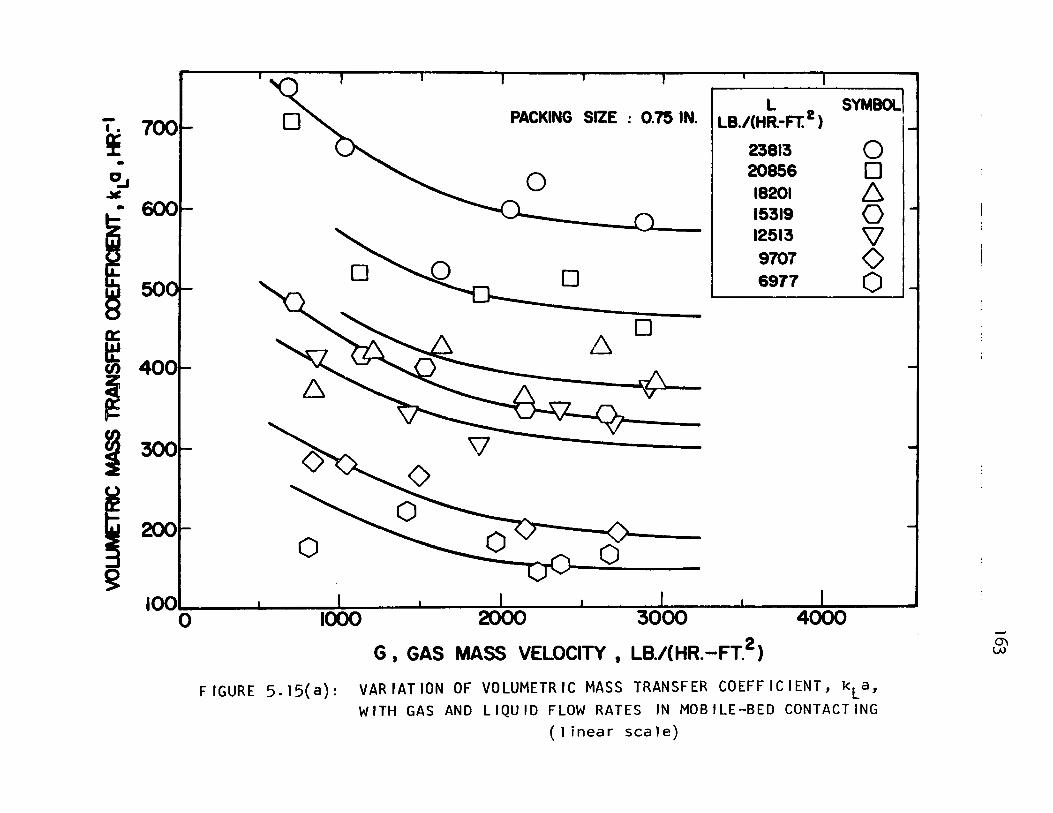
-1. 700 ~
L SYMBOL LB./(HR -FT. 2 )
23813 0 PACKING SilE: 0.75 IN.
• O.J
~600
20856 0 18201 6 15319 0
o 12513 \1 9707 0
50 o 6917 0
cr: ~ ~ 400
6 0
1300
1200 o
~ 1001 1 1 1 1
o 1000 2000 3000 4000
G, GAS MASS VELOCITY , LB.I(HR.-FT.2 )
FIGURE 5.15(a): VARIATION OF VOLUMETRIC MASS TRANSFER COEFFICIENT, kLa, WITH GAS AND LIQUIO FLOW RATES IN MOBILE-BEO CONTACTING
(1 inear scale)
0'\ UJ
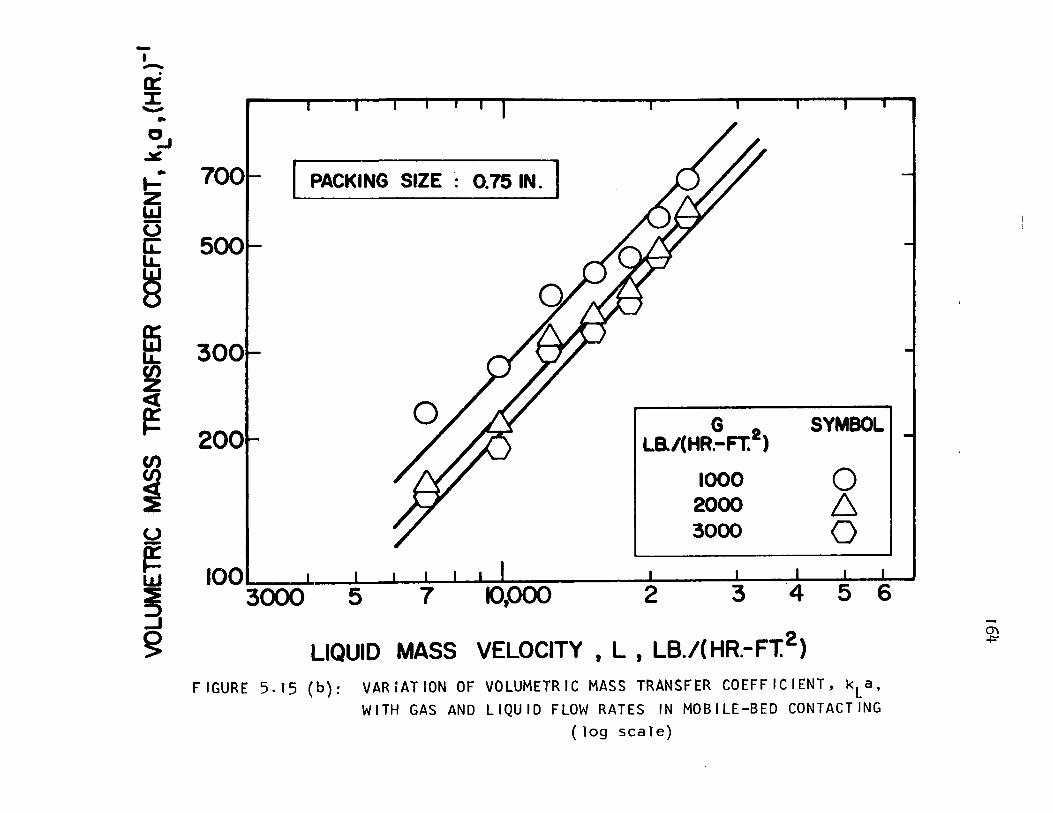
t -. a:: z '-'" .. 0..J ~ .. !z LLJ U IL: La..
~
m ~ (J)
~ u ~ LLJ
~ ~
- -
700 PACKING SIZE : 0.75 IN.
500
300
200 G LB./(HR.-FT.2 )
1000 2000 3000
SYMBOL
o 6 o
100. '" , "" , 3000 5 7 10.000 2 34 5 6
LIQUID MASS VELOCITY , L , LB./(HR.-FT2 )
FIGURE 5.15 (b): VARiATION OF VOLUMETRIC MASS TRANSFER COEFFICIENT, kLa, WITH GAS AND LIQUIO FLOW RATES IN MOBILE-BEO CONTACTING
(log scale)
m +="
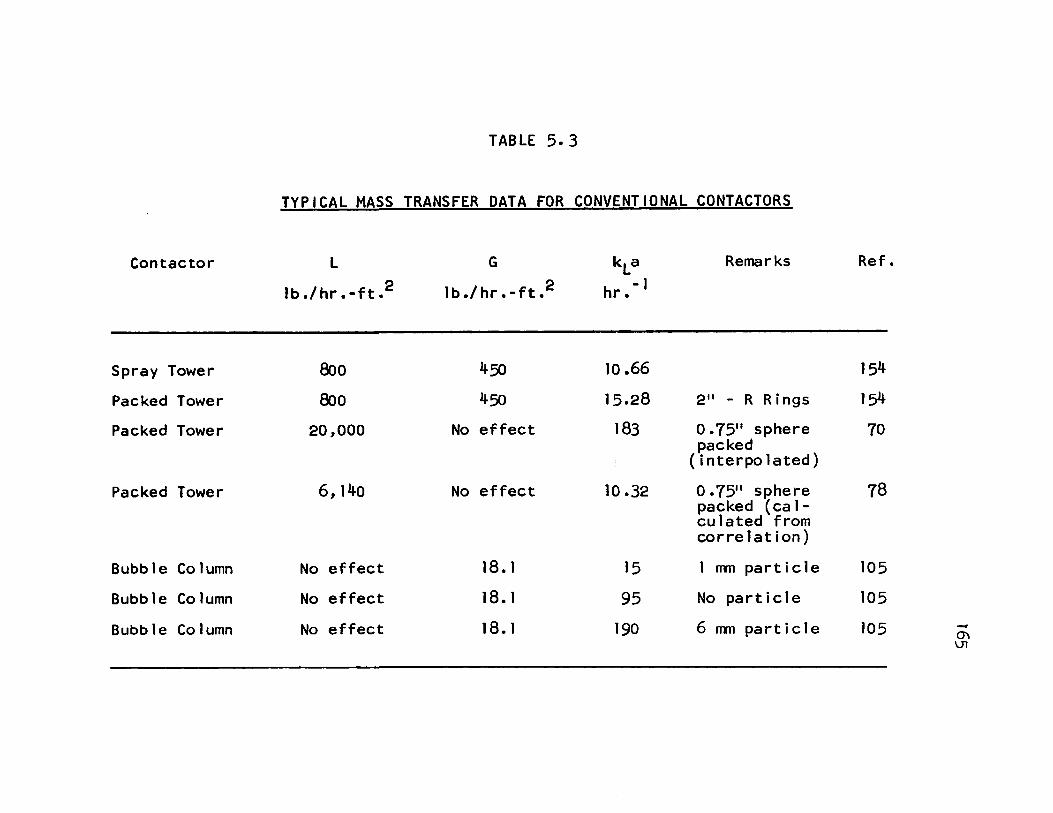
Contactor
Spray Tower
Packed Tower
Packed Tower
Packed Tower
Bubble Column
Bubble Column
Bubble Column
TABLE 5.3
TYPICAL MASS TRANSFER DATA FOR CONVENTIONAL CONTACTORS
L G
Ib./hr.-ft.2 Ib./hr.-ft.2
800 450
800 450
20,000 No effect
6, 140 No effect
No effect 18. 1
No effect 18. 1
No effect 18. 1
kLa
hr.- I
10.66
15.28
183
10.32
15
95
190
Remarks
2" - R Rings
o .75" sphere packed
(interpolated)
0.75" sphere packed (cal-culated from correlation)
1 mn particle
No particle
6 mn particle
Ref.
154
154
70
78
105
105
105 0\ \.J1
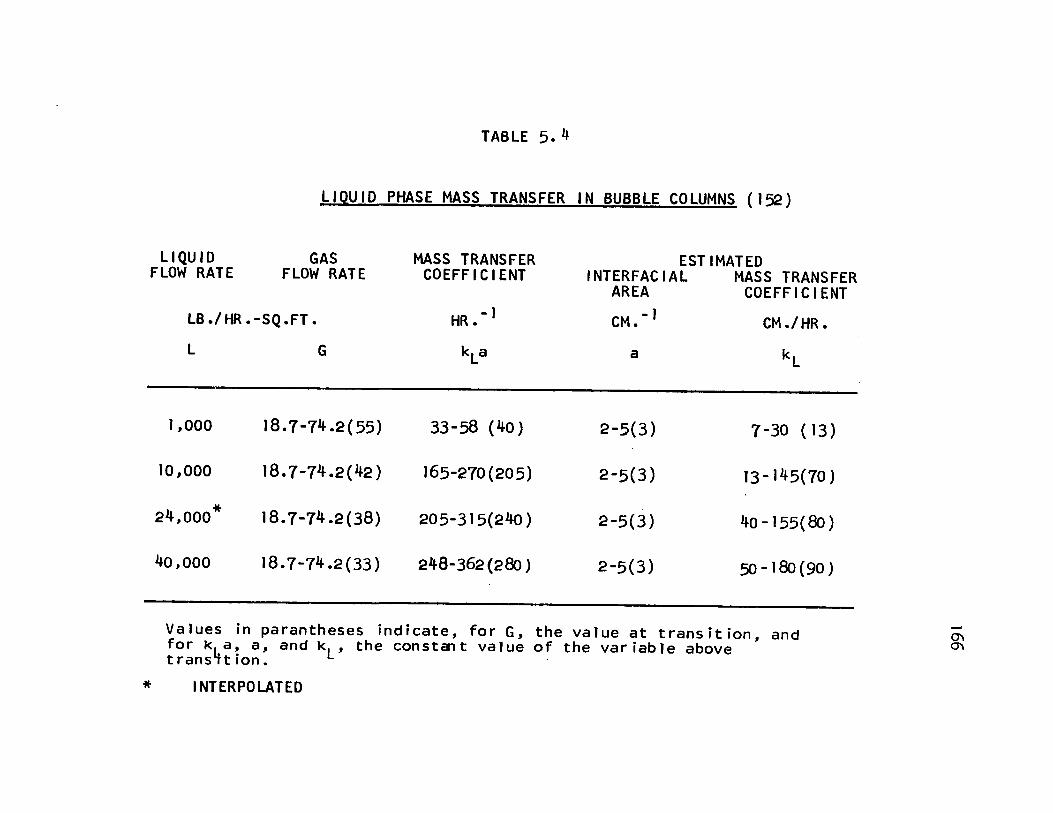
TABLE 5. 4
llQUIO PHASE MASS TRANS FER IN BUBBlE COlUMNS (152)
LlQU ID FLOW RATE
GAS FLOW RATE
LB.I HR • -SQ .FT •
L G
1,000 18.7-74 .2(55)
10,000 18.7-74 .2(42)
24,000 * 18.7-74 .2(38)
40,000 18.7-74 .2(33)
MASS TRANS FER COEFFICIENT
HR.- 1
kLa
33-58 (40)
165-270 (205)
205-315(240 )
248-362(280)
ESTIMATEO INTERFACIAL MASS TRANS FER
AREA COEFFICIENT
CM.- 1
a
2-5(3)
2-5(3)
2-5(3)
2-5(3)
CM ./HR.
k L
7-30 (13)
13 -1 45(70)
40 -155( 80)
50 -180 (90)
Values in parantheses indicate, for G, the value at transition, and for kl.a~ a, and kL, the constant value of the variable above trans1tlon.
* 1 NTERPOLATEO
0\ 0\
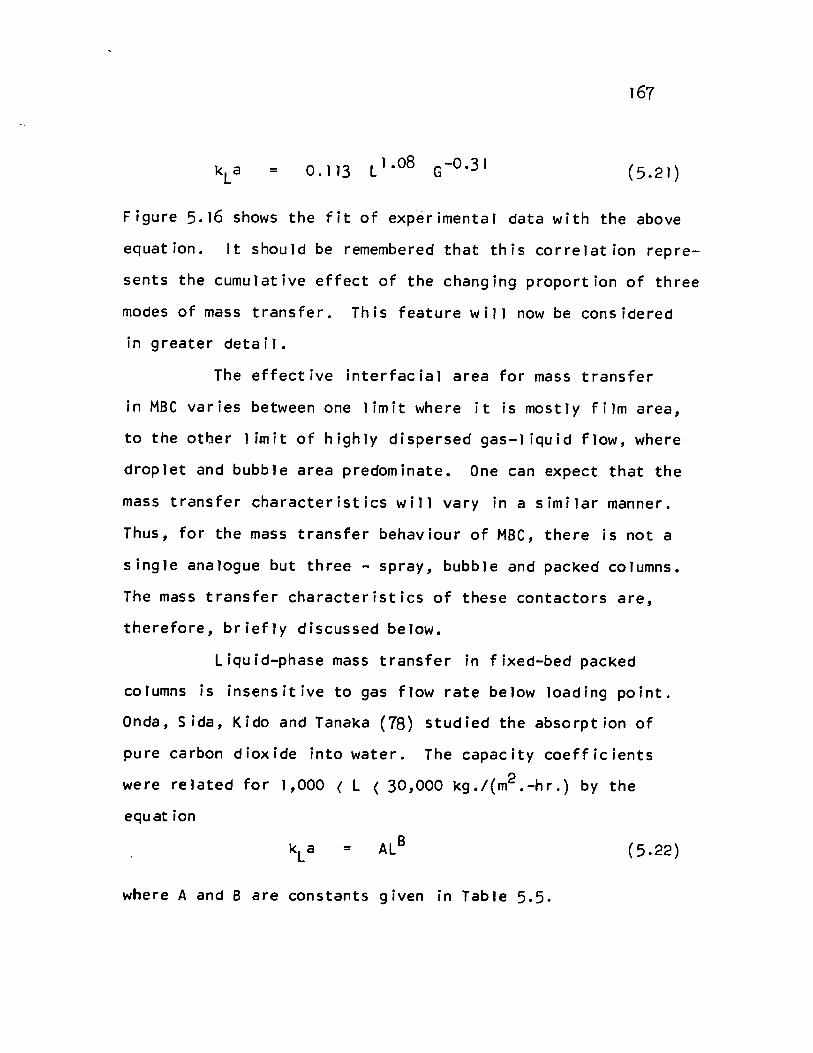
167
= 0.113 ll.08 G-0 •31 (5.21)
Figure 5.16 shows the fit of experimental data with the above
equation. It should be remembered that this correlat ion repre
sents the cumulative effect of the changing proportion of three
modes of mass transfer. This feature will now be considered
in greater detail.
The effective interfacial area for mass transfer
in MBC varies between one limit where it is mostly film area,
to the otber limit of highly dispersed gas-l iquid flow, where
drop let and bubble area predominate. One can expect that the
mass transfer characteristics will vary in a similar manner.
Thus, for the mass transfer behaviour of MBC, there is not a
single analogue but three - spray, bubble and packed columns.
The mass transfer characteristics of these contactors are,
therefore, briefly discussed below.
Liquid-phase mass transfer in fixed-bed packed
columns is insensitive to gas flow rate below loading point.
Onda, Sida, Kido and Tanaka (78) studied the absorption of
pure carbon dioxide into water. The capacity coefficients
were related for 1,000 ( L ( 30,000 kg./(m2 .-hr.) by the
equation
= (5.22)
where A and B are constants given in Table 5.5.

-1 • 0:: :E: ..
.. 1-Z L&J (3
ft L&J
8
168
IOOO'~~~--~------~----~--~--~--~-
9
8
7
6
5
4
2
100
PACKING SilE: 0.75 IN. 1
o CD
L SYMBOL
0 LB/(HR.-SQ.Ft)
23813 0 0 20856 0
18201 6 IS319 0 12S13 \] 97U1 8 6977
1.5 2000 3 4 5 6 7
LI.08 IG O.31
FIGURE 5.16: CORRELATION OF DATA ON VOLUMETRIC MASS TRANSFER COEFFICIENT FOR MOB/LE-BEO CONTACT/NG
8
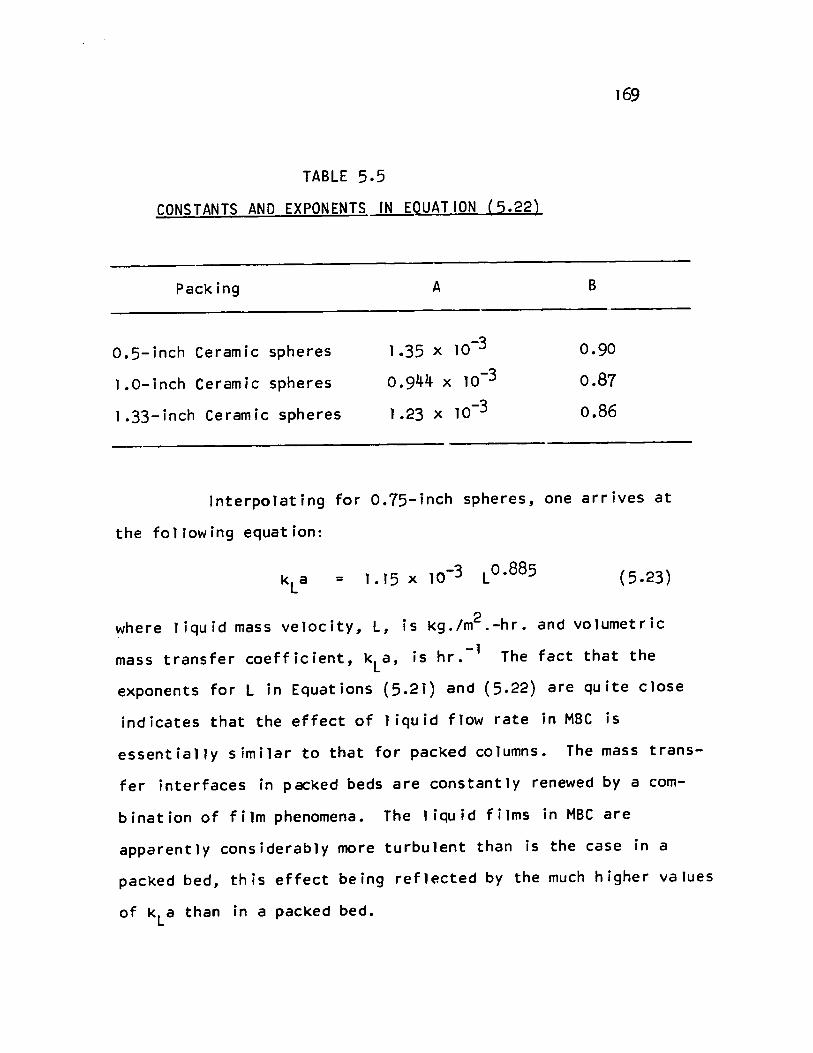
169
TABLE 5.5
CONSTANTS AND EXPONENTS IN EQUATION (5.22)
Paeking A B
0.5-inch Ceramic spheres 1.35 x 10⁻³ 0.90
I.O-inch Ceramic spheres 0.944 x 10⁻³ 0.87
1.33-inch Ceramic spheres 1.23 x 10⁻³ 0.86
Interpolating for 0.75-ineh spheres, one arrives at
the fol1owing equation:
= (5.23)
2 where liquid mass velocity, L, is kg./m .-hr. and volumetrie
mass transfer coeff ie ient, kL a, is hr. -1 The fact that the
exponents for L in Equations (5.21) and (5.22) are quite close
indieates that the effeet of 1 iquid flow rate in MBC is
essentially similar to that for paeked columns. The mass trans
fer interfaces in packed beds are eonstantly renewed by a com
bination of film phenomena. The 1 iquid films in MBC are
apparently considerably more turbulent than is the case in a
packed bed, this effeet being reflected by the much higher values
of kLa than in a paeked bed.

170
Bubble columns are characterized by no external
mixing, low gas velocity (~2 fpm) and in most cases practically
zero 1 iquid flow. However, Shulman and Holstad (152) examined
the mass transfer characteristics of bubble columns in which
there was a large downflow of water as the liquid phase. The
specific system studied was absorption and desorption of carbon
dioxide. The results are summarized in Table 5.4. Two
distinctly different regions were observed. At low gas velocities,
the rate of mass transfer increased with increasing gas velocity,
but at high gas velocities, kLa became independent of gas
velocity. The transition between the two regimes is characterized
by a decrease in mass transfer rate, as may be noted from
Table 5.4. The behaviour in the region of high gas flows could
be partly due to effective reduction in the level of turbulence
in the 1 iquid adjacent to the bubble surfaces because of the
onset of slug flow of the gas. Also, the mass transfer rates
were of the same order of magnitude as packed beds at low
1 iquid flow rates, and much higher mass transfer rates at high
1 iquid flow rates. The increase in liquid flow rate results
in more intense gas-liquid interaction which causes KLa to
increase significantly.
Spray columns are characterized by liquid drops
dispersed in a continuous gas phase. As can be seen fram
Table 5.2, liquid-phase transfer coefficients in spray columns
are not strongly affected by large variations in gas velocity,
171
although kLa does increase significantly with 1 iquid flow
rate. However, more significant yet is the fact that the
range of values ,of kLa for spray columns is very low, in the
range 10 to 60 hr- l . This low magnitude of kLa values is due
to the very low level of fluid motion in the interior of
tiny dr~ps.
Thus, analysis of available data for 1 iquid-phase
mass transfer indicates that kLa can be varied over a wide
range for both packed and bubble cOlumns, depending upon the
intensity of turbulence in the 1 iquid phase. The rate of
1 iquid-phase mass transfer in drops is, however, small. The
observed behaviour of MBC as a mass transfer device can be in-
terpreted as the result ofacombination of the flow conditions
typical of bubble columns, packed beds and spray columns.
Only two studies for mass transfer in MBC have
been reported, and these are of very limited scope (147,149).
AIso, these studies were for systems for which gas-side
resistance to mass transfer was predominant. Douglas et al.
(147) observed that volumetrie gas-phase mass transfer co
efficients, kGa, for MBC were 80-130 times higher than those
for a large coke packed absorption tower which had been used
for the same service. However, a large part of this improve
ment was no doubt due to the difficulty of wetting aIl the
pacKing in the fixed-bed tower. Similar results were obtained
by Douglas (149) in the study of ammonia absorption in water.
172
More insight into the mechanism of mass transfer
in MBC can be obtained by studying the area-based mass trans
fer coefficient, kL• As was done for effective interfacial
area and volumetric mass transfer coefficient, the behaviour
of kL
also will be analyzed in terms of the contributions to
total mass transfer from the three types of gas-l iquid inter
faces present in MBC. Thus kL
may be expressed in terms of
the coefficients and areas for drops, films.and bubbles as
follows:
= kLDa D + kLFaF + kLBa B
a (5.24)
As order of magnitude estimates for the three components of
effective interfacial area in MBC are now available, and
estimates can be made of the values of the transfer coefficients
for each type of interface, the mass transfer results for MBC
will be examined by comparison-with predictions based on this •
approach.
Experimental values of kL were obtained by dividing
the corresponding values of volumetrie mass transfer coefficient,
kLa, by effective interfacial area, a, as calculated from
Equat ion (5.16). The resu Its are shown in Figure 5.17(a) and (b)
for the range of flow rates studied. An empirical correlation
for estimating kL was obtained by dividing Equation (5.21) by
fquat ion (5.16):
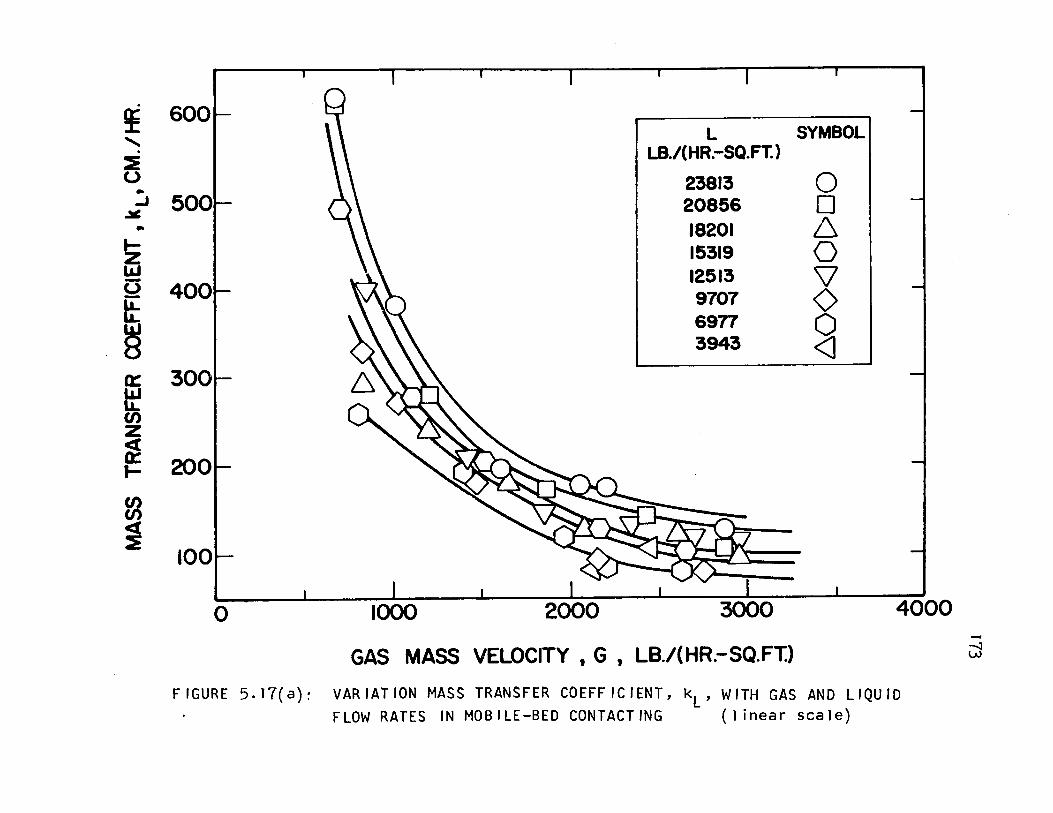
~ 600
" . ~ o .. ~-J 500 .. ffi G
~ Il::
~ Cf) z ~ t-
~ ~
400
300
200
100
o
L SYMBOL LB.I(HR.-SQ.FT. )
23813 0 20856 0 18201 6 15319 0 12513 'V 9707 0 6977 8 3943
1000 2000 3000 4000
GAS MASS VELOCITY , G , LB./(HR.-SQ.FT.)
FIGURE 5.17(a)~ VARIATION MASS TRANSFER COEFFICIENT, kL, WITH GAS AND LIQUIO FLOW RATES IN MOBILE-BEO CONTACTING (1 inear scale)
Lj
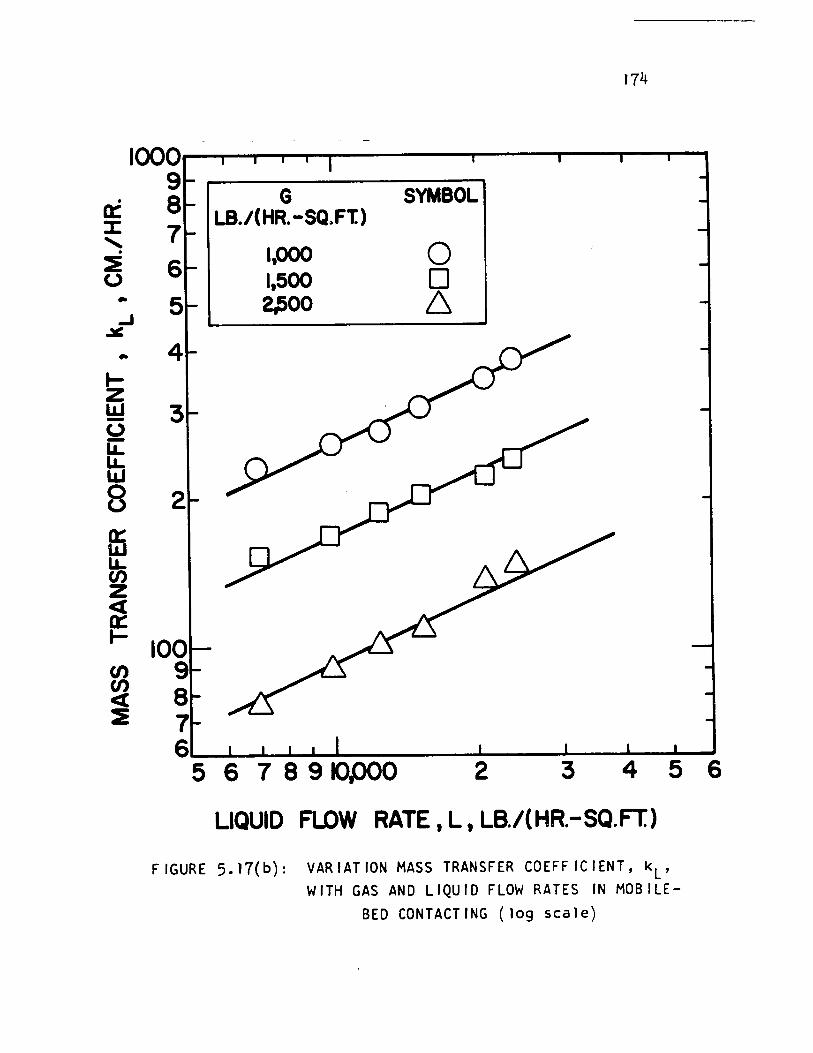
. a: ~
" . ::E 0 ..
..J ~ .. ~ Z LLJ -0 -LL LL LLJ
8 el LL CI) Z ~ a: ~
CI) CI) ~ :E
174
G SYMBOL LB./(HR. -SQ.Ft)
1,000 0 6 1,500 0 5 2,500 6 4
3
2
67891OPOO 2 3 4 5 6
LIQUID FLOW RATE 1 L t LB./(HR.-SQ.FT.)
FIGURE 5.17(h): VARIATION MASS TRANSFER COEFF ICIENT, k L, WITH GAS AND LIQUID FLOW RATES IN MOBILE
BED CONTACTING (log scale)
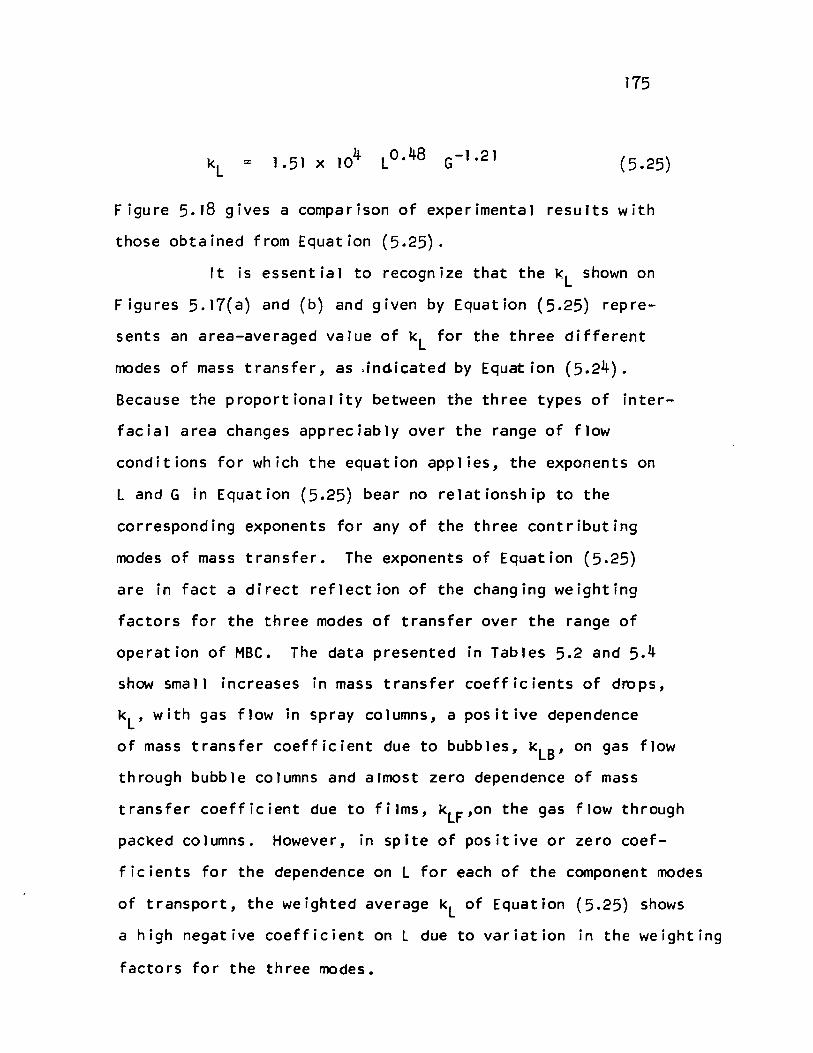
175
= (5.25)
Figure 5.18 gives a comparison of experimental results with
those obtained from Equation (5.25).
It is essential to recognize that the KL shown on
Figures 5.17(a) and (b) and given by Equation (5.25) repre
sents an area-averaged value of kL for the three different
modes of mass transfer, as ,inGicated by Equat ion (5.24).
Because the proportional ity between the three types of inter
facial area changes appreciably over the range of flow
conditions for which the equation applies, the exponents on
Land G in Equation (5.25) bear no relationship to the
corresponding exponents for any of the three contributing
modes of mass transfer. The exponents of Equation (5.25)
are in fact a direct reflection of the changing weighting
factors for the three modes of transfer over the range of
operation of MBC. The data presented in Tables 5.2 and 5.4
show small increases in mass transfer coefficients of drops,
kL' with gas flow in spray columns, a positive dependence
of mass transfer coefficient due to bubbles, kLB , on gas flow
through bubble columns and almost zero dependence of mass
transfer coefficient due to films, kLF,on the gas flow through
packed columns. However, in spite of positive or zero coef
ficients for the dependence on L for each of the component modes
of transport, the weighted average kL of Equation (5.25) shows
a high negative coefficient on l due to variation in the weighting
factors for the three modes.

, , .,
0: :I:
'" 8 . ::E 7 0 ..
.J 6 ~ .. 5, [PAC~ING SIZE: 0.75 IN. 1 ffi 0 4
~ 3r ~~ 6 L SYMBOL.
LB./(HR:-SQ.Ft)
21- AA.U" 1 23813 0 20856 0 18201 6
~ 15319 0
i 12513 'V
~ 100 8 9707 8 6977
ffi 9 ......., 3943
2 8 i2 7 ~ 5
6 789100 2 3 4 5 6 7 8 91000 2
CALClLATED MASS TRANSFER COEFFICIENT t k L t CM./HR. L&J
..... -..:J
FIGURE 5.18: COMPARISON OF EXPERIMENTAL VALUES OF MASS 0'1
TRANSFER COEFFICIENT, WITH CALCULATED VALUES FROM PROPOSED CORRELATION
177
Before proceeding further with analysis of mass
transfer in MBC based on the application of Equation (5.24)
it is necessary to estimate the values of kLD , kLF and kLB which would apply for conditions in a mobile bed.
For a rigid sphere model of small drops
= 6.58 D d
while for Kronig and Brink circulating large drops
= D 17.90 d
(5.26)
( 5.27)
Experimental rates have been found to vary from those for
rigid spheres in the case of highly viscous liquids, upto three
or four times the Kronig and Brink rate for fluids of low
viscosities. The mass transfer coefficients for small non-
circulating drops is generally an order of magnitude smaller
than for turbulent liquid fI ims. The values of kL shown in
Tables 5.2 and 5.3 confirm this behaviour. The data given
in Table 5.2 are used to estimate kL for drops.
The magnitude of the transfer coefficient in the case
of turbulent 1 iqJ id fi Ims depends on the rate of surface
renewal and is given for Danckwert's model of mass transfer
as kl OC ~. The experimentally measured values given in
Table 5.3 indicate that small values of kl of 10-180 hr.- I
occur for the relatively calm conditions of a packed bed. As
liquid flow conditions in MBC are mu ch more turbulent, one
should expect a significantly higher mass transfer coefficient.
178
Figure 5.17(a) shows that this is indeed so at low gas
velocities where the liquid flows primarily as liquid films,
the contributions due to drop and bubble phenomena being
still quite small.
A further complication with respect to estimating
the value of k LF results from the presence of swarms of
tiny gas bubbles dispersed in the liquid. The extent of
this effect is appreciable as indications are that, at high
rates of fluid flow, more than half of the interfacial area
may be present in this form. The presence of small bubbles
no doubt alters the structure of turbulence in the liquid
phase, including the interfacial reg ion. If the presence of
bubbles acts 'as- a turbulence suppressor in the 1 iquid, the
film mass transfer coefficient could be appreciably reduced
in the case of MBC.
The behaviour with respect to liquid-phase mass trans
fer of bubble columns for which there is a significant downflow
of 1 iquid is given in Table 5.4. The range of variation of k LB is very large, from 7 to 180 cm./hr. The estimates for transfer
coefficients in agitated and non-agitated g~s-sparged reactors
which are shown in Table 5.6 indicate a range of k LB from 12
to 110 cm/hr. It is particularly significant to note that
when high shear rates are applied to the liquid by means of
mechanical agitation, the increase in kL is strongly defermined
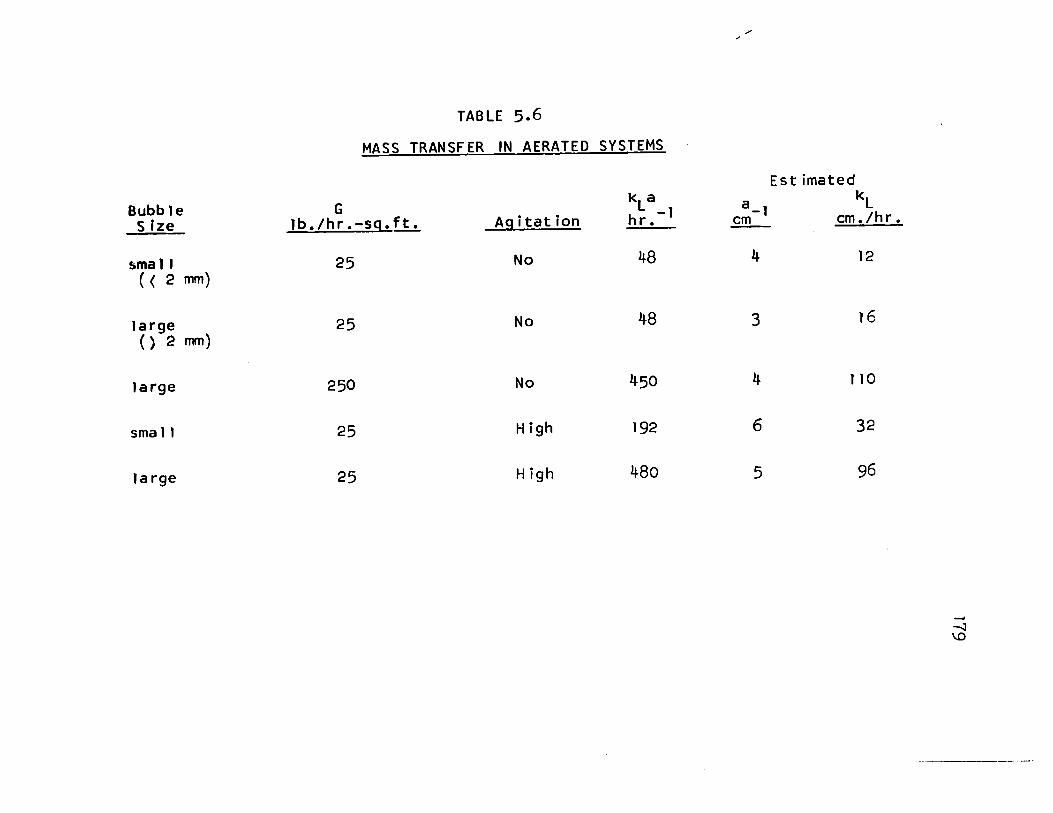
TABLE 5.6
MASS TRANSFER IN AERATED SYSTEMS
Bubble G kLa Size lb./hr.-s~(~ ~i~ation h -1 r.
!;ma 1 1 ( 2 mm)
25 No 48
large 25 No 48 () 2 mm)
large 250 No 450
sma 11 25 High 192
la rge 25 High 480
/'
a cm- l
4
3
4
6
5
Estimated kL
cm./hr.
12
16
110
32
96
-.;J \D

180
by the bubble diameter. For the agitation used, kl increases
by a factor of about 2.5 for small bubbles (diameter ( 2 111T1.)-
but by about a factor of 6 for larger bubbles. It is bel ieved
that the bubbles present in MBC operation are in the small
range, less than 2 mm. in diameter. Thus the mass transfer co
efficient, klB , forthe·bubble area in MBC is probably not strongly
dependent on the mixing conditions which prevai1.
An order-of-magnitude estimate can now be made for
MBC. For conditions just above minimum fluidization, the inter
facial area is believed to be mostly film area in a quite
turbulent state such that aF = 1 cm~l and k LF = 600 cm/h~ = k l •
For MBC conditions approaching the upper limit of possible
fluid flow rates considerable drop and bubble phenomena occur, and
one can estimate
klD = 100 cm/hr., aD = 0.5 cm. -1
k lF = 600 cm/hr., aF = 1 cm. -1
klB = 80 cm/hr. , aB = 2.5 cm. -1
whence from Equation (5.24),
= 100 x 0.5 + 600 x 1.0 + 80 x 2.5 (0.5 + 1.0 + 2.5)
= 212 cmlhr. This estimate is probably somewhat high because of the assumption
that th~ value of k LF = 600 cm/hr. does not decrease as the
bubble population increases. No quantitative basis is available
for est imat ing th i s effect. 1 fit we re es t imated that
IBI
kLF = 400 cm./hr., the weighted average value of kL would be
162 cm./hr. for MBC at high flow rates. From Figure 17(a)
it can be seen that at L - 24000,G = 3000 lbJhr.-sq.ft., the
value of kL is about 150 cm./hr. Errors enter the prediction
due to lack of complete and appropriate data for liquid-phase
mass transfer for films, droplets and bubbles, and to the
further difficulty of definition of flow conditions affecting
these modes of transfer within a mobile bed. However, such
close agreement between the actual and predicted values,
considering the difficulties associated with the prediction,
confirms the validity of the basic approach. This analysis
of the mass transfer results also confirms that the apparent
effect of gas and liquid flow rate on the mass transfer coef
ficient for MBC is in fact only reflection of the changing
relative importance of transport across the quite different
interfaces of films, bubbles, and droplets all of which co-exist
within a mobile bed.
5.2.3 CONCLUSION
Three modes of mass transfer in MBC have been identi
fied. The mass transfer which occurs across liquid films is
similar to that in a packed bed, except that the combined
effects of the shearing action of themoving balls and the
higher rates of countercurrent gas-liquid flow produce more
turbulent conditions with a higher rateof surface renewal and
thereby, larger values of kLo The other two modes of transport
correspond to those for drop lets in spray towers and bubbles
in gas-sparged vessels or bubble columns. The area-based trans
fer coefficients for both these modes are much less than for
liquid films. As the proportion of dispersed area, as bubbles
and drops, increases with gas flow rate in a mobile-bed, the
effect on the mass transfer coefficient which measures the
cumulative mass transfer is for a strong decrease in kL at
limiting values of high gas rate. The Increase of total'
interfacial area with gas flow rate due to small droplets and
swarms of bubbles produced is however sufficiently large that
the volumetrie mass transfer coefficient, kLa, decreases only
moderately with increasing gas velocity. The net effect Is
that liquid-phase mass transfer rates are much higher in mobile
bed contacting than for other gas-liquid contactors.
183
VI. SUMMARY AND CONTRIBUTION TO KNOWLEDGE
Mobile-bed contacting was studied in a 5.5-inch
diameter column over the range of gas and liquid flow rates
200 (G < 3,600 and 4000 ( L ( 25,000 Ib./hr.-ft. 2 with packing
of density 0.15 gm./cc. The results are of two types:
• HYDRODYNAMIC EFFECTS; including minimum
fluidization veJocity, bed expansion, liquid
holdup and axial mixing of the liquid, and
• MASS TRANSFER EFFECTS; including effective
interfacial area and liquid-phase mass
transfer coefficient.
The important features of this study can be summarized
as follows:
1. The determination of residence time distribution by the
method of transfer function analysis, as presented recently by
Ostergaard (105) and Michelsen and Ostergaard (103), has been
extended to include the case of finite-bed boundary conditions
which give a better representation of a real system. With
this extension, the method has been applied in determining axial
mixing of the liquid phase in a mobile-bed contactor. The dis
persion mode 1 is found to give a good representation of the
liquid flow. Axial mixing in MBC was determined for four sphere
sizes, 0.5, 0.75, 1.0 and 1.5-inch. The results for l.5-inch
spheres are not rel;able as they are significantly influenced by
184
wall effect. Liquid mixing, characterized as Peclet number,
changes in the direction of plug flow when either liquid flow
rate or sphere diameter is increased, and towards a more com~
pletely mixed state when gas flow rate is increased, The in
crease in Peclet number with packing size or liquid rate is
interpreted as resulting from a decrease in the tortuosity of
the 1 iqu id flow path. Increased gas rate on the other hand
increases the stirring action, hence leads to decreased Peclet
numbers. A graphical correlation of Peclet number as a function
of the se variables is presented. An aspect'of the results
which is of direct relevance to the economics of industrial
application is that the general level of mixing conditions in
MBC is appreciably closer to plug flow than was indicated by
a previous study of more 1 imited scope.
2. Minimum fluidization velocity, Gmf , was studied and a
corre lat ion is p resen ted fo ruse in the design of MBC_
Gmf = 1570 dl. 5 x 10-4.3 x 10-5 L
for 4,000 ( L ( 25,000 Ib./hr.-ft. 2
This correlation predicts values of Gmf which are in good
agreement up to sphere size of 1.0 in.; some deviation from
the predicted values is observed for the case of 1.5-inch
spheres because of wall effect.
2. Bed expansion for MBC is correlated by:
h = 1.5 x 10⁻⁴ t~ Gmf 1.2
where h = H - h
5 , and
This correlation is valid for 0.75- and 1.0-inch spheres, and
would probably apply for 0.5-inch spheres in a larger column.
ln the 5.5-inch diameter column there was a severe problem of
the 0.5-inch balls sticking to the walls and agglomeratinJ
within the bed, 50 the bed expansion results for 0.5-inch
spheres are not considered representative. The magnitude of
the wall effect for 1.5-inch spheres did not seem as serious
for bed expansion as in the case of the other measurements.
For systems using similar packing of 0.15 gm./cc. density
and a supporting grid of 70% free area, both Gmf and bed
expansion can be predicted with reasonable accuracy.
4. Liquid holdup was determined for aIl sphere sizes,but re
sults for the smallest and largest spheres (0.5 and 1.5-inch)
are unrel iable for the reasons noted in connection with the
bed expansion data. Liquid holdup increases with 1 iquid flow
rate and decreases with packing size. With gas flow rate,
holdup decreases as gas velocity increases above the minimum
fluidization velocity and either approaches a constant value
or, in some cases, begins to increase again at high gas velocity.
Graphical representation of hOldup data is presented.
5. For tricKle-bed operation (no gas flow) liquid holdup and
1 iqu id-phase mixing were determined for spherical pacKing by the
same technique as used for the MBC study, i.e. by pulse testing
using simultaneous two-point measurements. The results in both
186
cases agree weIl with those of other workers except for the
case of the 1.5-inch packing which give anomalously low values
of holdupandhigh values of dispersion coefficient because
of the presence of wall effect.
6. The various hydrodynamics results taken together form a
consistent pattern of the physical behaviour of a mobile-bed
contactor. Some limits have been established for conditions
of operation as a uniformly l1)obHe bed and without significant
wall effect. Large differences between the .liquid mixing re-
sults of Chen and Douglas on a 1.5-inch diameter column and
the present investigation with a 5.5-inch column indicate that
until further study resolves the disagreement, care must be
exercised in applying laboratory results for scale:~p~to
larger units. As large discrepancies exist in the numerous
results for mixing in countercurrent gas-liquid flow through
fixed-bed contactors, it is not surprising that the hydro
dynamics of the much more recent mobile-bed techn ique rema in as
yet imperfectly understood.
7. Three distinct types of interfacial areas, droplet, film
and bubble area, have been identified as contributing to the
total effective interfacial area in MBC. At the condition of
minimum fluidization, total interfacial area is about 1 cm- I .,
most of which is area of 1 iquid films. For high fluid Flow
rates near the upper physical limit of operation of MBC the
total interfacial area is about 4 cm.- l , and this is now
187
believed to be distributed approximately as 2.5 cm.- l from
bubbles, 1.0 cm.- l from films, and 0.5 cm.- l from droplets.
The dependence of total interfacial area
a = (0.75-inch spheres)
is consistent with the effect of gas and liquid flow on the
three components of total interfacial area.
This finding indicates that MBC has attributes to a varying
extent of three older classes of gas-liquid contactors -
packed beds, spray cOlumns, and aerated processes such as
bubble columns and gas-sparged vessels. Thus MBC operation
varies from a lower 1 imit which is similar to a packed bed
in the loading reg ion with continuous liquid film flow, to
the other extreme of a highly dispersed gas (as bubbles) and
liquid (as droplets) system.
8. l iquid-phase mass transfer in MBC, determined with
appropriate allowance for the effect of axial dispersion in
the liquid phase, has been analysed on the basis of the contri
butions made by mass transfer in droplets, films and bubbles.
The 1 iquid-phase volumetrie mass transfer coefficients are
correlated by
= O. 1 1 3 LI. 08 G -0 .3 1
and the area-based mass transfer coefficient as
= 1 • 5 1 x 1 04 L O• 48 G - 1 .2 1
These correlations are valid over the entire range of stable
operation of MBC and result from the continuous changes in
contribution to total mass transfer made by drop, film and
bubble phenomena with changing gas and liquid flow rate.
Order-of-magnitude calculations show that the overall values
of mass transfer coefficient which were measured are in
general agreement with predictions based on the contributions
by mass transfer through bubbles, films, and droplets, where
the contributions are weighted according to the relative
proportions of each type of area. This analy5is of the mass
transfer behaviour reinforces the interpretation of MBC as
having varying degrees of similarity to three other classes
of gas-liquid contactor - packed beds, aerated processes,
and spray columns. Finally, mass transfer rates in MBC are
found to be superior to the older contacting processes.
SUGGESTIONS FOR FUTURE WORK
Hydrodynamic behaviour of MBC appears to be strongly
influenced by the size of the unit and the packings used. One
of the important parameters that could provide some insight
into the flow behaviour of MBC is the pressure drop. It would
be interesting to examine the relationship between pressure
drop and physical parameters like bed expansion, minimum
fluidization velocity, properties of the fluids, packing size
and density and geometry of the supporting grid. Less sub
jective criteria for measurement of bed expansion and minimum
fluidization velocity are needed.
ln reacting systems the extent of mixing in the gas
phase determines the conversion that would be obtained in an
MBC reactor. Knowledge of the flow behaviour of gas in MBC
is therefore required. Since the residence time of gas in MBC
is very short (~0.1 sec.) it is rather difficult to determine
the residence time distribution in a two-phase flow system by
transient response experiments. However, it may be feasib1e
to obtain RTO for the gas phase from steady-state conversion
obtained for a system where gas undergoes a chemical reaction
of accurately known kinetics.
Although the diffusion model has been quite satisfactory
in the present study, there is need for better models for char
acterizing mixing. The statistical approach to this problem may
be applicable in future studies.

1.
2.
3.
4.
5.
6.
7.
8.
190
REFERENCES
Fenske, M.R., C.O. Tongberg and D. Quiggle, Ind. Eng. Chem., 26, 1169 (1934).
Furnas, C.C. and F.M. Bellinger, Trans. A.I.Ch.E., 31, 251 (1938).
Shu1man, H.l., C.F. Ullrich and N. Wells, A.I.Ch.E.J., l, 247 (1955).
Onda, K., E. Sada and Y. Murase, A.I.Ch.E.J.,~, 235 (1959).
Varrier, C.B.S. and K.R. Rao, Trans. Indian Inst. Chem. Engrs.,l1, 29 (1960-61).
Davidson, J.F., Trans. Inst. Chem. Engrs., (loncbn), TI, 13 1 (1959).
Uchida, S. and S. Fujita, J. Soc. Chem. Ind. (Japan), }9, 876, 432B (1936)., 40, 538, 238B (1937), __ 41, 503, 275B (1938).
Shulman, H.l., C.G. Savini and R.V. Edwin, A.I.Ch.E.J., .2, 479 (1963).
9. Cooper, C.M., R.J. Christ1 and l.C. Perry, Trans. A. 1 • Ch. E ., TI, 979 (194 1).
10. Mayo, F., T .G. Hunter and A.W. Nash, J. Soc. Chem. Ind. (london), 5i, 375T (1935).
11. Payne, J.W. and B.F. Dodge, Ind. Eng. Chem., 24,630 (1932).
12. Simmons, C.W. and H.B. OSborn, Jr., Ind. Eng. Chem., 26,529 (1934).
13. Elgin, J.C. and F.B. Weiss, Ind. Eng. Chem., 11,435 (1939).
14. Elgin, J.C. and B.W. Jesser, Trans. A.I.Ch.E.,.3.2, 377 (1943).
15. Shulman, H.l., C.F. Ullrich, N. Wells and A.l. Proulx, A.I.Ch.E.J., 1,259 (1955).
16. Otake, T. and E. Kunugita, Chem. Eng. (Japan), 22, 144 (1958).
191
17. White, A.M., Trans. A.I.Ch.E., 3J., 390 (1935).
18. Buchanan, J.E., Ind. Eng. Chem. Fundamentals, 6, 400 ( 1967) .
19. Gelbe, H., Chem. Eng. Sci.,~, 1401 (1968).
20. Otake, T. and K. Okada, Kagaku Kogaku, 11, 176 (1953).
21.
22.
23.
24.
25.
26.
27.
28.
29.
30.
31-
32.
33.
34.
35.
36.
37.
Mohunta, D.M. and G.S. laddha, Chem. Eng. Sei., 20, 1069 (1965).
Khanna, R.T., McGil1 Univ., Masterls Thesis, April 1966.
De Maria, F. and R.R. White, A.I.Ch.E., 6, 473 (1960).
Schiesser, W.E. and l. lapidus, A.I.Ch.E.J., 1, 163 ( 1961) .
Chen, B.H., Ph.D. Thesis, McGill Univ., April 1965.
Hwa, C.S. and R.B. Beckman, A.I.Ch.E.J., 6,359 (1960).
Standish, N., Ind. Eng. Chem. Fundamentals, 1~ 3 12 (1968).
Gel l prin, N.T., V.l. Grishko, V.I. Savchenko and V.M. Shchedro, Chem. and Pet. Eng., 1,36 (1966).
Chen~ B.H. and W.J.M. Douglas, Cano J. Chem. Eng., 245 ( 196t1) .
Shulman, H.l., C.F. Ul1rich, A.l. Proulx and J.O. l i l1l11e rman, A. 1 . Ch. E • J ., l, 253 (1955).
Whitt, F.R., Brit. Chem. Eng., 1,43 (1956).
Whitt, F.R., Brit. Chem. Eng.,.3., 179 (1960).
Fujita, S. and S. Sakuma, Chem. Eng. (Japan), 18,64(1954).
Hikita, H. and T. Kataoka, Chem. Eng. (Japan), 20, 528 (1956).
Hikita, H. and T. Kataoka, Chem. Eng. (Japan), 24,2 (1960).
Onda, K., Chem. Eng. (Japan), 24,490 (1960).
Yoshida, F. and T. Koyanagi, Ind. Eng. Chem., ~, 365 (1958).
38.
39.
40.
41.
42.
44.
45.
46.
47.
48.
49.
50.
51.
52.
53.
54.
55.
192"
Yoshida, F. and T. Koyanagi, A.I.Ch.E.J., 8, 309 (1962).
De Wall, K.J.A. and W.J. Beek, Chem. Eng. Sei., 22, 585 (1967).
De Wall, K.J.A., A.C. van Mameren and P.V. Rottenburg, Transport Phenomena, Inst. of Chem.Engrs. (London), Sym. Series, 6, 60 (1965).
",
Danckwerts, P.V. and A.J. G il1ham , Trans. Inst. Chem. Engrs. 44, T42 (1966).
Vidwans, A.D. and M.M. Sharma, Chem. Eng. Sci., 22, 673 (1967).
Jhaveri, A.S. and M.M. Sharma, Chem. Eng. Sci., ga, 669 (1968).
Mannford-Doble, M., Ph.D. Thesis, University of Cambridge ( 1966) .
Yoshida, F. and Y. Miura, A.I.Ch.E.J.,,2, 331 (1963).
Fellinger, L., Sc.D. Thesis, Mass. Inst. Tech., Mass. ( 1941) •
Danckwerts, P.V., Ind. Eng. Chem.,~, 1460 (1951).
Higbie, R., Trans. A.I.Ch.E.,.3.l, 365 (1935).
Danckwerts, P.V., Trans. Farad. Soc., 47,1014 (1951).
Richards, G.M., G.A. Ratcliff and P.V. Oanckwerts, Chem. Eng. Sc i., ..!.2, 325 (1964).
Porter, K.E., Trans. Inst. Chem. Engrs., 44, T25 (1966).
Sharma, M.M., R.A. Mashlekar and V.O. Mehta, Brit. Chem. Eng., li, 70 (1969).
Danekwerts, P.V. and M.M. Sharma, Trans. Inst. Chem. Engrs., 44, CE244 (1966). "
Porter, K.E., Trans. Inst. Chem. Engrs., il, 320 (1963).
Rodionov, A.I. and A.A. Vinter, Intnl. Chem. Eng., 1, 468 (1967).
56.
57.
58.
59·
60.
61.
62.
63.
64.
66.
67.
68.
70.
71.
193
Pohoreck i, R., Chem. Eng. Sc i ., ~, 1447 (1968).
Sharma, M.M. and R.A. Mashelkar, Tripartite Chem. Eng. Conf., Sym. on Mass Transfer w~h Chemica1 Reaction, Montreal, Session 2, 14 (1968).
Astarita, Gr, G. Marcucci and l. Coliti, li Chimica Industries,46, 9 (1964).
Francis, R.C. and J.C. Berg, Chem. Eng. Sei., 22, 685 ( 1967) .
Eben, C.D. and R.l. Pigford, Chem. Eng. Sei., 20,9 (1965).
Porter, K.E., M.B. King and K.C. Varshney, Trans. Inst. Chem. Engrs., 44, T274 (1966).
Calderbank, P.H., Trans. Inst. Chem. Engrs., .3.§., 443 ( 1958) .
lb id, 31, 173 (1959).
Dillon, G.B. and I.J. Harris, Cano J. Chem. Eng., 44, 307 (1966).
Westerterp, K.R., l.l. van Dierendonck, and.de Kraa, Chem. Eng. Sci.,.ill, 157 (1963).
Banerjee, S., Ph.D. Thesis, University of Waterloo, Waterloo, Ont. (1968).
Calderbank, P.H., F. Evans, and J. Rennie, Part 1 and II, proceedings of the International Sympos ium on Distillation, Brighton, Inst. Chem. Engrs., London, May 1960.
Quigley, C.J., A.I. Johnson, B.l. Harris, Chem. Eng. progr., Sym. Series., 2l (16),31 (1955).
Mehta4 K.C. and M.M. Sharma, Brit. Chem. Eng., 12(11), 1440- 4(1970), 12, (12), 1556-58 (1970).
Sherwood, T .K. and F .A.l. Holloway, Trans. A.I.Ch.E., 3.2, 39 (1940).
Molstad, M.C., J.F. McKinney and R.G. Abbey, Trans. A . 1 . Ch. E ., 3,2, 605 (1 943) .
Deed, D.W., P.W. Schultz and T.B. Drew, Ind. Eng. Chem., 3,2,766 (1947).
73.
74.
75.
76.
77.
78.
79.
80.
8l.
82.
84.
85.
86.
87.
88.
89.
90.
Van Krevelen, D.W. and P.J. Hoftijzer, Rec. Trav. Chim., 66, 49 (1947).
194
Fujita, S. and T. Hayakawa, Chem. Eng. (Japan), 20, 113 (1956).
Hikita, H., Chem. Eng. (Japan), 26, 725 (1962).
Onda, K., E. Sada. andY. Murase, A.I.Ch.E.J.,5, 235 (1959).
Onda~ K., E. Sada and M. Saito, Chem. Eng. (Japan), ~, tj20 (1961).
Onda, K., E. Sada, C. Kido and A. Tanaka, Chem. Eng. (Japan), gr, 140 (1963).
Vivian, J.E. and D.W. Peaceman, A.I.Ch.E.J., 2,437 ( 1956) .
Mada, J. and H. Shinohara, Kagaku Kogaku, 28, 159 (i964).
Bischoff, K.B., Chem. Eng. Sei., Jg, 69 (1960).
Schmalzer, O.K. and H.E. Hoelscher, A.I.Ch.E.J., 17, 1, 104 -11 0 (1971).
Astarita, G., "Mass Transfer with Chemical Reaction", Elsevier Publ ishing Company, New York (1967).
Van Krevelen~ D.W. and P.J. Hoftijzer, Rec. Trav. Chim., QI, 133 (194tj).
Van Krevelen, D.W. and P.J. Hoftijzer, Chem. Eng. Sei., 2, 145 (1953).
Van Kr64elen, D.W., Chem. Ing. Techn.,.3.Q, 551 (1958).
Brian, P.L.T., J.F. Hurley and E.H. Hasseltine, A.I.Ch.E.J., 1, 226 (1961).
Pearson, J.R.A., Appl. Scient. Res., AXI, 321 (1963).
Danckwerts, P.V., Chem. Eng. Sei., 2, 1 (1953).
Carberry, J.J. and R.H. Bretton, A.I.Ch.E.J., 4, 367 ( 1958) .

91.
92.
93.
94.
95.
96.
97.
98.
99·
100.
101.
102.
103.
104.
105.
195
Cairns, E.J. and J. Prausnitz, A.I .Ch.E.J., 6, 400 (1960).
Cairns, E.J. and J. Prausnitz, Chem. Eng. Sei., jg, 20 (1960).
Miyauchi, T. and T. Vermeulen, Ind. Eng. Chem. Fundamentals, g, 113 (1963).
Sater, V.E. and Levenspiel, Ind. Eng. Chem. Fundamenta1s, 2, 86 (1966).
Kramers, H. and G. A1berda, Chem. Eng. Sei., 2, 173 ( 1953) .
Mason, D.R. and E.L. Piret, Ind. Eng. Chem., 42, 817 ( 1950) •
Deans, H.A. and L. Lapidus, A. I.Ch.E.J., 6, 656 (1960).
Levenspiel, 0, C.J.Ch.E., 40, 135 (1962).
Levenspiel, O. and K.B. Bischoff, "Advan. in Chem. Eng.", 4,95-198 (1963).
Einstein, H.A., Ph.D. Thesis, Eidg. Techn. Hoehschule, Zur ich (1937).
Vermeulen, T., Lawrence Radiation Laboratory Report,UCRL-8658, Univ. of Cal if., Berkeley, April 1959.
Jacques, G.L. and T. Vermeulen, Lawrence Radiation Laboratory, Univ. of Cal if., Berkeley, Report UCRL-8029 ( 1958) .
Miche1sen, M.L. and K. Ostergaard, Chem. Eng. Sei., ~, 583-592 (1970).
Lees, F .P., Chem. Eng. Sei., 24, 1607-1613 (1969).
Ostergaard, K., "Studies of Gas-Liqu,id Fluidization", 1 Kommission Hos Teknisk Forlag (1969).
106. 'Hoogendoorn, C.S. and J. Lips, C.J.Ch.E., ~, 125 (1965).
107. Van Deemter, J.J., F.J. Zuiderweg and A. Klinkenberg, Chem. Eng. Sei., 2,271 (1956).
108. Hofmann, H., Chem. Eng. Sci.,.l±, 193 (1961) __
J09.
JJO.
JJ1.
JJ2.
113.
JJ4.
JJ5.
116.
117.
J 18.
JJ9.
120.
121.
122.
123.
124.
125.
196
Weber, H.H., Untersuchungen uber die Verweilzeiteilung in Aufstromkolonnen. Diss., Tech. Hochschule, Darmstadt, Germany, 1961.
Harrison/. O., M. lane and D.J. Walne, Tran. Inst., Chem. En 9 r s ., ~, 2 14 (1962). /'
Stemerding, S., Chem. Eng. Sei., li, 209 (1961).
Otake, T., E. Kunugita and T. Yamanishi, Chem. Eng. (Japan), 26, 800 (1962).
Word, T.T., Lawrence Radiation Laboratory, University of California, Berkeley, Report UCRL-9844, September (1961).
Dunn, W.E., T. Vermeulen, C.R. Wi'Kie and T.T. Words, Lawrence Radiation Laboratory Report UCRL-10394, Univ. of Cal if., Berkeley, July 1962.
Chen, B.H. and W.J.M. Douglas, C.J.Ch.E.,.iL, 113 (1969).
Kunugita, E.T., T. Otake and K. Yoshii, Chem. Eng. (Japan), 26, 672 (1962).
Pearson,J.R.A. A G.M. Richards and H. Skoczylas, Chem. E n g. Sei., 1.2, tj2 (1964).
Lelli, U., Ind. Eng. Chem. Fundamentals, 4, (3),360 (1965).
Sleicher, C.A., A.I.Ch.E.J., 2, 145 (1959).
Miyauchi, T., A.K. McMul1en and T. Vermeulen, UCRL-3911, Rev. 1960 (Washington: U.S. Atomic Energy Commission).
Stemerding, S. and F.J. Zuiderweg, Trans. Instn. Chem. Engrs., lI, CE 156 (1963).
Rod, V., Brit. Chem. Eng.,.2, 300 (1964).
Ibid., !l, 483 (1966).
Tepe, J.B. and B.F. Dodge, Trans. A.I .Ch.E., 32,255 (1943).
Sater, V.L, Ph.D. Thesis, Illinois Institute of Techno1ogy, Chicago, Ill., p. 127, January 1963.
126.
127.
128.
129.
130.
131.
132.
133.
134.
135.
136.
137.
138.
139.
140.
141.
144.
197
Hartland, S. and J.C. Mecklenburgh, Chem. Eng. Sei., gr, 1209 (1966).
J.C. Mecklenburgh and S. Hartland, Chem. Eng. Sci.,~ 57 (1968).
Ibid., ~, 67 (1968).
1 b id., ~, 8 1 (1968).
1 b id., ~, 1421 (1968).
Furzer, I.A. and G.E. Ho, Chem. Eng. Sei., ~, 1297-1300 (1970) .
Sullivan, G.A. and R.E. Treybal, The Chemical Engineering Journal, ~, 302-10 (1970).
Van der Laan, E. T., Chem. Eng. Sc i., 1, 187 (1958).
~/ehrier, J.F. and R.H. Wilhelm, Chem. Eng. Sei., 6, 89 (1956) .
Ibid., 8, 309 (1958).
Fan, L.T. and Y.K. Ahn, CEP Sym. Series,~, 946 (1963).
Van Cauwenberghe, A.R., Chem. Eng. Sei., gr, 203-5 (1966).
Brenner, H., Chem. Eng. Sei., 11,229 (1962).
Yagi, S. and T. Miyauchi, Chem. Eng. (Japan), 11,382 ( 1953) .
Miyauchi, T., Lawrence Radiation Laboratory, University of Ca1ifornia, Berkeley, Report UCRL-3911 (1957).
McMullen, A.K., T. Miyauchi and T. Vermeulen, Lawrence Radiation Laboratory, Univ. of Cal ifornia, Berkeley, Report UCRL-3911 Supplement (1958).
Miyauchi, T. and T. Vermeulen, Ind. Eng. Chem. Fundamentals, 2, 304 (1963).
Hennico, A., G. Jacques, and T. Vermeulen, UCRL-I0696 ( 1963) .
Vogel, A.I., A Text-Book of Quantitative Inorganic Analysis, 2nd Ed., Longmans (1957).
145.
146.
147.
148.
149.
150.
J 51.
152.
153.
154.
155.
156.
157.
158.
159.
198
R em i 1 1 eux, par J., A. T . 1 • P. B u 1 1. No. 2, 12., 94 (J 965) .
Kielback, A.W., Chem. Eng. Prog.)Symp. Ser. l .2L (35), 51 (1961).
Douglas, H.R., I.W.A. Snider and G.H. Tom1inson, Chem. Eng. prog., 22 (12), 85 (1963).
Kie1back, A.W., Paper Presented at A.I.Ch.E. Meeting, December 1960.
Douglas, W.J.M., Chem. Eng. prog., 60 (7),66 (1964).
Blyakher, I.G., L. Va. Zhivaikin and N.A. Yurovakaya, Intnl. Chem. Eng., 1,485 (1967).
levsh, I.P., N.I. Krainev and M.I. N iyazov, Intnl. Chem. En 9 ., 8, 3 11 (1968).
Shulman, H.l. and M.C. Molstad, Ind. Eng. Chem., 1fg, 1058 (1950).
Rabin, 1., Bechtel Corp., private Communication.
Perry, R.H., Chemical Engineer's Handbook, p. 700, 3rd. Ed., 1948.
Nijsing, R.A.T.O., R.H. Hendriksz, and H. Kramers, Chem. En g. Sc i ., lQ, 88 (1959).
Thomas, W.J. and M.J. Adams, Trans. Faraday Society, 61, 668 (1965). -
van Krevelen, D.W. and P.V. Hoftyzer, Chimie et Industrie: Numéro Spéciale du XXle Congrès International de Chimie Industrielle, Bruxelles, Sept., 168 (1948).
Roberts, D. and P.V. Danckwerts, Chem. Eng. Sci., 11, 961 ( 1962) •
Nijsing, R.A.T.O. and H. Kramers, Chem. Eng. Sci., 8, 81 (1958) .
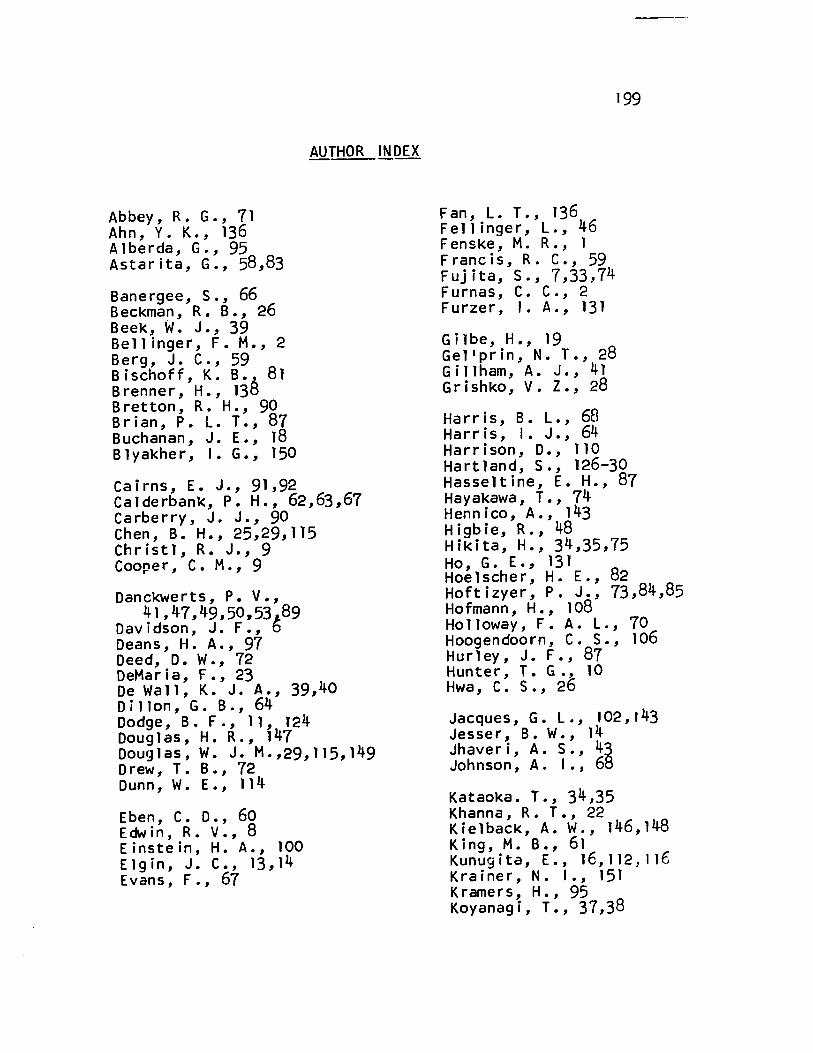
Abbey, R. G., 71 Ahn, Y. K., 136 A lberda, G., 95 Astarita, G., 58,83
Banergee, S., 66 Beckman, R. B., 26 Beek, W. J., 39 Bell inger, F. M., 2 Ber 9 , J. C., 59 Bischoff, K. B.
 81
Brenner, H., 13t5 Bretton, R. H., 90 Br i an, P. L. T., 87 Buchanan, J. E., 18 BI yakhe r, 1. G., 150
AUTHOR INDEX
Cairns, E. J., 91,92 Calderbank, P. H., 62,63,67 Carberry, J. J., 90 Chen, B. H., 25,29,115 ChristI, R. J., 9 Cooper, C. M., 9
DanckWerts, P. V., 41,47,49,50,53 J 89
Davidson, J. F., b Deans, H. A., 97 Deed, D. W., 72 DeMar i a, F., 23 De Wall, K. J. A., 39,40 Dillon, G. B., 64 Dodge, B. F., 11, 124 Douglas, H. R., 147 Douglas, W. J. M.,29,115,149 Drew, T. B., 72 Dunn, W. E., 114
Eben, C. D., 60 EdNin, R. V., 8 E i n ste in, H. A., 1 00 Elgin, J. C., 13,14 Evans, F., 67
Fan, L. T., 136 Fellinger, L., 46 Fenske, M. R., 1 Francis, R. C., 59 Fujita, S., 7,33,74 Furnas, C. C., 2 Furzer, 1. A., 131
G i 1 be, H., 19 Gel'prin, N. T., 28 Gillham, A. J., 41 Grishko, V. Z., 28
199
Harris, B. L., 68 Ha r ris , 1. J., 64 Harrison, D., 110 Hartland, S., 126-30 Hasseltine, E. H., 87 Hayakawa, T., 74 Hennico, A., 143 H i 9 b i e , R., 48 Hikita, H., 34,35,75 Ho, G. E., 13 1 Hoelscher, H. E., 82 Hoftizyer, P. J., 73,84,85 Hofmann, H., 108 Hol1oway, F. A. L., 70 Hoogendoorn, C. S., 106 Hu r 1 ey, J. F., 87 Hunter, T. G., 10 Hwa, C. S., 26
Jacques, G. L., 102,143 Jesser, B. W., 14 Jhaveri, A. S., 43 Johnson, A. 1., 68
Kataoka. T., 34,35 Khanna, R. T., 22 Ki e 1 back, A. W., 146, 148 King, M. B., 61 Kunugita, E., 16,112 .. 116 K ra i ne r, N. 1., 151 Kramers, H., 95 Koyanagi, T., 37,38
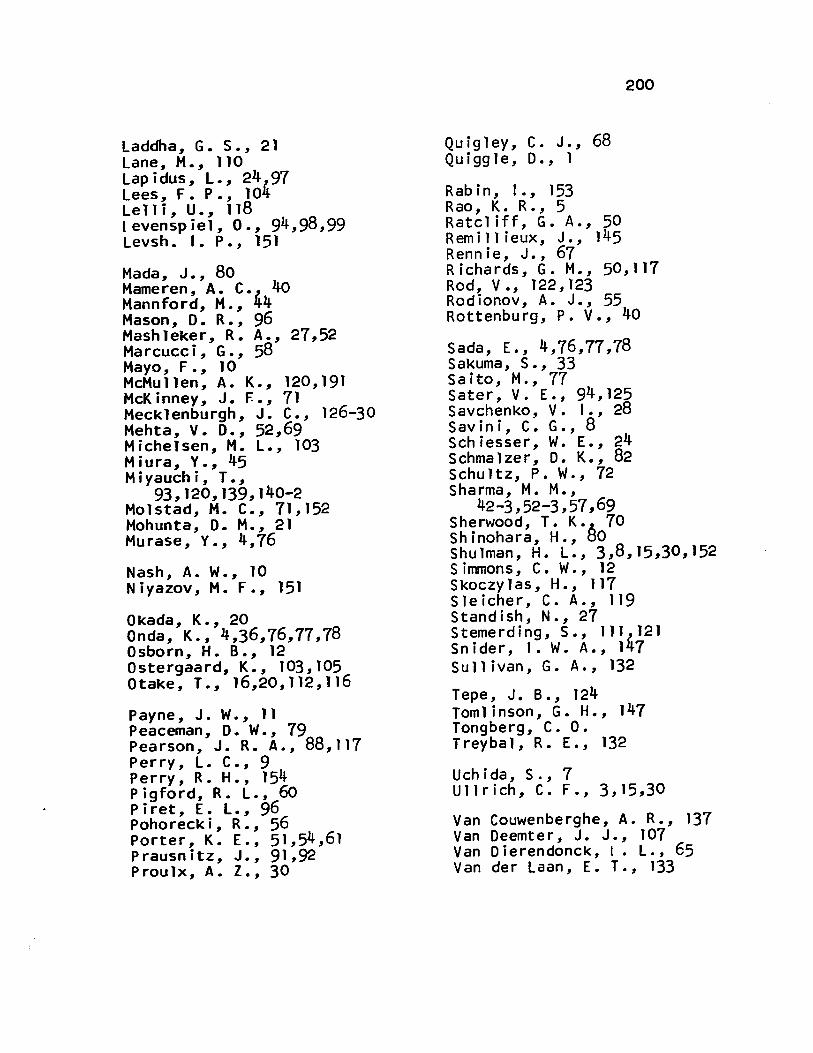
Laddha, G. S., 21 Lane, M., 110 Lapidus, L., 24
497
Lees, F. P., 10 Lelli, U., 118 Levenspiel, O., 94,98,99 Levsh. 1. P., 151
Mada, J., 80 Mameren, A. C.
4 40
Mannford, M., 4 Masan, D. R., 96 Mashleker, R. A., 27,52 Marcucci, G., 58 Mayo, F., 10 McMul1en, A. K., 120,191 McKinney, J. F-., 71 Mecklenburgh, J. C., 126-30 Mehta, V. D., 52,69 Michelsen, M. L., 103 M i u ra, Y., 45 Miyauchi, T.,
93,120,139,140-2 Molstad, M. C., 71,152 Mohunta, D. M., 21 Murase, Y., 4,76
Nash, A. W., 10 N i ya zov, M. F., 151
Okada, K., 20 Onda, K., 4,36,76,77,78 Osborn, H. B., 12 Ostergaard, K., 103,105 Otake, T., 16,20,112,116
Payne, J. W., 11 Peaceman, D. W., 79 Pearson, J. R. A., 88,117 Perry, L. C., 9 P e r ry, R. H., 1 54 P i 9 fo rd, R. L., 60 P i ret, E. l., 96 Pohorecki, R., 56 Porter, K. E., 51,54,61 Prausnitz, J., 91,92 Prou 1 x, A. Z., 30
Quigley, C. J., 68 Quiggle, D., 1
Rab in, 1., 153 Rao, K. R., 5 Ratcliff, G. A., 50
200
Rem i IIi eux, J., 145 Rennie, J., 67 Richards, G. M., 50,117 Rod, V., 122,123 Rodionov, A. J., 55 Rottenburg, P. V., 40
Sada, E., 4,76,77,78 Sakuma, S., 33 Sai to, M., 77 Sater, V. E., 94,125 Savchenko, V. 1., 28 Savini, C. G., 8 Schiesser, W. E., 24 Schmalzer, D. K., 82 Schultz, P. W., 72 Sharma, M. M.,
42-3,52-3,57,69 Sherwood, T. K.~ 70 Sh inohara, H., 00 Shulman, H. L., 3,8,15,30,152 S i mmon s, C. W., 12 Skoczylas, H., 117 SIe i che r, C. A., 119 Standish, N., 27 St eme rd i n g, S., 1 114121 Snider, 1. W. A., 1 7 Sullivan, G. A., 132
T epe , J. B., 124 Tom 1 i nson, G. H., 147 Tongberg, C. o. Treybal, R. E., 132
U ch i da, S., 7 Ul1rich, C. F., 3,15,30
Van Couwenberghe, A. R., 137 Van Deemter, J. J., 101 Van Dierendonck, t. L., 65 Van der Laan, E. T., 133
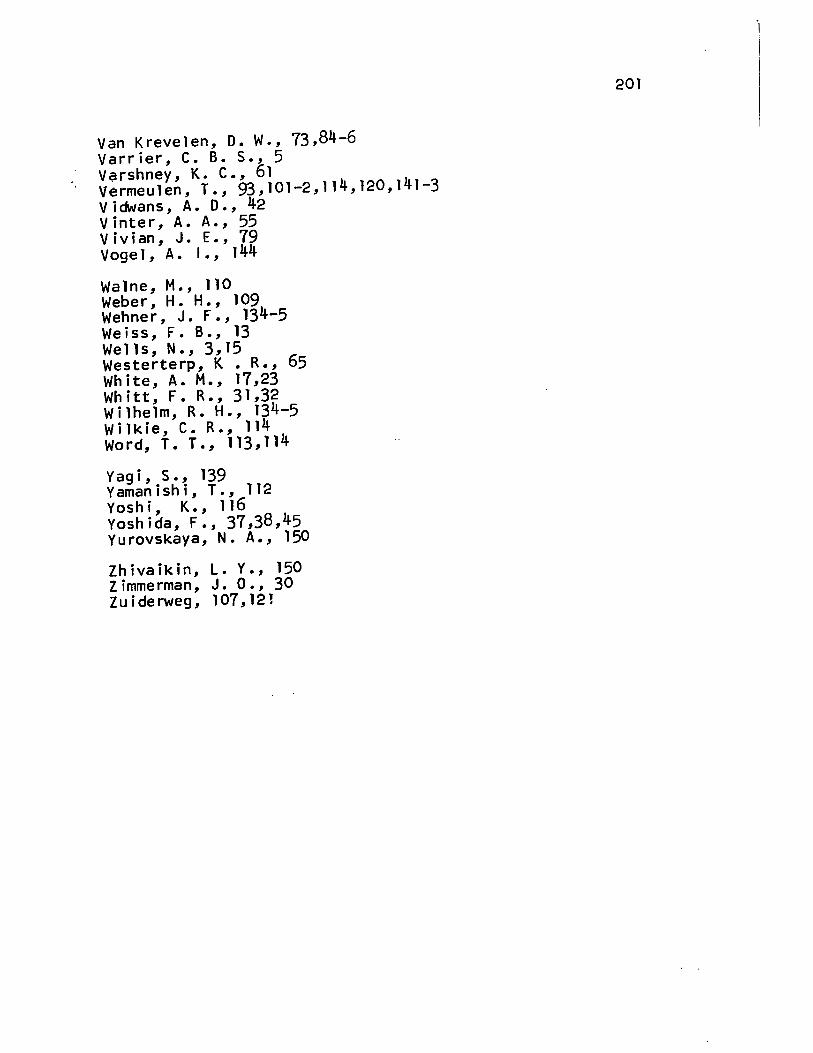
Van Krevelen, D. W., 73,84-6 Varrier, C. B. S., 5 Varshney, K. C., 61 Vermeulen, T., 93,101-2,114,120,141-3 Vidwans, A. D., 42 Vinter, A. A., 55 Vivian, J. E., 79 Voge 1, A. 1., 144
Walne, M., 110 Weber, H. H., 109 Wehner, J. F., 134-5 Weiss, F. B., 13 We 11 s, N., 3, 15 Westerterp, K • R., 65 White, A. M., 17,23 Whitt, F. R., 31,32 Wilhelm, R. H., 134-5 Wilkie, C. R., 114 Word, T. T., 113,114
Vag i, S., 139 Yamanishi, T., 112 Yoshi, K., 116 Yoshida, F., 37,38,45 Yurovskaya, N. A., 150
Zhivaikin, L. Y., 150 Zimmerman, J. O., 30 Z u i de rweg , 107, 12!
201
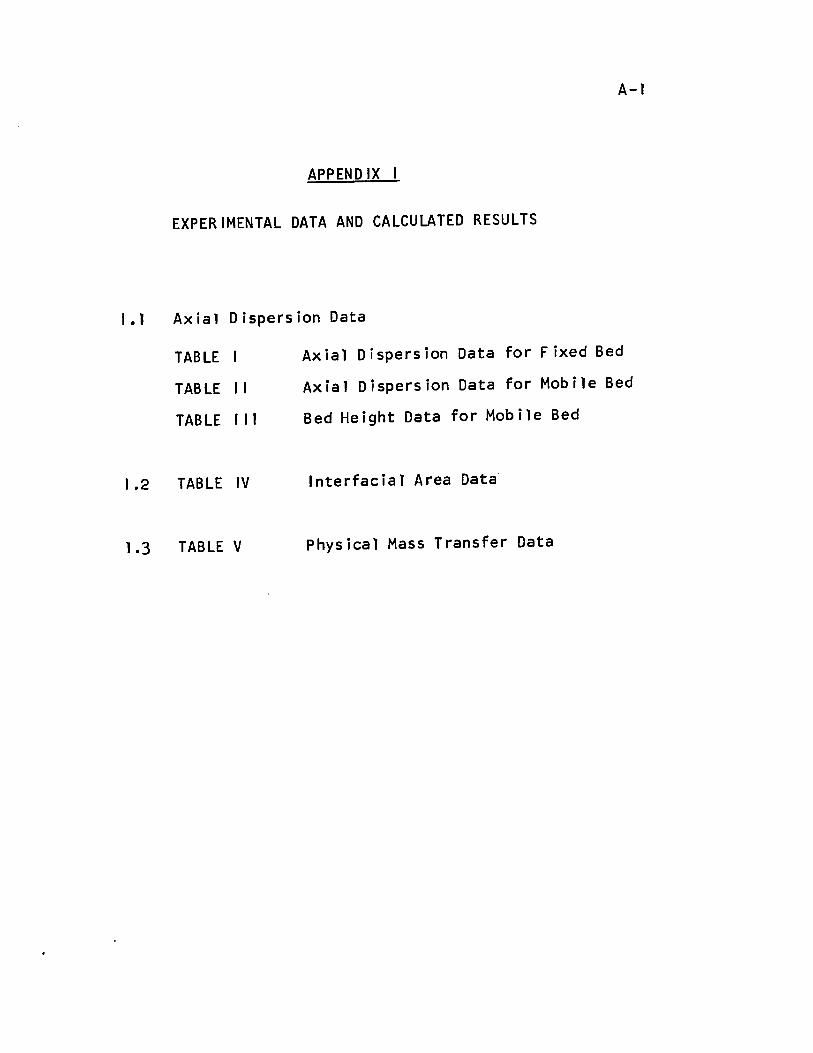
A-I
APPEND IX 1
EXPERIMENTAL DATA AND CALCULATED RESULTS
1.1 Axial Dispersion Data
TABLE
TABLE Il
TABLE III
1 .2 TABLE IV
1.3 TABLE V
Axial Dispersion Data for Fixed Bed
Axial Dispersion Data for Mobile Bed
Bed Height Data for Mobile Bed
Interfacial Area Data
Physical Mass Transfer Data
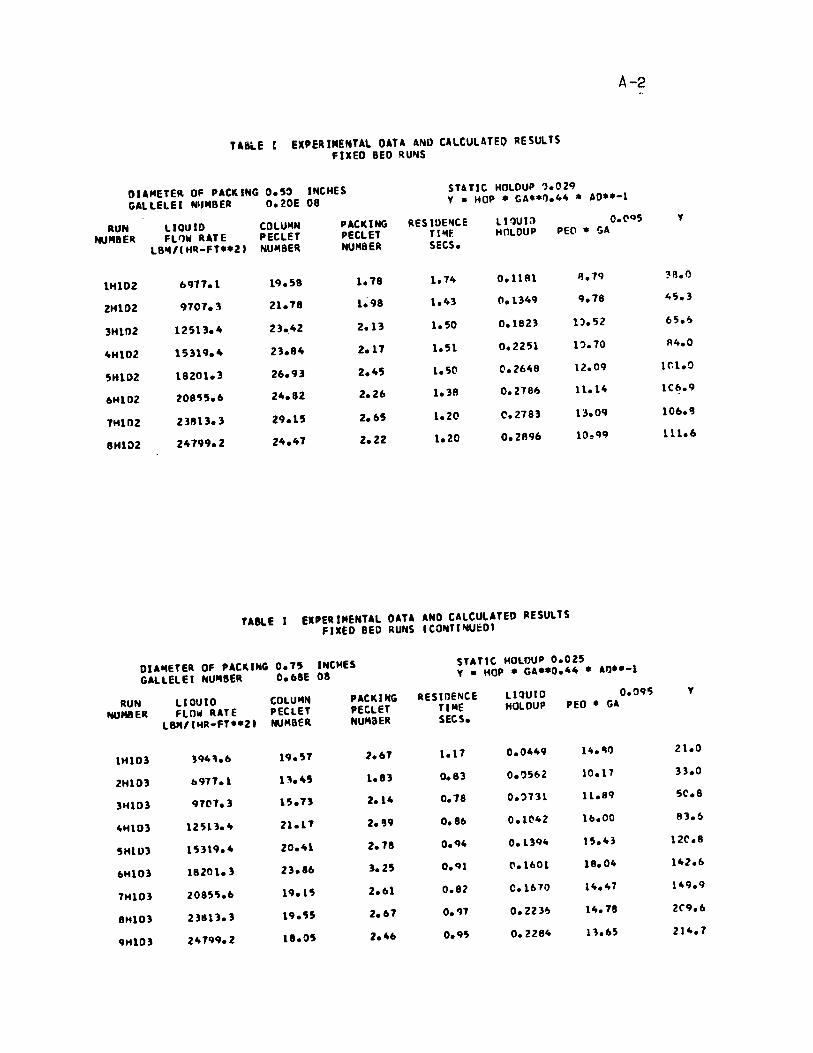
A-2
T 18i.E t EXPERIMENTAL DATA ANO CALCULATEQ RESULTS FIXED 8ED RUNS
DIAMETER OF PACKING 0.5~ I".CHES STATIC HOLDUP ?029
GALlELEI NlJ"BER 0.20E 08 Y • HOP. GA •• ".44 • ~O"-l
RUN LIOUID COLUI4". PACKING RESIOE~CE LI~UI;) 0.t' Q 5 y
NI.n'BER FLIJW RATE PECLET PECLET Tl .. F HOLDUP PEO • GA
LB"''' HR-FT"21 ".U148ER NUlt8ER SECS.
IHI02 6917.1 19.58 1.78 1.74 0.1181 Il.79 ~8.0
2HID2 9701.1 21.18 1~98 1.43 0.1349 9.18 45.3
3HID2 12513.4 23 •. 42 2.13 1.50 0.1823 D.52 65.!»
4HID2 15319.4 23.84 2.11 1.51 0.2251 1'.10 R4.0
SH1D2 18201.3 26.93 2.45 1.5(1 (\.2648 12.09 lel.O
6HID2 208';5.6 24.82 2.26 1.38 0.2186 11.14 lC6.9
1Hl02 23813.3 29.15 2.65 1.2l' C.2183 13.09 106.~
8Hl02 24199.2 24.41 2. Z2 1.20 0.2896 10,,99 111.6
TUtE 1 EXPERIMENTAL DATA AND CALCULATED RESULTS FIXEO BEO !tUNS 1 CONTI "IUED'
DIAI4ETER OF PACKING 0.15 INCHES STATIC HOLOUP 0.015
GALLELEI NU"SER 0.68E OB Y • HOP • GA •• 0.44 • AI)"-l
RUN LIOUIO COLU"N PACKING RESIDENCE LI QUI 0 0.091) Y
HUMBER FLOW RATE PECLET PEtLET TlI4E HOLOUP PEO • GA
LB"IC HIt-FT"l' NU"BER NU"BER SECS.
IHI03 194'\.6 19.51 2.61 1.11 0.0449 14.111) 21.0
lHI01 6977.1 Il.45 1.83 0.83 0.1)562 10.11 33.0
3Hl03 91l'1.3 15.73 2.14 0.78 0.n31 11.89 sc.s
4HI03 12513. " 21.11 2.1J9 0.86 0.11:'''2 16.00 e3.b
5HI03 15319.4 20.41 2.18 0.94 0.13910 1S.4) 12C.8
6HID3 18201.3 23.86 3.25 O.ql (\.1601 18.04 142.6
7H103 208S';.6 19.15 2.61 0.82 0.1670 14.41 149.9
8HI03 23811.3 19.55 2.61 O. ')1 0.223~ 1".111 2C9.6
9HID3 24199.2 18.05 2.46 0.95 0.2284 11.65 214.1
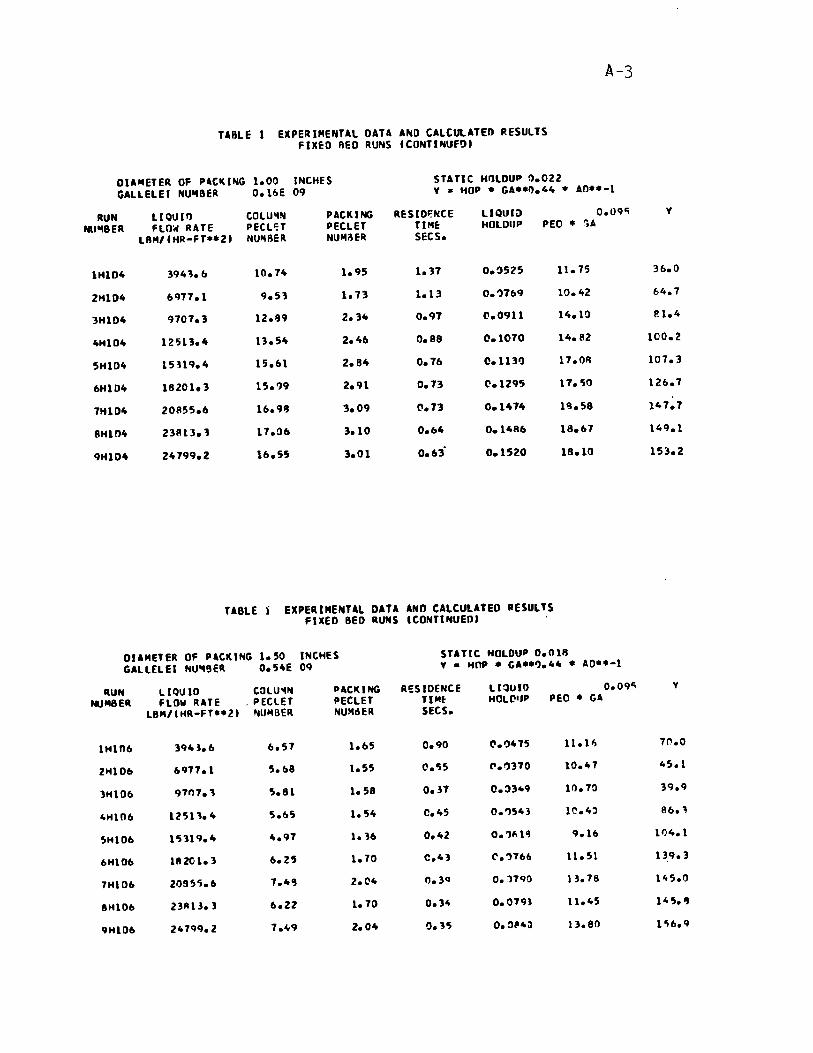
A-3
TARLE 1 EXPERIMENTAL DATA AND CALCUl.ATEn ItESULTS FIXEI) RED RUNS 1 CONTI NUf!) 1
DIA"ETER OF PAC~ING 1.00 INCHES STATle HlllDUP 0.022 GALLELEI NU14SER 0.16E 09 Y • HOP. GA •• O.44 • AO··-1
RUN LI OUII) COlUI4t,1 PACKING RESIOl:NCE L10UI;) 0.090; y
M' .. SER FLO .. RATE PECl'=T PECLET TI ME HOLDUP PEO • 'OA l R14/1 HR -FT" 21 NUItRER NUI4i\ER SECS.
IHI04 394~. & 10.74 1.95 1.31 0.~525 11.75 36.0
2HID4 &911.1 9.51 1.13 1.13 0.')7b9 10.42 64.1
3HI04 9107.3 12.1J9 2.34 0.91 0.0911 14.10 el.4
4HI04 12513.4 13.54 2.46 0.88 0.1010 14.82 100.2
5H1D4 15319.4 15.&1 2.84 0.16 C.1l31J 17.0R 101.3
bHl04 18201.3 15.?9 2.91 0.13 (1.1295 17.5/) 126.1
1Hl04 201155.6 16.91J 3.09 t'. 13 0.1414 11:1.58 147.7
8HI04 23813. ~ 11.06 3.10 0.b4 0.14Rb 18.&1 149.1
9HI04 24799.2 16.55 3.01 0.63 0.1520 18.10 153.2
TABLE ~ EXPERIMENTAL DATA AND CALCULAlED RESULTS FIXEO SEO RUHS 1 CONTI NueD 1
DIAMETER OF PlCKING 1.50 INCHES STATIC HOlOUP O.OlA GALLELEI NU"9ER 0.54E 09 Y • HOP • Ga •• ".44 • AO"-l
RUH lIQUIO COlU'4N PlCKING RESIDENCE lI~UIO 0.09e; V NU"SER FLOW lUTE . PEClET PEClET TI ME' HOLCI,P PEe • GA
l8MICHR-FT"ZI NIII4BER NU14dER SECS.
lH106 3943.b 6.57 1.65 0.90 (1.1)415 11.1~ 11'.0
ZHI0b 6977.1 S.68 1.55 0.'55 r.I)310 10.47 45.1
3H106 97"7.~ 'S.81 1.58 0.31 0.:)3 .. 9 Ill. 70 39.9
4H106 lZ'H 1.4 5.65 1. 'S4 C.45 0.'15"3 lC.4~ 86.'1
5Hl0b 15319.4 4.97 1.16 0.4Z O.'l"l't 9.1b 11)4.1
bH1D6 l11Z01.3 6.Z5 1.70 C."3 C'."'7b6 11.51 139.3
TH10b Z095'5.6 7.'" 2.04 O.3Q 0.1'7QO 13.78 145.0
8H10b 23All.) b.22 1.70 0.34 0.0'791 11.Co5 145.11
9Hl06 24TQq.2 7.1,,9 2.04 0.3'5 O. :]p"i) 13.80 1'1b.9

A--4
TABLE II EXPER IMENTAL DATA AND CALCULAT~n ~ESULTS MOIBLE KEO PU~S
DUMHfR UF PACKING \-.SC 1 ~el1F.S DENSITY OF PACKI:\IG 0.167 G~A"'S 1 CC. GALLElEI NU"IBER (I.2!'e tJB PEO • 1.('6 .. '~El*·().':'11 * 'GA'" -(1."9 511
PU~ LIQU ID GA" 14HHMU" OrLU PAeKING RESIDE:~Ce: PE/PEO LI QI) t 1)
NU'18EP I~ASS MA5S FLUIOllATlON PFClET TJ:~F "'OlOJO VELoe 1 TV VElnCITY VEloeITY 'II!J'13ER SEC.
102 "017.1 794.'» 218.2 1. Ab (I.S5 2.27 0.50;0; ".r9~O
l02 "911.1 1151.4 218.2 3.14 O.~~ 2.1P. ').31° (". ':970
302 6911.1 1578.5 21R.2 4.b 7 C.~Z 2.34 0.210 (.rl,<;7
41)2 6911.1 1914.4 278.Z 6.10 C.l5 2.41\ (1.162 ('.C'51<;
502 6917.1 24A6.? 2711.2 7. 9~ O.l') 2.75 O.lll r.:'5C;O
60l &911.1 7.'i91.1) 21B.2 '7.71 ".11 3.2:' I).H,a t:.I1'j""
702 6911.1 345C.a 278.2 Il.40 0.24 3.35 0.10;" 1'.1""13
R02 12!i13.4 50b.4 I&O.R 2.15 1.03 7.50 0.5~2 r.7Z'9
902 12513.4 846.~ 160.8 4.21 C.64 2.06 0.331 e'.1515
1'J02 12513.4 1189.8 160.8 6.41) 0.41 2.12 0.211 C.1214
U8lE: II EXPERIMENTAL O~TA A~O CALCUlAT~O RESULTS M"BILE BEO RUNS (cO~T t'llUEOI
DI AMfT ER OF PACKIHG C.50 lt.CHES ll( ... SITV OF PAeKI:~G 0.167 GRA"'S 1 CC. GALLELEI NU~"ER 0.20E 08 PFO • 1.C6 • ,QEl":).ltll • , GA •• , -(' • ra 0; 1 1
RU'" LlOUIO GAS "INI"U~ !)HH PAel(lNG PESIOE'ICE PE/PFIJ ltlJUIO NU'4(\fR "ASS "'~SS FLUIOIZATI!)N PECLET TI "lE "lllO'JI>
VELOe ITY VELOCITY VELOCITY NU"lIJEP SFC.
1102 ' 12513.,. 1451. ~ 160. li @.06 C.7~ 1.63 1).147 C.'}"i"
1202 12'>13.4 187<;. ft 160.9 lC.e.9 O.2e. 2."2 ('.1~" (.1)022
HOl 12'Hl." 7459.1 160.11 14.29 0.1 ~ 2 .. ~( (1.0°5 ( .'J'I'J5
14002 11513.4 3012.6 160.11 17.14 0.16 2.95 O.,.,Al (.')0'"
1502 12513.4 ~5r.4.6 160.8 20.81) C.15 3.36 0.07t- ( • ,:\0"5
le.D2 18201.3 45A.4 91.6 4.01 0.4 , 1.45 O.Zoo ('.104'1
n02 111 Zul. 3 t>99.4 91.6 6.64 ". 'J 1 1.89 (1.2 7 0 ('.21'14
180l 18201. ~ 119~.4 91.6 &.19 ('.41 2. n l C.IJ>f' (.2112
1902 182(\1.3 1083.6 91.6 10.84 (1.15 1.71 (\.11j3 ('.1"28
2002 111201.3 1416.4 91.6 14.41 0.2'1 1. '18 0.124 (.1541')
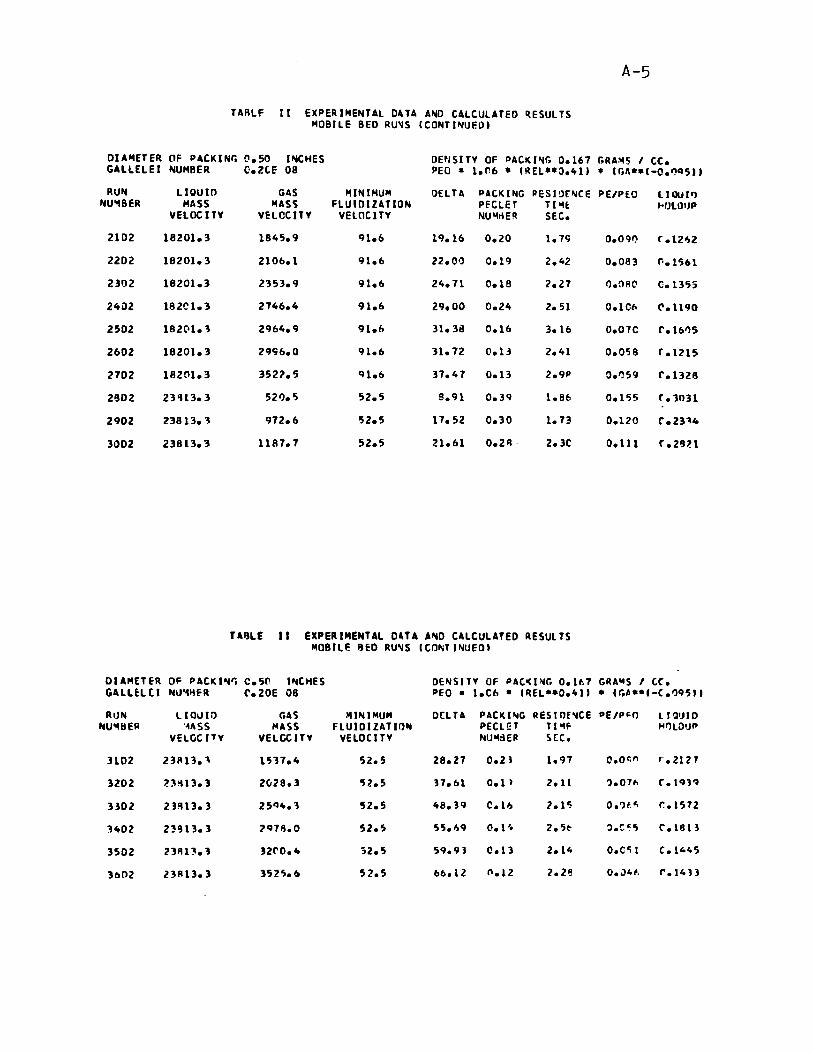
A-5
URLF Il EXPERIMENTAL DATA A~ CAlCULATEO ~ESULTS MOBILE BEO RU~S (CQNTI~UEO'
DIA "'ET ER OF PACKIN/,; 0.50 I".CHES OENSITY OF PACKIOoI!j 0.167 GRA)4C; 1 CC. GULELEI NUM8ER C.2tE 08 PEO a 1.1'16 • (REL"O.ltll • Ir,A*·(-O.~Q511
RU". LlQUIO GAS MINIMUM OELU PACK(~G PESI!)r~C:E PE/PEO LlOUII) NUIo18ER MASS MASS FLUIOlZ4T10N PfCLET TI '4E "OLOIJP
VELOCITY VELOCITY VELOCITY NU'4tiER SEC.
2102 18201.3 1845.9 91.6 19.16 0.20 1.79 0.O9~ (.12"2
2202 18201.3 2106.1 91.6 22.00 0.19 2.42 0.083 (0.1561
2302 18201.3 2353.9 91.6 24.71 0.18 2.21 O.('IA~ C.135;
24&>2 182C1.3 2746.4 91.6 29.00 0.24 2.51 O.lCt. ('.1190
2502 182C·1.3 2964.9 91." 31.38 0.16 3.16 0.01C ('.16115
2602 18201.3 2996.0 91.6 31.12 0.13 2. Itl 0.0'j8 (.1215
2102 18201.3 352? 5 91.6 31.47 0.13 2.9P 0."59 ('.1328
2902 23'113.3 52Q. " 52.5 9.91 0.39 1.86 0.1')5 (. '3031
2902 23813.3 972.6 52.5 11.52 0.30 1.13 0.120 C.23'\4
3002 23813.3 1187.7 52.5 21.61 0.2'" 2.3e 0.111 (.2''-1
TA6LE Il EXPERI"ENTAL OlTA AND CALCULATEO RESUL TS MOBILE IHO RU"'S (CI)~T 1 ~UED 1
o lA MET ER OF PAeKlOolr, C.5r l".CHES DENSITY OF PAtOUille; 0.1f.7 GRA'4S 1 CC. G4LULCl NlJ'1lifR ('.20E 08 PEO • 1.CI> • (REL··O.ltl. • (1';4··'-(.09511
RUN L H)"'IO GAS MINIMUM DClTA PACKI~G RES 1 OE..,CE "E/P~O l raoJIO NUIo1SER '-4ASS MA5S FLUIOlZATlO .. PEelET Tl'4f t4l'llOUP
VELDe (TY VElCCITY VELoelTY NUlI4aEII He.
3102 23A13.' 1'517.It '52.5 28.21 0.2 ) 1.97 0.0<:" ('.2127
3202 '-H13.3 2"28.3 '52.5 17.61 0.1 ) 2.11 ?07" C.191Q
H02 23"13.3 25'14.1 52.5 It8.19 C.l" 2.10; o .'lt, ... 1:.1572
H02 2~' 13.3 2911i.0 52.5 55."9 0.1 '. 2.5~ :l.Cc" ('.1613
3502 23RB.3 32<'0. It 32.5 59.91 C.ll 2.11, o.C'i 1 (.1445
3b02 23A13.3 352". b 52.5 66.12 (\.12 2. 2~ 0 • .)4t, 1".14)3
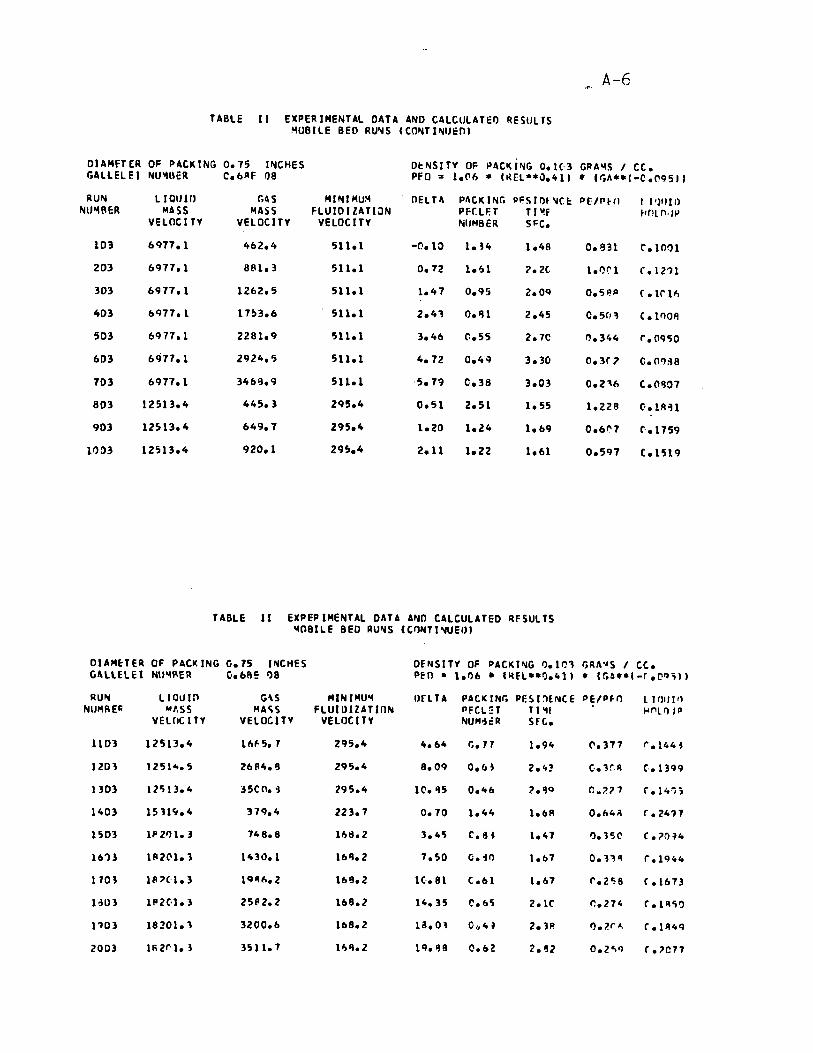
A-6
TABLE Il EXPERIMENTAL DATA AND CALCULATEO RE SUL rs ~UBILE BEO RU~S CCONTINUEOI
OIAMfT[R OF PACKING 0.15 IfiCHES OI:NSITV OF PACI< PIG 0.10 GRA'4S 1 CC. liALLELEI NU"II\ER C.bAF Q8 PFO 2 1.(I/) ,. '~EL*·O.411 • ,,. ...... C-C.1'9511
RUN LI OtH" r.4S MINI/I4U)4 OEL'" PACK INr. Il!,S 1 f)f ~Cl: PflPHI 1 1')1111> NtI"1BER I4ASS MASS FLUIO IlA TlJN PFUF. T TI "1f f·mn·, ...
VELOClrv VELOCITY VELOCITY NlIl4BER SI'C.
103 6911.1 462.4 511.1 -n.l0 1. J4 1.48 0.831 ('.1001
203 6911.1 881.3 511.1 0.72 1.~1 2.2(· 1.1)('1 r.12?l
303 6911.1 1262.5 511.1 1.47 0.95 2.00 O.SI!" (,.lrv,
403 6911.1 17~3.6 511.1 2.43 0.111 2.45 O.SfI" (.l'lOIl
503 6911.1 2281.9 511.1 3.46 C.55 2.7e 0.344 r.09';0
603 6977.1 2924., 511.1 4.12 O.4~ 3.30 O. 3r? C.OI)~8
703 6977.1 3468.9 511.1 ·5.79 C.38 3.03 0.2'\6 C.O~01
803 12513.4 445.3 295.4 O.Sl 2.51 1.55 1.22~ (·.lAH
903 12513.4 649.1 295.4 1.20 1.24 1.69 0.61'1 (',.1759
11) 03 12,13.4 920.1 295.4 2.11 1.22 1.61 0.591 C.I519
TABLE Il EXPEPI/I4ENTAL DATA AND CALCULATEO RFSULTS "[lBllE BEO RU"IS CCI')NTI~UEI)I
OIAMHEIt OF PACK ING 0.75 I!IICHES OfNSITV OF PACKING 1).1C'\ IjRA .... S 1 CC. GUULEI N\J'4"E~ O.6S!: I)B PEO • 1.06 • IltfL**t).411 • lr.u*l-r.C'''~11 RUN LI Olll Il G\S "IN 1"11'4 ufl T A PACK INf; PESI:1E.NCE PflPf(1 l 1 Il Il 1')
NUl4REil "'.55 MA~S FLUIIlIZATlIlN PFCL!:T 11 '41 "'''l'l' P VEUle 1 TY VELOCITY VELOCITY NUH~::R 5FC..
1103 12513.4 IM5.7 295.4 ft.64 r..71 1.910 (1.377 r .11010 ~
1201 1251 ... 5 26114.8 295.4 8.09 0.6~ 2.4~ (·.lr.A ('.lH9
1303 120; 13. 10 J5C n. i 295.4 1~. '15 0.46 2.'10 r: .. ?? 7 i .110';;
140] 1531Ci.4 31Q.1o 223.7 0.70 1.~1t 1. bR 0.b4~ r.ZIo'H
1503 lPZI)I.3 748.8 168.2 3.100; C.8~ 1.107 1).1SC (. 70 ~4
16')) 1112(11. ) 1430.1 1611.2 7.50 O.il) 1. b7 0.1'\'1 r.1944
170 J IA7{-I. ] 10"".2 168.2 lC·.81 (.61 1.67 ('.2';8 C.1673
BIl3 1112(·1.3 25112.2 168.2 110.35 C.Et" 2.1e r..274 C.I"Ij~
110] 18201.1 3200.6 168.2 la. 0 \ O'J4~ 2.111 t). j!(''' (.lA49
2003 11\2('1.3 ]511.7 11,'1.2 lQ.1t8 O.6Z 2.1J2 0.2"<) ( .7C17

A-7
TARlE Il EXPERIMENTAL DATA AND CAlCUlATEO RESUl TS ~OBllE SEO RUNS CCONTINUEOI
DI A"1ET ER OF PACKING 0.75 I~CHES OENSITV OF PACI(I"'4G 0.1('11 GRA'4S 1 CC. GALLElEI HUMBER C.b8E t)1J PEO • 1.C& 11 C~El**O.ft11 • C~A"C-(·.M511
RUN 1I0U ID CAS MINIMU~ DELTA PACKING PESIOFIIICE PE/PEn llOU11) HUMBER "1ASS MAÇS FlUIOIZATlON PEClET T 114[ HOlO\JP
VElOC 1 TV YELOCITV VElOCI TV NU/MER Sf:C.
21D3 1865(-.3 2251.3 1&0.8 13.01) 0.76 1.85 0.311J (.1794
220l 23813.3 q61.5 96.5 q.03 (1.'32 1.34 0.1f\Q C.?3J1
2303 23813.3 1&22.1 9&.0; 15. Al 0.71 l.ft1 O.u.q (.2165
2ft03 23813.3 lOfte.ft 96.5 20.14 0.61 1.56 0.252 C'.2096
2503 23813.3 2399.5 96.5 23.81 0.51 1.6q 0.19ft ( .21Jl
26D3 23813.3 2661'1.4 96.0; 2&.b'5 0.41 1.72 0.111 r.20Za
2703 23813.3 2992.3 96.'5 30.01 0.'51) 1.91 0.186 t'.2121
2803 21813.3 3013.7 96.'5 30.80; 0.13 1.61 0.124 C.I7"l
29D3 231113.3 3369.2 96.5 33. e;Jl 0.5i 2.3r. 0.211 C.2393
3003 2381:!.3 3522.1 96.5 35.50 0.44 2.46 0.161 C.2495
TABLE Il EXPERIMENTAL DATA AND CAlCULATED ~ESULTS "m8llE BEO R,VNS ICO ... TINUEOI
OIAMETE~ OF P4CKING 1.00 INCHES OENSITV OF PACKING 0.181 GRAM" 1 cr. GAllElEl I>4U"'8E~ 0.1 "e 09 PEO • 1.0" • IPElUO.411 • 1 I;II"I-r .oen Il
RU"'4 L 1/lIJiO GI\" "'IN l "'UM OI=LU PI\CKINt; RE slIIr ... CF. PE/P(n 1 1 Q'" 1)
NU'4IiCR "'AS" .. ASti FlUIDIZATIOH PECLET , I~L HlllO,'" VF.l OC ITV V~LOCJTV VELOCI TV N""lBEI( sre.
104 40QI\.3 ~Hl.? 1046.1 1.21 1.15 2.&1 0.~46 (.1)5'30;
204 4095.3 3045. & 104&.1 1.91 C.91 2.1(- 0.1,77 C.049"
30ft 6'H7.1 IHq.3 186.8 0.11 1.,&9 1.61 1.017. r.",,~q
404 6977 .1 1593.1 186.8 1.0J 2.Z 7 2.02 1.31,2 ('.(l'Bq
504 6977.1 11193.6 7"".8 1. loi 1.411 2.09 0."117 (.08&9
6010 6977.1 1916.2 186.A 1.4ft 1.24 1.12 0.74 '4 r.07~9
104 b971.1 2251.4 1136.8 1. A6 1.57 2.39 0.944 C.09ft6
1104 6971.1 2720.4 1116.11 2.46 1.2/) 2.52 0.717 (.OAI2
Q04 6971.1 3222. , 186.8 3.n9 1.0Z 2.89 0.611 0.':117.2
1004 &971.1 3')67.0 7A6.8 l.51 0.84 2.15 0.5'2 r.0721
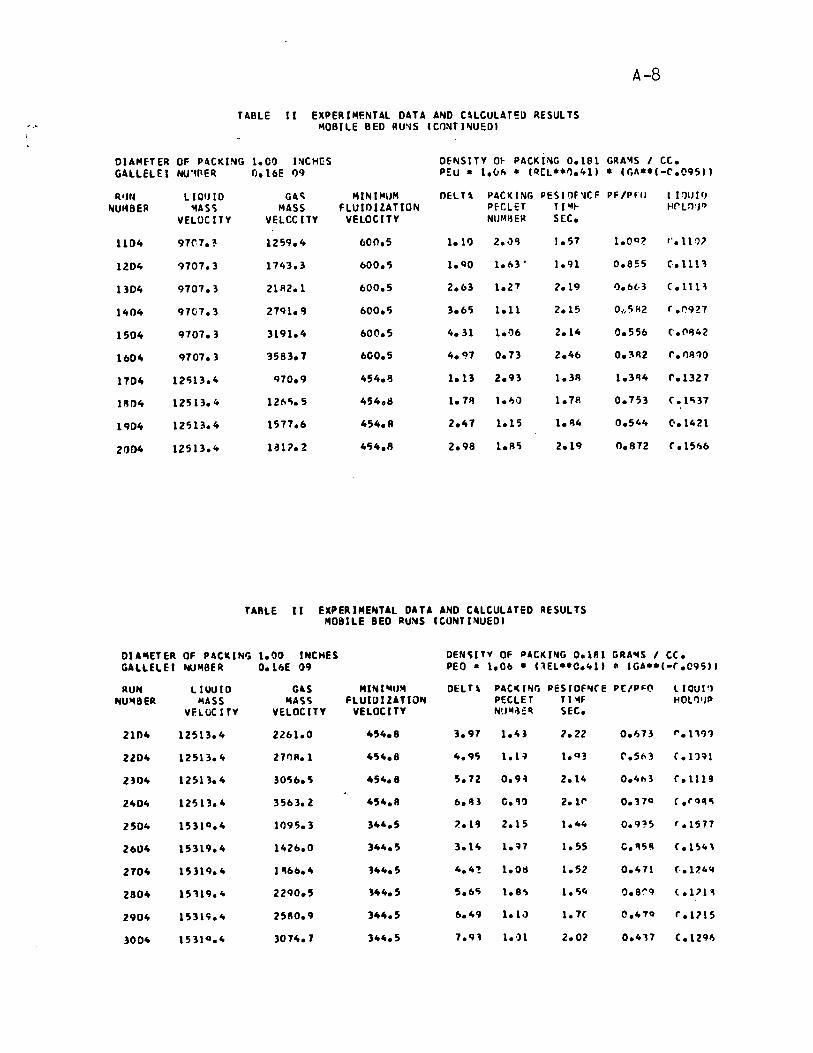
A-8
TABLE Il EXPERIMF.NTAL DATA A~D C'LCULATEO RESULTS ~OBILE BEO RU~S CCONTI~UEDI
DIAMfTER OF PACKING 1.CO INCH(;S DENSITY al- PACKI~G 0.181 GRA"IS / Ct. GALLEL El NU'1f\E~ n.16E I)q PEu a l.ûl'l • IQ[L**O.411 • Ir."**I-C.09511
Rom LIOUIO GA" MINIP4l1M OELU l'ACKING PESIOF'ICF PF/PIII 1 1011 1 r, NUI40ER "'ASC; MASS FLUIOILATlON PECL ET TI"''' HrLO'J"
VELOC ITY VELOC lTY VELOCITY NlJMIiER SEC.
1104 97('.7.~ 1259.4 600.5 1.10 2.·H 1.57 1.0Q ? t'. 11 '17
1204 9107.3 1143.3 600.5 1.90 1. ft3 • 1.91 0.855 C.ll1 ~
1304 9707.3 21 R2. 1 600.5 2.63 1.27 2.19 1). 6l, 3 (.l1U
1404 97(;1.3 2191.9 600.5 3.65 1.11 2.15 0 .. , 'HI 2 ( .(\921
1504 9101.3 3191.4 600.5 4.31 1.1)6 2.14 0.556 (.(\1142
1604 qT01.3 3583.7 600.5 4.0:11 0.73 2.46 0.3R2 l'. r,,~~o
1704 12513.4 910.9 454.13 1.13 2.93 1.31! 1.3114 r.1321
19D4 12513.4 121'15.5 454.8 1.7A 1."0 1.1R 0.753 (.100;31
1904 12513.4 1517.6 454.8 2.47 1.15 1.1\4 0.544 C'.1421
20D4 12513.4 lal?Z 40;4.8 2.98 1.R5 2.19 0.872 (.15"6
TARLE Il EXPERIMENTAL DATA AND CALCULATEO RE5ULT5 MOBILE BEO RUNS CCONTINUEOI
DU"ETER OF PACKINt; 1.00 tr.CHE5 OE~C;I Tv OF "CKING O.lAl GRA~S / cc. GALLElEI t«JMBER O.l"E 09 PEa • 1.06 • ClEL*.C.toll 0 IG'**I-( .09511
RUN LIUUIO GU MI,.I"4U,. OHH PACI(INIj PESIOFNrE PC/P~" II OUI!) HUMBER MA55 MAse; FlUIOllATlON PECLET T I14F HOL""P
VflOC ITY VELOCITY VElOCITY NtI~I\EQ SEC.
2104 12513.4 2261.0 454.& 3.97 1.43 2.22 0.1)13 t'.ll?'}
2204 12513.4 271)11. 1 454.8 4.95 1.1~ 1. Q] C'.5t>3 C .1Hl
23D4 12513.4 3056.'5 454.8 5.12 0.9-1 2.14 0.4"3 r.l11!!
2404 1251'3.4 356'3.2 454.R 6.113 (i.~'l 2. U' 0.'37C1 C .rq'l'i
2504 1531 C1 .4 1095.3 344.5 7..1~ 2.15 1. lolo O.9~5 '.1577
2604 15'319.4 1426.0 344.5 3.110 1.~7 1.55 C.IIS'! r.l!1'"
2104 15319.4 11166.4 344.5 4.4'! 1.0~ 1.52 0.471 (·.1l4Q
2804 15'H9.4 2290.5 144.5 5.65 1.80, 1. c;e; 'l.&"q <.111"
2904 1531<;.4 25110.9 344.5 6.49 1. 1" 1.7C 0.470 (.1?15
3004 1531 Q .4 J074.7 344.5 1.91 1.0)1 2.02 0.411 C .1296
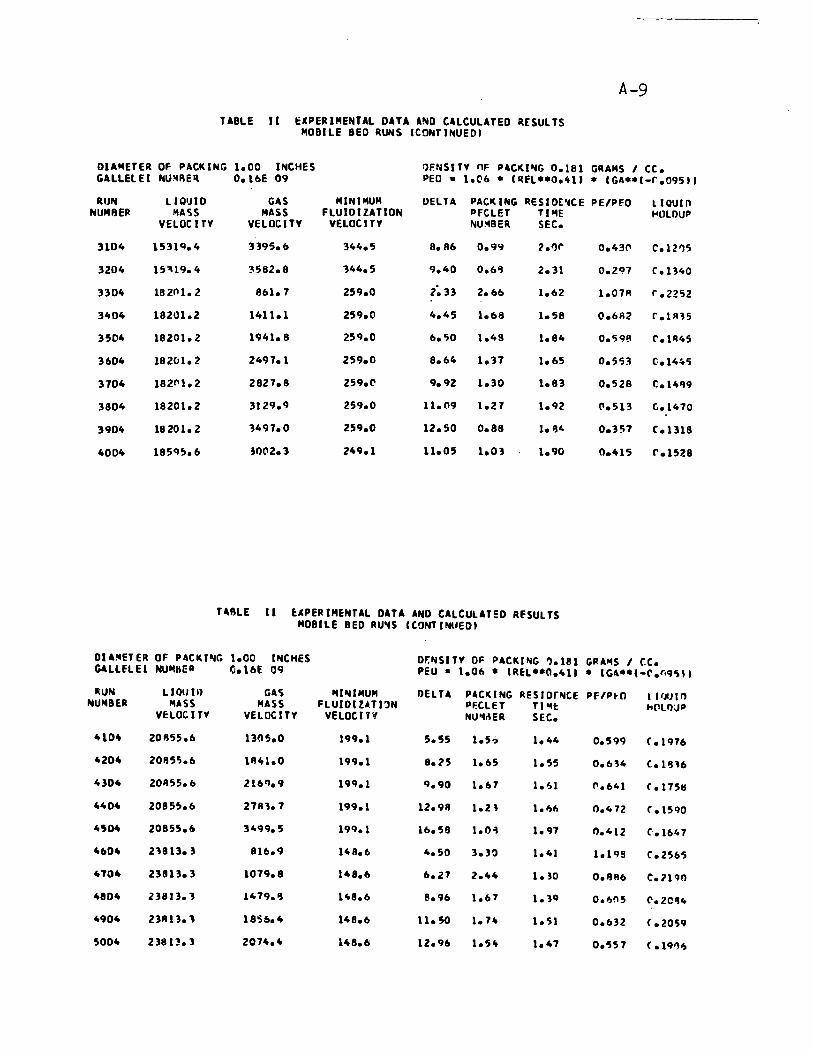
A-9
TABLE Il EKPERIMENTAl DATA AND CAlCUlATED RESUlTS MOBilE 8EO RUNS CeQ~TINUEDI
OIANETER OF PACKING 1.00 UiCHES rJfNSITV nF PACI(I~G 0.181 GRANS 1 CC. GAllEl El NU)tREIt 0.16E 09 PEO • 1.(\6 • Cltfl··0.4U • CGU·C-r..09511
RU,.. LlQIJlO GAS NINIMUN OElTA PACI( IHG RESIO['IIeE PE/PfO llOUln HUM9EP NA'iS MASS FLUIDIZATlON PFelET TI"IE ~OLnup
VELOC UV VELOCITY VELOCITV NU14BER SEC.
3104 1531q.4 3395.6 344.5 8.86 0.9 .. l.l)" 0.43(\ C.1Z"5
3204 U'H9.4 3582.8 144.5 9.40 0.6'1 2.31 0.2';17 C .1340
3304 18 2f"11. 2 861.1 259.0 l~33 2.66 1.62 1.01R r.2252
3 .. 04 18201.2 1411.1 259.0 4.45 1.68 1.58 0.6A2 r.1R~5
3504 18201.2 1941.8 259.0 6.0;0 1.49 1.84 0.0;9" r.1R45
3604 18201.2 2491.1 259.0 8.64 1.37 1.65 0.553 (..1445
3104 182"1.2 2821.8 259.C 9.92 1.30 1.83 0.528 C.14'19
3804 18201.2 3129.9 259.0 11. (19 1.21 1.92 (\.513 G.1470
3904 18201.2 1491.0 259.0 12.50 0.88 1. al, 0.357 C .1318
40 Olt 18595.6 ~O(\2. 3 249.1 11.05 1.03 1.90 0.415 r.1528
TABLE Il ~.PERIMENTAl DATA AND CAlCULATEO RfSUlTS MOBILE BEO RU"'S ICONT 1t«IEOI
OIA~ETER OF PACKI~G 1.00 I,..CHES or.'-ISUV OF PACKI'-IG ".181 GPAf04S 1 cc. G41lflEI NU"IIER O.16E 09 PEU • 1.06 • CR~L··O.411 • CGA··,-r.f"·9O;"
"UN LIOI/II) GAS "'ININUM OH TA PACI(ING RESlop"eE Pf/P~O llrJlJlIl NU"'BER NASS MASS FLUIOI lATllN PF.CLET TI"It: HClll);Jp
VELDe 1 TV VELOCITY VElOC 1 T't NU .... eR SEC.
4104 20855.6 13~5.0 199.1 5.55 1.5? 1.44 0.599 r .1916
4204 2085'5.6 11141.0 199.1 8.25 1.65 1.55 0.614 (.11316
4304 201155.6 216t).9 199.1 9.90 1.61 1. ~1 .... 641 (.11511
4404 20B55.6 2781.7 199.1 12.911 1.2 \ 1. "" 0.412 (.1590
4504 20855.6 3499.5 199.1 16.5B 1.0~ 1.97 0.412 ('.1641
4604 21813. ~ 816.9 148.6 4.50 3.30 1.41 1.199 (.2565
4704 23813. '3 1079.8 14B.6 6.21 2.44 1. ~o 0.fl86 C.llqO
4B04 23813.1 1479.11 148.6 8.96 1.67 1.1~ 0.1)05 C'.2C"4
4904 231113.1 18S~.4 148.6 11.50 1.14 1.~1 0.632 C • ZO~9
5004 238n. ] 2074.4 148.6 12.96 1.54 1.47 0.551 ( .1Q""
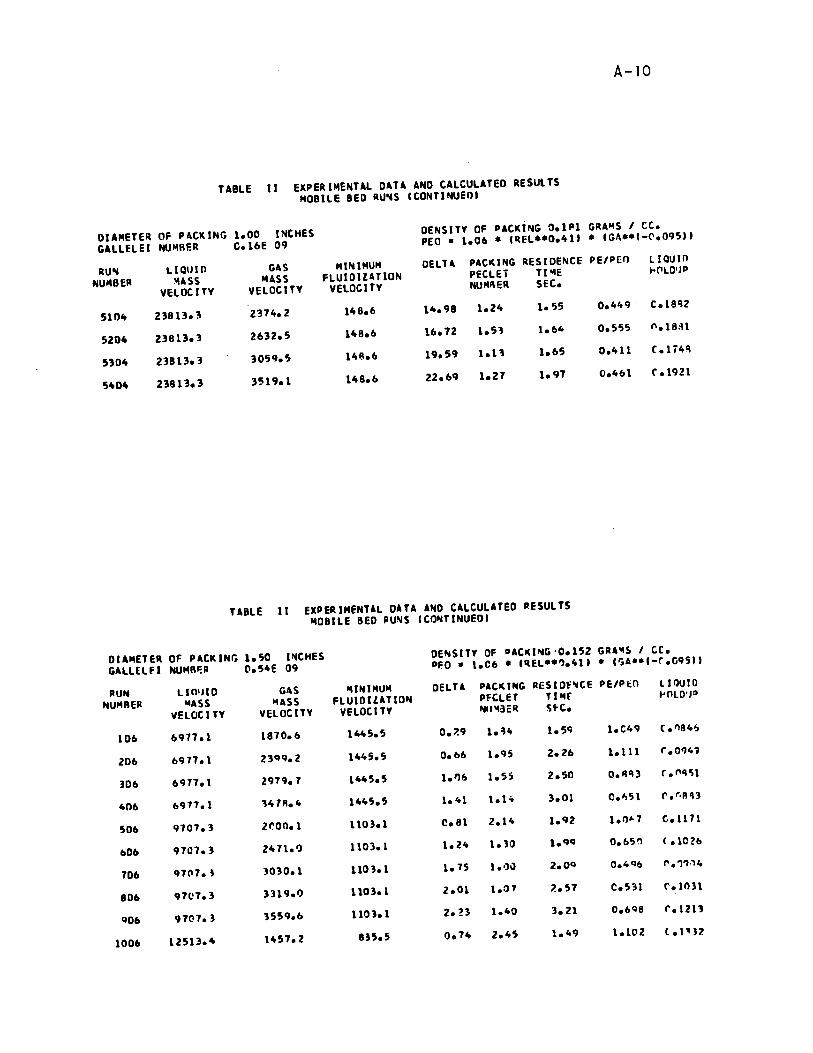
A-lO
TABLE 11 EXPERI"ENTAl DATA AND tAltULATEO RESUl TS MOBilE 8EO RU~5 CtONTI~UEOI
OIAMETER OF PAtKING 1.00 1~tHES OENSIT'I OF PAtKI~G 0.1111 GRAIo4S 1 Ct.
GALLELEI NUMRER C.16E 09 PEO • 1.06 - C REl.-0.411 * CGh-*C-C.09511
RU~ LIQIIIO GAS MINIMUM OELU PACKING RESIOENCE PE/PCO LIQUIO
NU148ER "IA5S NA5S FlUIDllATlON PEClET Tt"'E ",('IlO"P
VELOC 1 TY VElOelTY VELOCITY NUHI\ER SEt.
5104 21813.3 2~H.2 148.6 14.98 1.24 1.55 0.449 C.18'12
5204 23813.3 2632.5 148.6 16.72 1.53 1.64 0.555 1'.18"1
5304 23813.3 3059.5 148.6 19.59 1.11 1.65 0.411 C .li4'1
5ltD4 23813.3 3519.1 148.6 22.69 1.27 1.97 0.461 1'.1921
TABLE Il EXPERIMENTAL DATA AND tAlCUlATED IlESUlTS MOBilE 8ED PU~5 (CONTINUEOI
DIAMETER OF PAtKING 1.50 II\1tHE5 DEN51T'I OF "At"I"oIG-O.152 GU"~ 1 CC.
GAUELfl NU14R'=11 Q.54E 09 PF.O • 1.06 • IREL--.,.411 * I~A··I-r.C9511
PUN l IClIJ1D GAS "'INIHUM DELTA PACI( ING IlESIDE'oICE PE/P!:O llQUID
NU"'RER "AS5 "'A55 FLU1D1LATlON PFClEf T1 .. r "OLD-'"
'J Et OC 1 TY VELDe If Y VELOt1 TY NII'43ëR Stt.
106 6917.1 1870.6 1"5.5 0.1.9 1.~1o 1.5C; I.C4Q ( • "84!»
206 6971.1 23q9.2 1445.5 0.66 1.95 2.26 1.111 ".0<)41
306 6971.1 2979.7 11045.5 1.1)6 1.5, 2.50 0.""3 r.I''''H
406 6917.1 14111.4 11045.5 1.41 1.1 .. 3.01 C.I,51 r.r-sq)
506 9707.3 2('00.1 1103.1 C.81 2.14 1.92 1.1)"'7 <:.1171
b06 9707.3 2471.1) 1103.1 1.24 1.30 1.9q 0.&5'1 C .10l6
706 97(\7. J 3030.1 1103.1 1.75 1 • -)Il 2.0q 0.4Q& l' .''l·'4
806 97l'7.3 3319./) 1103.1 2.01 1.01 7..57 C.53l r.lo31
Q06 97C)7. J 1559.6 1103.1 2.n 1.40 3.21 0.698 r.1213
1006 12513.4 1457.2 en.5 Oe71o 2.45 1.49 1.102 ( .1' 32
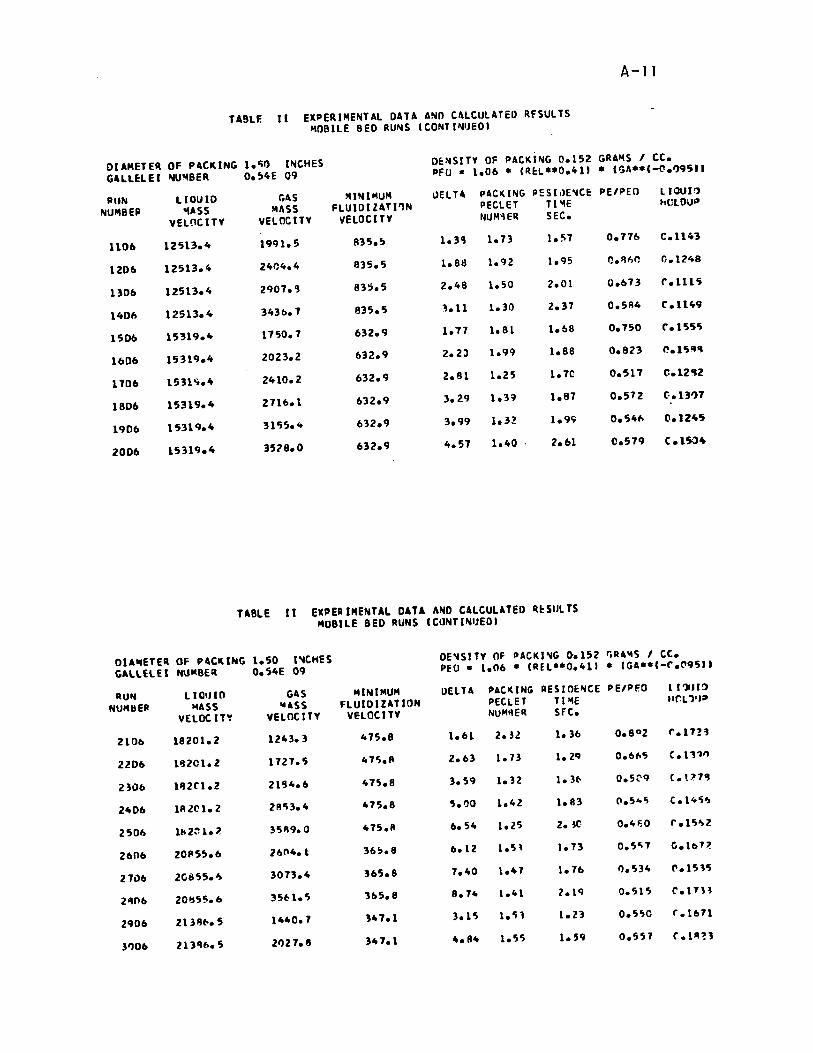
A-ll
TABLE Il EKPERI'Œ~TAl DATA ANO C~lClJlATEI) RFSUlT5 ~OBllE BED RU~S ICO~T[~~eO'
OIAMETER OF PACKING 1.0;0 IfliCHeS OE:NSITY OF PACK[~G 0.152 GRA'4S 1 CC.
GAtlElEi "'U~8ER o.sr.e Q9 PFO • 1.06 • 1~E:l"O.r.lI • (G"··(-{l.I)951J
AIJN llOUIO GAS "I~I"'U'" "El TA PACKlfIIG PESI,)E'IICE PE/PEO llOUI'l
NUMBEfi ""S5 MA55 HUIDI lATI'lN PEClET TI '4E HUlOU'"
VELOCITY VELDe ITY VELOClTY NUM!\ER SEC.
1106 12·H3.~ 1991.5 835. ~ 1.3" 1.73 1.57 0.776 C.1143
1206 12513.r. 2404.4 1335.'; 1.88 1.9Z 1.95 c. ~",~ 0.1248
1306 12513.4 2907.9 83,.5 2.48 1.50 2.01 0.673 r.l11S
1406 12513.4- 3436.7 835.5 '.11 1.30 2.37 0.584 C.1149
1506 15319.4 11'50.7 632.9 1.17 1.81 1.68 0.150 (".1555
1606 15319.4 2023.Z 632.9 2.2J 1.99 1.88 0.823 ~.15""
1106 1531'0.4 2410.2 632.9 Z.81 1.Z5 1.7e 0.511 C.12"2
1806 15319.4 Z716.1 632.9 3. Z9 1.39 1.87 0.572 (:.13')7
1906 15319.4 31'55 ... 632.9 3.99 1.32 1.99 0.546 0.1245
2006 15319.4 3518.0 632.9 4.57 1.40 2.61 C.579 (.1504
TABLE Il EKPEAIMENTAl DATA A~D CALCULATEO lU: SUL TS MOBILE BEO RU~5 (CO~TI~IJEOI
OU .. ETER OF "CIUNG 1.50 l-.C.HES OE"I5lTY OF PAeKl"lG ().152 t;AA'4S 1 C.C.
GAllEUl NUIC8ER 0.S4E 09 PEO • 1.06 • IREl··O.411 • IGA •• (-(".Cl9511
RUN LI OU 10 GAS MINIMUM llElTA PACI(ING RES 1 OE'~CE PE/PEO lI1U!!')
NUI4IiEII .. AS5 "455 FLUIDllATlON PECLET TI '4E !lCL ')'11t
VELO<: 1T't VELOCITY VELOCITY NU"'~ER src.
2106 18201.2 1243.3 475.8 1.61 2.3Z 1.36 0.8°2 r.17~~
2206 I1J201.2 1127. '5 47S.A 2.63 1.73 1.2q 0.6"'5 C.l1'J"
2306 1It2Cl.2 2194.6 475.8 3.59 l.ll 1.3t- 0.5~9 (.Pl ..
2406 lAlC 1. 2 280;3.4 475.8 '5.1)0 1.42 1.83 (1.5,.0; (.14r;..,
2506 Ib2~1.'- 35"9.0 415.11 6.54 1.2') 2. ~ 0.4F.0 r.15.,2
2606 ZOIl5!J.6 26ro4.1 36~.8 6.12 1.5\ 1.73 0.5~1 Ci.lb1 ,!
27116 2ee55 • .., 3073.4 365.8 7.40 1.47 1.76 1).534 (\.1515
2406 201J5~.6 35t-l.5 365.8 8.74 1.41 2.1Q 0.515 ('.11l\
2906 213~t-.5 1440.7 347.1 3.1'5 1.'n 1.23 0.5'Je r.1611
)1)06 2111lf,.5 2t)21.8 347.1 4.84 1.55 1.5q 0.557 r.l"!3
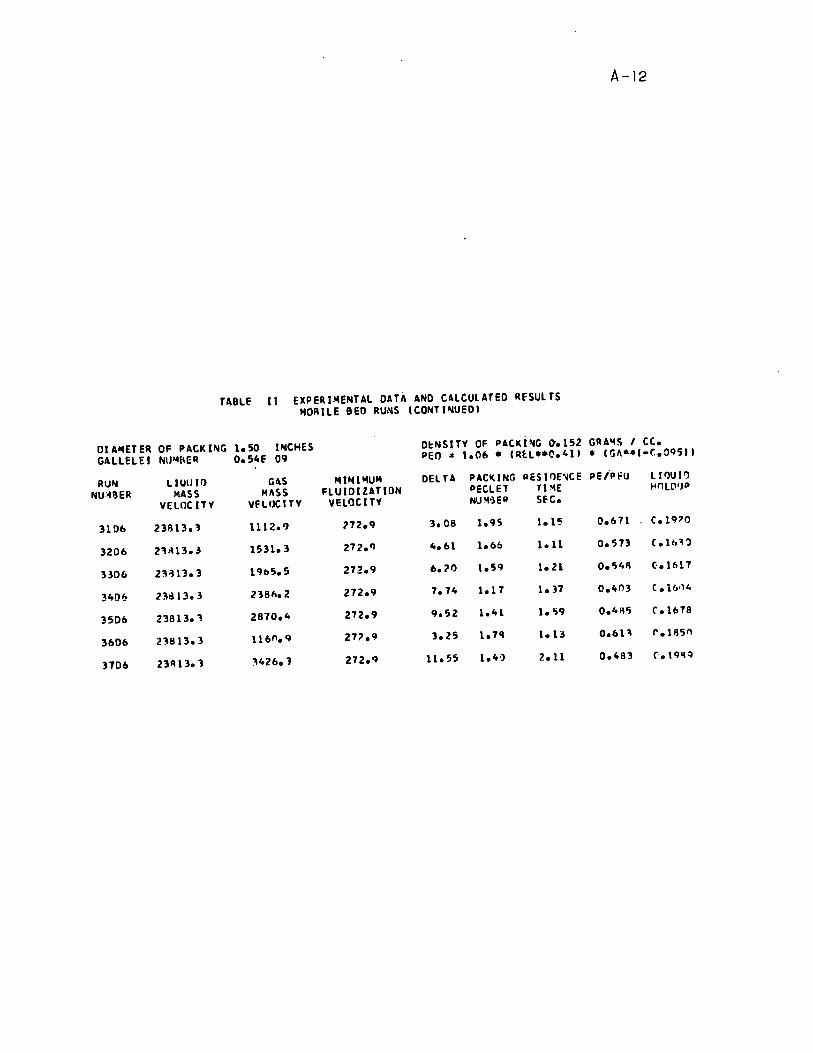
A-12
TABLf Il EXPERIMENTAL DATA AND CAlCUlAfEO RE'SULfS MORIlE BEO RUNS ICONTI~UEDI
DIA~ETER OF PACKING 1.50 INCHES D~NSJTV OF PACKliIIG 0'.152 GAA"'!; 1 CC. GAlLELEI Nl'''4f\EA 0.54E' 09 PEn. 1.06 • IRU .. tI.411 • IG"··I-r..OQ511
RU"" LIUlJl1} GAS "'IN 1 Io\UI4 DELTA PACttlNG IIESII')E .... CE PEiPFU L IIlUII) NU:4I3ER MA5S M"SS FLUIOIZATION PECLET TI ~E '''''lt'l'JP
VElOC ITV VFlIlCITY VElIJCITV NU~iEII SfC.
3106 231H3.1 1112.1) 172.q 3.08 1.95 1. 1'5 0.671 C.lq""
3206 2"'~13. 3 1531.3 272.<) 4.61 1.66 1.11 0.573 (.lhl'
H06 23'H3.3 1965.5 272.q 6.?0 t.5q 1.21 0.~4A C·.1617
340~ 23d 13. 3 238".2 272.9 7.74 1.17 1.37 0.403 C .1(,1'4
3506 23813.1 2870.10 272.9 9.52 1.41 1.0;9 0.414'5 ('.1678
3606 23813.3 H6n• q 27'1.9 3.25 1.7q 1.13 0.61l 1'.1135n
3706 231113.1 3426.3 272.9 H.55 1.4·) 2.11 0.483 r.,q'l~

A-13
TAI3LF III BEO HEIGHT OUt FOP. :-\ORIL!: sen
G!o\F - LBS. , 'H~.-FT"2' H - I~CHt:S
OP • 0.5C 1 NOiES
L 1 2 3 4 5 6 7 8 9 10
3944. G 1526. 2196. 269C. 3225. 3539. 793. 1/t'~9. 2488. 3213. 3514.
H 10.215 12.25 14.!i0 16.25 17.00 8.51' 1(1.37 14.75 19.00 20.75
6977. G 8/.0. 1387. 2238. 2946. 3575. 7n7. 1481. 24Q7. 3C96. 35~o;.
H ft.2'j le. 50 12.50 15.75 17.75 7.25 1('. 'je 14.25 18.25 ?i!. O;~
9707. G 653. 112ft. 199(:. 2934. 1557. 5~3. 1374. 1341. 3('16. 354~.
H 7.tO 9.75 12.(',0 lb.75 22.5C 7.13 11.50 14.75 19.25 22.75
12513. G 432. 984. îi26. 29H. 3317. 44!>. 1121. 2254. 29')9. ~418.
H 7.e-0 1('.25 13.50 18.25 21.5') 7.13 1~.13 14.~(, 17.75 21.5:;
15319. G 354. 1249. 2154. 2782. 3167. 347. 1076. 20ll5. 2769. 3220.
H 7.13 10.88 14.50 18.13 22.50 7.1~ 1~.15 13.15 18.5::' 22.(I!!
18201. G 37/). lC9'-. 195<'. 2536. 2846. 'H2. 1195. 1116. 2218. 2789.
H 7.63 11.25 14.50 20.25 22.'j~ 8.25 11.25 13.25 15.25 21.75
20856. G 328. IIHO. 2e23. 2340. 2·76..,. 21)6. 1151. 1777. 2170. 26(7.
H 7.88 11.5~ 17.00 19.50 23.50 7.50 12.00 lS.63 18.0t' 22.l'0
23B13. G 294. 76'). 1397. 2032. 2493.
H 9.CC 12.')0 14.75 18.75 22.5(;
fA8LE lit CCONTlNUI.:O' aEi) HEIIjHT DATA FOR "OS ILE SEO
GMF - L.lS. , '~.-FT··2' H - INCHES
OP • 0.1'5 I~CHes
L 1 7. 3 4 5 6 7 8 9 le 11 12
3943. r, ~11. . l '3'--). 197',. 24S4. 3('83. li 6.CC 7.C(I 8.75 11).25 11.25
6971. G a14. l/.l s. 1931.:. 2417. 29H. 1395. 8e5. 1315. 1921. 24ft~. 2964. 3462.
H 'j.88 1.l5 Il.50 10.CO 11.15 13.25 5.15 7.13 9.00 l~.('(' lC.75 12. '-5
91C7. G '325. 1345. 1945. 2480. 2962. 1428.
H 6. ,~ 7.55 9.25 9.15 1e.15 P.N'
12513. G '3 '.~. 1/.~ 7. 1950. 7.449. ler6. 1458. 7134. 1)9 t. l'n.,. 2"7. 7.967. )379.
~ ~. 51' 7. S8 9.1:0 1e.co 11.'j'' 12.75 6.25 7.25 9.7.5 le.50 11.25 12.75
15319. G 11'5. 1391. 195('. 2491. 3eez. )396.
H 6.50 8.flO 9.(,0 1(\.25 12.C(I 13.15
182el. G IH6. 1104',. 1929. 2560. )e' 19. )0\46. 711. 14Ct1. 1932. 2459. )('C8. 3)84.
It ~. '38 8. 'j'a e.88 l". co 11.5:: 14.25 6.75 7.75 9.50 10.15 12.15 14.25
2('1856. G 329. 137Z. 19(' 1. 2491J. ~<;9'j. 14Z2.
It 7.Cr. s.~o 9.~,) le. sr. 12.~r: 14.50
23813. G 'J09. lB5. 1«)49. 2515. 3eo\l.
H 7. sr. 8./')C 9.00 11.C'l 13.25
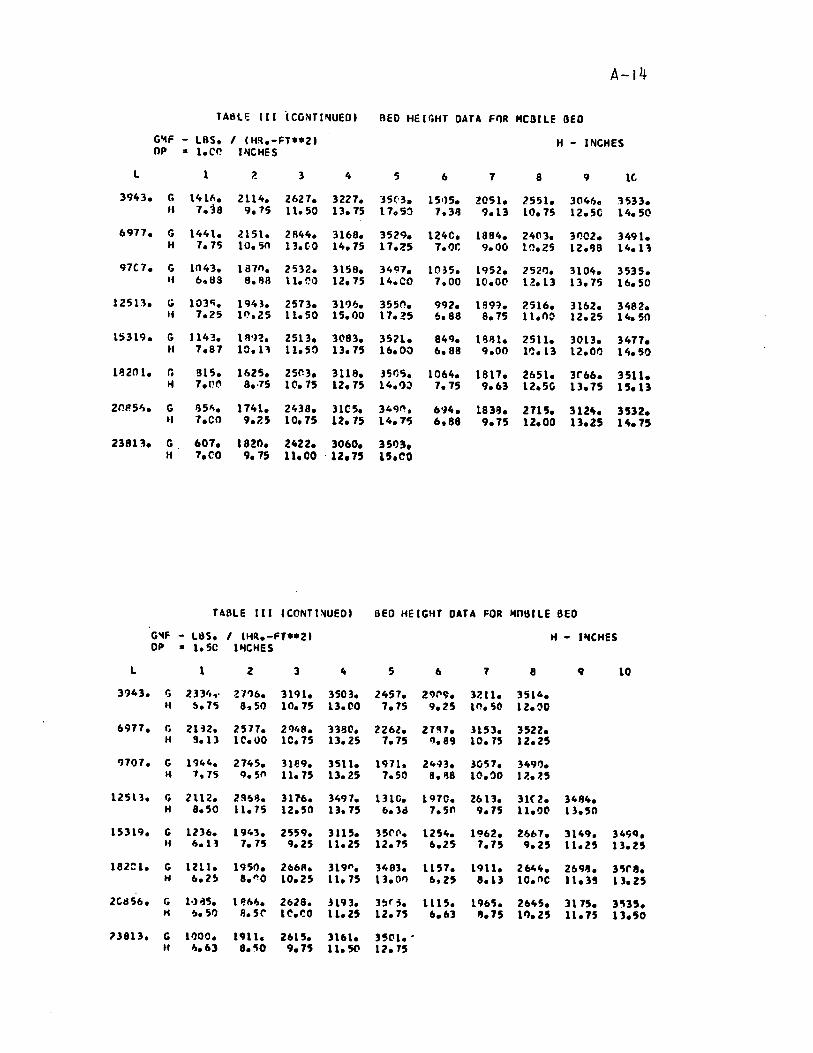
A-14
TASlF. III ·CCuNTIPofUED. RED HEIGHT DATA f~R HCBllE BEO
Glo\f - lBS. 1 C H!\.-FT •• 2' H - INCHES DP .. 1.cn IPofCHES
l 1 ? 3 4 5 6 7 8 9 1(,
3943. G 1411'1. 2114. 2627. 3227. ]5('3. 15')5. 2051. 1.551. 304". 3533. Il 7.38 9.75 11.50 13.75 17.5' 7.313 9.13 10.75 12.5C 14.50
6977. li 1441. 2151. 2R44. 3168. 3529. 124C. 1884. 2403. 3"02. 3491. H 7.75 10.50 13.CO 14.75 17.~5 7.tJr. 9.00 10.25 12.138 14.13
97C7. li 1043. 1 B7n. 2532. 3158. 3497. 10~5. 1952. 252/). 3104. 3535. Il 6 .. 83 S.SR 11.CO 12.75 14.CO 7 .. 00 10.00 12.13 13.75 16.50
12513. Ci 1030;. 1943. 2573. 311)~. 355~. 992. IB9~. 1.516. 3162. 3482. Il 7.25 1/).25 11.50 15.1)0 17.?S 6.88 8.75 11.n~ 12.25 14.50
l!i319. G J 143. 111<}~. 2513. 3(183. 3521. 849. 113111. 2511. 3013. 3477. tI 7.87 10.13 11.50 13.75 16.00 6.88 9.00 1'l. 13 12.0f) 14. St)
uzn 1. r. 815. 16Z5. 25r.3. 3118. )1j1)5. 1064. 1817. 2651. 3r66. 3511. li 7.1'(1 8.·75 10.75 12.75 14.1):,) 7.75 9.63 1Z.5C 13.75 15.1]
201'5". G ilS". 1741. 2438. 31e5. ]4Cm. 6'i4. 18313. 2715. 312~. 3532.
l' 7.CO 9.?5 10.75 12.75 14.70; 6.88 9.75 12.00 13.25 1".75
23813. G 607. 1820. 2"22. 3060. 351)3. H 7.CO 9.75 11.00 . 12.75 15.~o
TABLE III ICONTI~UEO. BEO HEIGHT DATA FOR "'"SILE SEO
GIo\F - l8S. 1 lliR.-FT··2. li - I,.CHES OP • 1. SC l "'ClIES
l 1 2 3 4 5 6 1 8 9 10
3'143. li ?] 3"0' Z·/'lb. 3191. 3503. 2"57. 29C"9. 31.11. 3514. It !o.H 8.50 10.75 13.r.O 7.15 9.25 l".':iO 12.~O
6911. r. 2B2. 2577. 2Cl48. 3380. 2262. 2H7. 1153. 3522. H 9.13 1C.OO 10.75 13.25 7.75 Cl.S9 10.75 12.25
9101. G 1944. 2145. 31e9. 3511. 1911. 24-13. ]051. 349". li 1.75 9.5" 11.75 13.25 1.50 8. "8 10.~O Il. '-5
12513. li 2112. 296". 3116. 3491. 1310. 1910. 2613. 31C 2. 3481t. H 8.':i0 Il.75 12.5n 13.75 6.3d 1.51' 9.15 11.00 13.50
15319. G 12)6. 1943. 2559. 3115. 15('(\. 1254. 1962. 2667. 3149. 34C;Q. Il 6.1) 1.15 9.25 11.25 12.75 6.25 1.75 9.25 1I.l5 Il.25
182:: 1. G 1211. 195/). 266R. 319". 3483. 1151. 1911. 26410. 2b98. 35rlJ. H 6.2!» 8."0 10.25 Il.15 13001') 6.l5 8.13 10. ne 11.3' 11.25
2Cd56. G 10) 035. IP.M. 2628. B93. l~r ;. III S. 1965. 26105. 3115. 3"35. H '!t. SI) Il.5r 1 C.I:O 11.25 12.15 6.63 8.75 11). l5 11.75 11.50
13813. G 1"00. 1911. 2615. 1161. 35(11 •• If Il. 63 8."0 9.75 11.5(\ 12.15
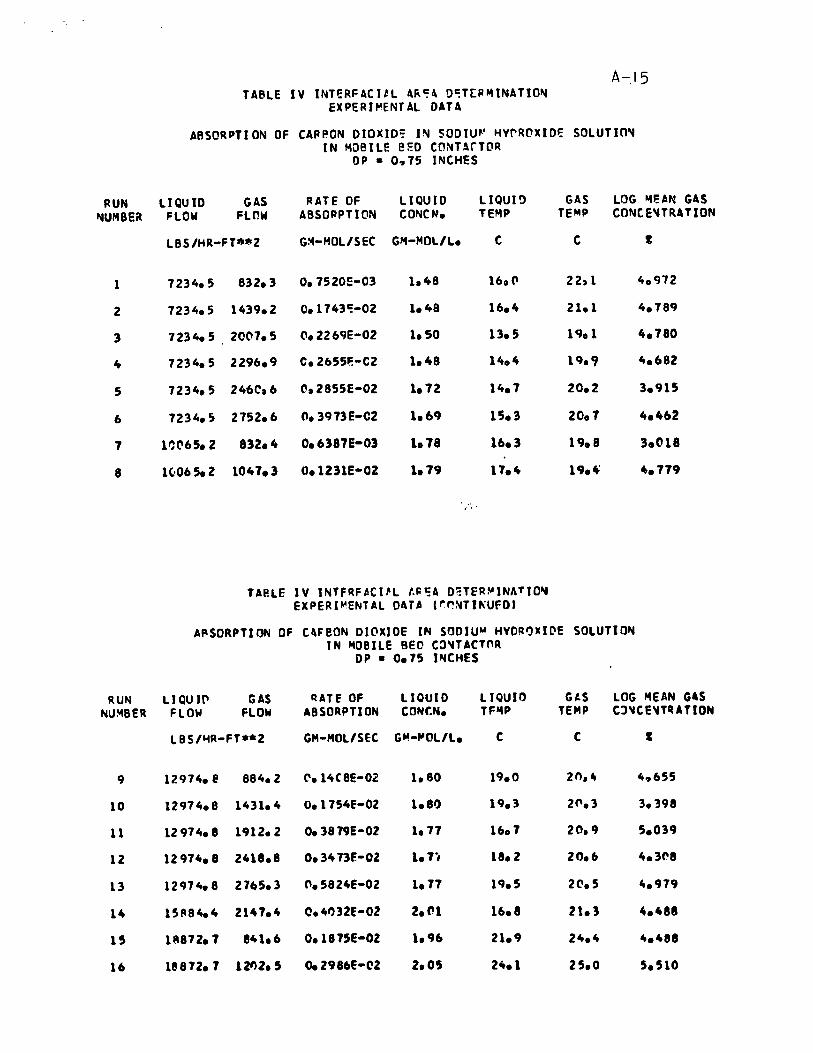
A-.15 TABLE IV INTERFACI~L A~~~ D~T(P~tNATIO~
EXpeRI~ENTAL DATA
A8S0RPTION OF CAP~ON oIOXIo~ IN 50DIU~ HvrROXIOE SOLUTIO'lf IN MOBILE eEo CONTArTOR
OP • 0,15 INtHES
RUN LIQUIO GAS RATE OF LIQUlo LIQUI !) GAS LOG ~EAN GAS ~UM8E~ FLOW FLOW A8S0PPTION CONCH. TEMP TEMP CONtE'HRATIDN
LBS/HR-FT$~2 G:4-MOL/SEC GM-MOL/L. C C , 1 1234.5 832.3 0.1520E-03 1.48 16. (\ 22,1 4.972
2 1234.5 1439.2 0.1143'=-02 1.48 16.4 21.1 4.189
3 1234.5 2001.5 0.2269E-02 1.50 13.5 19.1 4.780
4 1234.5 2296.9 C.2b55E-C2 1.1t8 14.4 19.~ 4.682
5 1234.5 246C, 6 <,,2855E-02 1.72 14.1 20.2 3.915
6 1234.5 2752.6 0.3913E-C2 1.69 15.3 20.1 4.462
7 11)('65.2 832.4 0.6387E-03 1.18 16.3 19.8 3.018
8 1(.0065.2 1047.3 O.U3lE-02 1.19 17.4 19.~ 4.179
,·'1"
TAPoLE IV INTFRF~CI~L t~~A oETER~INATIO~ EXPERI~eNTAL o4T~ ,~r.~TI~UFol
AI'SORPTI ON OF t~FeON DIOXIOE IN SODIUM HYOROXI~E SOLUTION IN ~OBILE 8EO C~'lfTACT~R
OP • 0.15 INCHE$
RUN LI QU If' GAS ~ATE OF lIQUlo LIQUIO Gt.S LOG MEAN GU NU~BER FLOW FLOW ABSORPTION CONtN. TF"P TEMP CJ"4CE"4TUTION
LBS/HR-FT·*2 GM-MOl/SEC GM-"OL/L. C C ~
9 12974. e 884.2 t'.14C8E-OZ 1.80 19.0 20. " 4.,655
10 12914.8 1431.4 0.11541:-02 1.8" 19.3 2(\.3 3.398
11 12974.8 1912.2 0.3819E-02 1.77 16.7 20.9 5.039
12 12914.8 2418.8 O. 31t nf-02 1.7i 18.2 20.6 4.3re
13 12 CH 40 8 21t,5.3 0.5824E-02 1.17 19.5 2('.5 4.979
lit 15R8401t 2147.1t O.41)32f-02 2.01 16.8 21.3 It.488
lS 18872.7 841.6 0.1875E-OZ 1.96 21.9 24.4 4.1t88
16 18812.7 12')2.5 0. 2986E-02 Z.05 ZIt.1 25.0 5.510
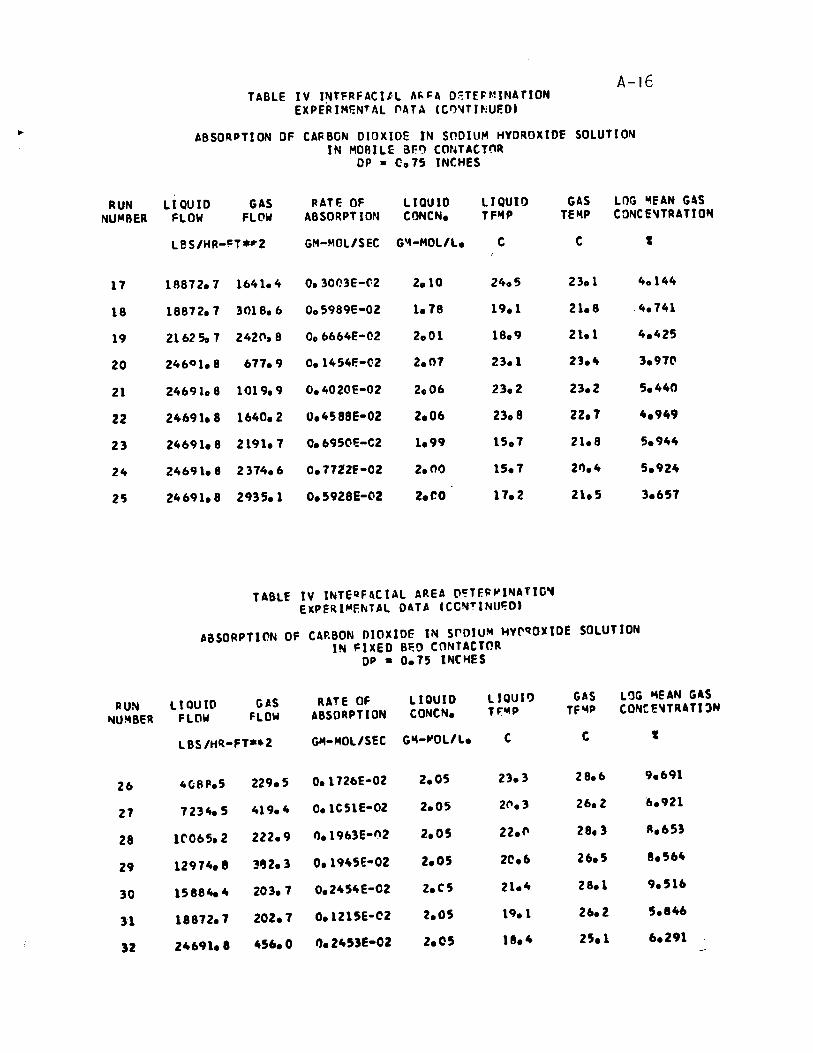
A-16 TABLE IV JNTFRFACJ'l A~~A D~TEFMINATION
EXPE~IM~NTAl ~ATA (C~~TI~UEO'
~8S0RPTlON OF CA~BON DIOXIDE IN SODIU~ HVDROXIOE SOLUTION IN MORllE aFry CONTACTOR
OP • C0 75 INCHES
RUN llQUID GAS PATE OF L1QUIO LI QUI!) GAS lOG I4EAN GAS NU~RER FLOW FLOW ABSORPTION CONCN. TF"'P TE"'P CONCe~TRATION
leS/HR-H*r2 GH-MOl/SEC G"4-MOL/L. C C ~
17 18872.7 1641.4 O. 3003E-t-2 2.10 240 5 23.1 40 144
18 18872.7 3018.6 00 5989E-02 1.78 19.1 21.8 ,4.741
19 2162507 242(\.8 0.6664E-02 2001 1809 21.1 4.425
20 246°1.8 677.9 0.1454E-C,2 2.()? 23.1 23.4 3.97('
21 24691.8 1019.9 O.4020E-02 2.06 23.2 23.2 5.44n
22 24691.8 1640.2 U.4588E-02 2.06 23.8 22.7 4.949
23 24691.8 2191.7 O.695l'E-C2 1.99 15.1 21.8 5.944
24 24691.8 2374.6 O.77Z2f-02 2.no 15.1 2".4 5.924
21j 2461H.8 2935.1 O.5928E-(\2 2.r.0 17.2 21.5 3.657
TABLE IV INTEQFACIAl AREA O~TEP~INATIO~ e)(PERIME~UL OAU CCC~"INlI'=O'
~aSORPTIr.N OF CARBON nloxlDE IN srOJUM HvrqoxIDE SOLUTION IN FJ)(EO BF.O CONTACTOR
OP • 0.15 INC~ES
RUN LIQUIO GAS RATE OF llOUIO lIQUI!) GAS laG "'EAN GAS
NU!l48eR FLOW FLOW ABSORPTION CONCN. TF:Io4P TF"P CONe e"'TRATI lN
lBS/H~-FT.~2 G"'-MOl/sec GI4-,",OL/l. C C 1
26 4(;8 fI.5 229.5 O.I726E-02 2.05 23.3 28.6 9.691
27 12340 5 419.4 O.le51E-02 2.05 2(\.3 26.2 '6.921
28 U'065.2 222.9 O.1963E-"2 2.05 22.(\ 28.3 1'.653
29 12974.8 3132.3 0.1945E-02 2.05 2~.6 26.5 8.564
30 158840 4 203.7 0.2454E-02 2.e5 21.4 28.1 9.516
31 18812.1 202.7 0.1215E-C2 2.05 19.1 26.2 5.846
3l 24691 •• 456.0 O. l453E-OZ 2.05 18.4 25.1 6.Z91
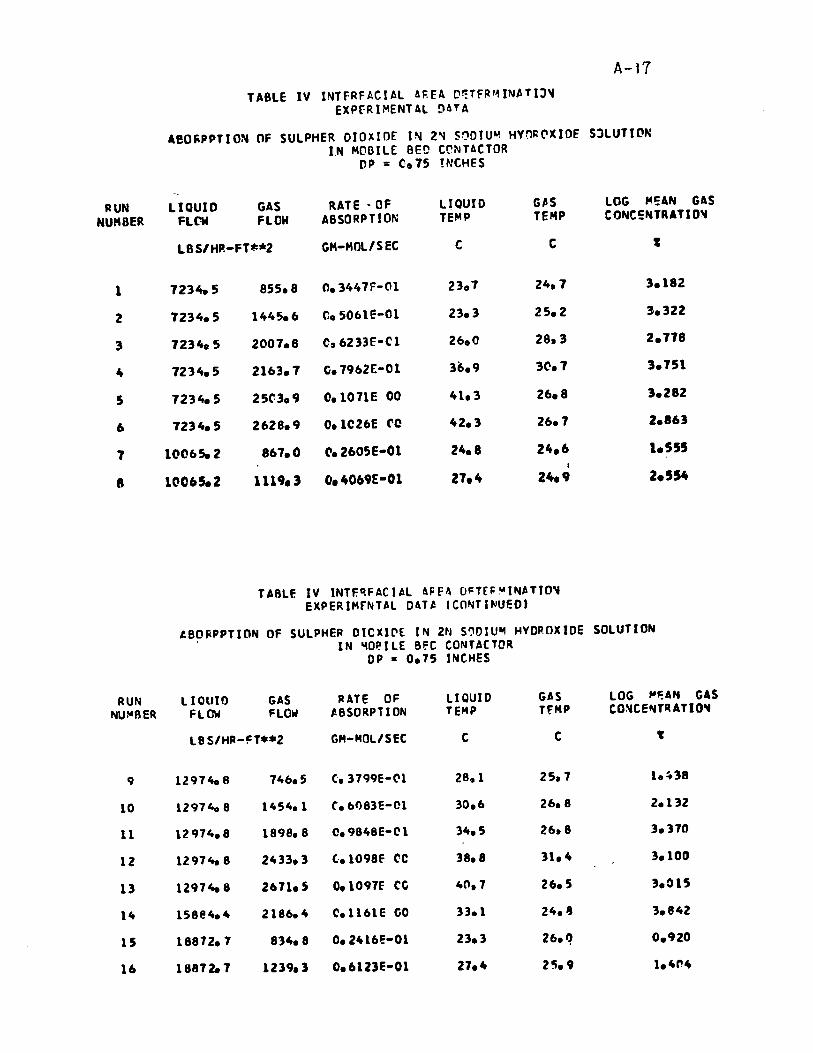
A-17 TABLE IV INTfRFACIAl aREA D~TFR~IN~TIJ~
EXPfRI~ENTAL DaTA
AeOI\PPTlO!'i OF SULPHER DIOXIOE I~ 2~ S~DIU~ HVn~~XIOE SJlUTlON IN MOBILE BEO CCNTACTOR
OP = Co 7S !NCHES
RUN llQUIO GAS RATE· OF llQUIO G~S lOG "'!:AN GAS HUMBER FlCW flOW ABSORPTION TE"'P TEMP CONCENTRATIO'lt
LBS/HP.-FT**2 GM-MOl/SEC C C t
1 7234. 5 855.8 n. 3447F-Cll 2307 24.7 3.182
2 7234.5 1445.6 C.5061E-Ol 23.3 25.2 3.322
3 7234c 5 2007.8 C,6233F-Cl 2600 28,3 2.718
0\ 7234.5 2163.7 (j.7962E-Ol 36.9 3~.7 3.751
5 7234.5 25~309 O.lOnE 00 41.3 26.8 3.282
6 7234.5 2628.9 O.IC26E (10 42.3 26.7 2.863
7 100650 2 867.0 <'.260SE-Ol 24.8 24.6 1.555 1
8 1('065.2 1119.3 O.o\069E-Ol 27,4 24,9 2.554
TABLE IV INTF.~FACIAl AFf~ D~Tr~~INATIO'lt EXPERIMFNTAl DATt ICONTINUEOt
taO l'PPTI ON OF SULPHEP DICXI~[ IN 2N S~DIU~ HVDROXIDE SOLUTION IN ~O~llE 8~C CONTACTOR
OP • 0.75 INCHES
RUN llOUIO GAS RATE OF LI QUIO GAS LOG "~AH GAS NU~8ER FLOW FLOW tBSORPTlON TEMP Tf HP CO~CENTItATlD~
LB S/HR-H**2 GM-MOL/SEC C C t
9 12974. ft 746.5 (-.3799E-N 28.1 25.7 1,438
10 12974.8 1454.1 c. M83E-Cl 30.6 26.8 2.132
11 12 cH4.8 1898.8 C.9848E-Cl 34.5 26,8 3.110
12 129740 8 2433.3 {.1098f (lC 38.8 31.4 3.100
13 129740 8 2671.5 001097f CG 40,7 26.5 3.015
14 158e4.4 2186.4 c.1161E CiO 33.1 24.1) 3.@42
15 18872.1 834.8 O.24161!-01 23.3 26.q 0.920
16 188720 7 1239.1 O.61Z1E-Ol 21.4 2~.9 1.4r.4
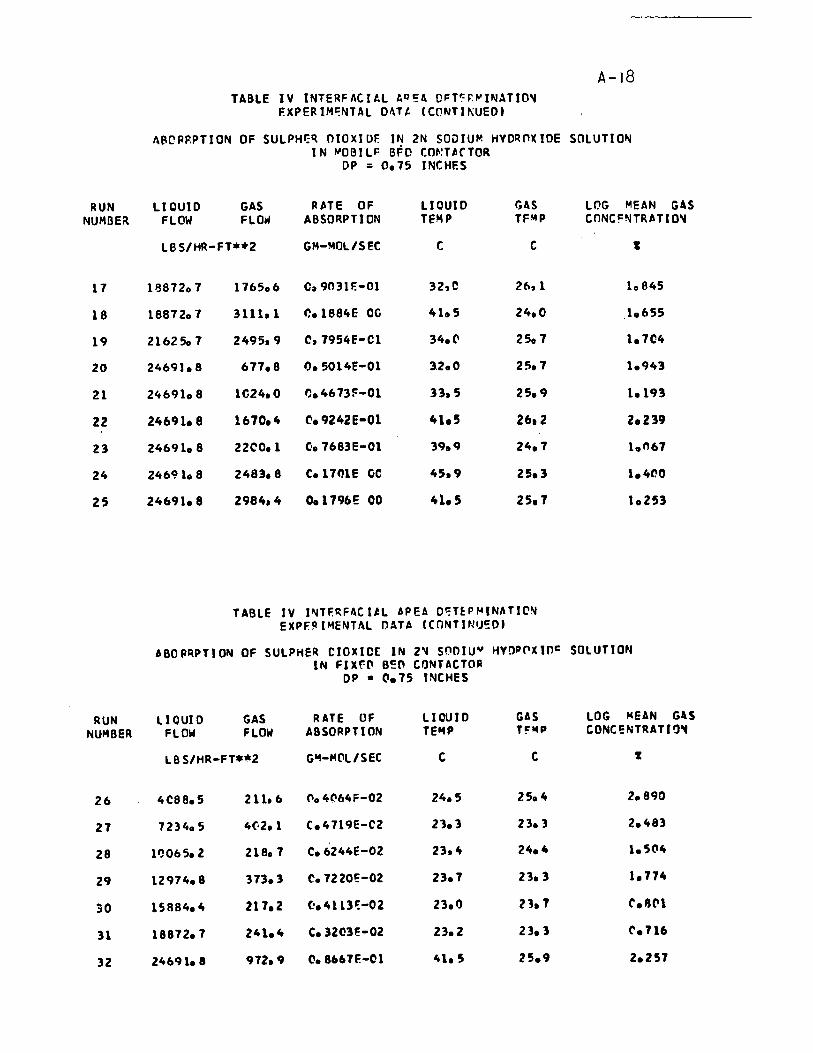
A-18 TABLE IV INTERFACIAL AO~4 D~T~r~INATIO~
EXPERIM~NTAL DhTt 1 CflNTI t\UEO)
AaePRPTION OF SULPHr;~ OIOXIDF. IN 2N SODIU~ HYO~nXIOE SOLUTION IN ~OBIL~ B~D CO~T~rTOR
OP = 0.75 INCHES
RUN LIQUID GAS Rne OF LIOUIO GAS LOG MEAN GAS NUMBER FLOW FLOW ABSORPTION TEMP TF!4P cnNC~NTRnIO~
LBS/HR-FT"''''2 GM-MOLISEC C C t
17 188720 7 1165.6 C~ 9031F.-Ol 3Z,C 26,1 10 845
18 18872.7 3111.1 ~.1884E OC 4lct5 24.0 1.655
19 2162507 2495.9 C,7954E-C1 34.(1 25.1 1.104
20 2469J.8 677.8 'l.5014E-Ol 3.2.0 2~. 7 1.943
21 24691 0 8 1024.0 ()04673F-01 33.5 25.9 10193
22 24691.8 1670.4 (I.9242E-01 41.5 26.2 2.239
23 246910 8 22CO.1 O.7683E-01 39.9 21t.1 10n61
24 24691.8 2483.8 C.l1tllE OC 45.9 25.3 1.4~O
25 24691.8 2984,4 00 1196E 00 41.5 25.1 10253
TABLE IV I~TF~FhCItL ~PEA D~T~P~IN~TICN EXPF~IMENTAL DATA (CnNTIN~~O)
~ BD PRPTI ON OF SULPHER CIOXIC[ IN 2" snOIU'" HYDP('lXIOC: SOLUTION IN Flxr-~ B~O CONTACTO~
OP • 0.15 tNCHES
RUN LI OUI 0 GAS RATE OF LIOUIO GAS LOG MEAN GAS NUMBER FLOW FLOW A8S0RPTION TE14P T~I4P CONC!:NTRATI!ltt
LBS/HR-FT**2 GIo1-MClLlSEC C C t
26 4CS8.5 211,6 ('I04(164F-02 24.5 2504 2.890
27 723405 1t('-2. 1 C.4719E-C2 21.3 23.3 2.483
28 1')065.2 218.1 C.621t4E-02 23." 24.4 1.5(\4
29 12974.8 373.3 C.7220E-02 23.7 23.3 1.774
30 15884.4 217.2 (-.4113';-02 23.1) 23.1 r.IS"l
31 18872.7 241.4 C.3203E-02 23.2 23. ) r.716
32 24691.8 972.9 C.8661F.-01 41.5 25.9 2.257
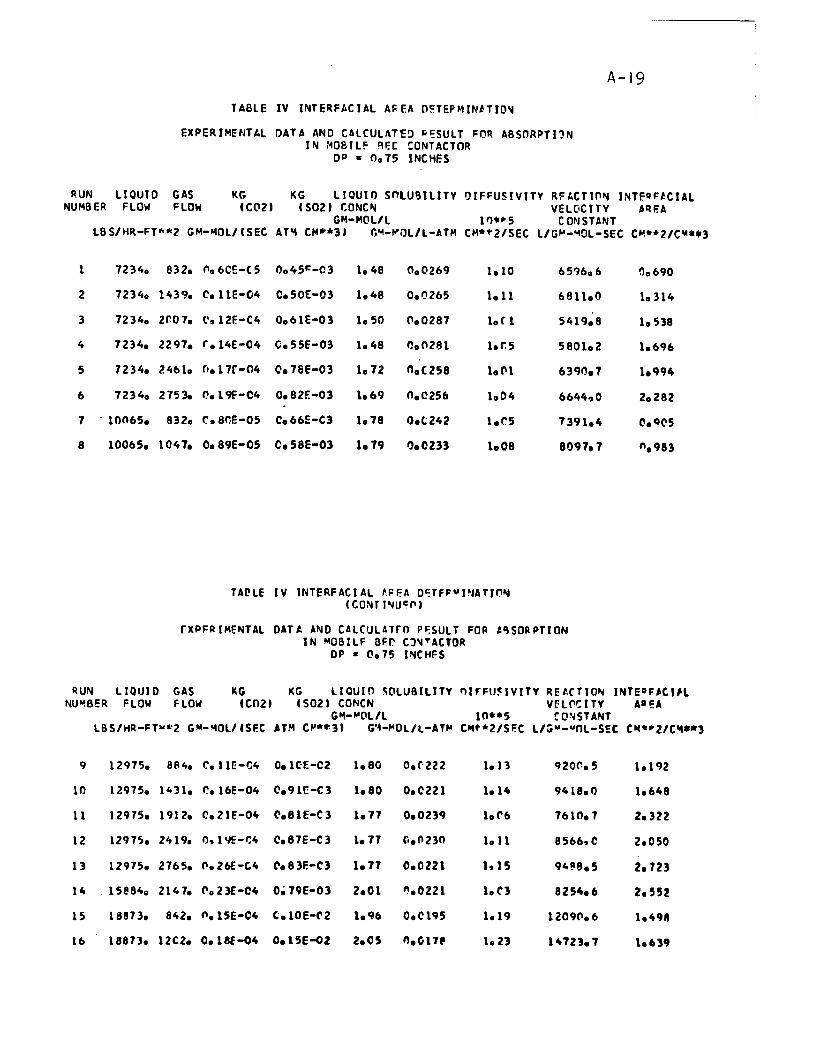
TABLE IV INTERFACJAL A~f.A O~TEPMIN~TIO~
EXPERIMENTAL DATA AND CAlCULATE~ ~~SULT FOR ABSORPTI'N IN MOBJLF ~EC CONTACTOR
OP a OQ75 INC~F.S
A- 19
RUN LIQUID GAS KG KG LIQUIO snLU81lITY DIFFUSIVITY RFACTJn~ INTFOF~CIAl NUMSER FLOW FLOW CC(l21 CS021 r.ONC~ VELCtCtTY ~ClF.A
GM-MOL/l 1~.~5 CONSTANT LBS/HR-FTw-Z GM-~OL/CSEC AT~ CM~*3' r,~-~OL/l-ATM CM*~2/SEC l/G~-~Ol-SEC CM.*2/C~*.3
1 72340 832. (l06eE-C5 00451:-03 1.48 0.0269 1.10 65960 (, n0 690
2 7234. 1439. ('.11E-04 C.50E-03 1.48 0.0265 1.11 6811.0 1.314
3 7234. 2r.07. ('0 12F.-C4 O.61e-03 1.50 ('.0287 1.C' 1 5419.8 1.538
4 7234. 2297. ('.14E-04 C.55[=-03 1.48 ".0281 1. r. 5 5801.2 1.696
5 1234. 2461. r'.17r-04 0.78[=-03 1.72 n.C258 10 CIl 6390.7 1.994
6 7234. 21530 ~. 19[=-04 O.82E-03 1.69 O.C256 1.04 6644.,0 2.282
7 . 10065. 832 • e:. SnE-05 Co 66E-C3 1.78 0.(;242 1.C5 7391.4 l'.qC'S
8 10065. 1047. O. S9E-05 C.5SE-03 1.79 ".0233 1008 8097.7 1'.983
TA[!LE IV INTERFACJAL ftP~A D~TFP~I~ATIO~ (CONTI~Ue".
rXPFA 1 MENT Al OATA AND CAlCUlATrO P~SUli FOR ~"SO~ PTI ON IN M081LF BFr. CJ~TACTOR
OP • 0.75 I~CHE5
RUN LlQUID GAS KG KG llOUIO ~(lLU8ILITY ~lrFU~IVITY REACTION INTeOF~C'#L
NU~BER FLOW FLOW CC02. (S02 1 CO~ICN VHPC ITY AII!:A G 11-I'OL IL 10"5 r(l~STANT
LBS/HR-FT~~2 GM-~Ol/C5EC UM C"-"3. G'4-~Ol/L -AT'" C","*2/SF.e l/~~-vnL-sec ClICu2lC~·*3
9 12975. 8E14. ~. liE-Cio 0.lH-C2 1.80 0.r·222 1.13 920r..5 1.1n
10 12975. 1431. r..16E-04 0.91e-C3 1.80 0.C221 1.14 9418. " 1.648
11 12975. 1912. ('.21~-04 C'.81E-C3 1.17 0.0239 1.('6 7610.7 2.322
12 1297'>. 2419. /), l 'lE - 1:4 C.87E-C3 1.77 fI.0230 1. Il 8566, C 2.050
13 12975. 2765. 0.26E-t4 t'. 83F.-C3 1.71 0.0221 1s 15 94119.5 2.723
14 15884 .. 2147. t'. 2 3~-C4 O~ 79E-03 2.01 ~.OZ21 1. (') 8254.6 2.552
15 18873. 842. ".15e-04 (.lOE-('2 1.q6 O.C195 1.19 1209(\.6 1.4911
16 18873. 12e2. 0.lSf-04 O.15E-oZ 2.05 ". Ci 17' 1.23 14723.7 1.639
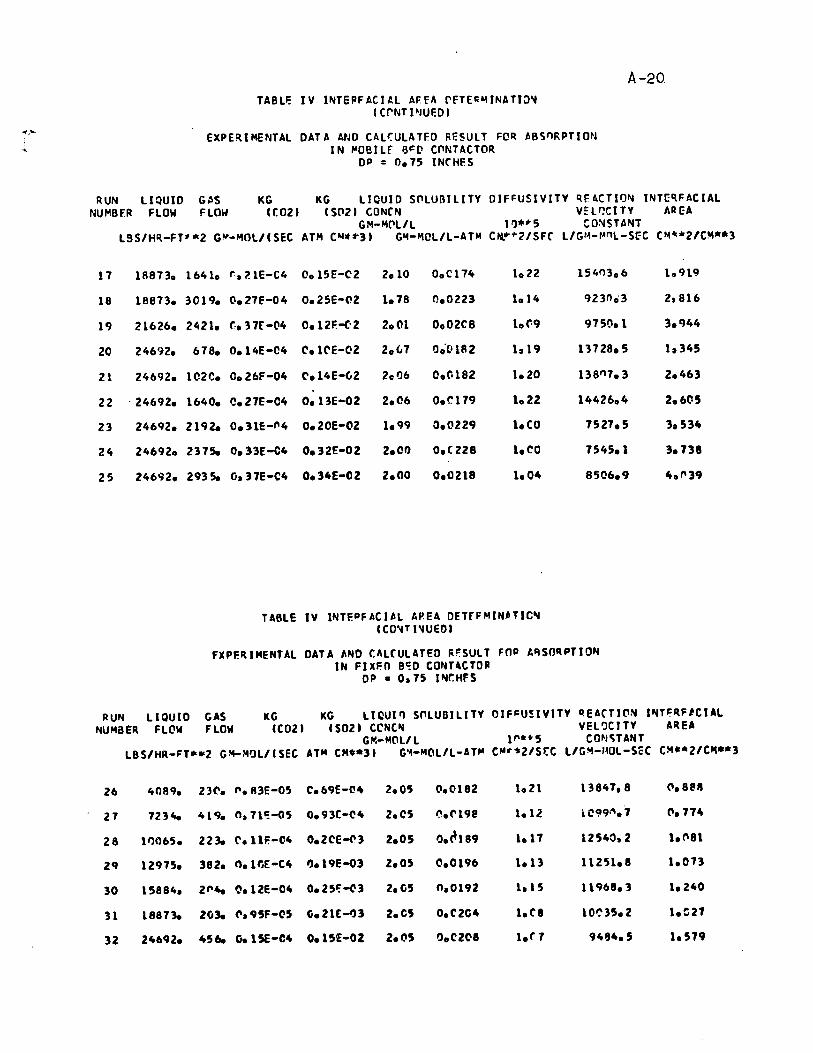
A-20 TABLI: IV I~TePFACJ1L AFFh rFTE~~JNATIJ~
1 CrNTI~IUEO' ~~~
EXPE~IMENTAL i DAT A AND CALt:ULATF.D RESUL T FO~ ABsnRPTlON '" IN ~OeILf 8~D C~NTACTOR
OP = 0.75 tNCHES
RUN LlQUIO G~S KG KG LJQUID S~LURtLtTY DIFFUSIVJTY qF4CTIO~ tNT~qFACIAL NUMBrR FLOW FLOW CC02' CSCl21 CONCN V:U~CtTY AREA
GM-"1('1L/L t 1).'" 5 CO!ljSTANT LSS/H~-FT-*2 G~-MOl/CSEC ATM C .... ,.3' G14-r.tCL/l-ATM C~"'21SFC LlGI~-rAnL-SfC C"'-*2'C~"'*3
17 1R873. 1641. "'al1E-C4 0.15E-C2 2.10 0.C174 1.22 154(')3.6 1.919
18 18873. 3019. O.27E-04 0.25E-OZ 1.78 1'!.0223 1.11. 92300'3 2,816
19 21626. 2421. r. 37r-(l4 O.12F-C·Z 2.01 Co02es 10 ('·9 975!1.1 3.1)44
ZO 246n. 678. 0.14E-04 ('.lrE-OZ 2.{.7 0.(118 Z 1, 19 13728.5 lt345
21 24692. 102e. 0.26F-04 ('.14E-(,Z 2.,06 0.0182 1.20 138"7.3 2.463
22 ·24692. 1640. C.27E-C4 O.llE-OZ 2.06 0.r.179 1022 14426 .. 4 2.6(15
23 24692. 21920 O.31E-M. 0.20E-02 1.99 0.0229 1.CO 75Z7.5 la534
Z4 24692. 23750 0.33[-C4 0.32E-02 2.01) 0.e228 1. CO 7545.1 3.738
25 24692. 29350 0,. HE-C4 0.34E-02 2.00 0.0218 1004 8506.9 4."39
TABLE IV INTF.DFAC1Al AP.E4 OETrFMIN~TIC~ CCO'iTI'lUEO'
FXPFRIMENTAL DATA AND CAL(UL4TEO R~SULT FOP I.~SOItPTlON
IN FIXF.O B~O CONT4CTO~ OP • 0,.75 I~r.HFS
RUN L1QUIO GAS KG KG lIQUI,., S~lUBILITY OJFFU!IVJTY ItEACTION I~T~RF'CIAL
NUMBER Fl(lW FLOW CC02. (S02' CCNC~ VEl'lCJTY AREA GP'.-MCll/L l""-S CONC;TANT
l8S/HR-FT*-2 G~HQL/(SEC ATM CM**3' G'~-M(lL/l-A T'" C",u2lSJ:C L/G!o1-HOl-SëC OI··21C~**3
26 4089. 23('. ". fl3E-05 C.69E-(!4 2.0'5 ('1.0182 1.21 13847.8 ('.8811
27 72340 10 19. na 71'=-05 O.93C-C4 2.0S <'.('198 1.12 iC991\.7 ('.774
28 11)065. 22:3- C'. HF-04 O.2CE-<') 2.05 O.~189 1.17 12540,2 1. (\81
29 12975. 382. n.lfiE-C4 1). 19E-03 2.05 0.0196 1.13 11251.8 1.073
30 1S881o. 2"40 ~.12e-04 0.2SI;-(l3 2. CiS n.0192 10 1S 11968.1 1.240
H 188730 20:3- <'. 95F-~5 (i.21[-4)] 2.C5 0.('2(;4 1.('8 10~35.2 1.:21
32 24692. 4S6o OolSE-C4 O.UE-OZ 2.(lS O.C'Z~I 1.r 7 941)4.S I.S19
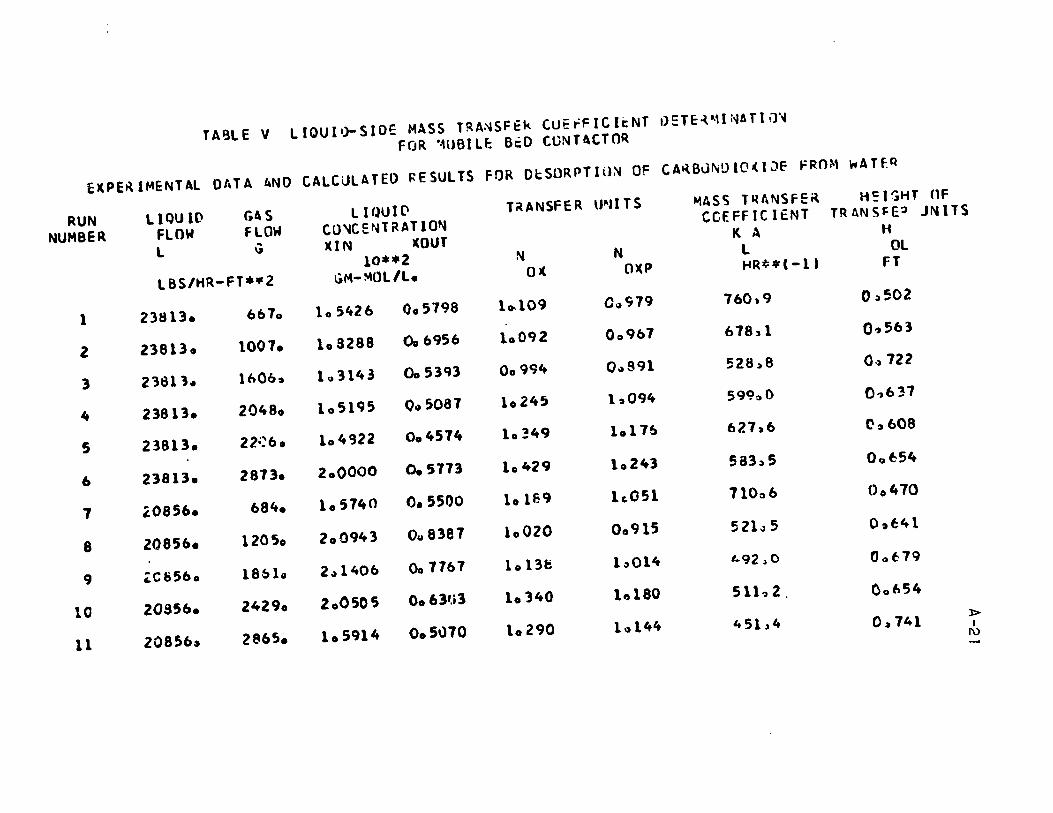
TA8lE V LIOUII)-SIOE MASS TRA.'~SFEk CUEt=FIClè:NT 1)=TE~"lIi~ATIIT~
FOR '·HJ6IU: 6':0 (ONT~CTOR
E~PERJMENTAl DATA AND CALCULATEO ~ESUlTS FOR D~SORPTli)~ OF CA~B0NDIO(IJf FROM ~ATfR
RUN llQUID GAS L HJUI (1 T~ANSFE R U~U T S ~AS5 T~ANSfE~ H=I'iHT OF
NUMBER FLOW FLOW CLl~C E~HRAT 10~ CCEFFICIt:NT TRANSFE:) JNITS
l \i XIN ICOUT K A H
10··2 ~ N l DL
lBS/HR-FT··Z liM-~OL/L. 0)( OXP t-tR**(-l' FT
1 23tH3. 6610 105426 Cl05798 10-109 a~~19 760,9 O;JS02
2 238130 1001. 10 8288 00 6956 10092 Oct 9b1 b18~1 0.,563
3 23S11. IbOb. 103143 00 5393 00994 O~S91 528:.8 O·) 722
" 23813. 20480 105195 QIJ 5081 10245 12094 5993 0 O.,6~1
5 23813. 22;:6 0 104922 0.4574 10~49 10 11~ 67.7:.6 ~2 608
6 23813. 2873. 200000 0. 5773 1.429 10243 583:.5 Oo~54
7 ~O856. 684. 105140 0.5500 10 169 1,,051 71036 ()0470
8 20856. 12050 200943 0" 83e7 10020 00915 521.:,5 0.(;41
9 4:C656o 18~lo 2~1406 007761 lo13b l:a014 L92)o Oot-79
10 20856. 24290 200505 00631.i3 10340 1., 180 511.,2. 00654
11 20856~ 2865. 105914 O05tJ70 10290 1.,144 451 J4 O~ 741 l>-I
1\)
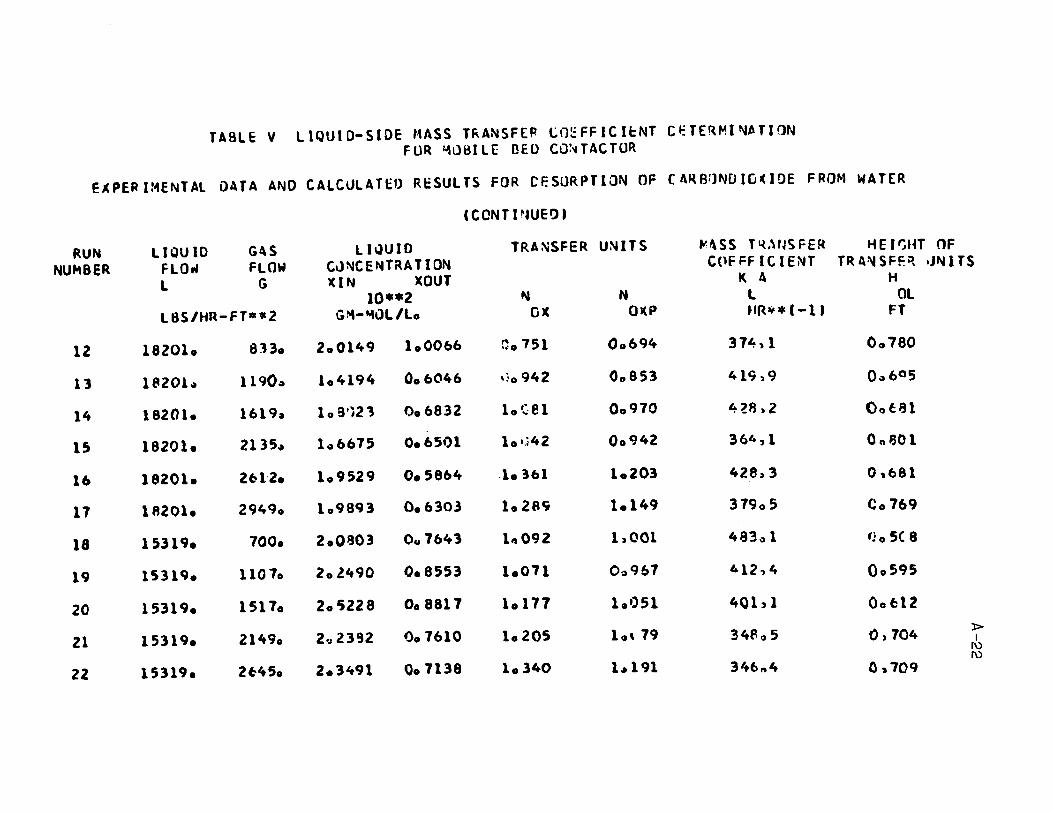
TABLE V LIQUtO-SIOE HASS T~ANSF[P ~OEFFIC(~NT CETERM(~~TION FUR ~üBILE OEO CO~TACTOR
E~PERIMENTAl DATA AND CALCULAT~O R~SULTS FOR CESORPTION OF (h~B~NDIO(IDE FROM WATER
'CONTPWEfJI
RUN LIQUIO G4S lllJUIO TRA~SFER UNITS ~·\SS TI{,\fJSFER I-fE I~UT OF NU .. 8ER fla'"' FLOW C\.lNC ENTRA TIaN C(lFFFtCIENT T R A ~ S F F. ~ .J ~ 1 T S
l G )(IN XOUT K 1\ H 10·*2 N N l Ol
l8S/HR-FT*-2 GM-"IOl/lo 0)( OJ(P UR""*'-11 FT
12 18201. 8330 200149 1.0066 ~. 751 00694 314., 1 00780
13 111201 0a 1190" 1.4194 006046 lio 942 00853 419 ~9 0,,6°5
14 18201. 1619a 10 9'}21 0.6832 10 cel 00910 4?B,2 Oo~81
lS 18201. 2135 .. 1.,6615 0.6501 10·.i42 00942 364,1 o ft 130 1
16 18201. 261'2. 109529 0.5864 .1.361 1.203 428~3 0,681
11 18201. 29490 109893 0.630.3 10 zac; 1.149 31905 C.769
18 15319. 100. 2.01303 Ou 1643 1" 092 1,001 483,,1 '1. SC 8
19 15319. 1101. 201490 0.8553 1.011 013961 412.,4 0.595
20 15319. 1511. 20 -;Z28 0.8817 1.177 1.')51 401,1 Oat:12
21 153190 21490 2.., 2392 00 7610 1.205 1." 79 34~o 5 0,704 l> 1
1\)
15319. 2t-450 2.3491 007138 10340 1 .. 191 1\)
22 346,,4 0,109
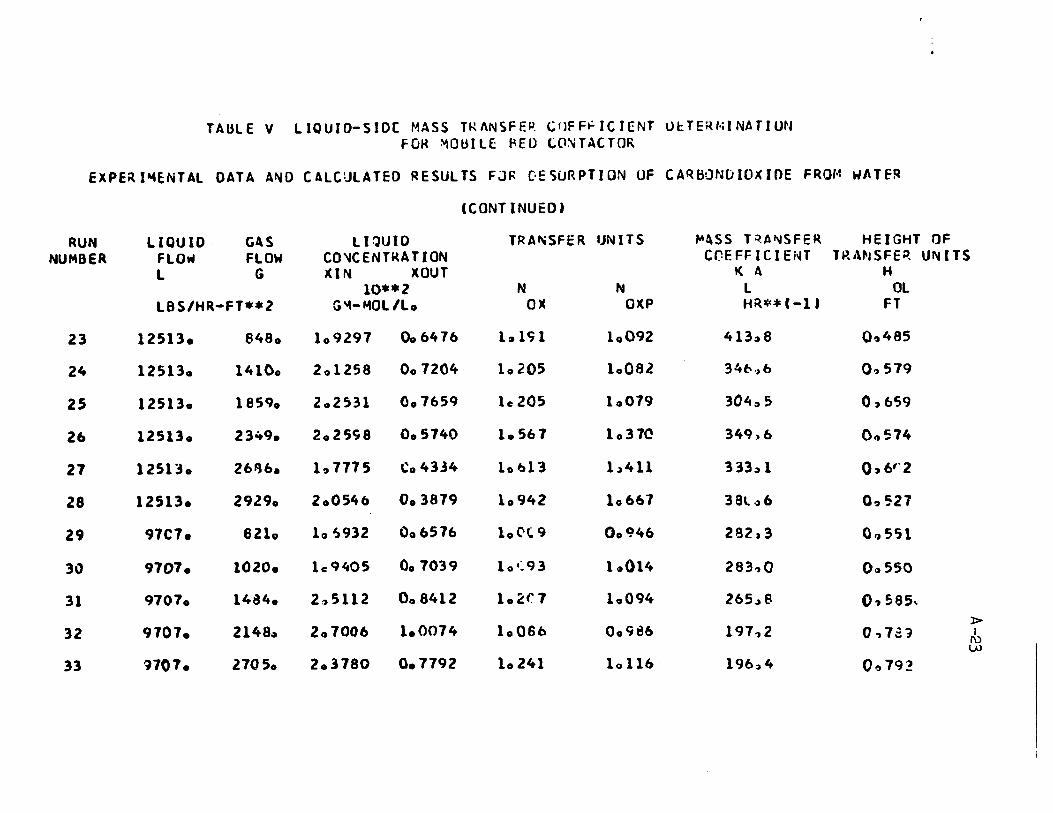
TAULE V lIQUIO-SIO[ t~ASS T~"NSfEP. Cf)Ff~ICIENT Ul:TEiHilNATIUN fOK ~OUllE ~EO ~Q~TACTOR
EXPE~I~~NTAl DATA A~O CAlCUlATED RESUlTS FJR DESURPTION OF CA~BaNOIO~IOE FRa~ ~ATf~
CCONTINUEO.
RUN llQUID GAS ll~UID TRA"iSFER IJNITS "'~SS T~A~SFER HEIGHT OF NUMSER FlO" FLOW CO~CENTKAT ION CGE FF 1 CIE iH TRM~SFE~ UNITS
l G "IN )COUT K A H 10··2 N N l Ol
lSS/HR-FT •• 2 C;""-,,",Ol/lo OX D)(P HR**(-I' FT
23 12513. 8480 10 9291 00 6476 la1-;1 10 092 413:a8 0",485
24 125130 14100 2 0 1258 001204 10205 looal 34t-.,b 0.,519
2S 125130 18590 202~31 001659 le205 10079 304;, 5 0,659
26 12513. 2349. 2025Ci8 005140 1.561 10310 349)6 0.,514
27 125130 26e:j6. 1:. 7775 Co 43.34 10 ~13 1,,411 333,) 1 0,6(' 2
28 12513. 29l9. 200546 0.3879 10942 10667 38l-l6 0",521
29 97C7. 821. 10 S932 006576 10('(.9 00946 282,3 0,,551
30 9107. 1020. le 9405 00 7039 10(93 10014 283.,0 0.,550
31 9107. 1484. 2,5112 008412 102( 7 10094 265,,8 0, S85.
32 9707. 2148~ 2 0 1006 1.0074 10066 009136 l>
191.,2 0, 1a~ 1 1\) VJ
33 9707. 27050 203780 0.7792 10241 10116 19b~4 0.,192

TA~LE V LIQUID-SIDE fo'ASS T~ANSFI:R COr:FFICIE~T l)ETER~'INATION FOR ~OBILE 8~D CO~TACTOR
E~P[~IMENTAl DATA AND CALCULATED RESULTS FJR OESORPTIilN OF CA~BO~DIOXIDE FR~~ WATfR
'CONT J 'JUEO.
RU~ LIQUID GAS LIQUIO TiUNSfER UNITS MASS l~A~SFEP HEIGHT OF NUM8ER FLOW FLOW C')~CE~TRAT IO~ CC'EFt-ICIENT T~ANSFER ..,t-.ITS
L G XIN XOUT K A H 10**2 N N l OL
lBS/HR-FT**2 GM-MOl/L. OX OXP H~**C-1' FT
34 6977~ 8010 2 .. 2713 1.(\25~ 0.,840 0:»795 176 ~O O:»f2B
35 6977. 14100 2 ~ 8 512 0.8511 1" 328 102':"'9 221) ,,4 0., 507
36 6911. 19620 2" 5d2 3 0 0 7974 1,306 13175 HU:> 3 0.,f,17
37 6917. 2216. 10 7535 0.6369 1.113 10013 14~" 1 00178
38 6977. 2368. 107~16 0.5873 10238 1,115 153.4 0.129
39 6977. 2684. 2,0207. 0.5616 1.444 102 gO 165;)0 O~~77
4r. 6971. 3010. 109388 0.2622 203C;9 20001 254~O 001,40
41 ~q43. 214~. 2,,7155 0.8660 l~ 264 1~143 9(,: 3 Ch 656
42 3943. 2450 •• 3 0 0017 0.5277 2.028 1 0 738 141.,5 0.447 l> 1
1\) -1=

APPENO IX Il
COMPUTER PROGRAMS
Il.1 Smoothening of the Experimental Pulse Testing
Il.2 Flow Oiagram and Calculation of liquid Mixing Results
Il.3 Calculation of Interfacial Areas of Mass Transfer
Il.4 Calculation of Physical Mass Transfer Coefficients
A-25
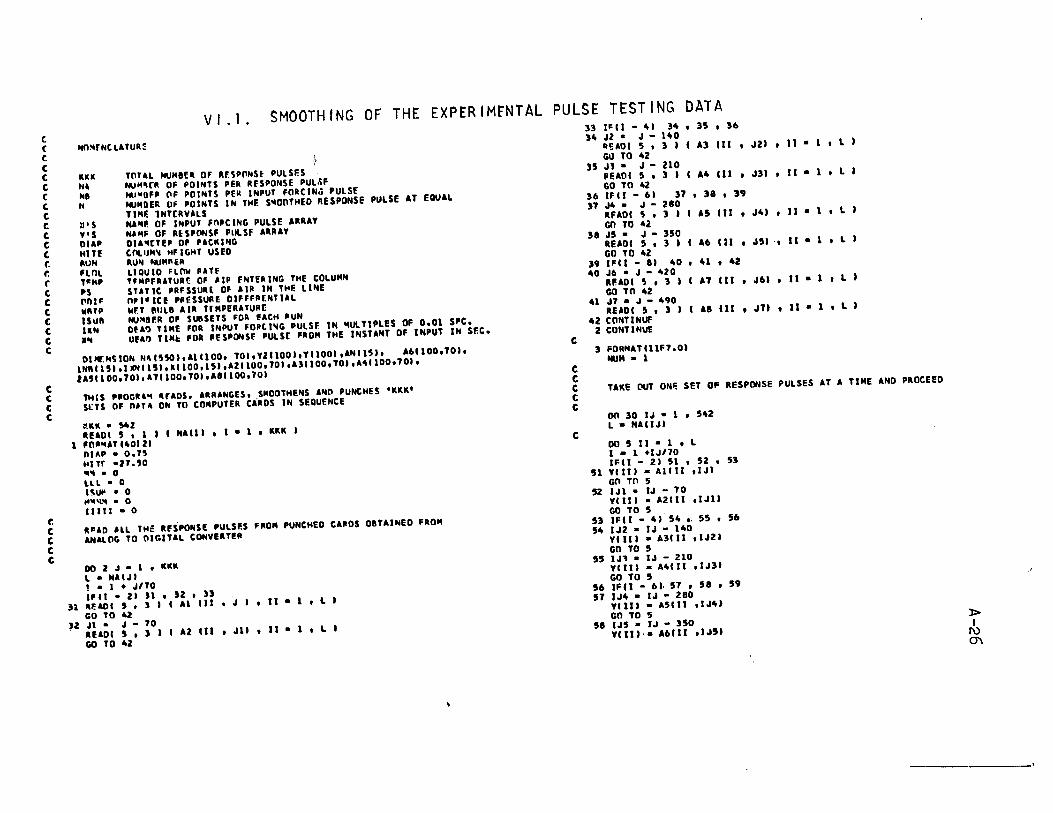
VI.1. SMOOTHING OF THE EXPERIMFNTAL PULSE TESTING DATA
c. c c. c c c C c c C (.
C (. r. r. (
c c (.
C C C C
c c c c
NO)lrHCLATUR~
III TOTlL HUM8ER OF Rf.SPOHSf PULSF.S N' HUNUR OF pOllns PER RfSPONSE PUL·,ÇF HII ""~OFP [IF POINTS PER INPUT FORC IN,i' PULSE fi HUMGER Of POINTS IN THF. S~OOTHED nESPONSE PULSE AT EOUAL
T IMF. lNT[RVALS ~'S NA~F. OF INPUT fnpCING PULSE 'RR'Y Y' 5 NU'F OF IIlSPC1NSF PULSf 'RUY OIAP OIA~CTEP OP PACllNG ~TE C~~~ ~I~T USW ROH RUN HUMA ER 'LOL LIQUIO FLOW PlTf TC .. , T'MPFRATUR( OF AI' fNTERING THE COLUMH '5 ST'TIC PAFSSURt Of AIR IN THF. LINE rnl~ n'I-ICE PPF.SSURE OIFFFA[NTIAL 1111" Il,.T lIlILIL AIR TrMPEAATUR[ ISuft NU~IIF.R 0' SUIISETS ~OR 'ACH 'UH laN otA~ TIME 'OR INPUT FOPtlNG PULSF IN ~UlTIPLES OF 0.01 SFC.
l~ UfA~ TINk FOR PESPONS~ PULSE FAOM THE INST'NT OF INPUT IN SF.C.
01 Jt:HS ID" N" ,,~,. AI Cl 00, 101, YZ 1100 I,YIlOOI ,'NIl'5I, '61100,101,
lNftll~I.I~'I",aII00.1~I,A21100,70I,A31100,101,A"'100,101,
"'1100,70I,Al1100,101,'81100,701
TH'S 'POGR'~ !trAOS. ARRAHGES. SMOOTHENS ANO PUNCHES 'KKK' sns OF nn" OH TO COMPUTER CARDS IN SEQUENCE
:!.lK • ~l READI , , 1 • 1 NAIII , 1 • l , Kll 1
1 '0'"'' 1"01 li nlAP • 0.1~ HI Tf' .n.'o ,,~ • 0 LU • 0 I~UI' • 0 "'4'1.'4 • 0 11111 • 0
r. . C R.AO ILL THë RF.SPONSE PULSF.S FROM PUNCHED CARDS OIlT'INEO FROM
C ANALOG TO ~IGITAL CONVERTER C C
00 Z J • l • KKl L • NAlJI 1 • 1 + JI10 Ifll - li n , JZ , 3J
:n lU: AD 1 , • "AI 1 II , JI, II • l , L GO TO 4Z
U JI· J - 10 . READI',' a Al 1 Il , Jil , 11 • 1 , L
GO TO "2
c
:n 1"11 - '" ,,, , 3~ , 36 ,,, J2 • J - 140
IIEADI 5 , 3 1 Al III , J21 , II • , l
GIl TO "2 ]5 Jl • J - 210
IIElOI ~ , 3 1 A4 III , J3I , II • l , l GO TO "2
36 IFII - 61 37 , 3a , 39 37 J4 • J - 210
RUDI '5 , , a AS 1 Il , J4' , Il • l , l GO TO 42
'8 J~ • J - 3~0 RUDI ~ , 3 a A6 121 • J~a ., Il • l , L GO TO "2
39 IFII - 81 40 , "1 • "2 "0 J6 • J - "20
RF.ADI '5 , 3 a GO Tn 42
"1 Jl • J - "90 RUDI ~ , 3 a
42 CONTINUF 2 CONTlNU1:
, FORMATll1Fl.0' NUM • 1
Al III , J6' , II • 1 t L
A8 III • Jla • Il • l , L
c c C T'KE OUT ONF. SET OF RESPONSE PULSES AT , TIME AND PROCEED
C C
c DO 30 IJ • l , 542 L • NAIIJI
D05I1-1,L 1 - 1 +IJI10 IFII - 21 51 , 52 • 53
51 YIIII - A1III ,IJI GO Tn 5
~ IJI • IJ .. 10 YIIII • A2111 ,IJ1J GO TO 5
53 IFII - '" 54 ~ 55 , 56 ,,, IJ2 • IJ - 140
YIIII • A'III ,IJ21 GO TO 5
55 IJ1 • IJ - l10 YIll1 • A"III ,IJ3J GO TO 5
56 IFCl - 61. 57 , 58 , 59 57 IJ4 • IJ - 280
YIIII • A5111 ,IJ4' GO TO 5
58 IJ5 • IJ - 3'0 yell'·. A6111 ,IJ51
l>I
1\) 0'\
C
C C C C C C C
C C C
C
".0 TO S S~ IFII - 81 60 , 61 , 5 .0 IJh • IJ - ~20
'11111 • A1111 ,IJ61 cn TO ,
61 IH • IJ - ~'90 Til" • &1\111 ,IJ11
5 CONf III'"
N • L
If 'N'l'~'NT IS POSITIVE, REJF.CT THE SET POSITIVF 'ruN8ERS 'PPEAR WHEN A BU8BLF ENTERS THF. CO~UCTIVITy PROBE. THE CIRCUITS HAVE BEEN 50 OESIGNED THAT AlL nTHER VOLTAGES EITHER FROM THE CONDUCTIVITY tELL OR FRnN THE INPUT EVENT MARKER ARE ~EGATIVE.
00 300 1 • 1. N IFIYCII - 200.1 300, SOI, SOI
JOU COMT 1 N~ C'l TO 1000
SOI IIRITru"" "M,," • .. .. N.. • 1
4 FORMATC'POSITIYE MUM8ER SET REJECTED"
'I~ THE POINT OF INJECTION
1000 00 302 1 • l , 15 IFIYIII • 200.' 301, 301, 302
)02 COHT INUF )01 Ifll - 1. )04, 304, 303 301 NI • 1 - 1
•• YlNIl KI • NI • 1 00 )05 1 • KI, N lt4 • 1 - NI YI K41 • Y Il 1 - A
)05 YlIK~1 • YIK41 N • N - NI L • N GO Tn 110
)04 •• YI III (1() US 1 • l, N YlII • '1111 - A
)25 '12111 • Y"I 310 ANAX • O.
IFCYI41 • 125.1 l~3 , 313 , 314 )1) IFIYI51 .100.1 109 , 109 , 110 109 YI 51 • Ylhl llO YI ~I • 'lUI l'" C • '11 .. 1
DO 34' 1 • l , 3 '44 'III' • 'III' - C
C C
C C C
c
C
.,
FIND Tt« l'AXIMUH RESPONSE VALUE, OTHER THAN THF. SIGNAL INPUT FROM CELL
00 301 1 • 4 , N '1111 • Y Il 1 - C IFIYIII - '111.1,. 306, 306, 301
106 IFIYIII - ANAXI 308, 308, 301 308 AMAX • YIt 1
M. 1 301 CONTINUE
SHOOTHEN THE CURVE BY EXTRAPOLATION, IF NECESSARY
K2·foI-1 UO • N - 1 K30 • fol • 1 K40 • N - 3 00 392 ~ • K30 , K40 IFIYCJI - YIJ • II' 392 ,
120 IFCYCJI - YIJ • 21' 392 • 121 IFIYIJI - YCJ • 3., 392 122 YIJI • 1 YI J - 1 1 • Y 392 CONTINUE
DO 309 J .... K2 AK • 1. IP • 0 E. 1 •• YlJI IFIYIJ.'390 • 391 , 391
392 , 720 392 , 721 392 , 722 J • 1 U/2.
391 IFIYIJ • 11 • E' 380 • 380 • 381 390 IFCYCJ .1. - E' 380. 380, 381 380 IFCYCJ • 11 - YCJ • 2 •• 399 • 381 , 381 399 YCJ • 1 •• YCJ.
GO TO 309 381 IFCYCJ' - YCJ • II' 319, 319, 309 319 IFCJ - 4. 321 , 327. 311 Jll IFCJ.F.O.K21 GO TO 22
IFCYIJ. - YCJ • 2" 330 , 334 , 334 J3 .. IFCY2CJI - YCJ • III 39J • 309 , 309 J93 YCJ • 1 •• e YCJI • 'le J • 2 "/2.
• GO TO 309 310 YIJ • l' • yeJ' • yeJ' - YCJ - 1. 395 IFIYIJ • 11 - YIJ • 2" 391 , 309 , 309 397 AK • AK.Z.
IP • 1 P • 1 Y'J • 1 1 • YCJI • C yeJ' - YIJ - 1 .I/AK IFCIP.GY.IO. GO TO 309 GO Tn 395
J21 KS • J • 1 YCKSI • YlJI GO TO 309
22 IFCYCK21 - YC J - 1 Il J09. 309 , 23 23 YIK2 •• YCJ l' - 1.
309 CONTINUE l> 1
1\) --:J
C
e
00 Il' J • M • X10 Ait • 1.
l' - 0 IFIYIJI - YIJ • 111 313. 312. 312
'12 I=IYIJI - YIJ • 21' 335 • 335 • 321 335 YIJ • 11 • IVIJ' • VIJ • 2"/2.
GO TO 31) U' l''VII J, - VU • 11' "365 • 365 • 366 J66 VIJ • 11 - VIJ' • YIJI - VIJ - l' J96 IFIVIJ • 1 , - VI J • 2 Il 31' • 313 • 394 J9. Ait • AIt+2.
.,·1'+1 VIJ • 1 , • VIJ' • IVIJ' - VIJ - 1 'I/Ax .'II,.GT.IOI GO Ta J1l GO TO 396
J.5 IFlve J • 11 - V2IN', J13 • 313 • 388 JU eONT1N~
GO TO 198 , •• N • J • 1
UO • N - 1 J.' on l75 J • 5 • x2
lFlveJI - YIJ • 1" '71 , 375 , 315 J71 YIJI - IVIJ - 11 • VIJ • 111/2. "5 (,ONTI~UE
00 JJI J -x30, xlO I.IVIJ' - VIJ • 1" 3J8 • 318 • Jll
III YIJI - IVIJ - l' • veJ • 1'1". J" CONT INUE
DO lOT J - 3 , " IFIVeJ" TOJ , 707 , 101
70. VI JI • O. 101 eONTlNtJ:
C C TF.RMINATE THE DATA WH!~ THE END VALUE IS LESS THAN THE 0.1. e OF THF "AXIMUM 'UlSE HEIGHT C
IN'" - " IFeN.rO.MI GO TO 66 GO Tn 61
66 W_ITEI 6 , 6. 1 IJ •• fORMATIIH • ," 50X, • HERE" EQUAlS N, CHECK'
11111 • 11111 • 1 '" Il - VI ""SN
X9 • " • 1 00 31. 1 -K9 • N U-I-"
'1. yell - yetI -AI·8 00 Jl5 t • ". N l'Ivell - O.OOl.A"AX' 315, 316, 316
Jl5 CONTINUE IfIVII" '29 • '16 , 319
)2. 1 • 1 • 1
C
116 YI Il • o. Il-t Y"AK • O. DO 355 1 • l , 3 1~IYel 1 - Y~AX' 356 , 355 , 355
3Sc» Y"AX • YIII K1.O - 1
355 CCIf.TlHUf VIlI - O. IFIYMAX. 13500.'376, 316 • 377
371 Y~AX - -13500. 376 ~~ - YI1"IYMAX+IO.' • 0.05 • 0.03
IFeK2n.~o.11 GO TO 1 GrI TO 62
8 XH - KN • 0.015 62 Kl • Il - 2
DO 32b 1 • 1 • K7 Itb - 1 • 2 YIII - YIK61
326 cn~TlNUE N - N - 2 DO 343 t - l , " IFI Y111+ 10.1 343, 343, 341
341 YI 11 • O. 343 CO~T ItIUE
D'l 317 1 - l, N 317 YIJI • ABSIYIJ','10.
M~' • MI' + 1 tFIMM - tSUOI 13 , 13 , 6
6 MM • 1 IFINU".EQ.11 GO TO 27 GCI TO 28
27 R~.OI 5 , 29 , hlTE
C REAO fACH SET OF PUNtHFO DATA FOR tNPUT PULSES AT A TIM~ C
28 R~AOI 5,7 'RUN,FL~L,Te"p,PS,ODIF.WBTP,ISU8.NUM 29 FIlP')lATlF5.ZI " 7 FOP.MA~IA3.F4.3.F3.1.F3.0,F6.4.F3.1,12,l1l
~EAnl 5 • 9 1 IANeJI • J • l , ISUB 1 9 FOP.MATC15A11
IIEAoe 5 • 10 INBeJl, IXIIIIJI , J - l , ISUB 10 FOctHAT e40121
00 12 JJ • l , ISUB LL - NRIJJ' READI 5 , 11 , Ixel • JJI , 1 - l , II ,
11 FnR'!ATe25F3.11 12 CONTlNuF
C " C NP. ITF AND P,'NCH AlL THE DATA AND EXPER IHENTAl CONDIT IONS IN r. SEOUENCE C
(3 WAITEe6,25' IJ NIIClJI • N
» 1
1\)
<X>

c c
LL • "fil .. 141 WIlITE 1 ft , 14
14 FOP~ATI ~Ox. 1. 41X. ' ORIGINAL PUNCHED PULSE './' "'JTEI 6 • 15 1 InCl' , 1 • l , l ,
15 FOR~ATllH , 20X, llFl,O, 1 , NAITFI 6 , 16 , l
16 FO~ATll00X, 110, " 40X, 'S~OOTHEO PULSE AT OUTlET OF COlUNN" NAITEI 6 , 11 1 IYIII , 1 • l , N
11 FaR~ATI/,lH·, 20X , llFl.21 WAITFI ~ , l~ , N .1 F~~~ATI100X, 110, Il, 52X, 'IrelET PUlSE',/' WRITr-1 ft , 19 1 IXII ,MMI • 1 • l , lL 1
19 Fn~NATllH , 36X , 4Fl0.l 1 WAITEI 6 , 20 1 lL
20 FOAMATll00X,110, Il,45X,'r:XPEAINENTAl CONDITIONS'/' WIIITEI 6 , 24 IPUN,ANI~M"FlCl,TE"P,P~,ODIF,WBTP,ISUB,OIAP,HITE,N, lIXNIMM',Ll,N~,IJ,XN
24 FO~~ATI1H ,15X,A3,Al,F8.3, F8.1, F8.1, F10.4,F8.1, 13,2F7.2, 1514,Fl0.71
25 FOAMATC1Hl,II,IOX,'PAGF MUMBF.R .a, 131 21 WIlITFI 1 , 26 , MUN, ANIM~I,FlOl, TFMP, PSI ODIF,WBrp, DIAP, HI TE,
lH,IXHIMMI,LL. HUM,IJ,XH, IYIII , 1 • l , N '.IXII,"MI,I • 1 • LLI 16 FO~"ATIA3,Al.F7.3,F5.1,F5.0,Fl0.4,F6.1,F5.2,F6.2.413,14,F9.1,1
11 12F6.211 30 CONTINUE
NAITEI6 , 65 1 MMM" ~ITfl 6 , 031 1 NAIII 1. l , 542 VRITEll , 641 INAII', • l , KKK.'
63 FOR~ATI 30X, 1011' ... FO'"AT14012' .5 FOR~ATllHl,III.50X, 'HUMBER OF SETS WITH POSITfVE NUMBERS • " 12'
STOP !ND
'0-"" .. ",
l> 1
1\)
\.D
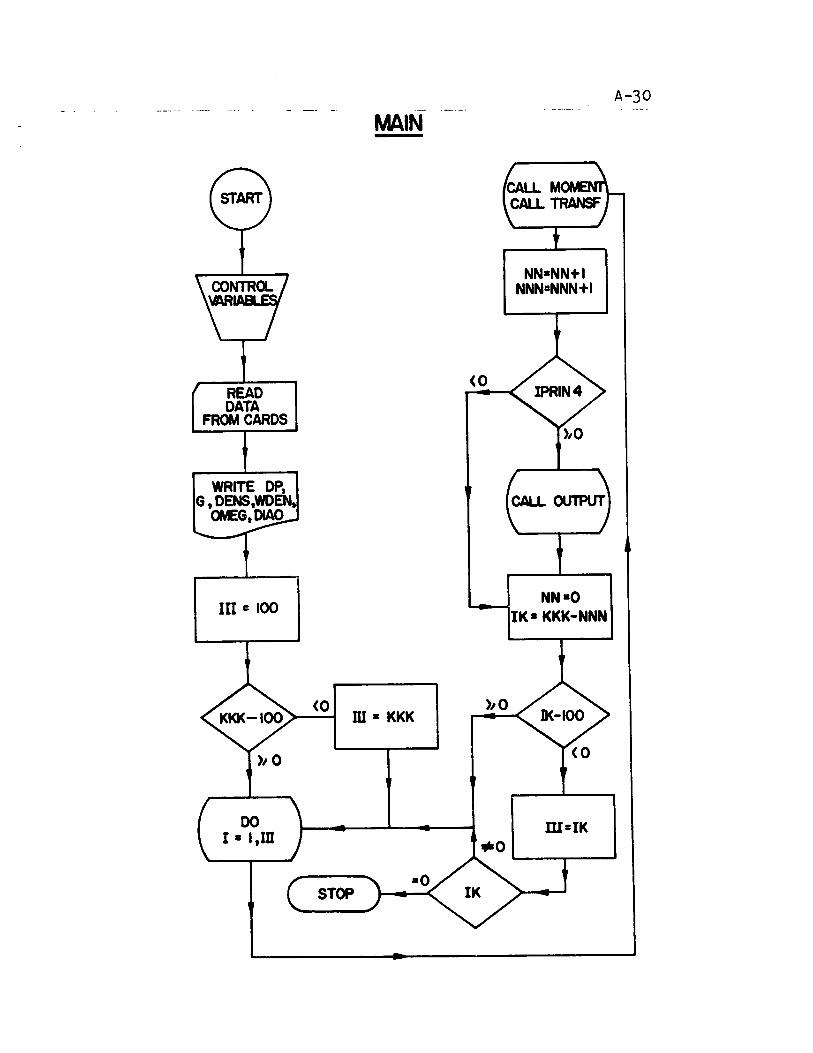
READ DATA
FROM CARDS
WRITE DP, G , DENS.WDEN.
OftEG,OIAO
III = 100
00 I· I.m
(0
STOP
---
MAIN
(0
m· KKK
9k0
NN-NN+I NNNIINNN+I
NN-O IK- KKK-NNN
m=IK
A-30
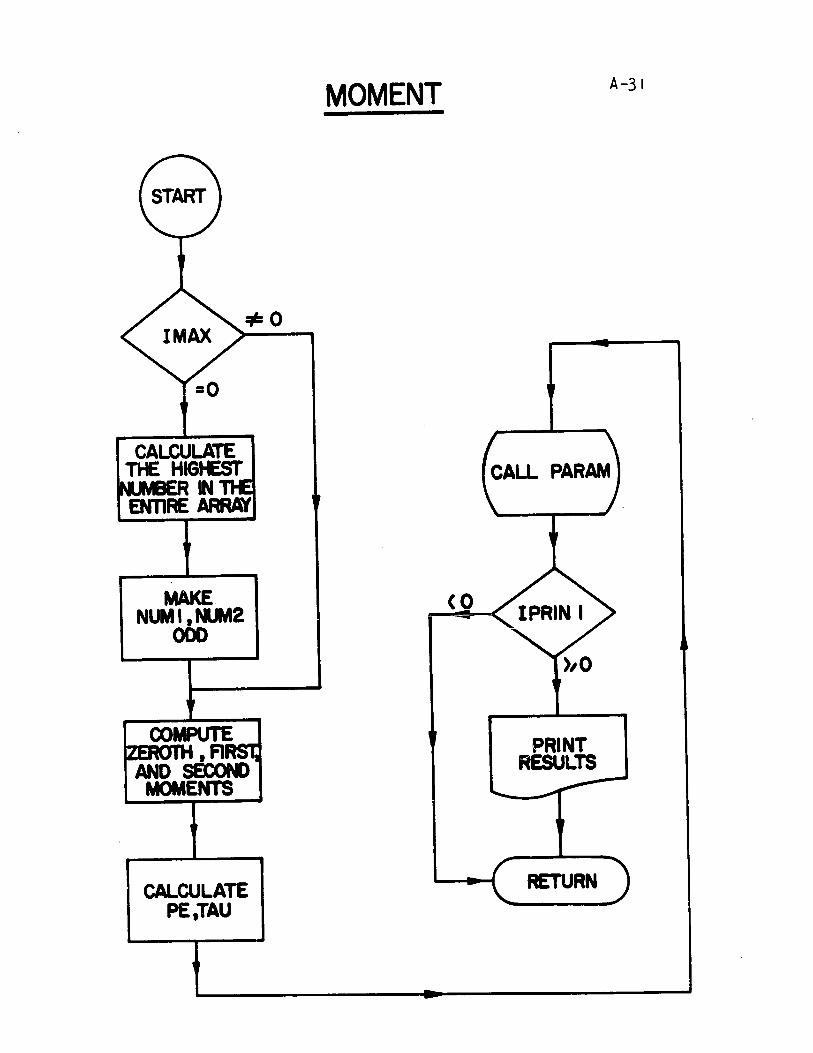
=0
CALCULATE THE HlGtEST _ ... ~ IN
:pO
ENTIRE ARRJt(
MAKE. NUM l , NLtt12
ODD
COMPUTE ,FI
AND SECQN) MOMENTS
CALCULATE PE,TAU
MOMENT
(0
PRINT RESULTS
RETURN
A-31
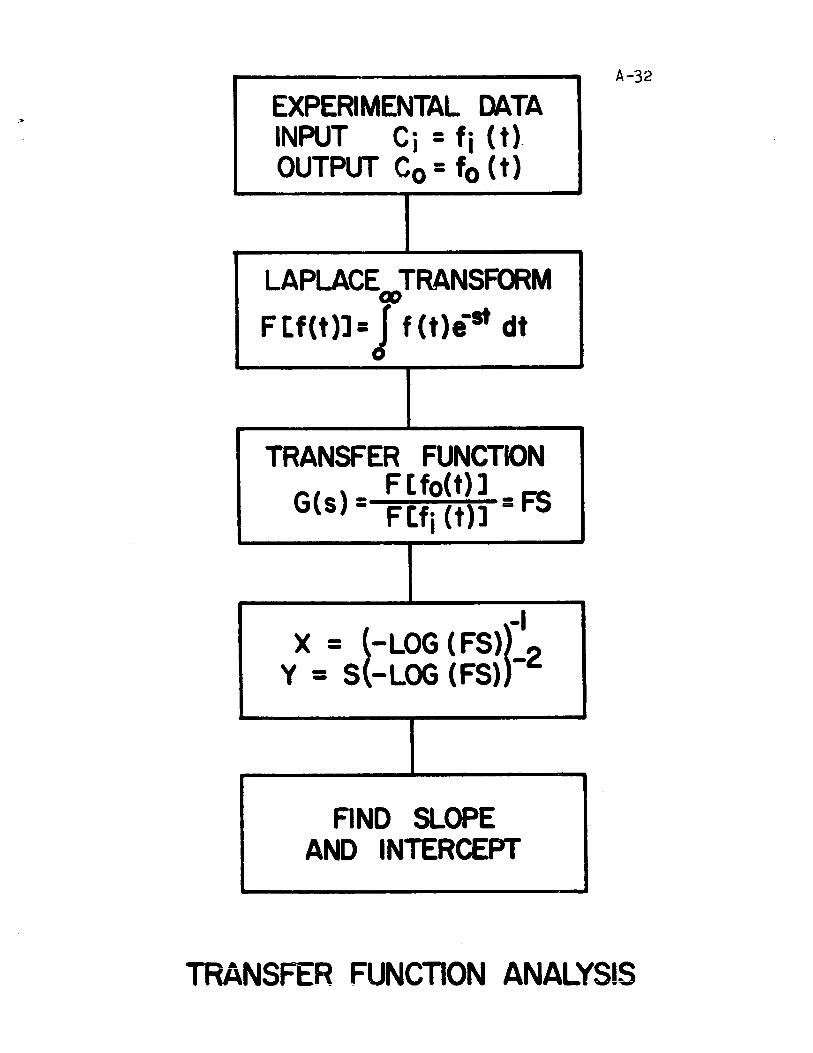
EXPERIMENTAL DATA INPUT C j = fi (t >OUTPUT Co = fo (t)
LAPLACEœTRANSFORM
FU(t)]= l f(t)e-st dt
TRANSFER FUNCTION F [fo(t)]
G(s) = Ftfj (t)] = FS
-1 X = (-LOG (FS)t2 y = S(-LOG (FS»)
FIND SLOPE AND INTERCEPT
A-32
TRANSFC:R FUNCTION ANALYSIS

CALL AREA
Al. - 10' KCOUNT-O
RETURN
TRANSF
ARTSFN-RTS
(0
DO J cl,IO
CAlCULATE TRANSFER FUNCTION OEFINEX'1
WRfTE RESULTS
pO
A-33
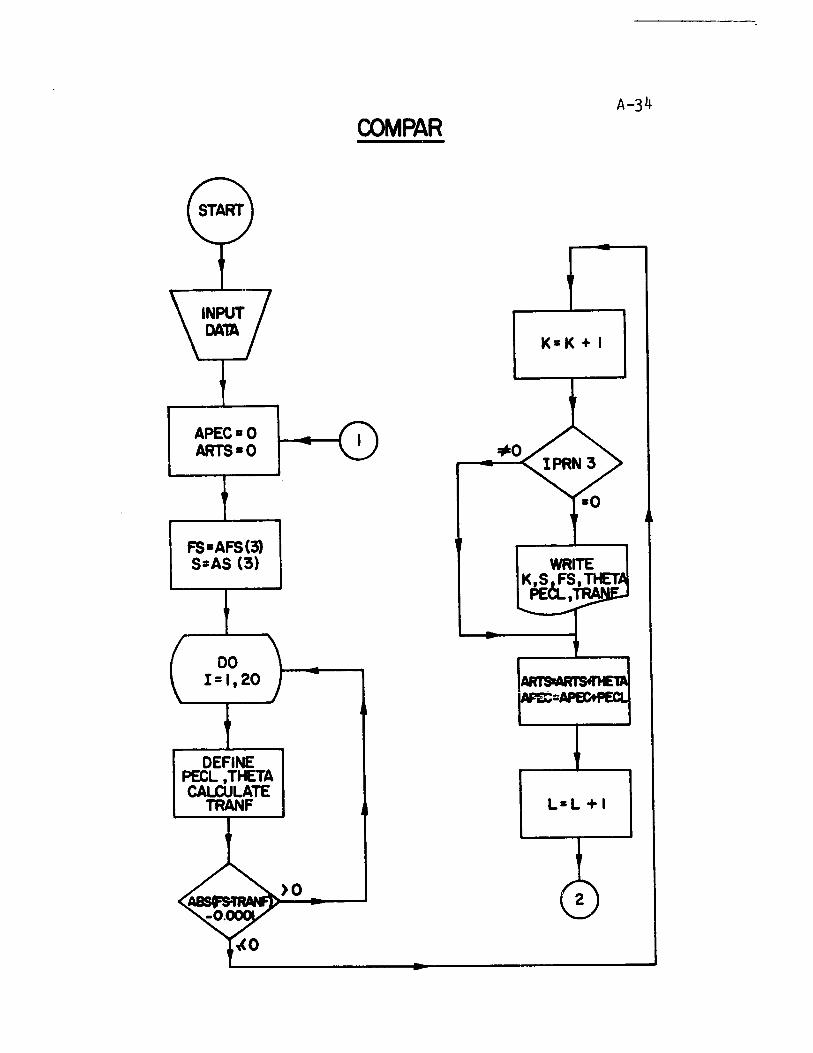
APEC-O ARTS-O
FS-AFS(3) S=AS (3)
DO l = 1,20
DEFI NE 'A PECL ,THEl", CALCULATE
TRANF
A-34 COMPAR
K=K + 1
)0
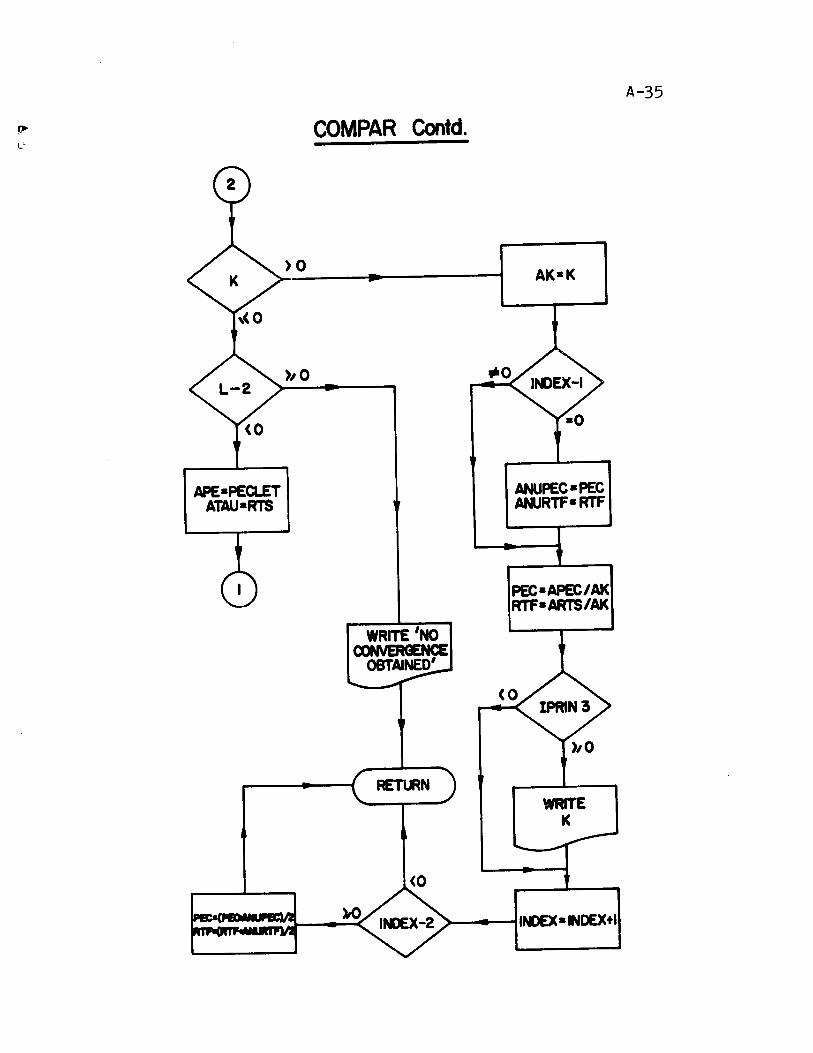
APE-PEa.ET ATAU-R1S
)0
COMPAR Contd.
WRITE 'NO OONVERENCE
OBTAiNED'
~N
(0
.. 0
ANUPEC-PEC ANJRTF-RTF
PEC-APEC/AK RTF-ARTS/AK
(0
WRITE K
A-35
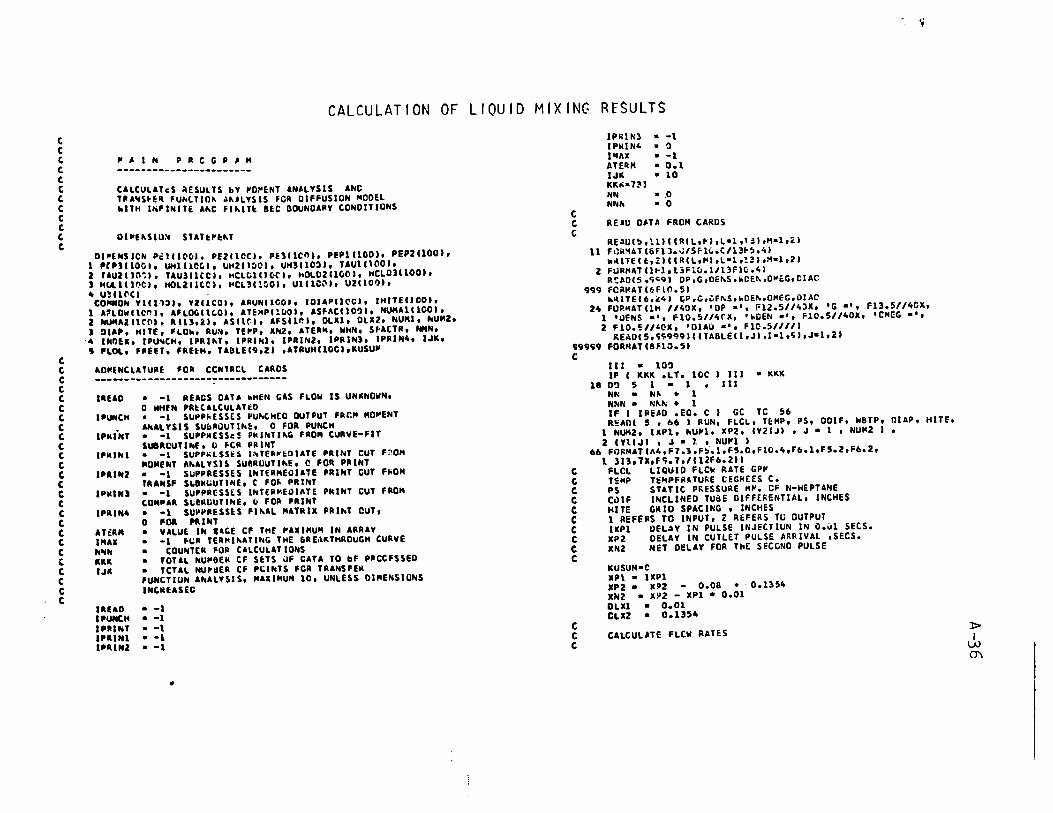
C C (
C C C C C C C C C
C C C C C C C C C C C C C t C (
C ( ( (
C , C C (
C
~
CALCULATION OF LIOUID MIXING RESULTS
,. AIN P Il CG" _ l'
CALCULATeS ~ESULTS bY ~D~ENT ANALYSIS ANC TIIA~S~EII FU,.'11011 ~II'lYSIS FeR DIFFUSION MOOEl ~11H l~fINITE AIIC FIIIITk SEC OOUNDAIIY CONDITIONS
OI~fllS1U~ SlA1t~tllT
OI~lNSICN Pèlll~~I. PE21ICCI. PE1IIC~I. PEPIIIOO), PEP,CIOO). 1 PCP'C10CI. UH1IlCCI, UHZll001. UH1IIOl,. TAU1(100). 2 'AU211~~I. 1AU)11CCI, HClC1I,~rl, hOL0211001. HCL0311001. ) HUL111~CI, HOl211CCI. HCL31!~OI. U1I1C~I. U2110~I, ~ U!Il(l(J
CO .... ON Ylll-'l" YlIlCOI, AIIUNI100l, 101API1('CI, IHITEIJOOI, 1 A1LOWI\COI, AFLOGlttOI. ATE~PI1~OI, ASFIICI100I. NUMA111COI, 2 ~AallrO), R113.al, ASI\r.I. AFSII"', DLXl. OLX2, NU"I, NU"Z, , OIA', H1TE, FLD~, RU~, TE~P, XN2. ATERM. WHN, S~ACTII. MNN,
-4 IHQEX, IPU~CH, IPRllll, IPIIIN1, IPR1NZ, IPRIN3, IPRIN~, IJK, • 'LOL. FilEE', FREtH, TAOlEI9.Z) ,ATRUHI10CI,ItUSU"
II0"lNCLATURE FOR CCNTRCL CARDS
IIIEAO
l ",..CH
"MI"NT
l'MINI
l'RlIt'
l''MIN)
"R1N~
AHR" I"AX HIiI" KU IJII
.IIUD lPUNtH l'IIINT lPIIINI l'RIN2
• -1 REACS OAT_ ~HfM CAS FLOW IS UNItNOWN, ° WH!N PR~'ALCULATtO -1 S~~PkESS(S PUh(HED OUTPUT F~C" "O~ENT
ANIILYSIS SUbIlOUTlh~, ° FOR PUMCH • -1 SU'PMESSeS PMINTI~G FIIO" (URVE-FIT SuellOU11Nf, 0 fCII PRINT
-1 SUPP~LSSES I~TE~~~OIATE PRINT eUT F~O~ "OMeNT AhALYSIS SU8110UTlhE, Q FOR PRINT • -1 SUPPRESSES INTER"E~IATE PRINT CUT FkO" '''''NSF S"SMUUTlNE. C FOr. PRINT
-1 SU,PRESSES IMT[R~EUIIITE PRINT CUT FRD" (0""" s"eRUUTINE. ~ FOII PIIINl
-1 SUP~AESS~S FlhAl "ATRIX PRlhT CUT, ° 1'011 PRINT VALut IN '.GE CF THE ~AXIMU" IN ARRAY -1 Ho:1I TER~lhATING THE &RE,lKTHROuGH CUII.VE
COUNT[R FOR CALCULATIONS TOTAL NU~8EM CF S~TS ~F CATA TO bF PPCCFSSED
• TCTAL NU~~EII CF peiNTS FOR TRANS FER fUNCTIUN ANAlYSIS, "AxIMUM 10, UNlESS DI"ENSIONS IN(MUSEC
- -1 • -1 • -1 - -1 • -1
•
C C C
IPliI/l:3 • -1 IPIIIN4 • 0 11411X • -1 ATEII" • 0.1 IJIt • 10 KK"·7~] NN • _0 NN,. • 0
REAU DATA FRO" CARDS
REAUI5,111111lIl.~I,L·l,l~I,H·l.~1 II FaR~ATI6Fl).~/5Fl,.C/13~~.~1
~~ITflt,ZlllRIL,~',L·l.!3"M·l,21 2 F~R"ATIl~l,I~F.O.1/13F10.41
IItAOIS,9~91 OP,G,OE~S.hCE~,O~ëG,CIAC
999 FC~MAT'~FlO.51 ~~ITEI6,t41 CP.G.~F~S.~OE~.O~EG.OIAe
Z4 FOP.~ATI1H 1140X, ·OP .', F12.511~~X, 'G .', F13.S114CX. 1 'UfMS .', F10.~II~rx, 'hOEN .', flO.511~OX, 'CM~G .', Z FIO.~II~OX, 'DIAO .', F10.SIIII'
READI5,Ç~999111TA6LEII,J,,1·1,ÇI.J·l,ZI 99999 FORMATI8F10.51 C
III • 100 IF 1 KKIt .LT. 10C 1 III • KKIt
lIID!) 51 1 III NN NI<. 1 HIII/I:. ~IIP.:. 1 IF 1 IPEAD .EQ. C 1 GC TC ~6 R~ADI 5 , b6 1 RUN. FLCL, T~HP. PS, ODIF, W6TP, DIAP, HITf,
1 N~Z, IXP1, hU~l, XP2, IY21JI , J • l , NUMZ 1 • 2 CY\IJI , J - 1 • NU~l 1
66 FORMAT , ... 4. F7.3. f!>-.l. fS.O. FlO.4, r6.1, F S. 2 ,F6. Z, 1 lI3,7X.fÇ.7./112F6.211
C FLCL LIQUID FLCk RATE GP~ C TSMP T~~PFAATU~E tEGREES C. ( PS STATIC PRESSURE M~. CF N-HEPTANE C C~IF INCLINED TUQE DIFfERENTIAL, INCHES C HITE GR 10 SPACING , INCH ES C 1 REFERS TO INPUT, 2 R~FERS TC OUTPUT C IXPl UfLAY IN PULSE INJfCTIUN IN O.~1 SECS. C XPZ DELAY IN CUTLET PULSE ARRIVAL ,SECS. ( XNZ NET DELAY fOR ThE SECCNO PULSE C
c
KUSUH-C XP\ • IXPl XPz. X!'2 0.08. O. nSft XNZ - x~2 - XPl • 0.01 OUI 0.01 CLX2 • 0.1354
C CALCUL'TE FLCW RAT~S C
l> 1
LV ()\
C C C
C
CALL FLcr. 1 TE~P, ~S, OClf, W~~, OP, G, OE~S, WOEN, 1 O~tC, OIAO. "~~", MeTP •
FLOw • fLOL • e.!'~ • bD. • 1~4./1122 •• 2.7~.·21/7.1 ~IN • WH~ • 1~4. 1 Il 22. • Z.75 •• Z • 1 7 •• CO Ta 76
'6 R['DI 5, 1 1 RUN, fLCM, WhN, TEMP, NUNI, NUM2, DIAP, IHITf, XN2. OLXI. DLX2, PE, PEP, X18, X2~. 2XI.~, ,2e~. ~, U, TAU, hCLD, hOLP, 'IY1IJI. J • \ , hUMl 1 • IYZIJ" J • 1 • NU~Z 1
1 FO."'TIA~.Fa.I,F6.I,F4.1,212,F3.1,F5.2,F5.3. ax .14.2, 1.~.7,~7.,.' •• ',I.)Fa."F6.4,Fa.',2F9.a.~x,I,119F4.1"
7. IF 1 OLX2 .LT. G.l!6 1 GC Ta 9 DL_l, - 0.1"4
• AR"" 1 1 1 - IIUN A'LU~III - FLOM AFLOGII' - M~" ATE~'II' - TE~P IDIA'II' - DIAP 1 0.2499' IHIUIII - ,.nE 1 '.4999 NU"Allll - "U~l "U"AZIII - "UNZ
I:UCULATf TIIut BED HUGHT AND Tl"E OF FREE FALL
1.IIHI1EIII.EQ.ll CC TC 81188 C.F-l'70 •• IIDIA~I •• 1,".1 lO ••• I-o.OOOO~'.fLOMII CALL leCKIVF.LOCI TRuell-C. OC~U.llwHN-G'UIIG"F ,. IG"' •• 1.21 TKUf"-1RU[~.'.' .'.5 FREEH-~ITf-1RUEH 'RE~T.fRtlH/VELGC·11./12.1 'RU"-lIIUfH GO TO 66Ur.
..... FAF.fH-tITr 'REf T-e •
... 66 wRllElt,llllll GMf, ~Hh, FREEH, HITt, FREET, vELet 11\11 'O.~ATII~ , 7F10.21
C
C C C
AT,UIHIII-'_EEH
CALL ~C"ENTIPEllhHl, TaulINNI, PEPIINNI, UHIINNI, U1CNHI. 1 HULDIIN .. ,. HOLllhNI, 1"'.'
CALL T"ANSFIPEII"NI. TAUII .. NI. PE2INNI, TAU2CNNI. \ ~E'21"NI. UH21"NI, UZIN"', HaLDZINNI, HOLZINN'. 2 'ElIN"" TAU~INNI. PEPlIN"', UHlINNI. UlINNI, J HOLU!!NNI. HOlllNNII
ASFAC 1 Il - SFAUR , CONTlN~f
IF 1 IFItIN~ 7,... 1 CONTINUE
'1IINT StCT ION
""nEC 6 • r. 1
C
C
6 FOAMATCIHl",ZOX, ' CALCULAT~O ~(SULTS FOR MOMENT' l'ANALYSIS ARE GIVEN IN THf fCLLOhlNG TAeLE/S'll1 C~Ll ClTPUTIPël. PEPI, UJol, Ul, TAU1, HOLU1,
1 HOl l, 1111 "RtTtC Ca • 26 1
Z6 FORMATCIH Il,20X,' CAlCULATEO kESUlTS FeR TRANSFER l' &NAlYSIS. -- INFINITE BEO CCNOITIONS',/l5X, 2 'ARE GIVEI. IN THE FCLLCIiiIIlG TAi:lE/S',/l1
CAlL OlTPUTCPE2. PEPZ, Uh2. UZ. TAU2, HOl02, l HOU, Ill.
ICUSUM-l "RtTE( Ca • 36 1
'6 FORMATltH Il,20.,' tALCUlATEO RrS~lTS FGR TRANS FER l' ANALYSIS -- FI"ITf ~EC CC~OITICNS',/35., Z '~E GIVE~ IN TH~ FCLlOWI"G TABLE/S' ,fi'
CALl OlTPUTIPE3, PEP3, UH~, U3, TAU3, HOl03. l HOl3. 1111
7 NN-O IIC - .'IC - ~NN IF C IIC - 100 1 13 '.
U IF C IIC • Ee:. G 1 GO III - IIC
14 GO TO 18 15 STCP
END
14, 14 TO 1S
FUNCTlON'
FU"ICTION'
J> 1
UJ -..J

t C
C
SU~ROUTI~f TRA~~fIPE, TAU, PECL~T, RTS, PtCLfP, U~S, \ u\, ""LUS, HOL1S, 'Et, RTF, PtP, UH, U, HOLOF, 2 HOLlr 1
C DATA MIDuCTleN bY TRANSFER FUNtTIJN ANALYSIS t .
C
DI~_SIO~ 1I11J~I, YI10el, 1I1!lO~I, 1121'Jûl, IIVALSIIOI. \ YVALSllrl, ~TSI10I, IIFIIIEDI1I, YFlllfD111, COEFFSIZI, 2 AFSIIIOI, AFUl\el tOl'"OH YIC 1.)nl, Y2UOO l, ARUM l( Olt 10lAPlle.t'I, IHITE unOl,
1 AFI.OWlln~l, AFLCGll001, ATEMPI10~I, ASFACI10~I. NUMAlllODI.
2 NUMA:! IH·". 11.1 130 21. AS Il,)1. Af S Ile 1. DLIII. DLII2, NUMI. NUl!l.
, DI". HITE, FLC~, RU~. Tt"P. IIN2, AT~RM. WH~. SFACTR. hNN.
4 INU~ •• JPU~CH, IPRI~T. IPRlhl. IPRIN2. IPRIN'. IPRIN4. IJK.
S fLOL •• RF.fT,F_EEH
C D!fINE TIME ARRAYS F~R DCTH THE PULSES C
t
INDU - (1
luu-nUT DO IIZ 1 • 2 • NUIIl '""I-\
22 .'111 - KllK11 .OLII IIZ III - IN2 on 2 1 - 2 • NUI'2 ,n-I-l
2 IZIII - 1121~11 + 01.112
t CALCUL_TE AME_ U~eER THE BRkAKTHROU'H CURVE5
C
t C t
tALL A'E'IYl.NUM1.CLII1,AR1.~1 CALL ARf.IY2.NUM2,CLIZ,AP2,OI SFACT~ - AR2/ARl AL 10. "t..uNT • (.
I.l IF 1 I(COLNT S 44. ss. " '.4 If 1 INCf Il 2 1 6C1. 811. " Il CALL PAR.MIPEC.MTF.PEP.UH.U,CIAP.FREEH.HDLOF.HOL1F.
1 FUIMI P"CLET "ECLE • 'ECLET 1 2. RTS 1 AkTSFN • RTS 1 1 2. tALL PARAMIPEtLET.kTS.PECLEP.UHS.US.DlAP,FREEH.
1 MOLD5. Hr.Ll5. 'LUlIl GO TlI S,
CALCUL AT! TRAN5FER fU~tT1C~ FOR THE SYSTEM
•• IFI INlEX 1 .tb • bOCl • CI'. .n. APECU • PECLET A.'SFN RTS
... DO 10 J 1 • lJI( 1 - ,J
C
5 • 6.C~ 1 TAU + 5. 0.01 1 TAU 5 • 5 • AL 00 33 1 • 1 • ~U~1
51 • -S-xUU 33 11111 • IY!IIII*SFACTP-ll./IEXPI-S\111
CALI. AREAIII.~UM1.DLII1,FS1,11 00 3 J • 1· , NU~2
S2 - -S*1I1 III 3 YIII • IY21111-ll./I~xPI-S2111
CALI. A~EAly,NUM2,OLII2,FS2,11 FS • FU/FSl YVALSIJI • 1./IALOGll./FSII IIVALSIJI • S-1./ICALCGI1./FSII-IALOGI1./FSIII ASIJI • S AFSlIJ 1 • F51 AFS21J 1 • FSl AFSIJI • FS
10 tONTINUE
t FIT CURVE USING CURYFT 5L8RDUTI~E t
C C
.C
C C t
C
00 hl· l , IJK • "TSI Il - 1.
NPTS - 1JK IStALE - 1 l'AIIDEG - , NFIIIED • n NCCEFF - 2 CALI. CURVFTIIIVALS.YVALS,~TS.NPTS.1SCALE.MAXOEG.
lXFIIIEO.YFIIIED.hFIIIED.COEFfS.~COfFF.1PRINTI
AL - ALI3. !(tCUNT - KCCUNT + 1
CALtULATE ~~CCESS PARA~ETERS
1 RTS - COEFFSI21 PECLET - -l./CCEfFSUI .
PMINT SECTION
IF 1 IPRI N2 ze. Z1. Z1
21 CONTlN!;E 1T CALL P'RA~IPECLET.MTS,PECLEP,UHS,US,DIAP.FkEEH.HOLDS.
1 H0I.1S. FLOIII ~RITEI b • 555 1
5S5 FURHATClH Il. 4311. '5'. clll. 'F51'. lX. 'F5l'. Tl.
1 'FS', III .ITEC fo • , ICASIJI. AFSllJIt .AFS2IJI. AFSql.J-l.IJIC.I
5 FORMATI'H • 3511. 4~IC.31 WRITEe 0 • 5 1 CCEFFS MIlITEe 6. 50n 1
SOD FORMATelH Il511.'RUN UHS HCLDS
PECLET HDLlS
FLC~ PECLEP
IIHN '. l>
l'SFACTM US RTS FIlEET' 1 1 v..> ():)
C
C
C
C
C C
C C C
C C C C C
C
WMITfl 6 • li 1 MU~. UHS. ~[tLET. FLOW. WHN. SFACTk. 1 US. ~TS. HOLOS. HULIS. P[tL~P. FREFT
II 'U.~ATIIH 1. ~S •• A~. FiG.5. F8.l. F'O.l. F8.l. lFI~.~. ft.l. F7.~. Z~lC.6.ZF8.5.IIII
zo cnleT l'''UE
CALL CCMPARIPE. TAU. PECLET. ATS. PEC. RTF. KI
G'J Ta 17 " A[!TUR~
1:"0
sua~OUTI ... t ~ARA"IPt'LET. ATS. PECLEP. UHS. us. OIAP.AHITE. l HOLOS. HCLIS. FlC~1
CALCPlAT~ PACCESS PAAAMETEAS
PECLEP·PECLET-OIA'/AHITe UNS - I./RTS US-AHlle/llZ.-.TSI FLCL _JLL~·lllt.·2.75 •• 11/7.1/18.)45.6D •• 144.1 HOLOS • FLCl - 0.1))68 • AT5/60. ~Ll5-~ULO$/IAHITt-o.le4~M8~/IZ.1 HalOS- TOT_l HClCUP .tu. FT. MOLlS- OI"!"SIOhlESS TtTAl HClOUP FlCl- GPM FLOW- LBS./HR. fT··Z us- VElOCITY RE TU."
EIIO
C C
t C C C C C t C C
C
SUOROUTINE CC~PA~IPE. TAU. PECl~T, RTS. PEt. RTF. KI ----------------------------------------------------FINITE lENGT~ OIFFUSIC'" ~ODEL ----
TRANSftR FUNtTIC'" ANAlYSIS USING PRfVIOUSLY tAltUlATF.D Monel PARA~ETEMS FROM INFl~lTE BED tONDITIONS
C~M~ON YillOOI. Y211tOI. ARUNIICOI. IDIAPIlrGI. IHITEIlrOl, 1 AFlO" 11(,(; 1. AFlCGO no 1. ATEMP nO:!I. ASFACC\C:N. NUMAlIl;)('I. 2 N~MA211~~I. RI~3,21. ASllùl. AFSI10I, ~lX!. OlXZ. NUM1. NUM2. 1 OIAP. HlTl:. FlCA. RUN. TEI'P. XN2, ATERM. IiH"'. SFACT ... NNN. 4 INDEX. IPUNCH. l~kINT. IPRIN1, IPRIN2, IPMIN3, IPRIN4, IJK
APEC • (1.
ARTS - (1. l 0 K Cl
C Of FINE PEClET AND AESICE~CE liME C
'C
APE • PE ATAU • TAU
2 PECll APE APE 1 5. lAUl 'ATAU - &TAU/5. FS • Af5131 S ASI"I no )1) 1 1. 20 AI.' 1 THETA - TAU! + 2 •.• ATAU /lCO •• AI 00 3~ J 1. 20 AJ • J PECl • PECll + 2 ••• PE I10C •• AJ
C EVALUA TE TRA~SFER FU~CTIC~ FOR ~XIAllY DISPERSED PluG FLOW C ~OEl kITH FINITE lENGT" BCU~DARY CUNDITIONS C
BETA • SCRTll. + ~ •• THETA·S/PECLI TRAHF -~ •• &ETA 1 III 1. + BETA 1 •• 2 1 • IEXPI -PECl •
11 l. - BETA Iii. Il - Il 1. - BETA 1 -. 2 1 • EXP' -PECl • 21 l. + BETA 1 1 2. Il
IF 1 .les 1 FS - TRA~F D.nOOl 1 31, 31, 30 31 CONTINUE
" • K + 1 IF 1 IPRIN3 .EQ. 0 1 GO Ta l GO TO 3
1 k~ITEI 6 , 7 ) K, S, FS, THETA. PECl, TRANF ) ARTS • ARTS + THETA
APEC • APEC + PECl 30 COillTlNCE
L • L + l l>I
lJJ \D
IF lit 1 5!, 55 • "" 55 IF CL - 2. ~4, II • 77
C C REPEAT FOk ~EW V'LUtS OF PECL AhO THETA C
c
44 APt PECLET AUU. IIlS GI) TO l
•• Ail • Il IF 1 INOLX. EO • 1 GC TO aa GU TO .. ,
Il A"UPEC • PEC A/IIURH IITF
,. P!C • APëC 1 ~Il RTF • ARTS , &Il IF 1 IPRIN) 1 11, 12. 12
12 .,AITEI •• 5 1 Il 11 INOEX l''O''X. 1
IFI I"CE. 2 1 78, 7.. 76 7. PEC. 1 PEC • ANUPEC 1 1 2.
"TF • 1 MTF • ANURTf , 1 2, GO Ta 711
77 kRITtl 6 , 6 1 ~t.M, S , FORMAT Il" 1,25K, 'TCTAL ~U"lfM OF SfT5 SATISFYING THE'
l ' FINITE aec CC~OITI0~5 • " Il, Il 6 'OA~ATI1H , 'NO C~NVEAG(~CE CITAINçD --- NNh ·',14, l' S.', F6.4'
7 'ORMATIIH Il5X, 'Il .', 15, lX, 'S .', F8.5, 3x,'F5 .', l 'R.5, lI, 'T"~TA .', F7.4, 3K, 'PECL .', F7.l, 3X, 2 'TKANF .', F8.51
h AtTIII'N
END
C C C C C C C
C C C C C C C C C C C C C C C C C C C C
C C C C C C C C C C C
c
T.O POINT ~C~E~T A~ALYSIS PRCGRA"
~OMENCLATURE
SU8ROUTI~E MOME~TIPE, TAU, P~P, UH, U. HOLD, HaLl. IMAXI --------------------------------------------------------SUHSCRIPTS lAND 2 REFER TC INLrT AND OUTLET PULSES RESPECTIVELY
N M'MBER CF DATA peiNTS DLX TI~ê INTEKV&L FOR EA'H DATA porNT x TIME AXIS Y VALU~S CF CONCENTRATUON XY ARRAY OF X * Y VALU~S XXY AMRAY OF X**2 * y
'LL AREAS UNOEM CU~VES ARE EVALUATED 8y SIMPSO~S MULE
AI\ ARR .us "11" "28 KIR, X211
AREA UNOER X - Y CURVE AREA U~O~~ X • Y - X CURVE A~EA UNeER X.*2 • y - X CURVE FIIIST ~C."E~TS X IlAR "'''LUES
Xl88.x~8e SECCN~ CENTRAL "CMENTS
DIMENSION xYll1cel, XY2110CI, XKYlllOOI, XXY211011 CO,,"DN YlllOOI, Y211~01, A~UNI1~OI, IDIAPIIOOI. IHITEI1COI.
1 AFLOWIloOI. AFLCGIIOal, ATEMPIlùOI. ASFACllC~', NUMA111001, 2 ~"~A2110~'. RI13,2', ASC101, AFSll0'. DLX1, DLX2, NUH1, NUH2. J DIAP. HITE, FLC~. RUN, TE~P, XN2. ATERM, WHN. SFACT~, NNN,' 4 INDEX, IPUNCH, IPRINT, IPRlhl, IPRIN2, IPRINl, IPkIN_, IJK, 5 FLOL.FREtT.FREEH
DIAP HilE "/H U PE PEP TAU HDLO HOLl
DIAMETE~ OF PACKING. INCHES COLU~N hEIGHT. INCHES VtLOCITY/HEIGHT VELotlTY CF WATER IN TCA, FT. 1 SEC. COLUM~ PECL~T "U~ReR PACKING PECLET ~UMB~R ~EAN RESIOtNCE TIHE, SECONDS HULD-UP IN TCA, CU. FT OF WATER HOLD-UP IN TCS. CU, FT. 1 CU. FT. OF TCA VOLUME
IF C I~AX .~c. -1' GC TC 1 GO TO 2
C CALCUL'TE THE HIGHEsr ~U~8tR IN ARRAY C
1 00 23 1 • 1. ~U,,2 IFCY211+11-Y211" 22.2~,23
n CONTl~LE
l>I
.p-O
UIIA".Y2CII IIAII ~.01 * ATtM" * .AM
C C e'lCUlAT~ ATEMM' OF THE ~AXIHUH VAlU~ IN THE ARRAY AND
C T~IIHINAT~ •• AKI~G T"~ ~EXT NlHBtA ZERO C
C
00 lq 1 • l'.hU~2 IFCY2C Il - .A~I Je. 26.20;
19 CuNTINl( '0 'I2C1I·(.
111'112 - 1 CU Ta 27
z. 'Il Clt1 1 • 1).
IIU"2 - 1 .1 n CilNTIHlF.
C 'INO Or.O 'N~ EVCh NUMI A~D hUMI. MAKE 000 C 8'1 AODING ANL~HtR lA ST ZtRC C
C
'-MIIII '·'12. 1-'IUfI117 Cl - 1 l'C~-G11\9. 19, 1~
19 ~U~l - HU"l t 1 '111 NUI' 11 .. o.
20 CnhTlhUf E - NU~2 f - Ell. 1 - NU~212
" - 1 l'Cf~HI li, 21, II 21 ~U"2 -~U~I • 1
YUNU"21 - O. II CONTIN,,!!
C COM'UTE zrRoTH, flRST AND SECOND MOMENTS C
2 X\ - '"EET CAll AM[ACyt. HU~I. ClXI. AMI, C CAll Allt"IYI. HU~I. DlXl, "R2. C 00 6 J-l.hUM' X'I~CJI.X' *n CJI XXYlCJI-IX1**ZI,YlCJI
• U-UtDlXl CAll AR~AIXY1. ~U"l, Dl.l. ARAL. 1 1 CAll AIIE"CXXYl, NU"l. Dl.1. ARS1, 1 1 ueO.1) 00 • l-l,IIUMZ l'IZIII-.2*YIIII XXY1CII-IX1**21*YICII
1 X~-XZ.Cl.2 CAll AlleAIXY2, 111."2, DlX2. AAM2. 1 1 CAll AIIEAIXXY1, hUM1, DlX2. ARS2. , 1
C
SFACTR ARZ 1 AAI ."u-c. ,,'''-ARRl/ARI .10allle •• M .IBRaIAM~l/Akll-C~lB·*21
"2Bal\" .. 2I6R2 X2d·,,?B •• t\Z .ZBS-IAMS2/AR21-1_IB*.11 \iIi-I.I Ixill-XlB 1 PE·I.~/ICIUH.l.I··II.IXIBB-XlIlBII
TAU -l./UH CAll PAk'"IPE. TAu. PEP, UH. U, ClAP, FREEH, HOlC,
1 HCll, "lU... 1 IF C IPAINl 5 , 9, 9
9 CIlhTlNlE
C PMINT S~CTICN C
IIRITEI6.q'i'h~~, DIAP, HITE 99 FOAHATI1H , 55 •• 'Sr~IAl NUMHER·. I~. 1.
150K.'0IAP, •• F3.1.5X.·CClUllh H1TE~ i.F5.1' IFI IREAe .éC. OlGa TU 110 wAITEC~.15IRUN.FlOl.TEMP.PS.OOlf,NUM1.DlXl,
hUM2.0lX2.xN2
15 FORHATC4f.X,'PUNl i.A~.2x.'lIQU1C FlOW.i.Fô.3.2x.·TfMP_ a,F4.),2X,'
lPS. i.F~.(,./27x,·ûR1F1C~ OIFF ••• f7.4.2x.·~UIIl~ a.12.lx.·~~lX1. a.
2F4.2.2X.·~U~2'i.12.2X.'DElXZ* a.F8.6.2X,·Xh2_ i.r4.2./1
110 hA ITE Ct, 1'" 10 FORMATC\H", 3HRUN,2X.5t'U8Ar •• 5X.5HX28AR.4X.oHXl&"AR,4X.
16HXIBBAR .5X. 3HU/H.5x ,Z"'PE, lX .4HFlOl. SX.~HFlOG. 3X. !.Hl .5X,4HSFl.C.
l' U TAU HOlO HCll PEPi 1 kRl~EC 6 , 11 1 RU~. X1~, X28. X1&B. X28B, UH. pet
1 FLOW, WHN. MMMM, SFACTR, U, TAU. HUlO, HDl1, PED
11 FO"MATC1H .A~.F8.5.F9.5.F'i.5.F1~.5,F10.5.F8.3.Fl~.l,F8.1.13.
1 F1P.2, Fb.l.F7.4,2F10.b.FB.5,/I IF 1 IPU~CH 1 ~, l, 1
J CUhTINUE ~R1TEI1.71 RUN,FlOW,WHh.TEIIP.hU~1.NU~2.0IAP
,HITE,x~2.SFAC.OlXl.
10lX2.PE.PfP,Xlll.x2B.Xlb8 •• 2SB.UH.U,TAU.HDlO .... Ol!.N~N.
lCYlCII.I-l,NUM1I,CY2111.1-1.hUM21 7 FORMATIA4,F8.1,Fb.1.F4.1,IZ,12.F3.1.F5.2.F5.l.FB.5.F~.2.
1 F9.7,F7.l.F8.5.1.5Fb.5.F6.4.F8.5,2F'i.8.14.I,I19F4.111
4 CONT1~"f IF'~U~1-~UM21 512.512.511
511 K-NU"2 + l 00 51~ J - K,NU~l
514 Y2CJI - O. GO TO 51
512 • - ~~l • 1 00 513 J • K, NUI42
·513 YlIJI - t'. 51 CONTINUf
IF'hU~1-~U"2' 10C,lC1,lOl 100 Nlillat NUM2 J>
GO TO !l3 1 ~
C
C C
IU\ N~~N • NU~1 JJI ~'I'tl~,IL'II,YIII.,Y211', 1 • I,NNNNI \~ 'QR~A'I&H ,J~I,II,,~A,FD.2,Z~.,~d.ZI
"" 1 Tt 1 t , Il'' 12) fURM'Tllhl,/1
S ""TU"N
END
S~~~OUTINE A~EACA • ~ , CEL , A~ • K •
C -----------------------------------__ _ C C C AMë' U~OEII THE CLRVE ey SI'PSON'S RULE C C
OII'["$IC~ AIlO!:!1 C
1'"0 ,. 1. , C C FINU TtE MA_IHUM VALULE IN ThE ARMAY C
c
1 Mt"Il • O. 00 1 1 • 1. ~ IFIA"'I - AII., 2. Z. 1
Z AMAIt • A Il • , CONTINLE
C TR,"S~fRlhG Ta NCh-ul"ENSICNAL FORM C
004·1,N 4 AC Il • ACll/AHAa
C C CALCUlarc AREA U~O[R T~E CURVE C
C
, t.N • ~ - '1 ... ('.
OU 6 1 • 1, ~N, 2 • Ali • ICOEL/':J •• -I'CU • 4.o-AII • 1 1. ACl • lIlI '. AR
IIETUlCN
END
c c
c c
c C
c
SUHkOUTlhF. UUTPUTIPEa, PEP', UHA, UA. TAUA, HOlOA, 1 HOU, 1111
DI'ENSION PEall~~I, PEFAI100I, UHAI100I, UAI10CI, 1 TAUAI!~~I, HOlD'1100I, HClAILOCI CO'MO~ Y11\QOI, YZI100I. ARUhll~QI, IOIAPI10~I, IHITEI100I,
1 AFlOWllnCI, AFLCGI'O~I, ATE~Pll~QI, ASFACI1001, NUMA1110~', 2 "UMA1UOl'l, RCl3,21. ,SIlOIo Afsn" •• OLal. ou::!, "UHI. NUM2. , OIAP, HITE. FLC". !lUI •• TE"P. Xtl2. ATEAM. WHN. SFACTIt. tlNN, 4 INOfX. IPU'ICH, IP/llfeT, IPiUM. IPRIN2., IPRlh3. IPAltilo. IJIC., ~ FLOl, FMFET, FREEH, TAHlEI9.21 ,AT/lUHll00I,K~SUM
IL 49 11 \ IF 111 '0 1 13, 12. 12
UIL III 1 12 1 J Il. IL
WAITEI 6 , 10 1 WltITEI 6, ni &AAUNII •• JHITëlll. JOJAPIlI, ATEMPClI.
1 AFLOWIII. àFLOGI1I, ASFACII •• PEAII •• PEPAIII. UAII •• 2 TAUAIII. AT/lUHIII, HOlAII.. 1 Il, IJ 1
10 FORMATI1H " 21X, ·/lU .. ~c. TE~P FLOW FlOG SFAC , 'PE PEP U T'U TRUH HOL1',111
11 FORMATIlH • 20X, A4,'H·,ll,'O',Il.F6.1,flO.l,F8.1,F10.4.F8.3, 1 Fl.3, 2F~.3. Fe.2,flO.61
1 FIlRNAY ClHU "RIT~I 6 • 1 1 IF 1 Il .fQ. Sl 1" GO TO 14 IF 1 III .GT. "!lO 1 Ge TCI 18 GD TU 14
18 IL ". III 51 17 Il • 51
GO TO 12 1" CONTINLE
C PU~CHED OUTPUT FOR E'CH CA TA SET C
c
IFIKUSLH.tQ. 01 GO TC 56 WRITEI 7 , 46 1 I~RUNIll, IHITEIII. 10IAPIII, ATEMPIll.
l AFLOWIII •• FlOGIII. ASFACIII, PcAIII, PEPAIII, UACI', 2 TAUAIII, ATRUHIII. hOLAII', 1 1. III 1
46 FOkMATIA4,'H',ll.'O'.lt.F4.1.F8.1,F6.1,F6.2,Fl.3.F8.5, 1 F6.4. F7.4, F6.2,F8.61
56 RETURN
END
» 1
.j:::" 1\)
c c c c c c
C C C C C C C C C C C C t C t C
t t t C C C C C C t C C C r. c c c c
C~LCUL'TE AIR FLtw RATE
S~DMOUTI~~ FLOG 1 TE'P, FS. PP. WHN. CP. G. DENS. \ ~DEN. O-tG. DIAt. 1. WBTP 1
NIl'lENCUTUpe
O~ PIPE CIAMfTEP.I~C~ES OIAO ORIFICE tl~~tTC~.lhtHES G 'CLfCULA~ ~elGhT RATIO T!~P TF~PRAT~~E OF THf RUN.D~G. t. PP I~CLINEO '~hO~CTEA REAOlhG. MM P$ MANUHETE~ ACAtlhG FeN TH[ IHL~T PIPE PRESSURE. MM _ISt VISt. OF ~AS .T TE~P •• tP. DEHS OtNSITY OF "ANC'tT[~ FLUIC • La/cu FT MDtH WAT!~ D(hSITY. L~/CU FT OH!G ANGL! OF IhCL.N.TION OF THE MANO'METER. DEGREES.
tO'MO~ YIllonl. Y211COI. AMUNI1Cll. IDIAPII001. IHIT[11001. 1 AFLOhl\n~l. AFLCGI'~OI. ATt'lPllOll. ASFAClt(·~I. HUMAlllOOI. 1 NUMA2111~1. RIll.21
P V.P. ~F .ATER AT TE'P. MM HG sp PltUS\lRE OF ThE "llITUFIE
IHLET STATIC PRESSURE 1 AARCHETEIt+GaGE PR~SSU~~ 1. PSIA
y SP. wT. OF GAS AT T~HP YA SP. MT. wF DRY AIA AT TE~P YS SP. MT. uF WATER VAPûR LN SATURATION AT TEMP
LIIIC'J FT PO DI~F~.!~TI~L PRESSURE H~AD ACR~SS THE ORifiCE.
HM ne MANCMtTER FLUID "MN INCH~S UF DIFERENTIAL OF MANOMETER FLUlt
1 IhCLI~EO 1 HM DIFFEREhTIAL PR~SSURE HEAD ACROSS THE ORIFICE.
IN. OF MAT~R AT 6S F M"" GAS FLO. RATE. LB/hA st'M STANDARD CUolC FE~T PER MINUTE OF GAS
-.AfP l "STP 32. e 5. / 9 • • 00 ~tTA-DIAO/OP
'A-l. '_1./ISD~TI1.-BiTA •• 411 PL*'.965-Z~60./lhBTP+l73.1 '-lO.··PL PT*IP*14.f91/760. TfMf-ITEMP.~./5.1.)2. VISC_C.~~02'64.TEHF.D.01619
C
TAuS-TFP4F+460. SP-14.~~~+IPS/3=5.1.IDENS/hD(NI~I'4.6q6/33.91 YA-29.·SP/I10.7~.TA6S1 Ys·\e.·SP/ll~.73·TAbSI Y·IYA~G·IISPI-PTII/SP+YS·'PT/SPI PI'f·pp PD·PP~~I~IO"EG·O.C17~31 HP4N-PO H~-H~N.'DENS-YI/~2.3 CO-C.65 I-Q
100 WH.13S~ •• tO.F.FA*OIAD •• ~.ll.-I~.ù32/3.1*IHW/SPIII-SQRTIHweYI lte·(WH*,.S.I/lCl.(;(,;(;(.7Z·3.14"DIAO"3600 •• YlSCI 1-1+1 00 20e L*I.13 OFR~-R IL .l'-NE lF(DFPfl 2CO.30u.3CC
200 COtiTiNLE WItITEIt.e:C·DI
600 FUR~ATI'REYNCLDS NU~BAK TCC elG FOR THE TABLE'I COEF - 4)."70Z GO Ta 'ion
3000FFM-PIL+l.11-RIL.11 CO~F • IIRIL+,.21 - RILt211/DFFRI"C~RE + RIL.21
900 WIN_35~ •• CoeF*F.0IAO •• 2.FA.'l.-IIJ.C32/3.1.lhW/'SPIIII*SQRTIHWeYI IF IIAbSlhHN-WHII-0.011 4CO. 'tUO. 450
450 co-terF IF 1 1 .GE. 400 1 Ge TO itCC GU TO 10:1
400 CONTI NL~ SCFM-lhH~.359.1/'29.*60.1 RETUltN
END
1> 1
-+=" LV
C ~UOROUllhf LCOKCYELCC'
C , INT'R'CLAlICh FO~ YELCCllv Clf F~[E ~ALL
C
C
C:lM"UN Vl(1IÏ?I,Y2110CI, Altl.hllOr) , ICIAPIlGCI, II1JTEIHIlI,
1 A'LUII'1I"", ULOGII'JOI, 'nMI'Il0'1j, ASFACC1C.('I, NUHA\l1001,
Z NUHAZI\'J('I, '113,21, &Sl1rl, A~SI1(1I, OLX1, OLx2, NUHI, NUI'2,
, DIA', Hllt, FLC~, MUN, lt~P, X~2, "EIIH, IIH~, SfACTk, NNN,
4 INDU, IPU~CH, IP"INT, IPRI..,\o IPRItIZ, lPRlN), lPMlN .. , l''K, , 'LOL, FRCE1, FREfl1, lA8LEI',21
t VELotllYoLl~ulO VELOCI1V cr f~EE FALL FPS C FLO.. LIOUIO FLCW Il''~ lh L6S./HR. fT ••• Z C
C
( C
00 1 101,~
lFCFLC .. -TABLEll,1I13,Z,\ 1 CONTINUE 2 Vr:LIIC.lAIILfC I,ZI
GO 10 ~
, VéLOC.CCTAdLECl,ZI-TA~LEll-l,ZII/CTABLECl,11-TA8LECI-1,11".
IC'Ln"-TAOLECI,111.'ABLEC1,ZI
.. RElUIlN END
SUOROUTlhr 4LUEC.X,hU,FS,PK,AL'"A,BETA,SI
( -----------------------------------------C
( ( C
C
OI~lNSION ALPI1AC11,IIETAC11,SI11
EVALUE 'CUTlhE FeR (URYF'
'ZoO. ,It·' . n.se \ 1 00 \ 1.' ,IN n,.,·PI' 'KoCXX-ALPH'Clll·PK-BET'Cllepz PL.TEM' FSoFS + PK-SU+II RflUR~
END
C C C C C (
C C ( ( (
C C C C C (
C C C C C C C C (
c C C
C
(URYE-FIT SUeRCuTINE
SUO~OUTINf CURVFTI~~"~S,YY~LS,WTS,NPTS,IS(AL~,MAXOEG,XFlXEO,
1 YFlXEO,NFIX[O,C~EFF,NCCEFF,IPRINTI
Af"ARKS CCE~FS HUST DE OIHEhSIOhE~ TO AT LEA~T HAXOEG+J
OI"ENSION XVALSCll,VVALSC11, .. TS'll,XFI~FOC11,VFIXECClliCOEFFC11,
1 ZC3001,~LPI1~C2ol,uETA'261,SC261,SG~S~'261, Z PC!OCI,POI30DI,XGC!OOI,YGC3tnl,~GI!OIlI
XVALS YVALS .. TS NPTS ISCALI: MAXi)EG XFIUO YFIXEO NFIXEO (OEFF IPRINT
FPTS·NPTS XO·O.O
OI"ENSIC~EC ARRAY OF X COCROINATE OI"ENSl~NeC ARRAY CF Y COCkOlNATE OIIIENSIGhEG ARRAV CF wrIGHT vALues ~U~RE~ Cf PCI~TS TO BE FITTED SCALING FOR 1, ~C SCALING FOR 0 HIGHEST CEGREE CF PCLYhC~IAL DI~tNSICNEC AFRAY Cr x COORCINATé OF FlxED POI~TS ~1~EhSIC~EO ARRAY OF V COORDINATE CF FIXED POI~TS TOTAL ~U~BER CF FIXEO POINTS, CONSTRAI~TS ~l"ENSICNEO ARRAY OF COEFFS OF POLYN~HIAL
-1 SUPPRESSES PRINTING, 0 FOR PRI~T
IF IlSCALEl5, 5, il
NO SCALING
5 GA""A.)./l .... EAN·l.O GO TO 10
( SCALE POINTS C
C
8 GAMMA.C.O .... EAN.C.1l 00 9 ,,-l,NPTS X".XVALSCJI XI'I-~O+lIJ , GA""A-~A~HA+ XJex"
9 ~MEAN-~~EAN + ~TSCJI GA.~A_SORTCFPTSUGAMMA-XC.XCI/FPTS
XO-XO/FPTS ~MEAN-"MEAN/FPTS
~ 1 ~ ~
1" 1~I"fl.EDI\\,lI,h c. c. "u '11fO PJI"1 C(N~1AAIS1S C
c
Il C~ 12 J-I,NP1S I~IJI-IXVALSIJI-.CI/GA~~' YGI.'" -YV~l S 1 JI
12 _~IJI-~T~IJI/W~EAI. GU TO lO
C INCUAPCAA1E CONS1RAIN1S C
C
l' on lb J-"NflxEO IIGIJI-l." .GIJI-I.FI~~OIJI-.CI/GA~~A
lb YGIJI-YFlxr.OIJI CA~L GffYTINFIXEO'l,l,NflxtO,XG,VG,WG,S,P,PO,SGMSQ,ALPHA,BElAI "He-o.t' 00 11 J-l,NP1S "HC-III1C • IITSI JI
Il .GIJI-IA~ALSIJI-.OI/GA~"' " .. o-rpTS/PHlI SlNfl.EI:"I-",/) on :n J-' ,,,"PtS CALL ALU(IXGIJI,I.fIXEO,FS,PK,ALPHA,SETA,SI 1""KI.n,! 0,20
1'1 STOl' Ir\ 20 VGIJI-IYVALSIJI-fSI/~K 21 wGIJI-~1SIJlaPK.PI.~HO
C MUGE C
C
10 KN-MAIOEG., CALL GffY1IKN,NrIIEC.l,NPTS,IG,VG,WG,S,P,PO,SGHSC,ALPHA,SETII N-IN-' DO Il Ja"NP1:> CA~L ALUEIIGIJI,,,,FS,PK"LPHA,~~rA,SI
JI li JI af' S DO U 1-1,"1 ALP"AlllaALP~Alll.GAMMA • 10
'2 BF.TAIII-dET'III.GAHMA AMO"-G'"''''
C 'CIlDA' 'hlUTINe C
NCIlCFF-"'tl on 1~ 1-2.NCCEFF CO'H 111-",0 PI 11-0 ,0
\4 POIlI-r..O '111-(',0 POlll-r,;: COfH 1 lI-S III DO J, lal,"
C
T2-n.o 11-1. ] cn 35 .1-1,11 TI_IT2-~LPH~III·POIJI-eET~(II-PIJII/~HOA n-pol JI PC JI-PCIJI pnlJI-n .
35 CGEFFIJI·CCEFFIJI.Tl-SII+11
C PAINT SECTION C
C
C
IFIIPRINTI5J,36,36
16 WIiITE 1 toltJI') 1 \OG FON!!AT (1.", ,31X,Ll,hPCLVIICIi,Il-L CUI;Vi: FITTING Il SI,lHX,l&X,lHV,
1 16.,~~Fl,\7X,2HFZI Dr. 311 .la' ,NPTS XZ-XVALSIJI FZ-COEFFINCnEFFI I-N
17 FZ-FZ-XZ • CCEFFIII lal-l IFII13e,~p,17
18 ftRITElt,l~lIXVALSIJI,VV~LSIJI,ZIJI,FZ 10\ FORMATI~el7.71 .
N2-N·Z "RlTEIl:,~C!" S"~SC:1l1 ,Ial ,NZI
10Z FO~~ATI6h~SG~S~,~t16.al WRITECt,\~4IS"~SCINCC~FFI,~
11)~ FIIN~AT \l5H.l'4INIHUH SGMSC:- ,ElI>.8,llH FOA DEGIIEe,131 WPlTtlt,\CI!5IN
105 FOK~ATI3"lNa,141 DO '1 l-l,NCCEFF· n-I-1
41 WRITelt,10611I,C~EFFIII 106 F~AMATI2H C, 13,ZH .,E1B.71 50 R!!1URN
END
l> 1
-1==" U1
e e e e e
e C e
SU&ROUll~~ GEFYTI~,~C,~~,XC,YG,.G,S,P,P0,SG~St,ALPhA,H~TAI
-------------------------------------------------------._-
OII'CNS 1(1~ XG III ,.,GIlI ,,,Gill, :>111 ,PIlI, POIlI ,SGI'SCClI, ALPHAI1',
\ ~~Ulll
ROUTINE e'LLEO BY C~RVFT
J·'j-HO IFCJI! ,l,?,
1 STep H2 2 IUCT·C
JeJ-H" IFIJI~,l·,.,
) IFCJ-\ 14,11\,10 JO lue T-l 4 tlEUU.CI.('.O
osa·o.r. .. ,p.(\.(' DO • J.\,H" "CJI·I.O "OIJI·r..O Il'P-IIPP • wGIJI II'ClUCT! '.1,5,.
'.1 osa.ost • wGCJI.YGCJ •• YGCJI • CIll\in"'lE
1C .... "., .. (-1 00 20 I·~C,N
II'R·IC-I IIY"·O.r. IIx .... ·C'.n 00 ln J·l.H" tt .... ·IIGCJ'· .. IJ' IFCI-Hll,ft,'I
1 Il.PP .... PP • TE"~·XGCJI·PCJI
• 1I'IIFRI1Cd,C; 9 ~YP."YP • TE~P.YGCJ'
\0 r.nkTl"LE IF "FA Il'-, \1 ,11
11 SC 1'·"Y""Pp \2 IFIIXACTI11,11,14 1] CSU·OSC-SIII.SIII·"PP
SG"~CIII·nSO/FLC.TII'A. 11'11-HCI2\,\4,21
21 IFIAOSISG~SQII.,-~8SISG"SCII-1I"14.14,22
14 IFCI-Nll~,2u,20
1'.1 ALPHAIII· .. XPP/ .. PP .,'PO·IIPP .,p,.n. DO 11 J-\.H" 'E"·I'GIJI-AL .. H~III'·PIJI-tlCTAIII.POIJI
c
"PP-IIPP • wGIJI*TEMPeTEMP POI.II.FI JI
11 PlJ'-HM .. BETAII.11~"PP/WPPO
20 CONTINUE RCTURt.:
22 N-I-l RETURN
END
l>I
-1=" CJ\
C C C C (
C C C C C C C
C
c: C C
C
VI .3. CALCULATION OF INTERFACIAL AREAS OF MASS TRANSFER
I~ITFC • r WRITfS FRO~ CC2FLO 1~IT~r. • 1 ~OwRITF 1~ITf( • ~ W~ITES FR~ F~r~ S02FLO IqITF~ • , ~1lWP.ITF
IAITFA • C WQIT~S FRO~ REACTN IAnfP • l "'!NRITE 1 PNt .. c • 0 PUNCIIFS FAOM C02FLO 1 PHeI« - 1 H('PIJ'fCH IPHr. .. S - " PI~r.HES FROM SC2FLO l'Ht .. S - 1 HO'UHCH
CnN~ON AIl6,2I,TI26.21.0P,G,t'E~S,W~F.H,OHEG,Tr.,IL,TL, GC02, lAI,C02IH,rOl~T,C02l8S,TGS,TlS,AlS,GS02,S02IH,S02t'UT,S02L~S, lHDlt'Ilr~,~"I,ALHPPC,ALHPPS,A~UWAT,A"USLN,~~AT,HW,H,ILHKR, 'RC.PTC,RFXPTS,G~F,TRUEHr.,TRUFHS,TRUEH,EAREA,TV~L,~KGS02,IKGe02, 4AHUKG~,ARPIC,SPARFA,IPhCHC,IPNCHS,IPNCH~,IRITEC,IRITFS,IPITER, 'MNNHN ,OSOLN,Tx,AXA,GC
IR ITH - 0 IAITPS - C IIIIT!!' - 0 l 'MCHC • 1 IPMCHS - 1 NHItNN - U
READ OA'A
.'AOI~,ll O',G,OEN~,WOEN,O~fG,OIAO 'OR"'''16F11I.!!1 11111 - Il WAtTrl6,l~1 nP,G,rENS,wOFN,OMEG
14 FIl.~A'II~l/lH ,1H('PI,F10.'/I .. ,2HG.,F10.'/lH ,'HO~NS', lFln.5/1H ,5Hwr~N.,F10.'/lH ,'H~"EG.,F10.'1 IIF.AOl5,lICITIL,"I,~-1,11I,~-1,21
, FOR·ATIS'l~."/'FIO.O/llF50~1 ~ITfl~,127J CCTIL,~I,L-l,IJJ,~-l,21 'F. An 15 ,] 1 1 III CL , H J ,l -1 ,1 1 J , ~- l, 2 J W-ITFI6,1271 IIlIll,NI,L-I,111,M-1,21
Il' FnRMATIIH1,l,Fl~.1/1)Flù.~! '00 11111 - 11111' 1
CAll COlFlOITG,Tl,Al,GC,Al,C02IN,C020UT,llttt,KKKKKI CALL S02FLOITGS,TLS,ALS,GS,S02IN,S020UT,IIIII,KKKKKI CALL ~rACTNIIIIII,xKKxK,GSI l'IIIIII.fO.HNNNNI GO TO 601 GO TO 700 .
601 00 6~~ ~NPO - l , 2' , 12 N'OR - "NPO • Il L .... 1TF.16, se III HOlOC l ,J l, J-IINPO,NPOR " 1-1, NNN~N 1
600 (nNTlNor .0 FO'!."" Il Hl" /II Ill' Il. li 1
tlll '.INTRllH,lMI ST 0'
IMD
C C
c c C C
c c C C C C C C C C C C C C C C
SUARCUTIN~ C02FLOITfHPG,TEMPL, WATFLO, GMASS,TOTALK, lGASIN,VOUT, IIIII,KKKKKI
CALCULATF.S FLOW RATES AND ABSORPTION DATA FOR C02-NAOH SYSTEM
DIMENSION FLOWNI50l,C0211100l,C022150l,C023150l,GASFLOl50l, lC02MI50l,COZ41501
COMMON RIZ6,2I,TI26,ZI,DP,G,DENS,WDEN,OMEG,TG,AL,Tl, GC02, lAI,C02IN,COZOUT,CJ2lBS,TGS,TLS,ALS,GSOl,SOZIN,S020UT,S02lBS, lHDLOC lro ,40 l ,ALNPPC,AlNPPS,AMUWAT,AMUSlN,OWAT,HW,H,AlN KR, 3REXPTc,ReXPTs,G~F,TPUEHC,TRUEHS,TRUFH,EAREA,TVOL,AKGSOl,AKGC02, 4ANUKGS,AREAC,SPAREA,IPNCHC,IPNCHS,IPNCHR,IRITEC,tRITES,tRITER, 5NNNNN ,DSOlN,TK,AKR,GC
OP OIAO G TEH' PP PS OENS IIDEN OMEG P WHN SCF"
PIPE OIAMETER,INCHES OPIFICE OIAMETER IN INCHES MOLECULAR WEIGHT RATIO TEMPERATURE OF THE RUN,DEGREES CENTIGRADE INCLINEO MANOHF.TER REAOING, INeHES HANOMETER READING FOR THE INLF.T PIPE PRESSUR~, M" DENSITY OF MANOMETER FLUIO, LBS PER CU FT DENSITY OF IIATER, LBS PER CU FT ANGLE OF INCLINATION OF THE HANOMETF.R, DF.GREES PRESSURE OF SATURATEO VAPOR AT TEMP,MM HG GAS FLOW RATE, LB/HA STANDARD CUBIC FEET PER MINUTE OF GAS
READ DATA
100 REAOl5,qqql NA~E,TEMP,TEMPl,PP1,PPl,PS,FLOW,GASVl,GlSVl, IPP1,PP~,AlKA1,CARBI,AlKAZ,CAR8l,KKKKK
999 FORHATIIl,F4.I,3F5.~,F6.l,F8.2,ZF6.2,F4.2,F5.2,F6,2,F5.2,lF6.2,lll C C CALCULAT~ GAS FLOW C
C
(i~lDlIlT - 44. O~AO -1.5 TEHPG-TFMP PP-PP1+PPl/64.-PP3-PP4/640 IFCKKKKK.fOoll DIAO -Z. CAlL ORIFISCOIAO, TEMP,TEMPL, PP, PS, GASVl, GASVl,
lGMOLIIT,KKKKK, WH N, GMASS, GASIN, GASOUT,PN,TASS,SP,Y,PI SCFM-CWHN*359.I/Cl9 •• 60., GASFLOCIIIIII-GMASS GtOZ - GHASS
C CAlCUlATE 'MOUNT ABSORBEO C
V-ID. 'SS CA~Bl - CAR8l/5.
SOlUTN - 'LKAI • 0.9'324 /50 •• 1.50605.40./50. l> 1
-r=......;J
(
UK'I • In. • SOlUTN 1 0.973l4 CA~ftl - CARftlI5. SC'UTN • AlKAl • 0.913l4 ISO • • 1.50605*40./50. AlK'l • 10 •• SOlUTN 1 0.973l4
111 AtlnVo0.5*CAlKAI.tARDII.0.5*IALKAl.tAR~ZI TOTAlKoACIOV·C.91)l4/V 'lOMNC 11111 I-FlOW/ISQRTII.Oll 66.8/6.7Z6011*1.081 WATFLO • FLOWNI11I111 COZIIIIIIII-40.*44.*.913Z46FlOWNIIIIIII-IALKAl-AlKAZI/C1.081645'.6
1 .~0 •• 6Z.41.Z8.316* 0.1 COlllllllll·GMASS-44.*IGASVl-GASVII/Z90C. cnZ'IIIIIII-COZIIIIIIII*ICARDZ-CAR811/IAlKAl-AlKAZI Iflconlllllll.fO.O_1 COZ)IIIIIII • COZII 11111 1 l'Icnlllllllll.lT.0.ICOZ1IIIIIII-COZ)1111111 COlI" 111111- ICOlIIIIIIII. COUIIIIIIII/Z. COlLU <OZMIIIIIII GASIN - GASIN'II. - P/160.1 COlING.r,~ASS*0.164955*GASIN Il Y-10n.1 COlOTG-COlING-COlL8S*0.16495*359.*TA8S*14.696/144.*49Z.*SPI VOUT-COZOTG'ICOZOTG.ICOZIN~ll.-GASIN 1100.I/IGASIN 1100.111*100. PPeOZ-IGASIN .vOUTI/Z. COZ41111111- 100. - VOUT
( PAINT SfCTION (
c
IFllI'ITEC.EO.OI GO TO III GO TO ZU ,
III VRITEC6.101 PN. HW. WHN. SCFM. TE~P. GMASS. PS, 11111. lTfMPl.FlOW.GASV1.GASVZ.AlKA1.CAR81,AlKAZ,CAR8Z,DIAO
10 FORMATn .. ,l'''.J,5FI.l, IJ.F9.1,7FI.Z,F3.1I III IFIIPNCHC.EO.OI GO TO JJJ
Gn TO "4 IJ' ~ITf17,4011 TEM",PP,TEMPl,FlOWNCIIIIII,GMASS,PPC02,TOTAlK,
lG'SIN, VOUT, v,COZMIIIIIII.11111 401 FORMA7 1'5.1 • F7.4 .F5. l,F U'. 1. F7. 1.F7.l.F7. J, 2F7.Z.F4o l,Fa. 2,1 J 1 444 IFIIIIII.fO.HNNNNI GO TO 600
GO TO 11111 .00 ~ITEI6.6501 IFlOWNIINI.COZ1IINI,COZ21INI,COZJIINI.C02MCINI.
1 COZ41INI.GASFLOIINI. IN. IN • 1 • HNNNNI • 50 FORMATC1Hl.IIIC7F15.5.1511
U 111 RHIMN C C G"OlWT C GASIN C GASOUT C COZ C "COZ C 1( IDV C TOULK C
!ND
MOlECUlAR wEIGHT OF GAS 8EING A8S0R8ED GAS CONCENTRATION AT THE INlET GAS CONCENTRATION AT THE OUT lET GAS AftSOR8ED L8S C02/HR-FT_*2 P.p OF COZ. IAGE ACIO VOLUME REOUIRED TO NEUTRAlllE V CC OF SAMPlE TqTAL ALKALIHITY, GM MDL/LITER
C C
( C ( C
(
C ( C C C C (
C C C C C
c c c
c c c
SURROUTINF SOlFlOITEMPG,TEHPL,WATFlO,GMASS, 1 VOUT,GASOUT, IIIII,INDEXI
CAlCUlATES FLOW RATFS AND A8S0RPTION DATA FOR seZ-NAoH SYSTF~
-------------------------------------------------------------DIMF.NSION FLOWNC50I,(OZlC501,C02Z150I,CDl'C501,GASFl~1501
COH"ON RI26,21,TIZ6,ZI,DP,G,DENS,WDEN,DMEG,TG,Al,TL, GCOl. lAI,COZIN,(02OUT,COZL8S,TGS,TLS,ALS,GSOZ,SOZIN,S020UT,SOZl8S, ZHOlDI1DO,401,ALNPPC,AlNPPS,AHUWAT,AHUSLN.nWAT,HW.H,AlNKR, JREXPTC,REXPTS,GHF,TRUEHC,TRUEHS,TRUEH,EAREA,TVOl,AKGSOZ,AKGCOZ, 4ANUKGS,AREAC,SPAREA.IPNCHC,IPNCHS,IPNCHR,IRITEC,IRITES,IAITER, 5NNNHN ,DSOLN,TK,AKR,GC
·SOZiM. SO 2 INTO COLUHN GRAH-HOLES 1 SEC. SOZOUT SO 2 OUT OF COLOMN GRAM-MOLES 1 SEC. SOZABS SO 2 ABSORBED IN COLUMN GRAM-HOLES 1 SEC. SOlLBS 50 2 ABSOR8EO IN COLUHN LBM/HR-FTetZ SOZING 50 2 INTO COLUHN FT*-3/HR SOZDTG SO 2 OUT OF COLUHN FT-_3/HR
RUD DATA
100 READC5,999IVA,VB,NAME,TEHP,TEMPll,TfHPLZ,IPP1,IPP2,VS,PS,FLOW, 1 GASV1,GASV2,IPP3,IPP4,VLA,VLB,INDEX
999 FOR"ATC2F5.Z,12,lX,3F5.Z.ZIZ.FT.2,F4.Z,FT.2,ZF6.3,ll,12,lX.ZF6.Z, 1121
CALCULATE GAS fLOW
GMOU'T • 640 DUO. 1.5 IFClNDEX.EQ.lIDIAD-Z.O TE"'L - CTEMPU • TE"PL2112 • TE .... G·TEHP pp. FLOATCIPPll • FLOATCIPP21/64.0-FLDATCIPP31-FLOATCIPP41/64. CALL ORIFISCDIAO, TEMP,TEHPL, pp, PS, GASV1, GASV2,
lG"OLWT. INDEX. WHN, GHASS. GASIN. GASOUT,PN.TA8S,SP,y, P' S(F".C WH Nto 359. '/(29.-60.1 GASFLOCIIIIII·G"ASS GS02 • GMASS
CALCULAT~ AMOUNT A8S0RBED
AHOAMT-l./9. ANOAMI·VS*ANORHT*O.l VOLI 1 N_CVA*ANDRMI-VLA-ANORMT', 10. SOZIN.(VOLI IN.O.D3Z03tFLOW*0. 165*()O.48,.63,/(64.-62.4t 3 600. ~ VOlIOT.CVB*ANDRHI-VLB-ANOR"T'/10. ~
CO
C
S~lnuT·S~1,~·ynL,rT/YOL',N sn2A~S·S~20UT-S~ll~ snllP\.\nlAnS·~4.·)bO~./14S3.b·C.lbSI SOllhC·C~ASS·r.lb4qss·r.AsnUT/IY·I~~.1 SOlnTC.S01INC.SOZLBS'0.I64q5'3Sq.'TABS'14.~qhI164.'49Z.*SPI vnuT.Sr2~T~/ISOZOTC.ISOZINC'II.-CASOUT'100.I/ICASOUT'10n."I·IO~. C0211111111 • SOlABS COZ21111111 • S02lBS COZ'IIIIIII • VOUT FLOM~IIII'II.FLCW/ISORTI1.011 '6.8/6.1Z6011*1.011 WAT'LO - 'lOWNIIIIIII
C 'IIINT OUT SECTION C
C
C
C
l'IIIIIT~S.~O.~1 CO TO 111 GO TO ZU
III WRITFI6,lol PN, H~, WHN, SCFM, TE~P, CHASS, PS, 11111, lTF.~L,Jlnw,r.ASV1,GASV2,VnuT,VLA,VLB ,OIAn ~SVI • lCln. - veUT
10 Fn'"ATI1H ,2'1.3,SFI.1, 13,F9.1,IF8.Z,F3.11 IIZ IFCI'NCHSeEo.OI GO TO 333
GO Tn "4 ,n cnNTI NUI! ~1'~IT,.nI' T!MPG,'P,TEMPl,FlO~Nltlllll,r."AS\,VOUT,GASOUT.
unZl"S ,11111 401 FOII~ATCF'.l,FT.4,FS.1,F10.1,FT.l,14X,ZFT.Z,4X, F8.Z,I]1
444 l'ClIIII.FQ.NNNNN' GO TG 600
GO TO 11111 600 WRITfC~,6501 CFLOWNCINI,COZ1CINI,COZZIINI,COZ3CINI.
1 GASflOClNl, IN, IN. , , MNNNNI .50 FOIIMATI1H',IIIISEZo.S,ISII
nlll .!TUCtN C
IND
C
C C C C
c c c C c c c C C C C C C C C C C C C C C C C C C C
( (
C (
C
SUBROUTINE REACTN IN,KKKKK,GSI
CALCUlATES EFFECTIVE INTERFACIAl AREA OF ~ASS TRA~SFE~
-------------------------COMMON RIZ6,ZI,TIZ6,2I,DP,G,DENS,WDfN,DMEG,TG,Al,Tl, CCOZ,
lAI,:OZIN,COZOUT,COZlBS,TGS,TLS,ALS,GSOZ,SOZIN,SOZOUT,S02lBS, ZHOLDIIOO,401,ALNPPC,ALNPPS,AHUWAT,AHUSLN,O~AT,HW,H,ALN<R, ]REXPTC,REXPTS,GHF,TRUEHC,TRUEHS,TRUEH,EAREA,TVOl,AKGS02,AKGC02, 4ANUKGS,AREAC,SPAREA,IPNCHC,IPNCHS,IPNCHR,I~ITEC,IRITES.IRITER, 'NIINNN ,DSOLN,TK.AKR,GC
Tl TEMPERATURE OEG. C. TK TEMPERATURE DEG. K. AI IONIC STRENGTH F CONCENTRATION OF SOLUTION IN FORHALITY AHUSlN VISCOSITY OF NAOH SOLUTION C.P. DWAT DIFFUSIVITY OF CARBON DIOXIDE IN WATER ICM*-Z 1 SEC.I·10'" DWAT. OIFFUSIVITY OF CARBON DIOXIDE IN NAlH ICH"Z 1 SE:,'·lo·e5 AKR REACTION VELOCITY CONSTANT, LITERS/IGM-MOLE-SEC.I ALNKR LOG IAKRI AKLR LIQUID MASS TRANSFER COEFF WITH REACTION,CH/SEC AKG'S GAS ~ASS TRANSFER COEFFICIENT,GM-MOL/SEC ATH CM"] HHW RATIO OF H TO HW HW HENRY'S LAW CONSTANT FOR WATER G-MDLES/L-ATMOS. H HENRY'S LAW CONSTANT FOR NAOH G-HOLES/L-ATMOS. CSTR EQUILIBRIUM CONCENTRATION G-HOLES/CC. R RATE OF ABSORBTION G-MOLES/ISEC. CM*aZI REXPTL EXPERIMENTAL RATE OF ABSORBTION GH.-MDLES CO Z 1 SEC. TRUEH TRUE BED HEIGHT FT. TVOL TRUE BEO VOLUHE CHea] AREAC EFFECTIVE INTERFACIAL AREAtCH"Z/CH.a] SPAREA SPECIFIC AREA CM'*2 1 CM"3 ~F MINUMUH FLUIOllATION VELOCITY LBH./IHR.-FT*eZI PPC02 CO 2 PRESENT EXPRESSED AS A PERCENT AGE
0IAP-0.75 F HUST BE LESS THAN 8. CANNOT HANOLE MORE THAN 100 SETS OF DATA WITHOUT CHANGING DIMENSION
(ALCULATE LOG-MEAN DRIVING FORCE
ALNPPC_CC02I~e020UTI/ALOGIC02IN/C020UTI '0.01 ALNPPS_IS02IN-SOZOUTI/ALOGIS02IN/S020UTI .0.01 TGK-TG+Z13.1]
C C CALCULATE VISCOSITY OF THE SOLUTION C
TT-TL-80435 ANUWAT_IOD./IZ.148Ze CTT+SQRTIB078.4+TT'.ZII-1ZO.1 F-U lFIF.GT.~1 GD TO 10
l>I
..j:::"
\0
C
C C C
C C C
c: C C
C C C
c c: c
C C C
C
IFIF.GT.l.1 GO TO lO
A"USl~.a"UWaTeICFeO.ll.l.OOI GO TO )t'
10 A"USl~·AMUWATel C IF -4.l e l.Obl5 .. l.lS' 20 A"USl~·AMUWATeIICF-l.,eO.S15'.1.S9' JO CONT IhUE
CAlCUlATf OIFFUSIVITY OF THf GAS IN SOLUTION
OVAT-ITL-10.,eO.0415S • 1.21b8 OSOLN·OWAT e IAMUWAT/AMUSLNl eeo.8S TIt-TL .l1).lJ
CAlCUlATE REACTION VELOCIT' CONSTANT
AlNIt~-lJ.bl~ - 1289S./TItI • o.llleAI AItR_10.eeALNItR
CAlCULATE SOLU8IlIT' OF COZ, IN THE SOLUTION
A-O.Ol • 110.Oll-0.011/10.1.ITL-1S.1 HHW·10.eel-10.094.0.0bl-AleAII .... 10. e.11 1 14O./TIt 1-50'1 H-HHveHW AltlR_SORTIOSOLNeAItReAI.O.OOOOII RElCPTC-COZl8SeO.lble4Slo b/ClbOO. e44.1 RElCPTS_S02LsseO.lbl.4SJ.b/ClbOO. eto4.1
CAlCUlATE SEO HF.IGHT
GM'.lsl0. e II0IAPle.I.'1 • 110 •• el-0.0000.' e Alli TRUfHC-n.~OOI'.II~C - GMFI/GMFI.IGMFe.1.21 TRUfHS-0.0001,eICGS - GMFI/GMF,eIGMF •• 1.21 IF C TRUEHC • lT • O. 1 TRUEHC • O. II' C TRUF.HS • lT • O. 1 TRUEHS • O. TRUEHoCTRUEHC.TRUEHS IIZ. TlUJEH-nRUE..-'.5 .S.SII1Z. EAREA_10141belboeO.OS9eCClbo~112.I-TRUEHII12.
CAlCULATE INTERFACIAl AREA OF MASS TRANSFER
TVOl-O.lbS e TRUEH e 110.Ioseel' AItGCOZ-REXPTC/IAlNPPC.TVOl' AItGSOZ_~EXPTS/IAlNPPseTVOll ANUKGS·AItGsozeSQRTCO.16'/0.l'll AREAC_AItGcozeA~UItGS'IIANUItGS-AItGcoz,eHeAItLR,el000. EAREA-E1REA/TVOl SPAREA.AREAC-EAREA
PRINT OUT SECTION
IFCIRITER.NE_OI GO TO Sl
C
C C C
c c c
'f
Sb WRITElb,50IAL,CC,TRUEHC,AI,AKR,H,REXPTC,SPARFA
WRITEI6,50IAlS,CS,TRUEHS,REXPTS,ALNPPC,ALNPPS,AKLR, lAKC:Ol,AK~SOZ,ANUKGS,AREAC
HOlO EVERYTHING
51 HOlOIN,lI-Tl HOLOIN,Z'-TG HOlOCN,l'-OSOLN HOlOCN,41-0WAT HOlOCN,51·AMUSlN HOLOCN,6'-AMUWAT HOlOCN,71-HHW HOlOCN,8'-HW HOlOIN,9'-TRUEH HOLOCN,101 • SPAREA HOlOIN,lll • EAREA HOlOCN,121 - Al HOLOCN,lll - AKeCOZ HOlOIN,14' • AKGS02 HOlOCN,15' • ANUltGS HOlOCN,161 • AREAC HOlOCN,lll • GMF HOlOCN,181 • TRUEHC HOlOCN,191 • TRUEHS HalOCN,ZOI • REXPTC HOlOCN,211 • REXPTS HDlDCN,2Z1 • Al HOlDCN,Z31 • AKR HalOCN,2101 - H HOlDCN,251 • GC HDlDCN,261 • GS HEllOCN,211 - DIAP HJlDCN,281 • AlNPPC HOlOCN,l91 - AlNPPS HDLOIN,lOI • AKLR HOlOIN,lll • TlS HOlOCN,l21 • TGS HOLDIN,3l1 • COZIN HOlOCN,llol • C020UT HEllDCN,l5' • SOZIN HDlOCN,361 • S020UT
50 FORNATC8E12_31
RElURN END
l> 1
U1 o
C
C C C C
C
c
c C
sua~~UTI~F FINDCDIRr,w,coeF,
ITF.0ATFS Fnp cnFFFICI~NT OF DISCHARG~
OIMf~SION wC26,ZI
C 0,.0111 ,. IIC16,21 ,Tl21>,2' ,,,p,G,"ENS,WOFN,O!olFG,TG,AL,Tl, GC02, lAI ,:02 IN,coznUT,C02l8S,TGS,TLS,ALS,GSn2,502IN,S02r.UT, S02LOS, 2HOLl)llnn,4~I,ALNPPC,ALNPPS,AMUW~T,AMUSLN,!)WAT,HW,H,ALNKR, 1.f.~TC,.F.DT5,GHF,TPU~HC,TRUEHS,TRUEH,EAA~A,TVOL,AKGSO2,AKGC02, U'C\JI\C.S ,ue AC, SPARfA, IPNCI4C ,1 P-.CHS, IP'CCHR, 1 R IlEC, IR ilES, IR IlER, 51NN~to ,nS[\L"I,TK,AKR,GC •.
01'1 ZC'/\ L-,,al !lFII".WIL,lI-RE l'COFRFIZOO,lCO,300
ZO/'l C ONT 1 ~U" lCO l'Cl.GT.11 GO TO 500
r"··wCL.l,ll-WCl,ll COEf o CCWIL.l.21-WCL,211/0FFRI*CRE-Wll,lll.WCL,ZI no T('I 600
500 Of FR 0 WIL,ll - Wll-l,11 cnfF o ICWCL,21-WIL-l,211/0FFRI·CPE-WCl,III.NCL,21
600 CONT 1 NUF.
IIfTURN fit 0
SUBRnUTINE nRIFISIOIAO, TE~P,TFHPl, pp, PS, GASV1, GASV2, \G~OlwT, INDEX, WHN, GHASS, GASIN, GASOUT,PN,TABS,SP,Y,PI
COHHON RI26,2I,TI2b,2I,OP,G,DENS,WDEN,O~EG,TG,Al,Tl, G:02, lAI,C021N,C020UT,C02lBS,TGS,TlS,AlS,GS02,S021N,S020UT,S02l8S, 2HJlDCIOO,40"ALNPPC,ALNPPS,AHUWAT,4HUSLN,~WAT,HW,H,Al~KR, 3REXPTC,REXPTS,GMF,TRUEHC,TRUEHS,TRUEH,EAREA,TVOL,AKGSD2,AKGC02, 4ANUKGS,ARFAC,SPAPEA,IPNCHC,IPNCHS,IPNCHR,IRITEC,IRITES,IRITER, 5NNNNN ,DSOLN,TK,AKR,GC
C VISC VISCOSITY OF GAS AT TEMP. CENTIPOISES C SP PRESSURE JF THE MIXTURE,STATIC + ATMOSPHERIC,PSIA C V SP. NT. OF GAS AT TEMP AND sp, L8S PER CU FT C VA SP. NT. OF DRY AIR AT TEMP, L8S PER CU FT C YS SP. NT. OF WATE~ VAPOUR AT TEHP AND SP,L8S PER CU FT C PD ORIFICE OIFFERENTIAl, HH OF MANOHETER FLUID C HMN ORIFICE DIFFERENTIAL ON INCLINEO SCAlE, INCHES C HW PRESSURE DIFFERENTIAl ACROSS ORIFICE.INCHES WATER AT 68 F
c
500 8ETA-DIAO/DP FA-l. F-I./CSQRTC1.-8ETA •• 4" W8TP-TFHP Pl-8.965-2260./CN8TP+273.,' P-10 ••• PL PT-CP.14.69,/760. TE""-C TEMP*9./5.1.32. VISC-O.C0002864*TEMF+O.01619 TA8S-TEMF+460. SP-14.696.CPS/305.,*CDENS/NDEN'*C14.696/33.9, GASIN-100.-GASVl GASOUT-100.-GASV2 YA-CGASV1/100 •• Cl.-GASV1/100.,*CGMOlWT/29.".29 •• SP/CI0.73*TABS' YS-18.*SP/C10.73-TABS, Y-CYA*G*CCSP,-PTII/SP+YS*CPT/SPI PN-PP PO-PP*SINCOMEG.0.017431 HMN-PO HNaHMN*CDENS-Y,/62.3 CD-0.65
100 WH_C3S9.*CO*F*FA.DIAO**2.Cl.-CO.032/3.I.CHW/SPI"*S~RTCH~*YI RE_CWH*48."CO.00l672*3.14.DIAO*3600.*VISCI IFClNDEX.EQ.11 GO TO 666 CAll FINOCOCRE.T.COEFI GO TO 555
666 CAll FINDCDCRE,R.CDEFI 555 NHN_3590*COEF*F*DIAO.*2*FA*Cl.-CCO.032/3.I*CHW/CSPII,I*S~~TCHW*YI
IFCCNHN-NHI-O.Oll 400.400.450 "'50 CD-COEF
GO Ta 100 "'00 CONTINUE
GMASS - NHN* 1./0.164955 RElU RN
END l> 1
\.Jl
r.
(
(
S~~~OUTINF APRNTIIA,18,IC,ID,II,11
r.O~~~N AI2~,21,TI2~,21,OP,G,DfNS,WDFN,OM~G,Tr."l,Tl, GCOZ, IAI,:OlIN,COZOUT,C02l8S,TGS,TLS,tLS,GS02,SnZIN,snZOUT,SOZL~S, lHOLOIII~,4~"ALNPPC,ALNPPS,AMUWjT,~~USLN,nWAT,HW,H,ALNKA, 'Pf.PTC,P~.PTS,G_F,TAU~Hr.,TRUF.HS,T~\IFH,~AREA,TVOL,AKGSOZ,4KGC~Z, 4A~UCGS,APFAC,SPAPfA,IDNCHC,IPNCHS,IPNCHA,IAITEC,IRIT~S,IRITFR, ~HNNNN ,nSOLN,TK,AKR,GC
IIIIITI;'6,2' 2 enRMATIIHI,IIIIIIIIII'5x,'TA8LE IV INTERFACIAL ARfA DETERMINATION' II
1 FcrC. GT.n, WA!TE 16, 111 11 flR~ATIIH ,~OX,'IC~TINUEO'"
IF IIA.~Q.nl Gn Tn 6 IFII IA.GE.I'.ANO.II~.~Q.~'.A~O.IIA.FO.4" GO Tn 6 i'III~.GF.I'.AND.IIB.Gf.I'.AND.IIC.LF..4'.AND.118.fQ.4'1 GO Ta 19
1" ""ITI;'.,UI l' FnRMATI1H ,40X, 'EXPEAI"~NTAL DATA ICONTINUE~"
GO TO 10 6 W!tITrllo,!'1 , FOAMATI1H ,45x,
19 III • Il - 1 1'1111120. 25, '0
'EX'ERIMENTAL DATA'
20 WIIITFI6,211 JI FnR-" 1/2111C, 'A8S0llPTION OP CA' BON OIOXIDF IN SODIUM HYOA'XIO~ sn
!LUTlON' 1 lA • lA .. IF lIA. EQ. 4' GO Ta 40 GO TO )S
Z, "RITEI6,21o' 16 F~R~ATI/I'., 'AIORR'TION OP SULPHER DIO.IDE IN 2N ~ODIUM HYDPO.IDE
1 SOl. UTI(lN' 1 Il • III 01 l' 118.EQ.41 GO TO 40 GO TO "
JO ... 11FIIo,1I' n FOII"U CIze x,
lInN' 1 IC • 1 C 01
'EX'flll"ENTAL DATA ANO CALCULATEO IIESULT FOR ASSOR'T
l' IIC.fO.4' GO TO 40 " IIRIT[I",361 J. FOII~ATI 45X,'I" MOBILE 810 CONTACTOR'/lH ,4ftX, 'OP • 0.15 I~CHF.S'/I
GO Tn 60 40 Il!tITf 16,411 41 FOR~ATI 45x, 'IN FIXEO 8fD CONTACTOR'/lH ,4BX,'OP • 0.1' I~CH~S'/I
.00 Il • Il 01
.0 CONT 1 N IlE' II! • ID 0 1 IPII.LF..41 GO TO 9(\ IFII.Lf.81 GO TO 91 ""UFI.,9,. IIRITEI6,ZOI'IN,HOLOIN,lZI,HOLOIN,Z5I,HOLOlh,lll,HOLDIN,l51,
C
c
1 ~nL~I~,Z2.,HnLDIN,Z4I,HnL~I~,31,H~LDIN,~3"HnLD'N,IOI,N·IC,I~' Z03 FOP~~TI1H ,I,13x,IZ,F9.~,F6.~, ZFQ.Z,F7.Z,F9.4,F9.Z,F13.1,F10.31
GO Tf1 101 91' "q ITq ",94'
~~rTFI~,2f"IN,HOLCI~,lZI,HCLOIN,Z5I,HnLOI~,Z~I,HOLOIN,ZZI, 1 ~nlnlN,II,HOLOIN,ZI,H~L~I~,ZA"N·ID,IF,
Z~l FnR~ATI1H ,I,15X,I4,F12.1,F8.1,f13.4,F8.2,2Fl~.l,FlO.31 GD TO lOI
91 WIIITfl6,95' WRITEI6,ZC'211N,HOLDIN,lZI,HOLOIN,Z6I,HOLOIN,zi"HOLOIN,311,
1 HOl~HI,3ZI,HOLO'N,Z9"N.IO,ll! 1 20Z FOR"'AT IlH ,I,15I(,IIo,F 12. "FlO. l, E 13. 4,F 10.1, F 11. l, Fl5. 31
GO TO 1(11
93 FORMATl/,llX,' ~UN LIQUIO GAS KG KG " l'LIOUIO S~LU8IlITY OIFFUSIVITY R~ACTlnN 1NTFRFAr.rAL',·' Z/,lZx, '.n;~IJFR FLOW FLOW ICOZ' ISOZI', ')'CON::N VF.lnCITY "FA', 4/,49X,'~M-MOL/l',I~X,'lO**5', '6X, 'CONSTANT',l,lloX,' LBS/HD-FT+*Z GM-"OL/lSF.C ATM C~ •• 3",' 6 GM-MOLIL-ATM CM**21SEC L/GM-!OOL-SF.C C~It."21r.MU!l'/'
~ FORMATI/,15X,' RUN LIQUIO r,~S RATE OF LIOUIr. LI 10UI0 GAS lOG MEAN GAS' ,I,15X,' Nll"RF.A FLOW FLOW ABS 20RPTIOII (ONCN. TEM' TFMP C\lJNCENTRATH1~I', 3/I,15X,' lBS/HR-FT*1Z GM-~OL/SrC G~-MJL/L. C', 4' C , '/1
95 FOR"ATII,15X,' RUN L10UIO GAS RATF. OF L10lnn', l' GAS LOG MFAN GAS', 1,15'.,' NUfo!9 c P' FllW FLOW 2 ARSOR'TIO~ TEMP TF.~P CONr.~NTRATION', 3/1,15X,' LBS/HR-FT**Z GM-MOL/SEC C SC "/1
101 CONTI NUF IFlIIA.FO.41.ANO.II8.EO.CII GO T(I 91 IFllIA.FO.41.AND.IIB.EO.41.AND.lle.EOoOII GO TO 97 GO TO 96
97 ID .• 1 GO TO 98
96 ID 10 0 8 98 CONTINUE
RETURN ENO
l> 1
U1 1\)
SU~AnUTIN~ PAINTRIAN.9NI e~MM~N AI2b.21.TI26.21.0P.G.OëNS.W~~N,O"~G.TG,AL.TL, Ge02. lAI,:071~.C"20UT.e~lLPS.TGS.TLS.ALS,GS02.~n.2IN.S02~UT_Sa2LBS. 2H~Lnll~·.401.ALNPPr..ALNoPS.A~UW~T.A"USLN.n~AT.Hw.H.ALN~P. 1P~.PTe.~F..PTS.r,vF.TRUeHC.TAUFHS.TAUEH.EAAEA.TVOL.AKGSn2,AK~cn2. 4AN~GS.A.FAC.SPAAEA.IPNCHC.IPNtHS.IPNCHP.IRITEC.I~ITES.1~ITeA. 'NHN~~ .OSOL~.TK.AKA.GC
lA D 0 Il • 0 IC • ~ 10 • 1 Il • ~ DO 7~~ IN • 1. 12 MDLOIIN.2dt • IOO.*HOLOIIN.281 MDlOIIN.291 • lOO.*HOlOIIN.291
700 eONTINUF no 5 1 • 1.12
5 eAll APANTI1A.II.le.ID.II.11 SToP ~o
l> 1
\J1 lA>
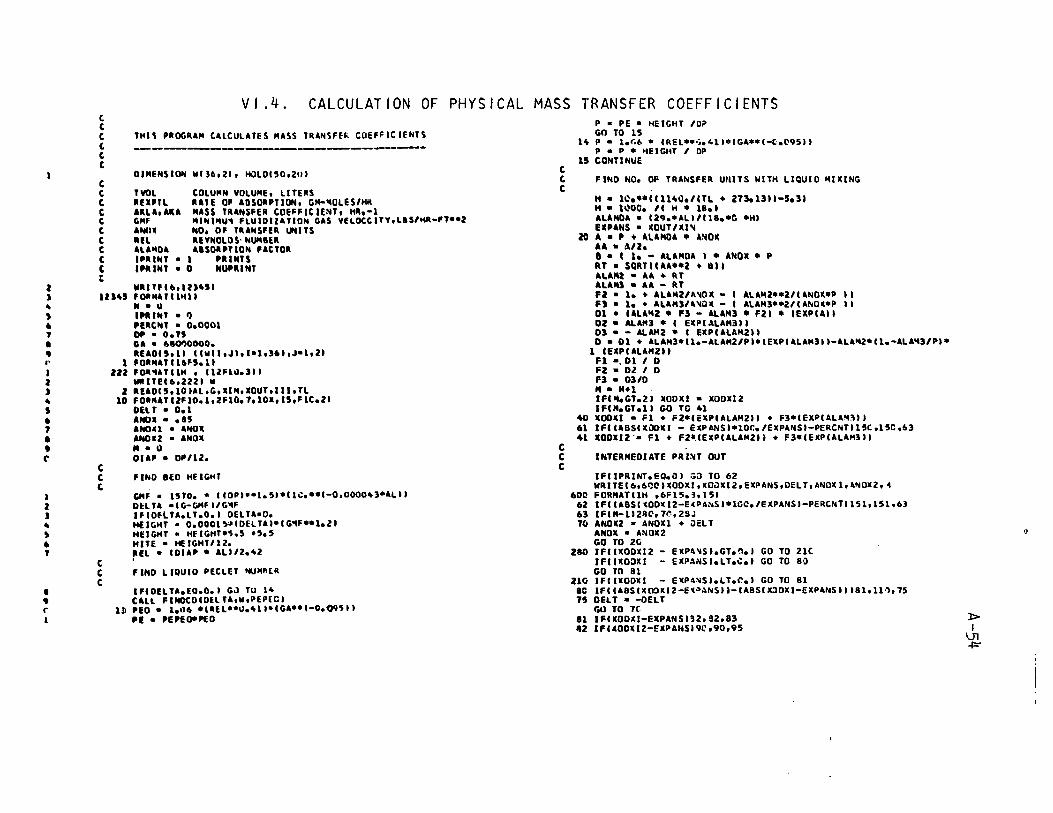
2 ) , , • , • • " 1 2 , , , • , • • ('
1 2 J 4 , • ,
• • r 1
VI .4. CALCULATION OF PHYSICAL MASS TRANSFER COEFFICIENTS t t C C C C
THIS '''DG.AM CAlCUlATE5 MA55 T.ANSFE~ COEFFICIENTS
--------------------------------------------------OIMEHSIOIII 11136.21. HOl0150.2ul
C C TVOL COLUMN VOLUME. LITERS C R!I'TL .ATE 0' AOSO.'TION. GM-~OLES'HK t AKLA.AKA "A55 T.ANSfER COEFF'C'E~T. 1411..-1 C 'MF MINI"U~ FLUIOIIATION GAS VfLOCCITY.lIS/~.-FTO*2 C A ... ,. NO. OF TUNSFER ~I T5 C REL REYNOLDS'NUMIER C ALA"O' 'ISO.'TION 'ACTO. C l'.INT • 1 '.INTS C ''''NT • 0 NU'RINT t
"'" Tf C'. '''451 lnU '0""""'''11
Il • U
C , ,
C , C
l'" INT • 1) '!!RCNT • 0.0001 OP - o." GA - 6IC1')()OOO. REAOI'.ll CIWII.J'.I-t.361.J·t.21
1 l'O"MAT 116".11 III FOII.~ATltH • CI2Fl~.311
MIIITI!C6.2221 W Z "EAOI,.101&l.G.XIH.XOUT.III.Tl
10 FO""ATI2Fl0.l.2fl0.,.10x.15.F1C.21 DEL' • 0.1 ANOI( •• IS ANOCl • ANOI( AttOU • ANOX Il • \) DU' - 0'"2.
flND 110 HEIGHT
GMF - 15TO. • IIOPI··l.51.ll~.··1-0.OOOO'3·'lll DtlT' ·CG-,"F"G~F IfIOFlTA.lT.O.1 DElTA·O. HIIGMT • 0.OOOl~~COElTAI·CG~F··I.21 HIIGHT • HfIGHT.~.5 .5.5 HITE • HEIGHT/12. ~El • lOIAP 0 All/2.42
FINO llOUIO 'EClET NUMRLR
l'CDELTa.EO.O.1 GJ TU 14 'All fINOCDIOElTA.W.PEP(CI
lli PEO • 1.1l6 .1.El··1l.411·IGA·ol-0.()q~1I '1 • 'EPEO*IIEO
C
P • PE • HEIGHT ID~
GO TO 15 l~ P • l.~6 * C.El •• ~.411.CGA •• C-t.V9511
P • P - HEIGHT 1 OP 15 CONTINUE
C FINO NO. OF TRAN5FER UrUTS WlTH UOUID MIXING C
C
H • 1~.o-IC11~Q./IlL + Z13.1311-,.31 H • l~OO. IC H - 1801 AlAMOA • Il9.oAll/ll8.-G -HI EIPANS • 10UT/II~
20 A • , + ALAMOA • ~~Ol AA • 6./Z. 8 • e 1. - AlAMOA 1 • ANal - P Rl • SORTleAA--Z + ~II ALA"i • AA • RT ALA"' • AA - RT FI. 1. + ALAMI/~~OI - 1 AlAM2 •• 2/IANO~.P Il F' • 1. + ALAM"'~û~ - 1 AlAM3.-2'IAhD~.P Il Dl • eALA~2 • F3 - ALAM3 • F21 • IEKPCAII 02. ALAM3 - C EI(PCAlAM311 03 • - &lAMl • C EI(PCAlAM211 o • Dl + AlAM3.Cl.-AlAM2/PI-CEx'CAlAM31'-AlA"2.ll.-AlA~3/PI.
l CEIPUlo\M211 Fl ., Dl 1 0 FZ • Dl 1 0 F3 • 03/0 ... 14+1 IFI~GT.21 10011 - 100112 IflM.GT.lI GO TO ~l
~O 1001(1 • Fl + F2-IEXPCAlAHZII + F3*IEXPIAlA~~11 61 IFIIABSIl(ool(1 - EXPAHSI*10C./EIPANSI-PERCNTI15C.15r..63 ~1 100XI2·. Fl + FZ*.IEIPUlAM211 + F3_IEXPCAlAH311
C INTERMEDIATE PRI~T OUT C
IFIJPRINT.EO.OI :;il TO 62 WRITEC6.6CCII(OOXI.xOilXI2.EXPANS.DElT.AND~1.'NO~2.4
60C FORMATllH .6F15.i.15, 62 IFleA8SI(OD(12-E(PA~SI*lCC./E~PAN51-PERCNTI151.l51.63 63 IFeM-lI2qO.7~.2S; 70 ANOI(2 • ANO~l + ilELT
ANOll • A~OX2 GO TO 2(;
zao IFleXOOXI2 - EXP'~SI.GT.~.I GO TO 2lC IFCII(O~XI - EKPANSI.lT.~.1 GO TO 8~ GO TO 81
Z10 IFCIXOO~I - E~PA~SI.lT.C.1 GD TO 81 ac IFI IABSI xœKl2-e"~ol.NSII-CABSI x::JDXI-EKPANS 11181.11,'. 75 l' OElT • -OELT
".0 TO 7e. Il IFI.ODCI-EIPANSI~2.S2.83 1> .2 IFUOOI(12-EIPAHSI9C ,90,95 1
lJl -1="
(}
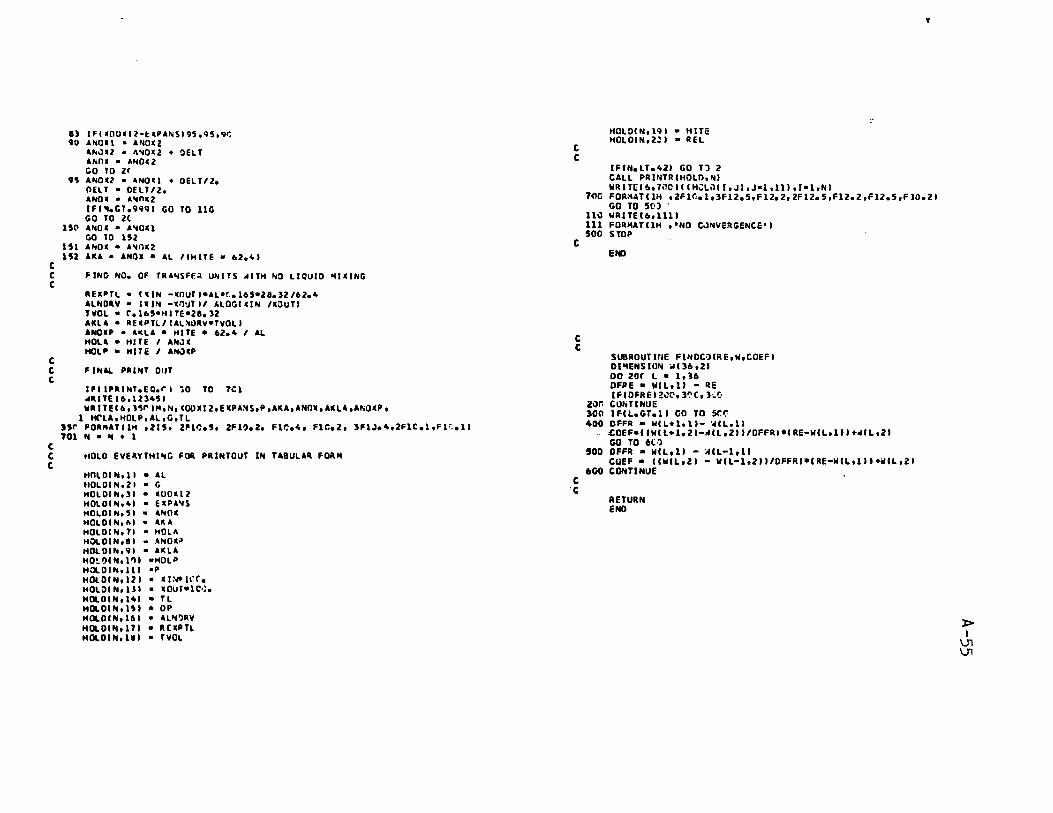
1 F leOOeI2-~ e' A~Ocl • ANoez Ahù_Z • A~O.Z • QElT ANoe • A~Oe2
GO Ta zr ANOe2 • AND nEU • OEll/2. ANO •• ,,~nez IFI'I.CT.9oi91 GO TO 110 GO TO Z( ANDe • A~Oel
GO TO 152 ANOC • AKA • ANDe * AL ""IT~ • ~~.~,
C C FING NO. OF TRA~SFF.~ UNITS 41TH NO llQUIO ~I.ING C
C
RE CP TL • I(IN -cOUTI.ALat.16'*Z8.3Z/6Z.4 AlNDRY • ICI~ -.~~"I 'lOGI.IN leauTI TVOl • r.l~'.HITe.Z8.32 AKlA • RECPTL/IAL~URY.TYOLI ANOCP • lKlA • HITE • 62.4 1 Al HOlA - HITE 1 ANJC HOlP • HITE , ANJCP
C FINAL PRINT DIIT C
C
IFIIPRIHT.EQ.rl ~O TO l~l .. RITEI6.U34" WRIT!I6.1~rIM.N.(OO.rZ,E.PA~S,P,AKA,ANO.,AKLA,ANa(p,
1 HrLA,HOLP,AL,G,TL "r FORMATelH ,Z15. Zl'l<:." 2Fl').2, Fll:.4, FIC.2, 3F1J.4,2F1C.l.FF .• 1I 701 N • ~ • 1
C .IOLD EYE"Y'HI .. G FDA PRINTOUT IN Tl8ULU FORM C
ttOLDI N.I 1 - AL "OlOIN.21 • Ci HOLDIN.31 • CUOCIZ HOlDIN.41 • ECPA~S HOlOIN,51 • ANO. HOLOeN."1 • AII.A HOLOIN,TI • HalA H~DIN,81 - ._Noe" HOLOIN,91 - AKLA HOtQIN.I~1 -HOL" H(]LOlfC,IlI .p HClOIN,IlI ... ~·Ifr. HOlQlfC,UI • cour-le·;. HO&.OlN,141 • TL HO&.OIN.151 • OP HOLOIN,I61 • 'LN~RY HO&.OIN,171 - IUePTL HO&.OIN.111 • TYOL
C C
C
c C
C 'C
lnC
llll III 500
SUDROUTUIE FINOC"IRE,w,COEFI 01~ENS10N ~136,21 002'lr L • 1.36 OFPE • NIL,ll - RE lFIOFReI2~~,3~(,l~~
201': CONTINUE JOa rFIL.GT.11 CO TO sr.~ 400 DFFR - wIL.l.l,- ~el.ll
~OEF·'lweL.l,21-~eL,211/DFFRI·eRE-wIL,III.~eL,21 GO TD 6(·')
50D OFFR * NIL,II - ~IL-l,ll COEF. IlwlL,ll - wIL-l,211/0FFRl a IRE-WIL,III •• ll,21
600 CQt.lTlNUE
RETURN END
'f
l> 1
U1 U1

e
S\JlIPO"Tllle PRINTitIHOLOol' OI~~NSI~~ HOLOI50,ZO'
ID • 1 HI • 0
11 wIIITfI~,l' 1 f~~M_TIIHI, """""""',2S.,'T_eLE V LIQUIO-SIOE ~~SS TRANSF
6f:A eoH' " IFICIE~T ~fTER~IN_TION',/45 •• 'FOR ~OKILë oeo CONTACTOR'," 113x.'E.peAI~E~TAL DATA AND CALCULATEO A~SUlTS FOR OESO~PTION ~F CA
lAKO;IUIOIlIOE FPU~ .. AT~R'/I IFINI.tO.O' GO TO 3 WRl!flb,ZI
Z FD~MATIIH ,~O •• 'leONTINUEOI'", l WltlTElb,41 .. FDA~ATIIH ,101l,'RUN LIOUIO GAS LIOUIO',Q(,' T~ANSFèR
1 UNlfS MASS TRANSFER HEIGHT aF','911,'NUMOER FLO~',
l' fLaw CIINCENTRATION CDEFFIC UNT T'IA'I
IoNSfER UNlTS',',ZOIl,'L G XIN xn'IT '. " K A'12X,'H'","11l,'10 •• Z' ,1111,'N' ,9X,'N',
61ZII,'L',1"1I,'OL','201l,'L6S/HR-FT •• Z ü"-~OL'L>'
Sllx,'OIl',RX,'OXP'.9X,'HR •• I-11 FT'," NI • NI • 1 lE • 10 • 10 IFIIII.CO.4, lE • lE - Z wRi HI b,5ICN.HOLOIN, 11 ,HOLOI N,Z' ,H(\lOW,ll' ,HOlOPI, n"
1 HflLOIN,5, ,HtlLOIN,.I' ,HOLO IN,6' ,HOlOI N,li, N-I u,l E'
III • In • 11 IfINI.EO.Io' GO TO 6 GO TO 11
, FnA~ATI1H ,11Z,Fl1.0,F9.0,ZF9.4,F9.3,Fl1.3,Flz.1,F14.3,"
. 6 WRITfI6,12~Io" 12110' fOMMA'll~lt
IIUIlAN !:ND
. "
1> 1
U1 11'\
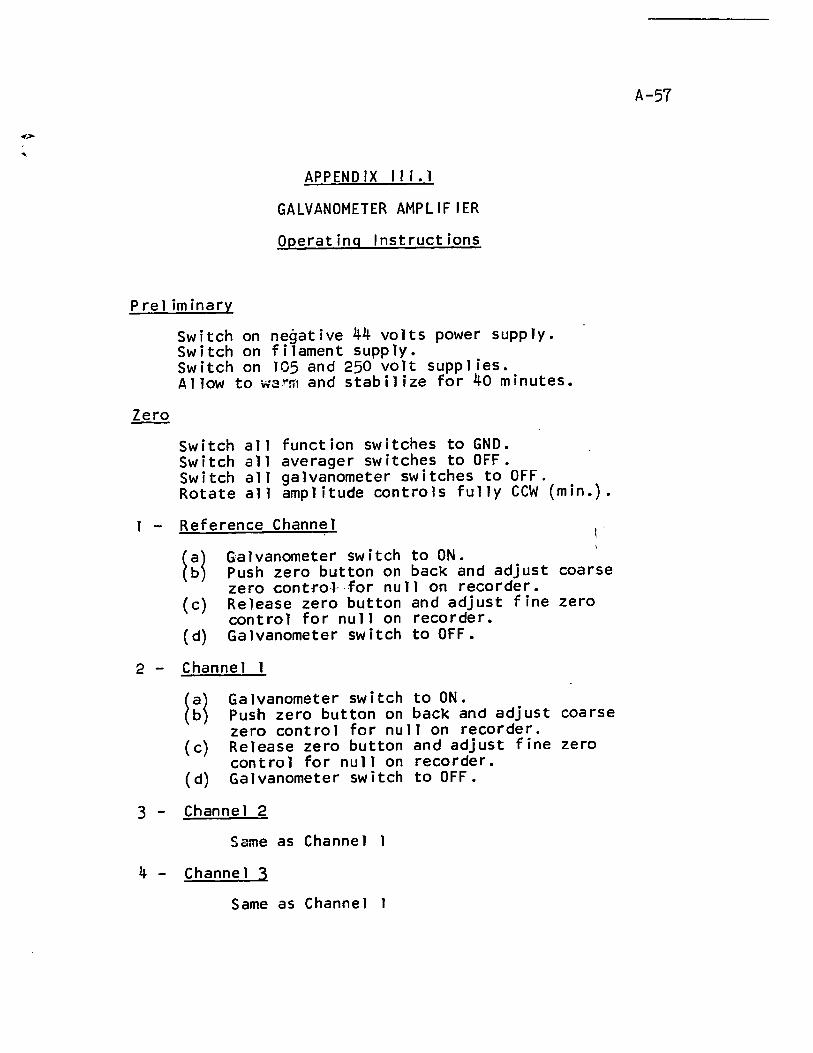
Pre 1 im inary
APPEND IX Il 1. 1
GALVANOMETER AMPLIFIER
Operating Instructions
Switch on negative 44 volts power supply. Switch on filament supply. Switch on 105 and 250 volt supplies. A llow to wal"!i'I and stab il i ze for 40 minutes.
Switch aIl function switches to GND. Switch aIl averager switches to OFF. Switch aIl galvanometer switches to OFF. Rotate aIl amplitude controls fully CCW (min.).
1 - Reference Channel 1·
( c)
( d)
Galvanometer switch to ON. Push zero button on back and adjust coarse zero control for null on recorder. Release zero button and adjust fine zero control for null on recorder. Galvanometer switch to OFF.
2 - Channel 1
( c)
( d)
Galvanometer switch to ON. Push zero button on back and adjust coarse zero control for null on recorder. Release zero button and adjust fine zero control for null on recorder. Galvanometer switch to OFF.
3 - Channe 1 2
Same as Channel 1
4 - Channel 3
Same as Channel 1
A-57
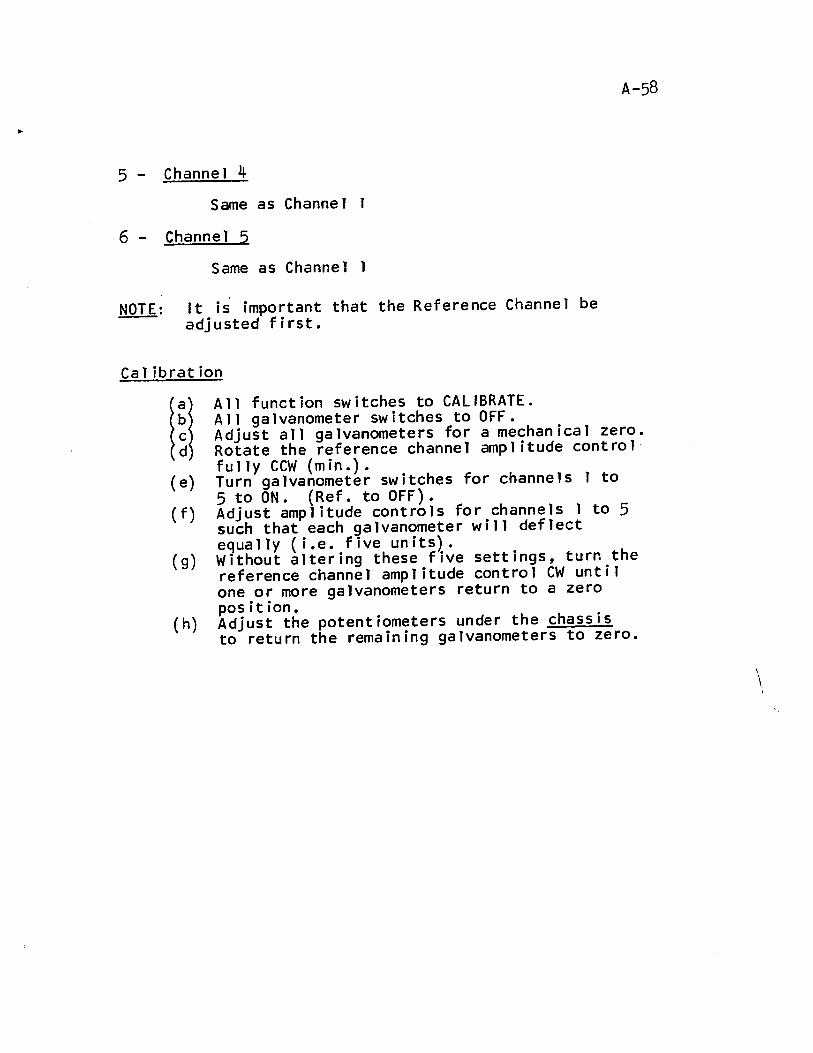
A-58
5 - Channel 4
Same as Channel 1
6 - Channel 5
Same as Channel 1
NOTE: It is important that the Reference Channel be adjusted first.
Ca 1 ibrat ion
( e)
( f)
( g)
(h)
AIl function switches to CALIBRATE. AlI galvanometer switches to OFF. Adjust aIl galvanometers for a mechanical zero. Rotate the reference channel ampl itude controlfully CCW (min.). Turn galvanometer switches for channels 1 to 5 to ON. (Ref. to OFF). Adjust amplitude controls for channels 1 to 5 such that each galvanometer will deflect equally (i.e. f ive un its) . Without altering these five settings, turn the reference channel amplitude control CW until one or more galvanometers return to a zero position. Adjust the potentiometers under the chassis to return the remaining galvanometers to zero.
\
\
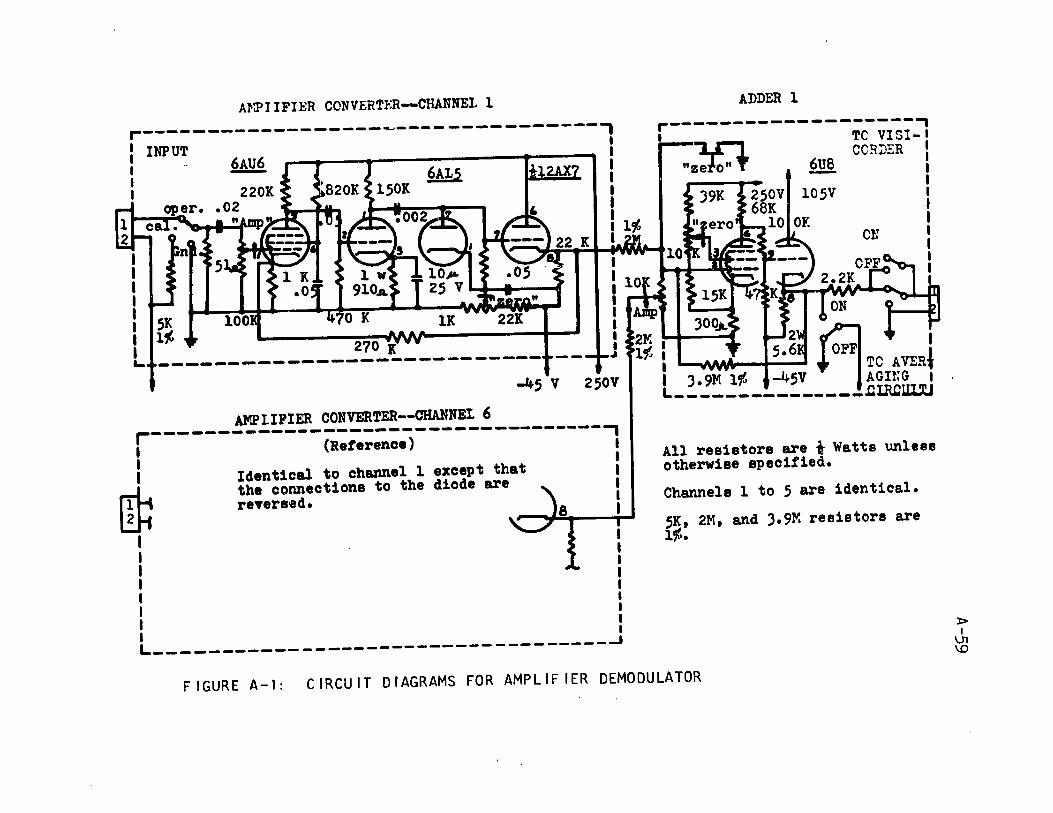
Al-'PIIFIBR CONVERTl-:R-CHANNEl l
r------------------~---------------, 1 I~~ ,
: - 6AL5 i12AX7 1 1 6AU6 r Il 1 220K l IS20K l150K :
270 K ---------------------------
1 1 1 l~ 1
-45 v 2S0V
AMPLIFIER CONVERTER--CHANNEt 6
r-----------------------------------, 1 (Reference) 1
1 1
~ Identical to channel l except that the connections to the diode are reTersed.
! -1 1 1 1 1 1 L ___________________________________ J
ADDER l
r-------------------, 1 TC VISI-~ CeRnER
"ze.J.o" T ~
105V
Cl!
All resistors are i Watts unless otherwiee epecitied.
Channels l to 5 are ident1cal.
SK. 2M. and ).9~ res1store are l~.
FIGURE A-l: CIRCUIT DIAGRAMS FOR AMPLIFIER DEMODULATOR
l> 1
lJ1 \0
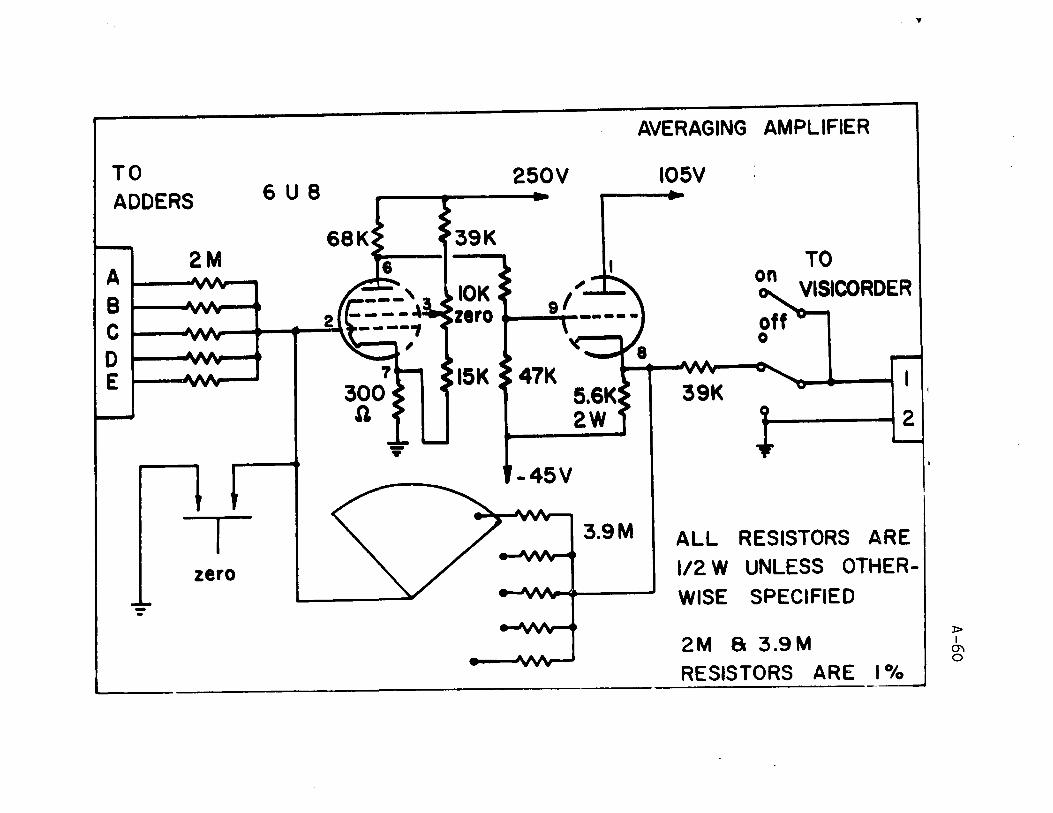
TO
ADDERS
~ 1 2M B :::J
6ua
g 1 ---tt---+.JJ
E 1 L\N\ --- '
-..
1 zero
--
250V
-45V
3.9M
AVERAGING AMPLIFIER
I05V
TO
VISlCORDER
t 12
ALL RESISTORS ARE
1/2 W UNLESS OTHER
WISE SPECIFIED
2M a 3.9M RESISTORS ARE 1 0/0
,.
l> 1
0'1 o
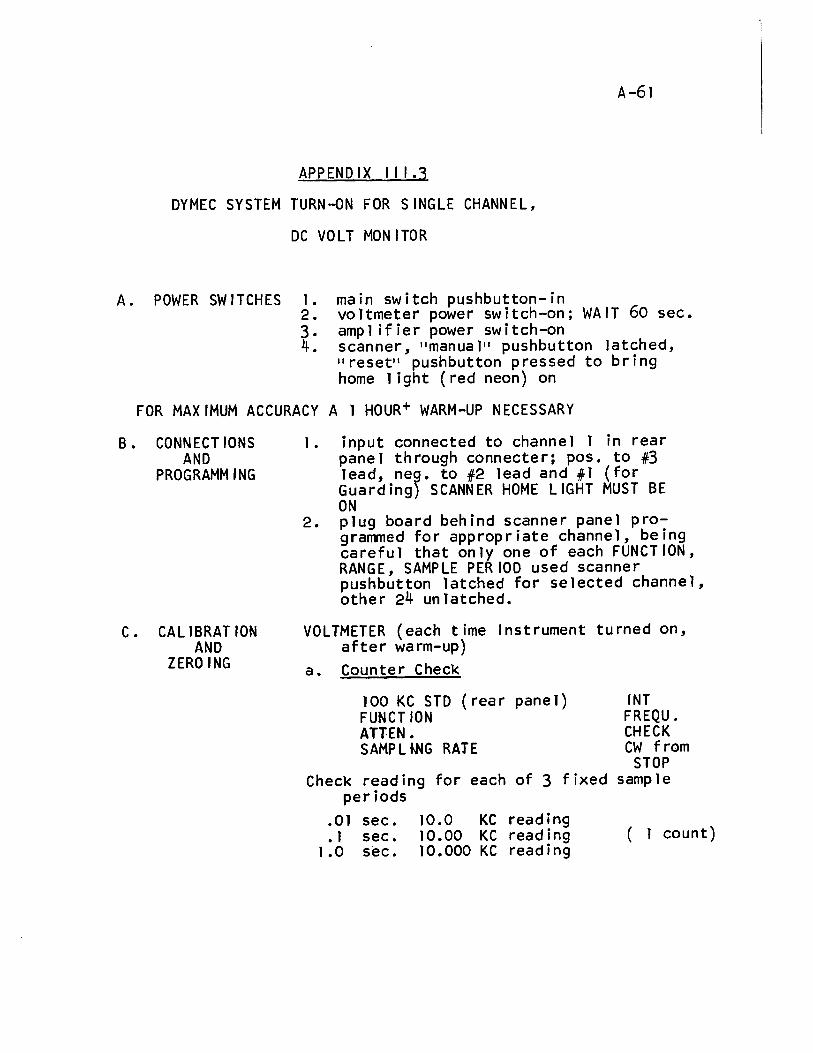
A.
A-61
APPEND IX 1 1 1.3
DYMEC SYSTEM TURN-DN FOR SINGLE CHANNEL,
DC VOLT MON ITOR
POWER SWITCHES 1. 2. 3. 4.
main switch pushbutton-in voltmeter power switch-on; WAIT 60 sec. ampl ifier power switch-on scanner, "manua 111 pushbutton latched, Il reset" pushbutton p ressed to br i ng home light (red neon) on
FOR MAXIMUM ACCURACY A 1 HOUR+ WARM-UP NECESSARY
B. CONN ECT IONS AND
PROGRAMMING
1. input connected to channel 1 in rear panel through connecter; pOSe to #3 lead, ne~. to #2 lead and #1 (for Guarding) SCANNER HOME LIGHT MUST BE ON
C. CALIBRATION AND
ZEROING
2. plug board behind scanner panel programmed for appropriate channel, being careful that only one of each FUNCTION, RANGE, SAMPLE PERIOD used scanner pushbutton latched for selected channel, other 24 unlatched.
VOLTMETER (each time Instrument turned on, after warm-up)
a. Counter Check
100 KC SrD (rear pane 1) INT FUNCr ION FREQU. ATTEN. CHECK SAMP L mG RATE CW from
STOP Check reading for each of 3 fixed sample
per iods .01 sec. 10.0 KC reading • 1 sec. 10.00 KC reading ( 1 count)
1.0 sec. 10.000 KC reading
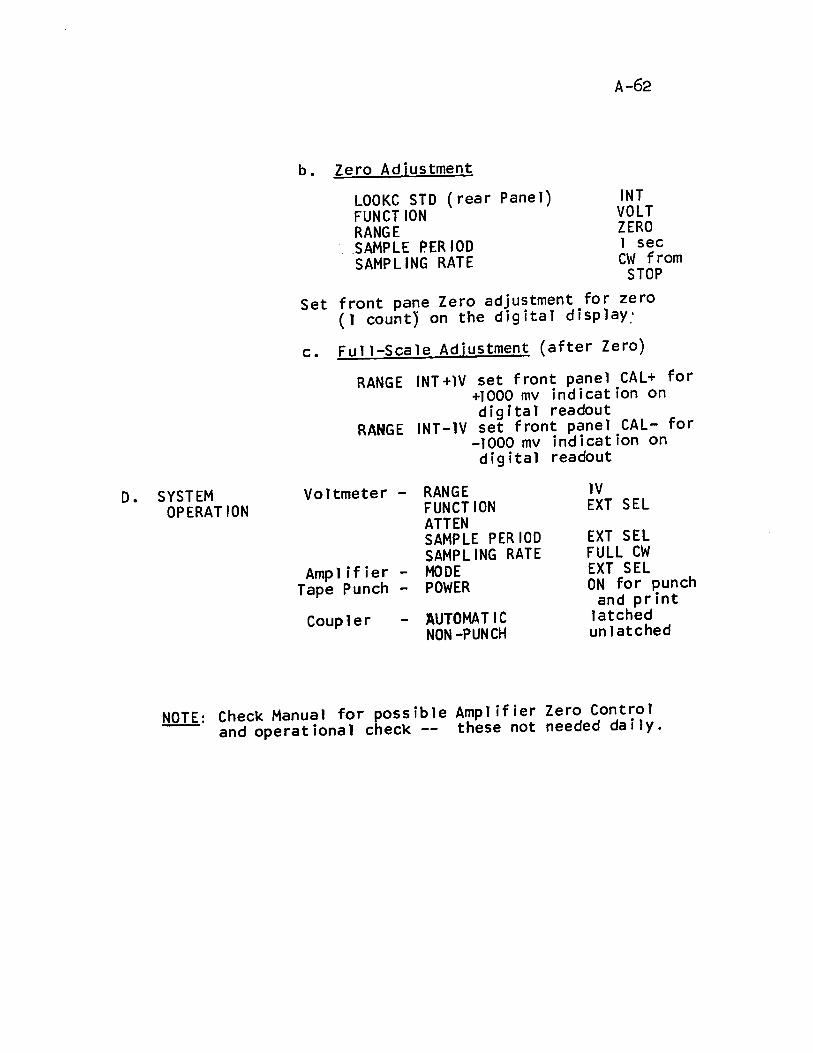
D. SYSTEM OPERATION
b. Zero Adjustment
LOOKC STD (rear Panel) FUNCTION RANGE
·SAMPLE ~ER 100 SAMPLING RATE
A-62
INT VOLT ZERO 1 sec CW from
STOP
Set front pane Zero adjustment for zero (1 countJ on the digital display:
c. Full-Scale Adiustment (after Zero)
RANGE INT+lV set front panel CAL+ for +1000 rnv indication on di g i ta 1 readout
RANGE INT-1V set front panel CAL- for -1000 rnv indication on digital readout
Voltmeter - RANGE FUNCTION ATTEN SAMPLE PERIOO SAMPLING RATE
Amplifier - MODE Tape Punch - POWER
Coupler - ~UTOMAT IC NON-PUNCH
lV EXT SEL
EXT SEL FULL CW EXT SEL ON for punch
and pr int latched unlatched
NOTE: Check Manual for possible Amplifier Zero Control and operational checK -- these not needed daily.

APPEND IX IV
EVALUATION OF PHYSICO-CHEMICA~PROPERTIES OF CARBON DIOXIDE - SODI~M HYDROXIDE SYSTEM
A-63
(a) Estimation of Diffusivity: The diffusivity of carbon
dioxide in the reacting system of interest here may be es
timated from the values of diffusivity which have been re
ported for a variety of non-reacting systems. The diffusion
coefficient was estimated from the equation:
(~ater 0.85
Dsolut ion = Dwater (A-l) tsolut ion
Equat ion (A-l) was developed by N igs ing et al. (155) for the
systems carbon dioxide-sodium sulphate and carbon dioxide
magnesium sulphate, and has been further verified indirectly
for the carbon dioxide-sodium hydroxide system. The diffus
ivity of carbon dioxide in water as an empirical function
of temperature has been given by Thomas and Adams (J56) as
Dw = 0.044 T L + 0.80 ( A -2)
(b) Estimation of Solubil ity of Carbon dioxide, H.
It is not possible to measure by conventional
analytical techniques the solubility of a gas in solutions
with which it reacts. However, it is possible to infer the
solubil ity of carbon dioxide in reacting solutions From the
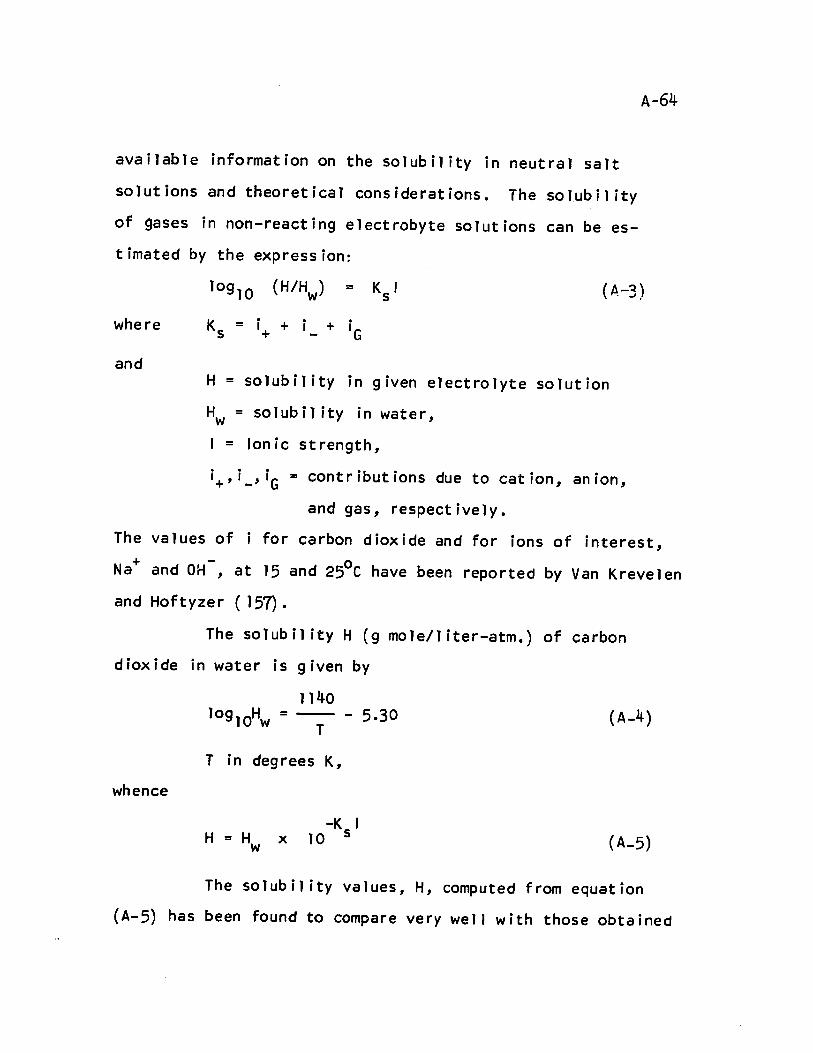
available information on the solubility in neutral salt
solutions and theoretical considerations. The solubility
of gases in non-reacting electrobyte solutions can be es
timated by the expression:
A-64
10910 = (A-3)
where
and
K = i + i + i G s + -
H = solubility in given electrolyte solution
Hw = solubil ity in water,
1 = lonic strength,
i ,i , iG = contributions due to cation, anion, + -
and gas, respectively.
The values of i for carbon dioxide and for ions of interest,
Na+ and OH , at 15 and 250 C have been reported by Van Krevelen
and Hoftyzer (157).
The soTubility H (g mole/liter-atm.) of carbon
dioxide in water is given by
whence
1140 10910H = ----- - 5.30 w T
T in degrees K,
-K 1 H = Hw x 10 s
(A-4 )
(A-5)
The solubility values, H, computed from equation
(A-5) has been found to compare very weIl with those obtained
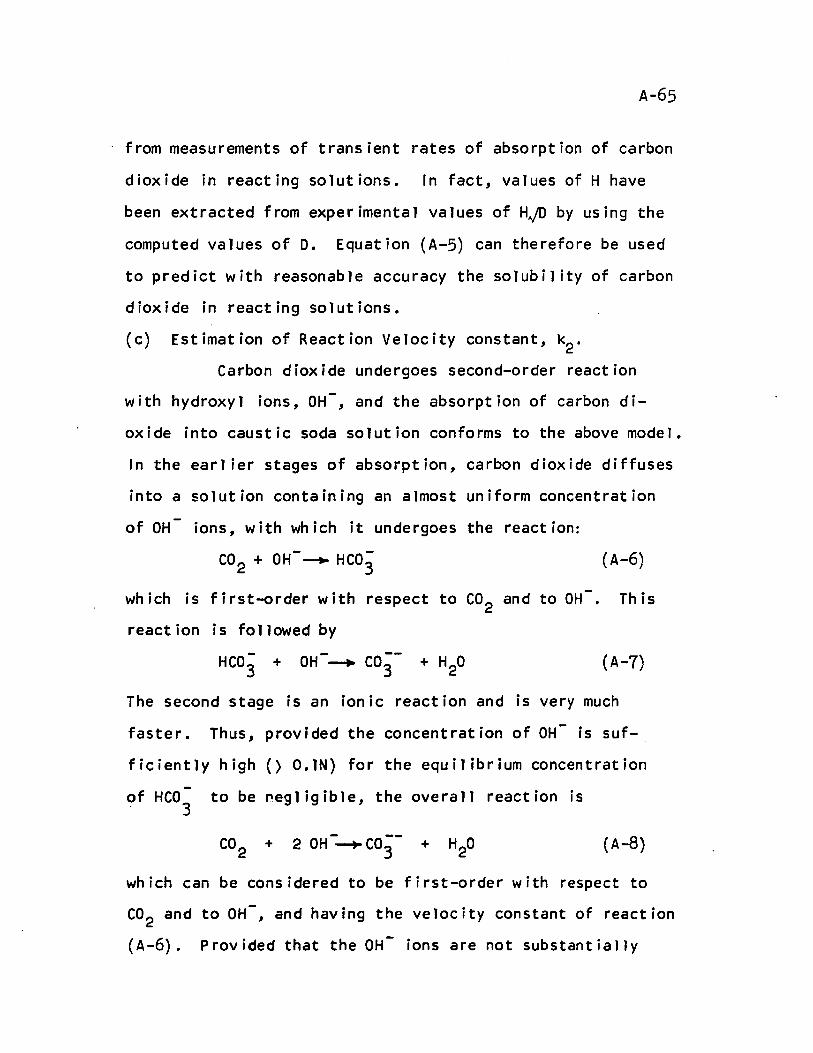
A-65
from measurements of transient rates of absorption of carbon
dioxide in reacting solutions. In fact, values of H have
been extracted from experimental values of HJD by using the
computed values of D. Equation (A-5) can therefore be used
to predict with reasonable accuracy the solubility of carbon
dioxide in reacting solutions.
(c) Estimation of Reaction Velocity constant, k2.
Carbon dioxide undergoes second-order reaction
with hydroxyl ions, OH-, and the absorption of carbon di
oxide into caustic soda solution conforms to the above modeJ.
ln the earl ier stages of absorption, carbon dioxide diffuses
into a solution containing an almost uniform concentration
of OH ions, with which it undergoes the reaction:
CO 2 + OH--+ HC03 (A-6)
which is first-order with respect to CO 2 and to OH-. This
reaction is followed by
(A-7)
The second stage is an ionic reaction and is very much
faster. Thus, provided the concentration of OH- is suf
ficiently high () O.lN) for the equilibrium concentration
of HC03
to be negligible, the overall reaction is
+ + (A-a)
which can be considered to be first-order with respect to
CO 2 and to OH-, and having the velocity constant of reaction
(A-6). Provided that the OH ions are not substantiaJJy
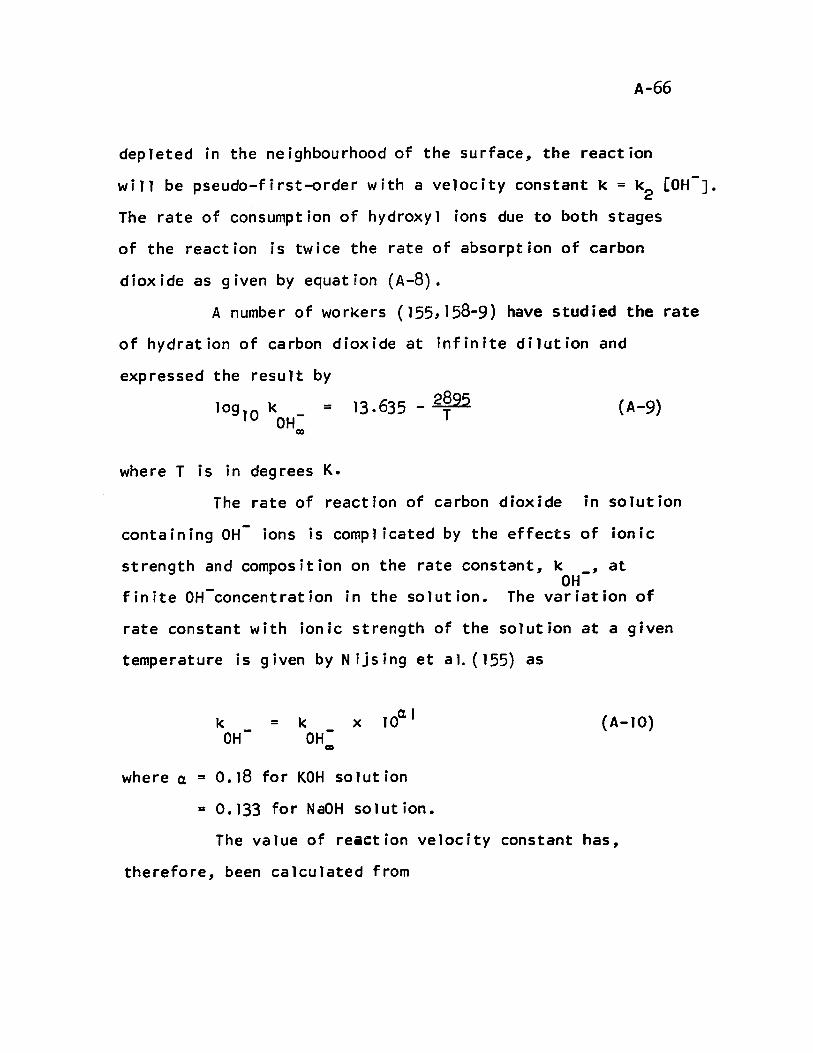
A-66
depleted in the neighbourhood of the surface, the reaction
will be pseudo-first-order with a velocity constant k = k2 [OH-J.
The rate of consumption of hydroxyl ions due to both stages
of the reaction is twice the rate of absorption of carbon
dioxide as given by equation (A-8).
A number of workers (155,158-9) have studied the rate
of hydration of carbon dioxide at infinite dilution and
expressed the result by
= 13.635 - 2~95 (A-9)
where T is in degrees K.
The rate of reaction of carbon dioxide in solution
containing OH- ions is compl icated by the effects of ionic
strength and composition on the rate constant, k _, at OH
finite OH-concentration in the solution. The variation of
rate constant with ionic strength of the solution at a given
temperature is 9 iven by N ijs ing et aL (155) as
k OH
= k x 100. 1 OH
CIl
where 0. = 0.18 for KOH solution
= 0.133 for NaOH solut ion.
(A-10)
The value of re~ction velocity constant has,
therefore, been calculated from
A-67
log k2 = log k -OH
= 13.635 - ~ + o. 133 1 (A-11) T
The app 1 i cab i 1 i ty of equat ion (A-11) has been discussed by
Roberts and Danckwerts (158) and Porter et al (61).
A-68
APPEND IX V
AXIAL DISPERSION AND TRANSFER FUNCTION ANALYSIS
The transfer function, F(s), for a 1 inear system gives
the response of the system to an impressed signal. If s is
expressed as a complex variable, iw, the real and imaginary
parts of F(s) can be written as:
F (s) - X + iY
whence ampl itude, A = 1 F(s)/ = (X2 + y2)O.S
and phase angle , ct> = tan- l y X
Bode diagrams (variation of amplitude and phase angle with
frequency of impressed signal, w) can be obta ined. One can
thus derive steady-state frequency response from the transient
response to a.pulse signal. By comparing the computed fre
quency response (from pulse testing data) with the frequency
response solution (Equation (3.22» to the diffusion Equation
(2.22) with finite-bed boundary conditions one can obtain re
sidence time, T, and Peclet number, P. This, however, does not
offer any advantage in data processing over direct trace
matching of the original pulse data. The type of frequency
response technique described above can be used to analyze two
po int concentrat ion-t ime data for. fin ite-bed boundary cond it ions
with a tracer input signal of any form, including a completely
random signa 1.
A-69
Transfer function analysis using a real, positive
value of s however provides a simpler data processing scheme.
The use of real, positive values of s in Equation (3.7) in
fact reduces the relative importance of the tail of the break
through curves in influencing the values of rand P. rt is,
however, important to realize that the use of a very large
value of_s has the effect of almost completely eliminating the
weighting of the data at large t becquse of exponential
decay factor e-st in Equation (3.7). Michelsen and Ostergaard
(l03) have shown that a value of the product, sr,between land
2 gives the most accurate results by this analysis. This range
of values has therefore been used in the present analysis of
data.
The details of the actual data processing are pre
sented next in three parts.
r. As moment analysis gives an approximate solution for the
case of infinite-bed boundary conditions, a program for moment
analysis was used to obtain rough estimates of T and P for each expe
rimental. (T~fs estimate for P and T was also used in debugging
the data processing by the more accurate transfer- function
analysis programs.)
r r. A series of values of s was defined using the initial esti
mates of r from moment analysis such that the product ST varied
between land 2. This series of values of s was used to obtain
corresponding experimental values of F{s) according to Equation
(3.7). The values of P and T for each run were then obtained

A-70
according to Equation (3.8) which is vaHd for infinite-bed
boundary conditions.
III. The values of rand P from the above were used as the
initial estimate in the application of transfer-function analysis
for finite-bed boundary conditions. This procedure was as
follows:
•
•
select a mean value of s from previous program,
vary P and r by + 20% in 20 steps each,
compute 400 values for F(s) for the finite-bed mode 1
from Equation (3.12) using the above single
value of s and the 400 sets of values of P and r.
compare these values.of F.(s) with th~51ngle
experlmenta1·value of F(s) for the same value of
s as computed from Equation (3.7), and retain
and aver~ge aIl those combinat ions of rand P
wh ich~et ·.'tf1.e. cr iterIon
\F(s)exptl. - F(s)calculated ~ 0.0001
•. ·repeat the above process for a second value of s,
and obtain the arithmetic mean of the two. The
values of rand P thus obtained are reported as
corrected residence time and peclet number in this
thesis.
Since HBC did not show very high liquid mixing,the mag
nitude of ·these correctionswas less than 5% of their values ob
tained by transfer-function analysis using infinite-bed boundary
cand i t ions.