Resolving ELT Challenges Through Critical Thinking Strategies

Atmospheric Dispersion Correction for ELT Instruments
T.G.Hawarden, E.Atad-Ettedgui, C.R.Cunningham, D.M.Henry & C.J.Norrie1
C.J.Dainty, N. Devaney & A. S. Goncharov2
1UKATC, Royal Observatory, Edinburgh, Scotland 2NUI, Galway, Irland
Abstract: The refractive index of the atmosphere varies with wavelength, giving rise to the well known effect of Atmospheric Dispersion. We examine this and its correction in the context of the very high angular resolution expected of AO-corrected ELTs. However, all refraction effects (such as seeing) are intrinsically chromatic and their full correction is evidently impossible with the purely reflective AO systems currently in use. We therefore also examine all such effects known to us, to determine whether they will significantly impair the performance of 50- and 100-m ELTs.
Keywords: Large Astronomical telescope, optical design, ADC, instrumentation, Adaptive Optics
1. INTRODUCTION
The terminology adopted in this paper follows Hardy1 (1998, section 9.3.3) with some additional clarifying labels. The main effects are summarized in the following:
1. Atmospheric Dispersion (AD), the variation of atmospheric refraction with wavelength and zenith distance, must be corrected to a small fraction of a percent. This is probably possible, but by no means easy, for near-diffraction-limited telescopes of ≤100m diameter, for λ >~500nm over moderate bandpasses (R=λ/∆λ~5), ~arcmin fields of view and zenith distances to >45°. We present outline designs for visible- and near-IR ADCs offering Strehl ratios around 80%.
2. Chromatic Error (or “Dispersive Seeing”, the chromatic analogue of “normal” seeing). This will not be a significant problem even for a 100m ELT unless the outer scale length of atmospheric turbulence (L0) is unusually large (of order 1000s of metres).
3. Dispersion Displacement Error (or “Dispersive Anisoplanatism”, a chromatic beam displacement analogous to anisoplanatism.) As light is dispersed by the atmosphere, the paths followed by different colours diverge. As a result correction by a deformable mirror in an adaptive optics system cannot be perfect, since it will not be in accurate positional registration with the wavefront at wavelengths other than that at which sensing is carried out, while the sensing does not apply to identical paths for different colours. Strong, high, turbulence layers in the atmosphere may confine observations needing very high Strehl ratios to limited ranges of zenith distances and/or limited wavelength ranges.
4. Diffractive effects of atmospheric turbulence must exist, but are unlikely to be of significance even for the largest ELTs.
2. ADCS DESIGNS FOR AN F/6 100M ELT (“OWL”)
Atmospheric properties matching Mauna Kea Observatory have been assumed. In all cases the results derived are applicable to most high-altitude (>2500m) sites.

2.1 Optical wavelengths
2.1.1 Designs for collimated beams
Figure 1: visible-band design for 100-m f/6 “OWL”: 3-glass design using plane surfaces in
collimator beam.
A number of designs for operation in a collimated beam have been generated. Good correlations have been obtained with triple, plane, Amici prisms. Since the prisms have only plane surfaces and are in a collimated beam, they contribute no additional aberrations.
An example employing a 500mm beam diameter (angular magnification of 100000/ 500 = 200) is illustrated (left). The design uses two identical triple Amici prisms, comprising three Ohara glasses – LAH80, S-LAH64 and S-BSM93.
Of these, one glass (S-LAH64) is designated a preferred glass type, whilst the others are special types. The tilt angles of the three surfaces (relative to the optical axis) are 2.430°, 1.380° and 13.469°. Prism centre thicknesses are 80mm, and the outer diameter is 500mm.
Figure 2: Spot diagrams for the design illustrated in Figure at 5 zenith distance values and several
wavebands. In-band image cores are close to diffraction-limited.
Figure 2 shows the resulting spot diagram (below) shows results for zenith distances (L to R) of 0°, 15°, 30°, 45° and 60°. The wave-length range is 0.365 – 1.65µm, and the zenith direction is up (i.e. atmos-pheric dispersion causes chromatic spreading in the verticallly). Near the zenith there is a small horizontal spreading of the light, orthogonal to the zenith direction, owing to the relatively large thickness of the prisms. This should be unimportant except perhaps for very broad-band spectroscopy.

The plot in figure 3, shows the residual (uncorrected) atmos-pheric dispersion as a function of wavelength for an R=5 bandpass with the prism rotation angle tuned for the operating wavelength. The dashed lines show λ/D for a 100m telescope. As can be seen, the residual dispersion is markedly smaller than the diffraction limit at all but the shortest wavelengths, and there is evidently considerable room for tradeoffs between atmos-pheric (zenith-directed) and parasitic (lateral) dispersions.
Figure 3: Residual atmospheric dispersion, for the design in Figure 2, as a function of wavelength. A
bandpass with R= λ/∆λ=5 is assumed, with the ADC tuned to the indicated wavelength
2.1.2 Designs for converging beams
Figure 4: visible-red design for 100m f/6 “OWL”: 3-glass design using curved prisms in
the converging beam.
The “standard” solution for atmospheric dispersion correction has so far been to use two prisms comprising two glass types; we have not achieved adequate performance from such designs. However a design using three glass types (illustrated below) shows promise for operation over a wavelength range of 0.5-1.8µm.
The prisms consist of wedges of Schott LLF6HT, Schott SF14 and Ohara S-TIM22 glass. Of these, SF14 and S-TIM22 are designated prefer-red glasses, whilst LLF6HT is a standard glass.
Distance from the rear of the prism group to the focal plane is ~2m. The prisms are ~700mm in diameter, with central thicknesses between 60 and 98mm. Surface tilts are between 1.3° and 13.3°.
As shown, these prisms have impractically small edge thicknesses on the narrow edge (approaching zero). This could be alleviated by moving the prisms further away from the focal plane, thus reducing the required amount of angular dispersion, and hence lowering the required prism angles.
Spot diagrams are shown below for the R, and J bands respectively, at ZDs (L to R) of 0, 15, 30, 45 and 60 degrees, and field angles corresponding to FOVs of 0, 1 and 2 arcmin. The image box size is 30 mas. Promising performance, probably approaching the diffraction limit, is apparent for ZDs of 45° or less and FOVs up to ~1 arcmin.

The residual atmospheric dispersion for tuned R=5 wavebands is well below the diffraction limit for λ≥550nm. Space therefore exists for tradeoffs between DC and image quality, ZD and field angle. This remains to be explored, as does aberration correction using the active optical capabilities of the telescope.
Figure 5: Spot diagrams for the design in 4 at several ZDs and field angles. Note promising performance for ZD ≤ 45°, FOV ≤ 1'.

2.1.3 Infrared wavelengths
Figure 6: ADC design for 100m f/6 “OWL” in the NIR, using wedged ZnS & ZnSe lenses in the converging
beam.
The design of ADCs is much more straightforward in the near-IR, since the amplitude of atmospheric dispersion is much reduced relative to the visible band. However the production of practical designs is constrained by the more limited range of lens and prism materials available and restrictive size limits on many of the preferred materials.
A satisfactory design employing two “prisms” comprising wedged ZnS and ZnSe lenses has been obtained, and is illustrated in Fig 7. The distance from the rear surface to the focal plane is 1.25m, a reasonable space for the accommodation of focal plane pickoff devices, etc. As indicated in the table in the figure, the NIR throughput is excellent. The performance of the conceptual design is illustrated by the spot diagrams.
Figure 7: Spot diagrams for the design in Figure 6, at zero and maximum zenith distance three field angles. This illustrates only the Z (1.0µm) band. (Performance is better at J,
H and K) Note that guiding must be done through the ADC since the images shift when tracking through different
Zenith angles: at 20, 40 and 60 degrees the image centroid shifts by 0.27, 0.61 and 1.25 arcsec, respectively, relative to the zenith position, and these shifts need to be corrected by the guider. A complication may therefore arise from the sizes of the components (540mm) which is larger than the 400mm maximum currently produced in the CLEARTRAN quality which offers visible+IR trans-mission. However if guiding can be carried out at IR wavelengths, standard FLIR quality ZnS and ZnSe can be used. This grade is available up in sizes up to 1.5m diameter.
The performance of the design is summarised in the Table 2. In each data box the rms ray envelope for on-axis (L) and maximally off-axis (R) images is given in milli-arcsec (mas).
Waveband
Diff Limit λ/D (mas)
z= 0o
mas z=20
o
mas z=40
o
mas z= 60
o
mas Z 2 2.47-3.17 2.47-3.17 2.47-3.58 2.60-4.40 J 2.5 2.27-3.07 2.27-3.07 2.27-3.07 2.27-3.93 H 3.3 2.0-3.0 2.0-3.0 2.0-3.0 4.1-5.3 K 4.2 3.6-4.6 3.6-4.6 3.6-4.6 5.5-8.3
Table 1. Performance of the design in Fig. 7, showing rms ray envelope sizes on-axis (L) and maximally off-axis (R) , in milli-arcsec (mas).
3. ADCS FOR AN F/13 50M TELESCOPE (= EURO50)
3.1 The Linear Atmospheric Dispersion Corrector in the Visible Band
The Euro50 2 uses an f/13 Aplanatic Gregorian (AG) design as a basic two-mirror system. For AO correction over a 1' FOV it is essential to provide at least 3' unvignetted full field for Laser Guide Star paths, so the minimum diameter of an ADC in the converging beam must be >1 m. The linear ADC, proposed by Beckers3 for the focal reducer and low dispersion spectrograph at two of the ESO 8m telescopes (Avila et al., 1997) has accordingly been chosen as a base line configuration.
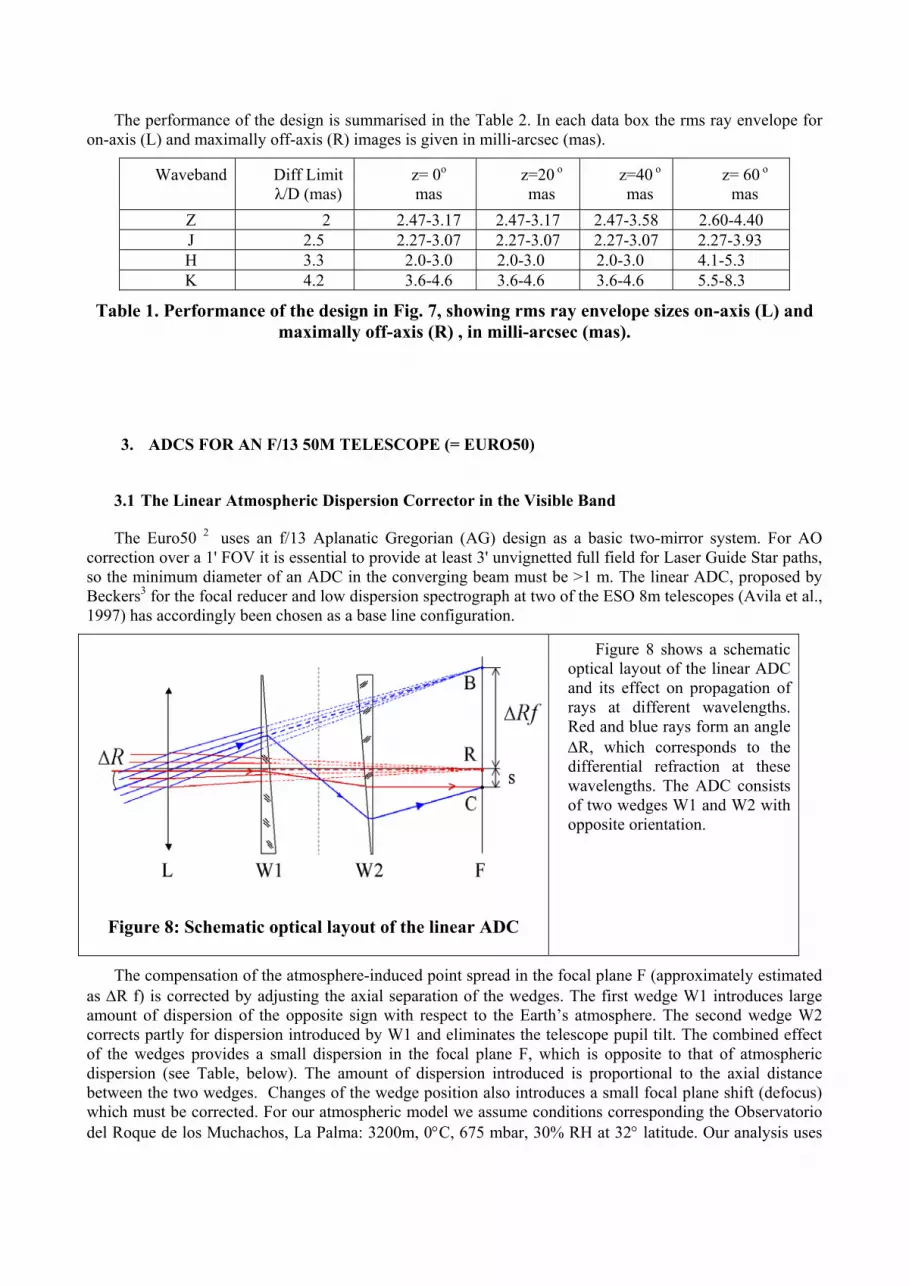
Figure 8: Schematic optical layout of the linear ADC
Figure 8 shows a schematic optical layout of the linear ADC and its effect on propagation of rays at different wavelengths. Red and blue rays form an angle ∆R, which corresponds to the differential refraction at these wavelengths. The ADC consists of two wedges W1 and W2 with opposite orientation.
The compensation of the atmosphere-induced point spread in the focal plane F (approximately estimated as ∆R f) is corrected by adjusting the axial separation of the wedges. The first wedge W1 introduces large amount of dispersion of the opposite sign with respect to the Earth’s atmosphere. The second wedge W2 corrects partly for dispersion introduced by W1 and eliminates the telescope pupil tilt. The combined effect of the wedges provides a small dispersion in the focal plane F, which is opposite to that of atmospheric dispersion (see Table, below). The amount of dispersion introduced is proportional to the axial distance between the two wedges. Changes of the wedge position also introduces a small focal plane shift (defocus) which must be corrected. For our atmospheric model we assume conditions corresponding the Observatorio del Roque de los Muchachos, La Palma: 3200m, 0°C, 675 mbar, 30% RH at 32° latitude. Our analysis uses

Zemax. A maximum zenith angle z=45° has been assumed. To illustrate the problem being addressed, we tabulate the Atmospheric Dispersion for zenith angle z=45° and the Airy Disk sizes.
An optical layout of the linear ADC in the Euro50 is presented in the figure below.
Band λ Range, (µm)
Atmospheric Dispersion ∆R (mas,
z=45°)
Airy Disk Radius rA Euro50 (mas)
Ratio ∆R/ rA
B 0.391 – 0.489 730 1.8 406 V 0.505 - 0.595 290 2.3 126 R 0.59 – 0.81 350 2.9 121 I 0.78 – 1.02 190 3.7 51 J 1.06 – 1.44 110 5.2 21 H 1.50 – 1.70 23 6.6 3.5 K 1.96 – 2.44 18 9.0 2
Table 2. Optical and near-IR photometric bands, comparing AD at 45° ZD with diffraction limits.
Figure 9: Linear ADC for the Euro50, showing range of motion of the first wedge, W1
Beam
WW WMotion
The main optical parameters of the proposed ADC design are presented in below. Schott flint glass F5 is used for both wedges. The internal transmission of F5 as a function of wavelength is shown. SF5 is particularly suited to correction in the R and I bands.
Material F5 (Schott catalog) Diameter 1.2 m Wedge angle 2 deg Wedge thickness 0.04 m (center) W1 motion range 0.01-3 m W2 (fixed) 2.95 m from AG
focus
Figure 10 Internal transmittance of flint glass F5 for a thickness of 25 mm.
Table 3 Optical design parameters for the linear ADC for Euro50.
0.5 1 1.5 2 0
0.2
0.4
0.6
0.8
1
K H J R I V B λ, µm
Since the secondary mirror in the AG system is a deformable mirror, one can use it for correcting spherical aberration, coma and astigmatism introduced by the ADC wedges An example of a look-up table for the telescope operation with the linear ADC at the V band is presented in Table 4 below. The coefficients corresponding to tilt, astigmatism and coma components are to be applied on the deformable secondary to compensate the aberrations caused by the linear ADC are listed. The RMS values of the Zernike coefficient

wedge separation, lateral and longitudinal shifts are listed in mm. Note that it is also possible to correct for the longitudinal image shift l by applying a defocus term at the deformable secondary mirror.
Angle z, deg
Z3 Z6 Z7 Wedge separation
Lateral image shift s
Longitudinal image shift l
45 0.10390 0.00039 0.00230 2575 56.7 -3.78 40 0.08717 0.00033 0.00193 2161 47.7 -3.17 30 0.06002 0.00023 0.00133 1488 33.3 -2.19 20 0.03785 0.00014 0.00084 938 21.5 -1.38 10 0.01836 0.00007 0.00044 454 11.3 -0.67 0 0.00000 0.00000 0.00000 1 1.4 0.00
Table 4: Secondary mirror deformation (RMS value) at different zenith angles z for image correction with the ADC in the V band.
After atmospheric dispersion correction the image quality at the AG focus is diffraction limited in the V band over a 0.5 arcmin field (intended for observations in the Single Conjugate AO mode) and, with the help of the deformable secondary mirror, nearly diffraction-limited over 1'. Nevertheless, excellent performance is achieved: Fig 11 shows spot diagrams for the J band.
3.2 AD correction in the NIR
Since AO correction in the visible is far more challenging than in the near IR, it is likely that ELTs will begin operations concentrating on the Z, J, H and K bands.. A better match of glass to atmospheric dispersion at these bands (especially H and K) may be needed if full correction is to be achieved, though the promising performance of the optical linear ADC in the J band is very encouraging. The secondary deformable mirror will be essential for correcting image aberrations such as coma and astigmatism. For fast converging beams, correction of spherical aberration caused by the linear ADC might be also needed. Ultimately the physical problems that arises when producing wedges of large diameters (larger than 1.2-1.5 m) will limit the usable field of view to 3-4 arcmin as in the case of the Euro50 where the ADC is a part of the AO system.
4. ABSOLUTE ACCURACY OF DISPERSION PREDICTIONS: THE LIKELY NEED FOR A CLOSED-LOOP ADC CONTROL SYSTEM.
It may not be sufficient to infer the necessary setting of the ADC from zenith angle and meteorological conditions.In this case, a direct sensor of the image behaviour in the telescope focal plane may be needed.
We make the comparison by determining R (refraction) and Dispersion between 450nm and 550nm at 45° zenith distance for three atmospheric models, the Ciddor4 model (currently believed to be the most general: see the NIST website, “documentation”; the Updated Edlén model, also provided by the NIST website; and the model built into Zeemax. The results are summarised in Table 5, where we assume “Mauna Kea Standard Conditions”. The Ciddor model takes CO2 into account, assuming an abundance of 450ppm; the Zeemax model assumes a latitude of 20°.
MODEL R D(450nm – 550nm) D - DCiddor Ciddor 36.83044 0."35622 -
Updated Edlén 36.83047 0."35622 0 Zemax. 36.77980 0. "35517 -0. "00105
Table 5: Comparison of refraction and dispersion (between 450nm and 550nm) at ZD=45°, for three atmospheric models.
The Updated Edlén and Ciddor models are evidently in complete agreement as to the magnitude of the dispersion under our atmospheric conditions (though the NIST website makes it clear that this is not always the case!). The Zeemax internal model differs by about one mas in estimating the overall dispersion, enough

for a detectable effect on an XAO image with a 50- or 100-m telescope. The NIST website suggests that this is somewhat more than a 1-σ discrepancy, similar to those which might arise from uncertainties in the fundamental constants involved.
Since there are significant technical challenges associated with providing an Atmospheric Dispersion Sensor (ADS) it will be necessary to examine this issue in more detail at some stage. An obvious approach would be the tracking of image centroids at two reasonably widely-spaced wavelengths in a loop closing through the ADC controller.
5. CHROMATIC AO EFFECTS
5.1 Chromatic Error (“Dispersive Seeing”)
The optical path length error introduced by atmospheric turbulence (“seeing”) will be slightly different at different wavelengths due to dispersion. A deformable mirror will apply a correction which may in principle be perfect, but only at a single wavelength. There will therefore be an error at the other wavelengths in the band over which correction is being attempted, or, indeed, if wavefront sensing is carried out at a wavelength very different from that of the AO observation, even if the corrections being applied to the DM are appropriately scaled.
As far as we know, the possibility of Dispersive Seeing was first discussed by Wallner5 (1977) (as “Chromatic Error”) who concluded that it would be negligible (inducing a ~1/50 wave error) for a 1m telescope. Reworking his analysis for a 100m telescope predicts an rms error of 0.5λ or ~π radians of phase, a highly significant degradation of performance. We now re-investigate the amplitude of these residual dispersion-generated errors, following the analysis of Owner-Petersen & Goncharov6 (2004).
5.2 Dispersive Seeing in Kolmogorov Turbulence
This error may be estimated according to the following reasoning. After passing through turbulence which is described by a position and wavelength dependent refractive
index, n(λ,z), the phase at a given point in the aperture will in the geometric optics approximation be given by
[ ]∫∞
−=0
1),(2)( dzzn λλπλϕ
Assuming that the wavelength dependence of the refractive index is separable from the temperature and
pressure dependence, (comment), then the phase at wavelength λ is related to the phase at wavelength λ0 by
)(1)(1)()( 0
0
0 λϕλλ
λλλϕ
−−
=s
s
nn
Here ns is the refractive index at standard conditions. If a deformable mirror applies perfect correction at
λ0 then the error in phase at wavelength λ is given by )(),()( 00 λϕλλελδϕ =
Where
1)()()(),(
0
000 −
−=
λλλ
λλλλε
s
ss
nnn
If the rms uncorrected wavefront phase error is σu, then the residual chromatic error at wavelength λ will
be given by 2
022 ),()( uch σλλελσ =

when the correction is exact at λ0. Consider as an example the case of a 100m telescope operating when the seeing at 0.5 µm corresponds to a Fried parameter of 0.1m. The uncorrected variance (in square radians) is given by Noll’s formula7
35
0
2 03.1 ⎟⎟⎠
⎞⎜⎜⎝
⎛=
rD
uσ
If the correction is perfect at λ0 =0.7 µm, then the Strehl ratio falls below 0.9 at any wavelengths by more than ~700Å from this value. This effect is illustrated in Figure 11, for a sensing wavelength of 589nm (appropriate to a sodium Laser Guide Star).
Figure 11: Strehl ratio degradation by Dispersive Seeing in Kolmogorov turbulence (infinite L0). Adapted from
Owner-Petersen & Goncharov (2004)
Effects of a finite Outer Scale of Turbulence (L0).
Noll’s variances were computed for Kolmogorov turbulence statistics, which assume that the outer scale is infinite. Winker (1991) pointed out that deviations from this assumption have important effects. His Fig. 2 plots the overall phase error as a function of D/L0 as turbulence departs from the Kol-mogorov case, showing a reduction by a factor ~14 as D/L0 approaches 1. The effects of smaller L0 on Dispersive Seeing are illustrated in the next figure, also from Owner-Petersen & Goncharov, which now shows the behaviour of the Strehl ratio for an outer scale length L0 = 100m.
Figure 12: Strehl ratio degradation for L0 = 100m (adapted from Owner-Petersen & Goncharov
1997) We conclude, therefore, that Chromatic Error (Dispersive Seeing) will probably not often be a serious
impediment to work with ELTs, but that close attention to the statistics and value of L0 will be needed.
5.3 Dispersion Displacement Error (“Dispersive Anisoplanatism”)
This phenomenon also was, as far as we know, first discussed by Wallner8 (1976), in some detail. He pointed out that because of dispersion, rays of differing colour traverse slightly different sections of atmosphere. This produces a wavelength-, bandwidth- and zenith-distance- dependent anisoplanatism closely analogous to the effect of angular separation of source and reference star. In 1977 Wallner discussed the minimisation of this “refraction-induced error”. The Roddiers9 (1986) provide a summary and a useful table
(their Table 1) of the beam displacements, in units of r0, involved in these “differential refraction effects”. We add the label “dispersive anisoplanatism” as we believe this makes quite clear the effects which we are addressing, which are twofold: (i) the wavefront can be perfectly corrected at only one wavelength and (ii) the wavefront phase measurement will be correct only at the wavelength of measurement.
Wallner’s (1976) expression for the displacement of the beams is
[ ] ( )s' gρP(z)(z))N(λN(λ=∆b /tansec) 00 −
Wallner (1976) derives a general expression for the wavefront error resulting from this effect:
H(h)G(λgρP(z)(z)=σ
sD )tansec
21
3/5
03/53/82⎥⎦
⎤⎢⎣
⎡
The two multiplicative factors G(λ) and H(λ) are given by
35
0 02
20
035
'''
/)(1)(91.2)(
)()()()()(
∫
∫∞
∞
−=
−=
PhPhCdhhH
NNIIddG
nλ
λλλλλλλ
This expression allows integration over the passband of the science camera, with weighting according to
I(λ), which could include the source spectral energy distribution, the system throughput and detector quantum efficiency. The wavelength λ0 is a mean wavelength, defined by
∫∞
=00 )()()( λλλλ NIdN
at which the wavefront correction will be correct.
Hardy (1998) writes the formula as
∫∞
−′−=0
35
''' )()()()]()(2[)( λλλλλλλλ NNIIIddG BBA .. where IA is the spectral intensity distribution of the object observed and IB is the spectral intensity
distribution of the reference source. The sample case provided by Wallner uses the intensity distribution of a 5500 K blackbody as transmitted by the Earth’s atmosphere and detected by an S-20 photocathode through a filter transmitting from 0.4 - 0.75µm, and the corresponding intensity integral, G(λ) has a value of 4.19 x 10⁻¹⁰
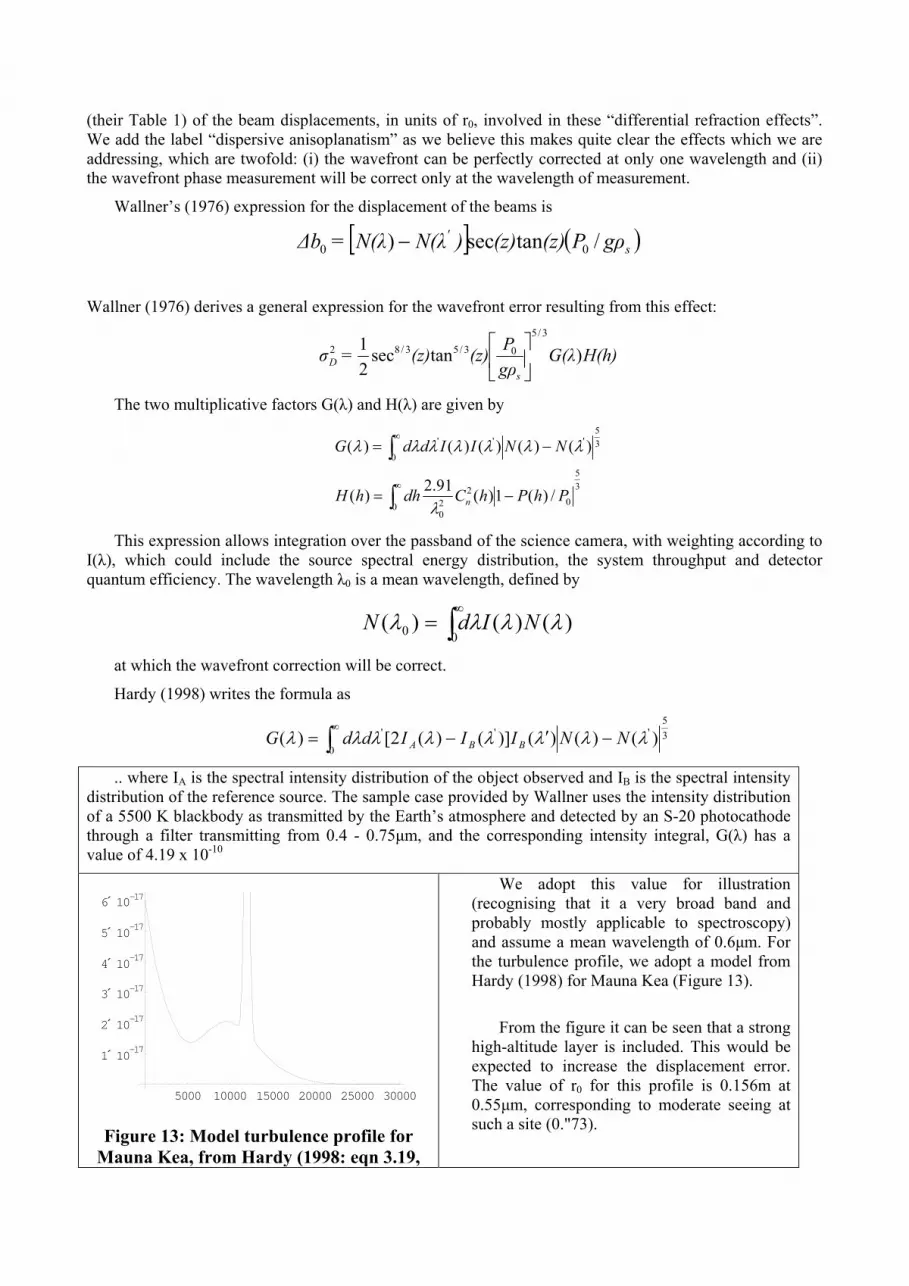
Figure 13: Model turbulence profile for Mauna Kea, from Hardy (1998: eqn 3.19,
We adopt this value for illustration (recognising that it a very broad band and probably mostly applicable to spectroscopy) and assume a mean wavelength of 0.6µm. For the turbulence profile, we adopt a model from Hardy (1998) for Mauna Kea (Figure 13).
From the figure it can be seen that a strong high-altitude layer is included. This would be expected to increase the displacement error. The value of r0 for this profile is 0.156m at 0.55µm, corresponding to moderate seeing at such a site (0."73).
5000 10000 15000 20000 25000 30000
1´ 10-17
2´ 10-17
3´ 10-17
4´ 10-17
5´ 10-17
6´ 10-17

parameters from Table 3.1, line 6)
Figure 14: Strehl ratio variation with Zenith Distance (in degrees) for the turbulence profile in Figure 13 and Wallner’s (1976) effective bandpass
(approximately 0.4-0.7 µm, mean ~0.6 µm
Figure 14 shows the variation of the Strehl ratio as a function of zenith angle assuming these parameters. The Strehl drops to 0.9 at a zenith angle of 44°. If the mean wavelength is reduced to 0.4 µm then the Strehl would drop to 0.9 at 35 degrees. A similar result is obtained if one assumes flat intensity profiles from 0.4 to 0.8µm (mean wavelength 0.6µm, λ) = 8x10⁻¹⁰).
It appears that this error will not be important, except perhaps at the shortest visible wavelengths
10 20 30 40 50 60
0.5
0.6
0.7
0.8
0.9
6. DIFFRACTIVE EFFECTS
In the geometric optics approximation, a plane wave passing through a turbulent layer suffers random phase delays, but does not change direction. The wave is also diffracted by the inhomogeneities in refractive index, and the angle of refraction is given by
ka1
=θ
Where k is the wavenumber and a is the typical scale size of the inhomogeneity. Since this angle depends on wavelength, it means that waves of different wavelength will be diffracted through different paths in the turbulence, giving rise to what might be called a ‘diffractive chromatic anisoplanatism’. However, the angles are very small. If we consider λ1=0.4µm and λ2=0.8µm, and a=0.1m in a turbulent layer 10km above the telescope, then the waves are separated by roughly 1mm at the telescope aperture. This should give a negligible error.
7. CONCLUSIONS:
Atmospheric Dispersion does not appear to present insurmountable problems for achieving the hoped-for performance of even a 100m ELT. ADCs on ELTs can probably deliver the level of correction needed for the Science Programme. However
• At least 2, most probably 4, different ADC units, optimised for different wavelength ranges and scientific applications, will probably be needed.
• Differential AD over large fields of view, varying during long exposures, will cause variable λ-, ∆λ- and ZD-dependent effects, especially serious for broad-band spectrometers. Multi-object instruments may need individual ADCs for each – moveable - pickoff.
• High-performance closed-loop ADC control systems, with multi-wavelength sensing, will probably be needed to achieve full performance.
• Site properties have an important impact on AO performance in the presence of AD: o If L0 exceeds ~1km Chromatic Error (dispersive seeing) will be significant.

o Chromatic Displacement Error (dispersive anisoplanatism) in the presence of high-altitude turbulence layers may limit observations requiring extremely high-performance AO to moderate zenith distances, possibly <45°.
8. REFERENCES
1. Hardy, J.W., 1998. “Adaptive Optics for Astronomical Telescopes”, Oxford University Press,
NY (ISBN 0-19-509019-5)
2. Andersen, T., Ardeberg, A. & Owner-Petersen, M., 2003. “Euro50. A design study for a 50m
Adaptive Optics Telescope”, Lund Observatory. (ISBN 91-631-4317-8)
3. Avila, G., Ruprecht, G. & Beckers, J.M., 1997. Proc SPIE, 2871, 1135
4. Ciddor, P.E., 1996. Appl. Opt. 35, 1566
5. Wallner, E.P., 1977. JOSA, 67, 407
6. Owner-Petersen, M. & Goncharov, A., 2004. Proc. SPIE, 5489, 507
7. Noll, R.J., 1976. JOSA, 66, 207
8. Wallner, E.P., 1976. Proc SPIE, 75, 119
9. Roddier, F. & Roddier, C., 1986. Proc SPIE, 628, 298
Copyright © 2022 FDOKUMEN