Nitrogen fertilisation of irrigated maize under Mediterranean conditions
Upload
khangminh22Category
view
1download
0
IMPROVING NITROGEN USE EFFICIENCY BY MAIZE THROUGH THE
PIGEON PEA-GROUNDNUT INTERCROP-MAIZE ROTATION CROPPING
SYSTEM IN MALAWI
AUSTIN T. PHIRI
A THESIS IN PARTIAL FULFILMENT OF THE REQUIREMENTS FOR THE
DEGREE OF DOCTOR OF PHILOSOPHY OF SOKOINE UNIVERSITY OF
AGRICULTURE. MOROGORO, TANZANIA.
2015

i
EXTENDED ABSTRACT
A study was initiated in the 2011/12 cropping season with a parallel experiment mounted
along side in the second season to investigate the possibility of improving nitrogen use
efficiency (NUE) by the maize crop in a pigeon pea groundnut intercrop-maize rotation
cropping system at Chitedze Agricultural Research Station in Malawi. The parallel
experiment was conducted to compare the performance of legumes over two cropping
seasons. The experiments involved the planting of two pigeon pea varieties, namely; long
(ICEAP 04000) and medium duration (ICEAP 00557) and groundnut (CG 7) as
monocultures or as intercrops. The main experiment had eight treatments; 1) Sole maize
(control); 2) Medium duration pigeon pea; 3) Long duration pigeon pea; 4) Sole
groundnut; 5) Medium duration pigeon pea + groundnut; 6) Long duration pigeon pea +
groundnut; 7) Medium duration pigeon pea + groundnut (biomass not incorporated in
season two); and 8) Long duration pigeon pea + groundnut (biomass not incorporated in
season two). All the treatment plots except treatment plot number one were treated with
25 kg P ha-1
. The parallel experiment had ten treatments; 1) Long duration pigeon pea; 2)
Medium duration pigeon pea; 3) Sole groundnut; 4) Sole groundnut + 25 kg P ha-1
; 5)
Medium duration pigeon pea 25 kg P ha-1
; 6) Long duration pigeon pea + 25 kg P ha-1
; 7)
Long duration pigeon pea + groundnut; 8) Long duration pigeon pea + groundnut + 25
kg P ha-1
; 9) Medium duration pigeon pea + groundnut; and 10) Medium duration pigeon
pea + groundnut + 25 kg P ha-1
. Both experiments were laid in a randomized complete
block design replicated three times. Key parametres assessed during the experiment
included; legume biomass and grain yield, soil nitrate nitrogen (NO3-‒N), maize stover,
and rachids yields; nitrogen and phosphorus partitioning both for the legumes and maize
NUE.

ii
Soil characterization was conducted before treatment application in the first and second
year. Generally, the soil chemical characteristics for soil samples collected in all the
treatment plots both in the main and parallel experiment indicated that the soil was of low
fertility. The %OC and total N (%) was low, and was at 1.4 %, 0.12%, respectively, while
plant available phosphorus (Mehlich 3) was marginally adequate (19 mg P kg-1
to 25 mg
P kg-1
). The soil texture which was predominantly sandy clay loam to sandy clay suggest
potential high leacheability of mobile nutrient ions more especially nitrogen as nitrate.
Inevitably, if the soil is not properly managed crop yield could be reduced drastically.
Total biomass yield assessment for the pigeon pea was conducted in the parallel
experiment in season two. Partial biomass yield assessment was done in season one in the
main experiment. In season two this involved assessment of litter, twigs, stems, fresh
leaves and roots for each treatment plot. The litter was collected from the ground on one
planting station (90 cm x 75 cm). This was done in September, 2013. Fresh leaves, twigs
and stems were also weighed from the 2 m x 2 m net plot. These were oven dried for 72
hours at 70 oC to constant weights. The assessment of the above ground groundnut
biomass indicate a low yield range of 479-656 kg ha-1
while the assessment of the total
above ground biomass yield of the pigeon pea varieties indicate a high yield range of
3,124-3,840 kg ha-1
. Nitrogen yield assessment indicate that the monoculture for
groundnut treated with P yielded more N (52.0 kg N ha-1
) compared to the non treated
groundnut monoculture (40.0 kg N ha-1
) while the P treated monoculture for the long
duration pigeon pea yielded higher soil returnable N (87.2 kg N ha-1
) compared to the non
P treated counterpart (79.7 kg N ha-1
). For the medium duration pigeon pea monoculture
higher soil returnable N was harvested in the P treated monoculture (95.6 kg N ha-1
) than

iii
the non P treated monoculture (87.0 kg N ha-1
). Similar soil returnable yield of N was
observed in the P (128.3 kg N ha-1
) and non P treated (128.8 kg N ha-1
) intercrop of
medium duration pigeon pea and groundnut. Higher soil returnable yield of N was
observed in the P (128.4 kg N ha-1
) and non P treated (103.9 kg N ha-1
) intercrop of long
duration pigeon pea and groundnut. Generally, the monocultures and intercrops treated
with P gave higher N yield when compared to the non P treated counterparts. This was
attributed to enhanced biological N fixation in the P treated treatments due to the
increased level of available P. Poor grain filling for the pigeon pea varieties was observed
both in the main and parallel experiment. For the groundnut shells’ yield ranged from 846
kg ha-1
to 1,985 kg ha-1
while grain yield ranged from 1,513 kg ha-1
to 3,025 kg ha-1
and
haulms’ yield ranged from 1,396 kg ha-1
to 2,463 kg ha-1
. N concentration in the shells
ranged from 0.9% to 1.5% while in the grain ranged from 2.9% to 3.2% while for haulms
ranged from 1.9% to 2.3%. N yield in the groundnut shells ranged from 10.2 kg N ha-1
to
25.2 kg N ha-1
while for grain ranged from 46.9 kg N ha-1
to 98.8 kg N ha-1
and for
haulms ranged from 29 kg N ha-1
to 52 kg N ha-1
. The concentration of N in the maize
grain ranged from 1.1% to 2.1% while maize grain yield ranged from 1,775 kg ha-1
to 5,
806 kg ha-1
and the N yield ranged from 23 kg N ha-1
to 115 kg N ha-1
. The concentration
of N in the maize stover ranged from 0.1% to 1.0% while stover yield ranged from 2,029
kg ha-1
to 4,413 kg ha-1
and the N yield ranged from 2.3 kg N ha-1
to 33.2 kg N ha-1
. The
concentration of N in the maize rachids ranged from 0.1% to 0.5% while the rachids yield
ranged from 405 kg ha-1
to 1,235 kg ha-1
and the N yield ranged from 0.7 kg ha-1
to 5.1
kg N ha-1
. The data indicated that more N in the groundnut and maize plant is
translocated to the grain as such there is net export of N from the field which might lead
to depletion of N in the soils.

iv
Assessment of soil NO3-‒N was conducted in the main experiment in the 2012/2013
cropping season, after the emergence of the succeeding maize crop. This was done in
order to establish the effect of incorporating legume residues on soil NO3-‒N and the
implication this might have on nitrogen management and crop yield. Data was collected
over a period of three weeks. This was done before top dressing with urea. Over the study
period high levels (100 > mg L-1
) of soil NO3-‒N were observed that were in most cases
statistically the same (p>0.05) across the treatment plots. In general, mean soil NO3-‒N
was higher between 20 cm to 40 cm than 0 to 20 cm, attributable to the soil texture which
is predominantly sandy clay loam both between 0 to 20 cm and 20 cm to 40 cm hence
high leaching of NO3-. Most likely, the level of soil NO3
-‒N, into the season, in treatment
plots in which no biomass was incorporated declined faster than in treatment plots where
no incorporation was done, as a result of uptake by the maize crop and leaching losses.
The high levels of soil NO3-‒N probably, lasted longer into the season for the latter
treatment plots, but might not have endured until the end of the cropping cycle due to
limited supply of N from the incorporated biomass. Therefore, supplementation of N
from mineral sources is requisite for the attainment of optimal maize grain yield. In
general the KCl method gave higher readings of NO3-‒N (0-20 cm=90.3 mg L
-1 and 20
cm to 40 cm =108.5 mg L-1
) compared to the nitrate meter (0 to 20 cm=68.1 mg L-1
and
20 cm to 40 cm=65.9 mg L-1
). This could be attributed to the differences in the extraction
procedure for the two methods, a cause of the different results generated by each
procedure.
Assessment of NUE for the maize crop was conducted in order to determine how
efficient the crop utilized applied N from urea. NUE was determined using the recovery

v
efficiency (RE), agronomic efficiency (AE) and partial factor productivity (PFP) indices.
Under the conditions of this study RE ranged between 20% and 88%, AE ranged between
7 and 32 kg yield increase per kg of nitrogen applied and PFP ranged from 27 to 104 kg
grain yield per kg nutrient applied. RE values of 50% to 80% , AE values of 10–30 kg kg-
1 and PFP values of 40–80 kg kg
-1 are often encountered with values >25 kg kg
-1 for AE
and >60 kg kg-1
for PFP being common in well-managed systems or at low levels of N
use, or at low soil N supply. The linear increase in grain yield with application of N and
the presence of a diminishing-return relationship between maize grain yields (grain yield
was near the yield potential of the maize variety at high N input) and increasing nitrogen
supply, suggest that the RE, AE and PFP values emerging from this study might apply
both to low and high levels of N use, or at low and high soil N supply.
From the study, the following conclusions were made; the soils on which the experiments
were conducted were of low fertility status evidenced by the low nitrogen and
phosphorus. A situation that calls for soil N and P management for increased crop
productivity. Furthermore, the study confirmed the viability of the pigeon pea-groundnut
intercropping system. The nitrogen yields for the cropping system were deemed to be
reasonably high. Employing this system in rotation with maize can reduce to an extent
the amounts and hence the costs of mineral fertilizers required for maize production. On
the effect of incorporating legume biomass into the soil on soil NO3-‒N, it was noted that
apparently the soil had high NO3-‒N in the soil solution attributable to residual N from N-
fertilization and legume cropping over years. Soil NO3-‒N was higher between 20 cm to
40 cm than between 0 to 20 cm in the soil. This was attributable to the soil texture which
is predominantly sandy clay loam with low to medium level of SOM. Leaching of NO3- is
vi
high under such soil conditions. It is likely that soil NO3-‒N levels in all the treatment
plots would decline in all the treatment plots along the season principally due to crop
uptake of N and leaching losses. This for the Malawian smallholder farmers implies that
in this cropping system N supplementation from mineral fertilizer is not optional if
reasonably high maize yield is to be realized. Additionaly, comparative analysis of two
soil NO3-‒N analysis procedures indicated that the KCl method gave higher readings of
NO3-‒N compared to the nitrate meter. This accrued from the differences in the extraction
procedure for the two methods.
The study served to confirm that more N yield in groundnut is exported from the field in
form of shells and grain and less is returned to the soil upon incorporation of the haulms.
Over and above, it was observed that in the pigeon pea much of the N contribution to the
soil N pool comes from the above ground biomass as compared to the below ground
biomass. Additionally, supply of P to legumes increases N accumulation and yield
through enhanced biological N fixation. The legumes, however, do not yield enough P for
the correction of soil P deffiencies that are prevalent across Malawi. The PFP ( 27 to 104
kg grain yield kg-1
N applied ) values obtained under the conditions of this study, which
are higher than that ( 20 kg grain yield kg-1
N applied ) reported under smallholder farms
in Malawi, seem to suggest that legume biomass incorporation into the soil does improve
NUE of the suceeding maize crop. The NUE values generated fall within the range of
values that are often encountered in well-managed systems or at low levels of N use, or at
low soil N supply.
Ratooning of the pigeon pea in this environment appears to be the solution to the
observed poor grain filling for the pigeon pea. Furthermore, the low P yields from the

vii
legumes indicate the need to supply P using mineral fertilizer sources in addition to N for
optimal maize grain yield. Further studies in this cropping system should focus on
understanding the decomposition and mineralization pattern of the incorporated legume
biomass for the assertion of the time and amount of N release. This is critical inorder to
establish if this is in syncrony with nutrient demand by the maize crop.

viii
DECLARATION
I, AUSTIN T. PHIRI, do hereby declare to the Senate of Sokoine University of
Agriculture that this Thesis is my own original work done within the period of
registration and that it has neither been submitted nor being concurrently submitted in
any other institution.
………………………………… ……………………………
Austin T. Phiri Date
(PhD Candidate)
………………………………… ……………………………
Prof. J.P. Mrema Date
(Supervisor)

ix
COPYRIGHT
No part of this Thesis may be reproduced, stored in any retrieval means; electronic,
mechanical, photocopy or other means without the acknowledgement of the author.

x
ACKNOWLEDGEMENT
First and foremost, I would like to thank Professor George Yobe Kanyama-Phiri,
“mentor extra-ordinary”, for ushering me into the world of legumes and soil fertility
improvement. Your tireless efforts in grooming me when others doubted have not been in
vain. Thank you for your firm belief in me, forever I shall remain grateful to you. I will
be deemed ungrateful for not thanking Prof. J.P. Mrema who has ably guided me through
“unfamiliar terrain”...it was not easy... May God Almighty richly bless you and continue
keeping you strong. To Prof. R.R. Weil, Prof. Julie Grossman, Dr. Rebbie Harawa, Prof.
B.M. Msanya, Prof. E. Semu and Prof. J. Semoka for dedicating time and expertise to
provide technical guidance and input during the field work, its a big thank you to you all!
I will be failing in my duty if I do not extend my gratitude to all technicians at Bvumbwe
and Chitedze Agricultural Research Stations in Malawi for assisting with both field and
laboratory work.
Special acknowledgement goes to Dr. Marie Rarieya and Dr. Abel K. Kaaya for their
unique roles on this PhD journey. I am grateful!
May I also thank the Alliance for a Green Revolution in Africa (AGRA) for providing
tuition as well as research funds, the Government of Malawi through the Department of
Agricultural Research Services of the Ministry of Agriculture and Food Security, for
providing the much needed institutional support.

xi
DEDICATION
“Through my Lord and Saviour Jesus Christ, to God Almighty the Father of Glory,
architect and redeemer of the destiny of men...thank you!...to my late Father, Stanslas
Esau Velentino Phiri, our guide and cover on life’s journey...gratitude... and to my son,
Divine Austin Phiri; “carry our dreams, hopes and aspirations into the future”...YO
PHIRI!”

xii
TABLE OF CONTENTS Page
EXTENDED ABSTRACT .................................................................................................. i
DECLARATION ............................................................................................................. viii
COPYRIGHT ..................................................................................................................... ix
ACKNOWLEDGEMENT ...................................................................................................x
DEDICATION ................................................................................................................... xi
TABLE OF CONTENTS .................................................................................................. xii
LIST OF TABLES .......................................................................................................... xxii
LIST OF FIGURES .........................................................................................................xxv
LIST OF APPENDICES ................................................................................................ xxvi
LIST OF ABBREVIATIONS AND SYMBOLS ............................................................xxx
CHAPTER ONE ..................................................................................................................1
1.0 GENERAL INTRODUCTION ......................................................................................1
1.1.0 Soil fertility and soil fertility status ........................................................................1
1.1.1 Soil fertility management .......................................................................................1
1.1.2 Consequences of declining soil fertility on soil and crop productivity ..................3
1.1.3 Challanges affecting agricultural productivity in Malawi ......................................4
1.1.4 Strategies for improving soil and crop productivity ...............................................5
1.1.5 Crop residue management for soil organic matter and fertility improvement .......5
1.1.6 Nutrient use efficiency ...........................................................................................7

xiii
Page
1.1.7 Improving crops’ nutrient use efficiency for increased productivity .....................8
1.1.8 Nutrient management for improved nutrient use efficiency ..................................9
1.1.9 Strategies for enhanced and sustainable agricultural production .........................11
1.1.10 Intercropping ......................................................................................................12
1.1.11 Legume-legume intercropping ...........................................................................14
1.1.12 Evaluation of the productivity of intercropping systems ...................................15
1.1.13 Crop rotation .......................................................................................................16
1.1.14 Pigeon pea ..........................................................................................................18
1.1.15 Environmental requirements ..............................................................................18
1.1.16 Groundnut ...........................................................................................................19
1.1.17 Legume based soil fertility rejuvenating technology .........................................20
1.2 EXPECTED OUTPUT ................................................................................................22
1.3 HYPOTHESES ............................................................................................................22
1.4 REFERENCES ............................................................................................................24
CHAPTER 2: .....................................................................................................................41
EFFECT OF PIGEON PEA-GROUNDNUT INTERCROPPING SYSTEM ON
SELECTED SOIL PROPERTIES ABSTRACT ...............................................................41
2.0 INTRODUCTION .......................................................................................................43
2.1 MATERIALS AND METHODS .................................................................................45
2.1.1 Study site ..............................................................................................................45

xiv
Page
2.1.2 Materials ...............................................................................................................45
2.1.3 Characterization of the soil at the study site .........................................................45
2.1.4 The field experiments ...........................................................................................47
2.2 RESULTS ....................................................................................................................50
2.2.1 Characterization of the soils at the study site .......................................................50
2.2.2 Characteristics of the soils at the study site after the first season ........................51
2.3 DISCUSSION ..............................................................................................................57
2.3.1 Soil fertility status at the study site ......................................................................57
2.3.2 Effects of biomass incorporation to the soil on selected soil properties ..............58
2.4 CONCLUSION ............................................................................................................59
2.5 REFERENCES ............................................................................................................60
CHAPTER 3: .....................................................................................................................66
ASSESSMENT OF BIOMASS AND NUTRIENT YIELDS OF MEDIUM AND LONG
DURATION PIGEON PEA IN A PIGEON PEA-GROUNDNUT INTERCROPPING
SYSTEM ABSTRACT ......................................................................................................66
3.0 INTRODUCTION .......................................................................................................68
3.1 MATERIALS AND METHODS .................................................................................70
3.1.1 Study site ..............................................................................................................70
3.1.2 Materials ...............................................................................................................70
3.1.3 Field experiment ...................................................................................................70

xv
Page
3.1.4 Experimental layout for each treatment plot ........................................................70
3.1.5 Application of triple super phosphate (Ca(H2PO4)2. H2O) ...................................70
3.2 DATA COLLECTION AND ANALYSIS ..................................................................71
3.2.1 Soil sample collection ..........................................................................................71
3.2.2 Rainfall data .........................................................................................................71
3.2.3 Pigeon pea height measurement ...........................................................................71
3.2.4 Biomass and grain yields assessment for the pigeon pea .....................................72
3.2.5 Biomass and grain yields assessment for the groundnut ......................................72
3.2.6 Evaluation of the productivity of the intercropping systems ...............................72
3.2.7 Plant sample analysis ............................................................................................73
3.2.8 Nutrient yields ......................................................................................................73
3.2.9 Statistical analysis ................................................................................................73
3.3 RESULTS ....................................................................................................................73
3.3.1 Growth rates for the long duration and medium duration pigeon pea ..................73
3.3.2 Pigeon pea biomass and nutrient yields: litter, fresh leaves and twigs ................77
3.3.3 Concentration of nutrients in groundnut pods, haulms and grain ........................80
3.3.4 Groundnut pods, haulms, grain and nutrient yields ..............................................82
3.3.5 Nitrogen and phosphorus yields returned to the soil ............................................85
3.4 DISCUSSION ..............................................................................................................88
3.4.1 Growth rate of medium and long duration pigeon pea in sole stands..............
and intercrops ................................................................................................................88
xvi
Page
3.4.2 The effect of intercropping on the yield components of the pigeon pea............
and groundnut ................................................................................................................89
3.5 CONCLUSION ............................................................................................................90
3.6 REFERENCES ............................................................................................................92
CHAPTER 4: .....................................................................................................................95
INSITU ASSESSMENT OF SOIL NITRATE-NITROGEN IN THE PIGEON PEA-
GROUNDNUT INTERCROPPING-MAIZE ROTATION SYSTEM: IMPLICATIONS
ON NITROGEN MANAGEMENT FOR INCREASED MAIZE PRODUCTIVITY
ABSTRACT .......................................................................................................................95
4.0 INTRODUCTION .......................................................................................................97
4.1 MATERIALS AND METHODS .................................................................................98
4.1.1 Study site ..............................................................................................................98
4.1.2 Materials ...............................................................................................................98
4.1.2 Experimental design .............................................................................................99
4.2 DATA COLLECTION AND ANALYSIS ..................................................................99
4.2.1 Soil sample collection after biomass incorporation to the soil preparation.............
and laboratory analysis ..................................................................................................99
4.2.2 Insitu measurement of soil pH, soil temperature and soil humidity .....................99
4.2.3 Soil nitrate-nitrogen ..............................................................................................99
4.2.4 Daily rainfall and temperature reading during the data collection period ..........100
4.2.5 Statistical analysis ..............................................................................................101

xvii
Page
4.3 RESULTS ..................................................................................................................101
4.3.1 Soil pH, soil temperature, humidity, total nitrogen and organic carbon content.. ...
.....................................................................................................................................101
4.3.2 The amount of biomass produced by the legumes and incorporated into the soil
.....................................................................................................................................103
4.3.3 Level of soil nitrate-nitrogen measured over the four week period ...................104
4.3.4 Nitrate nitrogen data from the meter and KCl method .......................................108
4.4 DISCUSSION ............................................................................................................110
4.5 CONCLUSION ..........................................................................................................112
4.6 REFERENCES ..........................................................................................................113
CHAPTER 5: ...................................................................................................................117
PIGEON PEA ROOT NITROGEN YIELDS FOR THE PIGEON PEA-GROUNDNUT
INTERCROP SYSTEM ABSTRACT .............................................................................117
5.0 INTRODUCTION .....................................................................................................118
5.1 MATERIALS AND METHODS ...............................................................................121
5.1.1 Study site ............................................................................................................121
5.1.2 Field Experiments ...............................................................................................121
5.1.3 Plot description and application of triple super phosphate (Ca(H2PO4)2.H2O)....
and urea (CO(NH2)2) ...................................................................................................121
5.2 DATA COLLECTION AND ANALYSIS ................................................................122
xviii
Page
5.2.1 Soil sample collection ........................................................................................122
5.2.2 Biomass and grain yield assessment for the pigeon pea ....................................122
5.2.3 Biomass and grain yield assessment for the groundnut and maize ....................123
5.2.4 Evaluation of the productivity of the intercropping systems .............................123
5.2.5 Soil analysis and plant sample analysis ..............................................................124
5.2.6 Nutrient yields ....................................................................................................124
5.2.7 Statistical analysis ..............................................................................................124
5.3 RESULTS ..................................................................................................................124
5.3.1 Characterization of soil at the study site ............................................................124
5.3.2 N, P, and Ca content and yield for groundnut and pigeon pea ...........................124
5.3.3 Biomass yields, nutrient concentrations and nutrient yields for fresh.....................
leaves of pigeon pea ....................................................................................................132
5.3.4 Summary of nitrogen and phosphorus yields for groundnut in the...........
parallel experiment season two ...................................................................................146
5.3.5 Summary of nitrogen and phosphorus yields for the pigeon pea in the............
parallel experiment season two ...................................................................................147
5.3.6 Estimated soil returnable N and P yields for the monoculture of groundnut...........
and pigeon pea and the intercrop of the groundnut .....................................................148
5.3.7 Evaluation of the productivity of the cropping systems .....................................149
5.4 DISCUSSION ............................................................................................................151
5.4.1 Yields, nitrogen and phosphorus partitioning for the legumes ..........................151
5.4.2 Estimated soil returnable N yields for the monoculture of groundnut and..............
pigeon pea and the intercrop of the groundnut ............................................................152

xix
Page
5.5 CONCLUSION ..........................................................................................................155
5.6 REFERENCES ..........................................................................................................156
CHAPTER 6: ...................................................................................................................163
NITROGEN UPTAKE AND YIELDS FOR THE PIGEON PEA-GROUNDNUT
INTERCROP MAIZE ROTATION CROPPING SYSTEM ABSTRACT .....................163
6.0 INTRODUCTION .....................................................................................................165
6.1 MATERIALS AND METHODS ...............................................................................169
6.1.1 Study site ............................................................................................................169
6.1.2 Field experiment .................................................................................................169
6.1.3 Plot description and application of triple super phosphate and urea ..................170
6.2 DATA COLLECTION AND ANALYSIS ................................................................170
6.2.1 Soil sample collection ........................................................................................170
6.2.2 Biomass and grain yields assessment for the pigeon pea ...................................170
6.2.3 Biomass and grain yields assessment for the groundnut and maize ...................170
6.2.4 Evaluation of the productivity of the intercropping systems .............................171
6.2.5 Soil analysis and plant sample analysis ..............................................................171
6.2.6 Nutrient yields ....................................................................................................171
6.2.7 Statistical analysis ..............................................................................................171
6.3 RESULTS ..................................................................................................................171
6.3.1 Characterization of the soils at study site ...........................................................171
6.3.2 Nutrient uptake in the parallel experiment .........................................................171

xx
Page
6.3.3 Yields of pigeon pea and groundnut in the parallel and main experiment............
in the second cropping season .....................................................................................180
6.3.4 Evaluation of the productivity of the cropping systems .....................................189
6.4 DISCUSSION ............................................................................................................191
6.4.1 Groundnut pods, grain and haulm’s yields for the parallel trial .........................191
6.4.2 Nutrient uptake for pigeon pea and yields ..........................................................191
6.4.3 Nitrogen uptake and yields for maize .................................................................193
6.5 CONCLUSION ..........................................................................................................195
6.6 REFERENCES ..........................................................................................................197
CHAPTER 7: ...................................................................................................................207
ASSESSMENT OF NITROGEN USE EFFICIENCY IN THE PIGEON PEA-
GROUNDNUT INTERCROP MAIZE ROTATION CROPPING SYSTEM IN
MALAWI ABSTRACT ...................................................................................................207
7.0 INTRODUCTION .....................................................................................................209
7.1 MATERIALS AND METHODS ...............................................................................213
7.1.1 Study site ............................................................................................................213
7.1.2 Field Experiment ................................................................................................213
7.1.3 Treatment plot description and application of triple super......................................
phosphate (Ca(H2PO4)2.H2O) and urea (CO(NH2)2) ...................................................213
7.2 DATA COLLECTION AND ANALYSIS ................................................................213

xxi
Page
7.2.1 Soil sample collection ........................................................................................213
7.2.2 Soil analysis and plant sample analysis ..............................................................214
7.2.3 Biomass and grain yields assessment for the pigeon pea ...................................214
7.2.4 Biomass and grain yields assessment for the groundnut and maize ...................214
7.2.5 Nitrogen yields ...................................................................................................214
7.2.6 Assessment of nutrient use efficiency by the maize crop...................................214
7.3 RESULTS ..................................................................................................................216
7.3.1 Characterization of the soils at the site ...............................................................216
7.3.2 Calculated nitrogen yields returnable to the soil ................................................216
7.3.3 Maize yields .......................................................................................................218
7.4 DISCUSSION ............................................................................................................239
7.4.1 Nitrogen partitioning in the maize crop .............................................................239
7.4.2 Maize yields and nitrogen use efficiency by the maize crop .............................240
7.5 CONCLUSION ..........................................................................................................242
7.6 REFERENCES ..........................................................................................................244
CHAPTER 8 ....................................................................................................................251
8.0 GENERAL CONCLUSIONS AND RECOMMENDATIONS ................................251
8.1 Conclusions ...........................................................................................................251
8.2 Recommendations .................................................................................................252
9.0 APPENDICES ...........................................................................................................254

xxii
LIST OF TABLES
Page
Table 2.0: The soils’ physical and chemical properties at the study site before the
experiment..........................................................................................................................50
Table 2.1a: Soil physical and chemical parameters for the main experiment after the first
season .................................................................................................................................53
Table 2.1b: Soil chemical parameters for the main experiment after the first season .......54
Table 2.2 a: Selected soil chemical properties for the main experiment after biomass
incorporation, second season .............................................................................................55
Table 2.2b: Selected soil chemical properties for the main experimemt after biomass
incorporation, second season .............................................................................................56
Table 3.0a: Nutrient concentrations in pigeon pea biomass: Litter (L), Fresh leave (L) and
Twigs (T) ...........................................................................................................................76
Table 3.0b: Pigeon pea biomass and nutrient yields: Litter (L), fresh leaves (FL) and
twigs (T) .............................................................................................................................79
Table 3.1a: Concentration of nutrients in groundnut pods (Ps), haulms (H) and grain (G) ..
......................................................................................................................................81
Table 3.1b: Groundnut pods (Ps), haulms (H), grain (G) and nutrient yields ...................84
Table 3.2: Calculated nitrogen and phosphorus yields returned to the soil by the legumes
where biomass was incorporated to the soil ......................................................................86
Table 3.3: Evaluation of the productivity of the intercrop against the monocultures:
biomass ..............................................................................................................................87
xxiii
Page
Table 4.0: Soil pH, soil temperature, humidity, total nitrogen and organic carbon
content... ...........................................................................................................................102
Table 4.1: The amount of biomass produced by the legumes and incorporated into the
soil ....................................................................................................................................103
Table 4.2: Soil nitrate-nitrogen in level in plots three weeks from the emergence of
maize, second season .......................................................................................................107
Table 5.0: N, P, Ca and Mg concentrations and yields for groundnut haulms at harvest,
parallel experiment, second season ..................................................................................126
Table 5.1: N, P and Ca concentrations and nutrient yields for groundnut shell at harvest,
parallel experiment.second season ...................................................................................129
Table 5.2: N, P and Ca concentrations for the grains of groundnut at harvest in the
parallel experiment...........................................................................................................131
Table 5.3: N, P and Ca concentrations in the fresh leaves for pigeon pea and yields at
harvest, parallel experiment, second season ....................................................................133
Table 5.4: N, P and Ca concentrations and nutrient yields for dry leaves for pigeon pea
plants at harvest, parallel experiment, second season ......................................................136
Table 5.5: N, P, Ca and Mg concentrations and nutrient yields for twigs of the pigeon pea
plants at harvest parallel experiment, second season .......................................................139
Table 5.6: N, P, Ca and Mg concentrations in stems for pigeon pea plants at harvest in the
parallel experiment...........................................................................................................142

xxiv
Page
Table 5.7: N, P and Ca concentrations and yields for roots of the pigeon pea plants at
harvest, parallel experiment, second season ...................................................................145
Table 5.8: Evaluation of the productivity of the intercrops .............................................150
Table 6.0: N and P contents in the maize plant at silking in the main experiment
(season two) .....................................................................................................................177
Table 6.1: Groundnut pods, grain and haulm’s yields in the parallel experiment ...........179
Table 6.2: Pigeon pea pod and biomass yields in the parallel experiment ......................182
Table 6.3: Maize grain, stover, rachids yields and average cob length for the main
experiment........................................................................................................................187
Table 6.4: Evaluation of the productivity of the cropping systems .................................190
Table 7.0: Calculated amount of biomass and N returned to the soil by the monoculture ....
....................................................................................................................................217
Table 7.1: Nitrogen concentrations and yields: maize grain, main experiment, second
season ...............................................................................................................................221
Table 7.2: Nitrogen concentrations and yields: Maize stover, main experiment, second
season ...............................................................................................................................226
Table 7.3: Nitrogen concentrations and yields: maize rachids, main experiment, second
season ...............................................................................................................................230
Table 7.4: Summary of total N yields in the maize plant, N input to the soil by legumes...
....................................................................................................................................237

xxv
LIST OF FIGURES
Page
Figure 2.0: Pigeon pea and groundnut biomass yield ........................................................52
Figure 3.0: Growth rate of long and medium duration pigeon pea in intercrops and............
pure stands. ........................................................................................................................74
Figure 4.0: Comparison of NO3-‒N data (Meter) and NO3
-‒N data (KCl): 0-20 cm..... 108
Figure 4.1: Comparison of NO3-‒N data (Meter) and NO3
-‒N data (KCl): 20-40 cm....109
Figure 4.2: Correlation of NO3-‒N data (Meter) and NO3
-‒N data (KCl): 0-20 cm .......109
Figure 4.3: Correlation of NO3-‒N (Meter) and NO3
-‒N data (KCl): 20-40 cm............ 110
Figure 5.0: Nutrient yields for the groundnut in the parallel experiment in season two..146
Figure 5.1: Nitrogen and phosphorus yields for the pigeon pea in the parallel....................
experiment season two .....................................................................................................147
Figure 5.2: Calculated soil returnable N and P yields for the monoculture.......................
of groundnut and pigeon pea and the intercrop of the groundnut ....................................149
Figure 6.0: Nutrient concentrations for the haulms of groundnut plants at flowering..........
in the parallel experiment season two ..............................................................................173
Figure 6.1: Nutrient concentrations for pigeon pea plants at flowering........................
stage in the parallel experiment season two .....................................................................174
xxvi
LIST OF APPENDICES
Page
Appendix 2.0a: Soils data for the main experiment at harvest (First season) ..................254
Appendix 2.0b: Soils data for the main experiment after biomass incorporation to the soil
(second season) ................................................................................................................257
Appendix 2.5: Yield parameter in the main experiment (season one) .............................260
Appendix 3.0a: Thirteen year rainfall data for the area ...................................................262
Appendix 3.0b: Rainfall (mm) distribution in the study area, for thirteen years (1999/00
to 2011/12 cropping season) ............................................................................................262
Appendix 3.0c: Rainfall (mm) distribution in the study area for the 2011/12 cropping
season ...............................................................................................................................264
Appendix 3.1a: Pigeon pea height data in the main experiment season 1 .......................265
Appendix 3.1b: Pigeon pea height data in the main experiment season 1 .......................266
Appendix 3.2a: Nutrient concentration and yields, fresh leaves pigeon pea main
experiment season one .....................................................................................................267
Appendix 3.2b: Nutrient concentration and yields, twigs pigeon pea main experiment
season one ........................................................................................................................268
Appendix 3.2c: Nutrient concentration and yields, litter pigeon pea main experiment
season one ........................................................................................................................269
Appendix 3.3a: Nutrient concentration and yields, groundnut pods main experiment
season one ........................................................................................................................270

xxvii
Page
Appendix 3.3b: Nutrient concentration and yields, groundnut haulms main experiment
season one ........................................................................................................................271
Appendix 4.0a: Daily temperature at the time of nitrate nitrogen measurement .............272
Appendix 4.0b: Daily temperature at the time of nitrate nitrogen measurement.............273
Appendix 4.0c: Off season daily temperature at the time of nitrate nitrogen measurement...
....................................................................................................................................274
Appendix 4.0d: Rainfall and mean daily temperature December, 2012 ..........................275
Appendix 4.0e: Rainfall and mean daily temperature readings for the month of January,
2013..................................................................................................................................276
Appendix 4.0f: Mean daily temperature readings for the month of May and June, 2013. ....
....................................................................................................................................276
Appendix 4.1: Soil pH at the time of nitrate nitrogen measurement ...............................277
Appendix 4.1: Soil pH at the time of nitrate nitrogen measurement ...............................279
Appendix 4.2: Soil temperature at the time of soil nitrate nitrogen measurement ..........281
Appendix 4.3: Soil humidity at the time of soil nitrate nitrogen measurement ...............283
Appendix 4.3: Soil temperature at the time of soil nitrate nitrogen measurement ..........285
Appendix 4.4: Soil humidity at the time of soil nitrate nitrogen measurement ...............287
Appendix 4.5: Soil nitrate nitrogen, day 1 .......................................................................289
Appendix 4.6: Soil nitrate nitrogen, day 2 .......................................................................291
Appendix 4.7: Soil nitrate nitrogen, day 3 .......................................................................293

xxviii
Page
Appendix 4.8: Soil nitrate nitrogen, day 4 .......................................................................295
Appendix 4.9: Soil nitrate nitrogen, day 5 .......................................................................297
Appendix 4.10: Soil nitrate nitrogen, day 6 .....................................................................299
Appendix 4.10: Soil nitrate nitrogen, day 7 .....................................................................301
Appendix 4.11: Soil nitrate nitrogen, day 1 .....................................................................303
Appendix 4.12: Soil nitrate nitrogen, day 2 .....................................................................305
Appendix 4.13: Soil nitrate nitrogen, day 3 .....................................................................307
Appendix 4.14: Soil nitrate nitrogen, day 4 .....................................................................309
Appendix 4.15: Soil nitrate nitrogen, day 5 .....................................................................311
Appendix 4.16: Soil nitrate nitrogen, day 6 .....................................................................313
Appendix 4.17: Soil nitrate nitrogen, day 7 .....................................................................315
Appendix 4.6: Off season nitrate nitrogen data from the nitrate meter and the KCl method..
....................................................................................................................................317
Appendix 5.0a: N and P yield in groundnut haulms parallel experiment, season two ....320
Appendix 5.0b: N and P yield in groundnut shells parallel experiment, season two ......321
Appendix 5.0c: N and P yield in groundnut grain parallel experiment, season two ........322
Appendix 5.0d: Yield parameters for groundnut in the parallel experiment, season two .....
....................................................................................................................................323
Appendix 5.1a: N and P yield in pigeon pea litter parallel experiment, season two .......325

xxix
Page
Appendix 5.1b: N and P yield in pigeon pea fresh leaves parallel experiment, season two ..
....................................................................................................................................327
Appendix 5.1c: N and P yield in pigeon pea twigs parallel experiment, season two ......328
Appendix 5.1d: N and P yield in pigeon pea stems parallel experiment, season two .....329
Appendix 5.1e: N and P yield in pigeon pea roots parallel experiment, season two .......331
Appendix 6.0: Nutrient uptake, groundnut at flowering parallel experiment season two .....
....................................................................................................................................333
Appendix 6.1: Nutrient uptake, pigeon pea at flowering parallel experiment season two ....
....................................................................................................................................334
Appendix 6.2a: N and P uptake by the maize plants at silking stage ..............................335
Appendix 6.2c: Stover yield, main experiment season two .............................................341
Appendix 6.2d: Rachids yield, main experiment season twoAppendix 6.2e: Cob length, ....
main experiment season two ............................................................................................355
Appendix 7.0: Fertilizer calculations main and parallel experiment ...............................361

xxx
LIST OF ABBREVIATIONS AND SYMBOLS
AGRA: Alliance for a Green Revolution in Africa
AE: Agronomic Efficiency
BD: Bulk Density
BNF: Biological Nitrogen Fixation
GoM: Government of Malawi
FARA: Forum for Agricultural Research in Africa
FISP: Fertilizer and Inputs Subsidy Program
LER: Land Equivalent Ratio
NUE: Nutrient Use Efficiency
NSO: National Statistical Office
OM: Organic Matter
PFP: Partial Factor Productivity
RE: Recovery Efficiency
SSA: Sub Saharan Africa
SOM: Soil Organic Matter
TSP: Triple Super Phosphate
XRF: X-ray fluorescence

1
CHAPTER ONE
1.0 GENERAL INTRODUCTION
1.1.0 Soil fertility and soil fertility status
Soil fertility has been defined as the soil’s ability to provide nutrients, in adequate
amounts and in proper balance, for the growth of plants when other growth factors are
favourable (Johnson et al., 2000). For optimal crop production a soil that allows for
deep rooting, provides aeration, has good water holding capacity, and contains
adequate and balanced supply of plant nutrients is considered a productive and fertile
soil (Millar and Turk, 2002). Soils on arable lands in sub Saharan Africa (SSA) in
general and Malawi in particular are highly degraded, principally due to inappropriate
soil management practices (Phiri et al., 2010; Ahaneku, 2010). Some of these practices
include; mono-cropping, sole dependence on mineral fertilizers as soil amendments,
non incorporation of crop residues into the soil after harvest and limited attention to
soil and water conservation practices like soil erosion control practices, mulching and
use of contour bunds, among other practices.
1.1.1 Soil fertility management
Maintenance of soil organic matter (SOM) at levels (0.85-3.4%) (Musinguzi et al.,
2013) that sustain optimal supply of soil nutrients for uptake by crops and enhance
efficiency of applied mineral fertilizers is a major challenge for smallholder farming
systems of southern Africa (Mapfumo et al., 2007). Many reports have shown that use
of inorganic fertilizers alone may lead to defficiency of nutrients not supplied by the
chemical fertilizers and may also lead to chemical soil degradation (Mafongoya et al.,
2006), like loss of the soil’s natural buffering capacity. Chemical fertilizers are also too

2
costly for farmers to apply the recommended rates. On the other hand, there are
demonstrated benefits of the use of organic sources of plant nutrients on soil properties
like soil pH, water holding capacity, hydraulic conductivity and infiltration and
decreased bulk density (Mafongoya et al., 2006). SOM is a key factor in soil
aggregation that leads to improved soil porosity hence increasing the infiltration,
storage and drainage of water, improving soil aeration, and the ease of penetration of
plant roots (Verhulst et al., 2010). However, sole application of organic sources of
plant nutrients is constrained by their low contents and availability of the essential
nutrients, N in particular, to the current crop (Nyamagara et al., 2009), imbalanced
nutrient contents, unfavorable quality and high labor demands for transporting the
bulky organic materials (Palm et al., 1997).
Many researchers have suggested that the alternative is to use the integrated approach
to soil fertility management (ISFM), which among other things involves the combined
application of organic and inorganic fertilizers for the improvement of crop yields and
maintenance of soil fertility (Bationo et al., 2005). Vanlauwe et al. (2010) suggested an
operational definition of ISFM as ‘the set of soil fertility management practices that
necessarily include the use of fertilizers, organic inputs, and improved germ plasm,
combined with knowledge on how to adapt these practices to local conditions, aiming
at maximizing agronomic use efficiencies of the applied inputs and improving crop
productivity. However, Musinguzi et al. (2013) propose to define ISFM as a practice of
improving and restoring soil fertility while optimizing yields using a set of soil fertility
management practices that necessarily includes organic and mineral fertilizers,
improved germ plasm; and using a set of knowledge to adapt them to a given
3
environment, while targeting maximizing production and recovery efficiencies of
applied nutrients for sustainable land use intensification. Abera (2005) reported that
half the number of smallholder farmers in SSA may reduce N fertilizer rates if high
quality green manure rich in N is used in legume-cereal rotation cropping systems,
while Kumwenda et al. (1995) was of the idea that comprehesion by farmers on the
positive effects of OM application on NUE could increase the number of inorganic
fertilizer users by reducing the amount of mineral fertilizer that farmers would purchase
for application in their fields.
1.1.2 Consequences of declining soil fertility on soil and crop productivity
The chief consequence of soil degradation has been declining soil fertility and resultant
low soil productivity (Amede, 2003). For instance, the average maize grain yield in
Africa is estimated to be at 1.7 tons ha-1
compared with the global average of about 5
tons ha-1
(FARA, 2009). In Malawi, the national yields of maize have averaged 1.3 t ha-
1 during the last 20 years (FAO, 2008) against a yield potential range of 6 to 10 t ha
-1 of
many maize hybrid varieties currently grown by some progressive Malawian farmers.
In the 2005/06 season, the national average maize yield was estimated to be at 1.6 t ha-
1. A strong Government-led Farm Input Subsidy Program (FISP) with special emphasis
on the use of inorganic fertilizer, increased the national average maize yield to over 2 t
ha-1
in the 2006/07 season (WFP, 2009). The low productivity is attributed largely to
low plant nutrient availability and nutrient use efficiency (Sakala, 2004).
Prevailing economic conditions in Malawi have limited the use of mineral fertilizers by
smallholder farmers, due to their low purchasing power. At the same time, annual
estimates indicate an increase in nutrient losses under various farming systems through

4
different pathways (Kanyama-Phiri, 2005), for example; through soil erosion, leaching
and denitrification. Total national estimates for annual nutrient losses of around
160,000 metric tons, lost mainly through nutrient mining by crops have been reported,
with annual estimates of inorganic fertilizer nutrient inputs into the farming systems
pegged at 70,000 metric tons thus leaving a net deficit of 90,000 metric tons
(Kanyama-Phiri, 2005). About 52.4% of Malawi’s 13 million people live below the
poverty line, of 1US$/day (GoM, 2006), yet the delivery price for a metric ton of urea
from the ocean ports of East African countries is $770 (Cornway and Waage, 2010),
translating to $38.5/50 kg bag. Certainly, this is beyond the smallholder farmers’
purchasing power, hence the low use of the mineral fertilizers by the farmers.
Conscious of the smallholder farmers’ resource limitations, the Government of Malawi
(GoM) introduced the targeted fertilizer subsidy program. This program is tailored to
reach out to resource poor smallholder farmers with the aim of boosting agricultural
production at village and national levels. However, many smallholder farmers are not
able to access the facility. This is due to the fact that the quantity of the fertilizers
purchased by the Government for the program usually is not enough (Phiri et al., 2010).
1.1.3 Challanges affecting agricultural productivity in Malawi
Socially, the HIV/AIDS pandemic and related chronic ailments are paralyzing the most
productive age group of Malawi’s society rendering them agriculturally ineffective. By
2013 the prevalence rate among adults aged 15 to 49 years was estimated to be at
10.3% (UNAIDS, 2013). This, coupled with the highlighted biophysical and
economical impediments to sustainable and increased agricultural productivity, has
kept the populace within the confines of an unyielding poverty trap. Furthermore, on
farm maize grain yield response to the application of N from inorganic fertilizers

5
(PFPN) is low as a result of declining levels of soil organic matter (SOM), deficiencies
of macro and micronutrients and reduced soil buffering capacity (Kumwenda et al.,
1995). According to Waddington et al. (2004), PFPN is usually below 20 kg maize
grain kg-1
nitrogen applied.
1.1.4 Strategies for improving soil and crop productivity
Not with standing the above, ample evidence is available attesting to the fact that gains
in crop productivity are realizable from nutrient additions through the combination of
organic and inorganic sources of plant nutrients compared with each input applied
alone (Swift et al., 1994). Bationo et al. (2006) stated that a combination of mineral and
organic soil amendments is necessary to sustain and improve crop production on
depleted soils. Combination of mineral fertilizers and organic nutrient sources often
results in synergistic effects on crop yields (Opala, 2010). Studies by Murwira and
Kirchmann (1993), showed that synchrony between N release and crop uptake was best
achieved by applying combinations of manure and mineral N and having it in such a
way that the N is applied as top dressing or side dressing. It was observed that late
application of mineral N reduced the amount of N lost through leaching. Similar results
were also reported in biomass transfer systems using manures and inorganic fertilizers
on vegetables (Kuntashula et al., 2004) and improved fallows when combined with
small amounts of inorganic fertilizers. This could be attributed to P additions from
inorganic fertilizers or K or N which may not be supplied in sufficient amounts by
organic inputs alone leading to better synchrony of nutrient release and uptake.
1.1.5 Crop residue management for soil organic matter and fertility improvement
The Soil Science Society of America (SSSA) (2001) defines SOM as the total organic
fraction of the soil exclusive of undecayed plant and animal residues. OM in the soil

6
balances various chemical and biological processes and helps to maintain soil quality
parameters at desirable level (Weil and Magdoff, 2004). It improves water infiltration
rate, water retention capacity, serves as a reservoir of nutrients and water and supplies
them to crops when needed (Weil and Magdoff, 2004). Soils that are rich in OM also
have a high cation exchange capacity (CEC) (Weil and Magdoff, 2004). SOM contains
many negatively charged surfaces with a high affinity for organics and metals that
might otherwise cause pollution (Allen et al., 2011). SOM has a high pH buffering
capacity to resist drastic changes in soil pH (Weil and Magdoff, 2004). With a high
level of SOM soil tilth is improved, and aggregate size tends to be large with good soil
structure (Allen et al., 2011). Soil microbial diversity and quantity generally improve as
SOM increases. Microbes are major players of the OM decomposition process. With a
high level of SOM, beneficial microorganisms reproduce and grow in the soil, which
hastens the decomposition process (Allen et al., 2011).
SOM is highly sensitive to management practices (Wander, 2004). An increase SOM
content helps reversing land degradation and often increases soil fertility and crop
production (Weil and Magdoff, 2004). Crop residue refers to any organic material
including stubble, that remains after an economic crop is harvested from a field (Idaho,
2014). There are several ways of managing residue for adding OM to the soil
particularly if C:N ratio is very high. Residue can be chopped, incorporated (with or
without chopping), or can be left to decompose on the surface. Removing crop residues
from fields reduces the amount of biomass available for conversion to SOM
(Gelderman et al., 2011). SOM levels are determined by the relative rates of production
and decomposition of both the above and below ground plant biomass material
(Gelderman et al., 2011). Residue removal from crop fields coupled to sole use of

7
mineral fertilizer can lead to a decrease of SOM through increased SOM mineralization
rates (Termorshuizen et al., 2005). A decrease of 6% SOM over five years for
continuous no-till maize when approximately 50% of the crop residue was removed
each year has been reported (Varvel et al., 2008). The nutrients removed can be
replaced through the use of inorganic fertilizers, but at the expense of other vital
functions of SOM like buffering soil pH and increasing the soil’s water holding
capacity (Gelderman et al., 2011). The amounts of crop residues required to maintain
SOM vary with soil types and management options (Gelderman et al., 2011). Crop
residues removal in excess of SOM maintenance levels will ultimately result in the
deterioration of the soil resource and lead to declining yields (Gelderman et al., 2011).
Since SOM levels in cultivated fields are already much reduced from native levels, it is
prudent to manage crop residues in a bid to limit the deterioration of the soil resource.
1.1.6 Nutrient use efficiency
Nutrient use efficiency in a cropping system is frequently defined as the proportion of
all nutrient inputs that are removed in harvested crop biomass, contained in recycled
crop residues, and incorporated into soil organic matter and inorganic nutrient pools
(Cassman et al., 2002). According to Mikkelsen (2005), for N, this value frequently
varies between 40 and 60%. Another common definition of NUE is the nutrients
recovered by plants within the entire soil-crop-root system. For N, this value may be in
the range of 65 to 85% (Mikkelsen, 2005). Mosier et al. (2004) described 4 agronomic
indices commonly used to describe nutrient use efficiency namely; partial factor
productivity (PFP, kg crop yield per kg nutrient applied), which is the most widely
used; agronomic efficiency (AE, kg crop yield increase per kg nutrient applied);
apparent recovery efficiency (RE, kg nutrient taken up per kg nutrient applied); and

8
physiological efficiency (PE, kg yield increase per kg nutrient taken up). For N, Hirel
et al. (2011) indicated that use efficiency is the product of absorption efficiency, that is
the amount of absorbed N (quantity of available N)-1
and the utilization efficiency that
is the yield (absorbed N)-1
. Hirel et al. (2007) indicated that among crops, there exists
genetic variability for both N absorption efficiency and for N utilization efficiency.
1.1.7 Improving crops’ nutrient use efficiency for increased productivity
Limited research in Malawi has shown that the low maize grain yield response can be
increased through the combined use of organic and inorganic nutrient sources. For
example, Sakala et al. (2004) reported that applying a combination of organic (Mucuna
puriens at 2.7 tons, Crotalaria juncea 3 tons and Lab lab purpureus 2.7 tons) and
inorganic fertilizer (35 and 69 kg N ha-1
) to maize, increased nutrient use efficiency of
the crop above 20 kg grain yield kg-1
N applied. Unfortunately, these findings have
remained in grey literature primarily because the green manure crops used by the
researchers were not the traditional crops grown by Malawian farmers due to either
their relative edibility like the Mucuna grains have a special preparation recipe or
inedibility as is the case with Crotalaria juncea. As such, efforts to out scale the
technologies have proved to be futile. Further research on NUE therefore, is required
but this time using edible legumes grown by farmers that have a high biological N
fixing capacity, for example, the pigeon pea and groundnut.
Globally, improvement of crop N use efficiency is still a challenge (Snyder and Fixen,
2012) due to inappropriate nutrient management practice. Randall et al. (2008) reported
that the apparent above-ground, growing season recovery of applied N by maize (Zea
mays L.), ranges below 40 to 50%. Dobermann and Cassman (2002) argues that

9
apparent N recoveries above 70% are achievable for many cereal crops through
intensive site specific nutrient management. This is attainable upon the use of
principles of 4R nutrient stewardship (right source at the right rate, right time, and on
the right place) (Bruulsema et al., 2008), deployed concurrently with optimum
management of other cropping system resources and inputs (Snyder and Fixen, 2012).
A 25% increase in crop N use efficiency above current reported levels is being
advocated by the government of the United States of America through the
Environmental Protection Agency (Dobermann 2007) through more intensive, skilled
nutrient and cropping system management (Snyder and Fixen, 2012). David
et..al..(2010) observed that poorly managed, imbalanced, and inefficient agricultural N
use impairs the ability to provide food, feed, fiber and biofuel; raises the risks for N
loss to groundwater and surface water resources; and increases the potential for direct
and indirect emissions of the potent green house gas, N2O.
1.1.8 Nutrient management for improved nutrient use efficiency
It is worthwhile to note that nutrient management plays an important role in helping
optimize crop response to inputs (Bruulsema et al., 2009), necessitating its inclusion in
the overall cropping system management under smallholder farms (Snyder and Fixen,
2012). Nutrient management aims at the maintenance and possible improvement of soil
fertility for sustained crop productivity on long term-basis and also to reduce inorganic
fertilizer input costs (Praharaj et al., 2007). Aspects embraced in this approach includes
appropriate soil and water conservation practices (Delgado and Bausch, 2005),
integrated pest management, and the use of adapted crop varieties and hybrids, which
are input-efficient and responsive to management (Cassman, 1999) at optimum
densities (Ping et al., 2008). In practical terms, NUE for crops can be enhanced through

10
the adoption of appropriate sustainable agricultural practices, judicious use of
fertilizers, crop rotation, establishment of ground cover and incorporation of the crop
residues into the soil (Hirel et al., (2011). Judicious use of soil amendments entails the
application of both organic and inorganic sources of plant nutrients in correct amounts
at appropriate growth stages of the crops and under appropriate conditions to prevent
runoff or leaching of the applied nutrients (Hirel et al., 2007), hence increased use
efficiency by the crops. Alternatively, cropping systems employing carefully designed
species mixtures (Malézieux et al., 2009) like for example, intercropping legumes with
legumes and rotating with maize, may be a route towards lower N fertilizer input, while
maintaining economic profitability (Malézieux et al., 2009) other plant growth factors
being optimal.
The recovery of applied mineral N from agricultural production systems globally is
about 50% (Krupnik et al., 2004). The surplus may accumulate in soils, lost to air,
ground and surface water through various pathways (Eickhout et al., 2006). Losses
from the soil-plant system are due to denitrification in the form of gaseous dinitrogen
(N2), nitrous oxide (N2O) and nitric oxide (NO), volatilization of ammonia (NH3),
leaching of nitrate (NO3-), runoff and erosion (FAO/IFA, 2002). Cassman et al. (2002)
observed that N use efficiencies from experimental plots do not accurately represent the
efficiencies obtainable in farmers’ fields. The disconnect in the results mainly arises
from differences in the scale of farming operations and differences in N management
practices (Cassman et al., 2002). According to Cassman et al. (2002) the effect of scale
influences both N fertilizer application and other management operations like tillage,
seeding, weed and pest management, and harvest, which also affect efficiency.
Consequentially, NUE in well managed research experiments is generally greater (50-
11
80%) than the efficiency of the same practices applied by farmers in production fields
(Cassman et al., 2002). For instance the REN, achieved by rice farmers in four major
rice producing Asian countries is 31% of applied N (Dobermann et al., 2002). This
differs markedly with REN for rice in well managed field experiments which range
from 50–80% (Cassman et al., 2002). It is on record that from the early 1980s in the
USA PFPN has increased (Frink et al., 1999) by 36% in the last 21 years, from 42 kg
kg–1
in 1980 to 57 kg kg–1
in 2000 (Cassman et al., 2002) attributable to improved soil
fertility management. Edmonds et al. (2009) reported that in sub Saharan Africa (SSA),
for cereal production on smallholder’s farms, generally, NUEs usually exceed 100%.
The high NUEs for SSA are a direct result of applying low amounts of mineral N
(Edmonds et al., 2009) with resultant nutrient mining by crops from soils and low
yields.
1.1.9 Strategies for enhanced and sustainable agricultural production
Sustainable agriculture involves the successful management of agricultural resources to
satisfy human needs while maintaining or enhancing environmental quality and
conserving natural resources for future generations (FAO, 2002). Improvement in
agricultural sustainability requires, alongside effective water and crop management, the
optimal use and management of soil fertility and soil physical properties. Both rely on
soil biodiversity and soil biological processes. This requires the widespread adoption of
management practices that enhance soil biological activity and thereby build up long-
term soil productivity and health (FAO, 2002). At farming system level the concept of
sustainable agriculture focuses on types of technology and strategies that reduce
reliance on non-renewable or environmentally harmful inputs. These include eco-

12
agriculture, organic, ecological, low-input, biodynamic, environmentally-sensitive,
community-based, farm-fresh and extensive strategies.
1.1.10 Intercropping
Intercropping is the practice of cultivating two or more crops in the same field at the
same time (Machado, 2009). The goal of intercropping is to achieve increased crop
yields on a piece of land through maximized crop growth resource use efficiency
(Machado, 2009). Crops grown in this system may not be sown or harvested at the
same time, but are grown simultaneously during their respective cropping cycle
(Lithourgidis et al., 2011). Intercropping can include: annual plants with annual plants
intercrop; annual plants with perennial plants intercrop; and perennial plants with
perennial plants intercrop (Eskandari et al., 2009).
Legumes through their symbiotic relationship with nodule dwelling bacteria fix
atmospheric N through biologically changing it from the inorganic form to forms that
are available for uptake by plants (Lithourgidis et al., 2011). Legumes grown on soils
with low N derive their N requirements entirely from the process of BNF while cereals
grown in rotation with maize may partially satisfy their N requirements from N fixed
by the previous legume if residues are incorporated into the soil, which is alternative
and sustainable way of introducing N into low input cropping systems (Fustec et al.,
2010). In addition, roots of the legumes decompose and release N into the soil thereby
increasing soil N reserves for uptake by subsequent crops (Lithourgidis et al., 2011).
Compared to monocropping, intercropping provides increased diversity, which facili-
tates better biological control of pests and reduced soil erosion (Machado, 2009).
Legumes intercropped with cereals can also provide soil cover, as they also smother

13
weeds, provide habitat for pest predators and increase microbial diversity such as
vesicular arbuscular mycorrhizae (VAM) (Machado, 2009). On weed suppression,
intercropping of cereals and cowpea has been observed to reduce striga infestation
(Khan et al., 2002). This was attributed to the soil cover by the cowpea that created an
unfavorable conditions for striga germination (Mbwaga et al., 2001). In Zimbabwe,
Mashingaidze (2004) found that maize-bean intercropping reduced weed biomass
through supression by 50-66% when established at a density of 222,000 plants ha-1
for
beans equivalent to 33% of the maize density (37,000 plants ha-1
) due to more surface
cover. Machado (2009) observes the need for more research in intercropping systems
before up and out scaling of this technology for potential adoption by farmers. This is
the case since choice and management of intercrops requires good planning, that
includes selection of appropriate cultivars and application of proper spacing or plant
density among other factors (Machado, 2009). For instance, Morgado and Willey
(2003) reported that dry matter yield accumulation of individual maize plant decreased
with increase in bean plant population. Muoneke et al. (2007) found that increasing
maize planting density reduced soybean seed yield by 21 and 23% at maize planting
density of 44,440 and 53,330 plants ha-1
, respectively compared with intercropping at
38,000 maize plants ha-1
, attributable to increased competition for growth resources in
the cropping system. A clear indication of the need for adequate agronomic research on
a variety of crop production aspects inorder to derive suitable recommendations for
yield optimization is mandatory.
Machado (2009) further observed that the success of an intercrop system rests on
understanding the physiology of the species involved, their growth habits, canopy and
root architecture, water and nutrient use. Plants compete for light above ground and for

14
water and nutrients below ground, so competition involves a combination of climatic
and soil factors in space and time. What begins as nutrient competition may culminate
into a shade issue, as different species compete for various resources at differing times
in their growth cycle (Machado, 2009). This spells the need to establish crop
compatibility under intercropping systems. In general, intercropping systems are useful
in terms of increasing productivity and profitability per unit area, water and radiation
use efficiency, control of weeds, pests and diseases (Matusso et al., 2012). Other
advantages of intercropping include potential for increased profitability and low fixed
costs for land as a result of a second crop in the same field (Thobatsi, 2009).
Additionally, intercropping system provides higher financial returns to smallholder
farmers than monocropping (Seran and Brintha, 2010).
1.1.11 Legume-legume intercropping
The main goal of legume-legume intercropping is to increase N yields by the N fixing
legumes and hence the amount of N returnable to the soil upon incorporation of the
biomass into the soil. Compared to short duration legumes like groundnut, long
duration legumes like the pigeon pea fix more N biologically, enhance P availability
and yields of subsequent cereal crops (Bezner Kerr et al., 2007). However, it has been
observed that short duration legumes usually have the higher grain yield potential than
long duration legumes, while contributing low amounts of nutrients to the soil if their
residues are incorporated due to low biomass yields (Hardarson and Atkins, 2003).
Hence intercropping two legumes with differing duration for maturation would yield
multiple benefits interms of soil fertility improvement and increased economic yields.
Short duration genotypes like the groundnut largely, are grown for commercial
purposes, while the long duration counterparts like the pigeon pea are adaptable into

15
relay intercrops and subsistence production systems (Rego and Nageswara, 2000).
Integration of legumes requires consideration of the competitive effect intercropping on
water and nutrient availability to the crops (Bezner Kerr et al., 2007).
Soil fertility benefits of legume integration into cropping systems depend on the
amounts of biomass produced and residue management (Bezner Kerr et al., 2007).
Edible legumes apart from the grain, usually their leaves are harvested and cooked for
relish or used as fodder for livestock thereby reducing nutrient input to the soil (Bezner
Kerr et al., 2007). It is on record that regular and proper addition of organic materials
(crop residues) maintains good soil tilth, improves fertility and productivity of
agriculture, controls wind and water erosion, and prevents nutrients losses by run-off
and leaching (Bukert et al., 2000).
1.1.12 Evaluation of the productivity of intercropping systems
The LER is a measure of the yield advantage obtained by growing two or more crops or
varieties as an intercrop compared to growing the same crops or varieties as a
collection of separate monocultures (Andrews and Kassam, 1976). The Land
Equivalent Ratio (LER) is used to evaluate the productivity of intercrops against the
monocultures. The LER is calculated using the formula LER= ∑ (Ypi/Ymi), where Yp
is the yield of each crop or variety in the intercrop or polyculture, and Ym is the yield
of each crop or variety in the sole crop or monoculture. For each crop (i) a ratio is
calculated to determine the partial LER for that crop, then the partial LERs are summed
to give the total LER for the intercrop. An LER value of 1.0 indicates no difference in
yield between the intercrop and the collection of monocultures (Mazaheri and Oveysi,
2004). Any value greater than 1.0 indicates a yield advantage for intercrop. A LER of

16
1.2 for example, indicates that the area planted to monocultures would need to be 20%
greater than the area planted to intercrop for the two to produce the same combined
yields
1.1.13 Crop rotation
Bruns (2012) defined crop rotation as the production of different economically
important plant species in recurrent succession on a particular field or group of fields.
Rotational systems reduce the presence of parasitic weeds and soil-borne pests
(Kabambe and Mloza-Banda, 2000). Bruns (2012) noted that one main benefit of crop
rotation is the breaking of crop pest cycles. It is on record that crop rotations help in the
control of crop disease problems such as gray leaf spot in maize (Cercospora zeae-
maydis), take-all in wheat (Gaeumannomyces graminis var. tritici), and sclerotina in
soybean (Sclerotinia sclerotiorum) (Roth, 1996), through prevention of the buildup of
large populations of pathogens (Krupinsky et al., 2002). Appropriate crop rotation
increases OM in the soil, improves soil structure, reduces soil nutrient depletion and
can result in higher yields and greater farm profitability in the long-term (Overstreet,
2009). Crop rotations may influence the rate of N mineralization hence availability for
plant uptake through modification of soil moisture, soil temperature and pH (Al-Kaisi,
2001). Increased levels of SOM through biomass incorporation into the soil enhances
water and nutrient retention, the result being increased nutrient uptake by crops and use
efficiency (Overstreet, 2009). Crop rotation involving nitrogen-fixing crops, can reduce
the input of mineral fertilizers to the succeeding crop through N addition via
incorporation of crop residues into the soil. Dias, et al. (2014) outlines the potential
benefits of crop rotation one of them being breaking the dominance of weeds. The
system is recommended as a management strategy against herbicide-resistant weeds;

17
improving soil structure hence the development of different plant rooting systems that
can effectively exploit the soil; resulting in less soil compaction leading to improved
plant nutrition with increased carbon sequestration; enhanced soil quality as a result of
the various crop residues that improve the quality of SOM, particularly when
leguminous plants are used; reducing soil erosion by at least 30% compared with
intensive single-culture systems; preventing groundwater pollution; and contributing to
landscape diversity, thereby promoting biodiversity.
Many crops can be included into different crop rotations, making the number of
possible combinations very high. It follows therefore, that designing crop rotations
must follow certain principles. (Dias et al., 2014). Four basic principles are used in
choosing crops to be included in a rotation system. This includes: the crop’s ability to
reduce soil erosion, maintain or improve SOM content, manage plant nutrition and
control of pests (Dias et al., 2014). Dias et al. (2014) stipulated that additionally, as
novel scientific advances become available, other important criteria for choice of crop
to be included in a rotation system that currently are not widely used can, and should,
be tested. For instance, the influence of plant–soil microbe interactions and soil biota
feedbacks on plant health and plant performance which are well established for natural
ecosystems (Dias et al., 2014) should be given due consideration. For example mean
yield benefits of up to 20% or more can be obtained in rotation systems involving
wheat and break crops like Brassica (Kirkegaard et al., 2008). Working on groundnut–
maize crop rotation experiments on station and on farm in Zimbabwe, Waddington et
al. (2007) reported that three rotational cycles generated evidence for the substantial
improvement in the productivity and sustainability of maize. Clear large benefits were
registered from rotations both with and without fertilizer applied to the succeeding

18
maize crop. The additive benefits of the rotation and mineral fertilizer application
almost doubled maize grain yields up to 8 t ha-1
on station (Waddington et al. (2007).
The approximate doubling of maize grain yield after groundnut was similar to that
reported by Mukurumbira (1985). Benefits from the rotation on farm were smaller,
with unfertilized maize production in rotation still increasing yield by about 15%
compared with continuous maize cropping, with some groundnut produced along side
as a bonus (Waddington et al. (2007). Work conducted in Malawi for a period of three
years (1997/98-1999/2000) on farm and on station showed that maize grain yields
obtained after a Mucuna-maize rotation (one year improved fallow of Mucuna) were
significantly higher than maize yields obtained under continuous maize without added
fertilizer inputs (3.5 t ha-1
versus 1.0 t ha-1
) (Sakala et al., 2003)
1.1.14 Pigeon pea
Pigeon pea (Cajanus cajan (L.) Millsp.) is an erect perennial legume shrub often grown
as an annual, reaching 1–4 meters in height (Valenzuela and Smith, 2002). The leaves
have three leaflets that are green and pubescent above and silvery grayish-green with
longer hairs on the under side (Valenzuela and Smith, 2002). The flowers are yellow
with red to reddish-brown lines or a red outside (Valenzuela and Smith, 2002). Pigeon
pea seedlings emerge 2–3 weeks after sowing. Vegetative growth begins slowly but
accelerates at 2–3 months (Valenzuela and Smith, 2002). Pigeon pea roots are thin with
a deep-rooting taproot reaching up to 2 m in depth (Valenzuela and Smith, 2002).
1.1.15 Environmental requirements
Pigeon pea can be grown in a wide range of soil textures, from sandy soils to heavy
clays. It grows best at a soil pH of 5.0–7.0 but tolerates a wider pH range (pH 4.5–8.4).

19
It does well in low fertility soils, making it a favorite among subsistence farmers
(Valenzuela and Smith, 2002). As with most legumes, it does not tolerate water logged
or flooded conditions for very long periods. Pigeon pea is heat-tolerant and grows well
in hot, humid climates and thrives under annual rainfall between 600–1000 mm
(Valenzuela and Smith, 2002). It is generally grown where the temperatures are in the
range of 18–30°C, but under moist soil conditions it can withstand temperatures of
35°C or more (Valenzuela and Smith, 2002). Once established, it is one of the most
drought tolerant of the legumes, and it can be grown in rainfed conditions or with
minimal irrigation (Valenzuela and Smith, 2002) as the tap root accesses moisture from
deeper soil horizons. Pigeon pea is grown in a variety of agro-ecological zones, and are
well adapted to semi-arid climate conditions (Mutegi and Zingore, 2014).
In SSA pigeon pea is widely grown in Kenya, Uganda, Tanzania, Malawi and
Mozambique for subsistence and for domestic and international markets. Despite
potential yields of about 5 t ha-1
(Kimani, 2001), pigeon pea yield less than 1 t ha-1
in
the farmers fields (FAOSTAT, 2008) due to poor management. With global climate
change, pigeon pea will become more important for managing food security and
nutritional situation in Africa due to the fact that pigeon pea usually yields some grain
under moisture stress during dry spells compared to other grain legumes (Mutegi and
Zingore, 2014). Pigeon pea can fix 150-200 kg ha-1
of atmospheric N biologically in the
soil especially when supplied with P (ICRISAT, 2003).
1.1.16 Groundnut
Groundnut (Arachis hypogaea L.) is one of the world’s most popular oil seed crops
which is grown as an annual plant but perennial growth is possible in climates which

20
are warm until harvest (Farag and Zahran, 2014). It is best cultivated in well drained
sandy or sandy loam soils with pH ranging from 5.5 to 6.5 (Farag and Zahran, 2014).
Groundnut is the most widely cultivated legume in Malawi, which accounts for 25
percent of household’s agricultural income (Diop et al., 2003). The crop provides a
number of benefits to smallholder farmers, for instance improvement of soil fertility
through BNF and saves fertilizer costs for subsequent crops; forms an important
component of both rural and urban diets like a source of valuable protein, edible oil,
fats, energy, minerals, and vitamins (Longwe-Ngwira, 2012). Groundnut is consumed
or processed into oil. In livestock-farming communities, groundnut can be used as a
source of livestock feed and increases livestock productivity (Longwe-Ngwira, 2012).
Groundnut yields are still very low in Africa, averaging about 800 kg ha-1
, compared to
the potential yield of 3,000 kg ha-1
(Longwe-Ngwira, 2012). The wide gap between
actual and potential yields is attributable to several factors, including non-availability
of seed of improved varieties, low soil fertility, inappropriate crop management
practices, as well as pests and diseases (Longwe-Ngwira, 2012). Groundnut has the
capacity to biologically fix up to 235 kg N ha-1
(Peoples et al., 1995).
1.1.17 Legume based soil fertility rejuvenating technology
In practical terms soil fertility restoration and improvement could involve utilization of
legume based soil fertility improving technologies like the double legume intercropping
system. In this approach, the main line of action is to restock SOM on smallholder
farms, achievable through incorporation of nitrogen rich biomass from legumes into the
soil. This would boost levels of nutrients in the soils, increase the soil’s ability to retain
nutrients, buffer soil pH and increase the soil’s water holding capacity. Legume
biomass incorporation into the soil has to be coupled with modest supplementation of

21
nutrients like nitrogen and phosphorus from mineral sources since their concentrations
in the biomass are low. The biomass should be generated on farmers’ fields, achievable
through large scale integration of both edible and non edible legumes in various
cropping systems (Bezner-Kerr, 2007). Priority though, has to be given to edible
legumes which generate ample biomass. Candidate edible legumes and a cropping
system have been proposed (Kanyama-Phiri et al., 2008), which include; pigeon pea,
groundnut and soybean among others grown in the double legume intercrop-maize
rotation cropping system (Kanyama-Phiri et al., 2008). Incorporating residue of
legumes in this cropping system might lead to increased N and OM levels in the soil
thereby increasing nutrient use efficiency (NUE) and crop productivity. On this
foundation, an indepth study was conducted at Chitedze Agricultural Research Station
in Malawi to investigate this proposition. The overall objective of the study was to
improve soil productivity through enhancement of nitrogen stocks and N use efficiency
of maize using the pigeon pea-groundnut intercrop in rotation with maize for increased
and sustainable maize production. The specific objectives were to:
i) characterize the soils at the trial site in terms of their chemical and physical
properties and hence the fertility status.
ii) assess the effect of intercropping medium and long duration pigeon pea
with groundnut on pigeon pea growth rates and yields.
iii) assess the effect of the biomass incorporation on soil NO3-‒N in the pigeon
pea-groundnut intercropping-maize rotation system.
iv) correlate the nitrate meter and KCl method for soil NO3-‒N measurement.
22
v) investigate the partitioning of plant N to harvestable grain and plant biomass
returned to soil and
vi) determine N use efficiency of maize in rotation with the legumes as
influenced by the incorporation of pigeon pea biomass and groundnut haulms
into the soil.
1.2 Expected output
The following was the expected output: Soil fertility and nutrient use efficiency
improved for increased crop productivity.
1.3 Hypotheses
The following were the study hypotheses:
i) the pigeon pea-groundnut intercrop maize rotation cropping system does not
improve soil fertility status.
ii) intercropping medium and long duration pigeon pea with groundnut does
not affect pigeon pea growth rates and yields.
iii) legume biomass incorporation to the soil does not affect soil NO3-‒N levels
in the pigeon pea-groundnut intercropping-maize rotation cropping system.
vi) using the nitrate meter and KCl method for soil NO3-‒N measurement does
not generate different values of soil NO3-‒N.
v) legume biomass incorporation to the soil does not affect N uptake a the
partitioning of plant N to harvestable grain and plant biomass returned to soil
and

23
vi) N use efficiency of maize in rotation with the legumes is not influenced by
the incorporation of pigeon pea biomass and groundnut haulms to the soil.

24
1.4 REFERENCES
Abera, T., Feyissa, D., Yusuf, H. and Georgis, T. (2005). Influence of precursor crops
on inorganic and organic fertilizers response of maize at Bako, Western Oromiya,
Ethiopia. Pakistan Journal of Biological Sciences 8(12): 1678-1684.
Ahaneku, I.E. (2010). Conservation of soil and water resources for combating food
crisis in Nigeria. Scientific Research and Essays 5(6): 507-513.
Al..Kaisi,..M...(2001)..Value..of..crop..rotation..in..nitrogen..management.[http://www.
ipiastate.edu] site visited on 6/23/2014.
Allen, D.E., Singh, B.P. and Dalal, R.C. (2011). Soil health indicators under climate
change: A review of current knowledge. B.P. Singh et al. (Eds.), Soil Biology.
29pp.
Amede, T. (2003). Opportunities and challenges in reversing land degradation:
A.regional.experience.In:.Amede,.T.(ed),.Natural..resource.degradation.and.envi
ro-nmental concerns in the Amhara National Regional State: Impact on food
security. Ethiopian Soils Science Society. pp. 173-183.
Andrews, D.J. and Kassam, A.H. (1976). The importance of multiple cropping is
increasing world food supplies. American Society for Agronomy 27: 1-10.

25
Bationo, A., Vanlauwe, B., Kimetu, J., Kihara, I., Abdoulaye, M.S., Adamou, A., Tabo,
R., and Koala, S. (2005). Increasing suitability and productivity through soil
fertility.management in the West African Sudano-Sahelian Zone. In:.Nutrient
and water management practices for increasing crop production in rainfed
arid/semi arid area. Proceedings of the Coordination Research Project. Nairobi:
ICRISAT.
Bationo, A., Hartemink, A., Lumgu, O., Naimi, M., Okoth, P., Smaling, E. and
Thaiombiano,.L..(2006)..African.soils:.Their.productivity.and.profitability.of
fertilizer use. Africa Fertilizer Summit. Abuja, Nigeria. 40pp.
Bezner.Kerr,.R.,.Snapp,.S.,.Shumba,.L..and.Msachi,.R..(2007)..Participatory.
research.on.legume.diversification.with.Malawian.smallholder.farmers.for
improved.human.nutrition.and.soil.fertility..Experimental.Agriculture.
43:.437–453.
Bruns,.A..(2012)..Concepts.in.crop..rotations...In:.Agricultural.Science,.G..Aflakpui.
(Ed.).[http://www.intechopen.com/books/agriculturalscience/concepts-in-crop-
rotation] site visited on 6/23/2014.
Bruulsema, T., Lemunyon, J. and Herz, B. (2009). Know your fertilizer rights. Crops
and Soils 42(2): 13-18.

26
Bruulsema, T.W., Witt, C., Garcia, F., Li, S., Rao, T.N., Chen, F. and Ivanova, S.
(2008). A global framework for fertilizer BMPs. Better Crops 92(2): 13-15.
Bukert, A., Bationo, A. and Possa, K. (2000). Mechanism of residue mulch-induced
cereal growth increases in West Africa. Soil Science Society of America Journal
64: 1–42.
Cassman, G.K., Dobermann, R.A. and Walters, T.D. (2002) "Agroecosystems, nitrogen
use.efficiency,.and.nitrogen.management".(2002)..Agronomy.and.Horticulture.
Faculty.Publications..356pp.
Cassman, K.G. (1999). Ecological intensification of cereal production systems: Yield
potential, soil quality and precision agriculture. Proceedings National Academy
of Science 96: 5952-5959.
Conway, G. and Waage, J. (2010). Harnessing science for global health. The Lancet. UK
Collaborative on Development Sciences Publication. 375(9726): 1599 –1600.
David, M. B., Drinkwater, L.E. and McIsaac, G.F. (2010). Sources of nitrate yields in
the Mississippi River Basin. Journal of Environmental Quality 39: 1657-1667.
Delgado, J.A., and Bausch, W.C. (2005). Potential use of precision conservation
techniques to reduce nitrate leaching in irrigated crops. Journal of Soil and
Water Conservation 60(6): 379-387.

27
Dias, T., Dukes, A. and Antunes, M.P. (2014). Accounting for soil biotic effects on soil
health and crop productivity in the design of crop rotations. Journal of Science
Food and Agriculture. 65pp.
Diop, N., Beghin, J. and Sewadeh, M. (2003). Groundnut policies, global trade
dynamics and the impact of trade liberalization. Mimeo. The World Bank,
Washington, D.C. pp. 1-36.
Dobermann, A. (2007). Nutrient use efficiency-measurement and management. In:
Fertilizer best management practices: General principles, strategy for their
adoption and voluntary initiatives versus regulations, Proceedings of IFA
International Workshop on Fertilizer Best Management Practices Brussels,
Belgium,.7-9.March.2007. International.Fertilizer.Industry Association. pp. 1-
28.
Dobermann,.A.,.Witt,.C.,.Dawe,.D.,.Gines,.G.,.Nagarajan,.R.,.Satawathananont,.S.,.
Wang,.G.H.,.Chien,.N.V.,.Thoa,.V.K.,.Muthukrishan,.P.,.Ravi,.V.,.Babu,.M.,.
Chatupon,.S.,.Kongchum,.M.,.Sun,.Q.,.Simbahan,.G.C..and.Adviento,.M.A..(200
2)..Site.specific.nutrient.management.for.intensive.rice.cropping.systems.in.Asia..
Field.Crops Research 74: 37–66.
Edmonds, E.D., Abreu, L.S., West, A., Caasi, R.D., Conley, O.T., Daft, C.M., Desta,
B.,.England, B.B.,.Farris, D.C.,.Nobles, J.T., Patel, K.N., Rounds,

28
W.E.,.Sanders, H.B.,.Shawaqfeh, S.S., Lokuralalage, L.,.Manandhar,.R., Raun,
W.R. (2009). Cereal.nitrogen use efficiency in Sub.Saharan Africa. Journal of
Plant Nutrition pp. 32-12.
Eickhout, B., Bouwman, A.F. and van Zeijts, H. (2006). The role of nitrogen in world
food production and environmental sustainability. Agriculture, Ecosystems and
Environment 116: 4–14.
Eskandari, H., Ghanbari, A. and Javanmard, A. (2009). Intercropping of cereals and
legumes for forage production. Notulae Scientia Biologicae 1: 07-13.
FAO, (2002). Soil biodiversity and sustainable agriculture. Paper prepared as a
background paper for the Ninth Regular Session of the Commission on Genetic
Resources for Food and Agriculture (CGRFA) FAO-Rome, 14-18 October
2002. 34pp.
FAO/IFA, (2002). Global Estimates of Gaseous Emissions of NH3, NO and N2O from
Agriculture..Food.and.Agriculture.Organization, Rome. 106pp.
FAOSTAT,.(2008)..[http://faostat.fao.org/faostat/collections?version=ext&hasbulk0&s
ubset=agriculture] site visited on 18/12/2014.

29
Farag, A.A.I. and Zahran, A.A..(2014). Groundnut (Arachis hypogaea L.) growth and
yield responses to seed radiation and mineral fertilization. Journal of
Agriculture and Veterinary Science 7(5): 63-70.
Food and Agriculture Organization (FAO), (2008). FAOSTAT database production:
Crops: [http://faostat.fao.org/site/567/default.aspx] site visited on 21/1/2011.
Forum for Agricultural Research in Africa (FARA), (2009). Change in maize
production in Africa: Implications for maize policy development. Ministerial
policy brief series. Number 3, December 2009. 10pp.
Frink,.C.R.,.Waggoner,.P.E..and.Ausbel,.J.H..(1999)..Nitrogen.fertilizer:.retrospect.and
prospect. Proceeding of the National Acadamey of Science (USA).96: 1175
–1180.
Fustec,..J.,.Lesuffleur,.F..and.Cliquet,.J..(2010)..Nitrogen..rhizodeposition.of.legumes.
A review. Agronomy for Sustainable.Development 30: 57-66.
Gelderman, R., Beck, R., Fanning, R. and Wagner, L. (2011). The value of crop
residue. Plant Science iGrow SDSU Extension. pp. 1-4.
GoM,.(2006)..Malawi.growth.and.development.strategy,.from.poverty.to.prosperity.[htt
p://siteresources.worldbank.org/MALAIEXTN/resources/MGDS_2006_final.pdf
] site visited on 21/1/2011.
30
Hardarson, G. and Atkins, C. (2003). Optimising biological N2 fixation by legumes in
farming systems. Plant and Soil 252: 41–54.
Hirel, B., Le Gouis, J., Ney, B. and Gallais, A. (2007). The..challenge of improving
nitrogen.use.efficiency.in.crops..Journal.for.Experimental.Botany.58: 369-387.
Hirel,.B.,.Tétu,.T..and.Dubois,.F..(2011)..Improving.nitrogen..use..efficiency.in.crops.
for sustainable agriculture. Sustainability 3:.1452-1485.
ICRISAT, (2003). Annual Report. ICRISAT, Hyderbad, India. 31pp.
Idaho,.(2014)..Crop.residue.burning..[https://www.de.idaho.gov/airquality/burning/crop
..residue-burning.aspx] site visited on 17/12/2014.
Johnson, G.V., Raun, W.R., Zhang, H. and Hattey, J.A. (2000). Oklahoma, soil fertility
handbook, 5th Edition. Department of Plant and Soil Sciences Oklahoma
Agricultural Experiment Station Oklahoma Cooperative Extension Service
Division of Agricultural Sciences and Natural Resources Oklahoma State
University. 8pp.
Kabambe, V.H. and Mloza-Banda, H. (2000). Options for management of witch weeds
in cereals for smallholder farmers in Malawi. In: Integrated crop management

31
research in Malawi: Developing technologies with farmers, (Ed. J. M.
Ritchie). Chatham: Natural Resources Institute, UK. pp. 210–215.
Kanyama-Phiri, G.Y., (2005). Best-bet soil fertility management options: The case of
Malawi. African Crop Science Conference Proceedings. African Crop Science
Society 7: 1039-1048.
Kanyama-Phiri, G.Y., Snapp, S., Wellard, K., Mhango, W., Phiri, A.T., Njoloma, J.P.,
Msusa H., Lowole, M. and Dakishon, L. (2008). Legume best bets to improve
soil quality and family nutrition..Conference proceedings: Mc Knight Foundation
S/E African Community of Practice Meeting Lilongwe, Malawi October, 2008.
25pp.
Khan, Z.R., Hassanali, A., Overholt, W., Khamis, T.M., Hooper, A.M., Pickett, J.A.,
Wadhams, L.J. and Woodcock, C.M. (2002). Control of witch weed Striga
hermonthica by Third RUFORUM Biennial Meeting 24-28 September 2012,
Entebbe, Uganda intercropping with Desmodium spp. and the mechanism
defined as allelopathic. Journal of Chemical Ecology. 28: 9-15.
Kirkegaard, J.A., Christen, O., Krupinsky, J. and Layzell, D. (2008). Break crop
benefits in temperate wheat production. Field Crops Research 107: 185-195.
Kimani, P.M. (2000). Pigeon pea breeding: Objectives, experiences, and strategies for
Eastern Africa. In: Status and potential of pigeonpea in Eastern and Southern

32
Africa: Proceedings of a regional workshop, 12–15 Sept. 2000, Nairobi, Kenya
(Edited by Silim SN, Mergeai G, Kimani PM). B-5030 Gembloux, Belgium:
Gembloux Agricultural University; and Patancheru, Andhra Pradesh, India;
International Crops Research Institute for the Semi-Arid.Tropics (ICRISAT).
pp. 324-502
Krupinsky,.M.J.,.Bailey,.L.K.,.McMullen,..P.M.,.Gossen,.B..and.Turkington,.K..(2002)
.Managing.plant.disease.risk.in.diversified.cropping.systems..Agronomy.Journal.
94: 198–209.
Krupnik, T.J., Six, J., Ladha, K., Paine, M.J. and Van Kessel, C. (2004). An assessment
of fertilizer nitrogen recovery efficiency by grain crops. In: Mosier, A.R., Syers,
J.K.,.Freney,.J.R..(Eds.),.Agriculture.and.the.nitrogen.cycle..Island.Press,.Wash
ington, D.C. pp. 193–207.
Kumwenda, J.D.T., Waddington, S.R., Stephen, R., Snapp, S.S., Jones, R.B., Richard, B.
and Blackie, M.J. (1995). Soil fertility management in the smallholder maize-
based cropping systems of Africa a paper for a workshop on.“The emerging maize
revolution in Africa: the role of technology, institutions and policy” Michigan
State University, USA, 9-12 July 1995. 24pp.
Kuntashula, E., Mafongoya, P.L., Sileshi, G., and Lungu, S. (2004). Potential of
biomass transfer technologies in sustaining vegetable production in the wetlands
(dambos) of eastern Zambia. Experimental Agriculture 40: 37–51.

33
Lithourgidis, A.S., Dordas, C.A., Damalas, C.A. and Vlachostergios, D.N. (2011).
Annual intercrops: an alternative pathway for sustainable agriculture, review
article. Australian Journal for Crop Science 5(4): 396-410.
Machado, S. (2009). Does intercropping have a role in modern agriculture? Journal of
Soil and Water Conservation 64(2): 55-57.
Mafongoya,.P.,.Bationo,.A.,.Kihara,.J..and.Waswa,.B..(2006)..Appropriate.technlogies.
to.replenish.soil.fertility.in.southern.Africa..Nutrient.Cycling.in..Agroecosystems
76: 137–151.
Malézieux,.E.,.Crozat,.Y.,.Dupraz,.C.,.Makowski,.D.,.Lafontaine,.H.,..and.Morison,.M.
.(2009)..Mixing.plant.species.in.cropping.systems:.Concepts,.tools.and.models..A
.review.Agronomy.for.Sustainable Development 29: 43-62.
Mapfumo,..P..Mtambanegwe,.F..and..Vanlauwe,..B..(2007)..Organic..matter..quality..a
nd management effects on enrichment of soil organic matter fractions in
contrasting soils in Zimbabwe. Plant Soil 296: 137–150.
Mashingaidze, A. B. (2004). Improving weed management and crop productivity in
maize systems in Zimbabwe. PhD Thesis, Wageningen University. 207pp.

34
Matusso, J.M.M., Mugwe, J.N. and Mucheru-Muna, M. (2012). Potential role of
cereal-legume intercropping systems in integrated soil fertility management in
smallholder farming systems of sub-Saharan Africa. Third RUFORUM Biennial
Meeting,..September.2012,.Entebbe,Uganda.Research.Application.Summary.
Mazaheri,.D..and.Oveysi,.M..(2004)..Effects.of.intercropping.on.corn.at.various.
nitrogen levels. Iranian Journal of Agronomy 7: 71-76.
Mbwaga, A.M., Massawe, C.R., Kaswende, A.M. and Hella, J.P. (2001). On-farm
verification of maize/cowpea intercropping on the control of striga under
subsistence farming. Seventh Eastern Africa Regional Maize Conference. pp.
165-167.
Mikkelsen, R. (2005). Nutrient use efficiency: using nutrient budgets..Western.Nutrient
Management Conference Salt Lake City,.Utah USA. 6:.2-7.
Millar, C.E. and Turk, L.M. (2002). Fundamentals of Soil Science. New Delhi: Biotech
Books. 67pp.
Morgado, L.B. and Willey, R.W. (2003). Effects of plant population and nitrogen
fertilizer.on.yield.in.maize.bean.intercropping..Pesquisa.Agropecuária
Brasileira 38(11): 1257-1264.

35
Mosier, A.R., Syers, J.K. and Freney, J.R..(2004)..Agriculture and the nitrogen
cycle..Assessing.the.impacts.of.fertilizer.on.food.production.and.environment.
Island Press, London. 65pp.
Mukurumbira, L.M. (1985). Effects of rate of fertilizer nitrogen and previous grain
legume crop on maize yields. Zimbabwe Agricultural Journal 82: 177-179.
Muoneke, C.O., Ogwuche, M.A.O. and Kalu, B.A. (2007). Effect of maize planting
density on the performance of maize/soybean intercropping system in a guinea
savannah agroecosystem African Journal of Agricultural Research 2(12): 667-
677.
Murwira, H.K. and Kirchmann, H..(1993). Nitrogen dynamics and maize growth in a
Zimbabwean sandy soil under manure fertilization. Communications in Soil
Science and Plant Analysis 24: 2343-2359.
Musinguzi P., Tenywa, J.S., Ebanyat, P. and Makoo, M. (2013). Soil organic carbon
thresholds and nitrogen management in tropical agroecosystems: Concepts and
prospects. Journal of Sustainable Development. pp. 6-12.
Mutegi, J. and Zingore, S. (2014). Pigeon pea could work for African smallholder
farmers in multiple ways. ISFM Policy Highlights 2, Soil Health Consortia. 3pp
36
Nyamangara, J., Mtambanengwe, F. and Musvoto, C. (2009). Carbon and nitrogen
mineralization from selected organic resources available to smallholder farmers
for soil fertility improvement in Zimbabwe. African Journal of Agricultural
Research 4(9): 870-877.
Opala, P.A., Othieno, C.O., Okalebo, J.R. and Kisinyo, P. (2010). Effects of combining
organic materials with inorganic phosphorus sources on maize yield and
financial benefits in western Kenya. Experimental Agriculture 46: 23-34.
Overstreet,.L.F..and.Huges,.J..(2009)...The..importance.of.soil.organic.matter..in.croppi
ng.systems.of.the.northern.great.plains..[http://www.extensionumn.edu/distribut
ion/ cropsystems/M1273.html#2d].site.visited.on.6/23/2014.
Palm, C., Myers, R.J. and Nandwa, S.M. (1997). Combined use of organic and
inorganic sources for soil fertility maintenance and replenishment. SSA Special
publication. No. 51: 193-218.
Peoples, M.B., Herridge, D.F., and Ladha, J.K. (1995). Biological nitrogen fixation: an
efficient source of nitrogen for sustainable agricultural production? Plant and
Soil 174: 3–28.
Ping, J.L., Ferguson, R.B. and Dobermann, A. (2008). Site specific nitrogen and plant
density management in irrigated maize. Agronomy Journal 100: 1193–1204.

37
Phiri, A.T., Njoloma, J.P., Kanyama-Phiri, G.Y., Snapp, S. and Lowole, M.W. (2010).
Maize yield response to the combined application of Tundulu rock phosphate
and pigeon pea residues in Kasungu, central Malawi. African Journal of
Agricultural Research 5(11): 1235-1242.
Phiri, A.T., Msaky, J.J., Mrema, J.P., Kanyama-Phiri, G.Y. and Harawa, R. (2013).
Assessment of nutrient and biomass yield of medium and long duration pigeon
pea in a pigeon pea-groundnut intercropping system in Malawi. Journal of
Sustainable Society 2(1): 36-48.
Praharaj, C.S., Bandyopadhyay, K.K. and Sankaranarayanan, K. (2007). Integrated
nutrient management strategies for increasing cotton productivity. Model
training course on “cultivation of long staple cotton” December 15-22, 2007
Central Institute for Cotton Research, Regional Station Coimbatore. 25pp.
Randall, G.W., J.A. Delgado, and Schepers, J.S. (2008). Nitrogen management to
protect water resources. In: Nitrogen in Agricultural Systems, (Edited by J.S.
Schepers and W.R. Raun). Agronomy Monograph. pp. 911-945.
Rego, T.J. and Nageswara Rao, V. (2000). Long term effects of grain legumes
on.sorghum.productivity.in.a.semiarid.tropical.vertisol..Experimental.
Agriculture.3(6): 205–221.

38
Roth, G.W. (1996). Crop rotations and conservation tillage. Conservation tillage series
No.1 5M696, College of Agriculture, Cooperation Extension service University
Park, Pennsylvania USA. pp.70-71.
Sakala, W.D., Kumwenda, J.D.T., and Saka, A.R. (2004). The potential of green
manures to increase soil fertility and maize yield in Malawi. Maize Agronomy
Research Report, Chitedze Agricultural Research Station, Lilongwe, Malawi.
pp.14-20.
Sakala, W.D., Saka, A.R., and Kayira, D (2003). The effects of Mucuna-maize
rotations and short term improved fallows on soil fertility and maize yields
under smallholder farms in Malawi. Malawi Journal of Agricultural Sciences
2(1): 2-13.
Seran, T.H. and Brintha, I. (2010). Review on maize based intercropping. Journal of
Agronomy 9(3): 135–145.
Snyder, S.C. and Fixen, E.P. (2012). Plant nutrient management and risks of nitrous
oxide emission. Journal of Soil and Water Conservation Society. 67(5): 137-144.
SSSA, (2001). Glossary of Soil Science Terms. Madison, USA: Soil Science Society of
America. 140pp.

39
Termorshuizen, A.J., van Rijn, E. and Blok, W.J. (2005). Phytosanitary risk assessment
of composts. Compost Science and Utilization 13: 108-115.
Thobatsi, T. (2009). Growth and yield responses of maize (Zea mays L.) and cowpea
(Vigna unguiculata L.) in an intercropping system. MSc. Thesis, Pretoria
University. 149pp.
UNAIDS, (2013). HIV and AIDS estimates. http//www.unaids.org/en/regionscountries/
countries/malawi. site visited 19/12/2014.
Valenzuela, H. and Smith, J. (2002). Pigeon pea. Sustainable Agriculture Green
Manure Crops 8: 1-3.
Vanlauwe,.B., Bationo,.A., Chianu,.J., Giller,.K.E., Merckx,.R., Mokwunye,.U., Ohiok
O., Pypers,.P., Tabo,.R., Shepherd,.K.D., Smaling,.E.M.A.,Woomer,.P.L..and S
anginga, N. (2010). Integrated soil fertility management: Operational definition
and consequences for implementation and dissemination. Outlook on
Agriculture 39: 17-24.
Verhulst, N., Govaerts, B., Verachtert, E., Castellanos-Navarrete, A., Mezzalama, M.,
Wall, P., Deckers, J. and Sayre, K.D. (2010). Conservation agriculture,
improving soil quality for sustainable production systems? In: Lal, R., Stewart,
B.A. (Eds.), Advances in Soil Science: Food Security and Soil Quality. CRC
Press, Boca Raton, FL, USA. pp. 137–208.

40
Waddington, S.R., Karigwindi, J. and Chifamba, J. (2007). The sustainability of a
groundnut plus maize rotation over 12 years on smallholder farms in the sub-
humid zone of Zimbabwe. African Journal of Agricultural Research
2(8): 342-348.
Waddington,.S.R.,.Sakala,.W..and.Mekuria,.M..(2004)..Progress.in.lifting.soil.fertility
in Southern Africa. Proceedings of the 4th
International Crop Science Congress
Brisbane, Australia, 26 September – 1 October 2004. 15pp.
Wander, M. (2004). Soil organic matter fractions and their relevance to soil function.
In: K. Magdoff, R.R.Weil (Eds.) Soil organic matter in sustainable agriculture.
CRC Press, Boca Raton, Florida, USA. pp. 67-102.
Weil, R.R. and Magdoff, F. (2004). Significance of soil organic matter to soil quality
and health. In: Weil R.R., Magdoff, F. (Eds). Soil organic matter in sustainable
agriculture. CRC press, Florida. pp. 1–43.
WFP,.(2009)..Country.portfolio.evaluation.of.WFP.assistance.to.Malawi,.Rome..[http:/
/documents.wfp.org/stellent/groups/public/documents/newsroom/wfp207899.pd
f].site. visited.on 9/1/2011.

41
CHAPTER 2:
EFFECT OF PIGEON PEA-GROUNDNUT INTERCROPPING SYSTEM ON
SELECTED SOIL PROPERTIES
ABSTRACT
A study was conducted to investigate on the efffect of the pigeon pea-groundnut
intercropping system on selected soil properties, namely organic carbon, nitrogen,
phosphorus and calcium. The study was conducted from the 2011/12 cropping season
with a parallel experiment set along side in the second season at Chitedze Agricultural
Research Station (130 59’ 23.2 S”, 033
0 38’ 36.8 E”) in Malawi. The main experiment
had eight treatments while the parallel experiment had ten treatments. Both were laid in
a randomized complete block design (RCBD) replicated three times. The experiments
involved planting of pigeon pea and groundnut as monocultures or as intercrops. Soil
characterization was conducted before treatment application in the first and second
year. After the first season, legume biomass in some plots of the main experiment was
incorporated into the soil. Laboratory analytical results indicated that soil texture was
predominantly sandy clay loam to sandy clay, organic carbon was marginally adequate
(≥ 0.88%), % total N was low ( ≤ 0.12%), while plant available phosphorus was
marginally adequate both between 0-20 cm and 20-40 cm (19 mg P kg-1
and 25 mg P
kg-1
). The soil texture which was predominantly sandy clay loam to sandy clay suggest
potential high leacheability of the mobile nutrient ions more especially NO-3-N. After
harvest, before the commencement of the second season, soil data indicated that soil
organic carbon and P remained largely in the medium range while plant total soil N
levels stood within the marginally adequate range. The soil reaction was not impacted

42
by biomass incorporation suggesting that the soils’ buffer capacity was not affected
with biomass incorporation. The status of OC was not affected with the incorporation
of the biomass. Building OC in the soil through biomass incorporation to the soil takes
time.
Keywords: Soil fertility; cation exchange capacity; biomass; nutrient use efficiency.

43
2.0 INTRODUCTION
Malawian smallholder farms’ productivity is constrained by a myriad of limitations that
include biophysico-chemical, economic and social in nature. One of the outstanding
biophysico-chemical constraints is the inherent low fertility status of the soils which is
being aggravated by the continuous loss of nutrients like nitrogen (N) and phosphorus
(P) from the soils. The loss of nutrients is principally through soil erosion, nutrient
export from the field and leaching losses. On average Malawi is losing about 40 kg N
ha-1
and 6.6 kg P ha-1
annually (Smaling et al., 1997) principally due to nutrient mining
by crops and export from the fields. Additionally, nutrient use efficiency (NUE) is low
(Sakala et al., 2004) as a result of declining levels of soil organic matter (SOM) and
associated deficiencies of macro and micronutrients and inappropriate soil
management/agronomic practices. This results into low uptake and utilization of the
nutrients by crops, attributed to a variety of soil properties like low water holding
capacity. The NUE is usually below 20 kg maize grain kg-1
of nutrients applied
(Waddington et al., 2004), which is categorized as being low.
For the past 20 years, national yields of maize have averaged 1.3 t ha-1
(FAO, 2008)
against a yield potential range of 6 to 10 t ha-1
of many maize hybrid varieties currently
grown by Malawian farmers (Saka et al., 2006) largely due to the low fertility status of
the soils. In the 2005/06 season, the national average maize yield was estimated to be at
1.6 t ha-1
(Denning et al.,2009) compared to the 1.3 t ha-1
(FAO, 2008) attributed to
increased mineral fertilizer use through the Government-led Farm Input Subsidy
Program (FISP). The program increased the nation average maize grain yield to over
2.5 t ha-1
in the 2006/07 season (WFP, 2009). The sustainability of the program has

44
been questioned due to its high dependence on donor funding and the sole use of
inorganic fertilizers without addition of organic matter to the soil. It has been argued
that this approach will continue to biologically and chemically degrade the soils due to
continued decline of SOM (Ogbomo, 2011. Overtime, crop response to applied mineral
fertilizer will continue to diminish due to low nutrient availability and uptake by the
crops. Sole use of mineral fertilizers can promote microbial C utilization in the soil
thereby depleting soil organic N content (Mulvaney et al., 2009). A proposition has
been made that one way out of this quandary is the large scale integration of legumes
like the pigeon pea in the maize based production systems (Kanyama-Phiri et al., 2009;
Bezner-Kerr et al., 2007). Recently, intercropping pigeon pea with groundnut with
subsequent incorporation of their residues to the soil has been touted to be a viable soil
fertility improving technology (Kanyama-Phiri et al., 2008). This has been attributed to
increased N and organic carbon (OC) input by the legumes into the soil. However, the
below ground processes and interactions that might enhance N fixation, hence yield and
NUE in this system are yet to be well understood. Such processes may include P uptake
by legumes along side with biological N fixation and nitrate-N dynamics in the soil
during the cereal cropping phase. There is need, therefore, to further investigate for the
development of sustainable soil fertility management technologies in the drive to
increase crop production and hence food security. To investigate on the possibility of
improving soil fertility and NUE through the pigeon pea-groundnut intercrop maize
rotation cropping system, a study was initiated in the 2011/12 cropping season, which
lasted for two seasons. The objectives were: i) to characterize the soil at the
experimental site in terms of the chemical and physical characteristics and hence the

45
fertility status, and ii) to assess changes of key soil fertility parameters namely, %OC,
total N (%), pH and exchangeable Ca, as a result of legume biomass incorporation.
2.1 MATERIALS AND METHODS
2.1.1 Study site
The study was conducted on station at Chitedze Agricultural Research Station (13º 59’
23.2 S”, 033º 38’ 36.8 E”) in Lilongwe, Malawi. The site falls within the Lilongwe
plain and receives an average annual rainfall of 875 mm and the rainy season starts in
November and ends in April (Phiri et al., 2013). The site has a moderate (pH=5.5) soil
reaction, low N (<0.12) and low (≤19 mg P kg-1
) to marginally adequate P (≥19 mg P
kg-1
) (Wendt,1996), with a sandy clay loam to sandy clay texture (Phiri et al., 2013).
2.1.2 Materials
Materials used during the study included the following; A photo and thermo insensitive
medium duration pigeon pea variety (ICEAP 00557, with a potential yield of up to 2.5 t
ha-1
) which matures in 5-6 months, a long-duration pigeon pea variety (ICEAP 04000,
potential yield of 1.6-2 t ha-1
) maturing in 8-9 months, groundnut (CG 7, potential
yield of 3 t ha-1
), early maturing maize variety (SC 403 potential yield of 6 t ha-1
) and
triple super phosphate (Ca(H2PO4)2.H2O) as a source of P.
2.1.3 Characterization of the soil at the study site
2.1.3.1 Soil sampling and preparation for laboratory analysis
Before the experiment in season one, a composite soil sample made from twenty four
randomly collected soil samples was gathered from the experimental site as described
by Okalebo et al., (2000). The sample was air dried and then passed through a 2 mm
sieve in preparation for soil physical and chemical analysis.

46
2.1.3.2 Preparation of the seed bed
The field was then demarcated into three blocks, with each block divided into eight
plots that were 20 m x 10 m for planting of the main experiment. Before
commencement of the second season, on the same field next to the main experiment a
portion of land was demarcated into three blocks, with each block divided into ten plots
that were 3 m x 4.5 m for planting of the parallel experiment. In both experiments,
ridges were made and spaced at 75 cm apart. All the experiments were laid in a
Randomised Complete Block Design (RCBD). For the main experiment legumes
(pigeon pea and groundnut) were planted in season one either as monocultures or
intercrops, with one plot planted with maize. Legume biomass was incorporated into
the soil in some plots (section 2.1.4) in June and September, 2012, before
commencement of the second season in December, 2012. All the plots were planted
with maize in season two. The legumes were also planted in the parallel experiment in
season two like in season one in the main trial. Treatment and agronomic details were
as presented under section 2.1.4.
2.1.3.3 Collection of soil sample from each plot after harvest and after biomass
incorporation into the soil
In the main experiment, after harvest at the end of season one, soil samples (4 borings
from each plot in all the blocks) were taken and a composite sample was made for each
plot. Two weeks into the second season, before fertilizer application, soil samples (4
borings from each plot in the blocks) were taken and composite sample was made for
each plot. The samples were air dried at Chitedze Agricultural Research Laboratory and
then passed through a 2 mm sieve in preparation for soil physical and chemical
analysis.

47
2.1.3.4 Laboratory soil analysis
Laboratory soil analysis of the composite soil sample was done in order to characterize
the soil. Soil samples were analyzed for OC, total N, available P, exchangeable K, Mg,
Ca and soil pH (H2O). Soil pH was measured in water (1:2.5) using pH meter (Okalebo
et al., 2000). Soil analysis for P, exchangeable K, Mg and Ca was done by Mehlich 3
extraction procedures (Mehlich, 1984) while OC was determined using the colorimetric
method (Schumacher, 2002) and total N was determined by Kjeldahl method (Amin
and Flowers, 2004). Molybdenum (Mo) was analyzed using the hand held XRF
machine (Baranowski et al., 2002). Bulk density was determined using the core sample
method (Rowell, 1994). Biomass yields for the legumes were assessed as described by
Phiri et al., (2013). This was done at the end of the first season before incorporation
into the soil.
2.1.4 The field experiments
In the first season the experiment was laid out in a RCBD design replicated three times.
The treatments were as follows: 1) Sole maize (control); 2) Medium duration pigeon
pea (control); 3) Long duration pigeon pea (control); 4) Sole groundnut (control); 5)
Medium duration pigeon pea + groundnut; 6) Long duration pigeon pea + groundnut;
7) Medium duration pigeon pea + groundnut (biomass not incorporated); and 8) Long
duration pigeon pea + groundnut (biomass not incorporated). The medium duration
pigeon pea-groundnut and long duration pigeon pea-groundnut intercrop was repeated
(treatment 7 and 8) purposively. In the second season, the biomass in all the plots
having the legumes, except plots with treatment 7, 8 and 1 (sole maize) was ploughed
into the soil. This was done inorder to allow for the comparison of the performance of
maize between the plots with legume biomass incorporated into the soil and the plots

48
with legume biomass removed from the field plus a plot where a cereal was grown
without incorporating its biomass into the soil. All the treatment plots except for
treatment 1 were treated with P as TSP at the rate of 25 kg P ha-1
. At harvest (June and
September, 2012) for the first season, the biomass in all the plots with the legumes,
except plots with treatments 7, 8 and 1 (sole maize) were incorporated into the soil,
allowing for comparison of the effect of biomass incorporation on selected soil
parameters and the effect this may have on the performance of the succeeding maize
crop. The amount of biomass produced and incorporated into the soil for each cropping
system is presented in Figure 2.0 of this Chapter and Table 4.1, section 4.3.2 under
Chapter 4, Appendix 2.5. All the plots were then planted with maize. A parallel
experiment laid in RCBD and replicated 3 times along side the main experiment was
run in the second season with similar treatments to the first season for comparison of
the performance of the legumes across seasons with the following treatments; 1) Long
duration pigeon pea; 2) Medium duration pigeon pea; 3) Sole groundnut; 4) Sole
groundnut + 25 kg P ha-1
; 5) Medium duration pigeon pea + 25 kg P ha-1
; 6) Long
duration pigeon pea + 25 kg P ha-1
; 7) Long duration pigeon pea + groundnut; 8) Long
duration pigeon pea + groundnut + 25 kg P ha-1
; 9) Medium duration pigeon pea +
groundnut; and 10) Medium duration pigeon pea + groundnut + 25 kg P ha-1
. P was
applied in form of TSP in treatments 4, 5, 6 and 8 to enhance N fixation and hence
yield by the legumes, for subsequent comparison with non P treated plots. The
experimental fields were kept weed free through regular weeding.
The general satistical model used for the RCBD was (Gomez and Gomez, 1984):
Yhi = µ + h + i + hi
where

49
Yhi is the random variable representing the response for treatment i observed in
block h,
µ is a constant (or the overall mean)
h is the (additive) effect of the hth
block (h = 1, 2, 3)
i is the (additive) effect of the ith
treatment (i = 1, 2, … , v)
hi is the random error for the ith
treatment in the hth
block (Gomez and Gomez, 1984).
2.1.4.1 Effect of cropping system on selected soil properties………………………
In the main experiment effect of cropping system on selected soil properties was
assessed by changes observed in selected soil properties after incorporation of biomass
into the soil. The selected soil properties were; OC, total N, available P, soil pH and
exchangeable Ca.
2.1.4.2 Statistical analysis……………………………………………………………….
All the soil and biomass data were analyzed using Genstat statistical package and were
subjected to analysis of variance at 95% level of confidence. Means were separated by
the least significant difference (P<0.05).

50
2.2 RESULTS
2.2.1 Characterization of the soils at the study site
The soils’ physical and chemical properties at the study site were as presented in Table
2.0.
Table 2.0: The soils’ physical and chemical properties at the study site before the
experiment
Parameter Depth
0-20 cm Rating 20-40 cm Rating Range Reference
% Sand 56.9 - 57.5 - - -
% Clay 35 - 34.3 - - -
% Silt 8.1 - 8.2 - - -
Texture class SC/SCL - SC/SCL - - SSSA, (2003)
pHH2O 5.5 Low 5.5 Low ≤ 6.0 Wendt, (1996)
Soil reaction - Moderately
acid
- Moderately
acid
5.5-5.7 “
% OC 1.4 Medium 1.4 Medium 0.88-1.5% “
Total N (%) 0.12 Low 0.12 Low ≤ 0.12% “
P mg kg-1
22.1 Marginally
Adequate
20.5 Marginally
Adequate
19-25 mg P
kg-1
“
Ex. K cmol kg-1
0.20 Adequate 0.20 Adequate >0.11-4.0
cmol kg-1
“
Ex. Mg cmol kg-1
0.40 Low 0.30 Low 0.2-
0.5.cmol kg-
1
“
Ex. Ca cmol kg-1
3.3 Marginally
adequate
3.4 Marginally
adequate
2.04-3.5
cmol kg-1
“
Total Mo mg
kg-1
10.8 High 16.8 High >5 mg kg-1
Hodges, 2010

51
2.2.2 Characteristics of the soils at the study site after the first season
Tables 2.1a to 2.2b and Appendices 2.1a to 2.2b, summarize the physical and chemical
properties of soils for the main experiment after season one at harvest. The bulk density
value both between 0-20 cm and 20-40 cm in all treatment plots was less than 1.6 g cm3
while soil texture was predominantly sandy clay loam to sandy clay between the two
depths. The soil reaction was strongly acid to moderately acid both between 0-20 cm
(pH=5.4-5.7) and 20-40 cm (pH=5.4-5.6) (Wendt, 1996) in all the treatment plots
(Table 2.1a) (Wendt, 1996). The total nitrogen content was largely low (≤ 0.12%) to
marginally adequate ( ≥ 0.12%) (Wendt, 1996) both between 0-20 cm (0.08-0.14%)
and 20-40 cm (0.09-0.13%). The level of soil organic carbon content was medium (≥
0.88%) (Wendt, 1996) between 0-20 cm (1.1-1.6%) and 20-40 cm (0.9-1.6%) across
the treatment plots. Plant available phosphorus was marginally adequate ( ≥ 19 mg P
kg-1
) between 0-20 cm (20.6-25.6 mg P kg-1
) and marginally adequate between 20-40
cm (16.8-26.6 mg P kg-1
). Molybdenum (Mo) content in the soil was high and ranged
from 5.4 to 26.4 mg Mo kg-1
between 0-20 cm in the soil while between 20-40 cm this
ranged from 11.5 to 25.4 mg Mo kg-1
(Table 2.1b). The field had adequate (> 0.105
cmol kg-1
) exchangeable potassium (K) between 0-20 cm (0.10-0.29 cmol kg-1
, 0.30-
0.48 cmol kg-1
) and between 20-40 cm (0.13-0.35 cmol kg-1
, 0.16-0.37 cmol kg-1
) while
calcium was marginally adequate ( ≥ 2.04 cmol kg-1
) (Wendt, 1996) for crop
production.
Figure 2.0 and Appendix 2.5, shows the yield of biomass for the pigeon pea and
groundnut. Pigeon pea biomass yields in all the treatments and across the varieties were
statistically the same (p>0.05). For groundnut, higher biomass yield was registered in

52
the pure stand and in the medium duration pigeon pea-groundnut intercrop. Overall, the
intercrops gave about 21% total biomass yield above the monocultures of pigeon pea
and groundnut (Figure 2.0 and Appendix 2.5).
Figure 2.0: Pigeon pea and groundnut biomass yield
Table 2.2 a and b, Appendix 2.1b, show some of the soil chemical properties for the
main experiment in the second season after the incorporation of legume biomass.
Notably, an increase in the mean level of soil exchangeable Ca was observed in plots
where legume biomass was incorporated.

53
Table 2.1a: Soil physical and chemical parameters for the main experiment after the first season
Treatment BD g/cc
0-20 cm
BD g/cc
20-40 cm
pHH2O
00-20
cm
pHH2O
20-40
cm
%O
C 0-
20
cm
%O
C 20-
40
cm
Total
%N 0-
20 cm
Total
%N 20-
40 cm
Total
Mo mg
kg-1
0-20
cm
Total
Mo mg
kg-1
20-
40 cm
1.Sole maize 1.2 1.2 5.5 5.4 1.4 1.2 0.12 0.12 10.7 16.4
2.Medium duration pigeon pea 1.2 1.3 5.4 5.5 1.3 1.0 0.10 0.12 26.4 22.1
3.Long duration pigeon pea 1.1 1.2 5.6 5.5 1.1 0.9 0.08 0.10 5.4 12.5
4.Sole groundnut 1.2 1.2 5.5 5.4 1.6 1.5 0.14 0.13 22.4 11.5
5.Medium duration pigeon pea +
groundnut
1.3 1.3 5.4 5.4 1.4 1.1 0.12 0.09 11.6 14.8
6.Long duration pigeon pea +
groundnut
1.2 1.1 5.7 5.5 1.4 1.2 0.12 0.12 9.9 18.4
7.Medium duration pigeon pea +
groundnut
1.3 1.2 5.6 5.6 1.4 0.9 0.12 0.12 Trace 25.4
8.Long duration pigeon pea +
groundnut
1.2 1.2 5.6 5.5 1.6 1.3 0.14 0.13 Trace 13.1
GM 1.2 1.2 5.5 5.5 1.4 1.4 0.12 0.12 10.8 16.8
CV (%) 11.7 14.2 4.40 3.70 25.5 26.9 25.5 26.9 27.8 32.8
LSD0.05 - - - - - - - - 13.8 12.8

54
Table 2.1b: Soil chemical parameters for the main experiment after the first season
Treatment P mg kg-1
0-20 cm
P mg kg-1
20-40
cm
K cmol
kg-1
0-20
cm
K cmol
kg-1
20-
40 cm
Mg cmol
kg-1
0-20
cm
Mg cmol
kg-1
20-40
cm
Ca cmol
kg-1
0-20
cm
Ca cmol
kg-1
20-40
cm
1.Sole maize 20.6 22.7 0.26 0.17 0.32 0.34 3.30 3.2
2.Medium duration pigeon pea 20.9 18.8 0.13 0.16 0.38 0.36 3.10 4.4
3.Long duration pigeon pea 20.8 16.8 0.16 0.17 0.35 0.28 3.20 3.0
4.Sole groundnut 23.4 17.6 0.10 0.21 0.48 0.52 3.04 3.4
5.Medium duration pigeon pea + groundnut 21.3 18.9 0.25 0.13 0.30 0.31 3.13 2.8
6.Long duration pigeon pea + groundnut 22.1 20.4 0.13 0.35 0.34 0.34 3.52 3.3
7.Medium duration pigeon pea + groundnut 21.4 26.6 0.29 0.20 0.42 0.37 3.87 3.1
8.Long duration pigeon pea + groundnut 25.6 23.4 0.26 0.20 0.42 0.16 3.32 3.8
GM 22.9 20.7 0.20 0.20 0.38 0.34 3.31 3.38
CV (%) 18.2 18.7 47.1 38.3 35.4 35.5 22 20.6
LSD0.05 - 7.02 - - - 0.21 - 1.2

55
Table 2.2 a: Selected soil chemical properties for the main experiment after biomass incorporation, second season
Treatment pHH2O
0-20 cm
pHH2O
20-40 cm
OC(%)
0-20 cm
OC(%)
20-40 cm
Total N(%)
0-20 cm
Total N(%)
20-40 cm
1.Sole maize 5.0 5.1 1.4 1.1 0.09 0.12
2.Medium duration pigeon pea 5.2 5.4 1.5 1.4 0.13 0.12
3.Long duration pigeon pea 5.1 5.0 1.4 1.1 0.07 0.10
4.Sole groundnut 5.3 5.5 1.3 1.3 0.11 0.11
5.Medium duration pigeon pea + groundnut 5.1 5.2 1.3 1.3 0.11 0.11
6.Long duration pigeon pea + groundnut 5.3 5.4 1.7 1.6 0.14 0.11
7.Medium duration pigeon pea + groundnut (biomass not incorporated) 5.1 5.0 1.3 1.3 0.12 0.14
8.Long duration pigeon pea + groundnut (biomass not incorporated) 5.3 5.0 1.6 1.4 0.14 0.12
GM 5.2 5.2 1.4 1.3 0.1 0.1
CV (%) 7.8 8.5 19.0 17.5 19.7 18.53
LSD0.05 - - 0.4 0.4 0.04 0.04

56
Table 2.2b: Selected soil chemical properties for the main experimemt after biomass incorporation, second season
Treatment P mg kg-1
0-
20 cm
P mg kg-
120-40 cm
K cmol kg-1
0-20 cm
K cmol kg-1
20-40
cm
Ca cmol kg-1
0-20 cm
Ca cmol kg-1
1.Sole maize 18.34 19.3 0.29 0.26 5.5 4.6
2.Medium duration pigeon pea 19.75 12.9 0.52 0.19 6.6 5.5
3.Long duration pigeon pea 18.63 12.4 0.47 0.17 9.1 8.3
4.Sole groundnut 19.74 13.4 0.39 0.39 9.4 8.0
5.Medium duration pigeon pea + groundnut 18.95 15.6 0.47 0.34 5.8 6.1
6.Long duration pigeon pea + groundnut 19.98 14.7 0.46 0.30 8.9 7.4
7.Medium duration pigeon pea + groundnut
(biomass not incorporated)
17.87 14.3 0.42 0.26 5.4 5.3
8.Long duration pigeon pea + groundnut
(biomass not incorporated)
19.44 15.5 0.29 0.26 4.9 4.4
GM 19.1 13.5 0.41 0.27 8.63 9.33
CV (%) 27.26 18.2 20.3 36.8 20.7 21.1
LSD0.05 - 4.3 0.15 0.18 5.9 8.2
57
2.3 DISCUSSION
2.3.1 Soil fertility status at the study site
On the experimental site, the soil reaction was moderately acid both between 0-20 cm
and 20-40 cm (pH=5.5) in all the treatment plots (Table 2.0). This is attributable to
leaching of exchangeable bases, explainable by the soil texure class that was sandy clay
loam to sandy clay. The soil reaction suggests that macronutrients like P were likely
less available to an extent compared to the micronutrients (Akinrinde, 2006). Low soil
pH fixes P as phosphate (s) through the formation of insoluble aluminum and iron
phosphates (Sharma et al., 2011). On the other hand, potential for the concentration of
soluble metals, especially manganese to toxic level was high, coupled to a high
likelihood of a decrease in the populations and the activity of soil micro-fauna that are
responsible for the transformation of N, S, and P to plant-available forms (Fernández
and Hoeft, 2009), hence the projected low availability.
Furthermore, the total nitrogen content was low ( ≤0.12%) (Wendt, 1996), both
between 0-20 cm and 20-40 cm in the soil. N is inherently low in most soil in Malawi
(Phiri et al., 2010) as most soil are highly weathered. This calls for N supplimentation
from either inorganic or organic sources for increased crop yields. The level of soil
organic carbon content was medium (≥1.4%) both between 0-20 cm and 20-40 cm in
the soil, partly due proper crop residues management which abates the rate of SOM
turn over in the soil through microbial activities and oxidation of exposed OM. The soil
texture which was sandy clay loam to sandy clay a high potential of leaching of mobile
nutrient ions like nitrate (NO3-), Ammonium (NH4
+), potassium (K) and magnesium
(Mg) (Hodges, 2010) through washing away of the ions beyond the crop root zone by

58
infiltrating and percorating rainfall water. Plant available phosphorus was marginally
adequate ( ≥ 19 mg P kg-1
) (Wendt, 1996) at both soil depths, suggesting the need for P
supply from mineral sources for increased soil and crop productivity. Total Mo content
was around the range (3–15 mg kg-1
) reported for surface soils in other parts of the
world (Hodges, 2010). However, going by the soil reaction potential for inavailability
of Mo for uptake by legumes was high. Mo availability is decreased with increasing
soil acidity (Fernández and Hoeft, 2009), due to increasing levels of aluminium and
iron oxides which strongly adsorbed the nutrient element (Das, 2014). N deficiency
caused by inadequancy of Mo in legumes dependant on BNF is common, more
especially on acid mineral soils of the humid and subhumid tropics (Weisany et al.,
2013). Molybdenum is a micronutrient specifically for nodulating legumes that form a
symbiotic relationship with N fixing bacteria (Weisany et al., 2013). Its essentiality to
BNF is very pronounced since the element is part of the 'FeMoCo' cofactor and is at the
center of the nitrogen reduction process for most nitrogenases (Weisany et al., 2013).
Soil exchangeable K was adequate ( ≥ 0.105 cmol kg-1
) on the site with low ( < 0.5
cmol kg-1
) Mg content (Wendt, 1996) while calcium was marginally adequate ( ≥ 2.0-
3.5 cmol kg-1
) (Wendt, 1996) for crop production.
2.3.2 Effects of biomass incorporation to the soil on selected soil properties
After harvest, before the commencement of the second season, soil data indicated that
soil organic carbon and P remained largely in the medium range while plant total soil
nitrogen levels stood within the marginally adequate range (Table 2.1a and b). For plant
available P in some cases the levels in the soil might have been sustained due to the
application of P as TSP. The soil reaction was not impacted by biomass incorporation
suggesting that the soils’ buffer capacity was not affected with biomass incorporation.

59
In the short term, liming is recommended for effecting significant changes to soil
reaction. The status of OC was not affected with the incorporation of the biomass.
Building OC in the soil through biomass incorporation to the soil takes time (Snapp,
personal communication). However, after biomass incorporation in season two (Table
2.2a and b), it was noticed that exchangeable calcium levels increased substantially.
This could be as a result of the corresponding high Ca yields of the biomass that was
returned to the soil.
2.4 CONCLUSION
Generally, the soil chemical characteristics for soil at the experimental site indicate that
the soil is of low fertility status. The soil pH which moderately acid suggest possible
low availability of the macro plant nutrients for uptake by crops. The largely soil
texture which is predominantly sand clay loam to sandy clay suggest potential high
leacheability of mobile nutrient ions especially nitrogen as nitrate. Inevitably, if the soil
is not properly managed crop yields will be drastically reduced at harvest. Furthermore,
NUE of crops cultivated on this soil will be low as the applied nutrients will be
rendered unavailable for uptake either due to fixation, soil acidity or leaching. This
challenge potentially can be circumvented through incorporation into the soil of high
quality organic residues. In the short term to change the soil reaction significantly,
liming should be considered. Additionally, for OC to be built sustained biomass
incorporation to the soil over time is required.

60
2.5 REFERENCES
Akinrinde, E.A., (2006). Strategies for improving crops’ use efficiencies of fertilizer
nutrients in sustainable agricultural systems. Pakistan Journal of Nutrition
5(2): 185-193.
Amin, M. and Flowers, T.H. (2004). Evaluation of the Kjeldahl digestion method.
Journal of Research (Science) 5(2): 59-179.
Baranowski, R., Rybak, A. and Baranowska, I. (2002). Speciation analysis of elements
in soil samples by XRF. Polish Journal of Environmental Studies 11(5): 473-
482.
Bezner-Kerr, R., Snapp, S., Chirwa, M., Shumba, L. and Msachi, R. (2007).
Participatory research on legume diversification with Malawian smallholder
farmers for improved, human nutrition and soil fertility. Experimental
Agriculture 43: 437–453.
Bower, C.A., Reitemeier, R.F. and Fireman, M. (1952). Exchangeable cation analysis
of saline and alkali soil. Soils Science 73: 325-261.
Das, K.S. (2014). Role of micronutrient in rice cultivation and management strategy in
organic agriculture, a reappraisal. Agricultural Sciences 5(9): 5-10.

61
Denning, G., Kabambe, P., Sanchez, P., Malik, A. and Flor, R. (2009). Input subsidies
to improve smallholder maize productivity in Malawi: Toward an African green
revolution. PLOS Biology 7: 23-24.
Fernández, F.G. and.Hoeft, R.G. (2009). Managing soil pH and crop nutrients..In:
Nafziger, E.D.,.(ed).Illinois..Agronomy..Handbook 24th..Edition..UI,.Urbana.
pp. 91–112.
Food and Agriculture Organization, (2008). FAOSTAT database Production: Crops;
[Available:http://faostat.fao.org/site/567/default.aspx.].site.visited.on.21/1/2011.
Gomez, K.A. and Gomez, A.A. (1984). Statistical Procedures for Agricultural
Research, 2nd.Edition. An International Rice Research Institute Book, John
Wiley and Sons, New York. 40pp.
Hodges, S.C. (2010). Soil Fertility Basics. Soil Science Extention, NCSU. pp. 1-20
Kanyama-Phiri, G.Y., Snapp, S., Wellard, K., Mhango, W., Phiri, A.T., Njoloma, J.P.,
Msusa, H., Lowole, M. and Dakishon, L. (2008). Legume Best Bets to Improve
Soil Quality and Family Nutrition. Conference proceedings: Mc Knight
Foundation S/E African Community of Practice meeting Lilongwe, Malawi;
2008. 25pp.

62
Kanyama-Phiri, G.Y., Snapp, S., Kamanga, B. and Wellard, K. (2000). Towards
integrated soil fertility management in Malawi: Incorporating participatory
approaches in agricultural research. In: Managing African Soils No. 11 IIED,
UK. 7pp.
McKenzie, N.J., Jacquier, D.J., Isbell, R.F. and Brown, K.L. (2004). Australian Soils
and.Landscapes.an.Illustrated.Compendium.CSIRO.publishing:.Collingwood.
Victoria. 17pp.
Mehlich, A. (1984). Mehlich 3 soil test extractant: A modification of Mehlich 2
extractant. Community of Soil Science and Plant Analysis 15(12): 1409-1416.
Mulvaney, R.L., Khan, S.A. and Ellsworth, T.R. (2009). Synthetic nitrogen depleted
soil nitrogen: A global dilemma for sustainable cereal production. Journal for
Environmental Quality 38: 2295-2314.
Ogbomo, L.K.E., Remison, S.U. and Jombo, E.O. (2011). Effects of organic and
inorganic fertilizer on the productivity of Amaranthus cruentus in an ultisol
environment. International Journal of Plant Physiology and Biochemistry
3(14): 247-252.
Okalebo, J.R., Gathua, K.W. and Woomer, P.L. (2000). Laboratory methods of soil and
plant analysis: A Working Manual. TSBF-KARI-UNESCO, Nairobi, Kenya.
pp.5-20.

63
Phiri A.T., Msaky, J.J., Mrema, J., Kanyama-Phiri, G.Y. and Harawa, R. (2013).
Assessment of nutrient and biomass yield of medium and long duration pigeon
pea in a pigeon pea-groundnut intercropping system in Malawi. Journal of
Sustainable Society 2(1): 36-48.
Phiri, A.T., Njoloma, J.P., Kanyama-Phiri, G.Y., Sieglinde, S. and Lowole, M.W.
(2013). Effects of intercropping systems and the application of Tundulu Rock
phosphate on groundnut grain yield in Central Malawi. International Journal of
Plant and Animal Sciences 1(1): 011-020.
Phiri, A.T., Njoloma, J.P., Kanyama-Phiri G.Y., Snapp, S. and Lowole, M.W. (2010).
Maize yield response to the combined application of Tunduru rock phosphate
and Pigeon pea residues in Kasungu, Central Malawi. Africa Journal of
Agricultural Research. 5(11): 1235-1242.
Rowell, D.L. (1994). Soil Science: Methods and Applications, Longman Scientific and
technical, England. pp.20-57.
Saka, A.R., Mtukuso, A.P., Daudi, A.T., Banda, M.H.P. and Phiri, I.M.G. (2006).
Agricultural technologies released by MoAFS.2000-2005 [Crop varieties,
livestock production technologies and agricultural processing and utilization
technologies] Department of Agricultural Research Services Ministry of
Agriculture and Food Security Lilongwe, Malawi May 2006. 3-8pp.

64
Sakala, W.D., Kumwenda, J.D.T. and Saka, A.R. (2004). The potential of green manures
to increase soil fertility and maize yield in Malawi. Maize Agronomy Research
Report, Chitedze Agricultural Research Station, Lilongwe, Malawi. 14-20pp.
Schumacher, B.A. (2002). Method for the determination of total organic carbon (TOC)
in.soils.and.sediments..US.Environmental.Protection.Agency.Environmental
Sciences Division National Exposure Research Laboratory, Las Vegas.
Sharma, S., Kumar, V. and Tripathi, B.R. (2011). Isolation of phosphate solubilizing
microorganism.from.soil...Journal.of..Microbiology..and..Biotechnology.
Research 1(2): 90-95.
Singh,.F..and.Oswalt,.D.L..(1995)..Groundnut.production.practices..Skill.Development
Series no. 3 Revised, ICRISAT. 10pp.
Smaling, E.M.A., Nandwa, S.M. and Jansen, B.H. (1997). Soil fertility in Africa at stake.
In: Replenishment of soil fertility in Africa. SSA Special Publication No.51
(Edited by Buresh, R.J., Sanchez, P.A., Calhoun, F.). Soil Science Society of
America. Madson Wisconsin, U.S.A. 20pp.
SSSA, (2003). Soil survey staff keys to soil taxonomy 19th edition. USDA-NRCS,
Washington DC. pp. 30-70.

65
Waddington, S.R., Sakala, W.D. and Mekuria, M. (2004). Progress in lifting soil
fertility in Southern Africa. In: Proceedings of the 4th
International Crop
Science Congress Brisbane, Australia, 26 September–1 October: 2004. 9pp.
Weisany, W., Raei, Y. and Allahverdipoor, K.H. (2013)..Role of some mineral
nutrients.in.biological.nitrogen.fixation.Bulletin.of.Environment,.Pharmacology
and Life Sciences 2(4): 77-84.
Wendt, J.W. (1996). Chemical Analysis Manual Soil and Plant Samples. Rockefeller
Foundation and Department of Agricultural Research and Technical Services,
Lilongwe, Malawi. 38-39pp.
World Food Programme, (2009). Country portfolio evaluation of WFP assistance to
Malawi..[Available:http://documents.wfp.org/stellent/groups/public/documents/
newsroom/wfp207899.pdf]. site visited on 9/1/2011.

66
CHAPTER 3:
ASSESSMENT OF BIOMASS AND NUTRIENT YIELDS OF MEDIUM AND
LONG DURATION PIGEON PEA IN A PIGEON PEA-GROUNDNUT
INTERCROPPING SYSTEM
ABSTRACT
Assessment of the performance of the medium and long duration pigeon pea in a
pigeon pea-groundnut intercropping system was conducted at Chitedze Agricultural
Research Station (130 59’ 23.2 S”, 033
0 38’ 36.8 E”) in the 2011/2012 cropping season.
An experiment involving eight treatments replicated three times in a randomized
complete block design was established. Two pigeon pea varieties, long (ICEAP 04000)
and medium duration (ICEAP 00557) and groundnut (CG 7) were grown as
monocultures and intercrops. The intercrops involved planting either of the pigeon pea
varieties with groundnut. Yields were assessed at harvest that included grain and
biomass yields. Nutrient accumulation in the grain and biomass was quantified after
determination of nutrient concentrations in the respective plant parts. Data were
subjected to Analysis of Variance in GENSTAT and means were separated using the
least significant difference (LSD). Productivity of intercrops was evaluated using the
land equivalent ratio (LER). The assessment of the above ground groundnut biomass
ranged from 479-656 kg ha-1
, while the leafy biomass yields of the pigeon pea varieties
indicates a yields range of 2,034-2,593 kg ha-1
. For the nitrogen (N) yields returnable to
the soil, the medium duration pigeon pea-groundnut intercrop (50.6 kg N ha-1
) and the
long duration pigeon pea-groundnut intercrop (49.6 kg N ha-1
) gave significantly
(p<0.05) higher yields than the monocultures of long duration pigeon pea (41.1 kg N
ha-1
) and medium duration pigeon pea (41.0 kg N ha-1
). Statistically (p<0.05), the

67
lowest N yields were generated by the groundnut sole crop (12.8 kg N ha-1
). Overall,
the intercrops showed yield advantage (total LER >1.0) compared with the
monoculture on equal land area. This is attributable to efficient utilization of growth
resources by crops grown in the intercrops........................................................................
Key words: Groundnut, double legume intercrop, maize, pigeon pea and rotation

68
3.0 INTRODUCTION
The smallholder agricultural sector in Malawi is characterized by low productivity and
land constraint (Phiri et al., 2012). The latter constraint has been aggravated by
increased population growth from 9,933,868 in 1998 to 13,066,320 in 2008,
representing an increase of 32% (NSO, 2008). This has exerted pressure on the already
limited arable land for the smallholder farmers, which by the year 2000 had fallen from
1.53 ha per household in 1968 to 0.80 ha per household (GoM, 2001). This has led to
continuous cropping principally of maize (the main cereal crop), without rotation of
crops and minimal application of soil fertility amendments resulting into decline in soil
fertility and productivity in most of the farmers’ fields (Phiri et al., 2012). The trend
necessitates the generation of agricultural technologies, that would allow for the
optimal use of the limited arable land for increased and sustainable crop production
while at the same time rejuvenating and maintaining soil fertility.
One of such technologies is intercropping pigeon pea with groundnut in rotation with
maize. Intercropping is more stable in terms of soil fertility, yield and financial returns
than monocropping. The stability under intercropping can be attributed to the partial
restoration of plant diversity that is lost under monocropping (Machado, 2009). Thus
intercropping provides high insurance against crop failure, particularly in places prone
to extreme weather conditions such as drought and floods. Furthermore, intercropping
accords greater financial stability to farmers, making it appropriate for the Malawian
labor-intensive smallholder farms. In the event that a crop fails because of unfavourable
weather conditions farmers reduce risks for total crop failure by growing more than
one crop on their fields (Clawson, 1985). This makes intercropping much less risky

69
than monocropping. Intercropping with legumes is an excellent practice for controlling
soil erosion and sustaining crop production (El-Swaify et al., 1988). For instance, in a
pigeon pea-groundnut intercropping system, the deep roots of the pigeon pea can
penetrate far into the soil breaking up hardpans and use moisture and nutrients from
deeper layers in the soil, which were positionally unavailable. On the otherhand the
shallow roots of the groundnut can bind the soil at the surface and thereby help to
reduce erosion. Other advantages of the system include weed suppression, and reduced
damage from pests and diseases (Machado, 2009).
Annual crop legumes grown in rotation with cereal crops can contribute to the total soil
N pool and improve yields of the cereals. Reported annual cereal yield responses to
previous legume crops are in the range of 50-80% over yields in cereal-cereal
sequences (Hayat, 2005). The yield increase is attributable chiefly to enhanced supply
of N to the succeeding cereal crop. Benefits of legumes have also been attributed to
improvements in soil structure, reduced insect pests and cereal diseases like yellow
spot (Pyrenophora tritici-repentis) in wheat (Delane et al., 1996).
A study was conducted at Chitedze Agricultural Research Station in Malawi to (i)
assess the effect of intercropping medium and long duration pigeon pea with
groundnut on pigeon pea growth rate and (ii) assess the effect of intercropping on the
yield components of the legumes. This was done inorder to establish the contribution
by the legumes of the biologically fixed N to the soil N pools in the pigeon pea-
groundnut for the subsequent maize.

70
3.1 MATERIALS AND METHODS
3.1.1 Study site
Details for the study site were as presented in Chapter 2 under section 2.1.1.
3.1.2 Materials
Details of the materials used in the study were as presented in Chapter 2 under section
2.1.2.
3.1.3 Field experiment
Details of the main experiment and the satistical model used for the RCBD were as
presented in Chapter 2 under section 2.1.4.
3.1.4 Experimental layout for each treatment plot
The gross plot size was 20 m x 10 m. Open ridges were spaced at 75 cm apart. In the
intercrop three pigeon pea seeds were planted per station at 90 cm apart while the
groundnut was planted in between the pigeon pea planting stations at 15 cm apart, with
one seed per station. In the pure stands three pigeon pea seeds were planted per station
at 90 cm apart while the groundnut was planted at 15 cm apart, with one seed per
station. Maize was planted on the ridges one seed at 25 cm per planting station. This
was done in January 2012.
3.1.5 Application of triple super phosphate (Ca(H2PO4)2. H2O)
At planting, all the treatment plots except where maize was planted were treated with
triple super phosphate (TSP), Ca(H2PO4)2. H2O, at the rate of 25 kg P ha-1
to boost N
fixation by the legumes due to marginally adequate plant available soil phosphorus. At
planting time, except for the pigeon pea sole crop treatment plot all the ridges were
split open to a depth of 5 cm and 93.3 g of TSP was evenly spread in the groove made

71
on each ridge. While in the sole pigeon pea treatment 8.4 g of TSP was applied per
planting station equivalent to 25 kg P ha-1
.
3.2 DATA COLLECTION AND ANALYSIS
3.2.1 Soil sample collection
Details on soil sample collection and preparation were as presented in Chapter 2 under
section 2.1.3.1.
3.2.2 Rainfall data
It was observed that the study area received moderate amount of rainfall (875 mm) and
that dry spells are a common phenomenon. Over the thirteen year period data indicate
that the area received more rainfall in the months of December, January and February.
The mean annual rainfall (875 mm) is adequate for the production of maize, pigeon pea
and groundnut.
3.2.3 Pigeon pea height measurement
At three weeks from emergence in each plot which had the pigeon pea in all the blocks,
four randomly selected pigeon pea plants were tagged. The height of each was taken
using a measuring ruler. This exercise was repeated after every two weeks from the day
of each measurement until harvest time. Mean height for the pigeon pea in a plot on
each day of height measurement was computed by summing up the height of the four
tagged plants in each treatment plot and calculating the average. Growth rate was
calculated by dividing the measured height with the number of days from seedling
emergence (Hussain, 2005).

72
3.2.4 Biomass and grain yields assessment for the pigeon pea
Grain yields assessment was done at physiological maturity of the two pigeon pea
varieties. Pods were harvested from a 2 m x 2 m net plot. Shelling was done, then
grains and the husks were weighed. The litter was collected from the ground on one
planting station (90 cm x 75 cm). This was done in October, 2012 when most leaves
had defoliated. Fresh leaves and twigs were also weighed from the 2 m x 2 m net plot.
These were oven dried for 72 hours at 70 oC to constant weights.
3.2.5 Biomass and grain yields assessment for the groundnut
Grain yields assessment was conducted at physiological maturity of the groundnut in
June, 2012. Pods were dug from a 2 m x 2 m net plot. Shelling was done, then grains
and the husks were weighed. These were later oven dried for 72 hours at 70 oC to
constant weights. Estimation of the mean number of pods per plant was done by
counting the total number pods from the net plot and dividing by the number of
planting stations in the net plot to get the mean. Groundnut haulms were also weighed
in the field and their dry weight measured after oven drying at 70oC for 72 hours to
constant weights. Agronomic data were collected for the maize plant which include
maize grain, stover and rachids yield.
3.2.6 Evaluation of the productivity of the intercropping systems
The Land Equivalent Ratio (LER) was used to evaluate the productivity of the doubled
up legume intercrops against the monocultures. The formula used was as presented in
Chapter 1 under section 1.1.12.
73
3.2.7 Plant sample analysis
Pigeon pea and groundnut materials were wet digested using nitric and perchloric acids
(Oyewole et al., 2012). P in the digests were determined colomerically using the
vanado-molybdate method, K was quantified using flame photometer while Ca was
determined using AAS (Oyewole et al., 2012). Total N was determined by the
Kjeldahl method (Amin and Flowers, 2004).
3.2.8 Nutrient yields
Nutrient yields were calculated by multiplying the nitrogen, phosphorus, potassium, and
calcium content of pigeon pea and ground tissues with their respective yields.
3.2.9 Statistical analysis
All the data were analyzed using Genstat statistical package and were subjected to
analysis of variance at 95% level of confidence. Means were separated by the least
significant difference (P<0.05).
3.3 RESULTS
3.3.1 Growth rates for the long duration and medium duration pigeon pea
Figure 3.0 and Appendices 3.0 a and b, show the growth rates of the long and medium
duration pigeon pea for both intercrops and pure stands. For the first 40 days after
planting, medium duration pigeon pea intercropped with groundnut had the highest
growth rate. This was followed by the long duration pigeon pea-groundnut intercrop,
long duration pigeon pea in the pure stand and medium duration pigeon pea in the pure
stand. Beyond the fortieth day generally growth rate in all the stands slowed down with
the medium duration pigeon pea-groundnut intercrop registering a marked reduction in
the rate of growth.

74
Figure 3.0: Growth rate of long and medium duration pigeon pea in intercrops and pure stands.
Nutrient concentrations in the litter, leaves and twigs for the pigeon pea in the long and
medium duration pigeon pea were as presented in Table 3.0a and Appendices 3.2 a-c.
No significant differences (p>0.05) were observed in the concentration of nitrogen (N),
phosphorus (P) and potassium (K) across the treatments. For N, this ranged from 0.59
to 0.72% for the litter, while for the fresh leaves, it ranged from 2.4 to 3.4%. In the
twigs, the concentration of N ranged from 2.0 to 2.6%.
For P in the same treatments, the concentration ranged from 0.18 to 0.30% in the litter,
while for the fresh leaves, this ranged from 0.15 to 0.33%. In the twigs, the
concentration of P ranged from 0.14 to 0.19%, for K this ranged from 0.25 to 0.31% in
the litter, while for the fresh leaves and twigs, the concentration ranged from 0.78 to
1.51%. For calcium (Ca) no significant differences were observed in the tissue
concentration in the litter and twigs. This ranged from 1.21 to 1.64% in the litter and
1.3 to 1.9% in the twigs. However, significant differences (p>0.05) of Ca concentration
in the fresh leaves were recorded. The highest was registered by the medium duration

75
pigeon pea grown in the pure stand (2.9%) while the lowest concentration of Ca (2.0%)
was.observed.in.the.long.duration.pigeon.pea-groundnut.intercrop.
intercrop.................................................................................. ....................
Table 3.0a: Nutrient concentration in pigeon pea biomass: Litter (L), Fresh Leaves (F)
and Twigs (T)....................................................................

76
na= not applicable
.................................................................................................................................................................................................
Table 3.0a: Nutrient concentrations in pigeon pea biomass: Litter (L), Fresh leave (L) and Twigs (T)
Treatment N(%) P(%) K(%) Ca(%)
(L) (F) (T) (L) (F) (T) (L) (F) ( T) (L) (F) (T) (L)
1.Sole maize na na na na na na na na na na na na na
2. Medium duration pigeon pea 0.65 2.4 2.4 0.20 0.33 0.15 0.25 1.51 1.04 1.2 2.6 1.3 0.35
3. Long duration pigeon pea 0.69 2.9 2.0 0.18 0.15 0.17 0.31 1.04 0.78 1.4 2.7 1.9 0.31
5. Medium duration pigeon pea + groundnut 0.59 3.1 2.6 0.30 0.19 0.14 0.28 0.87 0.93 1.6 2.9 1.5 0.36
6. Long duration pigeon pea + groundnut 0.72 3.4 2.3 0.18 0.25 0.19 0.29 0.78 1.51 1.6 2.0 1.8 0.35
7. Medium duration pigeon pea + groundnut
(Biomass not incorporated)
0.78 2.9 3.2 0.17 0.16 0.15 0.29 0.69 0.87 1.3 2.0 2.0 0.35
8. Long duration pigeon pea + groundnut
(Biomass not incorporated)
0.71 2.4 2.4 0.17 0.26 0.21 0.28 0.93 0.69 1.5 2.6 1.7 0.34
GM 0.69 2.85 2.48 0.20 0.22 0.17 0.28 0.97 0.97 1.5 2.5 1.7 0.34
CV (%) 26.2 15.5 25.7 20.9 27.7 24.1 29.4 20.5 25.5 18 9.4 28.8 9.33
LSD0.05 - 0.81 1.2 - - - - - - - 0.4 - -

77
3.3.2 Pigeon pea biomass and nutrient yields: litter, fresh leaves and twigs
Pigeon pea biomass and nutrient yields for the litter, fresh leaves and the twigs on a
hectare basis was as presented in Table 3.0b and Appendices 3.2 a-c. It is worthwhile to
state that grain yield for the pigeon pea has not been reported as this was extremely low
across the treatment. This was due to flower abortion and poor podding. No significant
differences (p>0.05) were observed in the biomass yield for the litter and fresh leaves
across the treatments. For the litter, yields ranged from 1,047 to 1,753 kg ha-1
in the
treatments where biomass was incorporated into the soil. For the twigs the yield ranged
from 332 to 553 kg ha-1
. Significant differences (p<0.05) were observed in the yields of
twigs with the sole crop of long (861 kg ha-1
) and medium duration pigeon pea (654 kg
ha-1
) registering the highest yield. The long duration pigeon pea-groundnut intercrop
(494 kg ha-1
) and the medium duration pigeon pea-groundnut intercrop (370 kg ha-1
)
gave the lowest yield.
For the long duration pigeon pea-groundnut intercrop and the medium duration pigeon
pea-groundnut intercrop, no significant differences were observed in the N yields for
the litter and fresh leaves across the treatments. This ranged from 7.7 to 11.6 kg N ha-1
for the litter, while for the fresh leaves this ranged from 11.7 to 16.1 kg N ha-1
. For the
twigs, significant yields differences were obtained across the treatments. The sole crop
of medium duration (19.8 kg N ha-1
) and long duration pigeon pea (17.5 kg N ha-1
)
gave the highest yield while the long duration-groundnut intercrop (12.7 kg N ha-1
) and
the medium duration pigeon pea-groundnut intercrop (11.6 kg N ha-1
) yielded the
lowest. For the P yields, no significant differences were observed across the treatments
in the litter, fresh leaves and twigs. This ranged from 2.2 to 3.2 kg P ha-1
for the litter,
while for the fresh leaves, this ranged from 0.77 to 0.97 kg P ha-1
. In the twigs, the
78
yields of P ranged from 0.91 to 1.7 kg P ha-1
. For the yields of K, no significant
differences were observed across the treatments in the litter and fresh leaves (Table
3.0b). This ranged from 9.7 to 12.3 kg K ha-1
for the litter, while for the fresh leaves,
this ranged from 3.8 to 6.5 kg K ha-1
. Significant differences in the yields of K in the
twigs were observed. The highest yields of K were obtained in the sole crop for the
long duration pigeon pea (5.2 kg K ha-1
) followed by the sole crop for the medium
duration pigeon pea (4.5 kg K ha-1
), long duration pigeon pea-groundnut intercrop (3.6
kg K ha-1
) and medium duration pigeon pea-groundnut intercrop (2.4 kg K ha-1
). For Ca
yields, no significant differences were observed across the treatments in the litter, fresh
leaves and twigs. Calcium yields in the litter ranged from 20.1 to 26.5 kg Ca ha-1
.
While in the fresh leaves this was 6.9 to 12.3 kg Ca ha-1
. For the twigs this ranged from
7.0 to 11.5.kg.Ca.ha-1
..........................................................................................................

79
Table 3.0b: Pigeon pea biomass and nutrient yields: Litter (L), fresh leaves (FL) and twigs (T)
Treatment Yield kg ha-1
N kg ha-1
P kg ha-1
K kg ha-1
Ca kg ha-1
L F T L F T L F T L F T L F T
1.Sole maize na na na na na na na Na na na na na na na na
2. Medium duration pigeon pea 1,047 531 654 7.7 13.5 19.8 2.4 0.97 1.5 9.7 5.8 4.5 23.5 10.6 9.8
3. Long duration pigeon pea 1,235 479 861 8.0 15.6 17.5 2.2 0.82 1.7 11.7 3.8 5.2 26.5 12.3 11.5
5. Medium duration pigeon pea + groundnut 1,753 460 370 8.9 16.1 11.6 3.2 0.80 1.06 10.7 4.8 2.4 20.1 12.0 7.0
6. Long duration pigeon pea + groundnut 1,620 332 494 11.6 11.7 12.7 2.9 0.77 0.91 12.3 6.5 3.6 26.4 6.9 8.7
7. Medium duration pigeon pea + groundnut 1,467 217 275 10.7 6.5 10.6 2.6 0.42 1.06 9.0 2.1 1.9 16.3 5.2 11.2
8. Long duration pigeon pea + groundnut 2,114 123 760 12.0 6.2 25.4 3.6 0.35 3.9 9.5 3.0 2.8 17.4 4.7 13.5
GM 1,319 306 487 8.4 9.9 13.9 2.4 0.6 1.4 9.0 3.7 2.9 18.6 7.4 8.8
CV (%) 48.9 37.
1
30 32.7 35.4 23.8 43.
1
38.3 35.8 22.1 33.2 44.
1
37.7 33.7 20.0
LSD0.05 - 255 327 - 9.3 8.5 - 0.61 1.30 - - 0.5 - 6.6 -

80
3.3.3 Concentration of nutrients in groundnut pods, haulms and grain
Nutrient concentration in the pods, haulms and grains for the groundnut in different
treatments was as presented in Table 3.1a and Appendices 3.3 d and e. No significant
differences (p>0.05) were observed in the concentration of N for the treatments in
which biomass was incorporated into the soil. This ranged from 0.61 to 1.04% for the
pods, while for the haulms, ranged from 2.4 to 3.2%. In the grain, the concentration of
N ranged from 4.6 to 6.5%. For P in the same treatments, the concentration in the
haulms and grains was statistically the same, but statistically different in the pods
(Table 3.1a). Higher P concentration was detected in the pods of the groundnut
intercropped with medium duration pigeon pea (0.12%), sole cropped groundnut
(0.10%) and groundnut intercropped with long duration pigeon pea (0.10%) in the
eighth treatment. The lower P concentrations for the pods were noted in the groundnut
intercropped with long duration pigeon pea (0.09%) in treatment six.
For the haulms P concentrations ranged from 0.15 to 0.30% while for the grain this
ranged from 0.81 to 0.92%. No significant differences (p>0.05) were observed in the
concentration of K in the pods, haulms and grains. This ranged from 0.99 to 1.47% for
the pods, while for the haulms it ranged from 0.33 to 0.59%. In the grains the K
concentration ranged from 0.84 to 1.02%. For calcium (Ca) no significant differences
were observed in the concentration for the pods and the haulms. This ranged from 0.44
to 0.66% in the pods and 0.74 to 1.08% in the haulms. However, significant differences
(p<0.05) for Ca concentrations in the grain were recorded. The highest concentrations
were registered by the sole groundnut treatment (0.84%) while the other treatments had
statistically similar mean concentrations of Ca.
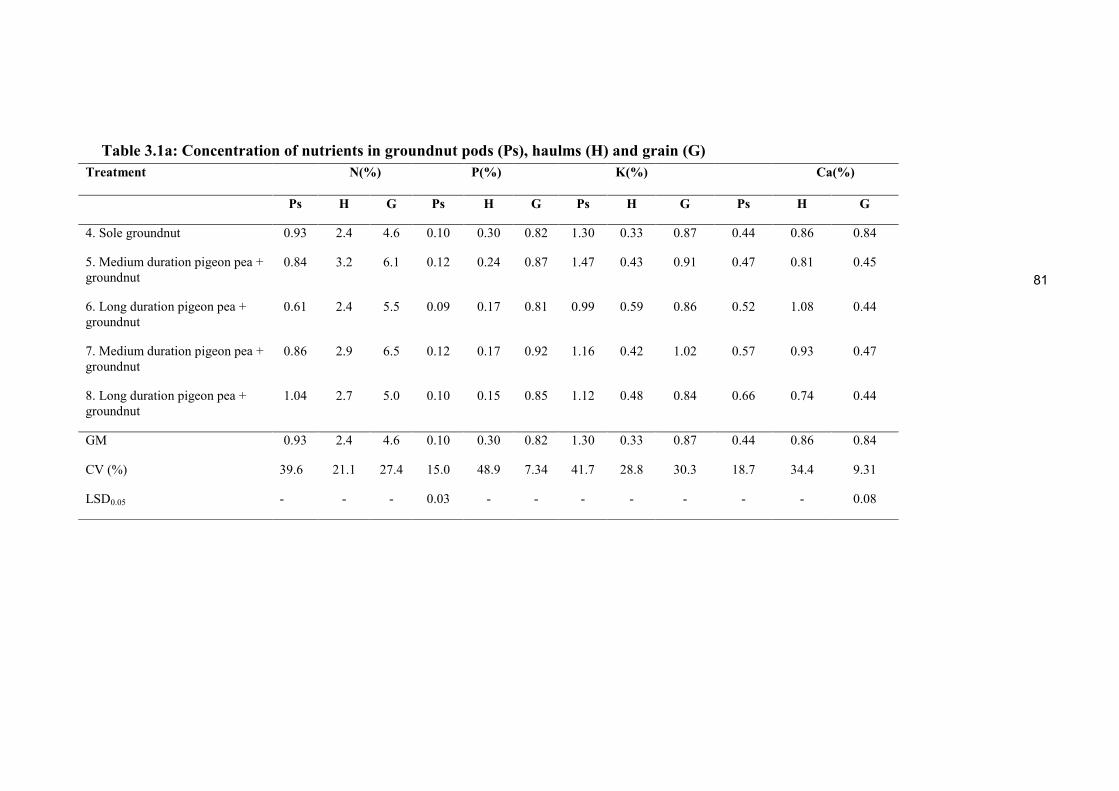
81
Table 3.1a: Concentration of nutrients in groundnut pods (Ps), haulms (H) and grain (G)
Treatment N(%) P(%) K(%) Ca(%)
Ps H G Ps H G Ps H G Ps H G
4. Sole groundnut 0.93 2.4 4.6 0.10 0.30 0.82 1.30 0.33 0.87 0.44 0.86 0.84
5. Medium duration pigeon pea +
groundnut
0.84 3.2 6.1 0.12 0.24 0.87 1.47 0.43 0.91 0.47 0.81 0.45
6. Long duration pigeon pea +
groundnut
0.61 2.4 5.5 0.09 0.17 0.81 0.99 0.59 0.86 0.52 1.08 0.44
7. Medium duration pigeon pea +
groundnut
0.86 2.9 6.5 0.12 0.17 0.92 1.16 0.42 1.02 0.57 0.93 0.47
8. Long duration pigeon pea +
groundnut
1.04 2.7 5.0 0.10 0.15 0.85 1.12 0.48 0.84 0.66 0.74 0.44
GM 0.93 2.4 4.6 0.10 0.30 0.82 1.30 0.33 0.87 0.44 0.86 0.84
CV (%) 39.6 21.1 27.4 15.0 48.9 7.34 41.7 28.8 30.3 18.7 34.4 9.31
LSD0.05 - - - 0.03 - - - - - - - 0.08

82
3.3.4 Groundnut pods, haulms, grain and nutrient yields
Groundnut biomass and nutrient yields for the pods, haulms and the grain on a hectare
basis were as presented in Table 3.1b and Appendices 3.3 e and 4.0. No significant
differences were observed in the biomass yields for the pods, haulms and grain across
the treatments. For the pods, this ranged from 136 to 619 kg ha-1
. While for the haulms
this ranged from 413 to 656 kg ha-1
. The grain yields ranged from 549 to 873 kg ha-1
.
For the N yields, significant differences were observed for the pods across the
treatments in which biomass was incorporated. Higher N yields were observed for the
groundnut pods in the sole groundnut (2.4 kg ha-1
) and in the fifth treatment (Long
duration pigeon pea-groundnut intercrop-1.8 kg ha-1
). This was followed by the sixth
treatment (Long duration pigeon pea-groundnut intercrop-0.98 kg ha-1
). For the P
yields, no significant differences were observed across the treatments in the pods,
haulms and grains. This ranged from 0.15 to 0.20 kg P ha-1
for the pods. For the haulms
statistically higher P yields were obtained in all the treatments except the eighth
treatment (0.6 kg P ha-1
). In the grain no significant differences were obtained and
yields ranged from 4.7 to 6.7 kg P ha-1
.
For K yields, no significant differences were observed across the treatments in the
pods, haulms and grain. This ranged from 1.9 to 2.8 kg K ha-1
for the pods, while for
the haulms, this ranged from 2.0 to 3.5 kg K ha-1
. In the grain this ranged from 4.3 to
7.1 kg K ha-1
. Significant differences in the yield of K in the twigs, was observed. The
highest yields of K were obtained in the sole crop for the long duration pigeon pea (5.2
kg K ha-1
) followed by the sole crop for the medium duration pigeon pea (4.5 kg K ha-
1), long duration pigeon pea-groundnut intercrop (3.6 kg K ha
-1) and medium duration

83
pigeon pea-groundnut intercrop (2.4 kg K ha-1
). For Ca yields, no significant
differences were observed across the treatments in the pods. The calcium yields in the
litter ranged from 20.1 to 26.5 kg Ca ha-1
. While in the fresh leaves this was 6.9 to 12.3
kg Ca ha-1
. For the twigs this ranged from 7.0 to 11.5 kg Ca ha-1
.

84
Table 3.1b: Groundnut pods (Ps), haulms (H), grain (G) and nutrient yields
Treatment Yields N P K Ca
kg ha-1
Pods Haulms Grain (Ps) (H) (G) (Ps) (H) (G)
(Ps)
(H) G) (Ps) (H) (G)
4. Sole groundnut 188 656 647 2.4 12.8 29 0.17 1.87 5.3 2.8 3.5 4.3 1.1 5.7 9.7
5. Medium duration pigeon pea +
groundnut
619 612 569 1.8 13.6 28 0.15 1.41 4.7 2.1 2.8 5.7 0.7 1.4 11
6. Long duration pigeon pea +
groundnut
182 479 691 1.0 11.5 38 0.16 0.81 6.1 2.1 2.0 7.1 1.1 4.0 7.7
7. Medium duration pigeon pea +
groundnut
136 498 549 1.3 14.0 30 0.19 0.86 4.7 1.9 2.7 5.3 0.6 4.7 9.7
8. Long duration pigeon pea +
groundnut
240 413 873 2.5 10.9 40 0.20 0.60 6.7 2.0 2.2 6.6 1.1 3.1 13
GM 273 532 666 1.8 12.6 33 0.2 1.1 5.5 2.2 2.6 5.8 0.9 3.8 10
CV (%) 61.0 9.9 50.7 30 22.0 30 45 56 36 28 32 37 32 20.0 22
LSD0.05 - - - 1.0 - - - 1.18 - - - - - 1.7 -

85
3.3.5 Nitrogen and phosphorus yields returned to the soil
Table 3.2 shows the calculated sum total of nitrogen and phosphorus yields returned to
the soil after biomass incorporation in each treatment that had the biomass incorporated
into the soil. Estimated yields for N and P returned to the soil for the intercrops were
obtained by summing up the respective yield from the pigeon pea and groundnut. The
medium duration pigeon pea-groundnut intercrop (50.6 kg N ha-1
) and the long duration
pigeon pea-groundnut intercrop (49.6 kg N ha-1
) gave statistically higher yields than the
long duration pigeon pea sole crop (41.1 kg N ha-1
) and the medium duration pigeon
pea sole crop (41.0 kg N ha-1
). Low N yield was generated by the groundnut sole crop
(12.8 kg N ha-1
). Significant differences were obtained in the yields of P across the
treatments. For the treatments that had the biomass incorporated treatment five,
medium duration pigeon pea-groundnut intercrop (6.5 kg P ha-1
) gave the highest yield,
this was followed by treatment six, long duration pigeon pea-groundnut intercrop (5.4
kg P ha-1
), medium duration pigeon pea sole crop (4.9 kg P ha-1
), long duration pigeon
pea sole crop (4.7 kg P ha-1
) and groundnut sole crop (1.9 kg P ha-1
).

86
PPL= Pigeon pea litter, PPF= Pigeon pea fresh leaves. PPT= Pigeon pea twigs. GNP= Groundnut pods, GNH= Groundnut haulms, GNG= Groundnut grain
Table 3.2: Calculated nitrogen and phosphorus yields returned to the soil by the legumes where biomass was
incorporated to the soil
N N N
returned
to soil
P P P
returned
to soil
PPL PPF PPT GNP GNH GNG PPL PPF PPT GNP GNH GNG
kg ha-1
2. Medium duration
pigeon pea
7.7 13.5 19.8 - - - 41.0 2.4 0.97 1.5 - - - 4.9
3. Long duration
pigeon pea
8.0 15.6 17.5 - - - 41.1 2.2 0.82 1.7 - - - 4.7
4. Sole groundnut - - - 2.4 12.8 29.0 12.8 - - - 0.17 1.9 5.3 1.9
5. Medium duration
pigeon pea +
Groundnut
8.9 16.1 11.6 1.8 14.0 27.7 50.6 3.2 0.80 1.1 0.15 1.41 4.7 6.5
6. Long duration
pigeon pea +
Groundnut
11.6 11.7 12.7 0.98 13.6 38.1 49.6 2.9 0.77 0.91 0.16 0.81 6.1 5.4
GM 9.1 14.2 15.4 1.7 13.4 31.6 39.0 2.7 0.84 1.3 0.16 1.37 5.7 4.7
CV (%) 32.7 35.4 23.8 30.2 22.03 29.9 2.71 43.1 38.3 35.8 45 56 36.1 1.86
LSD0.05 - 9.3 8.5 1.02 - - 2.0 - 0.61 1.28 - - - 0.2

87
Table 3.3 shows the evaluation of the productivity of the intercrops using the LER on
the basis of biomass production. In general all intercrops registered a yield advantage
above the monocultures of both the pigeon pea and groundnut. The higher yield
advantage over the monocultures was registered by the medium duration pigeon pea-
groundnut intercrop.
Table 3.3: Evaluation of the productivity of the intercrop against the
monocultures: biomass
Treatment
Pigeon pea
biomass-
leaves plus
twigs (kg ha-1
)
Ground
nut
Haulms
(kg ha-1
)
Partial
LER= ∑
(Ypi/Ymi)
-Pigeon
pea
Partial
LER= ∑
(Ypi/Ymi)
Groundnut
LER
= ∑
(Ypi/
Ymi)
2. Medium duration pigeon pea 2,034 - - - -
3. Long duration pigeon pea 2,636 - - - -
4. Sole groundnut - 656 - - -
5. Medium duration pigeon pea +
groundnut
2,245 612 1.10 0.93 2.03
6. Long duration pigeon pea +
groundnut
2,593 479 0.98 0.73 1.71
GM 2,377 582.3 - - -
CV (%) 29.2 9.9 - - -
LSD0.05 - 98.9 - - -
LER=Land equivalent ratio

88
3.4 DISCUSSION
3.4.1 Growth rate of medium and long duration pigeon pea in sole stands and
intercrops
Pigeon pea has a slow initial growth rate (Sharma et al., 2010). Under this study, height
measurements commenced at three weeks from emergence of the pigeon pea. At this
point in time potentially the growth rate for the crop had increased. In general, for the
first forty days after planting, the medium duration pigeon pea intercropped with
groundnut had the highest growth rate than the rest of the treatments. This was
followed by the long duration pigeon pea intercropped with groundnut, long duration
pigeon pea in the pure stand and medium duration pigeon pea in the pure stand. Beyond
this, generally, growth rate in all the stands slowed down with the medium duration
pigeon pea-groundnut intercrop registering a marked reduction in the rate of growth.
This contrasted with the observation made in the medium duration pure stand in which
a gradual slowing down of the growth rate was noticed. The observed trends could be
attributed to increased competition for growth factors i.e. solar radiation, nutrients and
moisture, in the intercrop between the pigeon pea and groundnut (Olujobi et al., 2013).
In the pure stand, the competition effect might have been less pronounced in the sole
medium duration pigeon pea due to the absence of the groundnut crop (Olujobi et al.,
2013), hence the gradual decrease of the growth rate. Between the fortieth to the sixty
seventh day from planting, intriguingly, though at a slower rate, the long duration
pigeon pea-groundnut intercrop registered a slightly higher growth rate than the long
duration pigeon pea in the pure stand. This trend could not be explained. After this
phase growth rate increased sharply in the pure stand and eventually slowed down,
while in the intercrop growth rate decreased slowly.

89
3.4.2 The effect of intercropping on the yield components of the pigeon pea and
groundnut
In general, high variability in the yields data was observed for the crops, attributable to
competition for growth factors across the cropping systems that impacted on yields.
The evaluation of the intercrops against the monocultures (Table 3.3) on LER basis
revealed that, intercropping of the two legumes is more productive than growing each
of the crops separately. This was in agreement with the findings of other researchers
(Schilling and Gibbons, 2002; Lingaraju et al., 2008; Phiri et al., 2013). This yield
advantage was not only observed at cropping system level but also at the yield
component level of the crops in the cropping system (Tables 3.1b and 3.2). The
advantage of the pigeon pea-groundnut double legume intercropping system over the
monocultures of either of the legumes was fortified further by the calculated yields of
nitrogen obtain from the system. Both the medium duration and long duration pigeon
pea-groundnut intercrop gave statistically similar nitrogen yields (Table 3.3) as N
concentrations and biomass yields that were the basis for quantification were similar
(Tables 3.0b and 3.3). This was higher than the yields of nitrogen that were generated
by the monocultures of the two legumes with the groundnut sole crop generating the
lowest yields of nitrogen. It is worthwhile to note that the nitrogen yields for the pigeon
pea monocultures and the pigeon pea-groundnut intercrop could have been slightly
higher given the fact that quantification of nitrogen yields in the roots and stems of the
legume erroneously was not conducted hence this was not included in the assessment.
Sanginga and Woomer (2009) indicated that intercropping systems use more efficiently
growth factors since they capture more radiation and utilize better the available water
and nutrients, reduce pests, diseases and suppress weeds. The legume biomass was

90
incorporated into the soil. Going by the yields of nitrogen both for the monocultures
and the intercrops, it is evident that external supplement of nitrogen will be required for
the succeeding maize crop for enhanced crop yields. The question that might require
investigation however is, after incorporation of the legume biomass into the soil how
much of this external nitrogen will be required to optimize yields while reducing the
cost accrued by purchasing the external source of nitrogen.
The biomass yields for P across the treatments were very low rendering the biomass a
poor source of P for uptake by the suceeding maize crop. The result resonates with the
report by Smithson and Giller, (2002) who indicated that biomass P content is largely
too low to provide enough P for annual crops. As such supply of phosphorus
requirements to the succeeding maize crop using the legume biomass alone was
virtually not possible. This was further aggravated by the prevailing soil reaction which
tends to increase fixation of the nutrient (Smithson and Giller, 2002). Use of external
mineral source of phosphorus on the subsequent maize crop is therefore indispensable.
For increased soil productivity, phosphorus must be added at higher rates than is
removed by crops inorder to offset the deficit of plant available P due to conversion of
the element to plant-unavailable forms, or P fixation (Smithson and Giller, 2002).
3.5 CONCLUSION
The study revealed that the soil on which the experiment was conducted was
predominantly sandy clay loam, with variable pH. The soil reaction was moderately
acid (5.5) (Wendt, 1996). The soil reaction might have reduced the availability of the
macronutrients for crop uptake. This was further compounded by the inherently low
soil N, marginally adequate soil P, Ca and low Mg content. Though P was externally

91
supplied through TSP to make up for the shortfall, the rate used might not have been
enough to offset a possible high P fixation capacity of the soil, going by the soil
reaction values. This could have had a net effect of depressing a phosphorus response
in the crops.
The study however, has confirmed the viability of the pigeon pea-groundnut
intercropping system, discounting the observed low grain yields of the groundnut and
extremely low grain yields of the pigeon pea. This was explainable interms of late
planting, a prolonged dry spell soon after the emergence of the crops and soil fertility
factors. Not with standing this it was observed that the other yield components of the
crops in the system were not compromised. Over and above, the nitrogen yields for the
cropping system were deemed to be reasonably high. Employing this system in rotation
with maize might reduce to an extent the amount and hence the cost of mineral
fertilizer required for maize production. The reduction in the amount of mineral
fertilizer will come about not only due to the mineralization of the organically bound
nitrogen but also due to the buffering effect that the organic residues have on the soil
pH and the potential to increase the cation exchange capacity of the soil. However, the
question that might need to be answered empirically is, how much of this external
nitrogen will be required to optimize yield while reducing the cost accrued by
purchasing the external source of nitrogen.

92
3.6 REFERENCES
Amin, M., and Flowers, T.H. (2004). Evaluation of the Kjeldahl digestion method.
Journal of Research (Science) 15(2): 159-179.
Andrews, D.J. and Kassam, A.H. (1976). The importance of multiple cropping in
increasing world food supplies. American Society for Agronomy 27: 1-10.
Clawson,.D.L..(1985). Harvest security and intraspecific diversity in traditional
tropical agriculture. Economic Botany 39: 56-67.
El.Swaify,.S.A.,.Lo,.A.K.F.,.Joy,.R.,.Shinshiro,.L..and.Yost,.R.S..(1988)...Achieving.
conservation..effectiveness.in..the..tropics.using.legume..intercrops..Soil.
Technology 1: 1-12.
GoM (Government of Malawi), (2001). State of Environment Report for Malawi 2001,
Lilongwe. Ministry of Natural Resources and Environmental Affairs.
Hayat,.R..(2005). Sustainable legume-cereal cropping system through management of
biological.nitrogen.fixation.in.Pothwar.PhD.Thesis,.University.of.Arid.
Agriculture Rawalpindi. 67pp.
Hussain, T., (2005). Breeding potential for high temperature tolerance in corn (Zea
mays L.). PhD thesis, University of Agriculture, Faisalabad, Pakistan. 81pp.

93
Lingaraju,.B.S.,.Marer,.S.B..and.Chandrashekar,.S..(2008)..Studies.on.intercropping.of
maize and pigeon pea under rainfed conditions in northern.transitional zone
of.Karnataka. Karnataka Journal of Agricultural Sciences 21(1): 1-3.
Machado, S. (2009). Does intercropping have a role in modern agriculture? Journal
of Soil and Water Conservation pp. 64: 65.
Olujobi, O.J., Oyun, M.B. and Oke, D.O. (2013). Nitrogen accumulation, growth.and
yield.of.maize.in.pigeon.pea/maize.intercrop..Global.Journal.of.Biology.
Agriculture and.Health Sciences 2(1): 42-48.
Oyewole, O.S., Ajayi, I.O.J. and Rotimi, R.I. (2012). Growth of cocoa (Theobroma
cacao L.) seedlings on old cocoa soils amended with organic and inorganic
fertilizers. African Journal of Agricultural Research 7(24): 3604-3608.
Phiri, A.T., Mhango, W.G., Njoloma, J.P., Kanyama-Phiri, G.Y. and Lowole, M.W.
(2012). Farmers’ evaluation of integrated soil fertility management methods in
northern Kasungu central Malawi. Journal of Agricultural Extension and Rural
Development 4(11): 340-346.
Phiri, A.T., Njoloma, J.P., Kanyama-Phiri, G.Y., Sieglinde, S. and Lowole, M.W.
(2013). Effects of intercropping systems and the application of Tundulu rock
phosphate on groundnut grain yield in central Malawi. International Journal of
Plant and Animal Sciences 1(1): 011-020.

94
Sanginga, N. and Woomer, P.L. (2009). Integrated soil fertility management in Africa:
Principles, Practices and Development Process. (Eds.). Tropical Soil Biology
and Fertility. Institute of the International Centre for Tropical Agriculture.
Nairobi. 263pp.
Schillings, R. and Gibbons, R. (2002). Groundnut. London and Oxford. Macmillan
Education Ltd. 146pp.
Sharma, O.P., Gopali, J.B., Suhas, Y., Bambawale, O.M., Garg, D.K. and Bhosle, B.B.
(2010). Pests of pigeon pea and their management, NCIPM, LBS Building,
IARI Campus, New Delhi, India. pp. 11-12.
Singh,.F..and.Oswalt,.D.L..(1995)..Groundnut.production.practices..Skill.Development
Series no. 3 Revised ICRISAT. 20pp.
Smithson, P.C. and Giller, K.E. (2002). Appropriate farm management practices for
alleviating N and P deficiencies in low-nutrient soils of the tropics. Plant and
Soil 245: 169–180.

95
CHAPTER 4:
INSITU ASSESSMENT OF SOIL NITRATE-NITROGEN IN THE PIGEON
PEA-GROUNDNUT INTERCROPPING-MAIZE ROTATION SYSTEM:
IMPLICATIONS ON NITROGEN MANAGEMENT FOR INCREASED MAIZE
PRODUCTIVITY
ABSTRACT
A study on the assessment of the effect of biomass incorporation in the soil on the level
of soil nitrate nitrogen (NO3-‒N), was conducted in a pigeon pea-groundnut intercrop-
maize rotation cropping system at Chitedze Agricultural Research Station (13o 59’
23.2” S, 033o38’ 36.8” E) in the 2012/2013 cropping season. In the 2011/2012 cropping
season, eight treatments replicated three times laid in a randomized complete block
design, with monocultures and intercrops of either long (ICEAP 04000) and medium
duration (ICEAP 00557) pigeon pea with groundnut (CG 7) planted. At harvest,
legume biomass was incorporated to the soil in some of the plots. Maize was planted in
the 2012/2013 cropping season and NO3- data collected insitu from emergence at 0-20
cm and 20-40 cm depth over a period of three weeks. This was done before top
dressing with urea. This was conducted at an interval of four days over a period of three
weeks and six days. The assessment was done using a Horiba NO3- meter for soil (B-
342). Means for NO3- level from the four points for each soil depth in each plot were
computed. The corrected data was transformed into NO3-‒N by multiplying by a factor
of 0.23. The data were subjected to the analysis of variance using GENSTAT. Means
were separated using the least significant difference (LSD). The results from the study
suggest that there was high (> 100 mg L-1
) NO3-‒N in the soil solution in all plots over
the study period (106.4 mg L-1
to 463.1 mg L-1
). In general, soil NO3-‒N was higher

96
between 20-40 cm than between 0-20 cm, a result of leaching. This was attributable to
the sandy clay loam texture of the soil and the low to medium level of SOM.
Potentially, the high levels of soil NO3-‒N in the plots declined over the season due to
uptake by the maize crop and leaching losses, justifying the need for N
supplementation from mineral fertilizer into this system for the realization of
reasonably high maize yields.
Key Words: Groundnut biomass, Intercropping, nitrate-nitrogen, pigeon pea biomass

97
4.0 INTRODUCTION
In Malawi maize yields are limited principally by nitrogen (N) defficiencies in soils
under cultivation (Phiri et al., 2010). To circumvert this impedement, use of mineral N
fertilizer for increased yields has been advocated for decades. However, with escalation
of the fertilizer prices on the market, this option has proved to be beyond reach of the
resource poor smallholder farmers (Phiri et al., 2010). Furthermore, the sole use of
mineral fertilizers on many smallholder farms has led to general physical and chemical
degradation of the soil (Maida, 2005). This has severely undermined the productivity of
the soils in Malawi. To address the challenge, an array of soil rejuvinating technologies
have been proposed. The premier method appears to be the large scale integration of
legumes like the pigeon pea and groundnut in the maize production systems and the
incorporation of their biomass into the soils (Bezner-Kerr, 2007). A systematic
integrating of legumes into the predominantly maize production system has been
proposed which is the pigeon pea-groundnut intercropping system in rotation with
maize (Kanyama-Phiri et al., 2008). Phiri et al. (2013), reported that the system can
generate substantial amounts of nitrogen rich biomass which upon incorporation into
the soil, in a legume-cereal rotation system, the biomass can improve soil fertility
thereby leading to increased maize yields. The improvement in soil fertility is
attributable to increase in the soil’s ability to retain nutrients, buffer soil pH, increase
the soil’s water holding capacity and the nutrients released upon the decomposition and
mineralization of the biomass (Krull et al., 2004) particularly N.
In this system, the prime nutrient element, released by the incorporated, decomposing
and mineralizing pigeon pea and groundnut residues, is the organically bound N. The

98
soil microbe mediated process of decomposition and N mineralization, converts the
organically bound N into plant available forms namely ammonium nitrogen (NH4+‒N),
and nitrate nitrogen (NO3-‒N) (Deenik, 2006). Uwah et al. (2009) reported that NO3
- or
NO3-‒N is the major form of N absorbed by plants. Currently, in Malawi, little is
known on the impact of the incorporation of pigeon pea and groundnut biomass on soil
NO3-‒N and the implication of this effect on maize production. A study therefore, was
conducted, to assess the effect of the biomass incorporation on soil NO3-‒N in the
pigeon pea-groundnut intercropping-maize rotation system. It was hypothesized that
the assessment would help in the assertion of the implication of this effect on soil N
management and maize production. Estimates of mineral fertilizer N required for maize
production are functions of expected yields, the amount of residual soil NO3-‒N, SOM
and other sources of N, timing of application and price of mineral fertilizer (Shapiro et
al., 2008). Residual NO3-‒N in soil is an important N source for crops, and correlates
with crop yields (Ferguson et al., 2002; Fan and Hao, 2003).
4.1 MATERIALS AND METHODS
4.1.1 Study site
Details on the location of the study site are as presented in Chapter 2 section 2.1.1.
4.1.2 Materials
Materials used during the study included the following; biomass of a photo and thermo
insensitive medium duration pigeon pea variety (ICEAP 00557, whose potential yield
is up to 2.5 t ha-1
) and matures in 5-6 months; biomass of a long-duration pigeon pea
variety (ICEAP 04000, potential yield is 1.6-2 t ha-1
) maturing in 8-9 months; biomass
of groundnut (CG 7 whose potential yield is 3 t ha-1
); early maturing maize variety (SC

99
403 with a potential yield of 6 t ha-1
) and triple super phosphate (TSP), Ca(H2PO4)2.
H2O. To generate data the following were used; Horiba NO3- meter for NO3
- soil, a
digital pH meter, Hygrothermo, distilled water; plastic bottles, beakers, centrifuge
tubes, soil auger, and a wash bottle.
4.1.2 Experimental design
Details on expelimental design and layout are as presented in Chapter 2 under section
2.1.4.
4.2 DATA COLLECTION AND ANALYSIS
4.2.1 Soil sample collection after biomass incorporation to the soil preparation and
laboratory analysis
Details of soil sample collection after biomass incorporation to the soil, preparation and
laboratory analysis were as described in Chapter 2 under section 2.1.3.3.
4.2.2 Insitu measurement of soil pH, soil temperature and soil humidity
Soil pHH2O, was measured insitu using a digital pH meter. This was calibrated before
making the measurements. Soil temperature and humidity were measured using a
hygrothermo. The assessment of these parameters was done at the depth of 0-20 cm and
20-40 cm in the soil. Measurement was done at four positions within each plot for the
respective soil depths. Means of the measurements for each parameter in the respective
plots were computed thereafter.
4.2.3 Soil nitrate-nitrogen
Soil NO3- level was assessed after every three days over a period of four weeks for
seven times from the emergence of maize using Horiba NO3- meter for soil (B-342).

100
Data was collected after every three days within the stated time frame. The assessment
was conducted from 16 December, 2012 to 10 January, 2013. Soil NO3- was measured
on 16, 20, 24, 29 December 2012 and 1, 6, and 10 January, 2013. The assessment was
done on four different points in each treatment plot for the soil depths of 0-20 cm and
20-40 cm..Soil nitrate was measured according to the procedure by Hall and Lockhart.
Calibration of the NO3- meter was done on each day before making measurements.
Means of the NO3- level from the four points for the respective depth in each plot were
computed. The corrected data was then transformed into NO3-‒N by multiplying by a
factor of 0.23.
In the parallel experiment after harvest, the legume biomass was incorporated (one
ridge in each treatment plot) in May, 2013 for one month. The ridges were watered at
an interval of three days for a fortnight as a way of simulating wet soil conditions that
prevail during the rainy season and also to facilitate decomposition and mineralization
of the biomass. Composite soil samples from 0-20 cm and 20-40 cm were collected
from all the plots. The composite samples were made from soil collected on five points
on the ridge. Soil NO3-
measurements using the meter, transformed to NO3-‒N, were
done on the samples. Measurement of NO3-‒N was also performed on the samples
using the KCl method (Miller and Sonon) for the correlation of the KCl and the digital
nitrate meter method for soil NO3-‒N measurement.
4.2.4 Daily rainfall and temperature reading during the data collection period
The study was conducted in the months of December, 2012, January, May and June,
2013. Daily rainfall and temperature data for these months were obtained from
Chitedze Meteorogical Station (Appendices 4.0a to 4.2d).

101
4.2.5 Statistical analysis…………………………………………………………………
All the data were analyzed using Genstat statistical package and were subjected to
analysis of variance at 95% level of confidence. Means were separated by the least
significant difference (P<0.05)…………………………………………………………...
4.3 RESULTS……………………………………………………………………………
4.3.1 Soil pH, soil temperature, humidity, total nitrogen and organic carbon
content
Table 4.0 and Appendinces 4.1-4.4, summarizes the soil pH, soil temperature and
humidity as recorded on the first day of the assessment. Also included is second season
data after biomass incorporation to the soil, for total nitrogen and organic carbon
content in the soil. The results indicate that the mean soil reaction was acid to
moderately acid both between 0-20 cm (pH=5.4-5.7) and between 20-40 cm (pH=5.4-
5.6) (Wendt, 1996) in all the treatment plots. Total nitrogen was low (<0.12%) both
between 0-20 cm (0.09%) and 20-40 cm (0.11%) to marginally adequate (≥ 0.12%)
(0.12-0.14%) in the sampled levels. It is worth while to note that total N between 0-20
cm was low in treatment plots 1 and 3. This was high in other treatment plots for this
sampled depth. Organic carbon was marginally adequate (≥ 0.88%) (Wendt, 1996) both
between 0-20 cm (1.08-1.63%) and 20-40 cm (1.17-1.55%). Soil temperature ranged
from 25.9 to 27.2 oC between 0-20 cm and 25.9 to 27.1
oC between 20-40
cm.…………………………………………..

102
Table 4.0: Soil pH, soil temperature, humidity, total nitrogen and organic carbon content
Treatment pHH2O
0-20
cm
pHH2O
20-40
cm
OC
(%)
0-20 cm
OC
(%)
20-40 cm
Total
N(%)
0-20 cm
Total
N(%)
20-40
cm
Soil
Temperature
(oC)
0-20 cm
Soil
Temperature
(oC)
20-40 cm
Soil
Humidity
(%)
0-20 cm
Soil
Humidity
(%)
20-40 cm
1.Sole maize 5.5 5.4 1.08 1.42 0.09 0.12 26.2 26.2 75.7 77.8
2.Medium duration pigeon pea 5.4 5.5 1.50 1.36 0.13 0.12 26.9 26.7 73.6 75.0
3.Long duration pigeon pea 5.6 5.5 1.10 1.17 0.07 0.11 25.9 25.9 75.2 77.2
4.Sole groundnut 5.5 5.4 1.28 1.34 0.11 0.11 26.3 26.2 77.5 79.8
5.Medium duration pigeon pea +
groundnut
5.4 5.4 1.29 1.32 0.11 0.11 26.1 25.9 77.6 80.9
6.Long duration pigeon pea +
groundnut
5.7 5.5 1.63 1.35 0.14 0.11 27.2 26.9 73.5 74.7
7.Medium duration pigeon pea +
groundnut biomass not
incorporated
5.6 5.6 1.31 1.55 0.12 0.13 25.7 25.7 79.9 81.0
8.Long duration pigeon pea +
groundnut biomass not
incorporated
5.6 5.5 1.58 1.39 0.14 0.12 27.1 27.1 76.8 77.6
GM 5.5 5.5 1.35 1.36 0.11 0.12 26.4 26.3 76.2 78.0
CV (%) 4.4 3.70 33.6 17.2 19.72 17.75 3.8 3.6 3.6 4.0
LSD0.05 - - - - 0.04 - - - - -

103
4.3.2 The amount of biomass produced by the legumes and incorporated into the
soil
The biomass yields for the legume monocultures and legume intecrops were as
presented in Table 4.1, Appendix 2.5. All the biomass were ploughed under in
treatment plot 2 to 6. The weighed leafy biomass ploughed under was as shown below.
Stems for pigeon pea were also ploughed under but these were not weighed,
erroneously.
Table 4.1: The amount of biomass produced by the legumes and incorporated
into the soil
na= not applicable
Treatment
Total pigeon pea
biomass (leaves plus
twigs) (kg ha-1
)
Groundnut
Haulms (kg
ha-1
)
Total
biomass
Incorporated
(kg ha-1
)
2. Medium duration pigeon pea 2,034 na 2,034
3. Long duration pigeon pea 2,636 na 2,636
4. Groundnut only na 656 656
5. Medium duration pigeon pea +
groundnut
2,245 612 2,857
6. Long duration pigeon pea +
groundnut
2,593 479 3,072
GM 2,377 582 1,876
CV (%) 29.2 9.9 30.0
LSD0.05 - 98.9 932

104
4.3.3 Level of soil nitrate-nitrogen measured over the four week period
Table 4.2 and Appendices 4.5 to 4.17, shows the level of soil nitrate-nitrogen measured
over the period of three weeks and five days in the month of December, 2012 and
January, 2013.
On the first, day the amount of soil NO3-‒N between 0-20 cm ranged from 243.7 to
456.4 mg L-1
. Significant differences (p<0.05) were observed in the amount of soil
NO3-‒N across the treatment plots at this depth. A statistically higher (p<0.05) amount
of soil NO3-‒N was recorded in treatment plot 8 (456.4 mg L
-1) compared with the rest
of the treatment plots. In the soil between 20-40 cm there was no significant difference
(p>0.05) in the level of NO3-‒N across treatment plots. This ranged from 249.6 to 444.9
mg L-1
. Except in treatment plot 3, 5 and 8, soil NO3-‒N was higher between 20-40 cm
than between 0-20 cm.
For the second day measurements, no statistical differences were observed in the level
of soil NO3-‒N across treatment plots both between 0-20 cm and 20-40 cm in the soil.
This ranged from 161.7 to 369.2 mg L-1
between 0-20 cm and 252.3 to 409.5 mg L-1
between 20-40 cm in the soil. All treatment plots apart from treatment plot 2 had higher
NO3-‒N between 20-40 cm than between 0-20 cm in the soil.
On the third day of data collection, the amount of soil NO3-‒N between 0-20 cm ranged
from 149.6 to 300.3 mg L-1
. A Significantly higher (p<0.05) amount of soil NO3-‒N
was recorded in treatment plot 6 (300.3 mg L-1
) compared with the rest of the treatment
plots. Between 20-40 cm in soil there were no differences in the level of NO3-‒N across

105
treatment plots. This ranged from 198.8 to 410.4 mg L-1
. On this day, across all the
treatment plots, soil NO3-‒N was higher between 20-40 cm than between 0-20 cm.
On the fourth day of measurement, no statistical differences were observed in the level
of soil NO3-‒N across treatment plots both between 0-20 cm and 20-40 cm in the soil.
This ranged from 278.5 to 444.9 mg L-1
between 0-20 cm and 276.9 to 443.3 mg L-1
between 20-40 cm. All treatment plots except treatment plot 1, 2 and 3 had higher NO3-
‒N between 20-40 cm than between 0-20 cm.
On day number five, the amount of NO3-‒N ranged from 265.7 to 463.1 mg L
-1
between 0-20 cm and 294.5 to 452.6 mg L-1
between 20-40 cm in the soil. A
significantly higher (p<0.05) amount of soil NO3-‒N was recorded in treatment plot 8
both between 0-20 cm (463.1 mg L-1
) and 20-40 cm (452.6 mg L-1
) in the soil,
compared with the rest of the treatment plots. Except for treatment plot 1, 2, 4 and 8
soil NO3-‒N was higher in the latter than former depth level.
On the sixth day of data collection, amount of NO3-‒N ranged from 106.6 to 324.0 mg
L-1
between 0-20 cm and 139.9 to 375.0 mg L-1
between 20-40 cm. Statistical
differences (p<0.05) were observed in the mean amount of soil NO3-‒N between 0-20
cm. This was significantly higher in treatment plot 4 (328.0 mg L-1
) and treatment plot
8 (324 mg L-1
). The lowest amount was recorded in treatment plot 1 (106.4 mg L-1
) and
treatment plot 2 (150.1 mg L-1
). Except for treatment plot 2 soil NO3-‒N was higher
between 20-40 cm than between 0-20 cm.
On the seventh day, no significance differences were observed in the amount of NO3-
‒N across treatment plots between 0-20 cm in the soil. This ranged from 130.9 to 226.4

106
mg L-1
, while between 20-40 cm it ranged from 144.0 to 233.1 mg L-1
. A significantly
higher (p<0.05) amount of soil NO3-‒N was recorded in treatment plot 3 (233.1 mg L
-1)
and treatment plot 5 (227.4 mg L-1
). The lowest amount of NO3-‒N was registered in
treatment plot 7 (144.0 mg L-1
). Minus treatment plot 1, 4, and 8, soil NO3-‒N was
higher between 20-40 cm than between 0-20 cm.

107
Table 4.2: Soil nitrate-nitrogen in level in plots three weeks from the emergence of maize, second season
Day 1 Day 2 Day 3 Day 4 Day 5 Day 6 Day 7
0-20cm 20-40
cm
0-20
cm
20-40
cm
0-20
Cm
20-40
cm
0-20
cm
20-40
cm
0-20
cm
20-40
cm
0-20
cm
20-40
cm
0-20
cm
20-40
cm
Treatments
mg/L
1.Sole maize 356.8 366.4 161.7 263.1 214.3 276.6 390.0 388.4 406.6 378.2 106.4 130.9 179.0 175.3
2.Medium duration pigeon pea 356.8 376.9 296.6 252.3 211.6 299.3 394.1 392.5 420.0 383.6 150.1 144.1 186.4 211.4
3.Long duration pigeon pea 300.2 249.6 369.2 409.5 149.6 198.8 331.9 330.3 323.2 354.9 283.0 328.0 219.2 233.1
4.Sole groundnut 335.7 367.3 299.6 322.4 151.3 260.9 429.0 427.4 330.9 294.5 328.0 375.0 165.5 151.9
5.Medium duration pigeon pea +
groundnut 382.6 303.5 244.2 342.4 184.3 252.2 392.2 390.6 331.9 368.3 311.7 316.2 226.4 227.4
6.Long duration pigeon pea + groundnut 251.4 285.9 282.0 398.5 300.3 410.4 444.9 443.3 337.6 389.4 198.2 213.2 152.0 166.2
7.Medium duration pigeon pea +
groundnut biomass not incorporated 243.7 309.8 254.2 264.7 191.6 287.8 278.5 276.9 265.7 355.8 279.5 307.5 130.8 144.0
8.Long duration pigeon pea + groundnut
biomass not incorporated 456.4 444.9 184.3 270.6 255.3 394.1 350.1 361.2 463.1 452.6 324.0 325.1 224.5 212.7
GM 335.5 338.0 261.5 315.4 207.3 297.5 376.3 376.3 359.9 372.2 247.6 267.5 185.5 190.3
CV% 24.6 24.4 22.2 26.8 23.9 24.4 25.4 25.4 19.3 22.9 51.3 26.1 22.2 24.4
LSD0.05 144.2 - - - 122.9 - - - 121.3 149.4 127.1 - - 81.2
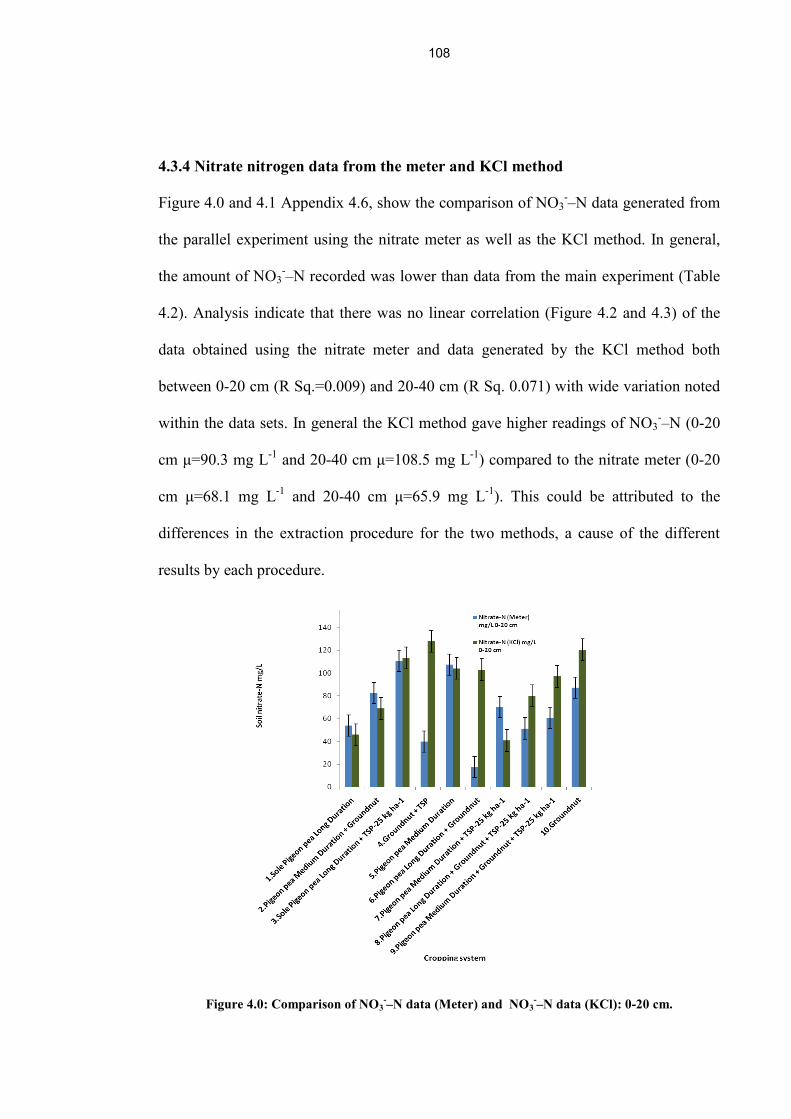
108
4.3.4 Nitrate nitrogen data from the meter and KCl method
Figure 4.0 and 4.1 Appendix 4.6, show the comparison of NO3-‒N data generated from
the parallel experiment using the nitrate meter as well as the KCl method. In general,
the amount of NO3-‒N recorded was lower than data from the main experiment (Table
4.2). Analysis indicate that there was no linear correlation (Figure 4.2 and 4.3) of the
data obtained using the nitrate meter and data generated by the KCl method both
between 0-20 cm (R Sq.=0.009) and 20-40 cm (R Sq. 0.071) with wide variation noted
within the data sets. In general the KCl method gave higher readings of NO3-‒N (0-20
cm μ=90.3 mg L-1
and 20-40 cm μ=108.5 mg L-1
) compared to the nitrate meter (0-20
cm μ=68.1 mg L-1
and 20-40 cm μ=65.9 mg L-1
). This could be attributed to the
differences in the extraction procedure for the two methods, a cause of the different
results by each procedure.
Figure 4.0: Comparison of NO3-‒N data (Meter) and NO3
-‒N data (KCl): 0-20 cm.

109
Figure 4.1: Comparison of NO3-‒N data (Meter) and NO3
-‒N data (KCl): 20-40 cm.
Figure 4.2: Correlation of NO3-‒N data (Meter) and NO3
-‒N data (KCl): 0-20 cm

110
Figure 4.3: Correlation of NO3-‒N (Meter) and NO3
-‒N data (KCl): 20-40 cm.
4.4 DISCUSSION
The results of the study seem to suggest that the soil generally has high NO3-‒N in the
soil solution (≥100 mg/L) (Ray Weil, personal communication). The values obtained
during the cropping season were higher than values reported by Uwah et al., (2009).
However, the results obtained off season in the parallel experiment using both the
meter and the KCl method fall within the same range of values reported by Uwah et al.,
(2009) that is 40.0 to 107 mg L-1
.
In general, the amount of NO3-‒N recorded off season was lower than data from the
cropping season (Figure 4.0-4.1 and Table 4.2). This is explainable mainly interms of
the prevailing temperature conditions at the time the measurements were done. It was
warmer in January, 2013 (Appendix 4.0b) and cooler in June, 2013 (Appendix 4.0c)
when data was collected from the main experiment and parallel experiment,
respectively. Most likely higher microbiological activity was present in January than in
June, resulting into a higher rate of decomposition and mineralization of N from the
incorporated biomass (Davidson et al., 2006). This released more NO3- into the soil

111
system culminating into higher NO3-‒N readings. The opposite scenario held for the
parallel experiment. The lower temperature possibly reduced microbial activity and
hence the rate of decomposition of the biomass and mineralization of N (Davidson et
al., 2006). The result of this is mirrored by the lower NO3-‒N values that were
recorded. In general the KCl method gave higher readings of NO3-‒N compared with
the nitrate meter. This could be attributed to the differences in the extraction procedure
for the two methods, a cause of the different results by each procedure.
It was further observed, that the level of soil NO3-‒N in most cases was statistically the
same (p>0.05) in treatment plots that had the legume biomass ploughed under and in
treatment plots that did not have plant biomass ploughed under. This could be due to
two reasons. Firstly, the soil on which the experiment was mounted though not having
high indigenous nitrogen content has been subjected to N fertilization and legume
cropping over years. As such, potential for having residual soil NO3-‒N in soil solution
is high (Shapiro et al., 2008). This could possibly be the reason why the values of the
parameter were consistently statistically the same (p>0.05) in treatment plots with
biomass incorporated and treatment plots that did not have the biomass incorporated
into the soil. Secondly, it is highly likely that the process of biomass decomposition and
mineralization of the organically bound N from the incorporated legume biomass was
gradual, due to warm soil conditions, thus, this could not lead to spontenous increament
in the level of soil NO3-‒N in these treatment plots. From work conducted in southern
Malawi, Phiri et al., (1999) reported that the incorporation of biomass for Sesbania
sesban into the soil increased soil nitrate level. It was also observed that largely, soil
NO3-‒N was higher between 20-40 cm than between 0-20 cm in the soil. This was
attributable to the soil texture which is predominantly sandy clay loam. Leaching of

112
NO3- is high in soils with such texture class (Fan et al., 2010). It is likely that the level
of soil NO3-‒N in the treatment plots which had no biomass incorporated would decline
faster as the season advanced, than in the treatment plots where biomass was
incorporated. This would have come about mostly due to uptake by the maize crop,
leaching losses and denitrification (Ju et al., 2009). However, it is worth while to note
that though the high level of NO3-‒N might have endure longer into the season, for the
latter treatment plots, this may not have lasted until the end of the cropping cycle due to
the limited amount of organically bound N in the biomass.
4.5 CONCLUSION
Under the conditions of the study, the results of the suggest that the soil in general has
high NO3-‒N in the soil solution attributable to residual N from fertilization and legume
cropping over years. The soil NO3-‒N was higher between 20-40 cm than between 0-
20 cm in the soil. This was attributable to the soil texture which is predominantly sandy
clay loam with low to medium level of SOM. Leaching of NO3- is high under such soil
conditions. It was projected that soil NO3-‒N levels in all the treatment plots will
decline in all the treatment plots along the season. This for the Malawian smallholder
farmers implies that in this cropping system N supplementation from mineral fertilizer
is not optional if reasonably high maize yield is to be realized. This principally is due to
the limited amount of tissue N in the biomass.
Comparative analysis of two nitrate analysis procedures indicated that the KCl method
gave higher readings of NO3-‒N compared with the nitrate meter. This was accrued to
the differences in the extraction procedure for the two methods. From the study, both
methods are recommended for the analysis of soil NO3-‒N.

113
4.6 REFERENCES
Bezner.Kerr,.R.,.Snapp,.S.,.Shumba,.L..and.Msachi,.R..(2007)..Participatory research
on legume diversification with Malawian smallholder farmers for improved
human nutrition and soil fertility. Experimental Agriculture 43: 437–453.
Davidson, E.A., Janssens, I.A. and Luo, Y. (2006). On variability of respiration in
terrestrial ecosystems: moving beyond Q10. Global Change Biology 12: 154-
164.
Deenik, J. (2006). Soil and crop management. Nitrogen mineralization potential in
important agricultural soils of Hawai‘i. SCM 15pp.
Fan, J. and Hao, M.D. (2003). Nitrate accumulation in soil profile of dryland farmland.
Journal of Agro Environmental Science 22: 263-266.
Fan, J., Hao, M. and Malhi, S.S. (2010). Accumulation of nitrate-N in the soil profile
and its implications for the environment under dryland agriculture in northern
China: A review. Canadian Journal of Soil Science 90: 429-440.
Ferguson, R.B., Hergertb, G.W., Schepersc, J.S., Gotwayd, C.A., Cahoone, J.E. and
Petersonf, T.A. (2002). Site specific nitrogen management of irrigated maize,
yield and soil residual nitrate effects. Soil Science Society of America Journal
66: 544-553.

114
Hall,.T..and.Lockhart..[http://www.awqa.org/pubs/waterqual/soilproc.pdf].site.visited
on 10/12/2012.
Ju, X.T., Xing, G.X., Chen, X.P., Zhang, S.L., Zhang, L.J., Liu, X.J., Cui, Z.L., Yin, B.,
Christie, P., Zhu, Z.L. and Zhang, F.S. (2009). Reducing environmental risk by
improving N management in intensive Chinese agricultural systems. PNAS
106: 3041-3046.
Kanyama-Phiri, G.Y., Snapp, S., Wellard, K., Mhango, W., Phiri, A.T., Njoloma, J.P.,
Msusa H., Lowole, M. and Dakishon, L. (2008). Legume best bets to improve
soil quality and family nutrition. Conference proceedings: Mc Knight
Foundation S/E African community of practice meeting Lilongwe, Malawi
October, 2008. 25pp.
Krull, E.S., Skjemstad, J.O. and Baldock, J.A. (2004). Functions of soil organic matter
and the effect on soil properties. In: Grains Research and Development
Corporation. 129pp.
Maida, J.H.A..(2005). The role of soil science in.agricultural production. A paper
presented at the launch of the book, “Elements of soil chemistry and fertility”,
Bunda College of Agriculture, 23 November, 2005. 34pp.
Miller,.R..and.Sonon,.L..Soil.nitrate.nitrogen.KCl..extraction/Cd.reduction.method.[http:/
/www.clemson.edu/agsrvlb/sera6/nitratenitrogen3.doc].site.visited.on.03/05/2013.

115
Phiri, A.T., Njoloma, J.P., Kanyama-Phiri, G.Y., Sieglinde, S. and Lowole, M.W.
(2010). Maize yield response to the combined application of Tundulu rock
phosphate and pigeon pea in Kasungu, central Malawi. African Journal of
Agricultural Research 5(11): 1235-1242.
Phiri, A.T., Njoloma, J.P., Kanyama-Phiri, G.Y., Sieglinde, S. and Lowole, M.W.
(2013). Effects of intercropping systems and the application of Tundulu rock
phosphate on groundnut grain yield in central Malawi. International Journal of
Plant and Animal Sciences 1(1): 11-20.
Phiri, R.H., Snapp S., and Kanyama-Phiri, G.Y. (1999). Soil nitrate dynamics in
relation to nitrogen source and landscape position in Malawi. Agroforestry
Systems 47: 253–262.
Shapiro, C.A., Ferguson, R.B., Hergert, G.W., Wortmann, C.S. and Walters, D.T.
(2008). Suggestions for corn. University of Nebraska-Lincoln Extension. 20pp.
Uwah, E.I., Abah, J., Ndahi, N.P. and Ogugbuaja, V.O. (2009). Concentration levels of
nitrate and nitrite in soils and some leafy vegetables obtained in Maiduguri,
Nigeria. Journal of Applied Science in Environmental Sanitation 4(3): 233-244.

116
Wendt, J.W. (1996). Chemical Analysis Manual Soil and Plant Samples. Rockefeller
Foundation and Department of Agricultural Research and Technical Services,
Lilongwe, Malawi. 38-39pp.

117
CHAPTER 5:
PIGEON PEA ROOT NITROGEN YIELDS FOR THE PIGEON PEA-
GROUNDNUT INTERCROP SYSTEM
ABSTRACT
A study aimed at the assessment of the contribution of pigeon pea roots to N yield for
the pigeon pea was conducted at Chitedze Agricultural Research Station (13o 59’ 23.2”
S, 033o38’ 36.8” E), Malawi in the 2012/2013 cropping season. Ten treatments,
replicated three times were laid in a randomized complete block design. Two pigeon
pea varieties, long (ICEAP 04000) and medium duration (ICEAP 00557) and
groundnut (CG 7) were grown as monocultures and intercrops. The intercrops involved
planting either of the pigeon pea varieties with groundnut. Some of the plots were
treated with triple super phosphate (TSP) at the rate of 25 kg P ha-1
for subsequent
comparison of N yields between the P treated plots and non P treated plots. At harvest,
roots for pigeon pea from three plants in each plot were dug out up to the 30 cm depth
by 30 cm diameter. The root biomass was oven dried for 72 hours at 70oC to costant
weights. The roots were then ground and laboratory analysis performed to determine
concentrations of N, which ranged from 1.0-1.6%. Pigeon pea root biomass yields
which were statistically the same (P>0.05) ranged from 507-605 kg ha-1
. This translated
to N yields of 5.7 to 7.7 kg N ha-1
. Though it is a modest contribution to the soil it
cannot be overlooked since the nutrient even after immobilization, a temporally state,
largely is available for uptake by succeeding crops in a rotation system as it does not
get complexed in the soil as is the case with phosphorus.
Key words: Biomass, groundnut, Intercrop, maize, nitrogen, pigeon pea and roots
118
5.0 INTRODUCTION
The role of legumes in soil fertility rejuvenation is globally reckoned and remains a
vital link towards sustainable agricultural production. The role played by legumes,
nitrogen (N) fixation and high quality biomass production are chorused as the main
reasons why legumes hold a key to sustainable agriculture. Other equally important
unique traits of legumes have also been spelt out and these include; the capacity to
excrete root compounds that solubilizes complexed phosphorus (P) that otherwise
remain unavailable (Drinkwater and Snapp, 2007). For example, the roots of pigeon
pea (Cajanus cajan), produce an exudate (piscidic acid-C11H12O7) which releases P
from the Fe-P complexes through solubilization, thereby increasing available P (Ae et
al., 1990). The deep penetrating and laterally spreading root system confers drought
tolerance through optimal use of soil moisture (Sharma, 2009). Furthermore, the deep
roots absorb nutrients from deeper soil horizons, thereby recycling nutrients
translocated to deep horizons (Masson et al., 1986). On the otherhand, the highly prized
annual edible legume, groundnut (Arachis hypogaea), possess a unique ability of
utilizing soil nutrients that relatively are unavailable to other crops (Ikisan, 2000). The
crop is also billed as very effective in extracting nutrients from soils of low nutrient
supply, possibly as a result of the mycorrhizal association between roots and soil fungi
or because of phosphobacteria found in the rhizosphere (Ikisan, 2000). Mycorrhizal
association between roots and soil fungi, effectively extends roots beyond the nutrient
depletion zone that is found around roots and increases the surface area thereby
enabling plant roots to exploit a greater volume of undepleted soil and increase the
specific surface area for P absorption (Lambers, 2008; Lambers et al., 2011). Plants
whose roots form mycorrhizal with soil fungi absorb more nutrients, particularly P even

119
at low concentration from the soil solution compared with other plants that do not form
such associations (Lynch and Brown 2001). Zhu et al. (2010) reported that mycorrhizal
hyphae have a higher affinity for P than roots. Over and above the aforementioned,
around the hyphae, the P concentration gradient is limited, thus there exists a minimal
depletion zone (Barber, 1984). Principally, this is because the radius of hyphae (0.005
mm) is much smaller than that of roots plus root hairs (0.15 mm) (Rai et al., 2013).
This results into perpetually higher P concentration in soil solution around the hyphae
than in the P depletion zone around roots (Rai et al., 2013). Consequencially, the
hyphae absorbs more P under conditions of low soil P even in the absence of a higher
affinity for the nutrient (Rai et al., 2013). It has been documented that mycorrhiza
releases organic anions such as citrate, malate and oxalate, which can occupy P (H2PO4-
, HPO42-
and PO43-
) sorption sites thereby enhancing availability of P into the soil for
plant uptake (Richardson et al., 2011).
A less emphasized dimension on the role of legumes in recharging soil fertility is their
contribution to the soil nutrient pool by decayed roots especially for leguminous plants
like pigeon pea (Guretzky et al., 2004; Cherr et al., 2006). Crops and trees root residues
contribute substancially to nutrient dynamics and pools and carbon turnover in
agricultural ecosystems (Egbe et al., 2013). Roots of plants also accord pathways for
channeling of carbon and energy from the canopies to the soil (Egbe et al., 2013).
Implicitly therefore, root production and turnover directly impact the biogeochemical
cycles of carbon and nutrients in terrestrial ecosystems (McGroddy et al., 2004; Majdi
et al., 2005; Espeleta and Clark, 2007). Decomposition and mineralization of the
organically bound nutrients from roots might have a positive influence on the growth of

120
succeeding crops in rotational cropping systems such as the pigeon pea-groundnut
intercrop maize rotational cropping system. Nnadi and Haque, (1986), reported that
under intercropping, legume roots can contribute between 5 and 15 kg N ha-1
to soil N
pool. In a study conducted by Phiri et al., (2013b), the root component and the
accompaning nutrient yields for two pigeon pea varieties used in the study were not
assessed, thus under estimating the amount of nutrients returnable to the soil. Not with
standing this however, their study indicate that this cropping system returns significant
amount of nutrients which can benefit the succeeding maize crop. It was necessary
therefore, to reassess biomass and nutrient yields, including that for roots of the pigeon
pea inorder to quantify the total amount of nutrient yields in this system. In gross terms,
the amount of nutrients added to a legume-cereal rotation cropping system depends on
the total legume biomass yields (Giller, 2001). The following were the study
objectives: (i) assess biomass and nutrient yields for the legumes (ii) Quantify N yields
returned to the soil for the monoculture of groundnut and pigeon pea and the intercrop
of the groundnut (iii) Quantify the contribution of root biomass to the soil N pool.

121
5.1 MATERIALS AND METHODS
5.1.1 Study site…………………………………………………………………………...
Details on the location of the study site are as presented in Chapter 2 section 2.1.1.
5.1.2 Field Experiments
Details of the field experiments were as presented in Chapter 2 section 2.1.4.
5.1.3 Plot description and application of triple super phosphate (Ca(H2PO4)2.H2O)
and urea (CO(NH2)2)
Details for the plots and application of triple super phosphate for the main experiment
in season one (2011/2012), were as presented in Chapter 3 under section 3.1.4 and 3.1.5
respectively.
In season two (2012/2013), for the parallel experiment the plot size was 3 m x 4.5 m.
While for the main experiment the size for the main plot size remained 20 m x 10 m.
The subplots had 6 ridges each. The ridges were spaced at 75 cm apart both in the main
and parallel experiment. In the parallel experiment planting of the legumes was as for
the main experiment in season one (Chapter 3, section 3.1.4). For the main experiment
planting of maize was as presented in Chapter 3, section 3.1.4. This was done in
December, 2012.
At planting in season one (2011/2012) in the main experiment, all the treatment plots
except where maize was planted were treated with triple super phosphate (TSP),
Ca(H2PO4)2.H2O, at the rate of 25 kg P ha-1
to offset soil P defficiency. At planting
time, except for the pigeon pea sole crop treatment plot all the ridges were split open to
a depth of 5 cm and 93.3 g of TSP was evenly spread on each ridge. While in the sole

122
pigeon pea treatment 8.4 g of TSP was applied per planting station. This was done to
achieve the rate of 25 kg P ha-1
for the enhancement of nitrogen fixation and the growth
and productivity of the legumes.
For season two (2012/2013), the parallel experiment had TSP applied to plots
according to the treatment structure. At planting time, except for the pigeon pea sole
crop treatment plot all the ridges were split open to a depth of 5 cm and 25.2 g of TSP
was evenly spread on each ridge. While in the sole pigeon pea treatment 8.4 g of TSP
was applied per planting station. This was done to achieve the rate of 25 kg P ha-1
for
the enhancement of nitrogen fixation and the growth and productivity of the legumes.
In the main experiment, in all the sub plots maize was basal dressed with 50 kg P ha-1
.
Top dressing with urea (CO(NH2)2), was done three weeks from emergence according
to the treatment structure at the rate of 0, 50, 100 and 150 kg N ha-1
.
5.2 DATA COLLECTION AND ANALYSIS
5.2.1 Soil sample collection
Details on soil sample collection and preparation were as presented in Chapter 2 under
section 2.1.3.1 and 2.1.3.3.
5.2.2 Biomass and grain yield assessment for the pigeon pea
Grain yield assessment was done at physiological maturity of the two pigeon pea
varieties. Pods were harvested from a 2 m x 2 m net plot in the first season for the main
experiment and second season for the parallel experiment. These were shelled and
weighed (seeds, grains and husks) in the first season (September, 2012) and in the
second season (August, 2013). In both seasons, assessment of the amount of litter for
each treatment plot was done by collecting all defoliated leaves from the ground on one

123
planting station (90 cm x 75 cm). This was done in October, 2012 in season one and
August in the second season. Fresh leaves and twigs for both experiments were also
weighed from the 2 m x 2 m net plot. Roots from pigeon pea plants were dug and
weighed in season two up to a depth of 30 cm by 30 cm diameter. These were oven
dried for 72 hours at 70 oC to constant weights.
5.2.3 Biomass and grain yield assessment for the groundnut and maize
Grain yield assessment was conducted at physiological maturity of the groundnut in
June, 2012 for the main experiment and in May, 2013 for the parallel experiment. Pods
were dug from a 2 m x 2 m net plot. The pods were shelled and the grains and the husks
weighed. These were later oven dried for 72 hours at 70 oC to constant weights.
Estimation of the mean number of pods per plant was done by counting the total
number pods from the net plot and dividing by the number of planting stations in the
net plot to get the mean. Groundnut haulms were also weighed in the field and their dry
weights measured after oven drying for 72 hours at 70oC to constant weights.
Agronomic data was collected for the maize plant which include maize grain and stover
yields in year one and grain, stover, cob length (mean of five cobs) and rachids in year
two. Maize yield data was collected from a 2 m x 3 m net plot within each subplot.
5.2.4 Evaluation of the productivity of the intercropping systems
The Land Equivalent Ratio (LER) (Mazaheri and Oveysi, 2004) was used to evaluate
the productivity of the doubled up legume intercrops against the monocultures. The
formula used was as presented in Chapter 1 under section 1.1.12.

124
5.2.5 Soil analysis and plant sample analysis
Laboratory soil analysis was conducted as presented in Chapter 2 under section 2.1.3.4.
The plant materials were analysed in the laboratory as described in Chapter 3 under
section 3.2.7.
5.2.6 Nutrient yields
Nutrient yields were calculated as described in Chapter 3 under section 3.2.9.
5.2.7 Statistical analysis
Statistical analysis on the soil, biomass, plant nutrient concentrations and yields data
was performed as presented in Chapter 2 under section 2.1.4.2.
5.3 RESULTS
5.3.1 Characterization of soil at the study site
Soil laboratory analytical results for the site were as presented in Chapter 2, Tables 2.0,
2.1a and 2.1b, sections 2.2.1 and 2.2.2, Appendices 2.0-2.1b.
5.3.2 N, P, Ca and Mg content and yield for groundnut and pigeon pea
5.3.2.1 Groundnut
Yields of groundnut haulms, nutrient concentrations for the haulms and yields at
harvest in season two were as presented in Table 5.0 and Appendix 5.0a. No significant
differences were observed (p>0.05) for the yields of haulms across the treatments. This
ranged from 1,396 to 2,463 kg ha-1
. On nutrient concentrations no significant
differences (p>0.05) were observed for the concentration of N, P and Ca across
treatment plots. For N this ranged from 1.9 to 2.3%, for P this ranged from 0.18 to
0.22% while for Ca this ranged from 0.19 to 0.25%. However, significant differences
(p<0.05) were observed for the concentrations of Mg across treatment plots with

125
haulms from the sole groundnut plots treated with TSP having the lowest
concentrations (0.13%) compared with the rest of the treatments which had a
concentration of 0.14%. On nutrient yields no significant differences were observed
across treatments (p>0.05) for the yields of N, P, Ca and Mg. For N this ranged from
29 to 52 kg ha-1
; the yields of P ranged from 3 to 5 kg ha-1
; the yields of Ca ranged
from 2.7 to 4.9 kg ha-1
while the yields of Mg ranged from 2.0-3.2 kg ha-1
.

126
Table 5.0: N, P, Ca and Mg concentrations and yields for groundnut haulms at harvest, parallel experiment, second season
Treatment
Haulms
yield kg ha-1
N(%) P(%) Ca(%) Mg(%)
N yield
kg ha-1
P yield
kg ha-1
Ca yield
kg ha-1
Mg yield
kg ha-1
1. Medium duration pigeon pea + groundnut 1,516 2.0 0.18 0.25 0.14 30 3 3.8 2.1
3.Groundnut + 25 kg P ha-1
2,463 2.1 0.19 0.20 0.13 52 5 4.9 3.2
5. Long duration pigeon pea + groundnut 1,396 2.1 0.18 0.21 0.14 29 3 2.9 2.0
7. Long duration pigeon pea + groundnut + 25 kg P ha-1
1,727 1.9 0.19 0.24 0.14 33 3 4.1 2.4
8. Medium duration pigeon pea + groundnut + 25 kg P ha-1
1,412 2.2 0.20 0.19 0.14 31 3 2.7 2.0
9.Sole groundnut 1,752 2.3 0.22 0.19 0.14 40 4 3.3 2.5
GM 1,711 2.10 0.19 0.21 0.14 35.83 3.50 3.62 2.37
CV (%) 41.7 14.4 16.7 11.2 18.1 38.3 17.0 32.1 19.2
LSD0.05 - - - - 0.01 - - - -

127
Yields of groundnut shells, nutrient concentrations and yields at harvest were as
presented in Table 5.1 and Appendix 5.0b. No significant differences (p>0.05) were
observed in the yields of groundnut shells across treatments. This ranged from 846 to
1,992 kg ha-1
. Significant differences in the concentrations of N, P and Ca were
observed across treatments. N concentrations were lowest for groundnut shells from the
long duration pigeon pea-groundnut intercrop (0.9%) and highest in the groundnut
shells from the sole groundnut treatment (1.5%) and the TSP treated groundnut (1.4%).
For P, concentrations were highest for groundnut shells from the sole groundnut
treatment (0.16%) and the TSP treated groundnut (0.15%). Thes were lowest for the
TSP treated intercrops of groundnut with long and medium duration pigeon pea and the
non TSP treated long duration pigeon pea-groundnut intercrop (0.12%). For Ca,
concentrations were highest for groundnut shells from sole groundnut (0.4%) and the
TSP treated long duration pigeon pea-groundnut intercrop (0.4%). These were lowest
for the non TSP treated long duration pigeon pea- groundnut intercrop (0.2%). This
ranged from 2.1 to 4.1%.
On nutrient yields, except for P which had non signficant different (p>0.05) nutrient
yields for the shells across the treatments (1.0 kg ha-1
to 3.0 kg ha-1
), significant yields
differences (p<0.05) were recorded for the yields of N and Ca. Significantly higher N
yields were obtained for groundnut shells from the TSP treated groundnut (27.8 kg ha-
1) and the sole groundnut treatment (25.2 kg ha
-1). N yields were lowest for the shells
TSP treated medium duration pigeon pea-groundnut intercrop (10.2 kg ha-1
) and the
long duration pigeon pea-groundnut intercrop (10.2 kg ha-1
). Calcium yields were

128
significantly higher for the shells from the TSP treated long duration-groundnut
intercrop (6.9 kg ha-1
) and sole groundnut treatment (6.2 kg ha-1
). Significantly low Ca
yields were generated for groundnut shells from the long duration pigeon pea-
groundnut intercrop (2.7 kg ha-1
) and the TSP treated medium duration pigeon pea-
groundnut intercrop (2.5 kg ha-1
)........................................................................................
........................................................................................
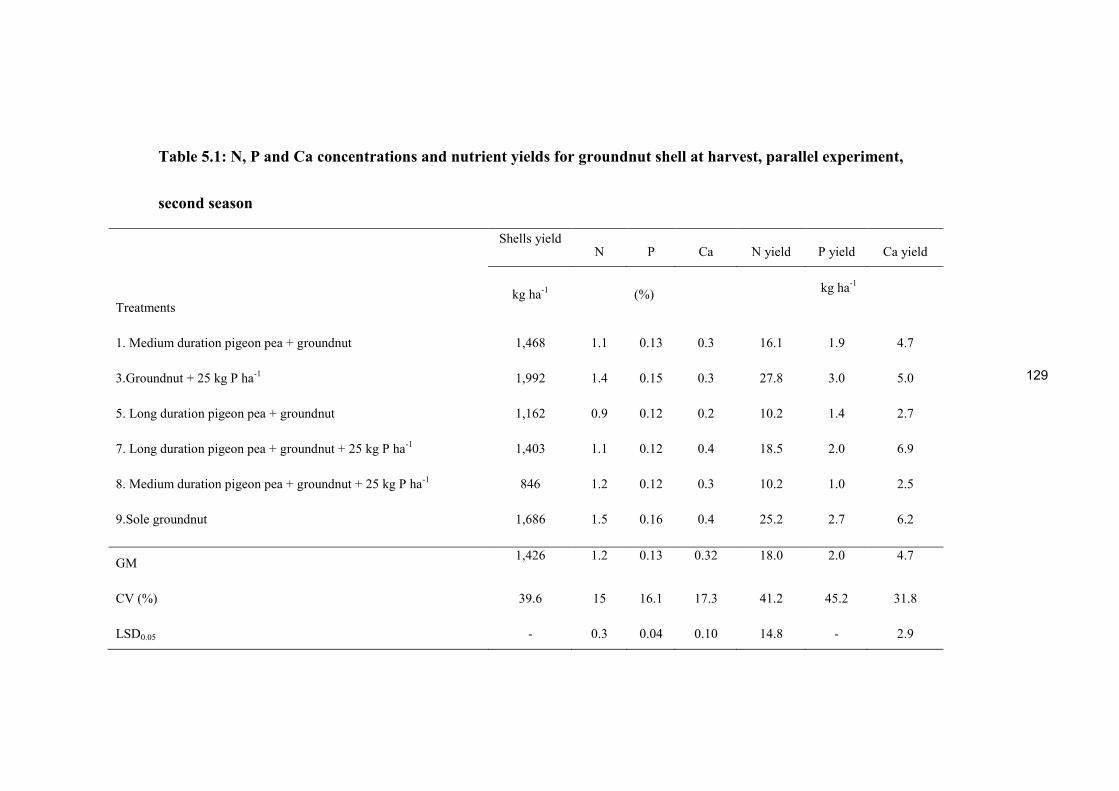
129
Table 5.1: N, P and Ca concentrations and nutrient yields for groundnut shell at harvest, parallel experiment,
second season
Shells yield N P Ca N yield P yield Ca yield
Treatments kg ha
-1
(%) kg ha
-1
1. Medium duration pigeon pea + groundnut 1,468 1.1 0.13 0.3 16.1 1.9 4.7
3.Groundnut + 25 kg P ha-1
1,992 1.4 0.15 0.3 27.8 3.0 5.0
5. Long duration pigeon pea + groundnut 1,162 0.9 0.12 0.2 10.2 1.4 2.7
7. Long duration pigeon pea + groundnut + 25 kg P ha-1
1,403 1.1 0.12 0.4 18.5 2.0 6.9
8. Medium duration pigeon pea + groundnut + 25 kg P ha-1
846 1.2 0.12 0.3 10.2 1.0 2.5
9.Sole groundnut 1,686 1.5 0.16 0.4 25.2 2.7 6.2
GM 1,426 1.2 0.13 0.32 18.0 2.0 4.7
CV (%) 39.6 15 16.1 17.3 41.2 45.2 31.8
LSD0.05 - 0.3 0.04 0.10 14.8 - 2.9
................................................................................................................................................................................................

130
Groundnut grain yields, nutrient concentrations for the groundnut grain and nutrient
yields were as presented in Table 5.2 and Appendix 5.0c. Non significantly different
(p>0.05) groundnut grain yields were registered across the treatments. This ranged
from 1,513 to 3,025 kg ha-1
.
Significant differences (p<0.05) were observed for N and Ca concentrations for the
groundnut grain across treatments. For N this was significantly higher for the
groundnut grain from the TSP treated medium duration pigeon pea-groundnut intercrop
(3.2%) than for the groundnut grain from the TSP treated long duration pigeon pea-
groundnut intercrop (2.9%). Calcium concentration was significantly higher for the
groundnut grain from the sole groundnut treatment (0.18%) than for the groundnut
grain from the medium duration pigeon pea-groundnut intercrop (0.07%). No
significant differences (p>0.05) were observed for the concentrations of P in the
groundnut grains across treatments. This ranged from 0.42% to 0.46%.
On nutrient yields, significant differences (p<0.05) were observed for groundnut grain
yields of N and P across treatments. N yields were significantly higher in the TSP
treated groundnut (98.8 kg ha-1
) compared with the rest of the treatments (46.9 to 58.1
kg ha-1
). Phosphorus yields were significantly higher for the groundnut grain from the
TSP treated groundnut (13.0 kg ha-1
) than in the groundnut grain from the long duration
pigeon pea-groundnut intercrop (6.7 kg ha-1
) and the TSP treated medium duration
pigeon pea-groundnut intercrop. Non significant yields differences (p>0.05) for the
groundnut grain were observed for Ca across treatments. This ranged from 1.3 to 4.5 kg
ha-1
.

131
Table 5.2: N, P and Ca concentrations for the grains of groundnut at harvest in the parallel
experiment
Treatments
Grain yield N P Ca N yield P yield Ca yield
kg ha-1
% kg ha-1
1. Medium duration pigeon pea + groundnut 1,835 3.0 0.42 0.07 55.1 7.7 1.3
3.Groundnut + 25 kg P ha-1
3,025 3.1 0.43 0.15 98.8 13.0 4.5
5. Long duration pigeon pea + groundnut 1,513 3.1 0.44 0.14 46.9 6.7 2.1
7. Long duration pigeon pea + groundnut + 25 kg P ha-1
1,719 2.9 0.43 0.12 49.9 7.4 2.1
8. Medium duration pigeon pea + groundnut + 25 kg P ha-1
1,654 3.2 0.42 0.09 52.9 6.9 1.5
9.Sole groundnut 1,875 3.1 0.46 0.18 58.1 8.6 3.4
GM 1,936 3.1 0.43 0.13 60.3 8.4 2.5
CV (%) 39.9 5.3 7.19 47.6 34.3 38.1 48.2
LSD0.05 - 0.3 - 0.11 38.1 6.1 -
132
5.3.3 Biomass yields, nutrient concentrations and nutrient yields for fresh leaves of
pigeon pea
Biomass yields, nutrient concentrations and nutrient yields for fresh leaves of pigeon
pea were as presented in Table 5.3 and Appendix 5.1a. Nutrient concentrations were
significantly (p<0.05) higher for fresh leaves for pigeon pea both the TSP treated and
non TSP treated medium duration pigeon pea-groundnut intercrop (944 kg ha-1
), and
were significantly lower in fresh leaves for pigeon pea from the TSP treated long
duration pigeon pea monoculture (791 kg ha-1
). N concentrations were significantly
higher in fresh leaves for the crop from the medium duration pigeon pea-groundnut
intercrop (3.7%) than for the long duration pigeon pea-groundnut intercrop (3.1%). No
significant differences (p>0.05) were observed in the concentrations of P in the fresh
leaves of the pigeon pea across treatments. This ranged from 0.2 to 0.4%. For Ca,
significant differences (p<0.05) in concentrations for the fresh leaves were observed
across treatments. The concentrations were significantly higher in the TSP treated
medium duration pigeon pea-groundnut intercrop (0.99%) than in the monoculture for
medium duration (0.68%) and long duration (0.72%) pigeon pea. On yields no
significant differences (p>0.05) were observed in the yields of N and P for the fresh
leaves. For N this ranged from 25.7 to 32.6 kg N ha-1
while for P this ranged from 1.7
to 3.3 kg P ha-1
. For Ca significant yields differences (p<0.05) were observed across
treatments. The yields were significantly higher in the fresh leaves from the TSP
treated medium duration pigeon pea-groundnut intercrop (9.4 kg ha-1
) than in the fresh
leaves from the monoculture for long duration (5.8 kg ha-1
) and medium duration 6.0
kg.ha-1
).pigeon pea..............................................................................................................
.............................................................................................................................

133
Table 5.3: N, P and Ca concentrations in the fresh leaves for pigeon pea and yields at harvest, parallel
experiment, second season
Treatment
Fresh
leaves
N P Ca N yield P yield Ca yield
kg ha-1
%
kg ha-1
1. Medium duration pigeon pea + groundnut 944 3.7 0.20 0.68
34.7 1.9 6.4
2. Long duration pigeon pea + 25 kg P ha
-1 791 3.5 0.40 0.96
28.0 3.1 7.6
4. Medium duration pigeon pea only 909 3.5 0.30 0.66
31.9 2.7 6.0
5. Long duration pigeon pea + groundnut 830 3.1 0.20 0.87
25.7 1.7 7.2
6. Medium duration pigeon pea + 25 kg P ha
-1 899 3.4 0.35 0.94
30.7 3.2 8.5
7. Long duration pigeon pea + groundnut + 25 kg P ha
-1 914 3.5 0.29 0.84
31.8 2.7 7.7
8. Medium duration pigeon pea + groundnut + 25 kg P ha
-1 944 3.5 0.35 0.99
32.6 3.3 9.4
10. Long duration pigeon pea only 809 3.4 0.25 0.72
27.6 2.0 5.8
GM 880 3.5 0.29 0.83
30.38 2.58 7.33
CV (%) 8.0 9.0 44.0 11.4 14.6 44.8 17.3
LSD0.05 122 0.5 - 0.10 - - 2.2

134
Biomass yields, nutrient concentrations and nutrient yields for pigeon pea litter were as
presented in Table 5.4 and Appendix 5.1b. Significant differences (p<0.05) were
observed in the yields of pigeon pea litter across treatments. The yields were
significantly higher for pigeon pea litter from the TSP treated medium duration pigeon
pea monoculture (824 kg ha-1
) than for the long duration pigeon pea-groundnut
intercrop (518 kg ha-1
). N concentrations were significantly in the litter from the TSP
treated long duration pigeon pea-groundnut intercrop (2.6%) than in the litter from long
duration pigeon pea-groundnut intercrop (2.1%) and the litter from the TSP treated
medium duration pigeon pea monoculture (2.1%). Significant differences (p<0.05)
were observed in the concentrations of P in the pigeon pea litter across treatments. The
concentrations were significantly higher in the litter from; the medium duration pigeon
pea-groundnut intercrop, TSP treated long duration pigeon pea monoculture, long
duration pigeon pea-groundnut intercrop and the long duration pigeon pea monoculture.
In all these treatments P concentrations were at 0.08%. Significantly lower P
concentrations were observed in the monoculture for medium duration pigeon pea
treated TSP (0.06%).
For Ca, significant differences (p<0.05) for concentrations in the pigeon pea litter were
observed across treatments. The concentrations were significantly higher for the litter
from the long duration pigeon pea-grounut intercrop (3.4%) and the TSP treated
medium duration pigeon pea-groundnut intercrop (3.3%) than for the litter from the
monoculture for medium duration (0.21%) and long duration (0.21%) pigeon pea, the
TSP treated medium duration (0.22%) and long duration (0.22%) pigeon pea
monoculture and the medium duration pigeon pea-groundnut intercrop (2.5%).

135
On yields no significant differences (p>0.05) were observed for the yields of N and P
for litter. For N this ranged from 11.0 to 17.4 kg ha-1
while for P this ranged from 0.4 to
0.5 kg ha-1
. For Ca significant yields differences (p<0.05) were observed across
treatments. The yields were significantly higher for litter from; the medium duration
pigeon pea-groundnut intercrop (6.4 kg ha-1
), the monoculture of medium duration
pigeon pea (6.0 kg ha-1
), the TSP treated long duration pigeon pea monoculture (5.9 kg
ha-1
), long duration pigeon pea monoculture (5.6 kg ha-1
), the TSP treated long duration
pigeon pea-groundnut intercrop (5.3 kg ha-1
). Significantly lower Ca concentrations
were observed in the litter from the long duration pigeon pea-groundnut intercrop (2.3
kg ha-1
)...............................................................................................................................

136
Table 5.4: N, P and Ca concentrations and nutrient yields for dry leaves for pigeon pea plants at
harvest, parallel experiment, second season
Treatment
Dry
leaves
N P Ca N yield
P yield Ca yield
kg ha-1
%
kg ha-1
1. Medium duration pigeon pea + groundnut 661 2.2 0.08 2.5 14.4 0.5 6.4
2. Long duration pigeon pea + 25 kg P ha-1
597 2.2 0.08 2.2 13.3 0.5 5.9
4. Medium duration pigeon pea only 686 2.3 0.06 2.1 15.8 0.4 4.7
5. Long duration pigeon pea + groundnut 518 2.1 0.08 3.4 11.0 0.4 2.3
6. Medium duration pigeon pea + 25 kg P ha-1
824 2.1 0.06 2.2 17.4 0.5 6.0
7. Long duration pigeon pea + groundnut + 25 kg P ha-1
652 2.6 0.07 2.1 16.9 0.5 5.3
8. Medium duration pigeon pea + groundnut + 25 kg P ha-1
671 2.4 0.07 3.3 16.1 0.5 4.8
10. Long duration pigeon pea only 611 2.3 0.08 2.1 14.2 0.5 5.6
GM 652 2.3 0.07 2.5 14.9 0.5 5.1
CV (%) 19 13 16.12 14.8 25.6 26.4 32.7
LSD0.05 230 0.5 0.02 0.7 - - 3.04

137
Biomass yields, nutrient concentrations and nutrient yields for pigeon pea twigs were as
presented in Table 5.5 and Appendix 5.1c. Significant differences (p<0.05) were
observed in the yield of twigs for pigeon pea across treatments. The yields were
significantly higher for the twigs from the TSP treated medium duration pigeon pea
monoculture (882 kg ha-1
) and significantly lower for the twigs in the long duration
pigeon pea-groundnut intercrop (655 kg ha-1
) and the TSP treated long duration pigeon
pea monoculture (665 kg ha-1
). No significant differences (p>0.05) were observed in N
concentration for the twigs across the treatments. This ranged from 2.1 to 3.3%.
Significant differences (p<0.05) were observed for the concentrations of P for the
pigeon pea twigs across treatments. The concentrations were significantly higher for
the twigs from the TSP treated long duration pigeon pea monoculture (0.3%), the
medium duration pigeon pea monoculture (0.3%) and the TSP treated medium duration
pigeon pea monoculture (0.3%). Significantly lower P concentrations were observed
for the twigs from the long duration pigeon pea-groundnut intercrop (0.1%) and long
duration pigeon pea monoculture (0.1%). For Ca, significant differences (p<0.05) for
concentrations in the twigs were observed across treatments. The concentration were
significantly higher for the twigs from the TSP treated medium duration pigeon pea
(3.2%) and significantly lower for the twigs from the medium duration pigeon pea-
groundnut intercrop (2.1%) and the long duration pigeon pea monoculture treated with
TSP (2.2%).
Significant differences (p<0.05) in Mg concentration for the pigeon pea twigs were
observed across treatments. The concentrations were significantly higher in the medium

138
duration pigeon pea-ground nut intercrop (0.96%) but significantly lower for the twigs
for the TSP treated long duration pigeon pea-groundnut intercrop (0.61%), the TSP
treated medium duration pigeon pea monoculture (0.62%) and the TSP treated medium
duration pigeon pea-groundnut intercrop (0.63%). The concentrations were
significantly lower for the litter from the non TSP treated long duration pigeon pea-
groundnut intercrop (0.44%).
On yields significant differences (p<0.05) were observed for the yields of N, P, Ca and
Mg for the twigs. For N significantly higher yields were observed in the twigs from the
medium duration pigeon pea-groundnut intercrop (26.3 kg ha-1
) and the TSP treated
medium duration pigeon pea monoculture (23.7 kg ha-1
). Significantly low N yields
were observed for the twigs for the long duration pigeon pea monoculture (16.3 kg ha-
1). Phosphorus yields were significantly higher for the twigs from the TSP treated
medium duration pigeon pea monoculture (2.3 kg ha-1
) and were significantly lower in
the twigs from; the medium duration pigeon pea-groundnut intercrop (1.0 kg ha-1
), long
duration pigeon pea-groundnut intercrop (1.0 kg ha-1
), the long duration pigeon pea
monoculture (1.1 kg ha-1
) and the TSP treated long duration pigeon pea-groundnut
intercrop (1.2 kg ha-1
). For Ca the yields were significantly higher for twigs from the
TSP treated medium duration pigeon pea monoculture (28.5 kg ha-1
). Significantly
lower Ca concentrations were observed for the twigs from the long duration pigeon
pea-groundnut intercrop (13.4 kg ha-1
). For Mg the yields were significantly higher for
twigs from the medium duration-groundnut intercrop (7.8 kg ha-1
) but significantly
lower for twigs from the rest of the treatments except Mg yields for twig from the
monoculture.of.long.duration.pigeon.pea.and..medium.duration.pigeon.pea.(6.0.kg.ha-
1).that.had.intermediary.yields.

139
Table 5.5: N, P, Ca and Mg concentrations and nutrient yields for twigs of the pigeon pea plants at harvest,
parallel experiment, second season
Treatment
Twigs N P Ca Mg N yield P yield Ca yield Mg yield
1. Medium duration pigeon pea + groundnut 808 3.3 0.1 2.1 0.96 26.3 1.0 17.2 7.8
2. Long duration pigeon pea + 25 kg P ha-1
665 3.1 0.3 2.2 0.81 20.4 2.0 14.6 5.4
4. Medium duration pigeon pea only 793 2.6 0.3 2.4 0.76 20.5 2.2 19.3 6.0
5. Long duration pigeon pea + groundnut 655 3.3 0.1 2.0 0.78 21.6 1.0 13.4 5.1
6. Medium duration pigeon pea + 25 kg P ha-1
882 2.7 0.3 3.2 0.62 23.7 2.3 28.5 5.4
7. Long duration pigeon pea + groundnut + 25 kg P ha-1
699 3.2 0.2 2.5 0.61 22.7 1.2 17.8 4.2
8. Medium duration pigeon pea + groundnut + 25 kg P ha-1
764 2.7 0.2 2.4 0.63 20.8 1.6 18.1 4.8
10. Long duration pigeon pea only 767 2.1 0.1 2.3 0.78 16.3 1.1 17.6 6.0
GM 754 2.9 0.2 2.4 0.7 21.5 1.6 18.3 5.6
CV (%) 14.0 18 41.2 15.3 16.7 17.7 39.4 12.4 21.7
LSD0.05 198 - 0.2 0.93 0.31 6.8 1.1 4.0 2.1
140
Biomass yields, nutrient concentrations and nutrient yields for pigeon pea stems were
as presented in Table 5.6 and Appendix 5.1d. No significant differences (p>0.05) were
observed for the yields of stems for pigeon pea across treatments. This ranged from 597
to 950 kg ha-1
.
Significant differences (p<0.05) were observed in N concentrations for the stems across
the treatments. Significantly lower stem N concentrations were observed in the long
duration pigeon pea-groundnut intercrop (1.6%) and the medium duration pigeon pea
monoculture (1.8%) compared to the rest of the treatments except for the TSP treated
medium duration pigeon pea monocrop (1.9%) which had an intermediary
concentrations of N in the stems. Significant differences (p<0.05) were observed in the
concentrations of P for the pigeon pea stems across treatments. The concentrations
were significantly higher in the stems from the TSP treated long duration pigeon pea
monoculture (0.16%) compared with the rest of the treatments except for the TSP
treated medium duration pigeon pea monoculture (0.15%) and the non TSP treated
medium duration pigeon pea monoculture (0.13%) that had intermediate concentration
of N in the stems.
For Ca, significant differences (p<0.05) in concentrations for stems were observed
across treatments. The concentrations were significantly higher for stems from the TSP
treated long duration pigeon pea monocrop (2.5%) and significantly lower for stems
from the medium duration pigeon pea-groundnut intercrop (2.1%), the medium
duration pigeon pea monoculture treated with TSP (2.1%) and the TSP treated medium
duration pigeon pea-groundnut intercrop. Significant differences (p<0.05) in Mg
concentration for pigeon pea stems were observed across treatments...............................

141
The concentrations were significantly higher in the TSP treated medium duration
pigeon pea-groundnut intercrop (0.7%), long duration pigeon pea monoculture (0.7%)
and the TSP treated medium duration pigeon pea monocrop (0.6%) but was
significantly lower in stems for the TSP treated long duration pigeon pea-groundnut
intercrop (0.4%) and medium duration pigeon pea monoculture (0.4%). On yields
significant differences (p<0.05) were observed in the yield of N, P, and Mg for the
stems. For N significantly higher yields were observed for stems from the TSP treated
medium duration pigeon pea-groundnut intercrop (20.7 kg N ha-1
) and the TSP treated
long duration pigeon pea monoculture (19.3 kg N ha-1
). Significantly low N yields were
observed for the stems for the long duration pigeon pea-groundnut intercrop (16.3 kg N
ha-1
). Phosphorus yields were significantly higher for stems from the TSP treated
medium duration pigeon pea monoculture (1.4 kg P ha-1
) and were significantly lower
for stems from the long duration pigeon-groundnut intercrop (0.6 kg P ha-1
) and long
duration pigeon pea monoculture (0.7 kg P ha-1
). For Ca no significant yields
differences (p>0.05) were observed across treatments. This ranged 13.2 to 20.4 kg Ca
ha-1
. Significant differences (p<0.05) were observed in the yields of Mg for the stems.
This was significantly higher for stems from the TSP medium duration-groundnut
intercrop (6.8 kg Mg ha-1
) but significantly lower for stems the medium duration
pigeon pea monoculture (2.6 kg Mg ha-1
) and the TSP treated long duration.pigeon.pea-
groundnut.intercrop.(2.8.kg.Mg.ha-1
).............................................................................
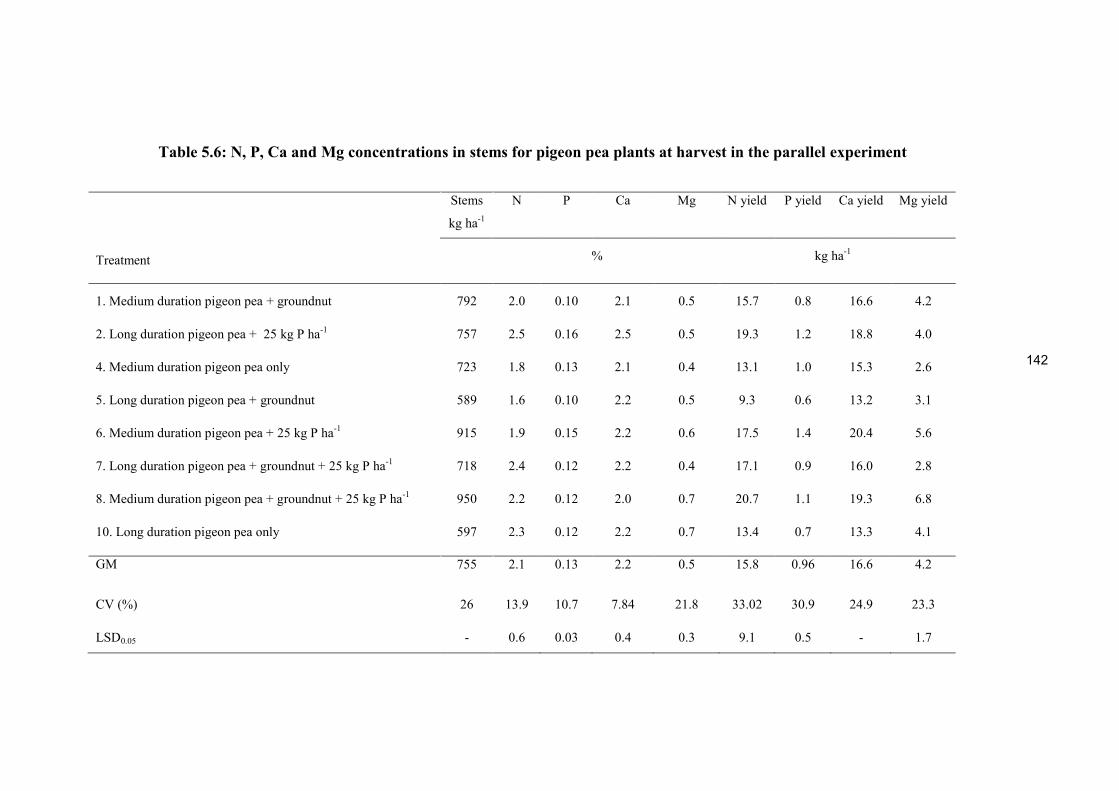
142
Table 5.6: N, P, Ca and Mg concentrations in stems for pigeon pea plants at harvest in the parallel experiment
Treatment
Stems
kg ha-1
N P Ca Mg N yield P yield Ca yield Mg yield
%
kg ha-1
1. Medium duration pigeon pea + groundnut 792 2.0 0.10 2.1 0.5 15.7 0.8 16.6 4.2
2. Long duration pigeon pea + 25 kg P ha-1
757 2.5 0.16 2.5 0.5 19.3 1.2 18.8 4.0
4. Medium duration pigeon pea only 723 1.8 0.13 2.1 0.4 13.1 1.0 15.3 2.6
5. Long duration pigeon pea + groundnut 589 1.6 0.10 2.2 0.5 9.3 0.6 13.2 3.1
6. Medium duration pigeon pea + 25 kg P ha-1
915 1.9 0.15 2.2 0.6 17.5 1.4 20.4 5.6
7. Long duration pigeon pea + groundnut + 25 kg P ha-1
718 2.4 0.12 2.2 0.4 17.1 0.9 16.0 2.8
8. Medium duration pigeon pea + groundnut + 25 kg P ha-1
950 2.2 0.12 2.0 0.7 20.7 1.1 19.3 6.8
10. Long duration pigeon pea only 597 2.3 0.12 2.2 0.7 13.4 0.7 13.3 4.1
GM 755 2.1 0.13 2.2 0.5 15.8 0.96 16.6 4.2
CV (%) 26 13.9 10.7 7.84 21.8 33.02 30.9 24.9 23.3
LSD0.05 - 0.6 0.03 0.4 0.3 9.1 0.5 - 1.7

143
Biomass yields, nutrient concentrations and nutrient yields for pigeon pea roots were as
presented in Table 5.7 and Appendix 5.1e. No significant differences (p>0.05) were
observed in the yields of roots for pigeon pea across treatments. This ranged from 507
to 605 kg ha-1
. Significant differences (p<0.05) were observed in N concentrations for
the roots across treatments. Significantly higher N concentrations were observed for the
long duration pigeon pea monoculture (1.6%). The concentrations were significantly
lower for roots from medium duration pigeon pea monoculture (1.0%) and for the roots
from the TSP treated medium duration pigeon pea monocrop (1.0%). Significant
differences (p<0.05) were observed for the concentration of P for the pigeon pea roots
across treatments. The concentrations were significantly higher for roots from the long
duration pigeon pea-groundnut intercrop (0.09%) but were significantly lower for roots
from the TSP treated medium duration pigeon pea monoculture (0.06%), the TSP
treated medium duration pigeon pea-groundnut intercrop (0.06%) and the non TSP
treated medium duration pigeon pea-groundnut intercrop (0.06%).
For Ca, significant differences (p<0.05) in concentration for the roots were observed
across treatments. The concentrations were significantly higher for roots from the
medium duration pigeon pea monocrop (2.5%) and significantly lower for roots from
the medium duration pigeon pea-groundnut intercrop (0.9%), the long duration pigeon
pea monoculture treated with TSP (1.0%) and the TSP treated medium duration pigeon
pea-groundnut intercrop (1.0%). On yields no significant differences (p>0.05) were
observed for the yields of N and P for the roots. For N this ranged from 5.7 kg ha-1
to
8.2 kg ha-1
. While for P this ranged from 0.3 kg ha-1
to 0.5 kg ha-1
. For Ca significantly
higher yields were observed for roots from the medium duration pigeon pea

144
monoculture (6.6 kg ha-1
). The yield were significantly lower for the long duration
pigeon pea monoculture (4.2 kg ha-1
) and the long duration pigeon pea-groundnut
intercrop (4.2 kg ha-1
).

145
Table 5.7: N, P and Ca concentrations and yields for roots of the pigeon pea plants at harvest, parallel
experiment, second season
Treatment
Roots N P Ca N yield P yield Ca yield
kg ha-1
%
kg ha-1
1. Medium duration pigeon pea + groundnut 571 1.3 0.06 0.9 7.7 0.3 5.1
2. Long duration pigeon pea + 25 kg P ha-1
507 1.2 0.07 1.0 6.2 0.4 5.1
4. Medium duration pigeon pea only 596 1.0 0.08 1.1 5.7 0.5 6.6
5. Long duration pigeon pea + groundnut 531 1.4 0.09 0.8 7.3 0.5 4.2
6. Medium duration pigeon pea + 25 kg P ha-1
605 1.0 0.06 0.8 6.3 0.4 4.8
7. Long duration pigeon pea + groundnut + 25 kg P ha-1
601 1.1 0.07 0.8 6.9 0.4 4.8
8. Medium duration pigeon pea + groundnut + 25 kg P ha-1
512 1.4 0.06 1.0 7.1 0.3 5.1
10. Long duration pigeon pea only 524 1.6 0.08 0.8 8.2 0.4 4.2
GM 555.9 1.3 0.07 0.90 6.9 0.4 5.0
CV (%) 12 15.8 15.6 19.1 22.2 15.5 22.1
LSD0.05 - 0.4 0.02 0.3 - - 1.9

146
5.3.4 Summary of nitrogen and phosphorus yields for groundnut in the parallel
experiment season two…………………………………………………………………..
Figure 5.0 summarizes nutrient total N and P yields for the groundnut in the parallel
experiment. For the haulms N yields ranged from 29 to 52 kg ha-1, while yields of P
ranged from 3 to 5 kg ha-1; For the shells N yields ranged from 10.2 to 25.2 kg ha-1
while P yields ranged from 2.5 to 6.9 kg ha-1. For the grain N yields ranged from 46.9
to 98.8 kg ha-1, the yields of P ranged from 6.7 to 8.6 kg ha-1. Total N yields ranged
from 86.1 to 178.6 kg ha-1 while total P yields ranged from 10.9 to 21.0 kg ha-1.
Figure 5.0: Nutrient yields for the groundnut in the parallel experiment in season two

147
5.3.5 Summary of nitrogen and phosphorus yields for the pigeon pea in the
parallel experiment season two
Figure 5.1 summarizes the total yields of N and P for the pigeon pea in the parallel
experiment for the pigeon pea in season two. N yields for the fresh leaves of the crop
ranged from 27.6 to 34.7 kg ha-1
while the yields of P ranged from 1.7 to 3.3 kg ha-1
. N
yields for dry leaves ranged from 11.0 to 17.4 kg ha-1
while the yields of P ranged from
0.4 to 0.5 kg ha-1
. N yields in twigs ranged from 16.3 to 26.3 kg ha-1
while the yields of
P ranged from 1.0 to 2.3 kg ha-1
. N yields for stems ranged from 9.3 to 20.7 kg ha-1
while the yields of P ranged from 0.7 to 1.4 kg ha-1
. N yields for roots ranged from 5.7
to 8.2 kg ha-1
while the yields of P ranged from 0.3 to 0.5 kg ha-1
. The sum total for N
yields for the crop ranged from 74.9 to 98.8 kg ha-1
while the yield of P ranged from
3.7 to 6.8 kg ha-1
.
Figure 5.1: Nitrogen and phosphorus yields for the pigeon pea in the parallel experiment season
two

148
5.3.6 Estimated soil returnable N and P yields for the monoculture of groundnut
and pigeon pea and the intercrop of the groundnut…………………………………
Figure 5.2 summarizes the computed soil returnable N and P yields for the monoculture
of groundnut and pigeon pea and the intercrop of the groundnut with two varieties of
pigeon pea. The monoculture for groundnut treated with TSP yielded more N (52.0 kg
N ha-1
) compared to the non treated groundnut monoculture (40.0 kg N ha-1
). The soil
returnable yields of P for the two treatments differed marginally. The TSP treated
monoculture for the long duration pigeon pea yielded higher soil returnable N (87.2 kg
N ha-1
) compared to the non TSP treated counterpart (79.7 kg N ha-1
). A marginal
difference in the yields of soil returnable P was observed for the two treatments. For the
medium duration pigeon pea monoculture higher soil returnable N was harvested in the
TSP treated monoculture (95.6 kg N ha-1
) compared to the non TSP treated
monoculture (87.0 kg N ha-1
). A marginal difference for the yields of soil returnable P
was observed for the two treatments. Similar soil returnable yields of N were observed
in the TSP (128.3 kg N ha-1
) and non TSP treated (128.8 kg N ha-1
) intercrop of
medium duration pigeon pea and groundnut. A marginal difference for the yields of soil
returnable P was observed for the two treatments. Higher soil returnable yields of N
was observed for the TSP (128.4 kg N ha-1
) than for the non TSP treated (103.9 kg N
ha-1
) intercrop of long duration pigeon pea and groundnut. A marginal difference for
the yields of soil returnable P was also observed for the two treatments. The amount of
soil returnable P ranged from 4.0 to 9.5 kg P ha-1

149
Figure 5.2: Calculated soil returnable N and P yields for the monoculture of groundnut and pigeon
pea and the intercrop of the groundnut
5.3.7 Evaluation of the productivity of the cropping systems
Table 5.8 shows the evaluation of the productivity of the intercrops using the LER on
biomass production basis. In general all intercrops registered a yield advantage above
the monocultures of both the pigeon pea and groundnut. The higher yield advantage
over the monocultures was registered by the medium duration pigeon pea-groundnut
intercrop.
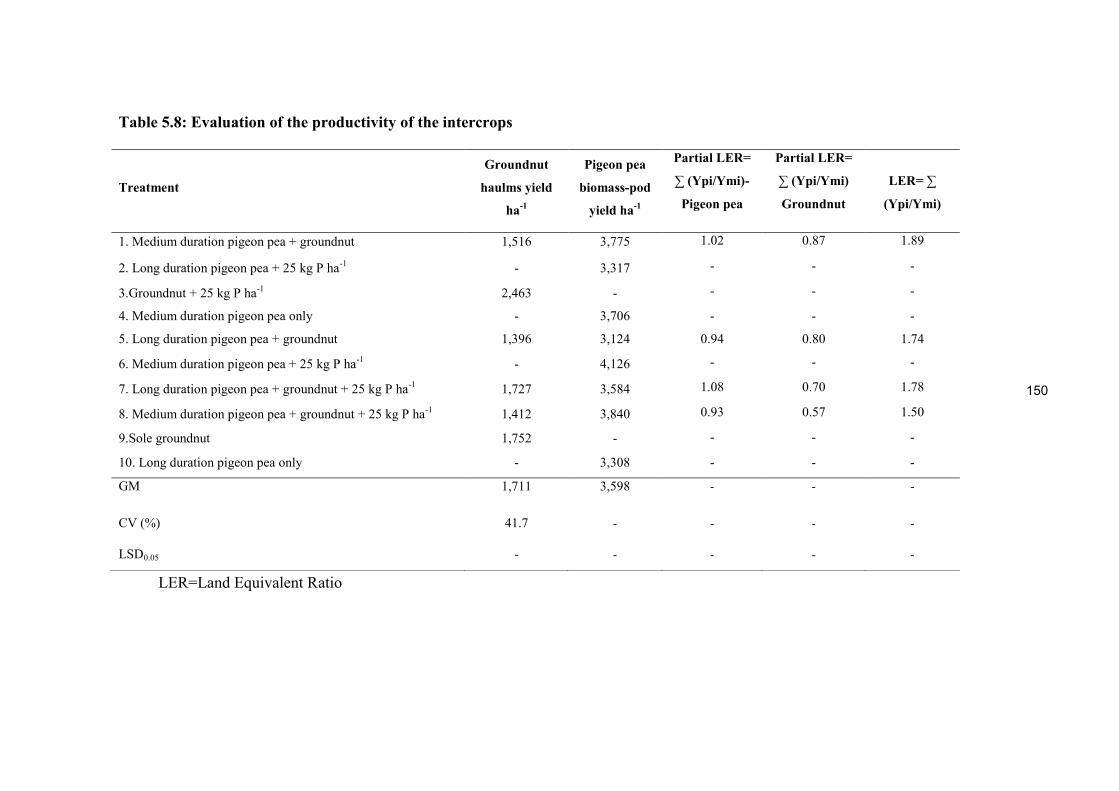
150
LER=Land Equivalent Ratio
Table 5.8: Evaluation of the productivity of the intercrops
Treatment
Groundnut
haulms yield
ha-1
Pigeon pea
biomass-pod
yield ha-1
Partial LER=
∑ (Ypi/Ymi)-
Pigeon pea
Partial LER=
∑ (Ypi/Ymi)
Groundnut
LER= ∑
(Ypi/Ymi)
1. Medium duration pigeon pea + groundnut 1,516 3,775 1.02 0.87 1.89
2. Long duration pigeon pea + 25 kg P ha-1
- 3,317 - - -
3.Groundnut + 25 kg P ha-1
2,463 - - - -
4. Medium duration pigeon pea only - 3,706 - - -
5. Long duration pigeon pea + groundnut 1,396 3,124 0.94 0.80 1.74
6. Medium duration pigeon pea + 25 kg P ha-1
- 4,126 - - -
7. Long duration pigeon pea + groundnut + 25 kg P ha-1
1,727 3,584 1.08 0.70 1.78
8. Medium duration pigeon pea + groundnut + 25 kg P ha-1
1,412 3,840 0.93 0.57 1.50
9.Sole groundnut 1,752 - - - -
10. Long duration pigeon pea only - 3,308 - - -
GM 1,711 3,598 - - -
CV (%) 41.7 - - - -
LSD0.05 - - - - -

151
5.4 DISCUSSION
5.4.1 Yields, nitrogen and phosphorus partitioning for the legumes
In general, for all the crops high variability in the yields data was observed, attributable
to competition for growth resources across the cropping systems that impacted on the
yields. Higher groundnut grains and haulms yields were registered in the 2012/2013
cropping season (Tables 5.0, 5.2 and 5.8) than in 2011/2012 cropping season (Phiri et
al., 2013). The higher yields in the 2012/2013 cropping season might be attributed to
sustained moisture availability over the cropping season and adequate nutrient uptake
that promoted vegetative growth, leading to more yields. On the other hand dry spells
in the 2011/2012 cropping season reduced the amount of available moisture leading to
a significant reduction in biomass and grain yields (Banerjee et al., 2005; Phiri et al.,
2013). Potential grain yield (3 t ha-1
) was generated in pure stands of groundnut that
were treated with TSP (Table 5.2). This implies that in these plots ideal conditions for
the growth of the variety were available. The conditions include soil moisture,
nutrients, temperature soil pH among others. Groundnut grain yields for intercrops
treated with TSP did not reach the yield potential (Table 5.2). It is likely that
competition for growth resources i.e. nutrients and moisture, with the pigeon pea
prevented the groundnut from fully expressing the potential yield. Though lower yields
were generated in the latter treatment plots, the yields were statistically the same
(p>0.05) to the yields that were obtained in the TSP treated monoculture.
Haulms’ N values (Figure 5.0) generated from this study were not consistent with
reported values of 60 kg N ha-1
(Ghosh et al., 2007) and 54-58 kg N ha-1
(Hedge and
Dwevidi, 1993). This could be attributed to environmental factors controlling nitrogen

152
concentration in the residues and plant size at maturity that determines the overall
haulms’ and hence N yields. It is important to note that N yields indicate that more of
the plant absorbed and biologically fixed N in the crop is exported from the field in
form of shells and grain and less is return to the soil upon the incorporation of the
haulms. This spells out the need to manage crop residues to avoid depletion of N from
the soil.
For the pigeon pea, the N and P yields (Figure 5.1) were lower for the dry leaves
compared with the fresh leaves because some N and P was remobilized to other plant
parts during the senescence of defoliating leaves (Fischer, 2007). The N and P content
was lower for the stems than the twigs and leaves (Figure 5.1) as the stems contain
more lignin and fibre (Norton, 1992). N yields for roots falls within the yields range
of 5 and 15 kg N ha-1
reported for intercropping systems involving legumes (Nnadi
and Haque, 1986). Overall, the results have shown that much of the N contribution to
the soil N pool comes from the above ground biomass as compared with the below
ground biomass. Though modest the contribution of roots to soil N cannot be
overlooked since the nutrient even after immobilization, a temporally state, largely is
available for uptake by succeeding crops in a rotation system as it does not get
complexed in the soil as is the case with phosphorus.
5.4.2 Estimated soil returnable N yields for the monoculture of groundnut and
pigeon pea and the intercrop of the groundnut
The results indicate that the monoculture for groundnut treated with TSP yielded more
N (52.0 kg N ha-1
) compared with the control (40.0 kg N ha-1
). This is attributable to
enhanced N fixation and accumulation in plant tissues of groundnut plants for the

153
former treatment plots compared to the latter treatment plots due to increased supply of
P. The results agrees with reports that indicate increase in N fixation when P is applied
to legumes growing on soils with low P supply (Yakubu et al., 2010). Phosphorus
enhances the energy demanding process of biological nitrogen fixation (BNF) in
legumes (Somado and Kuehne, 2006), as it is an integral part of the energy containing
molecules of ATP and ADP that provide energy for plant biochemical processes (Rai
et al., 2013). In legumes nodule number, as well as nitrogenase activity increases with
the additions of P, implying more efficient N fixation (Israel, 1987). The soil returnable
yields of P for the two treatments differed marginally. The TSP treated monoculture for
the long duration pigeon pea yielded higher soil returnable N (87.2 kg N ha-1
)
compared with the non TSP treated counterpart (79.7 kg N ha-1
).
The marginal difference for P uptake between the monoculture for groundnut treated
with TSP and the control is explainable interms of the efficiency of groundnut in P
uptake under conditions of low P supply (Ikisan, 2000). This largely is accrued to the
mycorrhizal association between roots of groundnut and soil fungi or due to
phosphobacteria found in the rhizosphere (Ikisan, 2000). Phosphobacterium turns
phosphate present in the soil from unavailable to available form (Basu et al., 2006).
Due to low P supply by the soil, it is likely that groundnut plants in the control plots,
scavenged for P from the soil through the above mechanisms, thereby concentrating P
in the biomass.
For the medium duration pigeon pea monoculture higher soil returnable N was
harvested from the TSP treated monoculture (95.6 kg N ha-1
) compared with the non
TSP treated monoculture (87.0 kg N ha-1
). The difference was attributable to enhanced

154
BNF for the former plots compared with the latter plots due to increased supply of P
(Somado and Kuehne, 2006). A marginal difference for the yields of soil returnable P
was observed for the two treatments. Pigeon pea is a known scavenger of P under soil
conditions of low supply of P (Gwata, 2012). The deep tap root extracts moisture and
nutrients from deep layers of the soil (Gwata, 2012). Additionally, the roots of pigeon
pea produce an exudate (piscidic acid-C11H12O7) which releases P from the Fe-P
complexes, thereby increasing available P (Ae et al., 1990; Gwata, 2012). It is likely
that the plants in the latter plots concentrate P in their tissues through this mechanism.
Similar soil returnable yields of N were observed for the TSP (128.3 kg N ha-1
) and non
TSP treated (128.8 kg N ha-1
) intercrop of medium duration pigeon pea and groundnut.
This suggests that N accumulation in plant tissues due to uptake and BNF did not differ
markedly. The observation could be explained by the uptake and yields of P. A
marginal difference for the yields of soil returnable P was observed between the two
treatments. The mode of TSP application for the former plots and potential resultant
competition for uptake of the applied P by the pigeon pea and groundnut might have
reduced the potential effects of applying P to the legumes. TSP was evenly spread out
in grooves made on the ridges, leading to low concentration on an area basis and hence
uptake by the two legumes of the applied P. Consequencially, N accumulation in plant
tissues due to uptake and BNF in particular might not have been enhanced for the TSP
treated plants leading to the observed similar yields of N by the legumes from the TSP
treated and control plots.
Higher soil returnable yields of N were observed for the TSP (128.4 kg N ha-1
) than the
non TSP treated (103.9 kg N ha-1
) intercrop of long duration pigeon pea and

155
groundnut. The difference is accountable since total biomass yields, which is the basis
for the N yields were lower for the intercrop of long duration pigeon pea and groundnut
compared with the intercrop of long duration pigeon pea and groundnut treated with
TSP (Table 5.8).
The evaluation of the productivity of the intercrops using the LER was based on
biomass production basis. In general, all intercrops registered a yield advantage above
the monocultures of both the pigeon pea and groundnut. This was in agreement with the
findings of other researchers like Schilling and Gibbons (2002) Lingaraju, et al. (2008)
and Phiri et al. (2013a). A higher yield advantage over the monocultures was registered
by the medium duration pigeon pea-groundnut intercrop.
5.5.CONCLUSION
The study has served to confirm that more N for groundnut is exported from the field in
form of shells and grain and less is return to the soil upon the incorporation of the
haulms. Furthermore, in the pigeon pea much of the N contribution to the soil N pool
comes from the above ground biomass as compared with the below ground biomass.
This though still is vital in increasing the level of soil N for increased crop productivity
in a rotation system. Additionally, supply of P to legumes increases N yields through
enhanced biological fixation. The legumes however do not yield enough P for the
correction of soil P deffiencies that are prevalent across Malawi.

156
5.6 REFERENCES
Ae, N., Arihara, J., Okada, K. and Johansen, C. (1990). Phosphorus uptake by pigeon
pea and its role in cropping systems of India subcontinent. Science
248: 477 – 480.
Andrews, D.J. and Kassam, A.H. (1976). The importance of multiple cropping is
increasing world.food supplies. American Society of Agronomy 27: 1-10.
Banerjee, K., Sounda, G. and Mandal, A. (2005). Effects of different level of irrigation
and cobalt on growth and nodulation of summer groundnut (Arachis hypogaea
L.). Journal of Inter academicia 9(2): 235-241.
Barber, S.A. (1984). Soil nutrient bioavailability. A Mechanistic Approach. John Wiley
and Sons, New York, USA. 398pp.
Basu, M., Bhadoria, P.B.S. and Mahapatra, S.C. (2006). Influence of microbial culture
in combination with micronutrient in improving the groundnut productivity
under alluvial soil of India. Acta agriculturae Slovenica, 87-2, September 2006.
pp. 435– 444.
Cherr, C.M., Scholberg, J.M.S. and McSorley, R. (2006). Green manure approaches to
crop production: A synthesis. Agronomy Journal 98: 302-319.

157
Drinkwater, L.E. and Snapp, S.S. (2007). Nutrients in agroecosystems: rethinking the
management paradigm. Advances in Agronomy 92: 164–188.
Egbe,.E.A.,.Nwoboshi,.L.C..and.Ladipo,.D..(2013)..Decomposition.and.macronutrients
release of roots of Millettia thonningii placed at three soil depths in the tropics.
Octa Journal of Environmental Research 1(3): 177-186.
Espeleta, J.F. and Clark, D.A. (2007). Multi-scale variation in fine root biomass in a
tropical rain forest: a seven-year study. Ecological Monographs 77: 377-404.
Fischer, A.M. (2007). Nutrient remobilization during leaf senescence. In: Annual Plant
Reviews: Senescence Processes in Plants (Ed. Gan S.), Blackwell Publishing
Ltd, Oxford, UK. 26: 5-10.
Ghosh, P.K., Bandyopadhyay, K.K., Wanjari, R.H., Manna, M.C., Misra, A.K.,
Mahonty, M. and Subba R.A..(2007). Legume effect for enhancing productivity
and nutrient use efficiency in major cropping systems-An Indian perspective: A
review. Journal of Sustainable Agriculture 30(1): 59-86.
Giller,.K.E..(2001)..Nitrogen.fixation.in.tropical.cropping.systems.CAB.international
Wallingford (Oxford) 8DE UK. pp. 93-106.

158
Gomez,.K.A..and.Gomez,.A..(1984)..Statistical.Procedures.for.Agricultural.Research,
2nd
Edition. An International Rice Research Institute Book, John Wiley and
Sons, New York. 40pp.
Guretzky, J.A., Moore, K.J., Burras, C.L. and Brummer, E.C. (2004). Distribution of
legumes along gradients of slope and soil electrical conductivity in pastures.
Agronomy Journal 96: 547-555.
Gwata, E. (2012). The potential of pigeon pea (Cajanus cajan) for producing
important.components.of.renewable.energy and.agricultural.products..EGU.
General.Assembly 2012, 22-27 April, 2012, Vienna, Austria. pp.1857.
Hedge, D.M. and Dwivedi, B.S. (1993). Integrated nutrient supply and management
as a strategy to meet nutrient demand. Fertilizer Research 38(12): 49-59.
Ikisan,..(2000)..[http://www.ikisan.com/links/ap_groundnut..Nutrient..Management].
site visited on 5/27/2014 .
Israel, D.W. (1987). Investigation of the role of phosphorous in symbiotic dinitrogen
fixation. Plant Physiology 84: 835-840.
Lambers, H., Raven, J.A., Shaver, G.R. and Smith, S.E. (2008). Plant nutrient
acquisition strategies change with soil age. Trends in Ecological Evolution 23:
95–103.

159
Lambers, H., Finnegan, P.M., Laliberte, E., Pearse, S.J., Ryan, M.H., Shane, M.W.
and Veneklaas, E.J. (2011). Phosphorus nutrition of Proteaceae in severely
phosphorus-impoverished soils: Are there lessons to be learned for future crops?
Plant Physiology 156: 1058–1066.
Lingaraju, B.S., Marer, S.B. and Chandrashekar, S.S. (2008). Studies on intercropping
of maize and pigeon pea under rainfed conditions in northern transitional zone
of Karnataka. Karnataka Journal of Agricultural Sciences 21(1): 1-3.
Lynch, J.P. and Brown, K.M. (2001). Topsoil foraging-an architectural adaptation of
plants to low phosphorus availability. Plant Soil 237: 225–237.
Majdi, H., Pregitzer, K., Moren, A.S., Nylund, J.E. and Agren, G.I. (2005).
Measuring fine turnover in forest ecosystems. Plant and Soil 276: 1-6.
Masson, S.C., Leihner, D.E. and Vorst, J.J. (1986). Cassava-cowpea and cassava-
peanut intercropping: nutrients concentration and removal. Agronomy Journal
78: 441-444.
Mazaheri, D. and Oveysi, M. (2004). Effects of intercropping of two corn varieties at
various nitrogen levels. Iranian Journal of Agronomy 7: 71-76.

160
McGroddy, M.E., Whendee, L., Silver, W.L. and de Oliveira R.C. (2004). The effect of
phosphorus availability on decomposition dynamics in a seasonal low land
Amazonian. Forest Ecosystem 7: 172-179.
Nnadi, L.A. and Haque, I. (1986). Forage legume-cereal systems: Improvement of soil
fertility and agricultural production with special reference to sub-Saharan
Africa. In: Potentials of forage legumes in farming systems of sub-Saharan
Africa. Proceedings of a workshop held at ILCA, Addis Ababa, Ethiopia,16-19
September 1985. Haque, I. Jutzi, S. and Neate, H.J.P. (Eds.). ILCA, Addis
Ababa pp. 330-362.
Norton, B.W., Kamau, F.K. and Rosevear, R. (1992). The nutritive value of some tree
legumes as supplements and sole feed for goats. In: Reodecha, C., Sangid, S.
and Bunyavetchewin, P. (Eds), Recent advances in animal
production, Proceedings of the Sixth AAAP Animal Science Congress, 23-28
November 1992, Sukothai Thammathirat Open University, Nonthaburi,
Thailand. 151pp.
Phiri, A.T., Njoloma, J.P., Kanyama-Phiri, G.Y., Sieglinde, S. and Lowole, M.W.
(2013a). Effects of intercropping systems and the application of Tundulu rock
phosphate on groundnut grain yield in central Malawi. International Journal of
Plant and Animal Sciences. 1(1): 011-020.
161
Phiri, A.T., Msaky, J.J., Mrema, J., Kanyama-Phiri, G.Y. and Harawa R. (2013b).
Assessment of nutrient and biomass yield of medium and long duration pigeon
pea in a pigeon pea-groundnut intercropping system in Malawi..Journal.of
Sustainable Society 2: 36-48.
Rai, A., Rai., S. and Rakshit, A. (2013). Mycorrhiza-mediated phosphorus use
efficiency in plants. Environmental and Experimental Biology 11: 107–117.
Richardson, A.E., Lynch, J.P., Ryan, P.R., Delhaize, E. and Smith, F.A. (2011). Plant
and microbial strategies to improve the phosphorus efficiency of agriculture.
Plant Soil 349: 121–156.
Schillings, R. and Gibbons, R. (2002). Groundnut. London and Oxford. Macmillan
Education Ltd. 146pp.
Sharma, A. (2009). Performance of pigeon pea based cropping systems under set-
furrow cultivation in vertisols. PhD thesis University of Agricultural Sciences,
Dharwad India. 31pp.
Somado, E.A. and Kuehne, R.F. (2006). Appraisal of the 15
N-isotope dilution and 15
N
Natural abundance methods for quantifying nitrogen fixation by flood tolerant
green manure legumes. African Journal of Biotechnology 5(12): 1210-1214.
162
Yakubu, H., Kwari, J.D. and Sandabe, M.K. (2010). Effect of phosphorus fertilizer on
nitrogen fixation by some grain legume varieties in Sudano Sahelian Zone of
North Eastern Nigeria. Nigerian Journal of Basic and Applied Science
18(1): 19-26.
Zhu, J., Zhang, C. and Lynch, J.P. (2010). The utility of phenotypic plasticity for
roothair length for phosphorus acquisition. Functional Plant Biology 37: 313–
322.

163
CHAPTER 6:
NITROGEN UPTAKE AND YIELDS FOR THE PIGEON PEA-GROUNDNUT
INTERCROP MAIZE ROTATION CROPPING SYSTEM
ABSTRACT
An experiment involving eight treatments replicated three times in a randomized
complete block design was established at Chitedze Agricultural Research Station ( 13o
59’ 23.2” S, 033o 38’ 36.8” E) in the 2012/2012 cropping season in order to assess
nutrient uptake and yields for the crops in a legume-cereal rotation cropping system.
Two pigeon pea varieties, long (ICEAP 04000) and medium duration (ICEAP 00557)
and groundnut (CG 7) were grown as monocultures and intercrops. The intercrops
involved planting either of the pigeon pea varieties with groundnut. At harvest time
legume biomass was buried into the soil and each plot split into four subplots to
accomodate four different levels of N (0, 50, 100, 150 kg N ha-1
) were applied at top
dressing to the succeeding maize crop in the 2012/2013 cropping season. During
planting, in the 2012/2013 cropping season the maize crop was basal dressed with 50
kg P ha-1
. Top dressing with N was conducted three weeks after emergence. For
groundnut, results from statistical analysis indicated non significant differences (
p>0.05) in the yields of grain. The grain yields ranged from 1,513 to 3,025 kg ha-1
. N
concentration in the grain ranged from 2.9% to 3.2% translating into N yields that
ranged from 46.9 kg N ha-1
to 98.8 kg N ha-1
. The N yields for grain were higher than N
yields for the shells and haulms. The concentration of N in the maize grain ranged from
1.1% to 2.1%, while maize grain yields ranged from 1,775 to 5, 806 kg ha-1
and the N
yields ranged from 23 to 115 kg N ha-1
. This was higher than N yields for stover and
rachids. The data indicated that more N in the groundnut and maize plant is

164
translocated to the grain as such there is net export of N from the field.
Key words: groundnut, intercrop, maize, nutrient, pigeon pea and rotation

165
6.0 INTRODUCTION
Intercropping and rotation farming are common practices by smallholder farmers in
Africa (Sakala et al., 2000). Pigeon pea (Cajanus cajan (L.) Millspaugh), performs
optimally under both systems with adequate moisture, warm temperature and
appropriate day length (Cook et al., 2005). On the continent in general and Malawi in
particular, traditional production of pigeon pea involves medium and late maturing
varieties either intercropped with cereals (Sakala et al., 2000) or other short duration
legumes and vegetables (Atachi and Machi, 2004). Pigeon pea has the capacity to
biologically fix up to 235 kg nitrogen (N) ha-1
per season (Peoples et al., 1995).
Nitrogen is one of the most abundant elements on earth (Vance, 2001), yet the most
limiting nutrient for crop production (Graham and Vance, 2003) due to inherent
defficiencies in most soils. Comparatively, pigeon pea yields more N per unit area from
plant biomass than other legumes (Odeny, 2007). This makes pigeon pea a desirable
crop for sustainable agricultural production in the maize based farming systems of
Malawi. Furthermore, pigeon pea’s high nutritive value appears to be the prime reason
for its integration in smallholder farms of Africa (Odeny, 2007). The high protein
contained in its grain ≥ 21%, (Aihou et al., 2006) makes pigeon pea suitable
supplement to common carbohydrate rich-diets of most Africans (Odeny, 2007).
Reddy, et al. (2011), observed that when pigeon pea is grown in a monoculture,
relatively the crop is inefficient due to the initial growth rate which is slow and a low
harvest index. Intercropping pigeon pea with other crops helps the legume to efficiently
utilize available growth resources like nutrients and moisture (Reddy et al., 2011).
Important factors limiting the productivity of pigeon pea include; unbalanced
fertilization and terminal stress (Reddy et al., 2011).

166
Groundnut (Arachis hypogea L.) is among the most important legumes grown in
Malawi (Chiyembekeza et al., 1998). Groundnut is a source of food and cash income
for Malawian smallholder farmers (Dzilankhulani et al., 1998). Its grains contain 43–
55% edible oil and 25–28% protein ( (Reddy et al., 2003). Just like pigeon pea,
groundnut has high P requirement (Singh and Oswalt, 1995). Phosphorus plays an
important role in root development, photosynthesis, N fixation, crop maturation, and
other vital processes (Uchida, 2000). Nutritionally in crops, P deputises nitrogen (Davis
and Westfall, 2009). Due ti its widespread deffiency, it is generally regarded to be
among the plant nutrients that are most limiting in tropical soils, Malawian’s soil
inclusive (Phiri et al., 2010). Phosphorus defficiency not only limits crop response to
other nutrients like N, but also affects gross soil fertility and productivity (Sahrawat et
al., 2001).
Nitrogen (N), phosphorus (P), potassium (K), calcium (Ca) and magnesium (Mg) are
required for crop growth and development (Ashraf et al., 2008). Stress factors like soil
acidity and drought affect the uptake of the aforementioned nutrient elements, and
consequently the yields of crops (Karnataka, 2007). Drought affects nutrient uptake and
concentrations in plant tissues due to reduction of nutrient transportation to plant roots
and impaired root development (Fageria et al., 2002; Junjittakarn et al., 2013).
Reduced nutrient uptake by plants under moisture stress is principally due to low
transpiration, impaired active transport and membrane permeability culminating into
crippled nutrient absorbing by roots (Junjittakarn et al., 2013). Work by Bassirirad and
Caldwell (1992) mentioned that nutrient uptake by plant decreases with increasing
water stress. Furthermore Kolay (2008) reported that water stress at flowering, pegging,

167
pod formation and pod development stages reduced groundnut pod yields together with
the uptake of N, P, K, Ca, Mg and S. It is on record that under moisture stress
conditions, available soil N (NO3- and NH4
+) and N2 fixation is markedly reduced
resulting into low N accumulation, low dry matter production and low crop yields
(Pimratch et al., 2008; Pimratch et al., 2013). Notwithstanding the above however,
Ikisan (2000) indicated that the groundnut plant possess a unique ability to utilize
nutrients that are relatively unavailable to other crops and is very effective in extracting
nutrients from soils of low nutrient supply. This has been attributed to the mycorrhizal
association between roots of groundnut and soil fungi or due to phosphobacteria found
in the rhizosphere (Ikisan, 2000). This trait, coupled with the N fixation capability
positions the crop to be the right candidate for the rejuvination of soil fertility and
production.
Maize (Zea mays L.) is cultivated over a variety of climatic conditions, with unique
seasonal rainfall distribution patterns as well as amounts (Asare, 2011). Maize thrives
best on fertile soils having enough moisture during the cropping season (Asare, 2011).
The crop tolerates dry spells, particularly during the first three to four weeks of growth
(Asare, 2011). Maize is a main source of energy and protein in people’s diets on the
continent (Enyisi et al., 2014). Overall, in Malawi maize is the most important food
staple (Minot, 2010). Per capita consumption is pegged to be at 133 kg, and it accounts
for over half (54%) of the caloric intake of Malawian households (Minot, 2010).
According to a study conducted by Enyisi et al. (2014), nutritionally, the approximate
composition of maize and maize products is; 44.8 – 69.6% carbohydrate, 4.5 – 9.87%
protein, 2.17 – 4.43% fat, 2.10 – 26.77% fibre and 1.10 – 2.95% ash.

168
In maize production, stresses like nutrient and moisture affect biomass and grain yields
(Asare, 2011). One of the major nutrients highly demanded by maize for growth is
nitrogen (Zotarelli et al., 2008). The high demand of nitrogen by maize principally is
due to the accumulation of above ground dry matter which forms a large N sink
(Zotarelli et al., 2008). Henry and Raper, (1991) indicated that N uptake by maize
depends on the availability of soluble carbohydrates in the roots coupled to
environmental factors like temperature, water and nitrate availability (Scholberg et al.,
2002). Ayad et al. (2010) mentioned that the rate of N uptake can be influenced by the
crop rooting depth, root length, density and the duration of assimilation. On the
otherhand maize requirement for P is high (PDA, 2008). The crop is sensitive to low P
availability, mostly in the early growth stages since much of the P is absorbed during
that time for robust root development (PDA, 2008) among other metabolic functions.
The role of P in robust root development likely enhances uptake not only of P but
uptake of other essential plant nutrient elements as well as moisture (Wasonga et al.,
2008). P uptake in maize and utilisation,varies across varieties and soil types
(Machado et al., 1999).
Evidence indicates that rotation of maize with annual grain legumes, such as soybean
(Glycine max) or groundnut, increased maize yields by 10–78%, although on-farm
gains largely, do not conform to this trend (Waddington and Karigwindi, 2001; Snapp
et al., 2002), largely due to management, climatic and environmental factors. The
pigeon pea-groundnut intercrop maize rotation cropping system, is being touted to have
high potential of registering positive on-station as well as on-farm gains (Kanyama-
Phiri et al., 2008), based on research work conducted both in central and northern
Malawi under the legume best bets project. The pigeon pea groundnut intercropping
169
system generates ample biomass which when incorporated into the soil contributes
substancial amount of N upon decomposition and mineralization (Phiri et al., 2013).
This might impact positively on maize yields. An indepth study of this cropping system
therefore, was conducted at Chitedze Agricultural Research Station in Malawi from
2011-2013. The following were the study objectives: (i) assess nutrient uptake by the
crops during the legume and cereal cropping phase (ii) quantifying the partitioning of
nutrients to harvestable grain and plant biomass returned to soil during the legume and
cereal cropping phase.
6.1 MATERIALS AND METHODS
6.1.1 Study site
Details on the location of the study site are as presented in Chapter 2 section 2.1.1.
6.1.2 Field experiment
Details of the field experiments were as presented in Chapter 2 section 2.1.4. In season
two in the main experiment, the experimental design was transformed into a split plot
design by dividing each main plot into four subplots in each replicate. This was done to
accomodate the application of N as urea (CO(NH2)2) to the succeeding maize crop. The
rates of mineral N were, 0, 50, 100, 150 kg of N ha-1
. All the plots were then planted
with maize.
The statistical model used for the split plot design was:
Xijk = + Mi + Bj + dij + Sk + (MS)ik + eijk
Xijk = an observation
= the experiment mean
Mi = the main plot treatment effect

170
Bj = the block effect
dij = the main plot error (error a)
Sk = the subplot treatment effect
(MS)ik = the main plot and subplot treatment interaction effect
eijk = the subplot error (error b)
i = a particular main plot treatment
j = a particular block
k = a particular subplot treatment (Gomez and Gomez, 1984).
6.1.3 Plot description and application of triple super phosphate and urea
Details for treatment plots and application of triple super phosphate and urea were as
presented in Chapter 5 section 5.1.3.
6.2 DATA COLLECTION AND ANALYSIS
6.2.1 Soil sample collection
Details on soil sample collection and preparation were as presented in Chapter 2 under
section 2.1.3.1 and 2.1.3.3.
6.2.2 Biomass and grain yields assessment for the pigeon pea
Details for the assessment of grain and biomass yields for the pigeon pea are as
presented in Chapter 5 under section 5.2.2.
6.2.3 Biomass and grain yields assessment for the groundnut and maize
Details for the assessment of grain and biomass yields for the groundnut and maize are
as presented in Chapter 5 under section 5.2.3.

171
6.2.4 Evaluation of the productivity of the intercropping systems
The Land Equivalent Ratio (LER) (Andrews and Kassam, 1976) was used to evaluate
the productivity of the doubled up legume intercrops against the monocultures. The
formula used was as presented in Chapter 1 under section 1.1.12.
6.2.5 Soil analysis and plant sample analysis
Laboratory soil analysis was conducted as presented in Chapter 2 under section 2.1.3.4.
The plant materials were analysed in the laboratory as described in Chapter 3 under
section 3.2.7.
6.2.6 Nutrient yields
Nutrient yields were calculated as presented in Chapter 3 under section 3.2.9.
6.2.7 Statistical analysis
Statistical analysis on the soil, biomass, plant nutrient concentrations and yields data
was performed as presented in Chapter 2 under section 2.1.4.2.
6.3 RESULTS
6.3.1 Characterization of the soils at study site
Soil laboratory analytical results for the site were as presented in Chapter 2, Tables 2.0,
2.1a and 2.1b, sections 2.2.1 and 2.2.2, Appendices 2.0-2.1b.
6.3.2 Nutrient uptake in the parallel experiment
6.3.2.1 Groundnut
Figure 6.0 and Appendix 6.0, shows nutrient uptake by groundnut in the parallel
experiment in season two at flowering stage. Uptake of N and Mg was similar across
treatments. For N, this ranged from 3.6 to 4% while for Mg this ranged from 0.32 to

172
0.34%. On the other hand, uptake of P and Ca differed across treatment. For P, it was
higher in the long duration pigeon pea-groundnut intercrop (1.5%) and the TSP treated
medium duration pigeon pea-groundnut intercrop (1.5%). This was lower in the TSP
treated groundnut monoculture (1.3%) and the non TSP treated groundnut monoculture
(1.3%). For Ca uptake was lower in the TSP treated groundnut monoculture (0.9%) and
in the TSP treated long duration pigeon pea-groundnut intercrop (0.9%) compared with
the rest of the treatments.
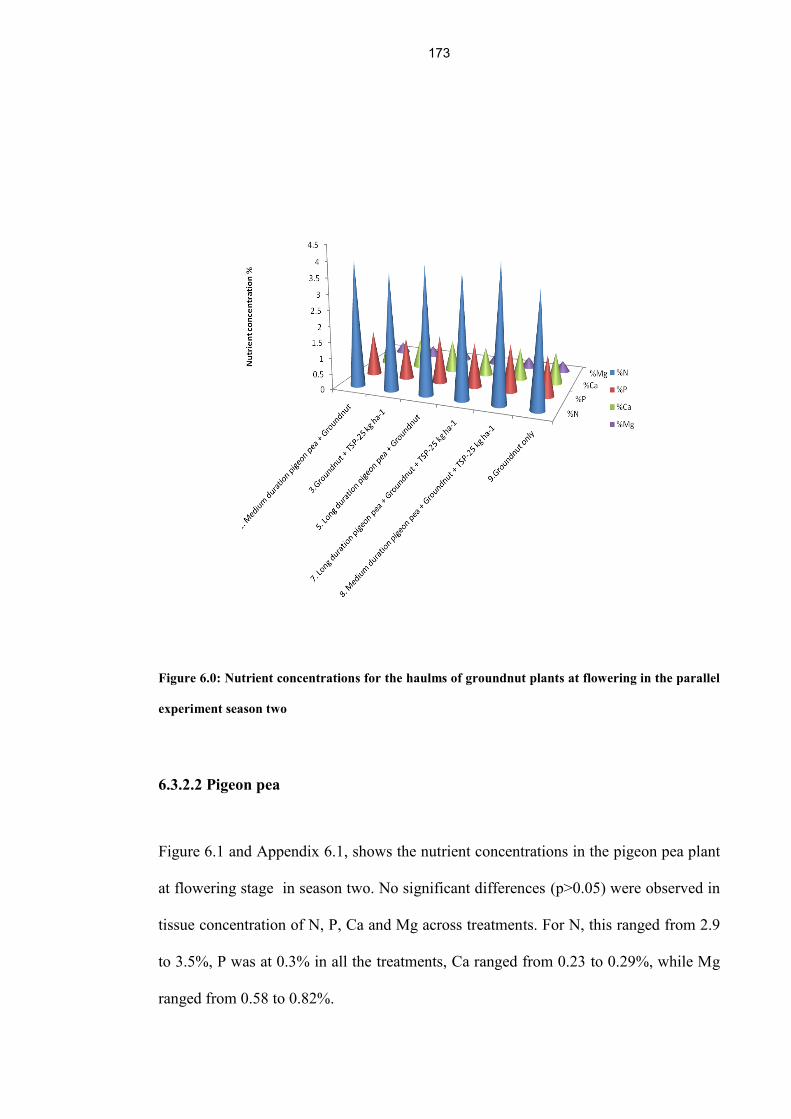
173
Figure 6.0: Nutrient concentrations for the haulms of groundnut plants at flowering in the parallel
experiment season two
6.3.2.2 Pigeon pea
Figure 6.1 and Appendix 6.1, shows the nutrient concentrations in the pigeon pea plant
at flowering stage in season two. No significant differences (p>0.05) were observed in
tissue concentration of N, P, Ca and Mg across treatments. For N, this ranged from 2.9
to 3.5%, P was at 0.3% in all the treatments, Ca ranged from 0.23 to 0.29%, while Mg
ranged from 0.58 to 0.82%.

174
Figure 6.1: Nutrient concentrations for pigeon pea plants at flowering stage in the parallel
experiment season two
6.3.2.3 Maize
The N and P uptake by the maize plants for the main experiment at silking stage in
season two in the subplots of the eight main treatment plots for season one were as
presented in Table 6.0, Appendix 6.0a. N uptake for the subplots of the main treatment
that had sole maize during season one without incorporating of stover into the soil at
harvest was in the order; 150 kg N ha-1
(2.6%) > 100 kg N ha-1
(2.3%) > 50 kg N ha-1
,
0 kg N ha-1
(2.0%). Uptake of P was at 0.3% across the subplots.
N uptake by the maize plants for the subplots of the main treatment that had the
medium duration pigeon pea monoculture during season one with biomass incorporated
into the soil at harvest was in the order; 150 kg N ha-1
(2.9%) >100 kg N ha-1
(2.5%) >
50 kg N ha-1
, 0 kg N ha-1
(1.6%), while P uptake was in this order 100 kg N ha-1
, 50 kg

175
N ha-1
, 0 kg N ha-1
(0.3%) > 150 kg N ha-1
(0.2%). N uptake by the maize plants for the
subplots of the main treatment that had the long duration pigeon pea monoculture
during season one with biomass incorporated into the soil at harvest were in the order;
150 kg N ha-1
(2.9%) > 100 kg N ha-1
(2.2%) > 50 kg N ha-1
(1.8%), 0 kg N ha-1
(1.4%),
while P uptake was in this order; 100 kg N ha-1
, 50 kg N ha-1
, 0 kg N ha-1
(0.3%) > 150
kg N ha-1
(0.2%).
N uptake by the maize plants for the subplots of the main treatment that had the
groundnut monoculture during season one with biomass incorporated into the soil at
harvest was the order; 150 kg N ha-1
(2.5%) >100 kg N ha-1
> 0 kg N ha-1
(1.7%) > 50
kg N ha-1
(2.2 %), while P uptake was in the order ; 150 kg N ha-1
(0.3%) >100 kg N
ha-1
, 50 kg N ha-1
(0.2 %) > 0 kg N ha-1
(0.1%).
N uptake by the maize plants for the subplots of the main treatment that had the
medium duration pigeon pea-groundnut intercrop during season one with biomass
incorporated into the soil at harvest was in the order; 150 kg N ha-1
(2.7%) >100 kg N
ha-1
(2.4%) > 50 kg N ha-1
(2.0 %) > 0 kg N ha-1
(1.3%), while P uptake was in the
order; 150 kg N ha-1
,100 kg ha-1
(0.3%) > 50 kg N ha-1
, 0 kg N ha-1
(0.2%).
N uptake by the maize plants for the subplots of the main treatment that had the long
duration pigeon pea-groundnut intercrop during season one with biomass incorporated
into the soil at harvest was in the order; 150 kg N ha-1
, 100 kg N ha-1
(2.4%) > 50 kg N
ha-1
(2.2 %) > 0 kg N ha-1
(2.1%), while for P the was at 0.3% in all the treatments for
the subplots.

176
N uptake by the maize plants for the subplots of the main treatment that had the
medium duration pigeon pea-groundnut intercrop during season one with no biomass
incorporated into the soil at harvest was in the order 150 kg N ha-1
(2.7%) > 100 kg ha-1
(1.9%) > 50 kg N ha-1
(1.8%) > 0 kg N ha-1
(1.5%), while uptake of P was at 0.2%
across treatments in the sub plots.
N uptake by the maize plants for the subplots of the main treatment that had the long
duration pigeon pea-groundnut intercrop during season one with no biomass
incorporated into the soil at harvest was in the order; 150 kg N ha-1
(2.7%) > 100 kg ha-
1(2.3%) > 50 kg N ha
-1 (1.9%) > 0 kg N ha
-1(1.6%), while P uptake was in the order;
150 kg N ha-1
, 50 kg ha-1
(0.3%) > 100 kg N ha-1
, 0 kg N ha-1
(0.2%).

177
Table 6.0: N and P contents in the maize plant at silking in the main experiment
(season two)
Treatments: Main and sub plots
1. %N %P
a.Sole Maize-No biomass 2.0 0.3
b.Sole Maize-No biomass + 100 kg N ha-1 2.3 0.3
c.Sole Maize-No biomass + 150 kg N ha-1 2.6 0.3
d.Sole Maize-No biomass + 50 kg N ha-1 2.0 0.3
2.
a.Medium duration pigeon pea-biomass 1.6 0.3
b.Medium duration pigeon pea-biomass + 100 kg N ha-1 2.5 0.3
c.Medium duration pigeon pea-biomass + 150 kg N ha-1 2.9 0.2
d.Medium duration pigeon pea-biomass + 50 kg N ha-1 1.6 0.3
3.
a.Long duration pigeon pea-biomass 1.4 0.3
b.Long duration pigeon pea-biomass + 100 kg N ha-1 2.2 0.3
c..Long duration pigeon pea-biomass + 150 kg N ha-1 2.9 0.2
d.Long duration pigeon pea-biomass + 50 kg N ha-1 1.8 0.3
4.
a..Sole groundnut-biomass 1.7 0.1
b.Sole groundnut-biomass + 100 kg N ha-1 2.2 0.2
c.Sole groundnut-biomass + 150 kg N ha-1 2.5 0.3
d.Sole groundnut-biomass + 50 kg N ha-1 1.2 0.2
5.
a.Medium duration pigeon pea + groundnut-biomass 1.3 0.2
b.Medium duration pigeon pea + groundnut-biomass + 100 kg N ha-1 2.4 0.3
c.Medium duration pigeon pea + groundnut-biomass + 150 kg N ha-1 2.7 0.3
d.Medium duration pigeon Pea + groundnut-biomass + 50 kg N ha-1 2.0 0.2
6.
a.Long duration pigeon pea + groundnut-biomass 2.1 0.3
b.Long duration pigeon pea + groundnut-biomass + 100 kg N ha-1 2.4 0.3
c.Long duration pigeon pea + groundnut-biomass + 150 kg N ha-1 2.4 0.3
d.Long duration pigeon pea + groundnut-biomass + 50 kg N ha-1 2.2 0.3

178
%N
%P
a.Medium duration pigeon pea + groundnut-no biomass 1.5 0.2
b.Medium duration pigeon pea + groundnut-no biomass + 100 kg N ha-1 1.9 0.2
c.Medium duration pigeon pea + groundnut-no biomass + 150 kg N ha-1 2.7 0.2
d.Medium duration pigeon pea + groundnut-no biomass + 50 kg N ha-1 1.8 0.2
7. %N %P
a.Long duration pigeon pea + groundnut-no biomass 1.6 0.2
b.Long duration pigeon pea + groundnut-no biomass + 100 kg N ha-1 2.3 0.2
c.Long duration pigeon pea + groundnut-no biomass + 150 kg N ha-1 2.7 0.3
d.Long duration pigeon pea + groundnut-no biomass + 50 kg N ha-1 1.9 0.3
GM 2.1 0.3
CV (%) 15.9 18.3
LSD0.05 0.50 -
Table 6.1, Appendix 5.0d, shows groundnut shell, grain, weight of 100 grains and
haulms yields for the parallel experiment in season two. No significant differences
(p>0.05) were observed in these yields parameters across treatments. The yields of
shells ranged from 846 to 1,985 kg ha-1
, for grain this ranged from 1,654 to 3,025 kg
ha-1
, while for haulms this ranged from 1,396 to 2,463 kg ha-1
. The weight of 100
groundnut grains ranged from 102 grams to 133 grams. Significant differences (p<0.05)
were observed in the average number of pods per plant across treatments and in the
weight of 100 pods. Average number of pods per plant was significantly higher for the
groundnut monoculture (22 pods per plant) compared to the medium duration pigeon
pea-groundnut (19 pods per plant) and the long duration pigeon pea-groundnut (19
pods per plant) intercrop. The weight of 100 pods was significantly higher for the
groundnut monoculture (167g) and significantly lower in the TSP treated medium
duration pigeon pea-groundnut intercrop (147g)................................................................

179
Table 6.1: Groundnut pods, grain and haulm’s yields in the parallel experiment
Treatment
Average number
of pods plant-1
Grain Wt 100
grains g
Pod
Wt
100 g
Shells
yield kg
ha-1
Grain
yield kg
ha-1
Haulms
yield
kg ha-1
1. Medium duration pigeon pea + groundnut 19 1.26 162 1,461 1,835 1,516
3.Groundnut + 25 kg P ha-1
28 1.02 161 1,985 3,025 2,463
5. Long duration pigeon pea + groundnut 19 1.19 155 1,135 1,513 1,396
7. Long duration pigeon pea + groundnut + 25 kg P ha-1
24 1.24 158 1,681 1,719 1,727
8. Medium duration pigeon pea + groundnut + 25 kg P ha-1
19 1.22 147 846 1,654 1,412
9.Srole goundnut 22 1.33 167 1,679 1,875 1,752
GM 21.8 1.2 158 1,464 1,936 1,711
CV (%) 27.5 0.14 5.7 37.1 39.9 41.7
LSD0.05 14.0 - 20 - - -

180
6.3.3 Yields of pigeon pea and groundnut in the parallel and main experiment in
the second cropping season
6.3.3.1 Pigeon pea yields
Yields components of pigeon pea for the parallel experiment for season two were as
presented in Table 6.2 and Appendices 5.1a to 5.1e. No significant differences (p>0.05)
were observed in the yield of pods, stems and roots across treatments. This ranged from
19 to 24 kg ha-1
. No grain yields were recorded as poor grain filling in the pods was
witnessed. Stem yields ranged from 597 to 950 kg ha-1
while root yields ranged from
507 to 605 kg ha-1
.
Significant differences (p<0.05) were observed for the yield of pigeon pea litter, fresh
leaves and twigs across treatments. For the litter this was significantly higher for the
litter from the TSP treated medium duration pigeon pea monoculture (824 kg ha-1
) and
significantly lower for the long duration pigeon pea-groundnut intercrop (518 kg ha-1
).
For fresh leaves, the yields were significantly higher in fresh leaves for both the TSP
treated and non TSP treated medium duration pigeon pea-groundnut intercrop (944 kg
ha-1
), and were significantly lower in fresh leaves for pigeon pea from the TSP treated
long duration pigeon pea monoculture (791 kg ha-1
).
In twigs the yields were significantly higher for the twigs from the TSP treated medium
duration pigeon pea monoculture (882 kg ha-1
) and significantly lower for the twigs
from the long duration pigeon pea-groundnut intercrop (655 kg ha-1
) and the TSP
treated long duration pigeon pea monoculture (665 kg ha-1
).

181
Computed total biomass yields indicate significant differences (p<0.05) across
treatment plots. Significantly higher total pigeon pea biomass yields were registered by
the TSP treated medium duration pigeon pea monoculture (4,149 kg ha-1
). The yields
were significantly lower in the non TSP treated long duration pigeon pea
groundnut.intercrop.(3,145.kg.ha-1
).

182
Table 6.2: Pigeon pea pod and biomass yields in the parallel experiment
Treatment
Pods
Litter
Fresh Leaves
Twigs
Stems
Roots
Total biomass
yield
kg ha-1
1. Medium duration pigeon pea + groundnut 21 661 944 808 792 571 3,796
2. Long duration pigeon pea + 25 kg P ha-1
20 597 791 665 757 507 3,337
4. Medium duration pigeon pea only 21 686 909 793 723 596 3,727
5. Long duration pigeon pea + groundnut 21 518 830 655 589 531 3,145
6. Medium duration pigeon pea + 25 kg P ha-1
23 824 899 882 915 605 4,149
7. Long duration pigeon pea + groundnut + 25 kg P ha-1
19 652 914 699 718 601 3,603
8. Medium duration pigeon pea + groundnut + 25 kg P ha-1
21 671 944 764 950 512 3,861
10. Long duration pigeon pea only 24 611 809 767 597 524 3,332
GM 21 653 880 754 755 556 3,619
CV (%) 17.0 19.0 8.0 14.0 26.0 12.0 10.2
LSD0.05 - 230 122 198 - - 681

183
Yields for maize grain, stover, rachids and the average cob length in season two for
treatments of the subplots in the main treatment plots for season one, were as presented
in Table 6.3, and Appendices 6.2b to 6.2e. Grain yields for the subplots of the main
treatment that had sole maize during season one without incorporation of stover into the
soil at harvest were in the order; 150 kg N ha-1
(4,106 kg ha-1
) > 100 kg N ha-1
(3,346
kg ha-1
) > 50 kg N ha-1
(2,188 kg ha-1
) > 0 kg N ha-1
(1,775 kg ha-1
); Stover yields
were in this order; 150 kg N ha-1
(3,006 kg ha-1
) > 50 kg N ha-1
(2,587 kg ha-1
) > 100
kg N ha-1
(2,579 kg ha-1
) > 0 kg N ha-1
> (2,272 kg ha-1
); rachids yields were in the
order; 150 kg N ha-1
(1,012 kg ha-1
) > 0 kg N ha-1
(774 kg ha-1
) > 100 kg N ha-1
(679 kg
ha-1
) > 50 kg N ha-1
> (661kg ha-1
);and the average cob lengths were in this order 150
kg N ha-1
, 100 kg N ha-1
(17cm) > 50 kg N ha-1
, 0 kg N ha-1
(16cm).
Grain yields for the subplots of the main treatment that had medium duration pigeon
pea monoculture during season one with biomass incorporated into the soil at harvest
were in the order; 150 kg N ha-1
(5, 404kg ha-1
) > 100 kg N ha-1
(4,391 kg ha-1
) > 50 kg
N ha-1
(3,700 kg ha-1
) > 0 kg N ha-1
> (2, 410 kg ha-1
). While stover yields were in the
order; 100 kg N ha-1
(3,360 kg ha-1
) > 50 kg N ha-1
(3,326 kg ha-1
) > 150 kg N ha-1
(2,944 kg ha-1
) > 0 kg N ha-1
> (2, 026 kg ha-1
); rachids yields were in this order; 50 kg
N ha-1
(1,178 kg ha-1
) > 0 kg N ha-1
(1,013 kg ha-1
) > 100 kg N ha-1
(953 kg ha-1
) > 150
kg N ha-1
> (669 kg ha-1
) and cob lengths were in the order; 150 kg N ha-1
(18cm) >
100 kg N ha-1
, 50 kg N ha-1
(17cm) > 0 kg N ha-1
> (15cm).
Grain yields for the subplots of the main treatment that had long duration pigeon pea
monoculture during season one with biomass incorporated into the soil at harvest were
184
in the order; 150 kg N ha-1
(5, 453 kg ha-1
) > 100 kg N ha-1
(4,691 kg ha-1
) > 50 kg N
ha-1
(4,621 kg ha-1
) > 0 kg N ha-1
> (4,365 kg ha-1
). While stover yields were in the
order; 50 kg N ha-1
(3,731 kg ha-1
) > 150 kg N ha-1
(3,232 kg ha-1
) > 100 kg N ha-1
(3,222 kg ha-1
) > 0 kg N ha-1
> (2, 896 kg ha-1
); rachids yields were in the order; 100
kg N ha-1
(1,076 kg ha-1
) > 150 kg N ha-1
(1,027 kg ha-1
) > 0 kg N ha-1
(1,025 kg ha-1
) >
50 kg N ha-1
> (1,019 kg ha-1
) and cob lengths were in the order; 150 kg N ha-1
(18cm)
> 100 kg N ha-1
, 50 kg N ha-1
(17cm) > 0 kg N ha-1
> (16cm).
Grain yields for the subplots of the main treatment that had sole groundnut during
season one with biomass incorporated into the soil at harvest were in the order; 150 kg
N ha-1
(5,806 kg ha-1
) > 100 kg N ha-1
(5,314 kg ha-1
) > 0 kg N ha-1
> (3,034 kg ha-1
) >
50 kg N ha-1
(3,010 kg ha-1
). While stover yields were in the order; 150 kg N ha-1
(4,413 kg ha-1
) > 100 kg N ha-1
(3,086 kg ha-1
) > 0 kg N ha-1
> (2,814 kg ha-1
) > 50 kg
N ha-1
(2,684 kg ha-1
); rachids yields were in the order; 150 kg N ha-1
(1,235 kg ha-1
) >
100 kg N ha-1
(1,150 kg ha-1
) > 50 kg N ha-1
(657 kg ha-1
)> 0 kg N ha-1
(641 kg ha-1
).
Cob lengths were in the order; 150 kg N ha-1
(18cm) > 100 kg N ha-1
(17cm) > 0 kg N
ha-1
(16cm) > 50 kg N ha-1
> (15cm). Grain yields for the subplots of the main
treatment that had medium duration pigeon pea-groundnut intercrop during season one
with biomass incorporated into the soil at harvest were in the order; 150 kg N ha-1
(5,636 kg ha-1
) > 100 kg N ha-1
(4,956 kg ha-1
) > 50 kg N ha-1
> (4,509 kg ha-1
) > 0 kg
N ha-1
(4,266 kg ha-1
). While stover yields were in the order; 150 kg N ha-1
(4,146 kg
ha-1
) > 50 kg N ha-1
(3,684 kg ha-1
) > 100 kg N ha-1
> (3,592 kg ha-1
) > 0 kg N ha-1
(3,023 kg ha-1
); rachids yields were in the order; 100 kg N ha-1
(1,155 kg ha-1
) > 50 kg
N ha-1
(817 kg ha-1
) > 150 kg N ha-1
(777 kg ha-1
)> 0 kg N ha-1
(671 kg ha-1
). Cob

185
lengths were in the order; 150 kg N ha-1
, 100 kg N ha-1
(17cm) > 50 kg N ha-1
, 0 kg N
ha-1
(16cm).
Grain yields for the subplots of the main treatment that had long duration pigeon pea-
groundnut intercrop during season one with biomass incorporated into the soil at
harvest were in the order; 100 kg N ha-1
(5, 217 kg ha-1
) > 50 kg N ha-1
(5,184 kg ha-1
)
> 150 kg N ha-1
(4,625 kg ha-1
) > 0 kg N ha-1
(3,333 kg ha-1
). While stover yields were
in the order; 50 kg N ha-1
(4,022 kg ha-1
) > 100 kg N ha-1
(3,810 kg ha-1
) > 150 kg N ha-
1 (3,105 kg ha
-1) > 0 kg N ha
-1 (2,179 kg ha
-1); rachids yields were in the order; 100 kg
N ha-1
(1,088 kg ha-1
) > 150 kg N ha-1
(936 kg ha-1
) > 50 kg N ha-1
(749 kg ha-1
) > 0 kg
N ha-1
(631 kg ha-1
). Cob lengths were in the order; 100 kg N ha-1
(17cm) > 150 kg N
ha-1
, 50 kg N ha-1
(16cm) > 0 kg N ha-1
(15cm).
Grain yields for the subplots of the main treatment that had medium duration pigeon
pea-groundnut intercrop during season one with no biomass buried into the soil at
harvest were in the order; 150 kg N ha-1
(4,235 kg ha-1
) > 100 kg N ha-1
(3,352 kg ha-1
)
> 0 kg N ha-1
(2,226 kg ha-1
) > 50 kg N ha-1
(2,163 kg ha-1
). While stover yields were
in the order; 150 kg N ha-1
(3,308 kg ha-1
) > 50 kg N ha-1
(3,157kg ha-1
) > 0 kg N ha-1
(2,538 kg ha-1
) > 100 kg N ha-1
(2,520 kg ha-1
); rachids yields were in the order; 100
kg N ha-1
(918 kg ha-1
) > 50 kg N ha-1
(810 kg ha-1
) > 150 kg N ha-1
(803 kg ha-1
) > 0
kg N ha-1
(405 kg ha-1
). Cob lengths were in the order; 150 kg N ha-1
(18cm) > 0 kg N
ha-1
(17cm) > 100 kg N ha-1
(16cm) > 50 kg N ha-1
(15cm).

186
Grain yields for the subplots of the main treatment that had long duration pigeon pea-
groundnut intercrop during season one with no biomass buried into the soil at harvest
were in the order; 150 kg N ha-1
(5,308 kg ha-1
) > 100 kg N ha-1
(5,185 kg ha-1
) > 0 kg
N ha-1
(3,007 kg ha-1
) > 50 kg N ha-1
(2,845 kg ha-1
). While stover yields were in the
order; 150 kg N ha-1
(3,254 kg ha-1
) > 100 kg N ha-1
(3,167kg ha-1
) > 50 kg N ha-1
(2,670 kg ha-1
) > 0 kg N ha-1
(2,556 kg ha-1
); rachids yields were in the order; 50 kg N
ha-1
(1,070 kg ha-1
) > 150 kg N ha-1
(856 kg ha-1
) > 100 kg N ha-1
(635 kg ha-1
) > 0 kg
N ha-1
(541 kg ha-1
). Cob lengths were in the order; 150 kg N ha-1
(17cm) > 100 kg N
ha-1
(17cm),50 kg N ha-1
, 0 kg N ha-1
(16cm).

187
Table 6.3: Maize grain, stover, rachids yields and average cob length for the
main experiment
Treatments: Main and sub plot
1.
Maize grain
yield kg ha-1
Stover yield
kg ha-1
Rachids yield
kg ha-1
Average cob
length cm
a.Sole Maize-No biomass 1,775 2,272 774 16
b.Sole Maize-No biomass + 100 kg N ha-1 3,346 2,579 679 17
c.Sole Maize-No biomass + 150 kg N ha-1 4,106 3,006 1,012 17
d.Sole Maize-No biomass + 50 kg N ha-1 2,188 2,587 661 16
2.
a.Medium duration pigeon pea-biomass 2,410 2,029 1,013 15
b.Medium duration pigeon pea-biomass + 100 kg N ha-1 4,391 3,360 953 17
c.Medium duration pigeon pea-biomass + 150 kg N ha-1 5,404 2,944 669 18
d.Medium duration pigeon pea-biomass + 50 kg N ha-1 3,700 3,326 1,178 17
3.
a.Long duration pigeon pea-biomass 4,365 2,896 1,025 16
b.Long duration pigeon pea-biomass + 100 kg N ha-1 4,691 3,222 1,076 17
c.Long duration pigeon pea-biomass + 150 kg N ha-1 5,453 3,232 1,027 18
d.Long duration pigeon pea-biomass + 50 kg N ha-1 4,621 3,731 1,019 17
4.
a. Sole groundnut-biomass 3,034 2,814 641 16
b.Sole groundnut-biomass + 100 kg N ha-1 5,314 3,089 1,150 17
c.Sole groundnut-biomass + 150 kg N ha-1 5,806 4,413 1,235 18
d.Sole groundnut-biomass + 50 kg N ha-1 3,010 2,684 657 15
5.
a.Medium duration pigeon pea + groundnut-biomass 4,266 3,023 671 16
b.Medium duration pigeon pea + groundnut-biomass + 100 kg N ha-1 4,956 3,592 1,155 16
c.Medium duration pigeon pea + groundnut-biomass + 150 kg N ha-1 5,636 4,146 777 17
d.Medium duration pigeon Pea + groundnut-biomass + 50 kg N ha-1 4,509 3,684 817 17
6.
a.Long duration pigeon pea + groundnut-biomass 3,333 2,179 630 15
b.Long duration pigeon pea + groundnut-biomass + 100 kg N ha-1 5,217 3,810 1,088 17
c.Long duration pigeon pea + groundnut-biomass + 150 kg N ha-1 4,625 3,105 936 16
d.Long duration pigeon pea + groundnut-biomass + 50 kg N ha-1 5,184 4,022 749 16

188
7.
Maize grain
yield kg ha-1
Stover yield
kg ha-1
Rachids yield
kg ha-1
Average cob
length cm
a.Medium duration pigeon pea + groundnut-no biomass 2,226 2,538 405 17
b.Medium duration pigeon pea + groundnut-no biomass + 100 kg N
ha-1 3,352 2,520 918 16
c.Medium duration pigeon pea + groundnut-no biomass + 150 kg N ha-
1 4,235 3,308 803 18
d.Medium duration pigeon pea + groundnut-no biomass + 50 kg N ha-1 2,163 3,157 810 15
8.
a.Long duration pigeon pea + groundnut-no biomass 3,007 2,556 541 16
b.Long duration pigeon pea + groundnut-no biomass + 100 kg N ha-1 5,185 3,167 635 16
c.Long duration pigeon pea + groundnut-no biomass + 150 kg N ha-1 5,308 3,254 856 17
d.Long duration pigeon pea + groundnut-no biomass + 50 kg N ha-1 2,845 2,670 1,070 16
GM 4,052 3,091 863 16.5
CV (%) 21.6 32.7 41.6 9.2
LSD0.05 1,425 1,649 586 3.0

189
6.3.4 Evaluation of the productivity of the cropping systems………………………
Table 6.4 below shows the evaluation of the productivity of the intercrops using the
LER on biomass production basis. Generally, all intercrops registered a yield
advantage above the monocultures of both the pigeon pea and groundnut. The higher
yield advantage over the monocultures was registered by the medium duration pigeon
pea-groundnut intercrop.

190
LER=Land Equivalent Ratio
Table 6.4: Evaluation of the productivity of the cropping systems
Treatment
Groundnut
haulms yield
ha-1
Pigeon pea
biomass-pod
yield ha-1
Partial
LER= ∑
(Ypi/Ymi)-
Pigeon pea
Partial LER=
∑ (Ypi/Ymi)
Groundnut
LER= ∑
(Ypi/Ymi)
1. Medium duration pigeon pea + groundnut 1,516 3,775 1.02 0.87 1.88
2. Long duration pigeon pea + 25 kg P ha-1
- 3,317 - - -
3.Groundnut + 25 kg P ha-1
2,463 - - - -
4. Medium duration pigeon pea only - 3,706 - - -
5. Long duration pigeon pea + groundnut 1,396 3,124 0.94 0.80 1.74
6. Medium duration pigeon pea + 25 kg P ha-1
- 4,126 - - -
7. Long duration pigeon pea + groundnut + 25 kg P ha-1
1,727 3,584 1.08 0.70 1.78
8. Medium duration pigeon pea + groundnut + 25 kg P ha-1
1,412 3,840 0.93 0.57 1.50
9.Sole groundnut 1,752 - - - -
10. Long duration pigeon pea only - 3,308 - - -
GM 1,711 3,598 - - -
CV (%) 41.7 - - - -
LSD0.05 - - - - -

191
6.4 DISCUSSION
6.4.1 Groundnut pods, grain and haulm’s yields for the parallel trial
The data on nutrient concentration in the groundnut at flowering stage indicate optimal
nutrient uptake of N (Figure 6.0) as the nutrient concentrations were within the
proposed range of sufficiency (Jones, 1974; Campbell, 2000), suggesting possible high
yields at harvest time. This was reflected at harvest in the yield parameters. For
instance, the yields of grain ranged from 1,654 to 3,025 kg ha-1
while the yields of
shells ranged from 846 to 1,985 kg ha-1
and the yields of haulms ranged from 1,396 to
2,463 kg ha-1
. Evidencially in the 2012/2013 cropping season, groundnut was not
hyper-stressed nutritionally or by other environmental factors like moisture. Nutrient
uptake was optimal as indicated by the concentration of nutrients in plant tissues. The
yields parameters contrasts sharply with what was generated in the 2011/2012 cropping
season in the same environment. Low yields were registered and this was attributed
chiefly to dry spells that marked the cropping season (Phiri et al., 2013). Moisture
stress reduces nutrient uptake leading into low concentrations of mineral nutrients in
crop plants (Gunes et al., 2006), hence resultant retarded growth and yields.
6.4.2 Nutrient uptake for pigeon pea and yields
Under the conditions of this study, nutrient uptake by the pigeon pea was high (Figure
6.1). The concentrations were in a similar range of values reported in literature (Snapp
et al., 2003; Dasbak and Asiegbu, 2012). However, though this was the case no grain
yields were recorded as poor grain filling in the pods was witnessed. This was a similar
phenomenon as observed during the 2011/2012 cropping season (Phiri et al., 2013). For
the 2011/2012 cropping season environmental stresses in the form of erratic rainfall

192
patttern were cited as being behind the poor grain filling. On the contrary, for the
2012/2013 cropping season such stresses were absent. Other factors ought to be
examined to establish the root cause of the poor grain filling. Probable aspects worth
investigating could be the effect of time of planting, temperature and photoperiod on
podding and grain filling. Noteworthy is the fact that pigeon pea is a short-day plant
that requires a daylight length of 12.5 hours to initiate flowering and seed production
(Cook et al., 2005). Mligo and Craufurd, (2005) indicated that for pigeon pea flowering
is delayed under long days and under cooler growing conditions. In Malawi, day length
and temperature changes along the year. After the first season pigeon pea plants were
ratooned with the intention of investigating the effect of ratooning on grain yield.
However, during biomass incorporation into the soil the roots of most of the plants
were injured leading to drying up. A few plants survived, which podded profusely in
the second season and had their pods filled with grain. Therefore, under this
environment, it could be worthwhile to investigate the effect of ratooning and
ratooning time on pigeon pea podding and grain filling for the pigeon pea during
season two.
On biomass yields, pigeon pea seem to have responded well to the application of
phosphorus, as reflected by the significant high yields registered by the TSP treated
medium duration pigeon pea monoculture (4,149 kg ha-1
). Lower biomass yields were
registered by the non TSP treated long duration pigeon pea groundnut intercrop (3,145
kg ha-1
). The results are in agreement with recent findings by Kumar and Kumar,
(2013) who indicated pigeon pea dry matter increase with increased doses of
phosphorus. Parihar et al. (2005), Kumar and Kushwaha (2006) and Kumar et al.
193
(2007) reported a similar trend of yields increase. The inclusion of stem and root
biomass yields increased the total biomass yields substancially above yields recorded
during the previous cropping season (Phiri et al., 2013). The biomass yields obtained
under this study falls within the range of values reported by other workers. For
instance, from on farm studies conducted in southern Malawi, Snapp, (1998) reported
that pigeon pea can produce over 2 t ha-1
of biomass which when incorporated into the
soil can help alleviate some of the soil fertility limitations under smallholder farms.
Some of the limitations include inherent low N and P supply capacity of Malawi’s
soils (Phiri et al., 2010)
6.4.3 Nitrogen uptake and yields for maize
For optimal growth and production maize must be supplied with enough nitrogen (N)
among other nutritional and growth factors (Alley et al., 2009). The nutrient is a major
yields determining factor in crop production (Onasanya et al., 2009). Under the
conditions of this study, basing on grain yields, uptake of nitrogen and subsequent
utilization seem to have been enhanced by the incorporation of pigeon pea and
groundnut biomass or the combination of both (Table 6.3). Optimal yields were
registered under the combination of legume biomass with 150 kg N ha-1
and 100 kg N
ha-1
with grain yields nearing the potential yield (6 t ha-1
) of the variety that was used
(SC 403). Sole biomass incorporation from either the pigeon pea or groundnut or the
combination of both without addition of mineral N appears to have had impact on
nutrient uptake and utilization as high maize grain yields which were above grain yields
from the control plots were registered (Table 6.3). Notwithstanding the aforementioned
maize responded well to sole application of mineral N at the rate of 150 kg N ha-1
and
100 kg N ha-1
, though the grain yields were consistently below those obtained from

194
plots treated with the combination of legume biomass with 150 kg N ha-1
and 100 kg N
ha-1
(Table 6.3). The observed difference in grain yields might be attributed to
increased N supply and uptake by maize from the decomposing and mineralizing
pigeon pea and groundnut biomass for the latter plots and possible enhance moisture
retention and availability. This is in tandem with similar work by Harawa et al. (2006)
who indicated an increased N uptake by maize in plots treated with biomass combined
with inorganic fertilizers. Under such treatment combinations there is better synchrony
of N release and N demand by maize (Munthali et al., 2014). Implicitly, adequate N
was available not only during the first two to six weeks after planting, which is the time
where N deficit reduces yield potential (Jones, 1985), but also was available at the time
when N is highly demanded by crop (Alley et al., 2009). This is the time of maximum
growth which occurs a month prior to tasseling and silking (Alley et al., 2009). This
culminated into the observed high grain yields. It is important to note that pigeon pea
biomass is of high quality and decompose very fast to release nutrients to the soil, N in
particular, attributable to a narrow C:N ratio (Oke, 2001). The rapid decomposition and
mineralization of the biomass to release N coincide with the period of optimum nutrient
absorption for vigorous vegetative development in maize plants (Olujobi et al., 2013).
N supply to the maize crop therefore was not limiting. Furthermore, on top of the
release of N and other nutrients, the decomposition of pigeon pea biomass performs
other functions (Olujobi et al., 2013), like the supply of energy through nutrient
availability to soil organism thereby enhancing nutrient cycling in the soil, reduction in
phosphorus (P) sorption capacity of the soil and stimulation of root growth (Oke,
2001).

195
It was observed that in treatment plots where legume biomass was not incorporated
(treatment 7 & 8), yields comparable with those obtained in plots where biomass was
incorporated were recorded. It is highly likely that the supply of N in these treatment
plots was boosted not only by mineralized N from decaying roots of pigeon pea but
also from residual N (Ferguson et al., 2002; Fan and Hao, 2003; Phiri et al., 2014).
Residual NO3-‒N in soil is an important N source for crops, and its amount correlates
with crop yields ( Ferguson et al., 2002; Fan and Hao, 2003).
6.5 CONCLUSION
In groundnut the observed yields level for the different yields parameters indicates that
the crop was not hyper-stressed nutritionally or by other environmental factors.
Nutrient uptake was optimal as indicated by the concentration of nutrients in plant
tissues. The yields parameters contrasts sharply with what was generated last season in
the same environment. Low yields were registered and this was attributed chiefly to dry
spells that marked the cropping season. For the pigeon pea, no grain yields were
recorded due to poor grain filling in the pods. This was a similar phenomenon as
observed during the first cropping. Environmental stresses in form of erratic rainfall
patttern were cited as being behind the poor grain filling, however in the second season
such stresses were absent. Other factors ought to be examined to establish the root
cause of the poor grain filling.
A potential solution to the observed poor grain filling appears to be ratooning the crop.
Computed total biomass yields indicate increased biomass yields above yields
registered in the first season due to the inclusion of stem and root biomass yields. In
general, N uptake and yields for maize was significantly higher in subplots top dressed

196
with 150 kg N ha-1
and 100 kg N ha-1
with legume residues buried with treatments
treated with 50 kg N ha-1
and biomass giving reasonably high yields. This could be due
to increased and sustained N supply. Under low input conditions like those of
Malawian smallholder farmers the latter treatment might not compromise yields when
employed.

197
6.6 REFERENCES
Aihou, K., Sanginga, N., Vanlauwe, B., Diels, J., Merckx, R. and Van Cleemput, O.
(2006). Soil factors limiting growth and establishment of pigeon pea (Cajanus
cajan (L.) Millsp. in farmers’ fields in the savannah of Benin. Bulletin de la
Recherche Agronomique du Bénin. 52pp.
Alley, M.M., Martz, M.E., Davis, P.H., and Hammons, J.L. (2009). Nitrogen and
phosphorus fertilization of corn. Virginia cooperative extension publication.
pp. 424-027.
Andrews, D.J. and Kassam, A.H. (1976). The importance of multiple cropping is
increasing world food supplies. American Society of Agronomy 27: 1-10.
Asare, D.K., Frimpong, J.O., Ayeh, E.O. and Amoatey, H.A. (2011). Water use
efficiencies of maize cultivars grown under rain-fed conditions. Agricultural
Sciences 2(2): 125-130.
Ashraf, M., Athar, H.R., Harris, P.J.C. and Kwon, T.R. (2008). Some prospective
strategies for improving crop salt tolerance. Advances in Agronomy 97: 45-110.
Atachi, P. and Machi, B. (2004). Intercropping cowpea with pigeon pea in an integrated
pestmanagement system in south Benin. Annales des Sciences Agronomiques du
Bénin 6(2): 1–2.

198
Cook, B.G., Pengelly, B.C., Brown, S.D., Donnelly, J.L., Eagles, D.A., Franco, M.A.,
Hanson, J. Mullen, B.F., Partridge, I.J., Peters, M. and Schultze-Kraft, R.
(2005). Tropical forages: an interactive selection tool. Cajanus cajan. CSIRO,
DPI and F (Qld), CIAT, and ILRI, Brisbane, Australia. 23pp.
Chiyembekeza, A.J., Subrahmanyam, P., Kisyombe, C.T. and Nyirenda, N.E. (1998).
Groundnut: A package of recommendations for production in Malawi. Ministry
of Agriculture and Irrigation. 14pp.
Dasbak, M.A. and Asiegbu, J.E. (2012). Assessment of leaf macro nutrients turn over
potential of six pigeon pea genotypes intercropped with maize in a humid
savanna agro-ecology of Nigeria. International Journal of Agricultural Sciences
2(5): 166-172.
Davis, J. and Westfall, D. (2009). Fertilizing corn. Colorado extension fact sheet No.
538.[http://www.ext.colostate.edu/pubs/crops/00538.html].site.visited.9/9/2013.
Dzilankhulani, A.M., Tchale, H. and Boughton, D. (1998). Small scale seed programs
and adoption of groundnut technology. The case of CG 7 groundnut variety in
Malawi. unpublished Report. ICRISAT. Lilongwe, Malawi.
Enyisi, S.I., Umoh, V.J., Whong, C.M.Z., Abdullahi, I.O. and Alabi, O. (2014).
Chemical and nutritional value of maize and maize products. African Journal of
Food Science and Technology 5(4): 100-104.

199
Fageria,.N.K.,.Baligar,.V.C..and.Clark,.R.B..(2002)..Micronutrient.in.crop.production.
Advances in Agronomy 77: 185-268.
Fan, J. and Hao, M.D. (2003). Nitrate accumulation in soil profile of dryland farmland.
Journal of Agro-Environment Science 22: 263-266 [in Chinese].
Ferguson, R.B., Hergertb, G.W., Schepersc, J.S., Gotwayd C.A., Cahoone, J.E. and
Petersonf, T.A. (2002). Site specific nitrogen management of irrigated maize,
yield and soil residual nitrate effects. Soil Science Society of America Journal
66: 544-553.
Harawa, R., Lehmann, J., Akinnifesi, F., Fernandes, E. and Kanyama-Phiri, G. (2006).
“Nitrogen.dynamics.in.maize-based.agroforestry.systems.as.affected.by
landscape.position.in.southern.Malawi,”. Nutrient.Cycling.in.Agroecosystems
75: 271–284.
Graham, P.H. and Vance, C.P. (2003). Legumes: Importance and constraints to greater
use..Plant Physiology 131: 872–877.
Gunes, A., Cicek, N., Inal, A., Alpaslan, M., Eraslan, F., Guneri, E. and Guzelordu, T.
(2006). Genotypic response of chickpea (Cicer arietinum L.) cultivars to
drought stress implemented at pre and post anthesis stage and its relations with
nutrient uptake and efficiency. Plant Soil Environment 52: 368-376.

200
Ikisan, (2000). [http://www.ikisan.com/links/ap_groundnutnutrient management] site
visited on 5/27/2014 .
Jones,.C.A..(1985)..C4 grasses and cereals: growth, development, and stress response.
John Wiley and Sons, Inc., New York. 67pp.
Junjittakarna, J., Pimratchb, S., Jogloya, S., Htoona, W., Singkhama, N., Vorasoota,
B.N., Toomsana, C., Holbrookc, C. and Patanothaia, A. (2013). Nutrient uptake
of peanut genotypes under different water regimes. International Journal of
Plant Production 7(4): 1735-6814 .
Kanyama-Phiri, G.Y., Snapp, S., Wellard, K., Mhango, W., Phiri, A.T., Njoloma, J.P.,
Msusa, H., Lowole, M.W. and Dakishon L. (2008). Legume best bets to
improve soil quality and family nutrition. Conference proceedings: Mc Knight
Foundation S/E African community of practice meeting Lilongwe, Malawi
October, 2008. 25pp.
Kolay, A.K. (2008). Soil moisture stress and plant growth. In: Water and crop growth.
Atlantic, Delhi. pp. 45-46.
Kumar, A. and Kushwaha, H.S. (2006). Response of pigeon pea to sources and levels
of phosphorus under rainfed condition. Indian Journal of Agronomy 51: 60-62.

201
Kumar, N., Prakash V. and Rajput, R. (2007). Effect of phosphorus and sulphur on
growth, yield and nutrient uptake by summer cowpea..National Symposium
on.Legumes.for.Ecological.Sustainability:.Emerging.challenges.and
opportunities held on November 3-5 at II PR, Kanpur. pp. 49-50.
Kumar, S. and Kumar, S. (2013). Effect of phosphorus and sulphur on growth, yield
attributes and yield of pigeon pea. Annals of Plant and Soil Research
15(2): 138-141.
Machado, C.T., Almeida, D.L. and Machado, A.T. (1999). Variability among maize
varieties to phosphorus use efficiency. Bragantia 58(1): 109-124.
Mazaheri, D. and Oveysi, M. (2004). Effects of intercropping on two corn varieties at
various nitrogen levels. Iranian Journal of Agronomy 7: 71-76.
Minot, N. (2010). Staple food prices in Malawi. Prepared for the Comesa policy
seminar on “Variation in staple food prices: causes, consequence, and policy
options”, 25-26 January, Maputo, Mozambique. 1-18pp.
Mligo, J.K. and Craufurd, P.Q. (2005). Adaptation and yield of pigeon pea in different
environments in Tanzania. Field Crops Research 94: 43–53.

202
Munthali, M.G., Gachene,.C.K., Sileshi, G.W. and Karanja, N.K. (2014). Amendment
of Tephrosia improved fallows with inorganic fertilizers improves soil chemical
properties, N uptake, and maize yield in Malawi. International Journal of
Agronomy. 9pp.
Odeny, D.A. (2007). The potential of pigeonpea (Cajanus cajan (L.) Millsp.) in
Africa..Natural Resources Forum 31: 297–305.
Oke, D.O. (2001). Below ground growth characteristics and tree-crop interactions in
some agroforestry systems on a Humid tropical Alfisol. PhD Thesis Federal
University of Technology Akure Nigeria. 113pp.
Olujobi, O.J., Oyun, M. B., and Oke, D.O. (2013). Nitrogen accumulation, growth
and yield of maize in pigeon pea/maize intercrop. Global Journal of Biology
Agriculture and Health Sciences 2(1): 42-48.
Onasanya, R.O., Aiyelari, O.P., Onasanya, A., Oikeh, S., Nwilene, F.E. and Oyelakin,
O.O. (2009). Growth and yield response of maize (Zea mays L.) to different
rates of nitrogen and phosphorus fertilizers in southern Nigeria. World Journal
of Agricultural Sciences 5(4): 400-407.
Parihar, C.M., Kaushik, M.M. and Palsaniya, D.R. (2005). Effect of varieties, plant
density and phosphorus levels on growth and yield of clusterbean [Cyamopsis
tetragonoloba (L.) taub]. Annals of Agricultural Research. New Series 26: 5-7.

203
PDA, (2008). Potash development association. Forage maize fertiliser requirements.
Maize growers association, Town Barton Farm, Sandford, Crediton, Devon.
Leaflet.17..[http://www.pda.org.uk/leaflets/pdf/PDA-lf17.pdf].site.visited.on
.5/25/ 2014.
Peoples, M.B., Herridge, D.F. and Ladha, J.K. (1995). Biological nitrogen fixation: An
efficient source of nitrogen for sustainable agricultural production? Plant and
Soil, 174: 3–28.
Phiri, A.T., Njoloma, J.P., Kanyama-Phiri, G.Y., Sieglinde, S. and Lowole, M.W.
(2010). maize yield response to the combined application of Tundulu rock
phosphate and pigeon pea in Kasungu, central Malawi. African Journal of
Agricultural Research 5(11): 1235-1242.
Phiri, A.T., Njoloma, J.P., Kanyama-Phiri, G.Y., Sieglinde, S. and Lowole, M.W.
(2013). Effects of intercropping systems and the application of Tundulu rock
phosphate on groundnut grain yield in central Malawi. International Journal of
Plant and Animal Sciences 1(1): 11-20.
Phiri, A.T., Weil, R.R., Kanyama-Phiri, G.Y., Msaky, J.J., Mrema, J.P., Grossman, J.
and Harawa, R. (2014). Insitu assessment of soil nitrate-nitrogen in the pigeon
pea-groundnut intercropping-maize rotation system:.Implications on nitrogen
management for increased maize productivity. International Research Journal
of Agricultural Science and Soil Science 4(2): 13-29.

204
Pimratch, S., Jogloy, S., Vorasoot, N., Toomsan, B., Kesmala, T., Patanothai, A. and
Holbrook, C.C. (2008). Effect of drought stress on traits related to N2 fixation
in eleven peanut (Arachis hypogeae L.) genotypes differing in degrees of
resistance todrought. Asian Journal of Plant Science 7(4): 334-342.
Pimratch, S., Vorasoot, N., Toomsan, B., Kesmala, T., Patanothai, A. and Holbrook,
C.C. (2013). Association of nitrogen fixation to water uses efficiency and yield
traits of peanut. International Journal of Plant Production 7(2): 225-242.
Reddy, T.Y., Reddy, V.R. and Anbumozhi, V. (2003). Physiological responses of
groundnut (Arachis hypogea L.) to drought stress and its amelioration: a critical
review. Plant Growth Regulation 41: 75–88.
Reddy, A.S.R., Babu, J.S., Reddy, M.C.S., Khan, M.M. and Rao, M.M. (2011).
Integrated nutrient management in pigeon pea (Cajanus cajan L.). International
Journal of Applied Biology and Pharceutical Technology 2: 462-470.
Sahrawat, K.L., Abekoe, M.K. and Diatta, S. (2001). Application of inorganic
phosphorus fertilizer. In: Sustaining soil fertility in west Africa. Soil Science
Society of America and American Society of Agronomy. SSSA special
publication. 58pp.

205
Sakala, W.D., Cadisch, G. and Giller, K.E. (2000). Interactions between residues of
maize and pigeon pea and mineral N fertilizers during decomposition and N
mineralization. Soil Biology and Biochemistry 32: 679–688.
Singh, F. and Oswalt, D.L. (1995). Groundnut production practices. Skill Development
Series no. 3 Revised ICRISAT. 20pp.
Snapp, S.S. (1998). Phosphorus and sustainability of sub Saharan Africa smallholder
farms, In: Lynch, J.P. and Deikman, J. (Eds.). Phophorus in plant biology:
Regulatory roles in molecular, cellular, organismic and ecosystem processes.
American Society of Plant physiology., Madison, Wiscosin. pp. 59-72.
Snapp, S.S., Rohrbach, D.D., Simtowe, F. and Freeman, H.A. (2002). Sustainable soil
management options for Malawi: Can smallholder farmers grow more legumes?
Agricultural Ecosystem and Environment 91: 159–174.
Snapp, S.S., Jones, R.B., Minja, E.M., Rusike, J. and Silim, S.N. (2003). Pigeon pea for
Africa: A versatile vegetable and more. Horticulture and Science 36(6): 1073-
1078.
Tanguilig, V.C., Yambao, E.B., O’Toole, J.C. and De Datta, S.K., (1987). Water
stress effect on leaf elongation, leaf water potential, transpiration and nutrient
uptake of rice, maize and soy bean. Plant Soil 103: 155-168.

206
Uchida, R.S. (2000). Essential nutrients for plant growth: nutrient functions and
deficiency symptoms. In: Plant nutrient management in Hawaii’s soils.
University of Hawaii, Manoa. pp. 31-55.
Vance, C.P. (2001). Symbiotic nitrogen fixation and phosphorus acquisition:
Plantnutrition in a world of declining renewable resources. Plant Physiology
127: 390–397.
Waddington, S.R. and Karigwindi, J. (2001). Productivity and profitability of maize +
groundnut rotations compared with continuous maize on smallholder farms in
Zimbabwe. Experimental Agriculture 37: 83–98.
Wasonga, C.J., Sigunga, D.O. and Musandu, A.O. (2008). Phosphorus requirements by
maize variaties in different soil types of western Kenya. African Crop.Science
Journal 16(2): 161.

207
CHAPTER 7:
ASSESSMENT OF NITROGEN USE EFFICIENCY IN THE PIGEON PEA-
GROUNDNUT INTERCROP MAIZE ROTATION CROPPING SYSTEM IN
MALAWI
ABSTRACT
An on station experiment was conducted in two seasons (2012/2012 and 2012/2013
cropping seasons) at Chitedze Agricultural Research Station (13o 59’ 23.2” S, 033
o 38’
36.8” E) to assess nitrogen use efficiency (NUE) by maize in the pigeon pea-groundnut
intercrop maize rotation cropping system where N was applied as urea, CO(NH2)2.
Eight treatments replicated three times in a randomized complete block design were
established. Two pigeon pea varieties, long (ICEAP 04000) and medium duration
(ICEAP 00557) and groundnut (CG 7) were grown as monocultures and intercrops in
the 2011/2012 cropping season. The intercrops involved planting of pigeon pea
varieties with groundnut. At harvest legume biomass was incorporated into the soil and
each plot split into four subplots to accommodate four different levels of N (0, 50, 100,
150 kg N ha-1
) applied as top dressing to the succeeding maize crop in the 2012/2013
cropping season. During planting the maize crop was basal dressed with 50 kg P ha-1
.
Top dressing with N was conducted three weeks from emergence. NUE was
determined using the recovery efficiency (RE), agronomic efficiency (AE) and partial
factor productivity (PFP) indices. Under the conditions of this study, RE ranged from
20% to 88%, AE ranged from 7 to 32 kg yield increase per kg of nitrogen applied and
PFP ranged from 27 to 104 kg grain yield per kg N applied. The linear increase in
maize grain yield with application of N and the presence of a diminishing-return
relationship between maize grain yields (grain yield was near the yield potential of the

208
maize variety at high N input) and increasing nitrogen supply, suggest that the RE, AE
and PFP values obtained from this study might apply both to low and high levels of N
use, or at low and high soil N supply for the maize crop. For optimal NUE under low
input agriculture, top dressing with 50 kg N ha-1
could be ideal while for high input
agriculture top dressing with 100 kg N ha-1
seem to be reasonable...................................
Key words: Groundnut, intercrop, maize, nutrient, pigeon pea and rotation

209
7.0 INTRODUCTION
Nutrient use efficiency (NUE) is one of the most important aspects of cropping systems
involving legumes (Makgoga, 2013) since legume biomass incorporation to the soil has
the potential to improve NUE. In Malawi, NUE is on the decrease (Sakala, 2004) as a
result of declining levels of soil organic matter (SOM) and associated deficiencies of
other macro and micronutrients, particulary N, reduced soil buffering and ion retention
capacity and soil moisture (Kumwenda et al., 1995). Prevailing economic conditions in
Malawi have limited the use of mineral fertilizers by smallholder farmers as farmers
have low income. At the same time, annual estimates indicate an increase in nutrient
losses from the farming system through different pathways like leaching and soil
erosion. Total national estimates for annual nutrient losses of around 160,000 metric
tons have been reported, with annual estimates of inorganic fertilizer input into the
farming systems pegged at 70,000 metric tons thus leaving a net imbalance of 90,000
metric tons (Kanyama-Phiri, 2005).
About 52.4% of Malawian population (13 million people) live below the poverty line,
of 1US$/day (GoM, 2006), yet the delivery price for a metric ton of urea from the
ocean ports of East African countries is $770 (Cornway and Waage, 2010), translating
to $38.5/50 kg bag which is beyond the smallholder farmers’ purchasing power.
Conscious of the smallholder farmers’ resource limitations, the Government of Malawi
introduced the targeted fertilizer subsidy program. This program is tailored to reach out
to resource poor smallholder farmers with the aim of boosting agricultural production
at village and national levels. However, many smallholder farmers are not able to
access the facility. This is due to the fact that the quanties of the fertilizers purchased

210
by the Government for the program are usually not enough (Phiri et al., 2010).
Therefore, technologies that can rejuvinate soil fertility under smallholder farms ought
to be developed.
In Malawi, on farm maize grain yields response to the application of N and P from
inorganic fertilizer is low. According to Waddington et al. (2004) this is usually below
20 kg maize grain kg-1
nutrient applied. Limited research in Malawi has shown that the
low maize grain yields response to the application of mineral fertilizer can be increased
through the combined use of organic and inorganic nutrient sources (Sakala et al.,
2004). For example, Sakala et al. (2004) reported that combined application to maize of
organic biomass (from Mucuna puriens at 2.7 tons, Crotalaria juncea at 3 tons and Lab
lab purpureus at 2.7 tons) and inorganic fertilizer (35 and 69 kg N ha-1
) increased NUE
of the maize crop above 20 kg maize grain kg-1
nutrient applied. Unfortunately, these
findings have remained in grey literature primarily because the green manure crops
used by the researchers are not the traditional crops grown by Malawian farmers due to
either their relative edibility (i.e. Mucuna grains have a special preparation recipe) or
inedibility like is the case with Crotalaria juncea. As such efforts to out scale the
technologies have proved to be futile. Further research on NUE therefore, is required
but this time using edible legumes, grown by farmers, that have a high biological N
fixing capacity, for example, the pigeon pea.
Cropping system, N source and method of application have been identified as some of
the major factors influencing NUE for N (NUEN) (Raun and Johnson, 1999). It is on
record that crop rotation has a profound influence on NUE, as it impacts soil mineral N

211
availability and water use and hence the availability of N for plant growth (López-
Bellido and López-Bellido, 2001). Larbi et al., (1993) noted that NUE can be improved
through the combined use of inorganic and organic fertilizers. The improvement in
NUE comes about due to increased supply of nutrients, improved soil buffer capacity,
improved soil water retention and provision of balanced nutrition (Tolessa and Friesen,
2001). Substancial amounts of N from mineralization of decomposed plant biomass
enhance inorganic N availability to growing crops (Omokanye et al., 2011). Cassman et
al. (2002) contended that the overall NUE of a cropping system can be increased by
achieving greater uptake efficiency from applied N, reducing the amount of N lost from
soil organic and inorganic N pools, or both. Mosier et al. (2004) reported four
agronomic indices commonly used to describe NUE: partial factor productivity (PFP)
expresssed as kg crop yield per kg nutrient applied; agronomic efficiency (AE)
expressed as kg crop yield increase per kg nutrient applied); apparent recovery
efficiency (RE) expressed as kg nutrient taken up per kg nutrient applied); and
physiological efficiency (PE) expressed as kg yield increase per kg nutrient taken up).
Genetically, some plant species (Brennan and Bolland, 2007; Rose et al., 2007) and
genotypes within species (Gunes et al., 2006) have the capacity to grow and yield
decently on soils with low available nutrients; such species and genotypes are
considered tolerant to nutrient deficiency (Rengel, 2005; Rengel and Marschner, 2005).
Efficient genotypes have specific physiological mechanisms that allow them to gain
access to sufficient quantities of a specific nutrient and/or effectively utilize amounts
of the absorbed nutrients (Sattelmacher et al. 1994). Nutrient-efficient genotypes are
important because they can produce more yields on soils where the effectiveness of

212
inorganic fertilizers may be constrained by chemical and biological processes (Rengel
and Marschner, 2005).
Agronomically, in cropping systems involving legumes, choice of crop has been
reported to be important for increasing NUE (Thobatsi, 2009). Cropping systems
having crop components with different rooting and nutrient uptake patterns result in
efficient use of nutrients, particularly of N (Makgoga, 2013). In the pigeon pea-
groundnut intercrop-maize rotation cropping system the deep roots of the pigeon pea
absorb nutrients from deeper soil layers, thereby recycling leached nutrients and
reducing competition (Masson et al., 1986). Simultenously, the groundnut (Arachis
hypogaea), possess a unique ability of utilizing soil nutrients that relatively are
unavailable to other crops (Ikisan, 2000). The highlighted facts might be the reason for
the substancial accumulation of nutrients in the biomass of the two legumes in the
pigeon pea-groundnut intercrop (Phiri et al., 2013). The nutrients accumulate or are
partitioned to different parts of the crops for instance, grain, shells and haulms for
groundnut and grain, pods, twigs, leaves (senenced and fresh) stems and roots for the
pigeon pea. For the maize crop, nutrients accumulate in the grain, stover, and rachids.
The grains of these crops are taken from the field for either consumption or sale. As
such in a legume-cereal rotation system not all of the nutrients are returned to the soil
for the succeeding maize crop to benefit and after the maize cropping phase. This
includes nutrients that accumulate in the groundnut shells, pigeon pea pods and maize
rachids. Quantification of nutrient partitioning and hence accumulation in the different
parts of these crops is imperative to bring to light the actual amount of nutrients
returned into the system for the assessment of NUE of the maize crop.

213
An indepth study, therefore, was conducted on station at Chitedze Agricultural
Research Station in Malawi on the pigeon pea groundnut intercropping maize rotation
cropping system with the following objectives; i) determination of the partitioning of
plant N to harvestable grain and plant biomass returned to soil and ii) determination of
NUE of maize in rotation with the legumes as influenced by the incorporation of
pigeon pea biomass and groundnut haulms into the soil.
7.1 MATERIALS AND METHODS
7.1.1 Study site
Details on the location of the study site are as presented in Chapter 2 section 2.1.1.
7.1.2 Field Experiment
Details of the field experiments were as presented in Chapter 2 section 2.1.4.
7.1.3 Treatment plot description and application of triple super phosphate
(Ca(H2PO4)2.H2O) and urea (CO(NH2)2)
Details for treatment plots and application of triple super phosphate and urea were as
presented in Chapter 5 section 5.1.3.
7.2 DATA COLLECTION AND ANALYSIS
7.2.1 Soil sample collection
Details on soil sample collection and preparation were as presented in Chapter 2 under
section 2.1.3.1 and 2.1.3.3.

214
7.2.2 Soil analysis and plant sample analysis
Laboratory soil analysis was conducted as presented in Chapter 2 under section 2.1.3.4.
The plant materials were analysed in the laboratory as described in Chapter 3 under
section 3.2.7.
7.2.3 Biomass and grain yields assessment for the pigeon pea
Details for the assessment of grain and biomass yields for the pigeon pea are as
presented in Chapter 5 under section 5.2.2.
7.2.4 Biomass and grain yields assessment for the groundnut and maize
Details for the assessment of grain and biomass yields for the groundnut and maize are
as presented in Chapter 5 under section 5.2.3.
7.2.5 Nitrogen yields
Nitrogen yields were calculated as presented in Chapter 3 under section 3.2.9.
7.2.6 Assessment of nutrient use efficiency by the maize crop
NUE for each treatment was determined using the recovery efficiency (RE), agronomic
efficiency (AE) and the partial factor productivity (PFP) indices (Dobermann, 2007).
RE (% of applied nutrients) = Nutrient uptake (F)-Nutrient uptake (C)/Quantity of
applied nutrients*100; AE=(Y – Yo)/F and FP=Y/F or PFP = (Yo/F) + AE; Where F =
amount of (fertilizer) nutrient applied (kg ha-1
); Y = Crop yield with applied nutrients
(kg ha-1
) and Yo = crop yield (kg ha-1
) in a control treatment with no nitrogen; C =
Nutrient uptake in a control treatment with no nitrogen. A primary assumption was that
N uptake is the same across the treatments. This assumption was made cautiously since
soil N transformations and root development may differ in the treatment plots (Brye et
al., 2002).

215
7.2.7 Statistical analysis....................................................................................................
Statistical analysis on the soil, biomass, plant N concentrations and yields data was
performed as presented in Chapter 2 under section 2.1.4.2.

216
7.3.RESULTS
7.3.1 Characterization of the soils at the site…………………………………………
Soil laboratory analytical results for the site were as presented in Chapter 2, Tables 2.0,
2.1a and 2.1b, sections 2.2.1 and 2.2.2 and Appendices 2.0-2.1b......................................
7.3.2 Calculated nitrogen yields returnable to the soil………………………………
The pigeon pea biomass yields, N yields for pigeon pea biomass, groundnut haulms
yields, N yields for groundnut haulms and sum total for N yield for the intercrops were
as shown in Table 7.0. Computed total biomass yields indicate significant differences
(p<0.05) across treatment plots. Significantly higher total pigeon pea biomass yields
were registered by the TSP treated medium duration pigeon pea monoculture (4,149 kg
ha-1
). This was significantly lower in the non TSP treated long duration pigeon pea
groundnut intercrop (3,145 kg ha-1
). No significant differences (p>0.05) were observed
in the of groundnut haulms this ranged from 1,396 to 2,463 kg ha-1
. N yields for pigeon
pea biomass ranged from 74.9 to 98.8 kg ha-1
while for groundnut haulms it ranged
from 29 to 52 kg ha-1
. N yields in the intercrops ranged from 103.9 to 128.8 kg N ha-1
.

217
Table 7.0: Calculated amount of biomass and N returned to the soil by the monoculture
and intercrop of groundnut and pigeon pea
Treatment TTBYPP
kg ha-1
PP-N yield
kg ha-1
Haulms
yield kg ha-1
GH-N yield
kg ha-1 H
TTC-N
yield kg
ha-1
1. Medium duration pigeon pea + groundnut 3,796 98.8 1,516 30 128.8
2. Long duration pigeon pea + 25 kg P ha-1
3,337 87.2 - - 87.2
3.Groundnut + 25 kg P ha-1
- - 2,463 52 52.0
4. Medium duration pigeon pea only 3,727 87 - - 87.0
5. Long duration pigeon pea + groundnut 3,145 74.9 1,396 29 103.9
6. Medium duration pigeon pea + 25 kg P ha-1
4,149 95.6 1,173 - 95.6
7. Long duration pigeon pea + groundnut + 25 kg P ha-1
3,603 95.4 1,727 33 128.4
8. Medium duration pigeon pea + groundnut + 25 kg P ha-1
3,861 97.3 1,412 31 128.3
9.Sole groundnut - - 1,752 40 40.0
10. Long duration pigeon pea only 3,332 79.7 - - 79.7
GM 3,619 89.5 1,634 43 93.1
CV (%) 10.2 - 41.7 38.3 -
LSD0.05 681 - - - -
TTBYPP=total biomass yield for pigeon pea; PP=pigeon pea; GH=groundnut haulms; TTC=total yield for the cropping system

218
7.3.3 Maize yields
The maize grain yields, nitrogen concentrations and yields in the grain in season two
for treatments of the subplots in the main treatment plots, were as presented in Table
7.1 and Appendix 6.2b.
Grain yields for the subplots of the main treatment that had sole maize during season
one without incorporation of stover into the soil at harvest were in the order; 150 kg N
ha-1
(4,106 kg ha-1
) > 100 kg N ha-1
(3,346 kg ha-1
) > 50 kg N ha-1
(2,188 kg ha-1
) > 0
kg N ha-1
(1,775 kg ha-1
); while N concentrations in the grains were in the order; 100
kg N ha-1
(1.5%) > 150 kg ha-1
, 50 kg N ha-1
, 0 kg N ha-1
(1.3%) and N yields were in
the order; 150 kg N ha-1
(55 kg N ha-1
) > 100 kg N ha-1
(49 kg N ha-1
) > 50 kg N ha-1
(28 kg N ha-1
) > 0 kg N ha-1
(23 kg N ha-1
). Grain yields for the subplots of the main
treatment that had medium duration pigeon pea monoculture during season one with
biomass incorporated into the soil at harvest were in the order; 150 kg N ha-1
(5, 404kg
ha-1
) > 100 kg N ha-1
(4,391 kg ha-1
) > 50 kg N ha-1
(3,700 kg ha-1
) > 0 kg N ha-1
(2,
410 kg ha-1
); while N concentrations in the grains were in the order; 150 kg N ha-1
,100
kg ha-1
(2.3%), 0 kg N ha-1
(1.2%) > 50 kg N ha-1
(1.1%) and N yields were in the order;
150 kg N ha-1
(67 kg N ha-1
) > 100 kg N ha-1
(54 kg N ha-1
) > 50 kg N ha-1
(41 kg N ha-
1) > 0 kg N ha
-1 (28 kg N ha
-1).
Grain yields for the subplots of the main treatment that had long duration pigeon pea
monoculture during season one with biomass incorporated into the soil at harvest were
in the order; 150 kg N ha-1
(5, 453 kg ha-1
) > 100 kg N ha-1
(4,691 kg ha-1
) > 50 kg N
ha-1
(4,621 kg ha-1
) > 0 kg N ha-1
(4,365 kg ha-1
); while N concentrations in the grains
219
were in the order; 150 kg N ha-1
(1.9%) > 100 kg ha-1
(1.7%) > 50 kg N ha-1
, 0 kg N
ha-1
(1.2%) and N yields were in the order; 150 kg N ha-1
(104 kg N ha-1
) > 100 kg N ha-
1 (81 kg N ha
-1) > 50 kg N ha
-1 (55 kg N ha
-1) > 0 kg N ha
-1 (54 kg N ha
-1). Grain yields
for the subplots of the main treatment that had sole groundnut during season one with
biomass incorporated into the soil at harvest were in the order; 150 kg N ha-1
(5,806 kg
ha-1
) > 100 kg N ha-1
(5,314 kg ha-1
) > 0 kg N ha-1
> (3,034 kg ha-1
) > 50 kg N ha-1
(3,010 kg ha-1
); while N concentrations in the grains were in the order; 150 kg N ha-1
(2.0%) > 100 kg ha-1
(1.8%) > 0 kg N ha-1
(1.4%) > 50 kg N ha-1
(1.3%) and N yields
were in the order; 150 kg N ha-1
(115 kg N ha-1
) > 100 kg N ha-1
(98 kg N ha-1
) > 0 kg
N ha-1
(43 kg N ha-1
) > 50 kg N ha-1
(38 kg N ha-1
).
Grain yields for the subplots of the main treatment that had medium duration pigeon
pea-groundnut intercrop during season one with biomass incorporated into the soil at
harvest were in the order; 150 kg N ha-1
(5,636 kg ha-1
) > 100 kg N ha-1
(4,956 kg ha-1
)
> 50 kg N ha-1
> (4,509 kg ha-1
) > 0 kg N ha-1
(4,266 kg ha-1
); while N concentrations
in the grains were in the order; 100 kg N ha-1
(1.7%) > 150 kg ha-1
, 0 kg N ha-1
(1.5%)
> 50 kg N ha-1
(1.2%) and N yields were in the order; 150 kg N ha-1
(85 kg N ha-1
) >
100 kg N ha-1
(84 kg N ha-1
) > 0 kg N ha-1
(62 kg N ha-1
) > 50 kg N ha-1
(55 kg N ha-1
).
Grain yields for the subplots of the main treatment that had long duration pigeon pea-
groundnut intercrop during season one with biomass incorporated into the soil at
harvest were in the order; 100 kg N ha-1
(5, 217 kg ha-1
) > 50 kg N ha-1
(5,184 kg ha-1
)
> 150 kg N ha-1
(4,625 kg ha-1
) > 0 kg N ha-1
(3,333 kg ha-1
); while N concentrations in
the grains were in the order; 0 kg N ha-1
(1.8%) > 150 kg ha-1
(1.7%) > 100 kg N ha-1
,

220
50 kg N ha-1
(1.6%) and N yields were in the order; 100 kg N ha-1
(86 kg N ha-1
) > 50
kg N ha-1
(84 kg N ha-1
) > 150 kg N ha-1
(76 kg N ha-1
) > 0 kg N ha-1
(59 kg N ha-1
).
Grain yields for the subplots of the main treatment that had medium duration pigeon
pea-groundnut intercrop during season one with no biomass incorporated into the soil
at harvest were in the order; 150 kg N ha-1
(5,308 kg ha-1
) > 100 kg N ha-1
(5,185 kg ha-
1) > 0 kg N ha
-1 (3,007 kg ha
-1) > 50 kg N ha
-1 (2,845 kg ha
-1); while N concentrations
in the grains were in the order; 150 kg N ha-1
, 100 kg ha-1
(1.7%) > 50 kg N ha-1
(1.6%)
> 0 kg N ha-1
(1.5%) and N yields were in the order; 150 kg N ha-1
(71 kg N ha-1
) > 100
kg N ha-1
(56 kg N ha-1
) > 50 kg N ha-1
(36 kg N ha-1
) > 0 kg N ha-1
(34 N kg ha-1
).
Grain yields for the subplots of the main treatment that had long duration pigeon pea-
groundnut intercrop during season one with no biomass incorporated into the soil at
harvest were in the order; 150 kg N ha-1
(4,235 kg ha-1
) > 100 kg N ha-1
(3,352 kg ha-1
)
> 0 kg N ha-1
(2,226 kg ha-1
) > 50 kg N ha-1
(2,163 kg ha-1
); while N concentrations in
the grains were in the order; 150 kg N ha-1
(2.1%) > 100 kg ha-1
(1.8%) > 50 kg N ha-1
,
0 kg N ha-1
(1.4%) and N yields were in the order; 150 kg N ha-1
(110 kg N ha-1
) > 100
kg N ha-1
(91 kg N ha-1
) > 0 kg N ha-1
(43 kg N ha-1
) > 50 kg N ha-1
(40 kg N ha-1
).

221
Table 7.1: Nitrogen concentrations and yields: maize grain, main experiment,
second season
Treatments: Main and sub plots
1.
Maize grain
yield kg ha-1
N (%)
N yield
kg ha-1
a.Sole Maize-No biomass 1,775 1.3 23
b.Sole Maize-No biomass + 100 kg N ha-1 3,346 1.5 49
c.Sole Maize-No biomass + 150 kg N ha-1 4,106 1.3 55
d.Sole Maize-No biomass + 50 kg N ha-1 2,188 1.3 28
2.
a.Medium duration pigeon pea-biomass 2,410 1.2 28
b.Medium duration pigeon pea-biomass + 100 kg N ha-1 4,391 1.2 54
c.Medium duration pigeon pea-biomass + 150 kg N ha-1 5,404 1.2 67
d.Medium duration pigeon pea-biomass + 50 kg N ha-1 3,700 1.1 41
3.
a.Long duration pigeon pea-biomass 4,365 1.2 54
b.Long duration pigeon pea-biomass + 100 kg N ha-1 4,691 1.7 81
c.Long duration pigeon pea-biomass + 150 kg N ha-1 5,453 1.9 104
d.Long duration pigeon pea-biomass + 50 kg N ha-1 4,621 1.2 55
4.
a. Sole groundnut-biomass 3,034 1.4 43
b.Sole groundnut-biomass + 100 kg N ha-1 5,314 1.8 98
c.Sole groundnut-biomass + 150 kg N ha-1 5,806 2.0 115
d.Sole groundnut-biomass + 50 kg N ha-1 3,010 1.3 38
5.
a.Medium duration pigeon pea + groundnut-biomass 4,266 1.5 62
b.Medium duration pigeon pea + groundnut-biomass + 100 kg N ha-1 4,956 1.7 84
c.Medium duration pigeon pea + groundnut-biomass + 150 kg N ha-1 5,636 1.5 85
d.Medium duration pigeon Pea + groundnut-biomass + 50 kg N ha-1 4,509 1.2 55
6.
a.Long duration pigeon pea + groundnut-biomass 3,333 1.8 59
b.Long duration pigeon pea + groundnut-biomass + 100 kg N ha-1 5,217 1.6 86
c.Long duration pigeon pea + groundnut-biomass + 150 kg N ha-1 4,625 1.7 76
d.Long duration pigeon pea + groundnut-biomass + 50 kg N ha-1 5,184 1.6 84

222
7.
Maize grain
yield kg ha-1
N (%)
N yield
kg ha-1
a.Medium duration pigeon pea + groundnut-no biomass 2,226 1.5 34
b.Medium duration pigeon pea + groundnut-no biomass + 100 kg N ha-1 3,352 1.7 56
c.Medium duration pigeon pea + groundnut-no biomass + 150 kg N ha-1 4,235 1.7 71
d.Medium duration pigeon pea + groundnut-no biomass + 50 kg N ha-1 2,163 1.6 36
8.
a.Long duration pigeon pea + groundnut-no biomass 3,007 1.4 43
b.Long duration pigeon pea + groundnut-no biomass + 100 kg N ha-1 5,185 1.8 91
c.Long duration pigeon pea + groundnut-no biomass + 150 kg N ha-1 5,308 2.1 110
d.Long duration pigeon pea + groundnut-no biomass + 50 kg N ha-1 2,845 1.4 40
GM 4052 1.5 63
CV (%) 21.6 27.96 38.7
LSD0.05 1,425 0.70 52
The yields for maize stover, nitrogen concentrations and yields in season two for
treatments of the subplots in the main treatment plots were as presented in Table 7.2
and Appendix 6.2c.
Stover yields for the subplots of the main treatment that had sole maize during season
one without incorporating of stover into the soil at harvest were in the order; 150 kg N
ha-1
(3,006 kg ha-1
) > 50 kg N ha-1
(2,587 kg ha-1
) > 100 kg N ha-1
(2,579 kg ha-1
) > 0
kg N ha-1
(2,272 kg ha-1
; while N concentrations in the stover were in the order; 150 kg
N ha-1
(0.8%) > 50 kg ha-1
(0.7%) > 100 kg N ha-1
(0.6%) > 0 kg N ha-1
(0.1%) and N
yields were in the order; 150 kg N ha-1
(23.8 kg ha-1
) > 50 kg N ha-1
(17.5 kg ha-1
) >
100 kg N ha-1
(14.5 kg ha-1
) > 0 kg N ha-1
(2.3 kg ha-1
). Stover yields for the subplots
of the main treatment that had medium duration pigeon pea monoculture during season
one with biomass incorporated into the soil at harvest were in the order; 100 kg N ha-1

223
(3,360 kg ha-1
) > 50 kg N ha-1
(3,326 kg ha-1
) > 150 kg N ha-1
(2,944 kg ha-1
) > 0 kg N
ha-1
(2, 026 kg ha-1
); while N concentrations in the stover were in the order; 100 kg N
ha-1
, 0 kg N ha-1
(0.8%) > 150 kg ha-1
, 50 kg N ha-1
and N yields were in the order; 100
kg N ha-1
(2.7 kg N ha-1
) > 0 kg N ha-1
(16.1 kg N ha-1
) > 50 kg N ha-1
(14.3 kg N ha-1
)
> 150 kg N ha-1
(13.2 kg N ha-1
). Stover yields for the subplots of the main treatment
that had long duration pigeon pea monoculture during season one with biomass
incorporated into the soil at harvest were in the order; 50 kg N ha-1
(3,731 kg ha-1
) >
150 kg N ha-1
(3,232 kg ha-1
) > 100 kg N ha-1
(3,222 kg ha-1
) > 0 kg N ha-1
(2, 896 kg
ha-1
); while N concentrations in the stover were in the order; 150 kg N ha-1
(0.6%) >
100 kg ha-1
(0.4%) > 50 kg N ha-1
, 0 kg N ha-1
(0.2%) and N yields were in the order;
150 kg N ha-1
(18.2 kg N ha-1
) > 100 kg N ha-1
(14.4 kg N ha-1
) > 50 kg N ha-1
(8.1 kg
N ha-1
) > 0 kg N ha-1
(6.3 kg N ha-1
).
Stover yields for the subplots of the main treatment that had sole groundnut during
season one with biomass incorporated into the soil at harvest were in the order; 150 kg
N ha-1
(4,413 kg ha-1
) > 100 kg N ha-1
(3,086 kg ha-1
) > 0 kg N ha-1
(2,814 kg ha-1
) > 50
kg N ha-1
(2,684 kg ha-1
); while N concentrations in the stover were in the order; 100
kg N ha-1
(0.8%) > 150 kg ha-1
(0.6%) > 0 kg N ha-1
(0.3%) > 50 kg N ha-1
(0.2%) and
N yields were in the order; 150 kg N ha-1
(24.8 kg N ha-1
) > 100 kg N ha-1
(24.5 kg N
ha-1
) > 0 kg N ha-1
(9.3 N kg ha-1
) > 50 kg N ha-1
> (5.8 N kg ha-1
). Stover yields for the
subplots of the main treatment that had medium duration pigeon pea-groundnut
intercrop during season one with biomass incorporated into the soil at harvest were in
the order; 150 kg N ha-1
(4,146 kg ha-1
) > 50 kg N ha-1
(3,684 kg ha-1
) > 100 kg N ha-1
> (3,592 kg ha-1
) > 0 kg N ha-1
(3,023 kg ha-1
); while N concentrations in the stover

224
were in the order; 150 kg N ha-1
, 100 kg ha-1
(0.4%) > 50 kg N ha-1
, 0 kg N ha-1
(0.3%)
and N yields were in the order; 150 kg N ha-1
(17.1 kg N ha-1
) > 100 kg N ha-1
(16.1 N
kg ha-1
) > 50 kg N ha-1
(12.2 kg N ha-1
) > 0 kg N ha-1
(10 kg N ha-1
).
Stover yields for the subplots of the main treatment that had long duration pigeon pea-
groundnut intercrop during season one with biomass incorporated into the soil at
harvest were in the order; 50 kg N ha-1
(4,022 kg ha-1
) > 100 kg N ha-1
(3,810 kg ha-1
) >
150 kg N ha-1
(3,105 kg ha-1
) > 0 kg N ha-1
(2,179 kg ha-1
); while N concentrations in
the stover were in the order; 100 kg N ha-1
(0.8%) > 50 kg ha-1
(0.6%) > 150 kg N ha-1
(0.4%) > 0 kg N ha-1
(0.2%) and N yields were in the order; 100 kg N ha-1
(32 kg N ha-1
)
> 50 kg N ha-1
(24.6 kg N ha-1
) > 150 kg N ha-1
(13.6 kg N ha-1
) 0 kg N ha-1
(3.3 kg N
ha-1
).
Stover yields for the subplots of the main treatment that had medium duration pigeon
pea-groundnut intercrop during season one with no biomass incorporated into the soil
at harvest were in the order; 150 kg N ha-1
(3,308 kg ha-1
) > 50 kg N ha-1
(3,157kg ha-1
)
> 0 kg N ha-1
(2,538 kg ha-1
) > 100 kg N ha-1
(2,520 kg ha-1
); while N concentrations
in the stover were in the order; 150 kg N ha-1
(1.0%) > 100 kg ha-1
, 50 kg N ha
-1 (0.3%)
> 0 kg N ha-1
(0.2%) and N yields were in the order; 150 kg N ha-1
(33.2 kg N ha-1
) > 50
kg N ha-1
(9.9 kg N ha-1
) > 100 kg N ha-1
(79 kg N ha-1
) > 0 kg N ha-1
(5.1 kg N ha-1
)
Stover yields for the subplots of the main treatment that had long duration pigeon pea-
groundnut intercrop during season one with no biomass incorporated into the soil at
harvest were in the order; 150 kg N ha-1
(3,254 kg ha-1
) > 100 kg N ha-1
(3,167kg ha-1
)

225
> 50 kg N ha-1
(2,670 kg ha-1
) > 0 kg N ha-1
(2,556 kg ha-1
); while N concentrations in
the stover were in the order; 100 kg N ha-1
(0.9%) > 150 kg ha-1
(0.4%) > 50 kg N ha-1
(0.3%) > 0 kg N ha-1
(0.1%) and N yields were in the order; 100 kg N ha-1
(28.4 kg N
ha-1
) > 150 kg N ha-1
(14.3 kg N ha-1
) > 50 kg N ha-1
(8.9 kg N ha-1
) > 0 kg N ha-1
(2.6
kg N ha-1
).

226
Table 7.2: Nitrogen concentrations and yields: Maize stover, main experiment,
second season
Treatments: Main and sub plots
1.
Stover
yield kg ha-1
N (%)
N yield
kg ha-1
a.Sole Maize-No biomass 2,272 0.1 2.3
b.Sole Maize-No biomass + 100 kg N ha-1 2,579 0.6 14.5
c.Sole Maize-No biomass + 150 kg N ha-1 3,006 0.8 23.8
d.Sole Maize-No biomass + 50 kg N ha-1 2,587 0.7 17.5
2.
a.Medium duration pigeon pea-biomass 2,029 0.8 16.1
b.Medium duration pigeon pea-biomass + 100 kg N ha-1 3,360 0.8 27.0
c.Medium duration pigeon pea-biomass + 150 kg N ha-1 2,944 0.4 13.2
d.Medium duration pigeon pea-biomass + 50 kg N ha-1 3,326 0.4 14.3
3.
a.Long duration pigeon pea-biomass 2,896 0.2 6.3
b.Long duration pigeon pea-biomass + 100 kg N ha-1 3,222 0.4 14.4
c.Long duration pigeon pea-biomass + 150 kg N ha-1 3,232 0.6 18.2
d.Long duration pigeon pea-biomass + 50 kg N ha-1 3,731 0.2 8.1
4.
a. Sole groundnut-biomass 2,814 0.3 9.3
b.Sole groundnut-biomass + 100 kg N ha-1 3,089 0.8 24.5
c.Sole groundnut-biomass + 150 kg N ha-1 4,413 0.6 24.8
d.Sole groundnut-biomass + 50 kg N ha-1 2,684 0.2 5.8
5.
a.Medium duration pigeon pea + groundnut-biomass 3,023 0.3 10.0
b.Medium duration pigeon pea + groundnut-biomass + 100 kg N ha-1 3,592 0.4 16.1
c.Medium duration pigeon pea + groundnut-biomass + 150 kg N ha-1 4,146 0.4 17.1
d.Medium duration pigeon pea + groundnut-biomass + 50 kg N ha-1 3,684 0.3 12.2
6.
a.Long duration pigeon pea + groundnut-biomass 2,179 0.2 3.3
b.Long duration pigeon pea + groundnut-biomass + 100 kg N ha-1 3,810 0.8 32.0
c.Long duration pigeon pea + groundnut-biomass + 150 kg N ha-1 3,105 0.4 13.6
d.Long duration pigeon pea + groundnut-biomass + 50 kg N ha-1 4,022 0.6 24.6

227
7.
Stover
yield kg ha-1
N (%)
N yield
kg ha-1
a.Medium duration pigeon pea + groundnut-no biomass 2,538 0.2 5.1
b.Medium duration pigeon pea + groundnut-no biomass + 100 kg N ha-1 2,520 0.3 7.9
c.Medium duration pigeon pea + groundnut-no biomass + 150 kg N ha-1 3,308 1.0 33.2
d.Medium duration pigeon pea + groundnut-no biomass + 50 kg N ha-1 3,157 0.3 9.9
8.
a.Long duration pigeon pea + groundnut-no biomass 2,556 0.1 2.6
b.Long duration pigeon pea + groundnut-no biomass + 100 kg N ha-1 3,167 0.9 28.4
c.Long duration pigeon pea + groundnut-no biomass + 150 kg N ha-1 3,254 0.4 14.3
d.Long duration pigeon pea + groundnut-no biomass + 50 kg N ha-1 2,670 0.3 8.9
GM 3,091 0.5 15.0
CV (%) 32.7 28.7 46.1
LSD0.05 1,649 0.5 23.3
The yield for maize rachids, nitrogen concentrations and yields in season two for
treatments of the subplots in the main treatment plots were as presented in Table 7.3,
Appendix 6.2d.
Rachids yields for the subplots of the main treatment that had sole maize during season
one without incorporation of stover into the soil at harvest were in the order; 150 kg N
ha-1
(1,012 kg ha-1
) > 0 kg N ha-1
(774 kg ha-1
) > 100 kg N ha-1
(679 kg ha-1
) > 50 kg N
ha-1
> (661kg ha-1
); while N concentrations in the rachids were in the order; 50 kg N ha-
1 (0.5%) > 100 kg ha
-1, 0 kg N ha
-1 (0.2%) > 150 kg N ha
-1(0.1%) and N yields were in
the order; 50 kg N ha-1
(3.0 kg ha-1
) > 100 kg N ha-1
(1.6 kg N ha-1
) > 0 kg N ha-1
(1.4
kg N ha-1
) > 150 kg N ha-1
(1.0 kg N ha-1
). Rachids yields for the subplots of the main
treatment that had medium duration pigeon pea monoculture during season one with
biomass incorporated into the soil at harvest were in the order; 50 kg N ha-1
(1,178 kg

228
ha-1
) > 0 kg N ha-1
(1,013 kg ha-1
) > 100 kg N ha-1
(953 kg ha-1
) > 150 kg N ha-1
> (669
kg ha-1
); while N concentration in the rachids was at; 50 kg N ha-1
(0.4%) and N yield
was at 50 kg N ha-1
(5.1 kg N ha-1
). N concentrations and yields for other treatments
were not determined.
Rachid yields for the subplots of the main treatment that had long duration pigeon pea
monoculture during season one with biomass incorporated into the soil at harvest were
in the order; 100 kg N ha-1
(1,076 kg ha-1
) > 150 kg N ha-1
(1,027 kg ha-1
) > 0 kg N ha-1
(1,025 kg ha-1
) > 50 kg N ha-1
> (1,019 kg ha-1
); while N concentrations in the rachids
were in the order; 50 kg N ha-1
(0.3%) > 0 kg ha-1
(0.2%) > 150 kg N ha-1
, 100 kg N
ha-1
(0.1%) and N yields were in this order; 50 kg N ha-1
(3.9 kg N ha-1
) > 0 kg N ha-1
(2.3 kg N ha-1
) > 100 kg N ha-1
(1.4 kg N ha-1
) > 150 kg N ha-1
(0.9 kg N ha-1
). Rachids
yields for the subplots of the main treatment that had sole groundnut during season one
with biomass incorporated into the soil at harvest were in the order; 150 kg N ha-1
(1,235 kg ha-1
) > 100 kg N ha-1
(1,150 kg ha-1
) > 50 kg N ha-1
(657 kg ha-1
)> 0 kg N ha-
1 (641 kg ha
-1); while N concentrations in the rachids were in the order; 150 kg N ha
-1,
50 kg ha-1
(0.4%) > 100 kg N ha-1
, 0 kg N ha-1
(0.3%) and N yields were in the order;
150 kg N ha-1
(4.3 kg N ha-1
) > 100 kg N ha-1
(2.9 kg N ha-1
) > 50 kg N ha-1
(2.5 kg N
ha-1
) > 0 kg N ha-1
(2.2 kg N ha-1
).
Rachids yields for the subplots of the main treatment that had medium duration pigeon
pea-groundnut intercrop during season one with biomass incorporated into the soil at
harvest were in the order; 100 kg N ha-1
(1,155 kg ha-1
) > 50 kg N ha-1
(817 kg ha-1
) >
150 kg N ha-1
(777 kg ha-1
) > 0 kg N ha-1
(671 kg ha-1
); while N concentrations in the
rachids were in the order; 50 kg N ha-1
, 0 kg ha-1
(0.4%) > 100 kg N ha-1
(0.3%) > 150

229
kg N ha-1
(0.2%) and N yields were in the order; 100 kg N ha-1
(3.2 kg N ha-1
) > 50 kg
N ha-1
(3.1 kg N ha-1
) > 0 kg N ha-1
(3.0 kg N ha-1
) > 150 kg N ha-1
(1.5 kg N ha-1
).
Rachid yields for the subplots of the main treatment that had long duration pigeon pea-
groundnut intercrop during season one with biomass incorporated into the soil at
harvest were in the order; 100 kg N ha-1
(1,088 kg ha-1
) > 150 kg N ha-1
(936 kg ha-1
) >
50 kg N ha-1
(749 kg ha-1
) > 0 kg N ha-1
(631 kg ha-1
); while N concentrations in the
rachids were in the order; 0 kg N ha-1
(0.3%) > 100 kg ha-1
, 50 kg N ha-1
(0.2%) > 0 kg
N ha-1
(0.1%) and N yields were in the order; 100 kg N ha-1
(2.0 kg N ha-1
) > 50 kg N
ha-1
(1.8 kg N ha-1
) > 0 kg N ha-1
(1.7 kg N ha-1
) > 150 kg N ha-1
(0.9 kg N ha-1
).
Rachids yields for the subplots of the main treatment that had medium duration pigeon
pea-groundnut intercrop during season one with no biomass incorporated into the soil
at harvest were in the order; 100 kg N ha-1
(918 kg ha-1
) > 50 kg N ha-1
(810 kg ha-1
) >
150 kg N ha-1
(803 kg ha-1
) > 0 kg N ha-1
(405 kg ha-1
); while N concentrations in the
rachids were in the order; 100 kg N ha-1
(0.4%) > 50 kg ha-1
(0.3%) > 0 kg N ha-1
(0.2%) > 150 kg N ha-1
(0.1%) and N yields were in the order; 100 kg N ha-1
(3.2 kg N
ha-1
) > 50 kg N ha-1
(2.5 kg N ha-1
) > 0 kg N ha-1
(0.9 kg N ha-1
) > 150 kg N ha-1
(0.8
kg N ha-1
). Rachids yields for the subplots of the main treatment that had long duration
pigeon pea-groundnut intercrop during season one with no biomass incorporated into
the soil at harvest were in the order; 50 kg N ha-1
(1,070 kg ha-1
) > 150 kg N ha-1
(856
kg ha-1
) > 100 kg N ha-1
(635 kg ha-1
) > 0 kg N ha-1
(541 kg ha-1
); while N
concentrations in the rachids were in the order; 150 kg N ha-1
, 100 kg N ha-1
, 50 kg N
ha-1
(0.3%) > 0 kg N ha-1
(0.1%) and N yields were in the order; 50 kg N ha-1
(2.7 kg N
ha-1
) > 150 kg N ha-1
(2.4 kg ha-1
) > 100 kg N ha-1
(1.9 kg ha-1
) > 0 kg N ha-1
(0.7 kg N
ha-1
).

230
Table 7.3: Nitrogen concentrations and yields: maize rachids, main experiment,
second season
Treatments: Main and sub plots
1.
Rachids
yield kg ha-1
N (%)
N yield
kg ha-1
a.Sole Maize-no biomass 774 0.2 1.4
b.Sole Maize-no biomass + 100 kg N ha-1 679 0.2 1.6
c.Sole Maize-no biomass + 150 kg N ha-1 1,012 0.1 1.0
d.Sole Maize-no biomass + 50 kg N ha-1 661 0.5 3.0
2.
a.Medium duration pigeon pea-biomass 1,013 ND ND
b.Medium duration pigeon pea-biomass + 100 kg N ha-1 953 ND ND
c.Medium duration pigeon pea-biomass + 150 kg N ha-1 669 ND ND
d.Medium duration pigeon pea-biomass + 50 kg N ha-1 1,178 0.4 5.1
3.
a.Long duration pigeon pea-biomass 1,025 0.2 2.3
b.Long duration pigeon pea-biomass + 100 kg N ha-1 1,076 0.1 1.4
c.Long duration pigeon pea-biomass + 150 kg N ha-1 1,027 0.1 0.9
d.Long duration pigeon pea-biomass + 50 kg N ha-1 1,019 0.3 3.9
4.
a. Sole groundnut-biomass 641 0.3 2.2
b.Sole groundnut-biomass + 100 kg N ha-1 1,150 0.3 2.9
c.Sole groundnut-biomass + 150 kg N ha-1 1,235 0.4 4.3
d.Sole groundnut-biomass + 50 kg N ha-1 657 0.4 2.5
5.
a.Medium duration pigeon pea + groundnut-biomass 671 0.4 3.0
b.Medium duration pigeon pea + groundnut-biomass + 100 kg N ha-1 1,155 0.3 3.2
c.Medium duration pigeon pea + groundnut-biomass + 150 kg N ha-1 777 0.2 1.5
d.Medium duration pigeon pea + groundnut-biomass + 50 kg N ha-1 817 0.4 3.1
6.
a.Long duration pigeon pea + groundnut-biomass 630 0.3 1.7
b.Long duration pigeon pea + groundnut-biomass + 100 kg N ha-1 1,088 0.2 2.0
c.Long duration pigeon pea + groundnut-biomass + 150 kg N ha-1 936 0.1 0.9
d.Long duration pigeon pea + groundnut-biomass + 50 kg N ha-1 749 0.2 1.8

231
7.
Rachids
yield kg ha-1
N (%)
N yield
kg ha-1
a.Medium duration pigeon pea + groundnut-no biomass 405 0.2 0.9
b.Medium duration pigeon pea + groundnut-no biomass + 100 kg N ha-1 918 0.4 3.2
c.Medium duration pigeon pea + groundnut-no biomass + 150 kg N ha-1 803 0.1 0.8
d.Medium duration pigeon pea + groundnut-no biomass + 50 kg N ha-1 810 0.3 2.5
8.
a.Long duration pigeon pea + groundnut-no biomass 541 0.1 0.7
b.Long duration pigeon pea + groundnut-no biomass + 100 kg N ha-1 635 0.3 1.9
c.Long duration pigeon pea + groundnut-no biomass + 150 kg N ha-1 856 0.3 2.4
d.Long duration pigeon pea + groundnut-no biomass + 50 kg N ha-1 1,070 0.3 2.7
GM 863 0.3 2.2
CV (%) 41.6 47.31 39.2
LSD0.05 586 0.3 -
ND= not determined
The calculated total N yields in the maize plant, N inputs to the soil by different legume
cropping systems, N inputs to the soil through urea, total N inputs, the N recovery and
agronomic use efficiencies were as presented in Table 7.4. The amount of N input
through urea was as presented in the subplot treatment structure. The sum total of N
yields in the maize plant, being a sum of nitrogen yields for grain, stover and rachids
has been presented alongside with the computed N recovery (RE) agronomic use
efficiency (AE) and the partial productivity factor (PFP).
N inputs to the maize plants for the subplots of the main treatment that had sole maize
during season one without incorparation of stover into the soil at harvest were
according to the treatment structure. Total N yield for the maize plants were in the
order; no biomass + 150 kg N ha-1
(79.8 kg N ha-1
) > no biomass + 100 kg N ha-1
(65.1
kg N ha-1
) > no biomass + 50 kg N ha-1
(48.5 kg N ha-1
) > 0 kg N ha-1
(26.7 kg N ha-1
);
while REs were in this order; no biomass + 50 kg N ha-1
(44%) > no biomass + 100 kg

232
N ha-1
(38% ) > no biomass + 150 kg N ha-1
(35%); AEs were in this order; no biomass
+ 150 kg N ha-1
, 100 kg N ha-1
(16 kg G kg-1
N ) > no biomass + 50 kg N ha-1
(8 kg G
kg-1
N); and PFPs were in the order; no biomass + 50 kg N ha-1
(44 kg G kg-1
N) > no
biomass + 100 kg N ha-1
(33 kg G kg-1
N) > no biomass + 50 kg N ha-1
(27 kg G kg-1
N)
> 150 kg N ha-1
(33 kg G kg-1
N).
Total N inputs from mineral fertilizer and biomass to the maize plants for the subplots
of the main treatment that had medium duration pigeon pea monoculture during season
one with biomass incorporated into the soil at harvest were only computed for the
subplots treated with 50 kg N ha-1
. This was at 141 kg N ha-1
with biomass contributing
91 kg N ha-1
. N yields from legume biomass in the other subplots were not calculated
due to lack of data on pigeon pea biomass yield. Additionally, total N yield for maize
plants was not calculated due to lack of data on N yield for rachids.NUEs for the
subplots treated with 50 kg N ha-1
were as follows; RE (24%) AE (141 kg G kg-1
N) and
PFP (74 kg G kg-1
N).
Total N inputs from mineral fertilizer and biomass to the maize plants for the subplots
of the main treatment that had long duration pigeon pea monoculture during season one
with biomass incorporated into the soil at harvest were in the order; biomass + 150 kg
N ha-1
(233 kg N ha-1
) > biomass + 100 kg N ha-1
(183 kg N ha-1
) > biomass + 50 kg N
ha-1
(133 kg N ha-1
) > biomass only (83 kg N ha-1
); while total N yield for the maize
plants were in the order; biomass + 150 kg N ha-1
(123.1 kg N ha-1
) > biomass + 100 kg
N ha-1
(96 kg N ha-1
) > biomass + 50 kg N ha-1
(67 kg N ha-1
) > biomass only (62.6 kg
ha-1
); REs were in this order; biomass only (43%) > biomass + 150 kg N ha-1
(41%) >
biomass + 100 kg N ha-1
(38%) > biomass 50 kg N ha-1
(30%); AEs were in the order;

233
biomass only (31 kg G kg-1
N) > biomass + 150 kg N ha-1
, biomass + 100 kg N ha-1
(16
kg G kg-1
N) > biomass + 50 kg N ha-1
(21 kg G kg-1
N); and PFPs were in this order;
biomass + 50 kg N ha-1
(92 kg G kg-1
N) > biomass + 100 kg N ha-1
(47 kg G kg-1
N) >
biomass + 150 kg N ha-1
(92 kg G kg-1
N).
Total N inputs from mineral fertilizer and biomass to the maize plants for the subplots
of the main treatment that had sole groundnut during season one with biomass
incorporated into the soil at harvest were in the order; biomass + 150 kg N ha-1
(196 kg
N ha-1
) > biomass + 100 kg N ha-1
(146 kg N ha-1
) > biomass + 50 kg N ha-1
(96 kg N
ha-1
) > biomass only (46 kg N ha-1
); while total N yield for the maize plants were in the
order; biomass + 150 kg N ha-1
(144.1 kg N ha-1
) > biomass + 100 kg N ha-1
(125.4 kg
N ha-1
) > biomass only (54.5 kg N ha-1
) > biomass + 50 kg N ha-1
(46.3 kg ha-1
); REs
were in the order; biomass + 100 kg N ha-1
(48%) > biomass + 150 kg N ha-1
, biomass
only (60%) > biomass + 50 kg N ha
-1 (20%); AEs were in the order; biomass only (27
kg G kg-1
N) > biomass + 100 kg N ha-1
(24 kg G kg-1
N) > biomass + 150 kg N ha-1
,
(21 kg G kg-1
N)> biomass + 50 kg N ha-1
(13 kg G kg-1
N); and PFPs were in the
order; biomass + 50 kg N ha-1
(60 kg G kg-1
N) > biomass + 100 kg N ha-1
(53 kg G kg-
1 N) > biomass + 150 kg N ha
-1 (39 kg G kg
-1 N).
Total N inputs from mineral fertilizer and biomass to the maize plants for the subplots
of the main treatment that had medium duration pigeon pea-groundnut intercrop during
season one with biomass incorporated into the soil at harvest were in the order; biomass
+ 150 kg N ha-1
(279 kg N ha-1
) > biomass + 100 kg N ha-1
(229 kg N ha-1
) > biomass +
50 kg N ha-1
(179 kg N ha-1
) > biomass only (129 kg N ha-1
); while total N yield for the

234
maize plants were in the order; biomass + 150 kg N ha-1
(103.6 kg N ha-1
) > biomass +
100 kg N ha-1
(103.3 kg N ha-1
) > biomass only (75 kg N ha-1
) > biomass + 50 kg N ha-1
(70.3 kg ha-1
); REs were in the order; biomass only (37%) > biomass + 100 kg N ha
-1
(33%) > biomass + 150 kg N ha-1
(28%)> biomass + 50 kg N ha-1
(24%); AEs were in
the order; biomass only (19 kg G kg-1
N) > biomass + 50 kg N ha-1
(15 kg G kg-1
N) >
biomass + 150 kg N ha-1
, biomass + 100 kg N ha-1
(14 kg G kg-1
N); and PFPs were in
the order; biomass + 50 kg N ha-1
(90 kg G kg-1
N) > biomass + 100 kg N ha-1
(50 kg G
kg-1
N) > biomass + 150 kg N ha-1
(38 kg G kg-1
N).
Total N inputs from mineral fertilizer and biomass to the maize plants for the subplots
of the main treatment that had long duration pigeon pea-groundnut intercrop during
season one with biomass incorporated into the soil at harvest were in the order; biomass
+ 150 kg N ha-1
(266 kg N ha-1
) > biomass + 100 kg N ha-1
(216 kg N ha-1
) > biomass +
50 kg N ha-1
(166 kg N ha-1
) > biomass only (116 kg N ha-1
); while total N yield for the
maize plants were in the order; biomass + 50 kg N ha-1
(110.4 kg N ha-1
) > biomass +
100 kg N ha-1
(120 kg N ha-1
) > biomass + 150 kg N ha-1
(90.5 kg N ha-1
) > biomass
only (64 kg N ha-1
); REs were in the order; biomass + 50 kg N ha-1
(50%) > biomass +
100 kg N ha-1
(43%) > biomass only (32%) > biomass + 150 kg N ha-1
(24%); AEs
were in the order; biomass + 50 kg N ha-1
(21 kg G kg-1
N) > biomass + 100 kg N ha-1
(16 kg G kg-1
N) > biomass only (13 kg G kg-1
N) > biomass + 150 kg N ha-1
(11 kg G
kg-1
N) >; and PFPs were in the order biomass + 50 kg N ha-1
(104 kg G kg-1
N) >
biomass + 100 kg N ha-1
(52 kg G kg-1
N) > biomass + 150 kg N ha-1
(31 kg G kg-1
N).

235
Total N inputs from mineral fertilizer and root biomass to the maize plants for the
subplots of the main treatment that had medium duration pigeon pea-groundnut
intercrop during season one with no biomass incorporated into the soil at harvest were
in the order; root biomass + 150 kg N ha-1
(157.4 kg N ha-1
) > root biomass + 100 kg N
ha-1
(107.4 kg N ha-1
) > root biomass + 50 kg N ha-1
(57.4 kg N ha-1
) > root biomass
only (7.4 kg N ha-1
); while total N yield for the maize plants were in the order; root
biomass + 150 kg N ha-1
(105 kg N ha-1
) > root biomass + 100 kg N ha-1
(67.1 kg N ha-
1) > root biomass only (48.4 kg N ha
-1) > root biomass + 50 kg N ha
-1 (40 kg ha
-1); REs
were in the order; root biomass + 150 kg N ha-1
(50%) > root biomass + 100 kg N ha-1
,
root biomass + 50 kg N ha-1
(38%); AEs were in the order; root biomass + 150 kg N ha-
1 (16 kg G kg
-1 N) > root biomass + 100 kg N ha
-1, (15 kg G kg
-1 N) > root biomass +
50 kg N ha-1
(7 kg G kg-1
N); and PFPs were in the order; root biomass + 50 kg N ha-1
(43 kg G kg-1
N) > root biomass + 100 kg N ha-1
(34 kg G kg-1
N) > root biomass +
150 kg N ha-1
(28 kg G kg-1
N).
Total N inputs from mineral fertilizer and root biomass to the maize plants for the
subplots of the main treatment that had long duration pigeon pea-groundnut intercrop
during season one with no biomass incorporated into the soil at harvest were in the
order; root biomass + 150 kg N ha-1
(157.1 kg N ha-1
) > root biomass + 100 kg N ha-1
(107.1 kg N ha-1
) > root biomass + 50 kg N ha-1
(57.1 kg N ha-1
) > root biomass only
(7.1 kg N ha-1
); while total N yield for the maize plants were in the order; root biomass
+ 150 kg N ha-1
(126.7 kg N ha-1
) > root biomass + 100 kg N ha-1
(121.3 kg N ha-1
) >
root biomass + 50 kg N ha-1
(51.6 kg ha-1
) > root biomass only (46.3 kg N ha-1
); REs
were in the order; root biomass + 100 kg N ha-1
(88%) > root biomass + 50 kg N ha-1

236
(64%) > root biomass + 100 kg N ha-1
(44%); AEs were in the order; root biomass +
100 kg N ha-1
(32 kg G kg-1
N) > root biomass + 150 kg N ha-1
, (22 kg G kg-1
N) >
root biomass + 50 kg N ha-1
(19 kg G kg-1
N); and PFPs were in the order; root
biomass + 50 kg N ha-1
(57 kg G kg-1
N) > root biomass + 100 kg N ha-1
(52 kg G kg-1
N) > root biomass + 150 kg N ha-1
(35 kg G kg-1
N).

237
Table 7.4: Summary of total N yields in the maize plant, N input to the soil by
legumes, total N input, the N recovery agronomic use efficiency and the partial
factor productivity
Treatments: Main and sub plots
1.
N
input-
biomas
s kg ha-
1
N
input-
Urea
kg ha-1
TT N
input
N yield in
maize kg
ha-1TT
RE
(%)
AE kg
G kg-1
N
PFPN
kg G
kg-1
N
a.Sole Maize-No biomass 0 0 0 26.7 - - -
b.Sole Maize-No biomass + 100 kg N ha-1 0 100 100 65.1 38 16 33
c.Sole Maize-No biomass + 150 kg N ha-1 0 150 150 79.8 35 16 27
d.Sole Maize-No biomass + 50 kg N ha-1 0 50 50 48.5 44 8 44
2.
a.Medium duration pigeon pea-biomass 87.0 0 - - ND ND ND
b.Medium duration pigeon pea-biomass + 100 kg N ha-1 ND 100 ND ND ND ND ND
c.Medium duration pigeon pea-biomass + 150 kg N ha-1 ND 150 ND ND ND ND ND
d.Medium duration pigeon pea-biomass + 50 kg N ha-1 91 50 141 60.4 24 14 74
3.
a.Long duration pigeon pea-biomass 83 0 83 62.6 43 31 -
b.Long duration pigeon pea-biomass + 100 kg N ha-1 83 100 183 96.8 38 16 47
c.Long duration pigeon pea-biomass + 150 kg N ha-1 83 150 233 123.1 41 16 36
d.Long duration pigeon pea-biomass + 50 kg N ha-1 83 50 133 67 30 21 92
4.
a. Sole groundnut-biomass 46 0 46 54.5 60 27 -
b.Sole groundnut-biomass + 100 kg N ha-1 46 100 146 125.4 68 24 53
c.Sole groundnut-biomass + 150 kg N ha-1 46 150 196 144.1 60 21 39
d.Sole groundnut-biomass + 50 kg N ha-1 46 50 96 46.3 20 13 60
5.
a.Medium duration pigeon pea + groundnut-biomass 129 0 129 75 37 19 -
b.Medium duration pigeon pea + groundnut-biomass + 100 kg
N ha-1 129 100 229 103.3 33 14 50
c.Medium duration pigeon pea + groundnut-biomass + 150 kg
N ha-1 129 150 279 103.6 28 14 38
d.Medium duration pigeon Pea + groundnut-biomass + 50 kg
N ha-1 129 50 179 70.3 24 15
90

238
ND= not determined
N
input-
Biomas
s kg ha-
1
N
input-
Urea
kg ha-1
TT N
input
N yield in
Maize kg
ha-1TT
RE
%
AE kg
G
kg-1 N
PFPN
kg G
kg-1
N
a.Long duration pigeon pea + groundnut-biomass 116 0 116 64 32 13 -
b.Long duration pigeon pea + groundnut-biomass + 100 kg N
ha-1 116 100 216 120 43 16
52
c.Long duration pigeon pea + groundnut-biomass + 150 kg N
ha-1 116 150 266 90.5 24 11
31
d.Long duration pigeon pea + groundnut-biomass + 50 kg N
ha-1 116 50 166 110.4 50 21
104
7.
a.Medium duration pigeon pea + groundnut-no biomass 7.4 0 7.4 40 - - -
b.Medium duration pigeon pea + groundnut-no biomass + 100
kg N ha-1 7.4 100 107.4 67.1 38 15 34
c.Medium duration pigeon pea + groundnut-no biomass + 150
kg N ha-1 7.4 150 157.4 105 50 16 28
d.Medium duration pigeon pea + groundnut-no biomass + 50
kg N ha-1 7.4 50 57.4 48.4 38 7 43
8.
a.Long duration pigeon pea + groundnut-no biomass 7.1 0 7.1 46.3 - - -
b.Long duration pigeon pea + groundnut-no biomass + 100 kg
N ha-1 7.1 100 107.1 121.3 88 32 52
c.Long duration pigeon pea + groundnut-no biomass + 150 kg
N ha-1 7.1 150 157.1 126.7 64 22 35
d.Long duration pigeon pea + groundnut-no biomass + 50 kg
N ha-1 7.1 50 57.1 51.6 44 19 57
GM - - - 80.8 - - -
CV (%) - - - 33.5 - - -
LSD0.05 - - - 58 - - -
239
7.4 DISCUSSION
7.4.1 Nitrogen partitioning in the maize crop
In general, data on nitrogen yields for the maize grains, stover and rachids presented in
Tables 7.1, 7.2 and 7.3 indicate that more N was partitioned to grains, followed by
stover and rachids. This being the result of N remobilization during grain filling from
the stover to cobs for grain formation (Yazdani, 2013). In all grain crops, the supply of
assimilates for grain filling emanates both from current assimilation channelled directly
to the developing grains and from the remobilization of assimilates stored in vegetative
plant parts (Arduini et al, 2006; Yang et al, 2007). Remobilization of assimilates arises
from plant senescence, a process that involves translocation of stored reserves from
stems and sheaths to grains (Masoni et al, 2004). Remobilizable nitrogen stored in plant
parts occurs in the form of amino acids and proteins (Yazdani, 2013). In this study,
plants in treatment plots that were treated with a combination of 150 kg N ha-1
, 100 kg
N ha-1
with groundnut biomass and plants in the long duration pigeon pea groundnut
intercrop that did not have biomass buried into the soil, had more N partitioned to the
grains compared to N partitioned to the grains of maize in other treatment plots (Table
7.1). The reason for the trend is not so clear as lower N yields were observed in plots
with similar treatment combination. The control plots had the least amount of N
partitioned to the grains largely due to low N supply and uptake during the reproductive
stage. A similar trend of N partitioning was reflected in stover and rachids (Tables 7.2
and 7.3). Overall, the combination of mineral N and legume biomass seem not to have
affected N partitioning to the grains, stover and rachids. In maize, grain yields and
partitioning of dry matter increases with increasing plant uptake and use of nitrogen at
proper growth stages (Amanulluh, 2007). The trend of N partitioning reflected by the N

240
yields which is a function of the amount of dry matter of plant parts (grain, stover and
rachids), seem to suggest that N uptake was not constrained at any stage of plant
growth across the treatments except the control plots. This resulted into high N
accumulation in the grains. Binder et al. (2000) indicated that limitation on plant
growth due to inadequate N is a function of N deficiency during the initial growth
stages. The basic reason for the limitation is reduced leaf expansion rate and leaf area
(Wolfe et al., 1988) resulting into reduced interception of solar radiation (Uhart and
Andrade, 1995). The stated trend culminates into reduce rates of photosynthesis and
hence assimilation of photosynthetic products into plant biomass. Chen et al. (2003)
indicated that crop biomass production especially grain yields are directly associated
with current rates of assimilation of photosynthetic products and translocation during
the reproductive stage. Furthermore, inadequate N at the flowering stage of maize
reduces the dry matter partitioning to reproductive sinks (Uhart and Andrade, 1995).
Under this study, the high N and grain yields suggest that there was no deficit of N
during the flowering stage.
7.4.2 Maize yields and nitrogen use efficiency by the maize crop
Evidencially, external N supply to plants under the conditions of this study was
requisite as the control plots had significantly less grain (p < 0.05) compared with
treament plots supplied with mineral N alone, pigeon pea and groundnut biomass, a
combination of mineral N with either pigeon pea and groundnut biomass, and a
combination of mineral N with a combination of pigeon pea and groundnut biomass.
The subplots under treatment plots (treatment 7 and 8) that had pigeon pea
intercropped with groundnut in year one without incorporating biomass in year two but
supplied with mineral N had high yields as well (Table 7.1 ), which were comparable to

241
yields obtained in treatments which had biomass incorporated into the soil and treated
with mineral N. Under treatments 7 and 8 the subplots which were not supplied with
mineral N had higher yields compared to the control. This could have come about
because in the former plots roots of pigeon pea might have increased the supply of N to
the plants upon decay and subsequent mineralization.
Overall, linear increase in grain yield with either sole application of mineral N or a
combination of mineral N and biomass incorporation over the control was observed.
The grain yields increase above yields from the control plots ranged from 21% to
227.1%. The grain yields increase above the yields generated by control plots was in
conformity with what was reported by other researchers. For example Munthali et al.,
(2014) working on N rich tephrosia biomass incorporation from tephrosia fallows plus
inorganic fertilizer amendment to maize reported 518% grain yields increase over the
control for maize grown where tephrosia biomass was incorporated and treated with
lower rates of N (45 kg N ha−1
) and P (20 kg P ha−1
). On the other hand tephrosia
biomass alone without inorganic fertilizer input increased maize yields by 400% over
the control. The maize grain yields increase over the control plots in systems involving
the incorporation of legume biomass into the soil is usually attributed to increased and
sustained supply of N to maize plants emanating from decomposition and subsequent
mineralization of N from the biomass (Harawa et al., 2006).
Under this study, platueing of grain yields below the yield potential (6 t ha-1
) of the
early maturing variety used (SC 403) was observed with increasing supply of mineral N
(Table 7.1). This suggested a diminishing-return relationship between maize grain
yields and increasing nitrogen supply, an indication of possible presence of other

242
factors that constrained the full expression of the yield potential. Such factors might
include defficiencies in other macro and micro nutrients, temperature regime and the
amount of intercepted solar radiation during the cropping season (van Wart et al.,
2013). The platueing of grain yields was noticed at the fertilizer rate of 150 kg N ha-1
plus mineralized N from legume biomass.
Recovery efficiency (RE) expressed by relative increase in above-ground crop uptake
per unit of N applied, Agronomic efficiency (AE) expressed by relative yield increase
per unit of N applied and partial factor productivity (PFP) expressed as crop yield per
unit of N applied (Roberts, 2008) indicate the extent of economic and environmental
efficiency in use of nutrient inputs. Under this study RE ranged between 20% and 88%,
AE ranged between 7 and 32 kg yield increase per kg of nitrogen applied and the PFP
ranges from 27 to 104 kg grain yield per kg nutrient applied. The PFP values are above
the value reported by Waddington et al. (2004) for Malawian smallholder agriculture.
This indicates that under the conditions of this study the pigeon pea-groundnut
intercrop maize rotation cropping system improved NUE. RE values of 50% to 80% ,
AE values of 10–30 kg kg-1
and PFP values of 40–80 kg kg-1
are often encountered
with values >25 kg kg-1
for AE and >60 kg kg-1
for PFP being common in well-
managed systems or at low levels of N use, or at low soil N supply (Doberman, 2007).
7.5 CONCLUSION
The linear increase in grain yield with application of N and the presence of a
diminishing-return relationship between maize grain yields (grain yield was near the
yield potential of the maize variety at high N input) and increasing nitrogen supply,
suggest that the RE, AE and PFP values emerging from this study might apply both to

243
low and high levels of N use, or at low and high soil N supply. In the pigeon pea
groundnut intercrop-maize rotation cropping system, for optimal NUE under low input
agriculture, basal dressing the maize crop with 50 kg P ha-1
and top dressing with 50 kg
N ha-1
could be ideal while for high input agriculture basal dressing the maize crop with
50 kg P ha-1
and top dressing with 100 kg N ha-1
seem to be reasonable. Under the
conditions of this study the lack of expression of the full yield potential by the variety
used at a high rate of N supply suggests the presence of other factors that constrained
the full expression of the yield potential. This requires further investigation inorder to
unravel the constraints.

244
7.6 REFERENCES
Amanulluh, (2007). Partitioning of dry matter and grain yield potential in maize
as..influenced..by.plant.density,..rate.and.timing.of..nitrogen.application
Internatinal Journal for Sustainable Crop Production 2(5): 01-07.
Arduini, I., Masoni, A., Ercoli, L. and Mariotti, M. (2006). Grain yield, dry matter,
nitrogen accumulation and remobilization in durum wheat as affected by
variety.and seeding rate. Agronomy Journal 25: 309-318.
Brennan, R.F. and Bolland, M.D.A. (2007). Comparing the potassium requirements of
canola and wheat. Australian Journal of Agricultural Research 58: 359–366.
Binder, D.L., Sander, D.H. and Walters, D.T. (2000). Maize response to time of
nitrogen application as affected by level of nitrogen deficiency. Agronomy
Journal 92: 1228–1236.
Brye, K.R., Norman, J.M. Nordheim, E.V., Gower, S.T. and Bundy, L.G. (2002).
Refinements to an In-situ soil core technique for measuring net nitrogen
mineralization in moist, fertilized agricultural soil. Agronomy Journal. 94pp.
Cassman, K.G., Dobermann, A. and Daniel, T.W. (2002). Agroecosystems, nitrogen-
use.efficiency.and..management..Agronomy.and.Horticulture.Faculty.
Publications .356pp.

245
Chen, Y.H., Yu, S.L. and Yu, Z.W. (2003). Relationship between amount or
distribution of PAR interception and grain output of wheat communities.
Acta Agronomica Sinica 29: 730–734.
Conway, G. and Waage, J. (2010). Harnessing science for global health. The Lancet,
UK Collaborative on Development Sciences Publication 375 (9726): 1599-
1600.
Dobermann, A., (2007). Nutrient use efficiency measurement and management In:
Proceedings of IFA International Workshop On Fertilizer Best Management
Practices, Brussels, Belgium. 45pp.
Gunes, A., Inal, A., Alpaslan, M. and Cakmak, I. (2006) Genotypic variation in
phosphorus efficiency between wheat cultivars grown under greenhouse and
field conditions. Soil Science and Plant Nutrition 52: 470–478.
Harawa, R., Lehmann, J., Akinnifesi, F., Fernandes, E. and Kanyama-Phiri, G.Y.
(2006). Nitrogen dynamics in maize-based agroforestry systems as affected by
landscape position in southern Malawi. Nutrient Cycling in Agroecosystems 75:
271–284.
Ikisan,.(2000)..Groundnut.nutrient.management..[http://www.ikisan.com/links/ap_grou
ndnut nutrient management] site visited on 5/15/2014.

246
Kanyama-Phiri, G.Y. (2005). Best-bet soil fertility management options: The case of
Malawi African Crop Science Conference Proceedings, African Crop Science
Society 7: 1039-1048.
Kumwenda, J.D.T., Waddington, S.R., Stephen, R., Snapp, S.S., Jones, R.B., Richard, B.
and Blackie, M.J. (1995). Soil fertility management in the smallholder maize-based
cropping systems of Africa. A paper for a workshop on “The Emerging Maize
Revolution in Africa: The Role of Technology, Institutions and Policy” Michigan
State University, USA, 9-12 July 1995. 67pp.
Larbi, A., Jabbar, M.A., Atta-Krah, A.N. and Cobbina, J. (1993). Effect of taking a
fodder crop on maize grain yield and soil chemical properties in Leucaena and
Gliricidia alley farming systems in western Nigeria. Experimental Agriculture 29:
317-321.
López-Bellido, R.J. and Lopez-Bellido, L..(2001)..Efficiency of nitrogen in wheat under
mediterranean conditions: effect of tillage, croprotation and N fertilization. Field
Crops Research 71: 31-46.
Makgoga, M.W. (2013). Influence of lablab (Lablab purpurues) and dry beans
(Phaseolus vulgaris) intercrops with maize (Zea mays L.) on maize grain yield
and soil fertility status. A mini-dissertation, Master of Science in Agriculture
(Agronomy), School of Agriculture and Environmental Sciences, Faculty of
Science and Agriculture, University of Limpopo, South Africa.

247
Masoni, A., Ercoli, L., Mariotti, M. and Arduini, I. (2007). Post anthesis accumulation
and remobilization of dry matter nitrogen and phosphorus in durum wheat as
affected by soil type. Agronomy Journal 26: 179-186.
Masson, S.C., Leihner, D.E. and Vorst, J.J. (1986). Cassava-cowpea and cassava-
peanut Intercropping: Nutrients concentration and removal. Agronomy Journal
78: 441-444.
Mosier, A.R., Syers, J.K. and Freney, J.R. (2004). Agriculture and the nitrogen cycle.
Assessing.the.impacts.of.fertilizer.use.on.food.production.and.the.environment.
Island Press, London. 65pp.
Munthali,
M.G., Gachene, C.K.K., Sileshi, G.W. and Karanja, N.K. (2014).
Amendment of Tephrosia improved fallows with inorganic fertilizers improves
soil chemical properties, N uptake, and maize yield in Malawi. International
Journal of Agronomy. 9pp.
Omokanye, A.T., Kelleher, F.M. and McInnes, A. (2011). Low input cropping systems
and nitrogen fertilizer effects on crop production: Soil nitrogen dynamics and
efficiency of nitrogen use in maize crop. American-Eurasian Journal of
Agriculture and Environmental Science 11(2): 282-295.
Phiri A.T., Msaky J.J., Mrema J.P., Kanyama-Phiri, G.Y. and Harawa R. (2013).
Assessment of nutrient and biomass yield of medium and long duration pigeon

248
pea in a pigeon pea-groundnut intercropping system in Malawi. Journal of
Sustainable Society 2: 36-48.
Phiri, A.T., Njoloma, J.P., Kanyama-Phiri, G.Y., Snapp, S. and Lowole, M.W. (2010).
Maize yield response to the combined application of Tundulu rock phosphate
and pigeon pea residues in Kasungu, central Malawi. African Journal of
Agricultural Research 5(11): 1235-1242.
Raun, W.R. and Johnson, G.V. (1999). Improving nitrogen use efficiency for cereal
production. Agronomy Journal 91: 357-363.
Rengel, Z. (2005). Breeding crops for adaptation to environments with low nutrient
availability. In: Ashraf M, Harris PJC (Eds) Abiotic Stresses: Plant resistance
through breeding and molecular approaches. The Haworth Press, New York,
pp. 239–276.
Rengel, Z. and Marschner, P. (2005). Nutrient availability and management in the
rhizosphere: exploiting genotypic differences. New Phytology 168: 305–312.
Roberts,.T..(2008)...Improving.nutrient.use..efficiency..Turkish Journal.of Agriculture
and Forestry 32: 177-182.

249
Rose, T.J., Rengel, Z., Ma, Q. and Bowden, J.W. (2007). Differential accumulation
patterns of phosphorus and potassium by canola cultivars compared to wheat.
Journal for Plant Nutrition and Soil Science 170: 404–411.
Sakala, W.D., Kumwenda, J.D.T. and Saka, A.R. (2004). The Potential of green manures
to increase soil fertility and maize yield in Malawi. Maize Agronomy Research
Report (2000-2003). Ministry of Agriculture, Irrigation and Food Security. pp. 14-
20.
Sattelmacher, B., Horst, W.J. and Becker, H.C. (1994) Factors that contribute to
genetic.variation for nutrient efficiency of crop plants. Z Pflanzenernahr
Bodenkd 157: 215–224.
Thobatsi, T.J. (2009). Growth and yield response of maize (Zea mays L.) and Cowpea
(Vigna unguiculata L.) in intercropping system. Masters dissertation. University
of Pretoria, South Africa. pp. 58-67.
Tolessa, D. and Friesen, D.K. (2001). Effect of enriching farmyard manure with
mineral fertilizers on grain yield of maize at Bako, western Ethiopia. Seventh
Eastern and Southern Africa Regional Maize Conference. pp. 335-337.
Uhart, S.A., and Andrade, F.H. (1995). Nitrogen deficiency in maize: Effects on crop
growth, development, dry matter partitioning, and kernel set. Crop Science 35:
1376–1383.

250
Waddington, S.R., Sakala, W.D. and Mekuria, M. (2004). Progress in lifting soil
fertility in Southern Africa. Proceedings of the 4th
International Crop Science
Congress Brisbane, Australia, 26 September –1 October. 56pp.
Warta, J., Kersebaumb, K.C., Pengc, S., Milnera, M. and Cassmana, K.G. (2013).
Estimating crop yield potential at regional to national scales. Field Crops
Research 143: 34–43.
Wolfe, D.W., Henderson, D.W., Hsiao, T.C. and Alvino, A. (1988). Interactive water
and nitrogen effects on senescence of maize II. Photosynthetic decline and
longevity of individual leaves. Agronomy Journal 80: 865–870.
Yang, D.L., Jing, R.L., XP, C. and Li, W. (2007). Identification of quantitative trait loci
and environmental interactions for accumulation and remobilization of water-
soluble carbohydrates in wheat (Triticum aestivum L.) Stems. Genetics 176:
571-584.
Yazdani, M. (2013). Post-anthesis accumulation and remobilization of dry matter in
corn (Zea mays L.) as affected by biofertilizers. International Journal of
Agronomy and Plant Production 4(3): 595-602.

251
CHAPTER 8
8.0 GENERAL CONCLUSIONS AND RECOMMENDATIONS
8.1 Conclusions
From the study the following general conclusions can be made:
Generally, the soil chemical characteristics for soil samples collected in all the
treatment plots both in the main and parallel experiment indicate that the soil is
of low low fertility status. The soil fertility limitations being low pH (<6.0),
Low N (<0.88%) and marginally adequate P (19 mg P kg-1
to 25 mg P kg-1
)
The study confirmed the viability of the pigeon pea-groundnut intercropping
system. The nitrogen yields for the cropping system were deemed to be
reasonably high.
High soil NO3-‒N was observed in plots where legume biomass was not
incorporated attributable to residual N from fertilization and legume cropping
over years. Residual N accumulates in the soil solution.
N supplement from mineral fertilizer is requiste for the attainment of high maize
grain yields as the soils have a lowN supplying capacity and are prone to
leaching due to the sandy clay loam texture.
Differences in the extraction procedures for the two nitrate analysis methods
(KCl method and the nitrate meter) seem to be the source of the observed
differences of nitrate readings generated by the methods.

252
Furthermore, in the pigeon pea plant, upon incorporation to the soil, much of the
N contribution to the soil’s N pool comes from the above ground biomass as
compared to the below ground biomass.
Additionally, supply of P to legumes increases N yield through enhanced
biological fixation. The legumes however do not yield enough P for the
correction of soil P deffiencies that are prevalent across Malawi.
The linear increase in grain yield with application of N and the presence of a
diminishing-return relationship between maize grain yields and increasing
nitrogen supply, suggest that the RE, AE and PFP values emerging from this
study might apply both to low and high levels of N use, or at low and high soil
N supply.
For optimal NUE under low input agriculture, top dressing with 50 kg N ha-1
could be ideal while for high input agriculture top dressing with 100 kg N ha-1
seem to be reasonable.
Under the conditions of this study the pigeon pea-groundnut maize rotation
cropping system improved NUE through increased N supply and subsequent
uptake by the maize crop.
8.2 Recommendations
Further studies in this cropping system should focus on understanding the
decomposition and mineralization pattern of the incorporated legume biomass
for the assertion of the time and amount of N release. This is critical inorder to
establish empirically if this is in syncrony with N demand by the maize crop.

253
Studies to answer the question on the amount of mineral nitrogen required to
suppliment to N added to the soil by the incorporated legume biomass for the
optimization of yield while reducing the cost accrued by purchasing mineral
nitrogen should be conducted and investigation on the effect of ratooning and
ratooning time on pigeon pea podding and grain filling in the second season should be
undertaken.

254
9.0 APPENDICES
Appendix 2.0a: Soils data for the main experiment at harvest (First season)
Treatment Depth cm Plot Rep pHH2O OC(%) N(%) P mg kg-1
1.Sole maize 0-20 3 " 5.01 1.35 0.12 16.7
1.Sole maize 20-40 " " 4.96 1.23 0.11 16.2
2.Medium duration pigeon pea 0-20 2 " 5.26 1.20 0.10 19.4
2.Medium duration pigeon pea 20-40 " " 5.05 1.26 0.11 24.1
3.Long duration pigeon pea 0-20 4 " 5.06 1.26 0.11 21.8
3.Long duration pigeon pea 20-40 " " 5.03 1.35 0.12 16.9
4.Sole groundnut 0-20 5 " 5.13 1.26 0.11 23.6
4.Sole groundnut 20-40 " " 5.22 1.44 0.12 20.1
5.Medium duration pigeon pea + groundnut 0-20 1 1 5.65 1.35 0.12 23.4
5.Medium duration pigeon pea + groundnut 20-40 " " 5.37 1.44 0.12 19.2
6.Long duration pigeon pea + groundnut 0-20 7 " 5.17 1.38 0.12 11.7
6.Long duration pigeon pea + groundnut 20-40 " " 5.28 1.41 0.12 15.3
7.Medium duration pigeon pea + groundnut 0-20 6 " 5.15 1.56 0.13 36.6
7.Medium duration pigeon pea + groundnut 20-40 " " 5.14 1.44 0.12 23.4
8.Long duration pigeon pea + groundnut 0-20 8 " 5.28 1.62 0.14 29.2
8.Long duration pigeon pea + groundnut 20-40 " " 5.28 1.53 0.13 28.8
1.Sole maize 0-20 2 " 5.40 1.53 0.13 29.2
1.Sole maize 20-40 " " 5.36 1.62 0.14 22.6

255
Treatment Depth cm Plot Rep pHH2O OC(%) N(%) P mg kg-1
2.Medium duration pigeon pea 0-20 3 " 5.34 1.65 0.14 21.9
2.Medium duration pigeon pea 20-40 " " 5.21 1.65 0.14 20.7
3.Long duration pigeon pea 0-20 6 " 5.46 1.35 0.12 23.9
3.Long duration pigeon pea 20-40 " " 5.35 1.47 0.13 17.1
4.Sole groundnut 0-20 5 " 5.43 1.17 0.10 26.7
4.Sole groundnut 20-40 " " 5.40 1.44 0.12 16.5
5.Medium duration pigeon pea + groundnut 0-20 8 " 5.45 1.44 0.12 17.6
5.Medium duration pigeon pea + groundnut 20-40 " " 5.46 1.59 0.14 15.7
6.Long duration pigeon pea + groundnut 0-20 4 " 5.34 1.68 0.14 18.9
6.Long duration pigeon pea + groundnut 20-40 " " 5.35 1.74 0.15 20.1
7.Medium duration pigeon pea + groundnut 0-20 7 " 5.29 1.59 0.14 20.5
7.Medium duration pigeon pea + groundnut 20-40 " " 5.30 1.71 0.15 17.9
8.Long duration pigeon pea + groundnut 0-20 1 2 5.26 1.65 0.14 21.2
8.Long duration pigeon pea + groundnut 20-40 " " 5.43 1.92 0.17 23.9
1.Sole maize 0-20 5 " 5.43 1.77 0.15 26.3
1.Sole maize 20-40 " " 5.31 1.74 0.15 18.1
2.Medium duration pigeon pea 0-20 4 " 5.50 1.59 0.14 27.5
2.Medium duration pigeon pea 20-40 " " 5.36 1.65 0.14 27.6
3.Long duration pigeon pea 0-20 2 " 6.25 1.35 0.12 16.7
3.Long duration pigeon pea 20-40 " " 5.90 1.59 0.14 16.5
4.Sole groundnut 0-20 3 " 5.65 1.56 0.13 19.9

256
Treatment Depth cm Plot Rep pHH2O OC(%) N(%) P mg kg-1
4.Sole groundnut 20-40 " " 5.46 1.74 0.15 16.2
5.Medium duration pigeon pea + groundnut 0-20 7 " 5.43 1.83 0.16 19.6
5.Medium duration pigeon pea + groundnut 20-40 " " 5.32 1.92 0.17 25.2
6.Long duration pigeon pea + groundnut 0-20 1 3 5.41 1.38 0.12 32.3
6.Long duration pigeon pea + groundnut 20-40 " " 5.38 1.59 0.14 29.4
7.Medium duration pigeon pea + groundnut 0-20 8 " 5.09 1.65 0.14 22.8
7.Medium duration pigeon pea + groundnut 20-40 " " 5.14 1.71 0.15 22.8
8.Long duration pigeon pea + groundnut 0-20 6 " 5.45 1.68 0.14 19.8
8.Long duration pigeon pea + groundnut 20-40 " " 5.37 1.77 0.15 24.1

257
Appendix 2.0b: Soils data for the main experiment after biomass incorporation to the soil (second season)
Rep.
Treatments
Depth (cm)
pHH2O
OC(%)
N(%)
P mg kg-1
1 1.Sole maize 0-20 5.6 0.81 0.07 9.29
1 1.Sole maize 20-40 5.7 1.20 0.10 18.27
1 2.Medium duration pigeon pea 0-20 5.7 1.26 0.11 12.89
1 2.Medium duration pigeon pea 20-40 5.6 1.06 0.09 19.62
1 3.Long duration pigeon pea 0-20 5.3 1.15 0.01 12.37
1 3.Long duration pigeon pea 20-40 5.0 1.09 0.09 18.59
1 4.Sole groundnut 0-20 5.6 1.29 0.11 13.51
1 4.Sole groundnut 20-40 5.7 1.04 0.09 19.76
1 5.Medium duration pigeon pea + Groundnut 0-20 5.5 1.09 0.09 15.64
1 5.Medium duration pigeon pea + Groundnut 20-40 5.5 1.20 0.10 18.89
1 6.Long duration pigeon pea + Groundnut 0-20 5.2 1.54 0.13 14.55
1 6.Long duration pigeon pea + Groundnut 20-40 5.2 1.54 0.13 20.10
1 7.Medium duration pigeon pea + Groundnut 0-20 5.8 0.78 0.07 14.29
1 7.Medium duration pigeon pea + Groundnut 20-40 5.8 1.34 0.12 17.67

258
Rep.
Treatments
Depth (cm)
pHH2O
OC(%)
N(%)
P mg kg-1
1 8.Long duration pigeon pea + Groundnut 5.8 1.34 0.12 15.49
1 8.Long duration pigeon pea + Groundnut 20-40 5.6 1.37 0.12 19.54
2 1.Sole maize 0-20 5.2 1.23 0.11 8.96
2 1.Sole maize 20-40 5.1 1.76 0.15 19.34
2 2.Medium duration pigeon pea 0-20 5.8 1.26 0.11 13.14
2 2.Medium duration pigeon pea 20-40 5.6 1.43 0.12 19.81
2 3.Long duration pigeon pea 0-20 5.7 1.88 0.16 12.42
2 3.Long duration pigeon pea 20-40 5.6 1.54 0.13 18.71
2 4.Sole groundnut 0-20 5.1 1.04 0.09 13.52
2 4.Sole groundnut 20-40 5.0 1.29 0.11 18.81
2 5.Medium duration pigeon pea + Groundnut 0-20 5.4 1.46 0.13 14.73
2 5.Medium duration pigeon pea + Groundnut 20-40 5.5 1.40 0.12 19.91
2 6.Long duration pigeon pea + Groundnut 0-20 5.9 1.46 0.13 15.68
2 6.Long duration pigeon pea + Groundnut 20-40 5.8 1.54 0.13 22.10
2 7.Medium duration pigeon pea + Groundnut 0-20 5.1 1.43 0.12 16.30

259
Rep.
Treatments
Depth (cm)
pHH2O
OC(%)
N(%)
P mg kg-1
2 7.Medium duration pigeon pea + Groundnut 20-40 5.1 1.57 0.14 19.87
2 8.Long duration pigeon pea + Groundnut 0-20 6.0 1.12 0.10 14.54
2 8.Long duration pigeon pea + Groundnut 20-40 6.0 1.20 0.10 17.44
3 1.Sole maize 0-20 5.2 1.51 0.13 10.41
3 1.Sole maize 20-40 5.1 1.68 0.14 18.55
3 2.Medium duration pigeon pea 0-20 5.9 1.04 0.09 16.87
3 2.Medium duration pigeon pea 20-40 5.4 1.31 0.11 22.75
3 3.Long duration pigeon pea 0-20 5.9 2.02 0.17 15.59
3 3.Long duration pigeon pea 20-40 6.0 1.26 0.11 19.63
3 4.Sole groundnut 0-20 5.7 1.18 0.10 13.78
3 4.Sole groundnut 20-40 5.6 1.62 0.14 21.74
3 5.Medium duration pigeon pea + Groundnut 0-20 5.2 1.46 0.13 14.63
3 5.Medium duration pigeon pea + Groundnut 20-40 5.1 0.98 0.08 17.86
3 6.Long duration pigeon pea + Groundnut 0-20 6.0 1.71 0.15 14.68
6.Long duration pigeon pea + Groundnut 20-40 6.0 1.76 0.15 19.98

260
Appendix 2.5: Yield parameter in the main experiment (season one)
Treatments BLOCK
G/nut
leaves
(kg ha-1
)
PP litter
(kg ha-1
)
PP fresh
leaves
(kg ha-1
)
Twigs (kg
ha-1
)
Total PP
biomass
(kg ha-1
)
G/nut wt
(kg ha-1
)
Grain
wt (kg)
Shells
wt (kg
ha-1
)
Number of
g/nut pods
plant-1
Maize
Stover
Maize
Grain
(kg ha-1
)
1 1 - - - - - - - - - 280 516.75
1 2 - - - - - - - - - 293 558.5
1 3 - - - - - - - - - 409 864.0
2 1 - 2133.3 550 710 3393.3 - - - - - -
2 2 - 844.4 277.5 772.5 1894.4 - - - - - -
2 3 - 163.0 170 480 813.0 - - - - - -
3 1 - 933.3 760 1292.5 2985.8 - - - - - -
3 2 - 1600 335 562.5 2497.5 - - - - - -
3 3 - 1170.4 497.5 727.5 2395.4 - - - - - -
4 1 592.5 - - - - 1962.5 1220 324.5 36 - -
4 2 682.5 - - - - 2250 587 190 26 - -
4 3 692.5 - - - - 187.5 135 50.25 25 - -
5 1 540 785.2 287.5 557.5 1630.2 1000 711.75 196 29 - -
5 2 682.5 1837.0 292.5 337.5 2467.0 1875 533.75 1593 28 - -
5 3 612.5 2637.0
2637.0 875 461 68.75 28 - -
6 1 335 1585.2 665 597.5 2847.7 1250 287.75 84.75 34 - -
6 2 572.5 1837.0 535 550 2922.0 1237.5 855.5 228.5 37 - -
6 3 530 1437.0 237.5 335 2009.5 1252.5 929 232.8 35 - -

261
Treatments BLOCK G/nut
leaves
(kg ha-1
)
PP litter
(kg ha-1
)
PP fresh
leaves
(kg ha-1
)
Twigs (kg
ha-1
)
Total PP
biomass
(kg ha-1
)
G/nut wt
(kg ha-1
)
Grain
wt (kg)
Shells
wt (kg
ha-1
)
Number of
g/nut pods
plant-1
Maize
Stover
Maize
Grain
(kg ha-1
)
7 1 332.5 1363.0 245 477.5 2085.5 1250 690.75 102.5 35 - -
7 2 585 918.5 147.5 227.5 1293.5 1312.5 366.25 112.8 36 - -
7 3 577.5 2118.5 - - 2118.5 1000 591.25 193.5 26 - -
8 1 385 2874.1 482.5 860 4216.6 1250 840.25 243.8 24 - -
8 2 442.5 1437.0 582.5 815 2834.5 1000 756.5 200.8 25 - -
8 3 412.5 2029.6 - - - 1500 1023.5 274.5 18 - -
1=Sole maize, 2=Medium duration pigeon pea, 3= Long duration pigeon pea, 5=Medium duration pigeon pea + pigeon pea, 6= Long
duration pigeon pea + groundnut, 7=Medium duration pigeon pea + groundnut, 8= Long duration pigeon pea + groundnut.

262
Appendix 3.0a: Thirteen year rainfall data for the area
Year/
Month
1999/
2000
2000
/2001
2001
/2002
2002
/2003
2003
/2004
2004
/2005
2005
/2006
2006
/2007
2007
/2008
2008
/2009
2009
/2010
2010
/2011
2011
/2012 Means
Rainfall amount in mm
Oct 99.2 17.3 2 0.1 - 32.5 61.9 113.1 1.7 4.5 1.4 56.6 15.6 31.2
Nov 53.7 148.4 60.9 53 5.4 132.7 139.6 207.6 29.7 112.3 71.7 205.4 69.2 99.2
Dec 195.8 79.8 194.3 206.5 113.6 245.6 144.9 411.8 272 116.4 171.6 202.4 76 187.0
Jan 174.9 318 230.5 324.7 222.9 188.6 134 196.7 360.5 227.8 107.3 202.9 268.5 227.5
Feb 141.6 237.5 217.2 216.2 258.8 185.4 183.6 56.5 183.6 121 322.4 147.2 204.7 190.
Mar 46 174.4 116.9 230.8 105 26.3 43.2 23.5 72.3 223.7 201.3 100.3 154.6 116.8
Apri - 16.5 0.6 5 83.2 3.7 - - 13.6 18.1 35.3 31.7 80.9 22.2
May - - - - - 5.8 - - - - - 2.6 - 0.65
875.0

263
Appendix 3.0b: Rainfall (mm) distribution in the study area, for thirteen years (1999/00 to 2011/12 cropping season)

264
Appendix 3.0c: Rainfall (mm) distribution in the study area for the 2011/12 cropping season

265
Appendix 3.1a: Pigeon pea height data in the main experiment season 1
Date of
Measurement PLOT I-TRT 8 PLOT III-TRT 2 PLOT IV-TRT 6
Height of tagged plant cm Height of tagged plant cm Height of tagged plant cm
1 2 3 4 Mean 5 6 7 8 Mean 9 10 11 12 Mean
13.2.12 25 30 24 44 30.75 24 22 21 18 21.25 28 21 28 20 24.5
27.2.12 66 42 41 47 49 42 37 34 29 35.5 49 35 47 33 42
12.3.12 74 72 62 87 73.75 66 56 50 42 53.5 80 52 72 59 66
26.3.12 109 88 80 74 87.75 63 105 74 97 84.75 90 108 120 99 99
12.4.12 122 120 110 138 122.5 - 107 104 94 101.7 - 119
120 59.5
24.4.12 136 137 119 155 136.8 - 125 120 109 118 - 134
137 67

266
Appendix 3.1b: Pigeon pea height data in the main experiment season 1
TRT=Treatment; 2=Medium duration pigeon pea; 3= Long duration pigeon pea; 5=Medium duration pigeon pea + pigeon pea; 6= Long
duration pigeon pea + groundnut; 7=Medium duration pigeon pea + groundnut; 8= Long duration pigeon pea + groundnut
Date of
Measurement PLOT VI-TRT 3 PLOT VII-TRT 5 PLOT VIII-TRT 7
Height of tagged plant cm Height of tagged plant cm Height of tagged plant cm
13 14 15 16 Mean 17 18 19 20 Mean 21 22 23 24 Mean
13.2.12 45 45 40 49 44.75 37 43 56 47 45.75 49 40 39 44 43
27.2.12 70 72 55 74 67.75 55 73 86 83 74.25 77 65 62 72 69
12.3.12 91 92 78 100 90.25 95 94 106 113 102 108 90 85 105 97
26.3.12 121 125 117 142 126.25 139 129 110 129 126.8 130 105 138 133 126.5
12.4.12 149 147 127 146 142.25 157 129 150 139 143.8 152 115 149 140 139
24.4.12 164 165 140 164 158.25 175 147 173 150 161.3 171 127 160 160 154.5

267
Appendix 3.2a: Nutrient concentration and yields, fresh leaves pigeon pea main experiment season one
REP.
Treatments
Leaves
kg ha-1
N(%)
P(%)
Ca(%)
N Yield
kg ha-1
P Yield
kg ha-1
Ca Yield
kg ha-1
1 2.Medium duration pigeon pea 550 2.84 0.17 1.63 15.6 0.9 9.0
2 2.Medium duration pigeon pea 277.5 3.79 0.30 2.19 10.5 0.8 6.1
3 2.Medium duration pigeon pea 170 3.49 0.29 2.40 5.9 0.5 5.0
1 3.Long duration pigeon pea 760 2.39 0.12 2.60 18.2 0.9 9.1
2 3.Long duration pigeon pea 335 2.39 0.19 2.48 8.0 0.6 8.3
3 3.Long duration pigeon pea 497.5 2.29 0.26 2.73 11.4 1.3 13.6
1 5.Medium duration pigeon pea + Groundnut 287.5 2.79 0.20 1.75 8.0 0.6 5.0
2 5.Medium duration pigeon pea + Groundnut 292.5 2.69 0.11 2.10 7.9 0.3 6.1
1 6.Long duration pigeon pea + Groundnut 665 3.14 0.16 2.60 20.9 1.1 15.0
2 6.Long duration pigeon pea + Groundnut 535 3.19 0.17 2.73 17.1 0.9 14.6
3 6.Long duration pigeon pea + Groundnut 237.5 2.49 0.18 2.73 5.9 0.4 6.5
1 7.Medium duration pigeon pea + Groundnut 245 2.99 0.21 1.87 7.3 0.5 5.1
2 7.Medium duration pigeon pea + Groundnut 147.5 2.59 0.17 3.00 8.0 0.3 5.0
1 8.Long duration pigeon pea + Groundnut 482.5 2.94 0.15 2.60 14.2 0.7 12.5
2 8.Long duration pigeon pea + Groundnut 582.5 3.59 0.16 3.00 20.9 0.9 12.3

268
Appendix 3.2b: Nutrient concentration and yields, twigs pigeon pea main experiment season one
REP.
Treatments
Twigs
kg ha-1
N(%)
P(%)
Ca(%)
N Yield
kg ha-1
P Yield
kg ha-1
Ca Yield
kg ha-1
1 2.Medium duration pigeon pea 710 3.04 0.07 0.99 21.6 1.0 7.0
2 2.Medium duration pigeon pea 772.5 3.19 0.08 1.63 24.6 1.2 12.6
3 2.Medium duration pigeon pea 480 1.99 0.55 1.98 10.2 2.6 9.5
1 3.Long duration pigeon pea 1292.5 1.84 0.12 1.30 23.8 1.6 13.0
2 3.Long duration pigeon pea 562.5 2.39 0.07 1.63 13.4 0.9 9.2
3 3.Long duration pigeon pea 727.5 1.69 0.60 2.87 12.3 3.2 12.0
1 5.Medium duration pigeon pea +
Groundnut 557.5 2.44 0.09 1.30 13.6 0.9 7.2
2 5.Medium duration pigeon pea +
Groundnut 337.5 2.69 0.05 1.87 11.4 0.8 6.9
1 6.Long duration pigeon pea +
Groundnut 597.5 2.04 0.17 1.52 12.2 1.0 9.1
2 6.Long duration pigeon pea +
Groundnut 550 2.29 0.24 1.75 12.6 1.3 9.6
3 6.Long duration pigeon pea +
Groundnut 335 1.99 0.19 2.10 10.0 0.8 7.0

269
Appendix 3.2c: Nutrient concentration and yields, litter pigeon pea main experiment season one
Rep.
Treatments
Litter
kg ha-1
N(%)
P(%)
Ca(%)
N
Yield
kg ha-1
P
Yield
kg ha-1
Ca
Yield
kg ha-1
1 2.Medium duration pigeon pea 2133.3 0.76 0.17 1.22 12.0 3.6 26.0
2 2.Medium duration pigeon pea 844.4 0.30 0.26 1.39 5.0 2.2 11.7
3 2.Medium duration pigeon pea 163.0 0.89 0.18 1.02 6.0 1.5 11.0
1 3.Long duration pigeon pea 933.3 0.54 0.17 1.25 5.0 1.6 11.7
2 3.Long duration pigeon pea 1600 0.60 0.19 1.29 9.6 3.0 20.6
3 3.Long duration pigeon pea 1170.4 0.92 0.17 1.69 10.8 2.0 19.8
1
5.Medium duration pigeon pea +
Groundnut 785.2 0.84 0.19 1.32 6.6 1.5 10.4
2
5.Medium duration pigeon pea +
Groundnut 1837.0 0.24 0.40 1.64 7.0 4.0 30.1
3
5.Medium duration pigeon pea +
Groundnut 2637.0 0.69 0.30 1.97 13.0 4.0 30.0
1 6.Long duration pigeon pea + Groundnut 1585.2 0.49 0.19 1.32 7.8 3.0 20.9
2 6.Long duration pigeon pea + Groundnut 1837.0 0.69 0.20 1.64 12.7 3.7 30.1
3 6.Long duration pigeon pea + Groundnut 1437.0 0.99 0.14 1.97 14.2 2.0 28.3
1
7.Medium duration pigeon pea +
Groundnut 1363.0 0.79 0.15 1.64 10.8 2.0 22.4

270
Appendix 3.3a: Nutrient concentration and yields, groundnut pods main experiment season one
REP.
Treatments
Pods
kg ha-
1
N(%)
P(%)
Ca(%)
N Yield
kg ha-1
P Yield
kg ha-1
Ca Yield
kg ha-1
1 4.Groundnut 324.5 0.94 0.09 0.35 3.1 0.2 1.1
2 4.Groundnut 190 1.34 0.11 0.70 2.5 0.2 1.3
3 4.Groundnut 50.25 0.69 0.09 0.50 1.5 0.1 0.8
1 5.Medium duration pigeon pea + Groundnut 196 0.84 0.10 0.35 1.6 0.2 0.7
2 5.Medium duration pigeon pea + Groundnut 1592.5 0.88 0.10 0.58 2.8 0.2 0.9
3 5.Medium duration pigeon pea + Groundnut 68.75 0.74 0.09 0.82 1.0 0.1 0.6
1 6.Long duration pigeon pea + Groundnut 84.75 1.49 0.11 0.58 1.3 0.1 0.5
2 6.Long duration pigeon pea + Groundnut 228.5 0.44 0.08 0.58 1.0 0.2 1.3
3 6.Long duration pigeon pea + Groundnut 232.75 0.29 0.13 0.58 0.7 0.2 1.3
1 7.Medium duration pigeon pea + Groundnut 102.5 0.69 0.09 0.47 1.4 0.2 0.5
2 7.Medium duration pigeon pea + Groundnut 112.75 0.99 0.09 0.47 1.1 0.1 0.5
3 7.Medium duration pigeon pea + Groundnut 193.5 0.34 0.14 0.47 1.4 0.3 0.9
1 8.Long duration pigeon pea + Groundnut 243.75 0.89 0.10 0.35 2.2 0.2 0.9
2 8.Long duration pigeon pea + Groundnut 200.75 1.29 0.13 0.47 2.6 0.3 0.9
3 8.Long duration pigeon pea + Groundnut 274.5 0.95 0.12 0.50 2.6 0.1 1.4

271
Appendix 3.3b: Nutrient concentration and yields, groundnut haulms main experiment season one
REP.
Treatments
G/nut
haulms
kg ha-1
N(%)
P(%)
Ca(%)
N
Yield
kg ha-1
P
Yield
kg ha-1
Ca
Yield
kg ha-1
1 4.Groundnut 592.5 2.39 0.55 0.80 14.2 3.3 4.7
2 4.Groundnut 682.5 1.34 0.19 0.80 9.1 1.3 5.5
3 4.Groundnut 692.5 3.44 0.15 0.99 15.0 1.0 6.9
1
5.Medium duration pigeon pea +
Groundnut 540
2.94 0.35 0.63 15.9 1.9 3.4
2
5.Medium duration pigeon pea +
Groundnut 682.5
3.54 0.18 0.80 13.0 1.2 5.5
3
5.Medium duration pigeon pea +
Groundnut 612.5
3.14 0.18 0.99 12.0 1.1 6.1
1
6.Long duration pigeon pea +
Groundnut 335
2.59 0.15 0.63 8.7 0.5 2.1
2
6.Long duration pigeon pea +
Groundnut 572.5
1.79 0.17 1.80 10.2 1.0 5.6
3
6.Long duration pigeon pea +
Groundnut 530
2.94 0.18 0.80 15.6 1.0 4.2
1
7.Medium duration pigeon pea +
Groundnut 332.5
3.29 0.15 0.80 10.9 0.5 2.7

272
Appendix 4.0a: Daily temperature at the time of nitrate nitrogen measurement
Dec-12
Day Max Temp oC Min Temp
oC Day Ave. Temp
oC
1 31.3 18.1 1 24.7
2 29.7 18.9 2 24.3
3 31.3 17.7 3 24.5
4 31.3 18.4 4 24.9
5 32.1 19.8 5 26.0
6 30.3 20.1 6 25.2
7 30.9 19.4 7 25.2
8 31.7 18.9 8 25.3
9 30.4 20.4 9 25.4
10 21.3 18.7 10 20.0
11 25.4 18.3 11 21.9
12 23.7 18.9 12 21.3
13 25.1 18.2 13 21.7
14 24.9 17.9 14 21.4
15 26.9 18.6 15 22.8
16 28.9 18.4 16 23.7
17 27.4 19.8 17 23.6
18 28.4 18.8 18 23.6
19 27.4 19.3 19 23.4
20 28.2 19.6 20 23.9
21 27.9 18.4 21 23.2
22 27.9 16.6 22 22.3
23 28.2 18.9 23 23.6
24 27.9 18.3 24 23.1
25 29.4 18.6 25 24.0
26 28.4 18.6 26 23.5
27 29.7 18.6 27 24.2
28 27.6 19.8 28 23.7
29 27.4 17.9 29 22.7
30 28.7 18.3 30 23.5
31 29.2 19.4 31 24.3

273
Appendix 4.0b: Daily temperature at the time of nitrate nitrogen measurement
Dec-13 Jan-13
Day
R/Fall
(mm) Day
Max Temp
oC
Min Temp
oC
Ave. Temp
oC
R/Fall
(mm)
1 - 1 30.6 19.4 25.0 -
2 - 2 29.7 19.7 24.7 4.3
3 - 3 26.9 19.9 23.4 -
4 - 4 28.9 20.5 24.7 5.9
5 - 5 22.8 19.6 21.2 8.4
6 - 6 26.8 19.1 23.0 12.3
7 - 7 26.4 19.1 22.8 46.3
8 - 8 25.1 18.1 21.6 1.9
9 44.8 9 21.2 19.7 20.5 25.1
10 17.8 10 25.7 18.7 22.2 20.7
11 6.4 11 27.4 18.8 23.1 124.9
12 11.8 12 26.9 19.5 23.2 -
13 5.4 13 25.4 18.2 21.8 0.2
14 13.2 14 26.7 18.8 22.8 23.7
15 13.1 15 26.8 19.2 23.0 12.1
16 - 16 28.6 17.9 23.3 1.7
17 5.8 17 28.2 19.4 23.8 1.6
18 - 18 29.6 19.1 24.4 -
19 0.6 19 30.7 18.8 24.8 -
20 51.6 20 29.4 20.1 24.8 1.3
21 - 21 28.6 19.9 24.3 4.3
22 - 22 28.2 19.6 23.9 4.7
23 34.7 23 26.6 19.2 22.9 49.6
24 34.4 24 27.6 19.7 23.7 -
25 - 25 26.4 20.4 23.4 1.4
26 5.3 26 27.4 17.8 22.6 4.4
27 11.4 27 27.9 16.9 22.4 0.2
28 12.3 28 26.9 16.9 21.9 2.5

274
Appendix 4.0c: Off season daily temperature at the time of nitrate nitrogen
measurement
DATE
Mean
Temp oC DATE
Mean
Temp oC
1 22.7 14.9 18.8 1 27.4 12.2 19.8
2 25.4 12.9 19.2 2 25.7 8.9 17.3
3 25.9 11.3 18.6 3 25.8 7.7 16.75
4 26.3 12.4 19.4 4 25.2 8.8 17
5 27.4 14.3 20.9 5 25.7 9.9 17.8
6 23.8 15.5 19.7 6 27.6 9.6 18.6
7 23.3 9.7 16.5 7 25.2 9.2 17.2
8 24.7 12.1 18.4 8 25.3 8.6 16.95
9 27.7 10.6 19.2 9 25.2 9.7 17.45
10 28.3 11.9 20.1 10 26.7 9.4 18.05
11 26.8 13.7 20.3 11 22.1 10.9 16.5
12 28.1 14.3 21.2 12 21.7 13.4 17.55
13 26.3 10.7 18.5 13 24.4 9.4 16.9
14 25.6 11.6 18.6 14 25.3 10.3 17.8
15 26.2 10.7 18.5 15 25.8 11.3 18.55
16 25.7 11.6 18.7 16 23.4 9.4 16.4
17 27.2 11.9 19.6 17 19.2 9.4 14.3
18 26.6 12.5 19.6 18 22.1 10.9 16.5
19 24.9 13.2 19.1 19 19.9 10.7 15.3
20 25.2 12.8 19.0 20 22.4 10.3 16.35
21 24.4 11.9 18.2 21 22.3 8.8 15.55
22 25.6 12.7 19.2 22 24.6 7.4 16
23 25.8 13.2 19.5 23 22.5 8.9 15.7
24 26 14.4 20.2 24 23 9.9 16.45
25 25.7 13.7 19.7 25 22.8 8.4 15.6
26 26.4 10.6 18.5 26 25.7 8.4 17.05
27 27.7 10.4 19.1 27 25.7 8.8 17.25
28 27.4 11.7 19.6 28 24.7 9.6 17.15
29 27.4 12.3 19.9 29 25.4 8.9 17.15
30 27.4 12.3 19.9 30 25.6 9.8 17.7
31 28.4 12.1 20.3

275
Appendix 4.0d: Rainfall and mean daily temperature December, 2012
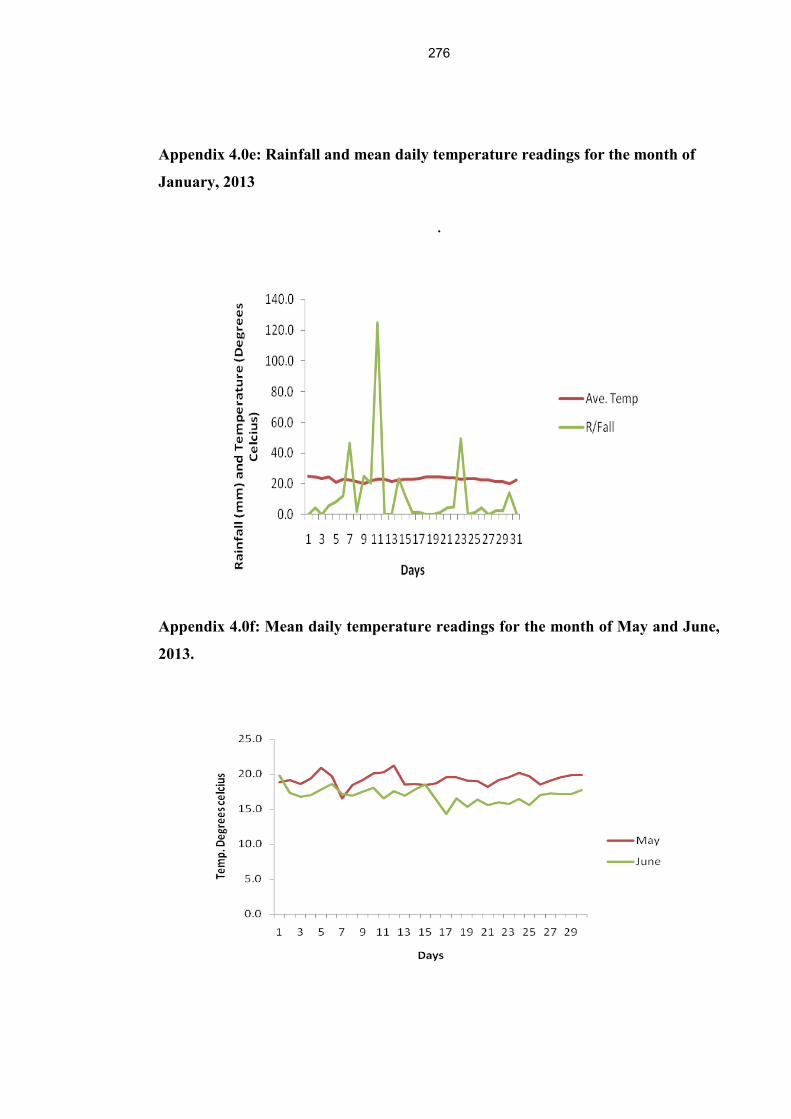
276
Appendix 4.0e: Rainfall and mean daily temperature readings for the month of
January, 2013
.
Appendix 4.0f: Mean daily temperature readings for the month of May and June,
2013.

277
Appendix 4.1: Soil pH at the time of nitrate nitrogen measurement
Rep. Treatment pHH2O
Depth
(cm)
Point
No. 1
Point
No. 2
Point
No. 3
Point
No. 4 Mean
1 1.Sole maize 0-20 5.47 5.68 5.70 - 5.62
1 1.Sole maize 0-20 5.93 5.54 5.87 5.34 5.67
1 1.Sole maize 0-20 5.22 5.26 5.13 5.42 5.26
1 2.Medium duration pigeon pea 0-20 5.46 5.70 5.74 5.66 5.64
1 2.Medium duration pigeon pea 0-20 5.64 5.48 5.44 5.31 5.47
1 2.Medium duration pigeon pea 0-20 5.28 5.13 5.16 5.08 5.16
1 3.Long duration pigeon pea 0-20 5.75 5.76 5.79 5.85 5.79
1 3.Long duration pigeon pea 0-20 5.80 5.92 5.73 5.62 5.77
2 3.Long duration pigeon pea 0-20 5.09 5.36 5.09 5.14 5.17
2 4.Sole groundnut 0-20 5.78 5.80 5.79 5.84 5.80
2 4.Sole groundnut 0-20 5.73 5.85 5.72 5.38 5.67
2 4.Sole groundnut 0-20 5.26 5.07 4.86 - 5.06
2 5.Medium duration pigeon pea + groundnut 0-20 5.45 5.07 5.01 5.90 5.36
2 5.Medium duration pigeon pea + groundnut 0-20 5.68 5.93 5.97 5.84 5.86
2 5.Medium duration pigeon pea + groundnut 0-20 4.76 4.99 5.45 5.23 5.11
2 6.Long duration pigeon pea + groundnut 0-20 6.02 5.94 5.98 6.01 5.99
3 6.Long duration pigeon pea + groundnut 0-20 5.26 4.92 5.42 5.35 5.24
3 6.Long duration pigeon pea + groundnut 0-20 6.57 5.88 5.71 5.29 5.86

278
Rep.
Treatment pHH2O
Depth
(cm)
Point
No. 1
Point
No. 2
Point
No. 3
Point
No. 4
Mean
3 7.Medium duration pigeon pea + groundnut 0-20 5.94 5.92 5.72 5.99 5.89
3 7.Medium duration pigeon pea + groundnut 0-20 5.72 5.53 5.76 5.87 5.72
3 7.Medium duration pigeon pea + groundnut 0-20 4.94 5.45 5.31 - 5.23
3 8.Long duration pigeon pea + groundnut 0-20 5.96 5.94 5.87 6.01 5.95
3 8.Long duration pigeon pea + groundnut 0-20 5.61 5.53 5.68 5.49 5.58
3 8.Long duration pigeon pea + groundnut 0-20 5.10 5.09 5.71 5.02 5.23

279
Appendix 4.1: Soil pH at the time of nitrate nitrogen measurement
Rep. Treatment pHH2O
Depth
(cm)
Point
No. 1 Point No. 2
Point No.
3
Point No.
4 Mean
1 1.Sole maize 20-40 5.62 5.71 5.68 - 5.67
1 1.Sole maize 20-40 5.80 5.54 5.76 5.37 5.62
1 1.Sole maize 20-40 4.99 5.07 5.07 4.97 5.03
1 2.Medium duration pigeon pea 20-40 5.68 5.79 5.70 5.60 5.69
1 2.Medium duration pigeon pea 20-40 5.80 5.78 5.31 5.18 5.52
1 2.Medium duration pigeon pea 20-40 5.17 5.20 5.17 5.24 5.20
1 3.Long duration pigeon pea 20-40 5.74 5.70 5.80 5.84 5.77
1 3.Long duration pigeon pea 20-40 5.81 5.95 5.30 5.43 5.62
2 3.Long duration pigeon pea 20-40 4.92 5.33 5.18 5.08 5.13
2 4.Sole groundnut 20-40 5.79 5.77 4.82 5.87 5.56
2 4.Sole groundnut 20-40 5.84 5.72 5.42 5.36 5.59
2 4.Sole groundnut 20-40 5.07 4.92 5.00 - 5.00
2 5.Medium duration pigeon pea + groundnut 20-40 5.20 5.05 5.97 5.76 5.50
2 5.Medium duration pigeon pea + groundnut 20-40 5.73 5.88 5.88 5.50 5.75
2 5.Medium duration pigeon pea + groundnut 20-40 4.97 4.92 5.42 5.10 5.10
2 6.Long duration pigeon pea + groundnut 20-40 5.95 5.97 6.10 5.92 5.99
3 6.Long duration pigeon pea + groundnut 20-40 5.08 4.98 5.15 5.28 5.12
3 6.Long duration pigeon pea + groundnut 20-40 5.66 5.44 5.53 4.95 5.40

280
Rep.
Treatment pHH2O
Depth
(cm)
Point
No. 1
Point No. 2
Point No.
3
Point No.
4
Mean
3 7.Medium duration pigeon pea + groundnut 20-40 6.02 5.96 5.90 5.96 5.96
3 7.Medium duration pigeon pea + groundnut 20-40 5.40 5.60 5.62 5.83 5.61
3 7.Medium duration pigeon pea + groundnut 20-40 5.10 5.26 5.05 - 5.14
3 8.Long duration pigeon pea + groundnut 20-40 5.93 5.95 6.03 6.04 5.99
3 8.Long duration pigeon pea + groundnut 20-40 5.44 5.55 5.43 5.52 5.49
3 8.Long duration pigeon pea + groundnut 20-40 4.86 4.95 5.18 4.82 4.95

281
Appendix 4.2: Soil temperature at the time of soil nitrate nitrogen measurement
Rep
No. Treatment
Depth
(cm)
Temp oC Mean
Temp oC 1 2 3 4
1 1.Sole maize 0-20 25.90 26.00 25.80 25.10 25.70
1 1.Sole maize 0-20 29.60 27.50 29.00 28.60 28.68
1 1.Sole maize 0-20 24.00 24.10 24.10 24.10 24.08
1 2.Medium duration pigeon pea 0-20 28.50 26.60 26.00 26.00 26.78
1 2.Medium duration pigeon pea 0-20 29.40 29.30 30.10 29.60 29.60
1 2.Medium duration pigeon pea 0-20 24.30 24.10 24.00 24.30 24.18
1 3.Long duration pigeon pea 0-20 25.60 25.20 25.40 25.00 25.30
1 3.Long duration pigeon pea 0-20 27.30 27.00 27.10 27.10 27.13
2 3.Long duration pigeon pea 0-20 25.30 25.20 25.00 25.70 25.30
2 4.Sole groundnut 0-20 26.10 26.40 26.90 28.40 26.95
2 4.Sole groundnut 0-20 27.80 27.80 27.30 26.70 27.40
2 4.Sole groundnut 0-20 24.90 24.40 24.50 - 24.60
2 5.Medium duration pigeon pea + groundnut 0-20 27.40 27.80 28.20 27.90 27.83
2 5.Medium duration pigeon pea + groundnut 0-20 27.00 26.40 26.40 26.60 26.60
2 5.Medium duration pigeon pea + groundnut 0-20 24.10 23.80 23.60 23.70 23.80
2 6.Long duration pigeon pea + groundnut 0-20 27.90 27.30 26.70 28.40 27.58
3 6.Long duration pigeon pea + groundnut 0-20 28.80 27.50 30.30 26.90 28.38
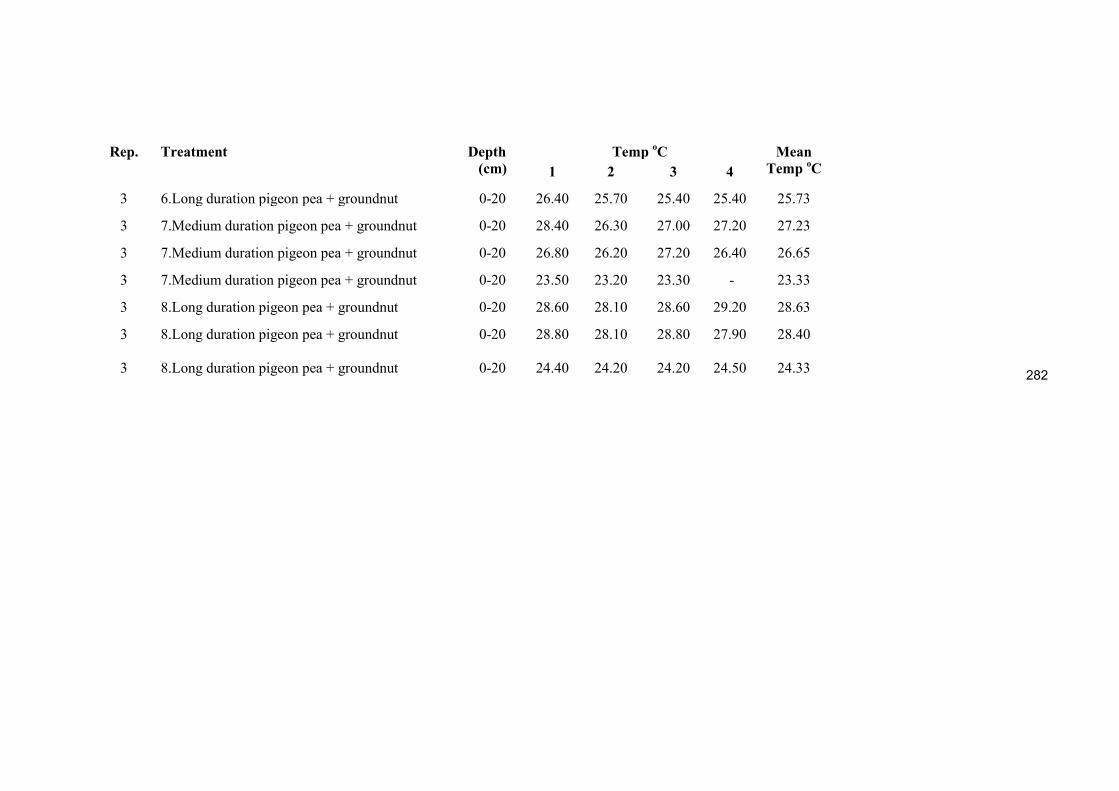
282
Rep. Treatment Depth
(cm)
Temp oC Mean
Temp oC 1 2 3 4
3 6.Long duration pigeon pea + groundnut 0-20 26.40 25.70 25.40 25.40 25.73
3 7.Medium duration pigeon pea + groundnut 0-20 28.40 26.30 27.00 27.20 27.23
3 7.Medium duration pigeon pea + groundnut 0-20 26.80 26.20 27.20 26.40 26.65
3 7.Medium duration pigeon pea + groundnut 0-20 23.50 23.20 23.30 - 23.33
3 8.Long duration pigeon pea + groundnut 0-20 28.60 28.10 28.60 29.20 28.63
3 8.Long duration pigeon pea + groundnut 0-20 28.80 28.10 28.80 27.90 28.40
3 8.Long duration pigeon pea + groundnut 0-20 24.40 24.20 24.20 24.50 24.33

283
Appendix 4.3: Soil humidity at the time of soil nitrate nitrogen measurement
Rep. Treatment
Depth
(cm)
Soil humidity (%) Mean
(%) 1 2 3 4
1 1.Sole maize 0-20 78.00 75.00 79.00 83.00 78.75
1 1.Sole maize 0-20 73.60 76.90 70.50 72.70 73.43
1 1.Sole maize 0-20 71.60 77.00 73.90 77.60 75.03
1 2.Medium duration pigeon pea 0-20 72.00 80.00 84.00 80.00 79.00
1 2.Medium duration pigeon pea 0-20 78.10 66.10 63.90 67.50 68.90
1 2.Medium duration pigeon pea 0-20 70.60 73.00 70.30 78.00 72.98
1 3.Long duration pigeon pea 0-20 82.00 81.50 86.00 80.00 82.38
1 3.Long duration pigeon pea 0-20 74.60 72.60 79.40 73.90 75.13
2 3.Long duration pigeon pea 0-20 68.40 66.90 67.10 69.70 68.03
2 4.Sole groundnut 0-20 89.50 83.20 79.50 81.00 83.30
2 4.Sole groundnut 0-20 75.50 74.80 75.00 75.50 75.20
2 4.Sole groundnut 0-20 79.50 69.20 73.70 - 74.13
2 5.Medium duration pigeon pea + groundnut 0-20 76.10 76.30 81.00 76.00 77.35
2 5.Medium duration pigeon pea + groundnut 0-20 73.40 78.60 77.60 80.40 77.50
2 5.Medium duration pigeon pea + groundnut 0-20 76.80 76.60 80.30 78.50 78.05
2 6.Long duration pigeon pea + groundnut 0-20 76.30 78.90 84.30 75.80 78.83
3 6.Long duration pigeon pea + groundnut 0-20 73.60 74.90 67.10 79.30 73.73
3 6.Long duration pigeon pea + groundnut 0-20 67.60 66.30 68.50 69.10 67.88

284
Rep.
Treatments
Depth
(cm)
Soil humidity (%)
Mean
(%)
1 2 3 4
1 1.Sole maize 0-20 78.00 75.00 79.00 83.00 78.75
3 7.Medium duration pigeon pea + groundnut 0-20 73.90 76.20 78.50 - 76.20
3 8.Long duration pigeon pea + groundnut 0-20 77.20 79.80 85.50 79.80 80.58
3 8.Long duration pigeon pea + groundnut 0-20 76.50 73.20 75.20 75.60 75.13
3 8.Long duration pigeon pea + groundnut 0-20 76.90 74.90 70.90 75.80 74.63

285
Appendix 4.3: Soil temperature at the time of soil nitrate nitrogen measurement
Rep
No.
Treatment Depth
(cm)
Temperature oC Mean
oC
1 1.Sole maize 20-40 25.80 26.00 25.80 25.80 25.85
1 1.Sole maize 20-40 29.50 27.60 28.70 28.30 28.53
1 1.Sole maize 20-40 24.00 24.10 24.20 24.30 24.15
1 2.Medium duration pigeon pea 20-40 27.80 26.20 26.00 26.00 26.50
1 2.Medium duration pigeon pea 20-40 29.20 29.40 30.00 29.40 29.50
1 2.Medium duration pigeon pea 20-40 24.20 24.20 24.10 24.30 24.20
1 3.Long duration pigeon pea 20-40 25.60 25.30 25.30 25.00 25.30
1 3.Long duration pigeon pea 20-40 27.20 27.00 27.00 26.90 27.03
2 3.Long duration pigeon pea 20-40 25.30 25.90 26.10 24.40 25.43
2 4.Sole groundnut 20-40 25.80 26.40 27.30 27.70 26.80
2 4.Sole groundnut 20-40 27.40 27.40 27.00 26.60 27.10
2 4.Sole groundnut 20-40 24.90 25.00 24.40 - 24.77
2 5.Medium duration pigeon pea + groundnut 20-40 25.90 28.40 26.10 27.50 26.98
2 5.Medium duration pigeon pea + groundnut 20-40 26.90 27.00 26.60 26.50 26.75
2 5.Medium duration pigeon pea + groundnut 20-40 24.30 23.90 23.90 23.80 23.98
2 6.Long duration pigeon pea + groundnut 20-40 27.40 27.10 26.40 27.80 27.18
3 6.Long duration pigeon pea + groundnut 20-40 28.40 27.30 28.00 26.80 27.63
3 6.Long duration pigeon pea + groundnut 20-40 26.80 26.10 25.20 25.90 26.00

286
Rep. Treatment Depth
(cm)
Temperature oC Mean
oC
3 7.Medium duration pigeon pea + groundnut 20-40 27.20 26.40 26.60 27.50 26.93
3 7.Medium duration pigeon pea + groundnut 20-40 26.40 27.00 27.10 26.60 26.78
3 7.Medium duration pigeon pea + groundnut 20-40 23.80 23.30 23.40 - 23.50
3 8.Long duration pigeon pea + groundnut 20-40 28.30 27.50 29.40 29.20 28.60
3 8.Long duration pigeon pea + groundnut 20-40 28.80 28.00 28.10 27.60 28.13
3 8.Long duration pigeon pea + groundnut 20-40 24.40 24.30 24.40 24.60 24.43

287
Appendix 4.4: Soil humidity at the time of soil nitrate nitrogen measurement
Rep. Treatment
Depth
(cm) Soil humidity (%)
Mean
(%)
1 1.Sole maize 20-40 81.00 80.00 82.00 84.00 81.75
1 1.Sole maize 20-40 71.30 76.20 70.20 73.60 72.83
1 1.Sole maize 20-40 75.50 77.90 79.80 82.00 78.80
1 2.Medium duration pigeon pea 20-40 76.00 82.00 84.00 81.00 80.75
1 2.Medium duration pigeon pea 20-40 73.60 67.40 64.90 68.60 68.63
1 2.Medium duration pigeon pea 20-40 73.10 75.80 73.60 79.50 75.50
1 3.Long duration pigeon pea 20-40 84.70 86.00 86.40 81.00 84.53
1 3.Long duration pigeon pea 20-40 75.70 78.00 79.90 76.50 77.53
2 3.Long duration pigeon pea 20-40 70.40 69.00 70.40 68.60 69.60
2 4.Sole groundnut 20-40 87.90 81.10 83.30 77.80 82.53
2 4.Sole groundnut 20-40 76.20 75.70 77.80 79.50 77.30
2 4.Sole groundnut 20-40 80.90 83.80 74.10 - 79.60
2 5.Medium duration pigeon pea + groundnut 20-40 81.20 84.00 86.20 82.00 83.35
2 5.Medium duration pigeon pea + groundnut 20-40 77.30 77.60 80.30 77.60 78.20
2 5.Medium duration pigeon pea + groundnut 20-40 80.90 83.50 80.60 80.10 81.28
2 6.Long duration pigeon pea + groundnut 20-40 77.90 78.50 84.40 74.60 78.85
3 6.Long duration pigeon pea + groundnut 20-40 73.10 74.90 74.70 79.70 75.60
3 6.Long duration pigeon pea + groundnut 20-40 70.10 68.00 69.20 71.40 69.68

288
Rep. Treatment
Depth
(cm)
Soil
humidity
(%) 1 2 3 4
Mean
(%)
3 7.Medium duration pigeon pea + groundnut 20-40 81.80 88.10 84.40 87.30 85.40
3 7.Medium duration pigeon pea + groundnut 20-40 76.90 77.40 78.60 79.20 78.03
3 7.Medium duration pigeon pea + groundnut 20-40 81.10 77.80 80.10 - 79.67
3 8.Long duration pigeon pea + groundnut 20-40 74.50 77.90 84.80 80.10 79.33
3 8.Long duration pigeon pea + groundnut 20-40 73.20 73.70 77.50 77.20 75.40
3 8.Long duration pigeon pea + groundnut 20-40 76.40 78.60 77.70 79.90 78.15

289
Appendix 4.5: Soil nitrate nitrogen, day 1
Readings in mg L-1
Rep
No. Treatment
Depth
(cm)
Point
No. 1
Point No.
2
Point
No. 3
Point
No. 4 Mean
Corrected
Mean
(Meanx5)
Adjusted
mean (Corr
mean-28)
Nitrate-
N(Adj.
Meanx0.23)
1 1.Sole maize 0-20 220 360 240 240 265.0 1325.0 1297.0 298.3
1 1.Sole maize 0-20 230 220 440 410 325.0 1625.0 1597.0 367.3
1 1.Sole maize 0-20 420 330 370 310 357.5 1787.5 1759.5 404.7
1 2.Medium duration pigeon pea 0-20 110 200 210 220 185.0 925.0 897.0 206.3
1 2.Medium duration pigeon pea 0-20 490 290 450 430 415.0 2075.0 2047.0 470.8
1 2.Medium duration pigeon pea 0-20 260 310 330 490 347.5 1737.5 1709.5 393.2
1 3.Long duration pigeon pea 0-20 70 380 280 190 230.0 1150.0 1122.0 258.1
1 3.Long duration pigeon pea 0-20 100 360 220 300 245.0 1225.0 1197.0 275.3
2 3.Long duration pigeon pea 0-20 390 240 270 400 325.0 1625.0 1597.0 367.3
2 4.Sole groundnut 0-20 310 480 330 300 355.0 1775.0 1747.0 401.8
2 4.Sole groundnut 0-20 410 270 320 220 305.0 1525.0 1497.0 344.3
2 4.Sole groundnut 0-20 230 350 350 - 232.5 1162.5 1134.5 260.9
2
5.Medium duration pigeon pea +
groundnut 0-20 470 210 130 110 230.0 1150.0 1122.0 258.1
2
5.Medium duration pigeon pea +
groundnut 0-20 450 290 310 290 335.0 1675.0 1647.0 378.8
2
5.Medium duration pigeon pea +
groundnut 0-20 430 540 420 410 450.0 2250.0 2222.0 511.1

290
Rep
No.
Treatments
Depth
(cm)
Point
No. 1
Point No.
2
Point
No. 3
Point
No. 4 Mean
Corrected
Mean
(Meanx5)
Adjusted
mean (Corr
mean-28)
Nitrate-
N(Adj.
Meanx0.23)
3
6.Long duration pigeon pea +
groundnut 0-20 420 190 220 230 265.0 1325.0 1297.0 298.3
3
6.Long duration pigeon pea +
groundnut 0-20 200 90 120 210 155.0 775.0 747.0 171.8
3
7.Medium duration pigeon pea +
groundnut 0-20 210 280 140 150 195.0 975.0 947.0 217.8
3
7.Medium duration pigeon pea +
groundnut 0-20 230 260 180 230 225.0 1125.0 1097.0 252.3
3
7.Medium duration pigeon pea +
groundnut 0-20 200 310 420 - 232.5 1162.5 1134.5 260.9
3 8.Long duration pigeon pea +
groundnut 0-20 330 560 400 470 440.0 2200.0 2172.0 499.6
3 8.Long duration pigeon pea +
groundnut 0-20 240 390 370 410 352.5 1762.5 1734.5 398.9
3 8.Long duration pigeon pea +
groundnut 0-20 370 350 530 410 415.0 2075.0 2047.0 470.8
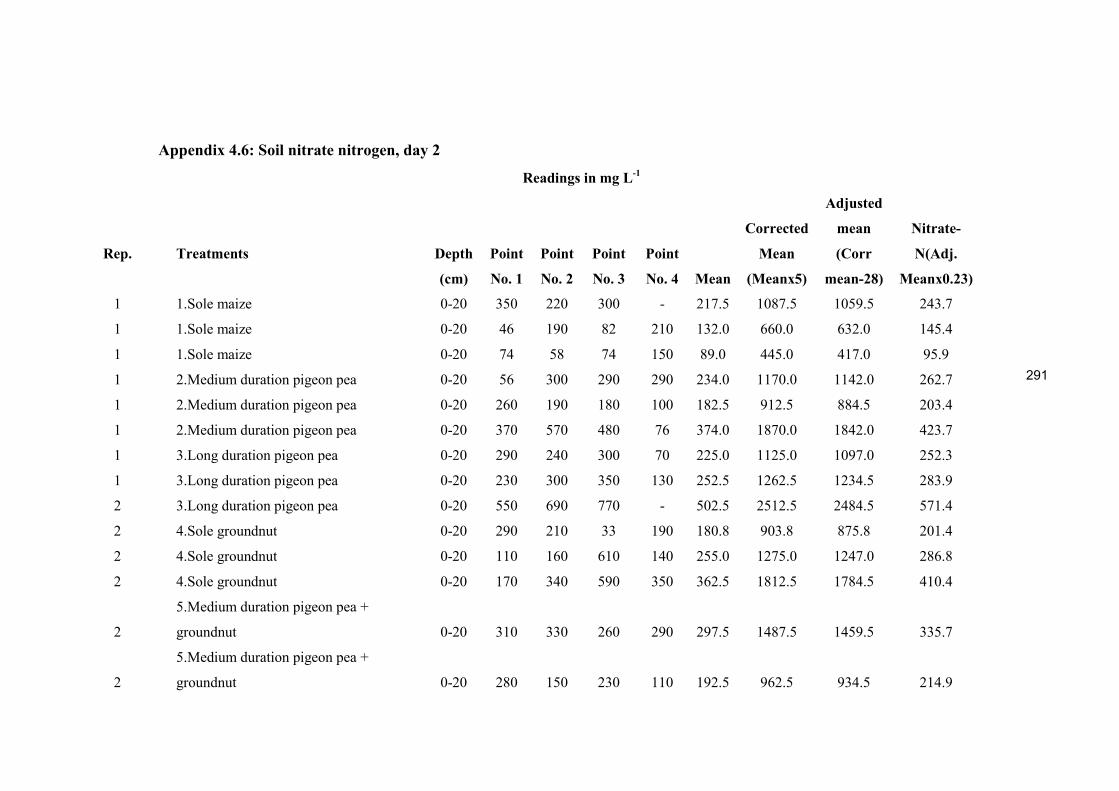
291
Appendix 4.6: Soil nitrate nitrogen, day 2
Readings in mg L-1
Rep.
Treatments
Depth
(cm)
Point
No. 1
Point
No. 2
Point
No. 3
Point
No. 4 Mean
Corrected
Mean
(Meanx5)
Adjusted
mean
(Corr
mean-28)
Nitrate-
N(Adj.
Meanx0.23)
1 1.Sole maize 0-20 350 220 300 - 217.5 1087.5 1059.5 243.7
1 1.Sole maize 0-20 46 190 82 210 132.0 660.0 632.0 145.4
1 1.Sole maize 0-20 74 58 74 150 89.0 445.0 417.0 95.9
1 2.Medium duration pigeon pea 0-20 56 300 290 290 234.0 1170.0 1142.0 262.7
1 2.Medium duration pigeon pea 0-20 260 190 180 100 182.5 912.5 884.5 203.4
1 2.Medium duration pigeon pea 0-20 370 570 480 76 374.0 1870.0 1842.0 423.7
1 3.Long duration pigeon pea 0-20 290 240 300 70 225.0 1125.0 1097.0 252.3
1 3.Long duration pigeon pea 0-20 230 300 350 130 252.5 1262.5 1234.5 283.9
2 3.Long duration pigeon pea 0-20 550 690 770 - 502.5 2512.5 2484.5 571.4
2 4.Sole groundnut 0-20 290 210 33 190 180.8 903.8 875.8 201.4
2 4.Sole groundnut 0-20 110 160 610 140 255.0 1275.0 1247.0 286.8
2 4.Sole groundnut 0-20 170 340 590 350 362.5 1812.5 1784.5 410.4
2
5.Medium duration pigeon pea +
groundnut 0-20 310 330 260 290 297.5 1487.5 1459.5 335.7
2
5.Medium duration pigeon pea +
groundnut 0-20 280 150 230 110 192.5 962.5 934.5 214.9

292
Rep.
Treatments
Depth
(cm)
Point
No. 1
Point
No. 2
Point
No. 3
Point
No. 4 Mean
Corrected
Mean
(Meanx5)
Adjusted
mean
(Corr
mean-28)
Nitrate-
N(Adj.
Meanx0.23)
3 6.Long duration pigeon pea + groundnut 0-20 430 150 160 150 222.5 1112.5 1084.5 249.4
3 6.Long duration pigeon pea + groundnut 0-20 390 140 420 200 287.5 1437.5 1409.5 324.2
3
7.Medium duration pigeon pea +
groundnut 0-20 290 190 100 190 192.5 962.5 934.5 214.9
3
7.Medium duration pigeon pea +
groundnut 0-20 130 250 280 690 337.5 1687.5 1659.5 381.7
3
7.Medium duration pigeon pea +
groundnut 0-20 270 190 140 - 150.0 750.0 722.0 166.1
3 8.Long duration pigeon pea + groundnut 0-20 240 300 250 270 265.0 1325.0 1297.0 298.3
3 8.Long duration pigeon pea + groundnut 0-20 150 100 88 57 98.8 493.8 465.8 107.1
3 8.Long duration pigeon pea + groundnut 0-20 75 130 150 180 133.8 668.8 640.8 147.4

293
Appendix 4.7: Soil nitrate nitrogen, day 3
Readings in mg L-1
Rep.
Treatments
Depth
(cm)
Point
No. 1
Point
No. 2
Point
No. 3
Point
No. 4
Mean
Corrected
Mean
(Meanx5)
Adjusted
mean
(Corr
mean-28)
Nitrate-
N(Adj.
Meanx0.23)
1 1.Sole maize 0-20 360 170 180 - 177.5 887.5 859.5 197.7
1 1.Sole maize 0-20 320 300 290 220 282.5 1412.5 1384.5 318.4
1 1.Sole maize 0-20 160 78 170 55 115.8 578.8 550.8 126.7
1 2.Medium duration pigeon pea 0-20 160 180 180 200 180.0 900.0 872.0 200.6
1 2.Medium duration pigeon pea 0-20 300 250 340 200 272.5 1362.5 1334.5 306.9
1 2.Medium duration pigeon pea 0-20 94 91 180 100 116.3 581.3 553.3 127.2
1 3.Long duration pigeon pea 0-20 170 170 180 290 202.5 1012.5 984.5 226.4
1 3.Long duration pigeon pea 0-20 87 130 130 130 119.3 596.3 568.3 130.7
2 3.Long duration pigeon pea 0-20 83 100 95 63 85.3 426.3 398.3 91.6
2 4.Sole groundnut 0-20 140 270 220 170 200.0 1000.0 972.0 223.6
2 4.Sole groundnut 0-20 140 93 79 64 94.0 470.0 442.0 101.7
2 4.Sole groundnut 0-20 120 200 150 - 117.5 587.5 559.5 128.7
2 5.Medium duration pigeon pea + groundnut 0-20 140 160 190 140 157.5 787.5 759.5 174.7
2 5.Medium duration pigeon pea + groundnut 0-20 110 150 170 130 140.0 700.0 672.0 154.6

294
Rep.
Treatments
Depth
(cm)
Point
No. 1
Point
No. 2
Point
No. 3
Point
No. 4
Mean
Corrected
Mean
(Meanx5)
Adjusted
mean
(Corr
mean-28)
Nitrate-
N(Adj.
Meanx0.23)
2 5.Medium duration pigeon pea + groundnut 0-20 170 350 150 130 200.0 1000.0 972.0 223.6
2 6.Long duration pigeon pea + groundnut 0-20 440 320 270 260 322.5 1612.5 1584.5 364.4
3 6.Long duration pigeon pea + groundnut 0-20 530 510 120 96 314.0 1570.0 1542.0 354.7
3 6.Long duration pigeon pea + groundnut 0-20 110 310 160 75 163.8 818.8 790.8 181.9
3 7.Medium duration pigeon pea + groundnut 0-20 210 270 300 260 260.0 1300.0 1272.0 292.6
3 7.Medium duration pigeon pea + groundnut 0-20 200 86 110 130 131.5 657.5 629.5 144.8
3 7.Medium duration pigeon pea + groundnut 0-20 160 200 140 - 125.0 625.0 597.0 137.3
3 8.Long duration pigeon pea + groundnut 0-20 220 250 200 260 232.5 1162.5 1134.5 260.9
3 8.Long duration pigeon pea + groundnut 0-20 330 440 260 250 320.0 1600.0 1572.0 361.6
3 8.Long duration pigeon pea + groundnut 0-20 100 180 81 160 130.3 651.3 623.3 143.3

295
Appendix 4.8: Soil nitrate nitrogen, day 4
Readings in mg L-1
Rep No. Treatment
Depth
(cm)
Point
No. 1
Point
No. 2
Point
No. 3
Point
No. 4 Mean
Corrected
Mean
(Meanx5)
Adjusted
mean
(Corr
mean-28)
Nitrate-
N(Adj.
Meanx0.23)
1 1.Sole maize 0-20 300 210 170 - 226.7 1133.3 1105.3 254.2
1 1.Sole maize 0-20 310 310 150 260 257.5 1287.5 1259.5 289.7
1 1.Sole maize 0-20 680 740 560 220 550.0 2750.0 2722.0 626.1
1 2.Medium duration pigeon pea 0-20 190 230 270 180 217.5 1087.5 1059.5 243.7
1 2.Medium duration pigeon pea 0-20 210 260 430 390 322.5 1612.5 1584.5 364.4
1 2.Medium duration pigeon pea 0-20 240 670 640 470 505.0 2525.0 2497.0 574.3
1 3.Long duration pigeon pea 0-20 230 320 400 200 287.5 1437.5 1409.5 324.2
1 3.Long duration pigeon pea 0-20 150 360 230 430 292.5 1462.5 1434.5 329.9
2 3.Long duration pigeon pea 0-20 490 220 290 210 302.5 1512.5 1484.5 341.4
2 4.Sole groundnut 0-20 300 350 230 280 290.0 1450.0 1422.0 327.1
2 4.Sole groundnut 0-20 220 310 490 230 312.5 1562.5 1534.5 352.9
2 4.Sole groundnut 0-20 560 460 580 - 533.3 2666.7 2638.7 606.9
2
5.Medium duration pigeon pea
+ groundnut 0-20 660 200 130 390 345.0 1725.0 1697.0 390.3
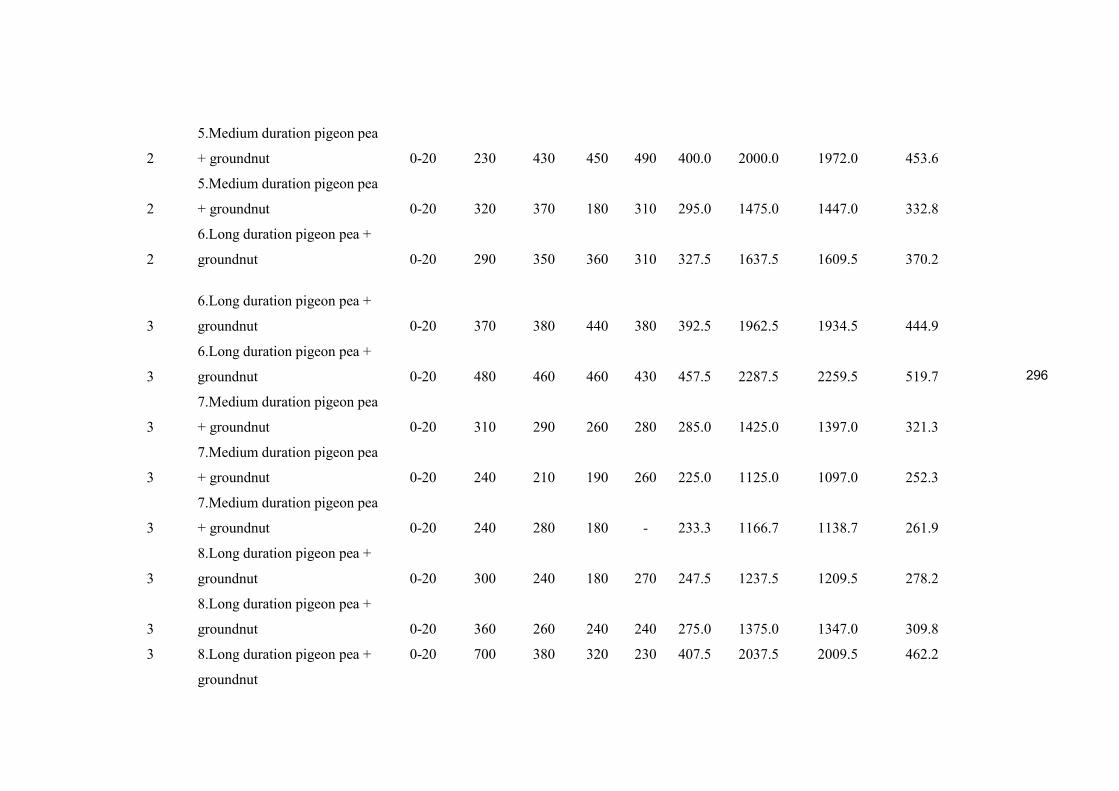
296
2
5.Medium duration pigeon pea
+ groundnut 0-20 230 430 450 490 400.0 2000.0 1972.0 453.6
2
5.Medium duration pigeon pea
+ groundnut 0-20 320 370 180 310 295.0 1475.0 1447.0 332.8
2
6.Long duration pigeon pea +
groundnut 0-20 290 350 360 310 327.5 1637.5 1609.5 370.2
3
6.Long duration pigeon pea +
groundnut 0-20 370 380 440 380 392.5 1962.5 1934.5 444.9
3
6.Long duration pigeon pea +
groundnut 0-20 480 460 460 430 457.5 2287.5 2259.5 519.7
3
7.Medium duration pigeon pea
+ groundnut 0-20 310 290 260 280 285.0 1425.0 1397.0 321.3
3
7.Medium duration pigeon pea
+ groundnut 0-20 240 210 190 260 225.0 1125.0 1097.0 252.3
3
7.Medium duration pigeon pea
+ groundnut 0-20 240 280 180 - 233.3 1166.7 1138.7 261.9
3
8.Long duration pigeon pea +
groundnut 0-20 300 240 180 270 247.5 1237.5 1209.5 278.2
3
8.Long duration pigeon pea +
groundnut 0-20 360 260 240 240 275.0 1375.0 1347.0 309.8
3
8.Long duration pigeon pea +
groundnut
0-20 700 380 320 230 407.5 2037.5 2009.5 462.2

297
Appendix 4.9: Soil nitrate nitrogen, day 5
Readings in mg L-1
Rep
No. Treatment
Depth
(cm)
Point
No. 1
Point
No. 2
Point
No. 3
Point
No. 4 Mean
Corrected
Mean
(Meanx5)
Adjusted
mean (Corr
mean-28)
Nitrate-
N(Adj.
Meanx0.23)
1 1.Sole maize 0-20 340 290 300 - 310.0 1550.0 1522.0 350.1
1 1.Sole maize 0-20 410 760 260 300 432.5 2162.5 2134.5 490.9
1 1.Sole maize 0-20 370 400 280 290 335.0 1675.0 1647.0 378.8
1 2.Medium duration pigeon pea 0-20 260 350 400 340 337.5 1687.5 1659.5 381.7
1 2.Medium duration pigeon pea 0-20 330 510 440 440 430.0 2150.0 2122.0 488.1
1 2.Medium duration pigeon pea 0-20 220 340 380 440 345.0 1725.0 1697.0 390.3
1 3.Long duration pigeon pea 0-20 370 250 440 350 352.5 1762.5 1734.5 398.9
1 3.Long duration pigeon pea 0-20 260 210 340 180 247.5 1237.5 1209.5 278.2
2 3.Long duration pigeon pea 0-20 250 220 370 200 260.0 1300.0 1272.0 292.6
2 4.Sole groundnut 0-20 200 390 330 450 342.5 1712.5 1684.5 387.4
2 4.Sole groundnut 0-20 220 390 130 280 255.0 1275.0 1247.0 286.8
2 4.Sole groundnut 0-20 370 410 350 - 282.5 1412.5 1384.5 318.4
2
5.Medium duration pigeon pea +
groundnut 0-20 210 260 210 360 260.0 1300.0 1272.0 292.6
2
5.Medium duration pigeon pea +
groundnut 0-20 260 190 270 300 255.0 1275.0 1247.0 286.8
2 5.Medium duration pigeon pea + 0-20 350 250 500 370 367.5 1837.5 1809.5 416.2

298
groundnut
2
6.Long duration pigeon pea +
groundnut 0-20 350 340 210 220 280.0 1400.0 1372.0 315.6
Rep
No. Treatment
Depth
(cm)
Point
No. 1
Point
No. 2
Point
No. 3
Point
No. 4 Mean
Corrected
Mean
(Meanx5)
Adjusted
mean (Corr
mean-28)
Nitrate-
N(Adj.
Meanx0.23)
3
6.Long duration pigeon pea +
groundnut 0-20 440 650 190 200 370.0 1850.0 1822.0 419.1
3
6.Long duration pigeon pea +
groundnut 0-20 270 220 300 200 247.5 1237.5 1209.5 278.2
3
7.Medium duration pigeon pea +
groundnut 0-20 250 220 280 180 232.5 1162.5 1134.5 260.9
3
7.Medium duration pigeon pea +
groundnut 0-20 210 270 360 270 277.5 1387.5 1359.5 312.7
3
7.Medium duration pigeon pea +
groundnut 0-20 180 410 210 - 200.0 1000.0 972.0 223.6
3
8.Long duration pigeon pea +
groundnut 0-20 400 340 330 430 375.0 1875.0 1847.0 424.8
3 8.Long duration pigeon pea +
groundnut 0-20 420 740 360 550 517.5 2587.5 2559.5 588.7
3 8.Long duration pigeon pea +
groundnut 0-20 390 280 280 380 332.5 1662.5 1634.5 375.9

299
Appendix 4.10: Soil nitrate nitrogen, day 6
Readings in mg L-1
Rep
No. Treatment 6
Depth
(cm)
Point
No. 1
Point
No. 2
Point
No. 3
Point
No. 4 Mean
Corrected
Mean
(Meanx5)
Adjusted
mean
(Corr
mean-
28)
Nitrate-
N(Adj.
Mean
x0.23)
1 1.Sole maize 0-20 100 74 130 - 76.0 380 352 81
1 1.Sole maize 0-20 130 90 83 - 75.8 379 351 81
1 1.Sole maize 0-20 210 130 130 100 142.5 713 685 157
1 2.Medium duration pigeon pea 0-20 58 92 110 59 79.8 399 371 85
1 2.Medium duration pigeon pea 0-20 84 470 120 120 198.5 993 965 222
1 2.Medium duration pigeon pea 0-20 100 160 120 140 130.0 650 622 143
1 3.Long duration pigeon pea 0-20 700 350 320 440 452.5 2263 2235 514
1 3.Long duration pigeon pea 0-20 120 130 110 140 125.0 625 597 137
2 3.Long duration pigeon pea 0-20 220 180 130 180 177.5 888 860 198
2 4.Sole groundnut 0-20 530 540 600 720 597.5 2988 2960 681
2 4.Sole groundnut 0-20 110 140 130 150 132.5 663 635 146
2 4.Sole groundnut 0-20 190 160 220 - 142.5 713 685 157
2
5.Medium duration pigeon pea +
groundnut 0-20 360 440 520 490 452.5 2263 2235 514

300
Rep
.
Treatments
Depth
(cm)
Point
No. 1
Point
No. 2
Point
No. 3
Point
No. 4 Mean
Corrected
Mean
(Meanx5)
Adjusted
mean
(Corr
mean-
28)
Nitrate-
N(Adj.
Meanx0.23)
2
6.Long duration pigeon pea +
groundnut 0-20 420 600 140 80 310.0 1550 1522 350
3
6.Long duration pigeon pea +
groundnut 0-20 110 99 97 130 109.0 545 517 119
3
6.Long duration pigeon pea +
groundnut 0-20 83 130 160 86 114.8 574 546 126
3
7.Medium duration pigeon pea +
groundnut 0-20 380 430 400 550 440.0 2200 2172 500
3
7.Medium duration pigeon pea +
groundnut 0-20 160 96 160 78 123.5 618 590 136
3
7.Medium duration pigeon pea +
groundnut 0-20 210 290 230 - 182.5 913 885 203
3
8.Long duration pigeon pea +
groundnut 0-20 480 460 480 450 467.5 2338 2310 531
3
8.Long duration pigeon pea +
groundnut 0-20 100 120 100 98 104.5 523 495 114

301
Appendix 4.10: Soil nitrate nitrogen, day 7
Readings in mg L-1
Rep. Treatment
Depth
(cm)
Point
No. 1
Point
No. 2
Point
No. 3
Point
No. 4 Mean
Corrected
Mean
(Meanx5)
Adjusted
mean
(Corr
mean-28)
Nitrate-
N(Adj.
Mean
x0.23)
1 1.Sole maize 0-20 200 180 190 - 142.5 713 685 157
1 1.Sole maize 0-20 62 69 84 - 53.8 269 241 55
1 1.Sole maize 0-20 300 350 350 150 287.5 1438 1410 324
1 2.Medium duration pigeon pea 0-20 180 180 210 200 192.5 963 935 215
1 2.Medium duration pigeon pea 0-20 84 100 110 88 95.5 478 450 103
1 2.Medium duration pigeon pea 0-20 230 250 220 160 215.0 1075 1047 241
1 3.Long duration pigeon pea 0-20 190 210 240 220 215.0 1075 1047 241
1 3.Long duration pigeon pea 0-20 82 84 69 130 91.3 456 428 98
2 3.Long duration pigeon pea 0-20 350 180 230 370 282.5 1413 1385 318
2 4.Sole groundnut 0-20 100 79 110 89 94.5 473 445 102
2 4.Sole groundnut 0-20 84 92 150 130 114.0 570 542 125
2 4.Sole groundnut 0-20 310 280 370 - 240.0 1200 1172 270
2
5.Medium duration pigeon pea +
groundnut 0-20 150 170 190 120 157.5 788 760 175

302
Rep.
Treatments
Depth
(cm)
Point
No. 1
Point
No. 2
Point
No. 3
Point
No. 4 Mean
Corrected
Mean
(Meanx5)
Adjusted
mean
(Corr
mean-28)
Nitrate-
N(Adj.
Meanx0.23)
2
5.Medium duration pigeon pea +
groundnut 0-20 120 110 170 110 127.5 638 610 140
2
5.Medium duration pigeon pea +
groundnut 0-20 170 390 370 360 322.5 1613 1585 364
2 6.Long duration pigeon pea +
groundnut 0-20 53 140 110 120 105.8 529 501 115
3 6.Long duration pigeon pea +
groundnut 0-20 110 120 110 100 110.0 550 522 120
3 6.Long duration pigeon pea +
groundnut 0-20 150 140 230 270 197.5 988 960 221
3 7.Medium duration pigeon pea +
groundnut 0-20 100 160 120 92 118.0 590 562 129
3 7.Medium duration pigeon pea +
groundnut 0-20 110 91 98 81 95.0 475 447 103
3 7.Medium duration pigeon pea +
groundnut 0-20 240 220 120 - 145.0 725 697 160
3 8.Long duration pigeon pea +
groundnut 0-20 110 110 160 83 115.8 579 551 127
3 8.Long duration pigeon pea +
groundnut 0-20 83 82 92 130 96.8 484 456 105
3 8.Long duration pigeon pea +
groundnut 0-20 360 490 390 320 390.0 1950 1922 442
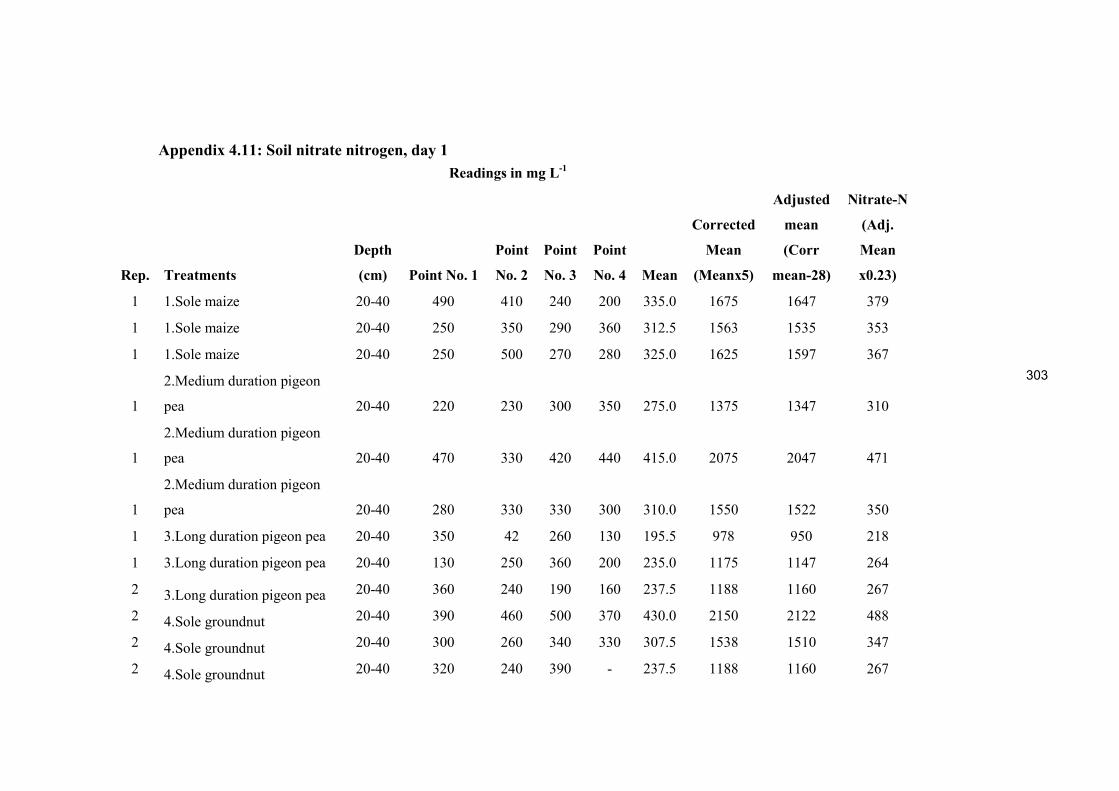
303
Appendix 4.11: Soil nitrate nitrogen, day 1
Readings in mg L-1
Rep. Treatments
Depth
(cm) Point No. 1
Point
No. 2
Point
No. 3
Point
No. 4 Mean
Corrected
Mean
(Meanx5)
Adjusted
mean
(Corr
mean-28)
Nitrate-N
(Adj.
Mean
x0.23)
1 1.Sole maize 20-40 490 410 240 200 335.0 1675 1647 379
1 1.Sole maize 20-40 250 350 290 360 312.5 1563 1535 353
1 1.Sole maize 20-40 250 500 270 280 325.0 1625 1597 367
1
2.Medium duration pigeon
pea 20-40 220 230 300 350 275.0 1375 1347 310
1
2.Medium duration pigeon
pea 20-40 470 330 420 440 415.0 2075 2047 471
1
2.Medium duration pigeon
pea 20-40 280 330 330 300 310.0 1550 1522 350
1 3.Long duration pigeon pea 20-40 350 42 260 130 195.5 978 950 218
1 3.Long duration pigeon pea 20-40 130 250 360 200 235.0 1175 1147 264
2 3.Long duration pigeon pea 20-40 360 240 190 160 237.5 1188 1160 267
2 4.Sole groundnut 20-40 390 460 500 370 430.0 2150 2122 488
2 4.Sole groundnut 20-40 300 260 340 330 307.5 1538 1510 347
2 4.Sole groundnut 20-40 320 240 390 - 237.5 1188 1160 267

304
Rep. Treatments
Depth
(cm) Point No. 1
Point
No. 2
Point
No. 3
Point
No. 4 Mean
Corrected
Mean
(Meanx5)
Adjusted
mean
(Corr
mean-28)
Nitrate-N
(Adj.
Mean
x0.23)
2
5.Medium duration pigeon
pea + groundnut 20-40 510 580 210 110 352.5 1763 1735 399
2 5.Medium duration pigeon
pea + groundnut 20-40 390 150 300 240 270.0 1350 1322 304
2 5.Medium duration pigeon
pea + groundnut 20-40 14 350 30 350 186.0 930 902 207
2 6.Long duration pigeon pea +
groundnut 20-40 280 250 220 220 242.5 1213 1185 272
3 6.Long duration pigeon pea + groundnut 20-40 540 250 200 180 292.5 1463 1435 330
3 6.Long duration pigeon pea + groundnut 20-40 240 180 120 370 227.5 1138 1110 255
3
7.Medium duration pigeon pea +
groundnut 20-40 320 270 220 240 262.5 1313 1285 295
3
7.Medium duration pigeon pea +
groundnut 20-40 210 190 220 270 222.5 1113 1085 249
3
7.Medium duration pigeon pea +
groundnut 20-40 430 460 470 - 340.0 1700 1672 385
3 8.Long duration pigeon pea + groundnut 20-40 370 740 420 600 532.5 2663 2635 606
3 8.Long duration pigeon pea + groundnut 20-40 290 380 370 220 315.0 1575 1547 356
3 8.Long duration pigeon pea + groundnut 20-40 320 430 260 310 330.0 1650 1622 373

305
Appendix 4.12: Soil nitrate nitrogen, day 2
Readings in mg L-1
Rep
No. Treatment 2
Depth
(cm)
Point
No. 1
Point
No. 2
Point
No. 3
Point
No. 4 Mean
Corrected
Mean
(Meanx5)
Adjusted
mean
(Corr
mean-
28)
Nitrate-
N(Adj.
Meanx
0.23)
1 1.Sole maize 20-40 280 400 290
242.5 1213 1185 272
1 1.Sole maize 20-40 740 230 93 160 305.8 1529 1501 345
1 1.Sole maize 20-40 170 130 180 140 155.0 775 747 172
1 2.Medium duration pigeon pea 20-40 140 310 420 200 267.5 1338 1310 301
1 2.Medium duration pigeon pea 20-40 180 120 340 300 235.0 1175 1147 264
1 2.Medium duration pigeon pea 20-40 220 190 170 110 172.5 863 835 192
1 3.Long duration pigeon pea 20-40 300 590 140 250 320.0 1600 1572 362
1 3.Long duration pigeon pea 20-40 390 660 190 200 360.0 1800 1772 408
2 3.Long duration pigeon pea 20-40 620 600 400 - 405.0 2025 1997 459
2 4.Sole groundnut 20-40 450 67 24 460 250.3 1251 1223 281
2 4.Sole groundnut 20-40 230 180 110 350 217.5 1088 1060 244
2 4.Sole groundnut 20-40 420 490 130 520 390.0 1950 1922 442
2
5.Medium duration pigeon pea +
groundnut 20-40 140 290 290 190 227.5 1138 1110 255
2
5.Medium duration pigeon pea +
groundnut 20-40 520 230 510 440 425.0 2125 2097 482

306
Rep.
Treatments
Depth
(cm)
Point
No. 1
Point
No. 2
Point
No. 3
Point
No. 4 Mean
Corrected
Mean
(Meanx5)
Adjusted
mean
(Corr
mean-
28)
Nitrate-
N(Adj.
Meanx
0.23)
2
6.Long duration pigeon pea +
groundnut 20-40 210 750 450 260 417.5 2088 2060 474
3
6.Long duration pigeon pea +
groundnut 20-40 180 170 200 75 156.3 781 753 173
3
6.Long duration pigeon pea +
groundnut 20-40 620 770 210 330 482.5 2413 2385 548
3
7.Medium duration pigeon pea +
groundnut 20-40 310 260 98 280 237.0 1185 1157 266
3
7.Medium duration pigeon pea +
groundnut 20-40 51 310 160 780 325.3 1626 1598 368
3
7.Medium duration pigeon pea +
groundnut 20-40 200 160 220 - 145.0 725 697 160
3
8.Long duration pigeon pea +
groundnut 20-40 69 130 150 480 207.3 1036 1008 232

307
Appendix 4.13: Soil nitrate nitrogen, day 3
Readings in mg L-1
Rep
No. Treatment 3
Depth
(cm)
Point
No. 1
Point
No. 2
Point
No. 3
Point
No. 4 Mean
Corrected
Mean
(Meanx5)
Adjusted
mean
(Corr
mean-28)
Nitrate-
N(Adj.
Meanx
0.23)
1 1.Sole maize 20-40 190 180 170
135.0 675 647 149
1 1.Sole maize 20-40 270 700 500 420 472.5 2363 2335 537
1 1.Sole maize 20-40 140 140 160 83 130.8 654 626 144
1 2.Medium duration pigeon pea 20-40 140 230 270 250 222.5 1113 1085 249
1 2.Medium duration pigeon pea 20-40 410 420 570 290 422.5 2113 2085 479
1 2.Medium duration pigeon pea 20-40 150 100 150 210 152.5 763 735 169
1 3.Long duration pigeon pea 20-40 300 250 200 220 242.5 1213 1185 272
1 3.Long duration pigeon pea 20-40 180 220 140 110 162.5 813 785 180
2 3.Long duration pigeon pea 20-40 97 140 95 190 130.5 653 625 144
2 4.Sole groundnut 20-40 220 420 180 420 310.0 1550 1522 350
2 4.Sole groundnut 20-40 190 370 250 200 252.5 1263 1235 284
2 4.Sole groundnut 20-40 200 140 200 - 135.0 675 647 149
2 5.Medium duration pigeon pea + groundnut 20-40 310 230 240 310 272.5 1363 1335 307
2 5.Medium duration pigeon pea + groundnut 20-40 79 240 160 200 169.8 849 821 189
2 5.Medium duration pigeon pea + groundnut 20-40 290 210 270 160 232.5 1163 1135 261

308
Rep.
Treatments
Depth
(cm)
Point
No. 1
Point
No. 2
Point
No. 3
Point
No. 4 Mean
Corrected
Mean
(Meanx5)
Adjusted
mean
(Corr
mean-28)
Nitrate-
N(Adj.
Meanx
0.23)
2 6.Long duration pigeon pea + groundnut 20-40 640 660 460 390 537.5 2688 2660 612
3 6.Long duration pigeon pea + groundnut 20-40 740 200 130 320 347.5 1738 1710 393
3 6.Long duration pigeon pea + groundnut 20-40 190 220 290 110 202.5 1013 985 226
3 7.Medium duration pigeon pea + groundnut 20-40 250 510 720 360 460.0 2300 2272 523
3 7.Medium duration pigeon pea + groundnut 20-40 110 150 130 320 177.5 888 860 198
3 7.Medium duration pigeon pea + groundnut 20-40 130 240 150 - 130.0 650 622 143
3 8.Long duration pigeon pea + groundnut 20-40 340 410 510 480 435.0 2175 2147 494
3 8.Long duration pigeon pea + groundnut 20-40 560 510 560 190 455.0 2275 2247 517
3 8.Long duration pigeon pea + groundnut 20-40 140 120 130 230 155.0 775 747 172

309
Appendix 4.14: Soil nitrate nitrogen, day 4
Readings in mg L-1
Rep
No. Treatment
Depth
(cm)
Point
No. 1
Point
No. 2
Point
No. 3
Point
No. 4 Mean
Corrected
Mean
(Meanx5)
Adjusted
mean
(Corr
mean-28)
Nitrate-
N(Adj.
Meanx
0.23)
1 1.Sole maize 20-40 190 160 150
125.0 625 597 137
1 1.Sole maize 20-40 790 340 220 210 390.0 1950 1922 442
1 1.Sole maize 20-40 640 630 690 450 602.5 3013 2985 686
1 2.Medium duration pigeon pea 20-40 370 310 370 230 320.0 1600 1572 362
1 2.Medium duration pigeon pea 20-40 220 490 370 390 367.5 1838 1810 416
1 2.Medium duration pigeon pea 20-40 500 380 430 630 485.0 2425 2397 551
1 3.Long duration pigeon pea 20-40 290 430 650 390 440.0 2200 2172 500
1 3.Long duration pigeon pea 20-40 210 280 510 250 312.5 1563 1535 353
2 3.Long duration pigeon pea 20-40 290 390 530 510 430.0 2150 2122 488
2 4.Sole groundnut 20-40 190 340 260 380 292.5 1463 1435 330
2 4.Sole groundnut 20-40 410 550 370 420 437.5 2188 2160 497
2 4.Sole groundnut 20-40 450 620 570 - 410.0 2050 2022 465
2 5.Medium duration pigeon pea + groundnut 20-40 420 210 510 570 427.5 2138 2110 485
2 5.Medium duration pigeon pea + groundnut 20-40 290 320 300 540 362.5 1813 1785 410
2 5.Medium duration pigeon pea + groundnut 20-40 470 190 110 750 380.0 1900 1872 431

310
Rep.
Treatments
Depth
(cm)
Point
No. 1
Point
No. 2
Point
No. 3
Point
No. 4 Mean
Corrected
Mean
(Meanx5)
Adjusted
mean
(Corr
mean-28)
Nitrate-
N(Adj.
Meanx
0.23)
2 6.Long duration pigeon pea + groundnut 20-40 370 540 450 440 450.0 2250 2222 511
3 6.Long duration pigeon pea + groundnut 20-40 490 540 560 350 485.0 2425 2397 551
3 6.Long duration pigeon pea + groundnut 20-40 490 440 460 220 402.5 2013 1985 456
3 7.Medium duration pigeon pea + groundnut 20-40 290 440 330 380 360.0 1800 1772 408
3 7.Medium duration pigeon pea + groundnut 20-40 410 390 230 590 405.0 2025 1997 459
3 7.Medium duration pigeon pea + groundnut 20-40 210 230 240 - 170.0 850 822 189
3 8.Long duration pigeon pea + groundnut 20-40 360 260 330 290 310.0 1550 1522 350
3 8.Long duration pigeon pea + groundnut 20-40 310 360 240 170 270.0 1350 1322 304
3 8.Long duration pigeon pea + groundnut 20-40 400 490 670 240 450.0 2250 2222 511

311
Appendix 4.15: Soil nitrate nitrogen, day 5
Readings in mg L-1
Rep
No. Treatment
Depth
(cm)
Point
No. 1
Point
No. 2
Point
No. 3
Point
No. 4 Mean
Corrected
Mean
(Meanx5)
Adjusted
mean
(Corr
mean-
28)
Nitrate-
N(Adj.
Meanx
0.23)
1 1.Sole maize 20-40 190 290 250
243.3 1217 1189 273
1 1.Sole maize 20-40 470 670 380 340 465.0 2325 2297 528
1 1.Sole maize 20-40 280 330 260 310 295.0 1475 1447 333
1 2.Medium duration pigeon pea 20-40 290 220 270 420 300.0 1500 1472 339
1 2.Medium duration pigeon pea 20-40 400 550 390 350 422.5 2113 2085 479
1 2.Medium duration pigeon pea 20-40 310 400 310 160 295.0 1475 1447 333
1 3.Long duration pigeon pea 20-40 350 290 580 420 410.0 2050 2022 465
1 3.Long duration pigeon pea 20-40 170 230 290 310 250.0 1250 1222 281
2 3.Long duration pigeon pea 20-40 290 230 390 220 282.5 1413 1385 318
2 4.Sole groundnut 20-40 340 260 270 270 285.0 1425 1397 321
2 4.Sole groundnut 20-40 350 200 140 410 275.0 1375 1347 310
2 4.Sole groundnut 20-40 290 360 250 - 225.0 1125 1097 252
2 5.Medium duration pigeon pea + groundnut 20-40 240 210 240 210 225.0 1125 1097 252
2 5.Medium duration pigeon pea + groundnut 20-40 300 360 230 370 315.0 1575 1547 356

312
Rep.
Treatments
Depth
(cm)
Point
No. 1
Point
No. 2
Point
No. 3
Point
No. 4 Mean
Corrected
Mean
(Meanx5)
Adjusted
mean
(Corr
mean-
28)
Nitrate-
N(Adj.
Meanx
0.23)
2 5.Medium duration pigeon pea + groundnut 20-40 390 330 530 500 437.5 2188 2160 497
2 6.Long duration pigeon pea + groundnut 20-40 360 290 420 300 342.5 1713 1685 387
3 6.Long duration pigeon pea + groundnut 20-40 750 300 240 250 385.0 1925 1897 436
3 6.Long duration pigeon pea + groundnut 20-40 290 260 370 300 305.0 1525 1497 344
3 7.Medium duration pigeon pea + groundnut 20-40 460 200 370 330 340.0 1700 1672 385
3 7.Medium duration pigeon pea + groundnut 20-40 350 350 370 340 352.5 1763 1735 399
3 7.Medium duration pigeon pea + groundnut 20-40 420 370 220 - 252.5 1263 1235 284
3 8.Long duration pigeon pea + groundnut 20-40 250 420 370 410 362.5 1813 1785 410
3 8.Long duration pigeon pea + groundnut 20-40 490 430 560 440 480.0 2400 2372 546
3 8.Long duration pigeon pea + groundnut 20-40 290 360 370 400 355.0 1775 1747 402

313
Appendix 4.16: Soil nitrate nitrogen, day 6
Readings in mg L-1
Rep
No. Treatment 6
Depth
(cm)
Point
No. 1
Point
No. 2
Point
No. 3
Point
No. 4 Mean
Corrected
Mean
(Meanx5)
Adjusted
mean
(Corr
mean-
28)
Nitrate-
N(Adj.
Meanx
0.23)
1 1.Sole maize 20-40 130 100 97 - 81.8 409 381 88
1 1.Sole maize 20-40 120 120 76 - 79.0 395 367 84
1 1.Sole maize 20-40 160 110 150 370 197.5 988 960 221
1 2.Medium duration pigeon pea 20-40 77 31 88 86 70.5 353 325 75
1 2.Medium duration pigeon pea 20-40 66 150 53 140 102.3 511 483 111
1 2.Medium duration pigeon pea 20-40 260 250 210 160 220.0 1100 1072 247
1 3.Long duration pigeon pea 20-40 570 550 480 550 537.5 2688 2660 612
1 3.Long duration pigeon pea 20-40 120 100 170 350 185.0 925 897 206
2 3.Long duration pigeon pea 20-40 160 160 120 160 150.0 750 722 166
2 4.Sole groundnut
20-40 520 700 800 760 695.0 3475 3447 793
2 4.Sole groundnut
20-40 120 120 190 160 147.5 738 710 163
2 4.Sole groundnut
20-40 180 250 180 - 152.5 763 735 169
2
5.Medium duration pigeon pea +
groundnut 20-40 77 180 210 190 164.3 821 793
182

314
Rep.
Treatments
Depth
(cm)
Point
No. 1
Point
No. 2
Point
No. 3
Point
No. 4 Mean
Corrected
Mean
(Meanx5)
Adjusted
mean
(Corr
mean-
28)
Nitrate-
N(Adj.
Meanx
0.23)
2
6.Long duration pigeon pea +
groundnut 20-40 530 290 130 92 260.5 1303 1275 293
3
6.Long duration pigeon pea +
groundnut 20-40 70 180 160 100 127.5 638 610 140
3
6.Long duration pigeon pea +
groundnut 20-40 110 170 280 180 185.0 925 897 206
3
7.Medium duration pigeon pea +
groundnut 20-40 410 460 510 660 510.0 2550 2522 580
3
7.Medium duration pigeon pea +
groundnut 20-40 190 150 150 76 141.5 708 680 156
3
7.Medium duration pigeon pea +
groundnut 20-40 190 270 210 - 167.5 838 810 186
3
8.Long duration pigeon pea +
groundnut 20-40 500 450 520 430 475.0 2375 2347 540

315
Appendix 4.17: Soil nitrate nitrogen, day 7
Readings in mg L-1
Rep.
Treatments 7
Depth
(cm)
Point No.
1
Point
No. 2
Point
No. 3
Point
No. 4 Mean
Corrected
Mean
(Meanx5)
Adjusted
mean
(Corr
mean-
28)
Nitrate-
N(Adj.
Meanx
0.23)
1 1.Sole maize 20-40 220 210 180 - 152.5 763 735 169
1 1.Sole maize 20-40 82 110 84 - 69.0 345 317 73
1 1.Sole maize 20-40 270 270 220 250 252.5 1263 1235 284
1
2.Medium duration pigeon
pea 20-40 180 180 180 210 187.5 938 910 209
1
2.Medium duration pigeon
pea 20-40 83 130 90 100 100.8 504 476 109
1
2.Medium duration pigeon
pea 20-40 470 150 270 230 280.0 1400 1372 316
1 3.Long duration pigeon pea 20-40 300 260 220 210 247.5 1238 1210 278
1 3.Long duration pigeon pea 20-40 110 130 90 150 120.0 600 572 132
2 3.Long duration pigeon pea 20-40 290 260 210 270 257.5 1288 1260 290
2 4.Sole groundnut 20-40 100 110 92 100 100.5 503 475 109
2 4.Sole groundnut 20-40 140 150 140 120 137.5 688 660 152
2 4.Sole groundnut 20-40 190 260 250 - 175.0 875 847 195
2 5.Medium duration pigeon
pea + groundnut 20-40 130 190 140 110 142.5 713 685 157

316
Rep.
Treatments
Depth
(cm)
Point No.
1
Point
No. 2
Point
No. 3
Point
No. 4 Mean
Corrected
Mean
(Meanx5)
Adjusted
mean
(Corr
mean-
28)
Nitrate-
N(Adj.
Meanx
0.23)
2 5.Medium duration pigeon
pea + groundnut 20-40 240 300 290 330 290.0 1450 1422 327
2 6.Long duration pigeon pea
+ groundnut 20-40 100 230 110 130 142.5 713 685 157
3 6.Long duration pigeon pea
+ groundnut 20-40 130 170 91 130 130.3 651 623
3
6.Long duration pigeon pea
+ groundnut 20-40 220 170 140 180 177.5 888 860
3
7.Medium duration pigeon
pea + groundnut 20-40 130 87 93 110 105.0 525 497
3
7.Medium duration pigeon
pea + groundnut 20-40 130 70 100 150 112.5 563 535
3
7.Medium duration pigeon
pea + groundnut 20-40 170 300 230 - 175.0 875 847
3
8.Long duration pigeon pea
+ groundnut 20-40 150 130 130 130 135.0 675 647
3
8.Long duration pigeon pea
+ groundnut 20-40 170 67 130 130 124.3 621 593

317
Appendix 4.6: Off season nitrate nitrogen data from the nitrate meter and the KCl method
Rep.
No.
Plot
No. Depth (cm)
Trt.
No. NO-3
(ppm)
Nitrate-N (Meter) mg
L-1
Nitrate-N
(KCl) mg L-1
Rep1 1 0-20 3 510 117.3 40
1 1 20-40 3 280 64.4 65
1 2 0-20 6 28 6.44 15
1 2 20-40 6 560 128.8 40
1 3 0-20 9 130 29.9 90
1 3 20-40 9 110 25.3 465
1 4 0-20 7 600 138 165
1 4 20-40 7 90 20.7 65
1 5 0-20 10 37 8.51 12.5
1 5 20-40 10 73 16.79 15
1 6 0-20 2 420 96.6 40
1 6 20-40 2 250 57.5 115
1 7 0-20 5 110 25.3 52.5
1 7 20-40 5 210 48.3 65
1 8 0-20 1 280 64.4 7.5
1 8 20-40 1 720 165.6 40
1 9 0-20 4 73 16.79 17.5
1 9 20-40 4 47 10.81 265
1 10 0-20 8 160 36.8 15

318
Rep.
No.
Plot
No.
Depth (cm) Trt.
No.
NO-3
(ppm) Nitrate-N (Meter) mg l-1
Nitrate-N
(KCl) mg l-1
Rep1 10 20-40 8 80 18.4 340
Rep 2 1 0-20 9 220 50.6 140
Rep 2 1 20-40 9 140 32.2 115
2 2 0-20 3 520 119.6 65
2 2 20-40 3 480 110.4 265
2 4 0-20 2 130 29.9 1490
2 4 20-40 2 110 25.3 840
2 5 0-20 4 78 17.94 965
2 5 20-40 4 110 25.3 90
2 6 0-20 6 330 75.9 65
2 6 20-40 6 680 156.4 290
2 7 0-20 5 630 144.9 165
2 7 20-40 5 280 64.4 190
2 8 0-20 7 250 57.5 140
2 8 20-40 7 100 23 115
2 9 0-20 1 390 89.7 15
2 9 20-40 1 570 131.1 65
2 10 0-20 8 260 59.8 315
Rep2 10 20-40 8 150 34.5 90
Rep 3 1 0-20 1 230 52.9 165

319
Rep.
No.
Plot
No.
Depth (cm) Trt.
No.
NO-3
(ppm) Nitrate-N (Meter) mg l-1
Nitrate-N
(KCl) mg L-1
Rep3 1 20-40 1 290 66.7 90
3 2 0-20 6 490 112.7 465
3 2 20-40 6 50 11.5 15
3 3 0-20 5 170 39.1 22.5
3 3 20-40 5 51 11.73 10
3 4 0-20 9 47 10.81 165
3 4 20-40 9 780 179.4 115
3 5 0-20 10 190 43.7 37.5
3 5 20-40 10 240 55.2 152.5
3 6 0-20 2 600 138 40
3 6 20-40 2 200 46 90
3 8 0-20 4 740 170.2 140
3 8 20-40 4 710 163.3 215
3 9 0-20 8 240 55.2 590
3 9 20-40 8 210 48.3 147.5
Rep3 10 0-20 9 420 96.6 815
Rep3 10 20-40 9 310 71.3 15

320
Appendix 5.0a: N and P yield in groundnut haulms parallel experiment, season two
Rep Treatment Haulms yield ha-1
N(%) P(%)
N Yield
ha-1
P Yield
ha-1
1 1.Medium duration pigeon pea + Groundnut 1530 2.0 0.18 30.4 2.8
1 3.Groundnut + 25 kg P ha-1
2410 1.8 0.16 43.0 3.9
1 5.Long duration pigeon pea + Groundnut 1428 2.2 0.20 31.2 2.9
1 7.Long duration pigeon pea + Groundnut + 25 kg P ha-1
1813 2.2 0.20 39.7 3.7
1 8.Medium duration pigeon pea + Groundnut + 25 kg P ha-1
1108 2.1 0.20 23.5 2.2
1 9.Groundnut 1872 2.3 0.19 42.2 3.6
2 1.Medium duration pigeon pea + Groundnut 1647 2.0 0.18 32.7 3.0
2 3.Groundnut + 25 kg P ha-1
1076 2.6 0.23 27.9 2.5
2 5.Long duration pigeon pea + Groundnut 1500 2.1 0.17 30.8 2.6
2 7.Long duration pigeon pea + Groundnut + 25 kg P ha-1
2010 1.7 0.17 34.5 3.5
2 8.Medium duration pigeon pea + Groundnut + 25 kg P ha-1
1778 1.8 0.15 31.7 2.7
2 9.Groundnut 1486 2.3 0.24 33.5 3.6
3 1.Medium duration pigeon pea + Groundnut 1370 1.9 0.18 26.3 2.5
3 3.Groundnut + 25 kg P ha-1
3904 2.1 0.20 82.8 7.9
3 5.Long duration pigeon pea + Groundnut 1261 2.0 0.16 25.1 2.1
3 7.Long duration pigeon pea + Groundnut + 25 kg P ha-1
1359 2.1 0.20 28.8 2.8
3 8.Medium duration pigeon pea + Groundnut + 25 kg P ha-1
1351 2.6 0.24 35.0 3.3
3 9.Groundnut - - - - -

321
Appendix 5.0b: N and P yield in groundnut shells parallel experiment, season two
Rep Treatment
Wt of shell
kg ha-1
N(%) P(%)
N Yield
ha-1
P Yield
ha-1
1 1.Medium duration pigeon pea + Groundnut 1609 1.4 0.16 22.2 2.6
1 3.Groundnut + 25 kg P ha-1
3070 1.4 0.15 44.5 4.5
1 5.Long duration pigeon pea + Groundnut 1062 0.9 0.13 9.7 1.4
1 7.Long duration pigeon pea + Groundnut + 25 kg P ha-1
1659 1.0 0.11 16.3 1.8
1 8.Medium duration pigeon pea + Groundnut + 25 kg P ha-1
1370 1.2 0.14 17.1 1.9
1 9.Groundnut 848 1.9 0.17 15.7 1.4
2 1.Medium duration pigeon pea + Groundnut 1500 1.0 0.10 14.7 1.5
2 3.Groundnut + 25 kg P ha-1
1506 1.4 0.16 20.8 2.5
2 5.Long duration pigeon pea + Groundnut 1260 1.0 0.14 13.2 1.7
2 7.Long duration pigeon pea + Groundnut + 25 kg P ha-1
1751 1.1 0.12 19.5 2.1
2 8.Medium duration pigeon pea + Groundnut + 25 kg P ha-1
1185 1.1 0.10 12.8 1.2
2 9.Groundnut 2634 1.1 0.14 29.3 3.8
3 1.Medium duration pigeon pea + Groundnut 1274 1.0 0.12 13.3 1.6
3 3.Groundnut + 25 kg P ha-1
1379 1.4 0.13 19.1 1.8
3 5.Long duration pigeon pea + Groundnut 1141 0.8 0.09 8.9 1.1
3 7.Long duration pigeon pea + Groundnut + 25 kg P ha-1
1633 1.1 0.14 18.2 2.3
3 8.Medium duration pigeon pea + Groundnut + 25 kg P ha-1
1634 1.2 0.12 19.3 2.0
3 9.Groundnut - - - - -

322
Appendix 5.0c: N and P yield in groundnut grain parallel experiment, season two
Rep. Treatments Gn Grain yield ha-1
N(%) P(%)
N Yield
ha-1
P Yield
ha-1
1 1.Medium duration pigeon pea + Groundnut 1721 3.1 0.43 52.8 7.4
1 3.Groundnut + 25 kg P ha-1
3629 2.7 0.45 98.0 16.3
1 5.Long duration pigeon pea + Groundnut 1567 3.3 0.47 51.5 7.3
1 7.Long duration pigeon pea + Groundnut + 25 kg P ha-1
2074 2.8 0.41 59.0 8.4
1 8.Medium duration pigeon pea + Groundnut + 25 kg P ha-1
1459 3.3 0.45 48.0 6.6
1 9.Groundnut 2650 3.3 0.47 87.2 12.3
2 1.Medium duration pigeon pea + Groundnut 2530 3.1 0.41 77.6 10.5
2 3.Groundnut + 25 kg P ha-1
1467 3.3 0.40 48.2 5.8
2 5.Long duration pigeon pea + Groundnut 1467 3.1 0.44 45.0 6.5
2 7.Long duration pigeon pea + Groundnut + 25 kg P ha-1
1456 2.8 0.45 41.4 6.6
2 8.Medium duration pigeon pea + Groundnut + 25 kg P ha-1
1826 3.1 0.36 56.0 6.6
2 9.Groundnut 1041 3.1 0.47 31.9 4.9
3 1.Medium duration pigeon pea + Groundnut 1255 2.8 0.42 35.7 5.3
3 3.Groundnut + 25 kg P ha-1
3979 2.4 0.40 97.3 15.9
3 5.Long duration pigeon pea + Groundnut 1506 2.8 0.41 42.8 6.1
3 7.Long duration pigeon pea + Groundnut + 25 kg P ha-1
1625 3.1 0.44 49.8 7.1
3 8.Medium duration pigeon pea + Groundnut + 25 kg P ha-1
1677 3.3 0.44 55.2 7.4
3 9.Groundnut - - - - -

323
Appendix 5.0d: Yield parameters for groundnut in the parallel experiment, season two
REP Treatment
Grain
yield ha-1
Haulms
yield ha-1
Ave. No of
pods plant-1
Popu
100 gn
Wt g
Shells
100 g
Pods
100 g
1 9.Groundnut 2650 1872 24 16 131 38 167
1 3.Groundnut + 25 kg P ha-1
3629 2410 45 17 65 37 167
1 5.Pigeon pea long duration + Groundnut 1567 1428 19 16 124 36 160
1
7.Pigeon pea long duration + Groundnut
+ 25 kg P ha-1
2074 1813 27 15 125 34 159
1
1.Pigeon pea medium duration +
Groundnut 1721 1530 22 14 135 35 170
1
8.Pigeon pea medium duration +
Groundnut + 25 kg P ha-1
1459 1108 21 17 128 22 150
2
8.Pigeon pea medium duration +
Groundnut + 25 kg P ha-1
1826 1778 23 11 116 32 147
2
1.Pigeon pea medium duration +
Groundnut 2530 1647 17 15 123 39 162
2
7.Pigeon pea long duration + Groundnut
+ 25 kg P ha-1
1456 2010 25 13 115 32 147

324
REP Treatment
Grain
yield ha-1
Haulms
yield ha-1
Ave. No of
pods plant-1
Popu
100 gn
Wt g
Shells
100 g
Pods
100 g
2 3.Groundnut + 25 kg P ha-1
1467 1076 20 20 132 40 172
2 9.Groundnut 1041 1486 24 14 136 37 172
3
1.Pigeon pea medium duration +
Groundnut 1255 1370 19 17 120 34 154
3
6.Pigeon pea medium duration + 25 kg P
ha-1
1235 1319 34 18 147 39 154
3 5.Pigeon pea long duration + Groundnut 1506 1261 21 16 111 34 145
3 3.Groundnut + 25 kg P ha-1
3979 3904 20 13 108 36 144
3
8.Pigeon pea medium duration +
Groundnut + 25 kg P ha-1
1677 1351 13 15 122 31 145
3
7.Pigeon pea long duration + Groundnut
+ 25 kg P ha-1
1625 1359 22 14 132 37 169
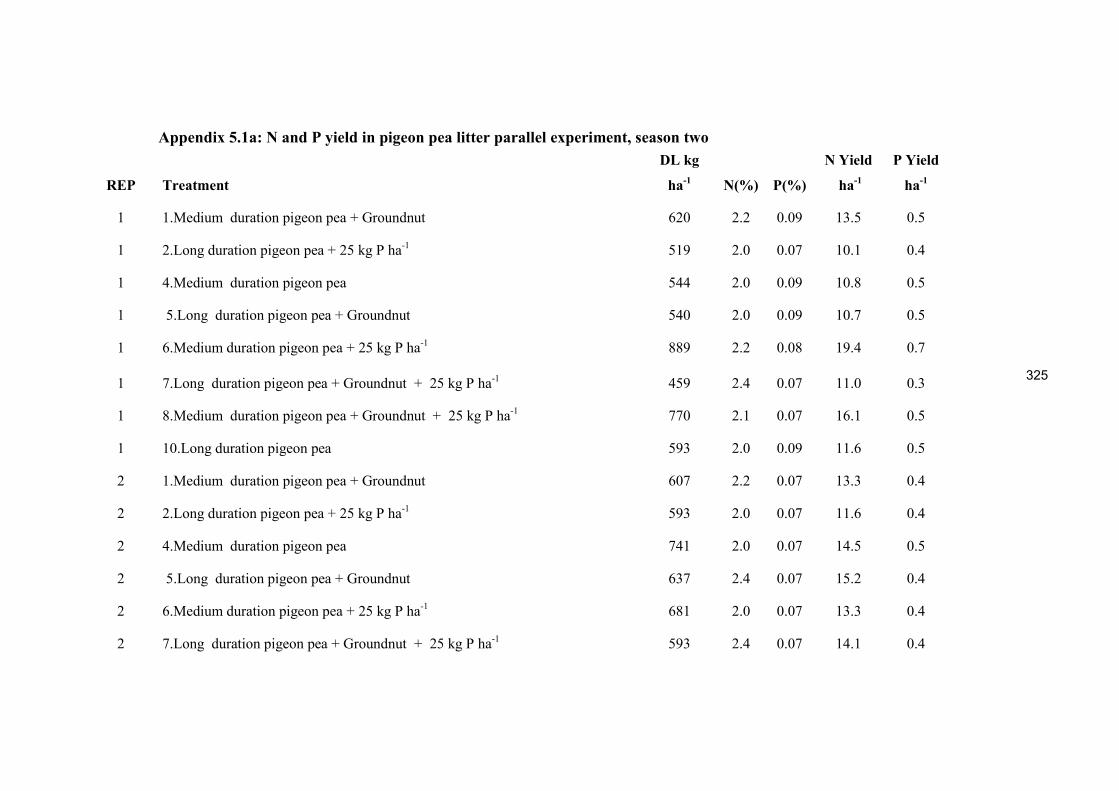
325
Appendix 5.1a: N and P yield in pigeon pea litter parallel experiment, season two
REP Treatment
DL kg
ha-1
N(%) P(%)
N Yield
ha-1
P Yield
ha-1
1 1.Medium duration pigeon pea + Groundnut 620 2.2 0.09 13.5 0.5
1 2.Long duration pigeon pea + 25 kg P ha-1
519 2.0 0.07 10.1 0.4
1 4.Medium duration pigeon pea 544 2.0 0.09 10.8 0.5
1 5.Long duration pigeon pea + Groundnut 540 2.0 0.09 10.7 0.5
1 6.Medium duration pigeon pea + 25 kg P ha-1
889 2.2 0.08 19.4 0.7
1 7.Long duration pigeon pea + Groundnut + 25 kg P ha-1
459 2.4 0.07 11.0 0.3
1 8.Medium duration pigeon pea + Groundnut + 25 kg P ha-1
770 2.1 0.07 16.1 0.5
1 10.Long duration pigeon pea 593 2.0 0.09 11.6 0.5
2 1.Medium duration pigeon pea + Groundnut 607 2.2 0.07 13.3 0.4
2 2.Long duration pigeon pea + 25 kg P ha-1
593 2.0 0.07 11.6 0.4
2 4.Medium duration pigeon pea 741 2.0 0.07 14.5 0.5
2 5.Long duration pigeon pea + Groundnut 637 2.4 0.07 15.2 0.4
2 6.Medium duration pigeon pea + 25 kg P ha-1
681 2.0 0.07 13.3 0.4
2 7.Long duration pigeon pea + Groundnut + 25 kg P ha-1
593 2.4 0.07 14.1 0.4

326
REP Treatment
DL kg
ha-1
N(%) P(%)
N Yield
ha-1
P Yield
ha-1
2 8.Medium duration pigeon pea + Groundnut + 25 kg P ha-1
489 2.1 0.07 10.2 0.4
2 10.Long duration pigeon pea 519 2.0 0.07 10.5 0.3
3 1.Medium duration pigeon pea + Groundnut 770 2.2 0.09 16.8 0.7
3 2.Long duration pigeon pea + 25 kg P ha-1
696 2.8 0.09 19.5 0.6
3 4.Medium duration pigeon pea 889 2.2 0.04 19.4 0.4
3 5.Long duration pigeon pea + Groundnut 533 2.0 0.09 10.6 0.5
3 6.Medium duration pigeon pea + 25 kg P ha-1
919 2.2 0.04 20.1 0.4
3 7.Long duration pigeon pea + Groundnut + 25 kg P ha-1
919 3.0 0.08 27.6 0.7
3 8.Medium duration pigeon pea + Groundnut + 25 kg P ha-1
770 3.0 0.08 23.1 0.6
3 10.Long duration pigeon pea 830 3.0 0.07 24.9 0.6

327
Appendix 5.1b: N and P yield in pigeon pea fresh leaves parallel experiment, season two
Rep. Treatments
FL
kg ha-1
N(%) P(%)
N
Yield ha-1
P
Yield ha-1
1 1.Medium duration pigeon pea + Groundnut 919 3.6 0.18 33.2 1.6
1 2.Long duration pigeon pea + 25 kg P ha-1
741 3.4 0.18 25.2 1.3
1 4.Medium duration pigeon pea 785 3.7 0.67 29.1 5.3
1 5.Long duration pigeon pea + Groundnut 889 3.2 0.21 28.5 1.8
1 6.Medium duration pigeon pea + 25 kg P ha-1
904 3.4 0.19 30.8 1.8
1 7.Long duration pigeon pea + Groundnut + 25 kg P ha-1
933 3.4 0.22 31.8 2.0
1 8.Medium duration pigeon pea + Groundnut + 25 kg P ha-1
948 3.7 0.60 35.2 5.7
1 10.Long duration pigeon pea 889 3.6 0.27 32.1 2.4
2 1.Medium duration pigeon pea + Groundnut 963 4.0 0.26 38.7 2.5
2 2.Long duration pigeon pea + 25 kg P ha-1
889 3.6 0.19 32.1 1.7
2 4.Medium duration pigeon pea 978 3.3 0.53 32.3 5.2
2 5.Long duration pigeon pea + Groundnut 815 2.6 0.20 21.1 1.7
2 6.Medium duration pigeon pea + 25 kg P ha-1
889 3.2 0.67 28.8 5.9
2 7.Long duration pigeon pea + Groundnut + 25 kg P ha-1
904 3.2 0.22 29.0 2.0
2 8.Medium duration pigeon pea + Groundnut + 25 kg P ha-1
993 3.8 0.22 37.9 2.1
2 10.Long duration pigeon pea 741 2.8 0.26 20.7 1.9
3 1.Medium duration pigeon pea + Groundnut 948 3.4 0.17 32.3 1.6
3 2.Long duration pigeon pea + 25 kg P ha-1
741 3.6 0.19 26.8 1.4
3 4.Medium duration pigeon pea 963 3.5 0.60 33.8 5.8

328
Appendix 5.1c: N and P yield in pigeon pea twigs parallel experiment, season two
Rep. Treatments
Twig
kg ha-1
N(%) P(%)
N
Yield ha-1
P
Yield ha-1
1 1.Medium duration pigeon pea + Groundnut 859 3.0 0.11 25.8 0.9
1 2.Long duration pigeon pea + 25 kg P ha-1
667 2.6 0.33 17.5 2.2
1 4.Medium duration pigeon pea 637 3.2 0.19 20.4 1.2
1 5.Long duration pigeon pea + Groundnut 593 3.2 0.15 19.0 0.9
1 6.Medium duration pigeon pea + 25 kg P ha-1
889 3.0 0.21 26.7 1.9
1 7.Long duration pigeon pea + Groundnut + 25 kg P ha-1
622 3.4 0.17 21.2 1.1
1 8.Medium duration pigeon pea + Groundnut + 25 kg P ha-1
830 2.3 0.33 19.0 2.7
1 10.Long duration pigeon pea 889 2.0 0.11 17.6 1.0
2 1.Medium duration pigeon pea + Groundnut 800 3.2 0.15 25.6 1.2
2 2.Long duration pigeon pea + 25 kg P ha-1
593 3.6 0.25 21.4 1.5
2 4.Medium duration pigeon pea 904 2.2 0.33 19.5 3.0
2 5.Long duration pigeon pea + Groundnut 622 3.0 0.14 18.7 0.9
2 6.Medium duration pigeon pea + 25 kg P ha-1
874 2.1 0.33 18.2 2.9
2 7.Long duration pigeon pea + Groundnut + 25 kg P ha-1
593 3.0 0.15 17.8 0.9
2 8.Medium duration pigeon pea + Groundnut + 25 kg P ha-1
785 3.0 0.12 23.6 1.0
2 10.Long duration pigeon pea 607 2.4 0.14 14.5 0.8
3 1.Medium duration pigeon pea + Groundnut 770 3.0 0.13 23.1 1.0
3 2.Long duration pigeon pea + 25 kg P ha-1
741 3.8 0.26 28.3 1.9

329
Appendix 5.1d: N and P yield in pigeon pea stems parallel experiment, season two
Rep. Treatments
Stems
kg ha-1
N(%) P(%0
N Yield
ha-1
P Yield
ha-1
1 1.Medium duration pigeon pea + Groundnut 667 1.8 0.11 12.1 0.7
1 2.Long duration pigeon pea + 25 kg P ha-1
1037 1.6 0.15 16.7 1.6
1 4.Medium duration pigeon pea 593 1.6 0.15 9.6 0.9
1 5.Long duration pigeon pea + Groundnut 444 1.8 0.10 7.9 0.5
1 6.Medium duration pigeon pea + 25 kg P ha-1
1037 2.0 0.16 21.0 1.7
1 7.Long duration pigeon pea + Groundnut + 25 kg P ha-1
667 2.0 0.11 13.2 0.8
1 8.Medium duration pigeon pea + Groundnut + 25 kg P ha-1
1037 2.0 0.13 20.3 1.3
1 10.Long duration pigeon pea 622 2.4 0.14 14.9 0.9
2 1.Medium duration pigeon pea + Groundnut 993 2.4 0.09 23.7 0.9
2 2.Long duration pigeon pea + 25 kg P ha-1
489 1.6 0.10 7.7 0.5
2 4.Medium duration pigeon pea 978 2.0 0.12 19.1 1.2
2 5.Long duration pigeon pea + Groundnut 563 1.6 0.10 8.8 0.5
2 6.Medium duration pigeon pea + 25 kg P ha-1
1037 1.8 0.15 18.8 1.6
2 7.Long duration pigeon pea + Groundnut + 25 kg P ha-1
593 2.4 0.14 14.1 0.8
2 8.Medium duration pigeon pea + Groundnut + 25 kg P ha-1
1007 2.2 0.11 22.0 1.1
2 10.Long duration pigeon pea 607 2.0 0.12 12.0 0.7
3 1.Medium duration pigeon pea + Groundnut 711 1.8 0.11 12.4 0.8

330
Rep. Treatments
Stems
kg ha-1
N(%) P(%)
N Yield
ha-1
P Yield
ha-1
3 2.Long duration pigeon pea + 25 kg P ha-1
741 2.6 0.15 19.2 1.1
3 4.Medium duration pigeon pea 593 2.4 0.11 14.1 0.7
3 5.Long duration pigeon pea + Groundnut 756 1.4 0.10 10.3 0.8
3 6.Medium duration pigeon pea + 25 kg P ha-1
667 1.9 0.14 12.6 0.9
3 7.Long duration pigeon pea + Groundnut + 25 kg P ha-1
889 2.8 0.12 24.9 1.1
3 8.Medium duration pigeon pea + Groundnut + 25 kg P ha-1
800 2.4 0.11 19.1 0.9
3 10.Long duration pigeon pea 978 2.4 0.09 23.3 0.9

331
Appendix 5.1e: N and P yield in pigeon pea roots parallel experiment, season two
Rep Treatments
Roots kg
ha-1
N(%) P(%)
N
Yield
ha-1
P
Yield
ha-1
1 1.Medium duration pigeon pea + Groundnut 474 1.3 0.07 6.0 0.3
1 2.Long duration pigeon pea + 25 kg P ha-1
519 1.0 0.07 5.4 0.3
1 4.Medium duration pigeon pea 548 1.1 0.10 6.3 0.5
1 5.Long duration pigeon pea + Groundnut 533 1.51 0.11 8.0 0.6
1 6.Medium duration pigeon pea + 25 kg P ha-1
593 1.1 0.08 6.8 0.5
1 7.Long duration pigeon pea + Groundnut + 25 kg P ha-1
622 1.16 0.07 7.2 0.4
1 8.Medium duration pigeon pea + Groundnut + 25 kg P ha-1
444 1.4 0.06 6.1 0.3
1 10.Long duration pigeon pea 415 1.51 0.08 6.3 0.3
2 1.Medium duration pigeon pea + Groundnut 652 1.5 0.06 9.7 0.4
2 2.Long duration pigeon pea + 25 kg P ha-1
415 1.16 0.07 4.8 0.3
2 4.Medium duration pigeon pea 637 0.8 0.07 5.1 0.5
2 5.Long duration pigeon pea + Groundnut 459 1.16 0.07 5.3 0.3
2 6.Medium duration pigeon pea + 25 kg P ha-1
607 0.9 0.05 5.6 0.3
2 7.Long duration pigeon pea + Groundnut + 25 kg P ha-1
533 0.98 0.08 5.2 0.4
2 8.Medium duration pigeon pea + Groundnut + 25 kg P ha-1
519 1.6 0.07 8.3 0.4
2 10.Long duration pigeon pea 593 1.68 0.09 10.0 0.5
3 1.Medium duration pigeon pea + Groundnut 593 1.0 0.81 6.1 4.8

332
Rep. Treatments Roots kg
ha-1
N(%) P(%) N
Yield
ha-1
P
Yield
ha-1
3 2.Long duration pigeon pea + 25 kg P ha-1
593 1.33 0.07 7.9 0.4
3 4.Medium duration pigeon pea 607 0.9 0.08 5.6 0.5
3 5.Long duration pigeon pea + Groundnut 607 1.16 0.07 7.0 0.4
3 6.Medium duration pigeon pea + 25 kg P ha-1
622 1.0 0.06 6.4 0.4
3 7.Long duration pigeon pea + Groundnut + 25 kg P ha-1
652 0.98 0.06 6.4 0.4
3 8.Medium duration pigeon pea + Groundnut + 25 kg P ha-1
578 1.16 0.05 6.7 0.3
3 10.Long duration pigeon pea 563 1.51 0.08 8.5 0.5

333
Appendix 6.0: Nutrient uptake, groundnut at flowering parallel experiment
season two
Rep Treatment N(%) P(%)
1 7.Long duration pigeon pea + groundnut + 25 kg P ha-1
3.7 1.34
1 9.Groundnut only 4.3 1.41
1 1.Medium duration pigeon pea + groundnut 4.5 1.55
1 5.Long duration pigeon pea + groundnut 3.8 1.48
1 3.Groundnut + 25 kg P ha-1
3.2 1.28
1 8.Medium duration pigeon pea + groundnut + 25 kg P ha-1
4.4 1.48
2 9.Groundnut only 2.8 1.28
2 9.Long duration pigeon pea + groundnut + 25 kg P ha-1
4.5 1.48
2 3.Groundnut + 25 kg P ha-1
4.2 1.34
2 5.Long duration pigeon pea + groundnut 4.3 1.41
2 1.Medium duration pigeon pea + groundnut 4.0 1.34
2 8.Medium duration pigeon pea + groundnut + 25 kg P ha-1
4.5 1.48
3 9.Groundnut only 3.5 1.34
3 3.Groundnut + 25 kg P ha-1
3.6 1.31
3 8.Medium duration pigeon pea duration + 25 kg P ha-1
3.6 1.28
3 5.Long duration pigeon pea + groundnut 3.7 1.48
3 7.Long duration pigeon pea + groundnut + 25 kg P ha-1
3.6 1.28
3 8.Medium duration pigeon pea + groundnut + 25 kg P ha-1
4.0 1.48

334
Appendix 6.1: Nutrient uptake, pigeon pea at flowering parallel experiment season
two
Rep Treatments N(%) P(%)
1 10.long duration pigeon pea 4.0 0.29
1 2.long duration pigeon pea + 25 kg P ha-1
3.3 0.31
1 7.long duration pigeon pea + groundnut 3.4 0.31
1 1.medium duration pigeon pea + groundnut 2.9 0.31
1 4.medium duration pigeon pea 3.4 0.29
1 8.medium duration pigeon pea + groundnut 3.4 0.27
2 7.long duration pigeon pea + groundnut 3.1 0.23
2 5.long duration pigeon pea + groundnut 3.2 0.32
2 6.medium duration pigeon pea + 25 kg P ha-1
3.8 0.32
2 4.medium duration pigeon pea 3.6 0.29
2 2.long duration pigeon pea + 25 kg P ha-1
4.0 0.29
2 10.long duration pigeon pea 4.0 0.30
3 5.long duration pigeon pea + groundnut 3.4 0.28
3 10.long duration pigeon pea 4.1 0.34
3 2.long duration pigeon pea + 25 kg P ha-1
3.8 0.31
3 4.medium duration pigeon pea 2.2 0.21
3 8.medium duration pigeon pea + groundnut 2.6 0.27
3 7.long duration pigeon pea + groundnut 2.6 0.28
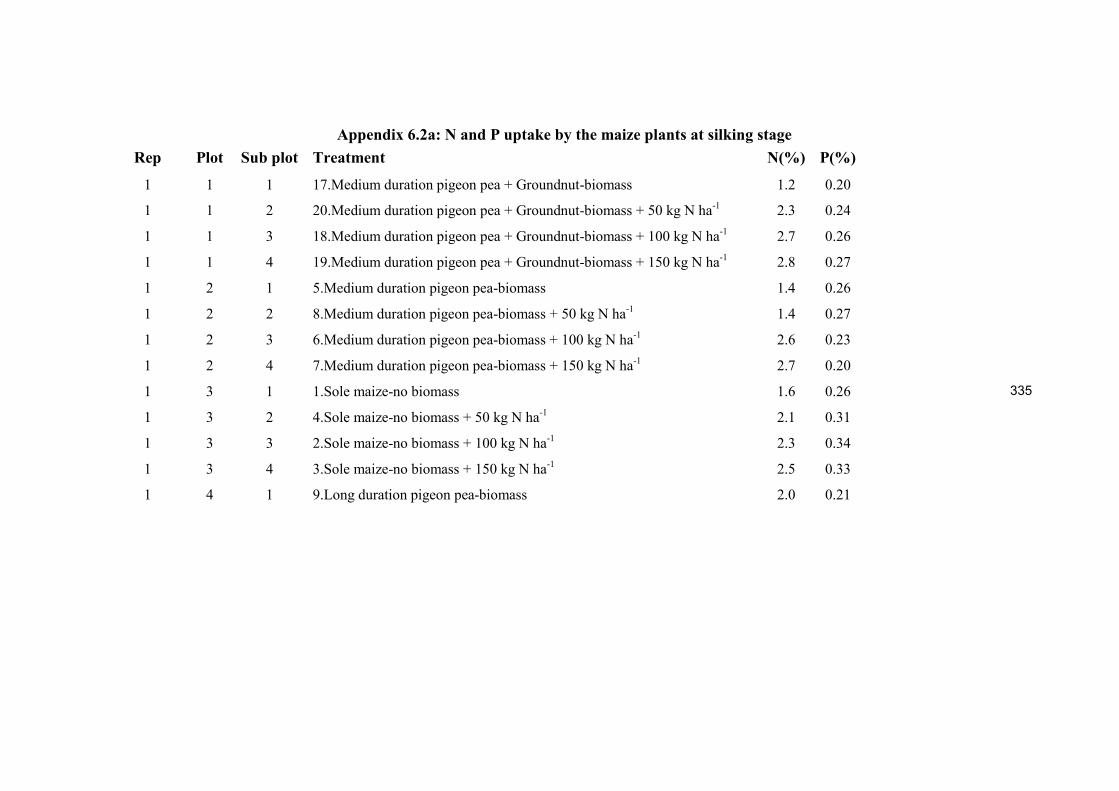
335
Appendix 6.2a: N and P uptake by the maize plants at silking stage
Rep Plot Sub plot Treatment N(%) P(%)
1 1 1 17.Medium duration pigeon pea + Groundnut-biomass 1.2 0.20
1 1 2 20.Medium duration pigeon pea + Groundnut-biomass + 50 kg N ha-1
2.3 0.24
1 1 3 18.Medium duration pigeon pea + Groundnut-biomass + 100 kg N ha-1
2.7 0.26
1 1 4 19.Medium duration pigeon pea + Groundnut-biomass + 150 kg N ha-1
2.8 0.27
1 2 1 5.Medium duration pigeon pea-biomass 1.4 0.26
1 2 2 8.Medium duration pigeon pea-biomass + 50 kg N ha-1
1.4 0.27
1 2 3 6.Medium duration pigeon pea-biomass + 100 kg N ha-1
2.6 0.23
1 2 4 7.Medium duration pigeon pea-biomass + 150 kg N ha-1
2.7 0.20
1 3 1 1.Sole maize-no biomass 1.6 0.26
1 3 2 4.Sole maize-no biomass + 50 kg N ha-1
2.1 0.31
1 3 3 2.Sole maize-no biomass + 100 kg N ha-1
2.3 0.34
1 3 4 3.Sole maize-no biomass + 150 kg N ha-1
2.5 0.33
1 4 1 9.Long duration pigeon pea-biomass 2.0 0.21

336
Rep
Plot
Sub plot
Treatment
N(%)
P(%)
1 4 2 12.Long duration pigeon pea-biomass + 50 kg N ha-1
2.1 0.25
1 4 3 10.Long duration pigeon pea-biomass + 100 kg N ha-1
2.4 0.28
1 4 4 11.Long duration pigeon pea-biomass + 150 kg N ha-1
2.5 0.30
1 5 1 13.Sole groundnut-biomass 0.4 0.09
1 5 2 16.Sole groundnut-biomass + 50 kg N ha-1
1.0 0.12
1 5 3 14.Sole groundnut-biomass + 100 kg N ha-1
2.3 0.09
1 5 4 15.Sole groundnut-biomass + 150 kg N ha-1
2.3 0.23
1 6 1 29.Long duration pigeon pea + Groundnut-no biomass 1.4 0.18
1 6 2 32.Long duration pigeon pea + Groundnut-no biomass + 50 kg N ha-1
1.8 0.21
1 6 3 30.Long duration pigeon pea + Groundnut-no biomass + 100 kg N ha-1
2.2 0.19
1 6 4 31.Long duration pigeon pea + Groundnut-no biomass + 150 kg N ha-1
2.5 0.19
1 7 1 25.Medium duration pigeon pea + Groundnut-no biomass 1.2 0.18
1 7 2 28.Medium duration pigeon pea + Groundnut-no biomass + 50 kg N ha-1
1.7 0.25
1 7 3 26.Medium duration pigeon pea + Groundnut-no biomass + 100 kg N ha-1
2.1 0.26
1 7 4 27.Medium duration pigeon pea + Groundnut-no biomass + 150 kg N ha-1
2.5 0.29
1 8 1 21.Long duration pigeon pea + Groundnut-biomass 2.3 0.20
1 8 2 24.Long duration pigeon pea + Groundnut-biomass + 50 kg N ha-1
2.5 0.22
1 8 3 22.Long duration pigeon pea + Groundnut-biomass + 100 kg N ha-1
2.6 0.21

337
Rep Plot Sub plot Treatment N(%) P(%)
1 8 4 23.Long duration pigeon pea + Groundnut-biomass + 150 kg N ha-1
2.7 0.25
2 1 1 29.Long duration pigeon pea + Groundnut-no biomass 2.0 0.34
2 1 2 32.Long duration pigeon pea + Groundnut-no biomass + 50 kg N ha-1
2.2 0.39
2 1 3 30.Long duration pigeon pea + Groundnut-no biomass + 100 kg N ha-1
2.3 0.31
2 1 4 31.Long duration pigeon pea + Groundnut-no biomass + 150 kg N ha-1
2.8 0.37
2 2 1 1.Sole maize-no biomass 1.7 0.29
2 2 2 4.Sole Maize-no biomass + 50 kg N ha-1
2.0 0.30
2 2 3 2.Sole maize-no biomass + 100 kg N ha-1
2.2 0.33
2 2 4 3.Sole maize-no biomass + 150 kg N ha-1
2.3 0.31
2 3 1 5.Medium duration pigeon pea-biomass 1.8 0.39
2 3 2 8.Medium duration pigeon pea-biomass + 50 kg N ha-1
1.8 0.40
2 3 3 6.Medium duration pigeon pea-biomass + 100 kg N ha-1
2.6 0.31
2 3 4 7.Medium duration pigeon pea-biomass + 150 kg N ha-1
2.9 0.28
2 4 1 21.Long duration pigeon pea + Groundnut-biomass 1.5 0.37
2 4 2 24.Long duration pigeon pea + Groundnut-biomass + 50 kg N ha-1
1.7 0.35
2 4 3 22.Long duration pigeon pea + Groundnut-biomass + 100 kg N ha-1
2.2 0.34
2 4 4 23.Long duration pigeon pea + Groundnut-biomass + 150 kg N ha-1
2.4 0.29
2 5 1 13.Sole groundnut-biomass 1.3 0.28
2 5 2 16.Sole groundnut-biomass + 50 kg N ha-1
1.8 0.30
2 5 3 14.Sole groundnut-biomass + 100 kg N ha-1
2.0 0.30
2 5 4 15.Sole groundnut-biomass + 150 kg N ha-1
2.4 0.31
2 6 1 9.Long duration pigeon pea-biomass 0.8 0.34

338
Rep Plot Sub plot Treatment N(%) P(%)
2 6 2 12.Long duration pigeon pea-biomass + 50 kg N ha-1
1.5 0.29
2 6 3 10.Long duration pigeon pea-biomass + 100 kg N ha-1
1.9 0.29
2 6 4 11.Long duration pigeon pea-biomass + 150 kg N ha-1
3.4 0.30
2 7 1 17.Medium duration pigeon pea + Groundnut-biomass 1.3 0.30
2 7 2 20.Medium duration pigeon pea + Groundnut-biomass + 50 kg N ha-1
1.9 0.24
2 7 3 18.Medium duration pigeon pea + Groundnut-biomass + 100 kg N ha-1
2.2 0.34
2 7 4 19.Medium duration pigeon pea + Groundnut-biomass + 150 kg N ha-1
2.6 0.31
2 8 1 25.Medium duration pigeon pea + Groundnut-no biomass 1.3 0.29
2 8 2 28.Medium duration pigeon pea + Groundnut-no biomass + 50 kg N ha-1
1.6 0.21
2 8 3 26.Medium duration pigeon pea + Groundnut-no biomass + 100 kg N ha-1
1.3 0.23
2 8 4 27.Medium duration pigeon pea + Groundnut-no biomass + 150 kg N ha-1
2.9 0.23
3 1 1 21.Long duration pigeon pea + Groundnut-biomass 2.7 0.25
3 1 2 24.Long duration pigeon pea + Groundnut-biomass + 50 kg N ha-1
2.4 0.22
3 1 3 22.Long duration pigeon pea + Groundnut-biomass + 100 kg N ha-1
2.5 0.20
3 1 4 23.Long duration pigeon pea + Groundnut-biomass + 150 kg N ha-1
2.1 0.23
3 2 1 9.Long duration pigeon pea-biomass 1.4 0.22
3 2 2 12.Long duration pigeon pea-biomass + 50 kg N ha-1
1.9 0.21
3 2 3 10.Long duration pigeon pea-biomass + 100 kg N ha-1
2.4 0.24
3 2 4 11.Long duration pigeon pea-biomass + 150 kg N ha-1
2.7 0.10
3 3 1 13.Sole groundnut-biomass 0.5 0.08

339
Rep Plot Sub plot Treatment N(%) P(%)
3 3 2 16.Sole groundnut-biomass + 50 kg N ha-1
0.9 0.11
3 3 3 14.Sole groundnut-biomass + 100 kg N ha-1
2.3 0.09
3 3 4 15.Sole groundnut-biomass + 150 kg N ha-1
2.7 0.22
3 4 1 5.Medium duration pigeon pea-biomass 1.5 0.27
3 4 2 8.Medium duration pigeon pea-biomass + 50 kg N ha-1
1.7 0.27
3 4 3 6.Medium duration pigeon pea-biomass + 100 kg N ha-1
2.2 0.22
3 4 4 7.Medium duration pigeon pea-biomass + 150 kg N ha-1
3.1 0.19
3 5 1 1.Sole maize-no biomass 2.7 0.29
3 5 2 4.Sole maize-no biomass + 50 kg N ha-1
2.1 0.30
3 5 3 2.Sole maize-no biomass + 100 kg N ha-1
2.5 0.29
3 5 4 3.Sole maize-no biomass + 150 kg N ha-1
3.1 0.22
3 6 1 29.Long duration pigeon pea + Groundnut-no biomass 1.4 0.20
3 6 2 32.Long duration pigeon pea + Groundnut-no biomass + 50 kg N ha-1
1.7 0.19
3 6 3 30.Long duration pigeon pea + Groundnut-no biomass + 100 kg N ha-1
2.5 0.18
3 6 4 31.Long duration pigeon pea + Groundnut-no biomass + 150 kg N ha-1
2.7 0.19
3 7 1 17.Medium duration pigeon pea + Groundnut-biomass 1.3 0.19
3 7 2 20.Medium duration pigeon pea + Groundnut-biomass + 50 kg N ha-1
1.9 0.26
3 7 3 18.Medium duration pigeon pea + Groundnut-biomass + 100 kg N ha-1
2.2 0.25

340
Rep Plot Sub plot Treatment N(%) P(%)
3 8 1 25.Medium duration pigeon pea + Groundnut-no biomass 1.9 0.26
3 8 2 28.Medium duration pigeon pea + Groundnut-no biomass + 50 kg N ha-1
2.1 0.24
3 8 3 26.Medium duration pigeon pea + Groundnut-no biomass + 100 kg N ha-1
2.2 0.22
3 8 4 27.Medium duration pigeon pea + Groundnut-no biomass + 150 kg N ha-1
2.7 0.19

341
Appendix 6.2c: Stover yield, main experiment season two
Rep
No.
Plot
No. Treatment
Maize
Population
Stover
Wt
(kg)
Adj.
Stover
Wt (kg)
Stover
Wt
ha-1
1 3 1.Sole maize-no biomass 18 0.8 0.9 1481
1 2 2.Medium duration pigeon pea-biomass 21 1 1.0 1587
1 4 3.Long duration pigeon pea-biomass 22 1.8 1.6 2727
1 5 4.Sole groundnut-biomass 19 2.2 2.3 3860
1 1 5.Medium duration pigeon pea + Groundnut-biomass 21 2.6 2.5 4127
1 8 6.Long duration pigeon pea + Groundnut-biomass 18 2 2.2 3704
1 7 7.Medium duration pigeon pea + Groundnut-no biomass 22 1.6 1.5 2424
1 6 8.Long duration pigeon pea + Groundnut-no biomass 20 1.6 1.6 2667
2 2 1.Sole maize-no biomass 20 1.2 1.2 2000
2 3 2.Medium duration pigeon pea-biomass 24 0.6 0.5 833
2 6 3.Long duration pigeon pea-biomass 22 1 0.9 1515
2 5 4.Sole groundnut-biomass 20 1 1.0 1667
2 7 5.Medium duration pigeon pea + Groundnut-biomass 19 1 1.1 1754
2 4 6.Long duration pigeon pea + Groundnut-biomass 20 0.2 0.2 333
2 8 7.Medium duration pigeon pea + Groundnut-no biomass 20 1.2 1.2 2000
2 1 8.Long duration pigeon pea + Groundnut-no biomass 20 1 1.0 1667
3 5 1.Sole maize-no biomass 21 2.1 2.0 3333
3 4 2.Medium duration pigeon pea-biomass 20 2.2 2.2 3667

342
Rep.
Plot
No. Treatments
Maize
Population
Stover
Wt
(kg)
Adj.
Stover
Wt (kg)
Stover
Wt
ha-1
3 2 3.Long duration pigeon pea-biomass 21 2.8 2.7 4444
3 3 4.Sole groundnut-biomass 24 2.1 1.8 2917
3 7 5.Medium duration pigeon pea + Groundnut-biomass 23 2.2 1.9 3188
3 1 6.Long duration pigeon pea + Groundnut-biomass 20 1.5 1.5 2500
3 8 7.Medium duration pigeon Pea + Groundnut-no biomass 23 2.2 1.9 3188
3 6 8.Long duration pigeon pea + Groundnut-no biomass 23 2.3 2.0 3333
1 3 1.Sole maize-no biomass + 50 kg N ha-1
20 1.6 1.6 2667
1 2 2.Medium duration pigeon pea-biomass + 50 kg N ha-1
20 1.4 1.4 2333
1 4 3.Long duration pigeon pea-biomass + 50 kg N ha-1
18 2.8 3.1 5185
1 5 4.Sole groundnut-biomass + 50 kg N ha-1
20 1.8 1.8 3000
1 1
5.Medium duration pigeon pea + Groundnut-biomass + 50 kg N
ha-1
19 3 3.2 5263
1 8
6.Long duration pigeon pea + Groundnut-biomass + 50 kg N ha-
1 22 3.8 3.5 5758
1 7
7.Medium duration pigeon pea + Groundnut-no biomass + 50 kg
N ha-1
20 1.8 1.8 3000
1 6
8.Long duration pigeon pea + Groundnut-no biomass + 50 kg N
ha-1
22 1.6 1.5 2424
2 2 1.Sole maize-no biomass + 50 kg N ha-1
21 1.2 1.1 1905
2 3 2.Medium duration pigeon pea-biomass + 50 kg N ha-1
24 3.2 2.7 4444

343
2 6 3.Long duration pigeon pea-biomass + 50 kg N ha-1
23 2.2 1.9 3188
Rep.
Plot
No. Treatments
Maize
Population
Stover
Wt
(kg)
Adj.
Stover
Wt (kg)
Stover
Wt
ha-1
2 7
5.Medium duration pigeon pea + Groundnut-biomass + 50 kg N
ha-1
19 1.4 1.5 2456
2 4
6.Long duration pigeon pea + Groundnut-biomass + 50 kg N ha-
1 12 1 1.7 2778
2 8
7.Medium duration pigeon pea + Groundnut-no biomass + 50 kg
N ha-1
15 1.6 2.1 3556
2 1
8.Long duration pigeon pea + Groundnut-no biomass + 50 kg N
ha-1
33 1.6 1.0 1616
3 5 1.Sole maize-no biomass + 50 kg N ha-1
23 2.2 1.9 3188
3 4 2.Medium duration pigeon pea-biomass + 50 kg N ha-1
25 2.4 1.9 3200
3 2 3.Long duration pigeon pea-biomass + 50 kg N ha-1
26 2.2 1.7 2821
3 3 4.Sole groundnut-biomass + 50 kg N ha-1
20 1.8 1.8 3000
3 7
5.Medium duration pigeon pea + Groundnut-biomass + 50 kg N
ha-1
26 2.6 2.0 3333
3 1
6.Long duration pigeon pea + Groundnut-biomass + 50 kg N ha-
1 17 1.8 2.1 3529
3 8
7.Medium duration pigeon pea + Groundnut-no biomass + 50 kg
N ha-1
24 2.1 1.8 2917

344
Rep.
Plot
No.
Treatments
Maize
Population
Stover
Wt
(kg)
Adj.
Stover
Wt (kg)
Stover
Wt
ha-1
3 6
8.Long duration pigeon pea + Groundnut-no biomass + 50 kg N
ha-1
21 2.5 2.4 3968
1 3 1.Sole maize-no biomass + 100 kg N ha-1
23 1.5 1.3 2174
1 2 2.Medium duration pigeon pea-biomass + 100 kg N ha-1
23 2 1.7 2899
1 4 3.Long duration pigeon pea-biomass + 100 kg N ha-1
23 2.6 2.3 3768
1 5 4.Sole groundnut-biomass + 100 kg N ha-1
22 1.8 1.6 2727
1 1
5.Medium duration pigeon pea + Groundnut-biomass + 100 kg
N ha-1
18 2.4 2.7 4444
1 8
6.Long duration pigeon pea + Groundnut-biomass + 100 kg N
ha-1
21 3.6 3.4 5714
1 7
7.Medium duration pigeon pea + Groundnut-no biomass + 100
kg N ha-1
20 1 1.0 1667
1 6
8.Long duration pigeon pea + Groundnut-no biomass + 100 kg
N ha-1
22 1.4 1.3 2121
2 2 1.Sole maize-no biomass + 100 kg N ha-1
19 1.2 1.3 2105
2 3 2.Medium duration pigeon pea-biomass + 100 kg N ha-1
25 3 2.4 4000
2 6 3.Long duration pigeon pea-biomass + 100 kg N ha-1
13 1 1.5 2564
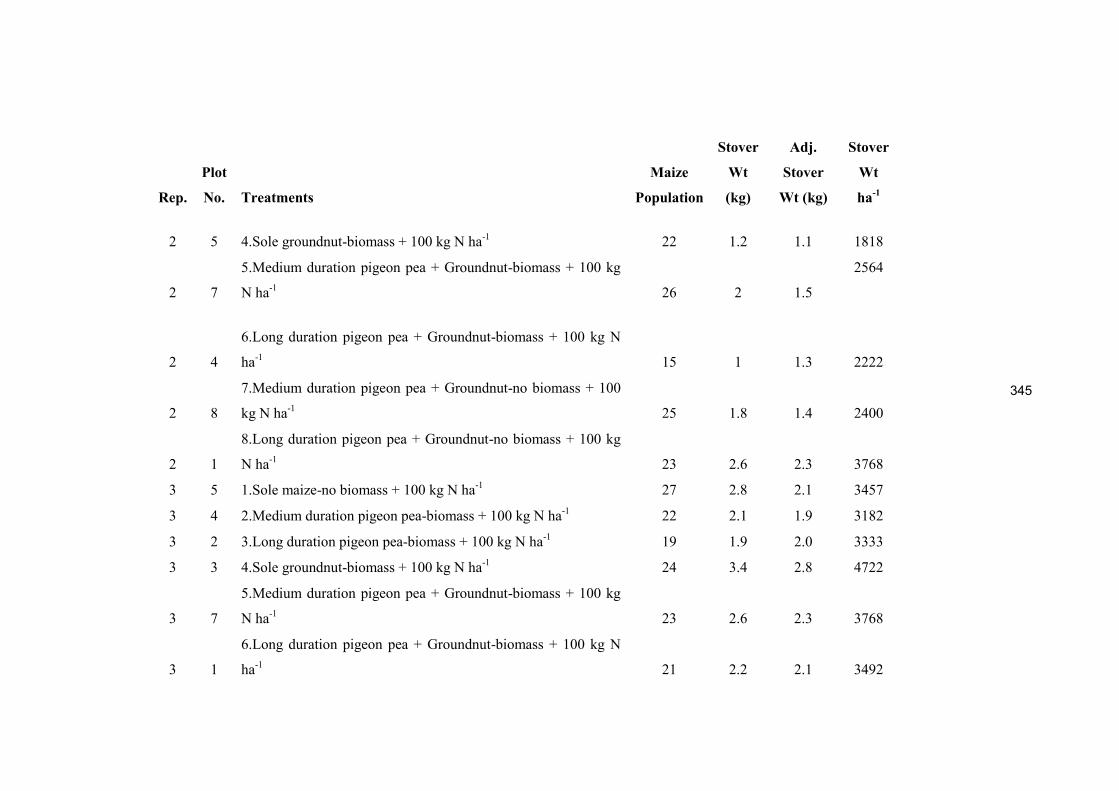
345
Rep.
Plot
No.
Treatments
Maize
Population
Stover
Wt
(kg)
Adj.
Stover
Wt (kg)
Stover
Wt
ha-1
2 5 4.Sole groundnut-biomass + 100 kg N ha-1
22 1.2 1.1 1818
2 7
5.Medium duration pigeon pea + Groundnut-biomass + 100 kg
N ha-1
26 2 1.5
2564
2 4
6.Long duration pigeon pea + Groundnut-biomass + 100 kg N
ha-1
15 1 1.3 2222
2 8
7.Medium duration pigeon pea + Groundnut-no biomass + 100
kg N ha-1
25 1.8 1.4 2400
2 1
8.Long duration pigeon pea + Groundnut-no biomass + 100 kg
N ha-1
23 2.6 2.3 3768
3 5 1.Sole maize-no biomass + 100 kg N ha-1
27 2.8 2.1 3457
3 4 2.Medium duration pigeon pea-biomass + 100 kg N ha-1
22 2.1 1.9 3182
3 2 3.Long duration pigeon pea-biomass + 100 kg N ha-1
19 1.9 2.0 3333
3 3 4.Sole groundnut-biomass + 100 kg N ha-1
24 3.4 2.8 4722
3 7
5.Medium duration pigeon pea + Groundnut-biomass + 100 kg
N ha-1
23 2.6 2.3 3768
3 1
6.Long duration pigeon pea + Groundnut-biomass + 100 kg N
ha-1
21 2.2 2.1 3492

346
Rep. Plot
No.
Treatments Maize
Population
Stover
Wt
(kg)
Adj.
Stover
Wt (kg)
Stover
Wt
ha-1
3 6
8.Long duration pigeon pea + Groundnut-no biomass + 100 kg
N ha-1
24 2.6 2.2 3611
1 3 1.Sole maize-no biomass + 150 kg N ha-1
23 1.4 1.2 2029
1 2 2.Medium duration pigeon pea-biomass + 150 kg N ha-1
24 1.6 1.3 2222
1 4 3.Long duration pigeon pea-biomass + 150 kg N ha-1
21 2 1.9 3175
1 5 4.Sole groundnut-biomass + 150 kg N ha-1
23 2.8 2.4 4058
1 1
5.Medium duration pigeon pea + Groundnut-biomass + 150 kg
N ha-1
22 2.6 2.4 3939
1 8
6.Long duration pigeon pea + Groundnut-biomass + 150 kg N
ha-1
24 3 2.5 4167
1 7
7.Medium duration pigeon pea + Groundnut-no biomass + 150
kg N ha-1
21 1.2 1.1 1905
1 6
8.Long duration pigeon pea + Groundnut-no biomass + 150 kg
N ha-1
20 1 1.0 1667
2 2 1.Sole naize-no biomass + 150 kg N ha-1
23 2 1.7 2899
2 3 2.Medium duration pigeon pea-biomass + 150 kg N ha-1
24 1.4 1.2 1944
2 6 3.Long duration pigeon pea-biomass + 150 kg N ha-1
18 1.8 2.0 3333
2 5 4.Sole groundnut-biomass + 150 kg N ha-1
22 3.2 2.9 4848

347
Rep. Plot
No.
Treatments Maize
Population
Stover
Wt
(kg)
Adj.
Stover
Wt (kg)
Stover
Wt
ha-1
2 7
5.Medium duration pigeon pea + Groundnut-biomass + 150 kg
N ha-1
14 1.4 2.0
3333
2 4
6.Long duration pigeon pea + Groundnut-biomass + 150 kg N
ha-1
18 0.8 0.9 1481
2 8
7.Medium duration pigeon pea + Groundnut-no biomass + 150
kg N ha-1
18 1.9 2.1 3519
2 1
8.Long duration pigeon pea + Groundnut-no biomass + 150 kg
N ha-1
24 3.2 2.7 4444
3 5 1.Sole maize-no biomass + 150 kg N ha-1
22 2.7 2.5 4091
3 4 2.Medium duration pigeon pea-biomass + 150 kg N ha-1
20 2.8 2.8 4667
3 2 3.Long duration pigeon pea-biomass + 150 kg N ha-1
23 2.2 1.9 3188
3 3 4.Sole groundnut-biomass + 150 kg N ha-1
20 2.6 2.6 4333
3 7
5.Medium duration pigeon pea + Groundnut-biomass + 150 kg
N ha-1
20 3.1 3.1 5167
3 1
6.Long duration pigeon pea + Groundnut-biomass + 150 kg N
ha-1
20 2.2 2.2 3667
3 8
7.Medium duration pigeon pea + Groundnut-no biomass + 150
kg N ha-1
20 2.7 2.7 4500

348
Rep.
Plot
No. Treatments
Maize
Population
Maize
Rachids
Wt (kg)
Adj.
rachids
Wt
(kg)
Rachids
Wt kg
ha-1
1 3 1.Sole maize-no biomass 18 0.2 0.2 370
1 2 2.Medium duration pigeon pea-biomass 21 0.2 0.2 317
1 4 3.Long duration pigeon pea-biomass 22 0.8 0.7 1212
1 5 4.Sole groundnut-biomass 19 0.4 0.4 702
1 1 5.Medium duration pigeon pea + Groundnut-biomass 21 0.5 0.5 794
1 8 6.Long duration pigeon pea + Groundnut-biomass 18 0.3 0.3 556
1 7 7.Medium duration pigeon pea + Groundnut-no biomass 22 0.2 0.2 303
1 6 8.Long duration pigeon pea + Groundnut-no biomass 20 0.6 0.6 1000
2 2 1.Sole maize-no biomass 20 0.6 0.6 1000
2 3 2.Medium duration pigeon pea-biomass 24 1 0.8 1389
2 6 3.Long duration pigeon pea-biomass 22 0.6 0.5 909
2 5 4.Sole groundnut-biomass 20 0.4 0.4 667
2 7 5.Medium duration pigeon pea + Groundnut-biomass 19 0.2 0.2 351
2 4 6.Long duration pigeon pea + Groundnut-biomass 20 0.4 0.4 667
2 8 7.Medium duration pigeon pea + Groundnut-no biomass 20 0.2 0.2 333
2 1 8.Long duration pigeon pea + Groundnut-no biomass 20 0.2 0.2 333

349
Rep.
Plot
No. Treatments
Maize
Population
Maize
Rachids
Wt (kg)
Adj.
rachids
Wt
(kg)
Rachids
Wt kg
ha-1
3 5 1.Sole maize-no biomass 21 0.6 0.6 952
3 4 2.Medium duration pigeon pea-biomass 20 0.8 0.8 1333
3 2 3.Long duration pigeon pea-biomass 21 0.6 0.6 952
3 3 4.Sole groundnut-biomass 24 0.4 0.3 556
3 7 5.Medium duration pigeon pea + Groundnut-biomass 23 0.6 0.5 870
3 1 6.Long duration pigeon pea + Groundnut-biomass 20 0.4 0.4 667
3 8 7.Medium duration pigeon Pea + Groundnut-no biomass 23 0.4 0.3 580
3 6 8.Long duration pigeon pea + Groundnut-no biomass 23 0.2 0.2 290
1 3 1.Sole maize-no biomass + 50 kg N ha-1
20 0.4 0.4 741
1 2 2.Medium duration pigeon pea-biomass + 50 kg N ha-1
20 1 1.0 1667
1 4 3.Long duration pigeon pea-biomass + 50 kg N ha-1
18 0.8 0.9 1481
1 5 4.Sole groundnut-biomass + 50 kg N ha-1
20 0.3 0.3 526
1 1 5.Medium duration pigeon pea + Groundnut-biomass + 50 kg N ha-1
19 0.2 0.3 417
1 8 6.Long duration pigeon pea + Groundnut-biomass + 50 kg N ha-1
22 0.8 0.6 1026
1 7
7.Medium duration pigeon pea + Groundnut-no biomass + 50 kg N
ha-1
20 0.2 0.2 317
1 6 8.Long duration pigeon pea + Groundnut-no biomass + 50 kg N ha-1
22 0.6 0.6 952
2 1 1.Sole maize-no biomass + 50 kg N ha-1
33 0.8 0.6 988
2 2 2.Medium duration pigeon pea-biomass + 50 kg N ha-1
21 0.6 0.6 952

350
Rep.
Plot
No. Treatments
Maize
Population
Maize
Rachids
Wt (kg)
Adj.
rachids
Wt
(kg)
Rachids
Wt kg
ha-1
2 3 3.Long duration pigeon pea-biomass + 50 kg N ha-1
24 0.4 0.3 533
2 4 4.Sole groundnut-biomass + 50 kg N ha-1
12 0.4 0.5 889
2 5 5.Medium duration pigeon pea + Groundnut-biomass + 50 kg N ha-1
13 0.2 0.3 444
2 6 6.Long duration pigeon pea + Groundnut-biomass + 50 kg N ha-1
23 0.6 0.5 909
2 7
7.Medium duration pigeon pea + Groundnut-no biomass + 50 kg N
ha-1
19 0.4 0.4 702
2 8 8.Long duration pigeon pea + Groundnut-no biomass + 50 kg N ha-1
15 0.6 0.6 1000
3 1 1.Sole maize-no biomass + 50 kg N ha-1
17 0.2 0.2 333
3 2 2.Medium duration pigeon pea-biomass + 50 kg N ha-1
26 0.4 0.4 667
3 3 3.Long duration pigeon pea-biomass + 50 kg N ha-1
20 0.6 0.6 1000
3 4 4.Sole groundnut-biomass + 50 kg N ha-1
25 0.8 0.8 1333
3 5 5.Medium duration pigeon pea + Groundnut-biomass + 50 kg N ha-1
23 0.2 0.2 290
3 6 6.Long duration pigeon pea + Groundnut-biomass + 50 kg N ha-1
21 0.8 0.8 1270
3 7
7.Medium duration pigeon pea + Groundnut-no biomass + 50 kg N
ha-1
26 0.8 0.8 1333
3 8 8.Long duration pigeon pea + Groundnut-no biomass + 50 kg N ha-1
24 0.8 0.7 1111
1 1 1.Sole maize-no biomass + 100 kg N ha-1
18 0.5 0.6
926

351
Rep.
Plot
No. Treatments
Maize
Population
Maize
Rachids
Wt (kg)
Adj.
rachids
Wt
(kg)
Rachids
Wt kg
ha-1
1 2 2.Medium duration pigeon pea-biomass + 100 kg N ha-1
23 0.4 0.3
513
1 3 3.Long duration pigeon pea-biomass + 100 kg N ha-1
23 0.2 0.2 333
1 4 4.Sole groundnut-biomass + 100 kg N ha-1
23 0.6 0.5 870
1 5
5.Medium duration pigeon pea + Groundnut-biomass + 100 kg N
ha-1
22 0.4 0.3 580
1 6 6.Long duration pigeon pea + Groundnut-biomass + 100 kg N ha-1
22 0.4 0.4 635
1 7
7.Medium duration pigeon pea + Groundnut-no biomass + 100 kg N
ha-1
20 0.6 0.6 952
1 8
8.Long duration pigeon pea + Groundnut-no biomass + 100 kg N
ha-1
21 0.8 0.7 1212
2 2 1.Sole maize-no biomass + 100 kg N ha-1
19 0.2 0.2 370
2 3 2.Medium duration pigeon pea-biomass + 100 kg N ha-1
25 1 0.7 1235
2 6 3.Long duration pigeon pea-biomass + 100 kg N ha-1
13 0.4 0.6 1026
2 5 4.Sole groundnut-biomass + 100 kg N ha-1
22 0.6 0.5 870
2 7
5.Medium duration pigeon pea + Groundnut-biomass + 100 kg N
ha-1
26 1.2 0.9 1538

352
Rep.
Plot
No.
Treatments
Maize
Population
Maize
Rachids
Wt (kg)
Adj.
rachids
Wt
(kg)
Rachids
Wt kg
ha-1
2 8
7.Medium duration pigeon pea + Groundnut-no biomass + 100 kg N
ha-1
25 0.6 0.5 800
2 1
8.Long duration pigeon pea + Groundnut-no biomass + 100 kg N
ha-1
23 0.4 0.4 635
3 5 1.Sole maize-no biomass + 100 kg N ha-1
27 0.8 0.8 1333
3 4 2.Medium duration pigeon pea-biomass + 100 kg N ha-1
22 0.6 0.7 1111
3 2 3.Long duration pigeon pea-biomass + 100 kg N ha-1
19 0.8 0.8 1333
3 3 4.Sole groundnut-biomass + 100 kg N ha-1
24 1.2 1.2 2000
3 7
5.Medium duration pigeon pea + Groundnut-biomass + 100 kg N
ha-1
23 0.6 0.6 1000
3 1 6.Long duration pigeon pea + Groundnut-biomass + 100 kg N ha-1
21 0.6 0.6 1000
3 8
7.Medium duration pigeon pea + Groundnut-no biomass + 100 kg N
ha-1
21 0.6 0.6 1000
3 6
8.Long duration pigeon pea + Groundnut-no biomass + 100 kg N
ha-1
24 0.4 0.4 635
1 3 1.Sole maize-no biomass + 150 kg N ha-1
23 0.6 0.5 870
1 2 2.Medium duration pigeon pea-biomass + 150 kg N ha-1
24 0.4 0.4 606

353
1 4 3.Long duration pigeon pea-biomass + 150 kg N ha-1
21 0.4 0.4 635
1 5 4.Sole groundnut-biomass + 150 kg N ha-1
23 1 0.7 1190
1 1
5.Medium duration pigeon pea + Groundnut-biomass + 150 kg N
ha-1
22 0.8 0.6 988
1 8 6.Long duration pigeon pea + Groundnut-biomass + 150 kg N ha-1
24 0.8 0.6 1067
1 7
7.Medium duration pigeon pea + Groundnut-no biomass + 150 kg N
ha-1
21 0.4 0.4 741
1 6
8.Long duration pigeon pea + Groundnut-no biomass + 150 kg N
ha-1
20 0.4 0.5 784
2 2 1.Sole naize-no biomass + 150 kg N ha-1
23 0.6 0.5 833
2 3 2.Medium duration pigeon pea-biomass + 150 kg N ha-1
24 0.8 0.6 1067
2 6 3.Long duration pigeon pea-biomass + 150 kg N ha-1
18 0.6 0.7 1111
2 5 4.Sole groundnut-biomass + 150 kg N ha-1
22 1 0.9 1515
2 7
5.Medium duration pigeon pea + Groundnut-biomass + 150 kg N
ha-1
14 0.6 0.7 1176
2 4 6.Long duration pigeon pea + Groundnut-biomass + 150 kg N ha-1
18 0.4 0.4 741
2 8
7.Medium duration pigeon pea + Groundnut-no biomass + 150 kg N
ha-1
18 0.4 0.4 667
2 1
8.Long duration pigeon pea + Groundnut-no biomass + 150 kg N
ha-1
24 0.4 0.3 513

354
Rep.
Plot
No.
Treatments
Maize
Population
Maize
Rachids
Wt (kg)
Adj.
rachids
Wt
(kg)
Rachids
Wt kg
ha-1
3 5 1.Sole maize-no biomass + 150 kg N ha-1
22 0.8 0.8 1333
3 4 2.Medium duration pigeon pea-biomass + 150 kg N ha-1
20 0.2 0.2 333
3 2 3.Long duration pigeon pea-biomass + 150 kg N ha-1
23 0.8 0.8 1333
3 3 4.Sole groundnut-biomass + 150 kg N ha-1
20 0.6 0.6 1000
3 7
5.Medium duration pigeon pea + Groundnut-biomass + 150 kg N
ha-1
20 0.1 0.1 167
3 1 6.Long duration pigeon pea + Groundnut-biomass + 150 kg N ha-1
20 0.6 0.6 1000
3 8
7.Medium duration pigeon pea + Groundnut-no biomass + 150 kg N
ha-1
20 0.6 0.6 1000
3 6
8.Long duration pigeon pea + Groundnut-no biomass + 150 kg N
ha-1
21 0.8 0.8 1270

355
Appendix 6.2d: Rachids yield, main experiment season twoAppendix 6.2e: Cob length,
main experiment season two
Rep.
Plot
No.
Treatments
Cob
Length
(cm)
1 2 3 4
Average
Cob
length
(cm)
1 3 1.Sole maize-no biomass 7 8 11 15 19 13
1 2 2.Medium duration pigeon pea-biomass 7 9 11 16 20 14
1 4 3.Long duration pigeon pea-biomass 5 12 13 20 21 17
1 5 4.Sole groundnut-biomass 7 9 11 16 20 14
1 1 5.Medium duration pigeon pea + Groundnut-biomass 5 12 13 20 21 17
1 8 6.Long duration pigeon pea + Groundnut-biomass 6 10 14 17 10 13
1 7
7.Medium duration pigeon pea + Groundnut-no
biomass 4 6 11 13 14 11
1 6 8.Long duration pigeon pea + Groundnut-no biomass 7 8 11 15 19 13
2 2 1.Sole maize-no biomass 11 12 16 19 22 17
2 3 2.Medium duration pigeon pea-biomass 3 8 16 17 19 15
2 6 3.Long duration pigeon pea-biomass 11 12 13 17 18 15
2 5 4.Sole groundnut-biomass 11 14 16 19 22 18
2 7 5.Medium duration pigeon pea + Groundnut-biomass 6 9 13 17 22 15
2 4 6.Long duration pigeon pea + Groundnut-biomass 5 9 11 15 18 13
2 8
7.Medium duration pigeon pea + Groundnut-no
biomass 15 15 20 21 21 19

356
2 1 8.Long duration pigeon pea + Groundnut-no biomass 11 13 14 17 22 17
3 5 1.Sole maize-no biomass 11 14 17 22 22 19
3 4 2.Medium duration pigeon pea-biomass 10 13 18 19 19 17
3 2 3.Long duration pigeon pea-biomass 12 13 18 20 20 18
3 3 4.Sole groundnut-biomass 11 13 17 19 19 17
3 7 5.Medium duration pigeon pea + Groundnut-biomass 10 14 16 20 20 18
3 1 6.Long duration pigeon pea + Groundnut-biomass 13 16 17 19 19 18
3 8
7.Medium duration pigeon Pea + Groundnut-no
biomass 14 19 20 22 22 21
3 6 8.Long duration pigeon pea + Groundnut-no biomass 12 17 18 19 19 18
1 3 1.Sole maize-no biomass + 50 kg N ha-1
6 10 12 16 20 15
1 2
2.Medium duration pigeon pea-biomass + 50 kg N
ha-1
8 13 15 17 19 16
1 4 3.Long duration pigeon pea-biomass + 50 kg N ha-1
12 14 16 19 21 18
1 5 4.Sole groundnut-biomass + 50 kg N ha-1
6 8 12 15 18 13
1 1
5.Medium duration pigeon pea + Groundnut-biomass
+ 50 kg N ha-1
11 14 15 17 20 17
1 8
6.Long duration pigeon pea + Groundnut-biomass +
50 kg N ha-1
5 8 12 16 19 14
1 7
7.Medium duration pigeon pea + Groundnut-no
biomass + 50 kg N ha-1
5 7 9 11 14 10
1 6
8.Long duration pigeon pea + Groundnut-no biomass
+ 50 kg N ha-1
11 13 15 17 18 16

357
2 2 1.Sole maize-no biomass + 50 kg N ha-1
9 11 15 19 22 17
2 3
2.Medium duration pigeon pea-biomass + 50 kg N
ha-1
11 14 15 17 20 17
2 6 3.Long duration pigeon pea-biomass + 50 kg N ha-1
11 13 15 18 21 17
2 5 4.Sole groundnut-biomass + 50 kg N ha-1
6 10 12 16 20 15
2 7
5.Medium duration pigeon pea + Groundnut-biomass
+ 50 kg N ha-1
8 12 14 18 19 16
2 4
6.Long duration pigeon pea + Groundnut-biomass +
50 kg N ha-1
8 13 15 17 19 16
2 8
7.Medium duration pigeon pea + Groundnut-no
biomass + 50 kg N ha-1
10 14 17 18 18 17
2 1
8.Long duration pigeon pea + Groundnut-no biomass
+ 50 kg N ha-1
9 11 16 18 20 16
3 5 1.Sole maize-no biomass + 50 kg N ha-1
10 13 18 19 19 17
3 4
2.Medium duration pigeon pea-biomass + 50 kg N
ha-1
9 15 17 20 20 18
3 2 3.Long duration pigeon pea-biomass + 50 kg N ha-1
12 15 17 18 18 17
3 3 4.Sole groundnut-biomass + 50 kg N ha-1
13 16 17 20 20 18
3 7
5.Medium duration pigeon pea + Groundnut-biomass
+ 50 kg N ha-1
12 14 15 21 21 18
3 1
6.Long duration pigeon pea + Groundnut-biomass +
50 kg N ha-1
12 14 17 19 19 17

358
3 8
7.Medium duration pigeon pea + Groundnut-no
biomass + 50 kg N ha-1
13 15 16 19 19 17
3 6
8.Long duration pigeon pea + Groundnut-no biomass
+ 50 kg N ha-1
9 14 16 19 19 17
1 3 1.Sole maize-no biomass + 100 kg N ha-1
10 11 14.5 19 21 16
1 2
2.Medium duration pigeon pea-biomass + 100 kg N
ha-1
11 13 14 17 21 16
1 4 3.Long duration pigeon pea-biomass + 100 kg N ha-1
9 10 13 17 21 15
1 5 4.Sole groundnut-biomass + 100 kg N ha-1
8 12 14 18 22 17
1 1
5.Medium duration pigeon pea + Groundnut-biomass
+ 100 kg N ha-1
6 8 15 17 21 15
1 7
7.Medium duration pigeon pea + Groundnut-no
biomass + 100 kg N ha-1
6 8 12 14 20 14
1 6
8.Long duration pigeon pea + Groundnut-no biomass
+ 100 kg N ha-1
9 12 13 15 18 15
2 2 1.Sole maize-no biomass + 100 kg N ha-1
11 13 14 17 21 16
2 3
2.Medium duration pigeon pea-biomass + 100 kg N
ha-1
10 11 14.5 19 21 16
2 6 3.Long duration pigeon pea-biomass + 100 kg N ha-1
9 11 15 19 22 17
2 5 4.Sole groundnut-biomass + 100 kg N ha-1
7 14 16 17 20 17
2 7
5.Medium duration pigeon pea + Groundnut-biomass
+ 100 kg N ha-1
4 11 15 17 19 16

359
2 4
6.Long duration pigeon pea + Groundnut-biomass +
100 kg N ha-1
7 12 13 18 21 16
2 8
7.Medium duration pigeon pea + Groundnut-no
biomass + 100 kg N ha-1
8 10 15 17 20 16
2 1
8.Long duration pigeon pea + Groundnut-no biomass
+ 100 kg N ha-1
6 8 15 17 21 15
3 5 1.Sole maize-no biomass + 100 kg N ha-1
10 14 16 20 20 18
3 4
2.Medium duration pigeon pea-biomass + 100 kg N
ha-1
10 15 18 19 19 18
3 2 3.Long duration pigeon pea-biomass + 100 kg N ha-1
14 15 18 19 19 18
3 3 4.Sole groundnut-biomass + 100 kg N ha-1
9 12 18 22 22 19
3 7
5.Medium duration pigeon pea + Groundnut-biomass
+ 100 kg N ha-1
11 13 17 20 20 18
3 1
6.Long duration pigeon pea + Groundnut-biomass +
100 kg N ha-1
13 14 16 21 21 18
3 8
7.Medium duration pigeon pea + Groundnut-no
biomass + 100 kg N ha-1
14 17 19 20 20 19
3 6
8.Long duration pigeon pea + Groundnut-no biomass
+ 100 kg N ha-1
10 15 19 22 22 20
1 3 1.Sole maize-no biomass + 150 kg N ha-1
11 13 17 20 20 18
1 2
2.Medium duration pigeon pea-biomass + 150 kg N
ha-1
10 15 19 22 22 20
1 4 3.Long duration pigeon pea-biomass + 150 kg N ha-1
14 17 19 20 20 19
1 5 4.Sole groundnut-biomass + 150 kg N ha-1
11 13 16 20 25 19
1 1 5.Medium duration pigeon pea + Groundnut-biomass 10 14 16 20 20 18

360
+ 150 kg N ha-1
1 8
6.Long duration pigeon pea + Groundnut-biomass +
150 kg N ha-1
6 10 13 15 20 15
1 7
7.Medium duration pigeon pea + Groundnut-no
biomass + 150 kg N ha-1
10 14 16 17 20 17
1 6
8.Long duration pigeon pea + Groundnut-no biomass
+ 150 kg N ha-1
12 13 14 18 21 17
2 2 1.Sole naize-no biomass + 150 kg N ha-1
11 14 16 19 22 18
2 3
2.Medium duration pigeon pea-biomass + 150 kg N
ha-1
12 15 17 19 21 18
2 6 3.Long duration pigeon pea-biomass + 150 kg N ha-1
7 11 17 18 21 17
2 5 4.Sole groundnut-biomass + 150 kg N ha-1
10 14 16 21 22 18
2 7
5.Medium duration pigeon pea + Groundnut-biomass
+ 150 kg N ha-1
9 10 12 17 19 15
2 4
6.Long duration pigeon pea + Groundnut-biomass +
150 kg N ha-1
12 14 15 15 22 17
2 8
7.Medium duration pigeon pea + Groundnut-no
biomass + 150 kg N ha-1
10 13 14 19 19 16
2 1
8.Long duration pigeon pea + Groundnut-no biomass
+ 150 kg N ha-1
12 13 16 18 21 17
3 5 1.Sole maize-no biomass + 150 kg N ha-1
10 14 16 19 19 17
3 2 3.Long duration pigeon pea-biomass + 150 kg N ha-1
13 14 19 21 21 19
3 3 4.Sole groundnut-biomass + 150 kg N ha-1
10 14 18 19 19 18

361
Appendix 7.0: Fertilizer calculations main and parallel experiment
TSP to legumes
P2O5 in TSP= 46%
Elemental P= 46 x 0 .437=20.102
100 kg contains 20 kg elemental P
to apply 25 kg P ha-1
requires =124.3657 kg
1 planting station of 90cm x 75cm will require
= 0.9*0.75/10000*124.3657*1000
8.4g
Fertilizer (TSP) calculations main experiment: Maize
P2O5 in TSP = 46% Elemental P = 46 x 0 .437 =20.102
100 kg contains 20 kg elemental P
to apply 50 kg P ha-1
requires =250 kg
1 planting station of 25cm x 75cm required
=0.25*0.75/10000*250*1000
4.7g
Urea
Content of N in the urea = 46%
1. Rate to be applied = 50 kg N ha-1
46 kg of N is contained in 100 kg of urea
50 kg of N will be contained in
50/46*100 kg

362
=108.7 kg
Amount per planting station
0.25*0.75/10000*108.7*1000g
=2g
2. Rate to be applied = 100 kg N ha-1
46 kg of N is contained in 100 kg of urea
100 kg of N will be contained in
100/46*100 kg
=217.4 kg
Amount per planting station
0.25*0.75/10000*217.4*1000g
= 4g
3. Rate to be applied = 150 kg N ha-1
46 kg of N is contained in 100 kg of urea
150 kg of N will be contained in
150/46*100 kg
=326.1 kg
Amount per planting station 0.25*0.75/10000*326.1*1000g =6g
Copyright © 2022 FDOKUMEN