Nitrogen fertilisation of irrigated maize under Mediterranean conditions
9
Please cite this article in press as: Berenguer, P., et al., Nitrogen fertilisation of irrigated maize under Mediterranean conditions. Eur. J. Agron. (2008), doi:10.1016/j.eja.2008.09.005 ARTICLE IN PRESS G Model EURAGR-24826; No. of Pages 9 Europ. J. Agronomy xxx (2008) xxx–xxx Contents lists available at ScienceDirect European Journal of Agronomy journal homepage: www.elsevier.com/locate/eja Nitrogen fertilisation of irrigated maize under Mediterranean conditions P. Berenguer a,b,∗ , F. Santiveri a , J. Boixadera c , J. Lloveras a a Centre Universitat de Lleida (UdL)-IRTA, Av. Rovira Roure, 191, 25198 Lleida, Spain b Departament d’Enginyeria Agroalimentària i Biotecnologia, Escola Superior d’Agricultura de Barcelona, Universitat Politècnica de Catalunya, Campus del Baix Llobregat UPC, Av. del Canal Olímpic, 15, 08860 Castelldefels, Barcelona, Spain c Secció d’Avaluació de Recursos Agraris, Departament d’Agricultura, Alimentació i Acció Rural, Generalitat de Catalunya, Av. Rovira Roure, 191, 25198 Lleida, Spain article info Article history: Received 1 May 2008 Received in revised form 22 September 2008 Accepted 23 September 2008 Keywords: Irrigated maize Nitrogen fertilisation Maize yield response Soil nitrate content abstract Nitrogen fertilisation of maize (Zea mays L.) has become an important economic and environmental issue, especially in high-yielding irrigated Mediterranean areas. Producers have traditionally applied more N fertiliser than required and, as a result, some environmental problems have appeared in recent decades. A 4-year study (2002–2005) was conducted and six N rates (0, 100, 150, 200, 250 and 300 kg N ha −1 year −1 ) were compared. Before planting 50 kg N ha −1 were applied. The rest of the N was applied in two sid- edresses, the first at V3–V4 developing stage and the second at V5–V6. Yield, biomass, grain N uptake, plant N uptake and SPAD-units were greatly influenced by both N fertilisation rate and soil NO 3 − -N content before planting and fertilising [Nini (0–90 cm)]. At the beginning of the experiment, Nini was very high (290 kg NO 3 − -N ha −1 ) and there was therefore no yield response to N fertilisation in 2002. In 2003, 2004 and 2005, maximum grain yields were achieved with 96, 153 and 159 kg N ha −1 , respectively. Results showed that N fertilisation recommendations based only on plant N uptake were not correct and that Nini should always be taken into account. On the other hand, the minimum amount of N available for the crop [N applied with fertilisation plus Nini (0–90 cm)] necessary to achieve maximum grain yields was 258 kg N ha −1 . This value was similar to plant N uptake, suggesting that available N was able to predict N maize requirements and could be an interesting tool for improving maize N fertilisation. © 2008 Elsevier B.V. All rights reserved. 1. Introduction Maize (Zea mays L.) is one of the most important field crops in the irrigated areas of the Mediterranean part of the Ebro Val- ley (north-east Spain). In Spain, more than 99,000 ha of maize are produced under intensive irrigation (Ministerio de Agricultura Pesca y Alimentación, 2006). Average grain yields range from 11 to 15 Mg ha −1 , depending on the area and irrigation system, and plant N uptake is over 250–300 kg ha −1 (Berenguer et al., 2008). More- over, profitability is greatly influenced by N fertilisation, which is one of the main costs of production. Recent surveys in the Ebro Valley (Sisquella et al., 2004) showed that mineral N rates applied to maize are about 300–350 kg ha −1 . These amounts of N are only based on possible N uptake and do not consider the high pre-planting levels of soil mineral N that are common in the area (Ballesta and Lloveras, 1996; Villar-Mir et al., 2002; Abad et al., 2004; Vázquez et al., 2006). ∗ Corresponding author at: Centre Universitat de Lleida (UdL)-IRTA, Av. Rovira Roure, 191, 25198 Lleida, Spain. Tel.: +34 973 702 573; fax: +34 973 238 264. E-mail addresses: [email protected], [email protected] (P. Berenguer). High pre-planting soil N content is the result of excessive N application (from manure or mineral fertilisers) in previous crops, which tends to accumulate in the soil (Berenguer et al., 2008). More- over, the typical crop rotation in the area [alfalfa (Medicago sativa L.)–maize] and the high organic matter mineralisation also con- tribute to there being numerous fields with high pre-planting levels of N in the soil (Ballesta and Lloveras, 1996; Cela et al., 2007). As a result, ground waters in these areas are frequently pol- luted with nitrate (Ferrer et al., 1997), often with concentrations above 50 mg NO 3 − L −1 , the maximum concentration permitted by the European Union (1991). Consequently, as in many other regions of the EU, parts of the Ebro Valley have been declared nitrate vul- nerable (Diari Oficial de la Generalitat de Catalunya, 1998, 2004). It is known that over-fertilisation with N does not give any extra grain yield, but merely wastes fertiliser, reduces crop profitability and is a potential source of nitrate pollution (Broadbent and Carlton, 1978; Cox et al., 1993). Moreover, N deficiencies reduce maize growth and, consequently, biomass yield (Uhart and Andrade, 1995). For these reasons, more precise N fertiliser recommenda- tions are required and these should be specifically adapted to the area in question. A compromise between high grain yields and low nitrate pollution should be possible. Broadbent and Carlton (1978) suggested that optimum, or near optimum, production of maize 1161-0301/$ – see front matter © 2008 Elsevier B.V. All rights reserved. doi:10.1016/j.eja.2008.09.005
Transcript of Nitrogen fertilisation of irrigated maize under Mediterranean conditions

E
N
Pa
b
Cc
a
ARR2A
KINMS
1
ilaP1Noo
tTnc2
R
p
1d
ARTICLE IN PRESSG ModelURAGR-24826; No. of Pages 9
Europ. J. Agronomy xxx (2008) xxx–xxx
Contents lists available at ScienceDirect
European Journal of Agronomy
journa l homepage: www.e lsev ier .com/ locate /e ja
itrogen fertilisation of irrigated maize under Mediterranean conditions
. Berenguera,b,∗, F. Santiveri a, J. Boixaderac, J. Lloverasa
Centre Universitat de Lleida (UdL)-IRTA, Av. Rovira Roure, 191, 25198 Lleida, SpainDepartament d’Enginyeria Agroalimentària i Biotecnologia, Escola Superior d’Agricultura de Barcelona, Universitat Politècnica de Catalunya,ampus del Baix Llobregat UPC, Av. del Canal Olímpic, 15, 08860 Castelldefels, Barcelona, SpainSecció d’Avaluació de Recursos Agraris, Departament d’Agricultura, Alimentació i Acció Rural, Generalitat de Catalunya, Av. Rovira Roure, 191, 25198 Lleida, Spain
r t i c l e i n f o
rticle history:eceived 1 May 2008eceived in revised form2 September 2008ccepted 23 September 2008
eywords:rrigated maizeitrogen fertilisation
a b s t r a c t
Nitrogen fertilisation of maize (Zea mays L.) has become an important economic and environmental issue,especially in high-yielding irrigated Mediterranean areas. Producers have traditionally applied more Nfertiliser than required and, as a result, some environmental problems have appeared in recent decades. A4-year study (2002–2005) was conducted and six N rates (0, 100, 150, 200, 250 and 300 kg N ha−1 year−1)were compared. Before planting 50 kg N ha−1 were applied. The rest of the N was applied in two sid-edresses, the first at V3–V4 developing stage and the second at V5–V6. Yield, biomass, grain N uptake,plant N uptake and SPAD-units were greatly influenced by both N fertilisation rate and soil NO3
−-N contentbefore planting and fertilising [Nini (0–90 cm)]. At the beginning of the experiment, Nini was very high
− −1
aize yield responseoil nitrate content
(290 kg NO3 -N ha ) and there was therefore no yield response to N fertilisation in 2002. In 2003, 2004and 2005, maximum grain yields were achieved with 96, 153 and 159 kg N ha−1, respectively. Resultsshowed that N fertilisation recommendations based only on plant N uptake were not correct and thatNini should always be taken into account. On the other hand, the minimum amount of N available for thecrop [N applied with fertilisation plus Nini (0–90 cm)] necessary to achieve maximum grain yields was258 kg N ha−1. This value was similar to plant N uptake, suggesting that available N was able to predict N
ould
awoLto
laton
maize requirements and c
. Introduction
Maize (Zea mays L.) is one of the most important field cropsn the irrigated areas of the Mediterranean part of the Ebro Val-ey (north-east Spain). In Spain, more than 99,000 ha of maizere produced under intensive irrigation (Ministerio de Agriculturaesca y Alimentación, 2006). Average grain yields range from 11 to5 Mg ha−1, depending on the area and irrigation system, and plant
uptake is over 250–300 kg ha−1 (Berenguer et al., 2008). More-ver, profitability is greatly influenced by N fertilisation, which isne of the main costs of production.
Recent surveys in the Ebro Valley (Sisquella et al., 2004) showedhat mineral N rates applied to maize are about 300–350 kg ha−1.
Please cite this article in press as: Berenguer, P., et al., Nitrogen fertilisati(2008), doi:10.1016/j.eja.2008.09.005
hese amounts of N are only based on possible N uptake and doot consider the high pre-planting levels of soil mineral N that areommon in the area (Ballesta and Lloveras, 1996; Villar-Mir et al.,002; Abad et al., 2004; Vázquez et al., 2006).
∗ Corresponding author at: Centre Universitat de Lleida (UdL)-IRTA, Av. Roviraoure, 191, 25198 Lleida, Spain. Tel.: +34 973 702 573; fax: +34 973 238 264.
E-mail addresses: [email protected],[email protected] (P. Berenguer).
ga1g1tans
161-0301/$ – see front matter © 2008 Elsevier B.V. All rights reserved.oi:10.1016/j.eja.2008.09.005
be an interesting tool for improving maize N fertilisation.© 2008 Elsevier B.V. All rights reserved.
High pre-planting soil N content is the result of excessive Npplication (from manure or mineral fertilisers) in previous crops,hich tends to accumulate in the soil (Berenguer et al., 2008). More-
ver, the typical crop rotation in the area [alfalfa (Medicago sativa.)–maize] and the high organic matter mineralisation also con-ribute to there being numerous fields with high pre-planting levelsf N in the soil (Ballesta and Lloveras, 1996; Cela et al., 2007).
As a result, ground waters in these areas are frequently pol-uted with nitrate (Ferrer et al., 1997), often with concentrationsbove 50 mg NO3
− L−1, the maximum concentration permitted byhe European Union (1991). Consequently, as in many other regionsf the EU, parts of the Ebro Valley have been declared nitrate vul-erable (Diari Oficial de la Generalitat de Catalunya, 1998, 2004).
It is known that over-fertilisation with N does not give any extrarain yield, but merely wastes fertiliser, reduces crop profitabilitynd is a potential source of nitrate pollution (Broadbent and Carlton,978; Cox et al., 1993). Moreover, N deficiencies reduce maizerowth and, consequently, biomass yield (Uhart and Andrade,
on of irrigated maize under Mediterranean conditions. Eur. J. Agron.
995). For these reasons, more precise N fertiliser recommenda-ions are required and these should be specifically adapted to therea in question. A compromise between high grain yields and lowitrate pollution should be possible. Broadbent and Carlton (1978)uggested that optimum, or near optimum, production of maize

IN PRESSG ModelE
2 J. Agronomy xxx (2008) xxx–xxx
ic
trtmr(io
se1DoacPcaaa
boyrU((dIsr
Ms(ow
2
S2sthdIct
NpsacpafiN
Table 1Main soil properties at the beginning of the experiment (2002).
Horizon
Ap Bw Bk
Depth (cm) 0–23 23–69 69–117Sand (g kg−1) 390 380 450Silt (g kg−1) 400 420 380Clay (g kg−1) 210 200 170pH 8.3 8.3 8.3ECe (dS m−1) 0.20 0.34 0.59C.E.C. (meq. 100 g−1) 24 – –Organic matter (g kg−1) 22 14 6BAPK
tiliser was applied in the second sidedress. Ammonium nitrate wasapplied using a small drop-type hand-driven fertiliser spreader.Phosphorus and K fertilisation was applied before planting, at ratesof 150 kg P2O5 ha−1 and 250 kg K2O ha−1.
ARTICLEURAGR-24826; No. of Pages 9
P. Berenguer et al. / Europ.
s compatible with minimum pollution hazard if N fertilisation isarefully and accurately applied.
Yield response to N rates depends largely on the environmen-al conditions encountered (Schröder et al., 2000) and N fertiliserequirements must be considered for specific production situa-ions (Bundy and Malone, 1988; Schröder et al., 2000). Moreover,
any N rates need to be tested in order to accurately predict yieldesponse to increasing N rates and to adjust yield response modelsCerrato and Blackmer, 1990). These authors suggested that exper-ments involving too few N treatments could suggest a false levelf confidence (high r2) when fitting yield response models.
Many studies about the effects of N on maize yield and residualoil N have been carried out in different countries and for differ-nt growing conditions (Onken et al., 1985; Bundy and Malone,988; Cerrato and Blackmer, 1990; Dickson et al., 1993; Nagy, 1996;eumier et al., 2002; Halvorson et al., 2005, 2006). However, mostf the literature is from the USA; there have been very few reportsbout the yield response of N fertilisation in high-yielding maizeropping systems in Mediterranean areas (Villar-Mir et al., 2002; Diaolo and Rinaldi, 2008). Villar-Mir et al. (2002) monitored severalommercial maize fields for yield, N uptake and soil NO3
−-N over2-year period using N rates that ranged from 250 to 340 kg ha−1
nd Di Paolo and Rinaldi (2008) also studied three N rates (0, 150nd 300 kg N ha−1) over a 2-year period.
Several methodologies based on soil or plant indicators haveeen developed (Schröder et al., 2000) to predict the yield responsef maize to N fertilisation, but few have been tested under high-ielding irrigated conditions in Mediterranean areas with highesidual N soil contents (Villar et al., 2000; Ferrer et al., 2003).nder similar conditions to ours, Halvorson et al. (2005) [Colorado
USA) high-yielding irrigated maize] found that plant-available Npre-planting soil mineral content plus fertiliser N) was a good pre-ictor of yield response. However, Blackmer (1989), working in
owa (USA), affirmed that under their conditions, pre-planting Noil tests did not show good correlations with maize yield and theyecommended testing soil N at pre-sidedress.
We conducted a 4-year N fertilisation study under irrigatedediterranean conditions with the following objectives: (i) to
tudy maize yield, biomass and N uptake response to N fertilisation;ii) to study the evolution of soil NO3
−-N; (iii) to test a methodol-gy for predicting maize yield response based on soil N availabilityhich could be used under our conditions.
. Materials and methods
Field trials were conducted at the Gimenells research station (NEpain; 41◦65′N, 0◦39′E) over four consecutive years: from 2002 to005. The soil is well drained, with no salinity problems, and is clas-ified as Petrocalcic Calcixerept (Soil Survey Staff, 1998). The waterable is about 135 cm below the surface, but there is a petrocalcicorizon at a depth of 80–100 cm, which prevents root penetration toeeper layers. The main soil characteristics are presented in Table 1.
rrigation was required to obtain appropriate grain yields, since pre-ipitation was low (192 mm) during the maize growing period andemperatures were high (mean temperature 19.1 ◦C) (Fig. 1).
Six N rates, 0, 100, 150, 200, 250 and 300 kg N ha−1 (N0, N100,150, N200, N250 and N300) were applied each year to the samelots. N was applied as ammonium nitrate (33% N). The plots mea-ured 15 m × 11 m (with 15–16 rows per plot) and were arrangedccording to a randomised complete block design with four repli-
Please cite this article in press as: Berenguer, P., et al., Nitrogen fertilisati(2008), doi:10.1016/j.eja.2008.09.005
ations. Before planting, 50 kg N ha−1 were applied to all fertilisedlots. A nitrogen sidedress was applied twice: at the V3–V4 andt V5–V6 developing stages (Ritchie and Hanway, 1982). In therst sidedress, N100 and N150 received 50 kg N ha−1 and N200,250 and N300 each received 100 kg N ha−1. The rest of the N fer-
F(
ulk density (g cm−3) 1.40 1.56 1.63vailable water holding capacity (mm) 29 67 54(Olsen) (mg kg−1) 31(NH4Ac) (mg kg−1) 217
on of irrigated maize under Mediterranean conditions. Eur. J. Agron.
ig. 1. Monthly precipitation and mean temperature for the historic period1989–2006) and for the experimental period (2002–2005).

ING ModelE
J. Agro
8w(MwtditotA
1(aItas(labadwwSs
(0pntdcStodua
2i(NNg2t
t
N
tcNAs
a
(
(
de1eNnwt
rtail
3
3
am2r
tpgo0tat(
3
Tda1au1
3
Na
ARTICLEURAGR-24826; No. of Pages 9
P. Berenguer et al. / Europ.
Maize was planted during the first week of April at a rate of0,000 seeds ha−1. In 2002 and 2003, the hybrid used was ‘Dracma’,hereas in 2004 and 2005 it was ‘Sele’. Preceding crops were vetch
Vicia sativa L.) in 2000 and wheat (Triticum aestivum L.) in 2001.aize was sprinkler-irrigated with 549, 568, 556 and 568 mm ofater from 2002 to 2005, respectively. Between rain and irrigation,
he maize received a total of approximately 650–700 mm of wateruring the growing period. The irrigation water was analysed while
rrigating and no appreciable nitrate content was observed (lesshan 5 mg NO3
− kg−1 of water). Pre-emergence herbicide (1 L ha−1
f Metolachlor 96% + 3 L ha−1 of Atrazine 47.5%) was applied to con-rol weeds. Fluoxypyear 20% (1 L ha−1) was also applied to controlbutilon theophrasti M.
Maize was harvested on 10/15/02, 09/25/03, 10/05/04 and0/10/05. Grain yield was measured by harvesting two central rows1.4 m × 15 m). Grain moisture was determined for each plot from300 g sample and grain yield was adjusted to 14% moisture (GAC
I, Dickey-John, Auburn, IL, USA). Maize straw was removed fromhe field after harvest. A grain sample was taken from each plotnd grain N concentration was measured by near infrared (NIR)pectroscopy, using a previously calibrated 500 Infrared AnalyserBran+Luebbe, Norderstedt, Germany). Grain N uptake was calcu-ated by multiplying grain yield by N concentration. Plants from
central row (4 m) were harvested and weighed to determineiomass at physiological maturity (10/05/02, 09/16/03, 09/21/04nd 09/12/05). A two-plant sample from each plot was chopped andried to determine moisture content. Total plant N concentrationas also determined by NIR spectroscopy, and total plant N uptakeas calculated by multiplying plant N concentration by biomass.
PAD-units for 10 plants per plot were measured on the leaf ear atilking using a Minolta SPAD-502 manual leaf chlorophyll meter.
Soil NO3−-N was determined before planting and fertilising
Nini) and after harvest (Nresi). Samples were taken at a depth of–90 cm from three consecutive layers (30 cm per layer). Soil sam-les from each plot contained a mixture of three cores per plot. Soilitrates were extracted with deionised water and measured usingest strips with a Nitrachek® device calibrated according to the stan-ard procedure (Bischoff et al., 1996). Plant-available N (Nav) wasonsidered as the sum of Nini (0–90 cm) and the applied N fertiliser.oil NH4
+N was only measured for the maximum and minimumreatments (0 and 300 kg N ha−1) as it was considered negligible inur area (Villar-Mir et al., 2002). Soil NH4
+-N did not statisticallyiffer between treatments for a given year. Initial soil NH4
+-N val-es were 24, 87, 41 and 16 kg N ha−1 for 2002–2005, respectively,nd the residual values were 6, 28, 9 and 11 kg N ha−1.
The N budget was calculated for each plot from 2003 to005. Soil NH4
+-N was not considered due to its relative stabil-ty throughout the crop rotation (Liu et al., 2003). MineralisationNmin) was estimated for the N0 treatment, applying the equationmin = Nresi + Nplant − Nini (Sexton et al., 1996) and assuming thatlosses from unfertilised plots were zero. Nplant was the above-
round plant N uptake at maturity. N budget was not considered in002 due to the high initial soil NO3
−-N content, while N losses inhe N0 treatments were probably not equal to zero.
N losses (Nlost) were estimated from the N budget for the fer-ilised plots (Angás et al., 2006), using the following expression:
lost = Nfinal + Nplant − Ninic − Nmin − Nfert
Nfert was N applied by fertilisation. Nlost was considered to be
Please cite this article in press as: Berenguer, P., et al., Nitrogen fertilisati(2008), doi:10.1016/j.eja.2008.09.005
he sum of leached NO3−-N, N lost by volatilisation and denitrifi-
ation and N that remained unaccounted for. A negative value oflost could be interpreted as a N loss from the soil–plant system.positive value of Nlost could be interpreted as N inputs to the
ystem that were not considered.
BysNt
PRESSnomy xxx (2008) xxx–xxx 3
From each treatment N-efficiency parameters were calculateds follows (López-Bellido and López-Bellido, 2001):
1) Apparent nitrogen recovery (ANR; kg kg−1) as the ratio of (Nuptake at Nx − N uptake at N0) to N applied at Nx.
2) Agronomic nitrogen efficiency (ANE; kg kg−1) as the ratio of(biomass at Nx − biomass at N0) to N applied at Nx.
The results obtained were subjected to analysis of variance toetermine the treatment effects; we did this by applying the Gen-ral Linear Model procedure of the Statistical Analysis System (SAS,991). Means were compared by Fisher’s least significant differ-nce (LSD0.05). In the cases of grain yield, biomass, plant and grainuptake and SPAD-units, if the analysis of variance indicated a sig-
ificant F value for N rate, a bilinear model (linear-plus-plateau)as fitted to the N response data using the iterative optimization
echnique of TBL Curve (Jandel Scientific, 1992).The linear-plus-plateau model was also fitted to describe the
elationship between Nav and grain yield for all years and alsohe relationship between SPAD-units and relative grain yield forll years. The term relative yield (expressed as a percentage) usedn this paper was the ratio between the plateau yield from theinear-plus-plateau model and the yield for each N rate and year.
. Results
.1. Yield and biomass
Based on plateau yield (Fig. 2), we could consider the years 2002nd 2004 as being highly productive, while 2003 and 2005 wereoderate in production. Average grain yields in 2003 were aboutMg ha−1 lower than in either 2002 or 2004, while in 2005, the
eduction in yield with respect to 2002 was about 1.2 Mg ha−1.Yield and biomass responses to N fertilisation varied according
o year (Figs. 2 and 3, Table 2). After 4 years of continuous maizeroduction, the minimum N rate required to achieve maximumrain yields (optimal N rate) never exceeded 159 kg N ha−1. Basedn the lineal-plus-plateau model, optimal N application rates were:, 96, 153 and 159 kg N ha−1 for 2002, 2003, 2004 and 2005, respec-ively. Biomass followed a similar trend to grain yield in 2002, 2003nd 2004 with optimal N rates of 0, 92 and 150 kg N ha−1, respec-ively. However, in 2005, the optimal N application rate for biomass209 kg N ha−1) was higher than that for yield (159 kg N ha−1).
.2. Plant and grain N uptake
Plant and grain N uptakes varied from year to year (Fig. 4,able 2). In the first 2 years of the experiment, N fertilisationid not significantly increase plant N uptake. However, in 2004nd 2005, the highest plant N uptake was achieved with rates of69 and 254 kg N ha−1, respectively. Nitrogen fertilisation did notffect N grain uptake in 2002. Nevertheless, the highest grain Nptakes were recorded with N rates above 151 kg N ha−1 in 2003,64 kg N ha−1 in 2004 and 184 kg N ha−1 in 2005.
.3. Soil N content
Soil N content at the beginning of the trial was very high (290 kgO3
−-N ha−1) but such N soil values are very common in the testrea (Villar-Mir et al., 2002; Abad et al., 2004; Vázquez et al., 2006).
on of irrigated maize under Mediterranean conditions. Eur. J. Agron.
efore planting and fertilising, soil N content and Nresi varied fromear to year and were influenced by N rates applied in previouseasons (Tables 2 and 3). The Nini was usually quite similar to theresi of the preceding year, suggesting only small N losses during
he winter period (Table 3). In 2002, there was an accumulation of

ARTICLE IN PRESSG ModelEURAGR-24826; No. of Pages 9
4 P. Berenguer et al. / Europ. J. Agronomy xxx (2008) xxx–xxx
F ction
swtdp
F
ig. 2. Effects of N fertilisation on grain yield. Four years of continuous maize produ
Please cite this article in press as: Berenguer, P., et al., Nitrogen fertilisati(2008), doi:10.1016/j.eja.2008.09.005
oil N during the growing season on fertilised plots because Nresias greater than Nini. In the other years, Nresi was quite similar
o, or lower than, Nini, suggesting little or no soil N enrichmenturing the growing season. Application rates of over 150 kg N ha−1
resented the highest Nini and Nresi.
3
m6
ig. 3. Effects of N fertilisation on biomass at maturity. Four years of continuous maize prod
(2002–2005). (*) and (**): Significant at the 0.05 and 0.01 levels, respectively.
on of irrigated maize under Mediterranean conditions. Eur. J. Agron.
.4. Yield and available N
Grain yield was correlated with Nav (Fig. 5). The r2 for the seg-ented model was highly significant (P < 0.001), indicating that
5% of the variability in grain yield could be accounted for by Nav.
uction (2002–2005). (*) and (**): Significant at the 0.05 and 0.01 levels, respectively.
ARTICLE IN PRESSG ModelEURAGR-24826; No. of Pages 9
P. Berenguer et al. / Europ. J. Agronomy xxx (2008) xxx–xxx 5
f conti
Tvg
3
Ty(
3
3
Fp
ii
3
rto
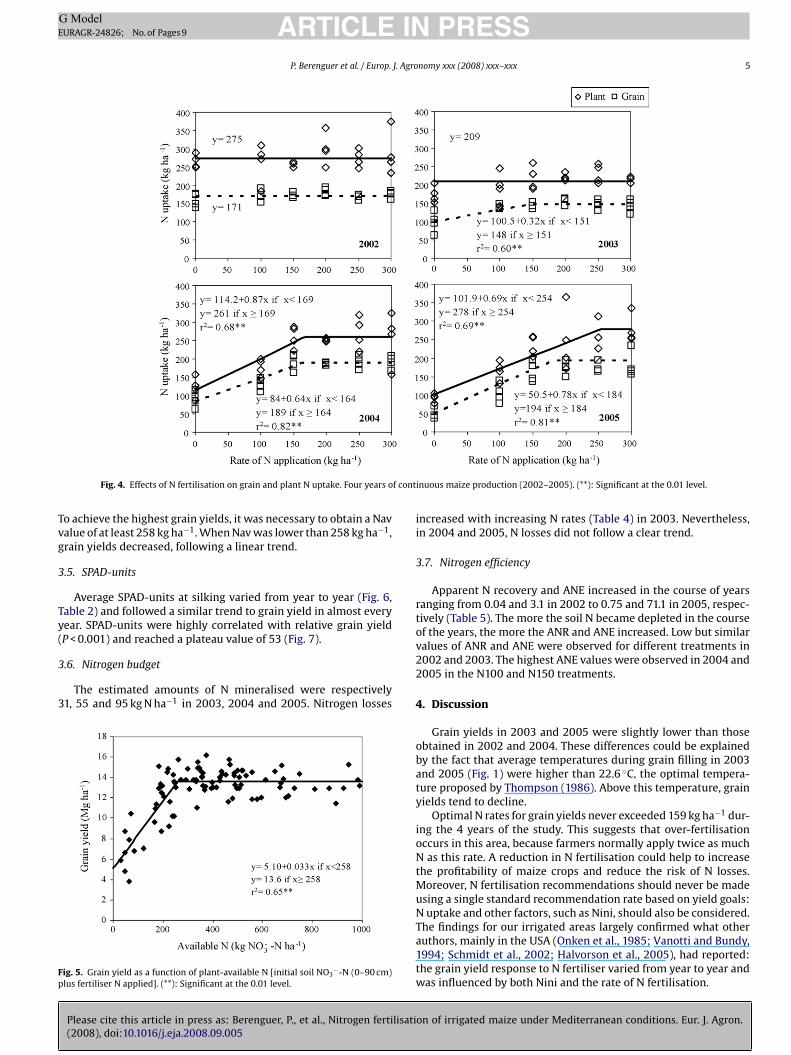
Fig. 4. Effects of N fertilisation on grain and plant N uptake. Four years o
o achieve the highest grain yields, it was necessary to obtain a Navalue of at least 258 kg ha−1. When Nav was lower than 258 kg ha−1,rain yields decreased, following a linear trend.
.5. SPAD-units
Average SPAD-units at silking varied from year to year (Fig. 6,able 2) and followed a similar trend to grain yield in almost everyear. SPAD-units were highly correlated with relative grain yieldP < 0.001) and reached a plateau value of 53 (Fig. 7).
Please cite this article in press as: Berenguer, P., et al., Nitrogen fertilisati(2008), doi:10.1016/j.eja.2008.09.005
.6. Nitrogen budget
The estimated amounts of N mineralised were respectively1, 55 and 95 kg N ha−1 in 2003, 2004 and 2005. Nitrogen losses
ig. 5. Grain yield as a function of plant-available N [initial soil NO3−-N (0–90 cm)
lus fertiliser N applied]. (**): Significant at the 0.01 level.
v22
4
obaty
ioNtMuNTa1tw
nuous maize production (2002–2005). (**): Significant at the 0.01 level.
ncreased with increasing N rates (Table 4) in 2003. Nevertheless,n 2004 and 2005, N losses did not follow a clear trend.
.7. Nitrogen efficiency
Apparent N recovery and ANE increased in the course of yearsanging from 0.04 and 3.1 in 2002 to 0.75 and 71.1 in 2005, respec-ively (Table 5). The more the soil N became depleted in the coursef the years, the more the ANR and ANE increased. Low but similaralues of ANR and ANE were observed for different treatments in002 and 2003. The highest ANE values were observed in 2004 and005 in the N100 and N150 treatments.
. Discussion
Grain yields in 2003 and 2005 were slightly lower than thosebtained in 2002 and 2004. These differences could be explainedy the fact that average temperatures during grain filling in 2003nd 2005 (Fig. 1) were higher than 22.6 ◦C, the optimal tempera-ure proposed by Thompson (1986). Above this temperature, grainields tend to decline.
Optimal N rates for grain yields never exceeded 159 kg ha−1 dur-ng the 4 years of the study. This suggests that over-fertilisationccurs in this area, because farmers normally apply twice as muchas this rate. A reduction in N fertilisation could help to increase
he profitability of maize crops and reduce the risk of N losses.oreover, N fertilisation recommendations should never be made
sing a single standard recommendation rate based on yield goals:uptake and other factors, such as Nini, should also be considered.
on of irrigated maize under Mediterranean conditions. Eur. J. Agron.
he findings for our irrigated areas largely confirmed what otheruthors, mainly in the USA (Onken et al., 1985; Vanotti and Bundy,994; Schmidt et al., 2002; Halvorson et al., 2005), had reported:he grain yield response to N fertiliser varied from year to year andas influenced by both Nini and the rate of N fertilisation.

ARTICLE IN PRESSG ModelEURAGR-24826; No. of Pages 9
6 P. Berenguer et al. / Europ. J. Agronomy xxx (2008) xxx–xxx
ontin
rrdttrN(omy
wwmo
Fa
iawre2aNrlr
Fig. 6. Effects of N fertilisation on SPAD-units at silking. Four years of c
In the first year of the experiment, grain yield, biomass and theest of the plant variables showed no response to N fertilisationates, probably because of the high Nini. As soil NO3
−-N becameepleted with time, particularly on the least fertilised and/or unfer-ilised plots, grain yield, biomass and all the other parameters moni-ored in this study became more responsive to increasing N fertiliserates. In a study conducted in Colorado (USA) with a high level ofini (136 kg NO3
−-N ha−1), but one that was still lower than ours290 kg NO3
−-N ha−1), Halvorson et al. (2005) also reported a lackf yield response to N fertilisation in the first year of their experi-ent. As in our case, they also observed a maize response to N in the
ears during which the soil NO3−-N content was gradually reduced.
Please cite this article in press as: Berenguer, P., et al., Nitrogen fertilisati(2008), doi:10.1016/j.eja.2008.09.005
On unfertilised plots and those receiving little fertilisation, thereas evident soil Nini and Nresi depletion over time. This reductionas less noticeable with medium and highly N fertilised treat-ents, which still presented high NO3
−-N soil contents at the endf the study.
ig. 7. Relationship of relative grain yield and SPAD-units at silking. (**): Significantt the 0.01 level.
r
woeytr2bCwcpaTrN
bCHa
uous maize production (2002–2005). (**): Significant at the 0.01 level.
In 2003, the high level of soil NO3−-N depletion during the grow-
ng season (with considerable differences between Nini and Nresi)nd the small differences in plant N uptake suggest high N losses,hich increased with increasing N rates: such losses have also been
eported by other authors (Liu et al., 2003; Brye et al., 2003). How-ver, N losses could be considered lower in 2004 and 2005 than in002 or 2003 because there were small differences between Ninind Nresi in the former years. In general, the minimum estimated
losses and highest N efficiencies coincided with the optimal Nates, as suggested by Broadbent and Carlton (1978). This under-ines the importance of finding the most appropriate N fertilisationate to provide the maximum grain yields with the minimum envi-onmental impact.
As reported in other studies, grain yield was highly correlatedith Nav (Halvorson et al., 2005; Dara et al., 1992). However, previ-
us studies conducted under similar conditions to ours (Villar-Mirt al., 2002) did not find any relationship between Nav and grainield. This was probably due to the narrow range of N fertilisa-ion rates that they used (250–340 kg N ha−1). The minimum Navequired to achieve maximum grain yields in our experiment was58 kg ha−1. Similar values (258–265 kg Nav ha−1) were obtainedy Halvorson et al. (2005) for irrigated high-production maize inolorado (USA). Dara et al. (1992) reported that 247 kg ha−1 of Navas required for a grain yield of 11.86 Mg ha−1 [under irrigated
onditions in North Dakota (USA)]. Maximum yielding treatmentsresented very similar plant N uptake values (256 kg N ha−1of aver-ge) to minimum Nav values required to achieve maximum yields.his suggests that Nav was able to accurately predict maize Nequirements and could be considered a good tool for improving
fertilisation recommendations.
on of irrigated maize under Mediterranean conditions. Eur. J. Agron.
Plant and grain N uptake were both significantly influencedy N fertiliser rates, as reported by other researchers (Cox andherney, 2001; Derby et al., 2005; Shapiro and Wortmann, 2006;alvorson et al., 2006). Moreover, Cox and Cherney (2001), Shapirond Wortmann (2006) and Halvorson et al. (2006) all reported

Please cite this article in press as: Berenguer, P., et al., Nitrogen fertilisati(2008), doi:10.1016/j.eja.2008.09.005
ARTICLE IN PRESSG ModelEURAGR-24826; No. of Pages 9
P. Berenguer et al. / Europ. J. Agronomy xxx (2008) xxx–xxx 7
Tab
le2
Effe
ctof
Nfe
rtil
isat
ion
rate
son
grai
nyi
eld
,bio
mas
sat
mat
uri
ty,g
rain
Nu
ptak
e,p
lan
tN
upt
ake,
chlo
rop
hyll
met
erva
lues
and
soil
NO
3−
-Nco
nte
nt
befo
rep
lan
tin
gan
dfe
rtil
isin
g(i
nit
ial)
and
afte
rh
arve
st(r
esid
ual
).
Nra
te(k
gh
a−1)
Gra
inyi
eld
(Mg
ha−1
)B
iom
ass
mat
uri
ty(M
gh
a−1)
Gra
inN
upt
ake
(kg
ha−1
)Pl
ant
Nu
ptak
e(k
gh
a−1)
Ch
loro
phy
llSP
AD
-un
its
Soil
init
ialN
O3
−-N
(kg
ha−1
)So
ilre
sid
ual
NO
3−
-N(k
gh
a−1)
09.
3119
.59
101
155
4513
875
100
12.4
023
.69
138
181
5319
217
415
013
.58
26.7
516
722
557
209
194
200
13.8
727
.26
174
253
5627
524
025
013
.61
27.6
017
125
856
299
274
300
13.7
028
.33
175
263
5732
631
3
Nit
roge
n(N
)**
****
****
****
Blo
ckN
SN
SN
SN
SN
S**
**
Erro
ra
––
––
––
–Ye
ar(Y
)**
****
****
****
N×
Y**
****
****
*N
SEr
ror
b–
––
––
––
LSD
0.05
(N)
0.97
2.33
1327
279
105
NS:
not
sign
ifica
nt.
*Si
gnifi
can
tat
the
0.05
leve
l.**
Sign
ifica
nt
atth
e0.
01le
vel.
Table 3Soil NO3
−-N content (kg ha−1) before planting and fertilising (Ini) and after harvest(Resi) (depth 0–90 cm).
N rate (kg ha−1) 2002 2003 2004 2005
Ini Resi Ini Resi Ini Resi Ini Resi
0 262 185 175 32 58 24 57 59100 218 477 352 109 86 39 113 72150 263 441 343 137 112 110 119 86200 319 427 455 212 100 143 225 178250 281 533 512 213 140 174 265 177300 395 585 521 198 136 173 253 295
Means 290 441 393 150 105 111 172 144Signification NS * ** * * * ** **
LSD0.05 – 245 129 134 52 116 103 246
NS: not significant.* Significant at the 0.05 level.
** Significant at the 0.01 level.
Table 4Effect of N fertilisation rates on estimated N losses.
N rate (kg ha−1) N losses (kg ha−1)
2003 2004 2005
0 0 0 0100 −180 −99 −71150 −169 −50 −44200 −252 −37 −95250 −349 −35 −177300 −438 −59 −75
Means −231 −47 −77Signification ** NS *
LSD0.05 −168 – 105
N
sa2eopdyt1ata
TA
N
011223
MSL
N
S: not significant.* Significant at the 0.05 level.
** Significant at the 0.01 level.
imilar plant and grain N uptake responses to N fertilisation. Theverage plant N uptake of the maximum yielding treatment was56 kg N ha−1 and the optimal N rate during this 4-year study neverxceeded 159 kg N ha−1. The difference between the N uptake andptimal N fertilisation rate should be covered by the soil N sup-ly. In a maize monoculture, the soil N content would be graduallyepleted and optimal N fertilisation rates could increase in futureears. In any case, high initial soil N levels are very frequent inhe area where we carried out our study (Ballesta and Lloveras,
on of irrigated maize under Mediterranean conditions. Eur. J. Agron.
996; Villar-Mir et al., 2002; Abad et al., 2004; Vázquez et al., 2006)nd, furthermore, producers do not usually grow maize for morehan 4–6 consecutive years, because they follow the traditionallfalfa–maize rotation.
able 5pparent N recovery (ANR) and agronomic N efficiency (ANE).
rate (kg ha−1) ANR (kg kg−1) ANE (kg kg−1)
2002 2003 2004 2005 2002 2003 2004 2005
– – – – – – – –00 −0.03 0.19 0.14 0.74 −1.8 22.9 59.5 83.250 −0.05 0.29 0.67 0.94 −3.9 22.4 88.5 84.000 0.17 0.24 0.76 0.78 12.8 19.2 51.1 70.350 0.03 0.22 0.73 0.65 2.8 16.3 49.7 59.500 0.07 0.14 0.57 0.66 5.6 11.2 41.0 58.7
eans 0.04 0.22 0.58 0.75 3.1 18.4 57.9 71.1ignification NS NS ** * NS NS * *
SD0.05 – – 0.29 0.28 – – 32.0 25.9
S: not significant.* Significant at the 0.05 level.
** Significant at the 0.01 level.

ING ModelE
8 J. Agro
Srwam
5
myls
sattpy1O
wadcs
wiefmoc
A
tcCpUPwm
R
A
A
B
B
B
B
B
B
B
C
C
C
C
D
D
D
D
D
D
D
E
F
F
H
H
J
L
L
M
N
O
P
ARTICLEURAGR-24826; No. of Pages 9
P. Berenguer et al. / Europ.
In line with Piekielek et al. (1995) and Schröder et al. (2000), thePAD meter immediately detected N-deficiencies, but SPAD metereadings were poor predictors of N-excess. The critical level beyondhich maize could be considered non-responsive to N application
ccording to our study, 53 SPAD-units, was similar to that recom-ended by Piekielek et al. (1995) (52–56 SPAD-units).
. Conclusions
During the 4 years of continuous maize cultivation, the mini-um N rate required to obtain maximum grain yields varied from
ear to year, but never exceeded 159 kg N ha−1. This rate was muchower than the 250–300 kg N ha−1 usually applied by farmers in thetudy area.
Grain yield, biomass, plant and grain N uptake and SPAD-units allhowed a similar response pattern to N fertilisation rates and werell highly influenced by Nini. As Nini gradually became depleted inhe course of the growing season, in unfertilised and less N fertilisedreatments, yield and all the other parameters studied respondedositively to increasing rates of N fertilisation. In the case of grainield, maximum yield values were achieved with rates of 0, 96,53 and 159 kg N ha−1, in 2002, 2003, 2004 and 2005, respectively.ptimal N rates seemed to coincide with the highest N efficiencies.
The evolution of soil NO3−-N over the course of the experiment
as influenced by rates of N fertiliser application. On unfertilisednd less fertilised plots, a soil Nini and Nresi depletion was pro-uced through the years. This reduction was less noticeable in thease of medium and highly fertilised treatments, which still pre-ented high NO3
−-N soil contents at the end of the study.The minimum Nav required to obtain maximum grain yields
as 258 kg N ha−1: a value very close to that of maize N uptake. Ast seems able to predict maize N requirements, Nav could be consid-red a good tool on which to base N fertilisation recommendationsor Mediterranean conditions. However, in order to achieve even
ore accurate predictions of maize N availability, other method-logies based on soil N mineralisation should also be tested for ouronditions.
cknowledgements
We would like to thank the staff of the field crops laboratory ofhe Universitat de Lleida (UdL) and the laboratory of the UDL–IRTAentre for their helpful assistance. This work was funded by theomisión Interministerial de Ciencia y Tecnología (CICYT) throughroject AGL2001-2214-C06-05. We would also like to thank theniversitat de Lleida (UdL) for funding the doctorate studies ofilar Berenguer and the Universitat Politècnica de Catalunya (UPC),here the final analysis of the results and the writing of the presentanuscript was carried out.
eferences
bad, A., Lloveras, J., Michelena, A., 2004. Nitrogen fertilization and foliar ureaeffects on durum wheat yield and quality and on residual soil nitrate in irrigatedMediterranean conditions. Field Crops Res. 87, 257–269.
ngás, P., Lampurlanés, J., Cantero-Martínez, C., 2006. Tillage and N fertilizationeffects on N dynamics and Barley yield under semiarid Mediterranean condi-tions. Soil Till. Res. 87, 59–71.
allesta, A., Lloveras, J., 1996. Effects of nitrogen fertilization on corn production andon soil nitrate accumulation in the irrigated areas of the Ebro valley (Spain). In:Book of Abstracts: IV Congress of the European Society for Agronomy, Veldoven,the Netherlands, pp. 328–329.
Please cite this article in press as: Berenguer, P., et al., Nitrogen fertilisati(2008), doi:10.1016/j.eja.2008.09.005
erenguer, P., Santiveri, P., Boixadera, J., Lloveras, J., 2008. Fertilisation of irri-gated maize with pig slurry combined with mineral nitrogen. Eur. J. Agron. 28,635–645.
ischoff, M., Hiar, A.M., Turco, R.F., 1996. Evaluation of nitrate analysis using teststrips. Comparison with two analytical laboratory methods. Commun. Soil Sci.Plant Anal. 27, 2765–2774.
R
SS
PRESSnomy xxx (2008) xxx–xxx
lackmer, A.M., 1989. Nitrogen needs for corn in a sustainable agriculture. In: 44thAnnual Corn & Sorghum Research Conference. American Seed Trade Association.Washington, D.C., USA, pp. 1–14.
roadbent, F.E., Carlton, A.B., 1978. Field trials with isotopically labeled nitrogen.In: Nielsen, D.R., MacDonald, J.G. (Eds.), Nitrogen in the Environment. AcademicPress, New York, USA, pp. 1–41.
rye, K.R., Norman, J.M., Gower, S.T., Bundy, L.G., 2003. Methodological limitationsand N-budget differences among a restored tallgrass prairie and maize agroe-cosystems. Agric. Ecosyst. Environ. 97, 181–198.
undy, L.G., Malone, E.S., 1988. Effect of residual profile nitrate on corn response toapplied nitrogen. Soil Sci. Soc. Am. J. 52, 1377–1383.
ela, S., Ballesta, A., Santiveri, F., Lloveras, J., 2007. N fertilisation of maize in analfalfa–maize rotation. In: Book of Abstracts: 15th N Workshop, Lleida, Spain, p.25.
errato, M.E., Blackmer, A.M., 1990. Comparison of models for describing corn yieldresponse to nitrogen fertilizer. Agron. J. 82, 138–143.
ox, W.J., Kalonge, S., Cherney, D.J.R., Reid, W.S., 1993. Growth, yield, and qualityof forage corn under different nitrogen management practices. Agron. J. 85,341–347.
ox, W.J., Cherney, D.J.R., 2001. Row spacing, plant density and nitrogen effects oncorn silage. Agron. J. 93, 597–602.
ara, S.T., Fixen, P.E., Gelderman, R.H., 1992. Sufficiency level and diagnosis and rec-ommendation integrated system approaches for evaluating the nitrogen statusof corn. Agron. J. 84, 1006–1010.
erby, N.E., Steele, D.D., Terpstra, J., Knighton, R.E., Casey, F.X.M., 2005. Interac-tions of nitrogen, weather, soil, and irrigation on corn yield. Agron. J. 97, 1342–1351.
iari Oficial de la Generalitat de Catalunya, 1998. Decret 283/1998 de 21 d’Octubrede designació de les zones vulnerables en relació amb la contaminació de nitratsprocedents de fonts agràries. D.O.G.C. 2760-6.11.1998 (Directive 283/1998 ofOctober 21 concerning the designation of nitrate vulnerable areas coming fromagricultural activities. D.O.G.C. 2760-6.11.1998). Barcelona, Spain (in Catalan).
iari Oficial de la Generalitat de Catalunya, 2004. Decret 476/2004 de 28 de Desem-bre pel qual es designen noves zones vulnerables en relació amb la contaminacióde nitrats procedents de fonts agràries. D.O.G.C. 4292-31.12.2004 (Directive476/2004 of December 28 concerning the designation of the new nitrate vul-nerable areas coming from agricultural activities. D.O.G.C. 4292-31.12.2004).Barcelona, Spain (in Catalan).
i Paolo, E., Rinaldi, M., 2008. Yield response of corn to irrigation and nitrogenfertilization in a Mediterranean environment. Field Crops Res. 105, 202–210.
eumier, J.M., Lacroix, B., Balas, B., 2002. Irrigation du maïs et azote. Limiter les fuitesde nitrate (Maize irrigation and nitrogen fertilisation. Reducing nitrate losses).Perspectives Agricoles 283, 18–24 (in French).
ickson, T., Aitken, R.L., Dwyer, J.C., 1993. Prediction of nitrogen fertilizer require-ments of corn in subtropical Queensland. Aust. J. Exp. Agric. 33, 53–58.
uropean Union, 1991. Council directive 91/676/EEC of 12 December concerningthe Protection of Waters against Pollution caused by Nitrates from AgriculturalSources. Off. J. Eur. Commun.: L375. Brussels, Belgium.
errer, F., Villar, J.M., Stockle, C.O., Villar, P., Aran, M., 1997. Impacto del nitrógeno pre-sente en el agua de riego en la zona regable del Canal d’Urgell (Nitrogen impactin irrigation water in the irrigated area of the Urgell’s Channel). XV Congreso deRiegos y Drenajes, Lleida. pp. 241–248 (in Spanish).
errer, F., Villar, J.M., Villar, P., Aran, M., Stockle, C.O., 2003. Use of a pre-sidedresssoil nitrate test (PSNT) to determine nitrogen fertilizer requirements for irrigatedcorn. Agronomie 23, 561–570.
alvorson, A.D., Schweissing, F.C., Bartolo, M.E., Reule, C.A., 2005. Corn responseto nitrogen fertilization in a soil with high residual nitrogen. Agron. J. 97,1222–1229.
alvorson, A.D., Mosier, A.R., Reule, C.A., Bausch, W.C., 2006. Nitrogen and tillageeffects on irrigated continuous corn yields. Agron. J. 98, 63–71.
andel Scientific, 1992. TBL Curve Fitting Software. Version 3 0. Jandel Scientific,Corte Madera, USA.
iu, X., Ju, X., Zhang, F., Pan, J., Christie, P., 2003. Nitrogen dynamics and budgets in awinter wheat–maize cropping system in the North China Plain. Field Crops Res.83, 111–124.
ópez-Bellido, R.J., López-Bellido, L., 2001. Efficiency of nitrogen in wheat underMediterranean conditions: effect of tillage, crop rotation and N fertilization. FieldCrops Res. 71, 31–46.
inisterio de Agricultura, Pesca y Alimentación, 2006. Anuario de EstadísticaAgroalimentaria 2006. Datos de 2004, 2005 y 2006 (Spanish surveys food andagriculture. Data from 2004, 2005, 2006). Madrid, Spain.
agy, J., 1996. Effects of tillage, fertilization, plant density and irrigation on corn (Zeamays, L.) yields. Acta Agronomica Hungarica 44, 347–354.
nken, A.B., Matheson, R.L., Nesmith, D.H., 1985. Fertilizer nitrogen and residualnitrate-nitrogen effects on irrigated corn yield. Soil Sci. Soc. Am. J. 49, 134–139.
iekielek, W.P., Fox, R.H., Coth, J.D., Macneal, K.E., 1995. Use of a chlorophyll meterat the early dent stage of corn to evaluate nitrogen sufficiency. Agron. J. 87,403–408.
on of irrigated maize under Mediterranean conditions. Eur. J. Agron.
itchie, S.W., Hanway, J.J., 1982. How a corn plant develops. Iowa State Coop. Ext.Serv. Spec. Rep., 48. Ames, IA, USA.
AS, 1991. SAS User’s Guide. SAS Institute Inc., Cary, NC, USA.chröder, J.J., Neeteson, J.J., Oenema, O., Struik, P.C., 2000. Does the crop or the soil
indicate how to save nitrogen in maize production? Reviewing the state of theart. Field Crops Res. 66, 151–164.

ING ModelE
J. Agro
S
S
S
S
S
T
U
V
V
V
ARTICLEURAGR-24826; No. of Pages 9
P. Berenguer et al. / Europ.
chmidt, J.P., DeJoia, A.J., Ferguson, R.B., Taylor, R.K., Young, R.K., Havlin, J.L., 2002.Corn yield response to nitrogen at multiple in-field locations. Agron. J. 94,798–806.
exton, B.T., Moncrief, J.F., Rosen, C.J., Gupta, S.C., Cheng, H.-H., 1996. Optimizingnitrogen and irrigation inputs for corn based on nitrate leaching and yield on acoarse-textured soil. J. Environ. Qual. 25, 982–992.
hapiro, C.A., Wortmann, C.S., 2006. Corn response to nitrogen rate, row spacing andplant density in Eastern Nebraska. Agron. J. 98, 529–535.
isquella, M., Lloveras, J., Álvaro, J., Santiveri, F., Cantero, C., 2004. Técnicas de cultivopara la producción de maíz, trigo y alfalfa en los regadíos del valle del Ebro (Man-
Please cite this article in press as: Berenguer, P., et al., Nitrogen fertilisati(2008), doi:10.1016/j.eja.2008.09.005
agement of maize, wheat and alfalfa in the irrigated areas of the Ebro Valley).Proyecto Trama-Life, Lleida, Spain, pp. 47 (in Spanish).
oil Survey Staff, 1998. Keys to Soil Taxnomy. United States Department of Agricul-ture, Natural Resources Conservation Service, USA.
hompson, L.M., 1986. Climatic change, weather variability, and corn production.Agron. J. 78, 649–653.
V
PRESSnomy xxx (2008) xxx–xxx 9
hart, S.A., Andrade, F.H., 1995. Nitrogen deficiency in maize. I. Effects on cropgrowth, development, dry matter partitioning, and kernel set. Crop Sci. 35,1376–1383.
anotti, M.B., Bundy, L.G., 1994. An alternative rationale for corn nitrogen fertilizerrecommendations. J. Prod. Agric. 7, 243–249.
ázquez, N., Pardo, A., Suso, M.L., Quemada, M., 2006. Drainage and nitrate leachingunder processing tomato growth with drip irrigation and plastic mulching. Agric.Ecosyst. Environ. 112, 313–323.
illar, P., Villar, J.M., Ferrer, F., Arán, M., 2000. Optimización de la fertilización nitroge-nada en maíz en suelos calcáreos del área regada por los canales de Urgell (Lleida)
on of irrigated maize under Mediterranean conditions. Eur. J. Agron.
(Optimisation of maize nitrogen fertilisation in calcareous soils in the Urgell’sChannel irrigated area (Lleida)). Investigación Agraria: Producción y ProtecciónVegetales. 15, 105–123 (in Spanish).
illar-Mir, J.M., Villar-Mir, P., Stockle, C.O., Ferrer, F., Aran, M., 2002. On-farm moni-toring of soil nitrate-nitrogen in irrigated cornfields in the Ebro valley (NortheastSpain). Agron. J. 94, 373–380.