Maize endosperm texture characterisation using the Rapid ...
137
Maize endosperm texture characterisation using the Rapid Visco Analyser (RVA), X-ray micro-computed tomography (μCT) and micro-near infrared (microNIR) spectroscopy by Anina Guelpa Dissertation presented for the degree of Doctor of Philosophy (Food Science) in the Faculty of AgriSciences at Stellenbosch University Supervisor: Prof Marena Manley Co-supervisor: Prof Paul Geladi Co-supervisor: Dr Anton du Plessis March 2015
-
Upload
khangminh22 -
Category
Documents
-
view
3 -
download
0
Transcript of Maize endosperm texture characterisation using the Rapid ...

Maize endosperm texture characterisation using the
Rapid Visco Analyser (RVA), X-ray micro-computed
tomography (μCT) and micro-near infrared
(microNIR) spectroscopy
by
Anina Guelpa
Dissertation presented for the degree of
Doctor of Philosophy (Food Science) in the
Faculty of AgriSciences at
Stellenbosch University
Supervisor: Prof Marena Manley
Co-supervisor: Prof Paul Geladi
Co-supervisor: Dr Anton du Plessis
March 2015

i
DECLARATION
By submitting this dissertation electronically, I declare that the entirety of the work contained
therein is my own, original work, that I am the sole author thereof (save to the extent
explicitly otherwise stated), that reproduction and publication thereof by Stellenbosch
University will not infringe any third party rights and that I have not previously in its entirety or
in part submitted it for obtaining any qualification.
Anina Guelpa
March 2015
Copyright © 2015 Stellenbosch University
All rights reserved
Stellenbosch University https://scholar.sun.ac.za

ii
Acknowledgements
My journey back into the world of academics after 10 years in the industry has been unpredictable
to say the least. During this time some people and institutions have been consistent in their support
and guidance, allowing me to take the next step in my career with confidence.
I would like to express sincere gratitude to the following people and institutions for their
professional contributions to my studies:
my supervisor, Prof Manley for the opportunity to further my studies in Food Science, being
patient when it took me some time to get used to the world of academics again and her
professional guidance;
my co-supervisor, Prof Geladi for his expert NIR hyperspectral imaging advice and for
introducing me to the world of chemometrics;
my co-supervisor, Dr Du Plessis, for reviewing my work and providing feedback;
a sincere thank you to Prof Kidd who spent many hours analysing my data and giving great
advice;
the staff of CAF including Stephan le Roux, Olwethu Majodina, Jarlen Beukes and Stacy-
Lee Lewis for X-ray µCT assistance and analysis;
Ayanda Myende, who played an important role in ensuring that the RVA analysis of my
samples got done in time;
Umbio AB (Umeå, Sweden) for the use of their Umbio Inspector SWIR pushbroom
hyperspectral imaging system and BÜCHI Labortechnik GmbH (Flawil, Switzerland) for the
use of their BÜCHI NIRFlex N-500 Fourier transform near-infrared (FTNIR)
spectrophotometer;
Sasko, a division of Pioneer Foods (Pty) Ltd (Paarl, South Africa), for the use of their
research and development facilities supplying analytical reference results (Essential Foods)
as well as donation of the Rapid Visco Analyser and Perten Laboratory Mill; and
Anchen Lombard for assisting with travel arrangements and other financial aspects.
Without your support and meticulous way of staying on top of things with great humour, my
journey would probably have been much longer.
I am also sincerely grateful for the financial assistance I have received from various institutions
during my three years of study. To this end I would like to acknowledge the contributions of:
Maize Trust for a study bursary
FoodBev
Harry Crossley
Stellenbosch University merit bursary
Stellenbosch University https://scholar.sun.ac.za

iii
This work is based upon research supported by the National Research Foundation (grant specific
unique reference numbers (UID) 76641, 70863 and 83974).
On a personal level I have been blessed with a wonderful family who always have my best
interests at heart. I am grateful to my parents for their continuous interest in my progress and
believing in my abilities. To my mother, the hours spent looking after my family when I couldn’t was
a wonderful gift and great blessing to us all.
To my sons, I am truly blessed to have such great boys, who, at a young age already understand
the meaning of support, whether it is helping with breakfast or dinner or just making sure that it is
quiet around the house for me to concentrate.
To my husband Wickus, thank your for sharing this journey with me. Your continuous interest and
sometimes challenging critique is sincerely appreciated. Your assistance with household tasks,
looking after the boys and surviving my overseas trips made this all possible. LVJ
Stellenbosch University https://scholar.sun.ac.za

iv
Abstract
Maize kernels consists of two types of endosperm, a harder vitreous endosperm and a softer floury
endosperm, and the ratio of the vitreous and floury endosperm present mainly determines the
hardness of the kernel. Maize (Zea mays L.) is a staple food in many countries, including South
Africa, and is industrially processed into maize meal using dry-milling. For optimal yield and higher
quality products, hard kernels are favoured by the milling industry. Despite many maize hardness
methods available, a standardised method is still lacking, furthermore, no dedicated maize milling
quality method exists.
Using an industrial guideline (chop percentage), a sample set of different maize hybrids was
ranked based on milling performance. Unsupervised inspection (using principal component
analysis (PCA) and Spearman’s rank correlation coefficients) identified seven conventional
methods (hectoliter mass (HLM), hundred kernel mass (HKM), protein content, particle size index
(PSI c/f), percentage vitreous endosperm (%VE) as determined using near infrared (NIR)
hyperspectral imaging (HSI) and NIR absorbance at 2230 nm (NIR @ 2230 nm)) as being
important descriptors of maize milling quality. Additionally, Rapid Visco Analyser (RVA) viscograms
were used for building prediction models, using locally weighted partial least squares (LW-PLS).
Hardness properties were predicted in the same order or better than the laboratory error of the
reference method, irrespective of RVA profile being used.
Classification of hard and soft maize hybrids was achieved, based on density measurements
as determined using an X-ray micro-computed tomography (µCT) density calibration constructed
from polymers with known densities. Receiver operating classification (ROC) curve threshold
values of 1.48 g.cm-3, 1.67 g.cm-3 and 1.30 g.cm-3 were determined for the entire kernel (EKD),
vitreous (VED) and floury endosperm densities (FED), respectively at a maximum of 100%
sensitivity and specificity.
Classification based on milling quality of maize hybrids, using X-ray µCT derived density and
volume measurements obtained from low resolution (80 µm) µCT scans, were achieved with good
classification accuracies. For EKD and vitreous-to-floury endosperm ratio (V:F) measurements,
93% and 92% accurate classifications were respectively obtained, using ROC curve. Furthermore,
it was established that milling quality could not be described without the inclusion of density
measurements (using PCA and Spearman’s rank correlation coefficients).
X-ray µCT derived density measurements (EKD) were used as reference values to build NIR
spectroscopy prediction models. NIR spectra were acquired using a miniature NIR
spectrophotometer, i.e. a microNIR with a wavelength range of 908 – 1680 nm. Prediction statistics
for EKD for the larger sample set (where each kernel was scanned both germ-up and germ-down)
was: R2V = 0.60, RMSEP = 0.03 g.cm-3, RPD = 1.67 and for the smaller sample set (where each
kernel was scanned only germ-down): R2V = 0.32, RMSEP = 0.03 g.cm-3, RPD = 1.67. The results
Stellenbosch University https://scholar.sun.ac.za

v
from the larger sample set indicated that reasonable predictions can be made at the fast NIR scan
rate that would be suitable for breeders as a rough screening method.
Stellenbosch University https://scholar.sun.ac.za

vi
Uittreksel
Mieliepitte bestaan uit twee tipes endosperm, ‘n harder glasagtige endosperm en ‘n sagter
melerige endosperm, en die verhouding waarin die twee tipes endosperm aangetref word, bepaal
hoofsaaklik die hardheid van die pit. Mielies (Zea mays L.) is ‘n stapelvoedsel in baie lande,
insluitende Suid-Afrika, en word industrieël geprosesseer na mieliemeel deur van droë-vermaling
gebruik te maak. Vir optimale produksie en beter kwaliteit produkte, word harde pitte deur die
meule verkies. Ongeag die beskikbaarheid van verskeie mielie hardheid metodes, ontbreek ‘n
gestandardiseerde metode nog, en verder bestaan ‘n metode om mielies se maalprestasie te
bepaal ook nie.
‘n Monsterstel, bestaande uit verskillende mieliebasters, is op grond van maalprestasie
ingedeel deur van ‘n industriële riglyn (chop persentasie) gebruik te maak. Inspeksie sonder toesig
(deur gebruik te maak van hoofkomponentanalise (HKA) en Spearman’s
rangkorrelasiekoëffisiënte) het sewe onkonvensionele metodes (hektoliter massa, honderd pit
massa, protein inhoud, partikel grootte indeks, persentasie glasagtige endosperm soos bepaal
deur gebruik te maak van naby-infrarooi (NIR) hiperspektrale beelding en NIR absorbansie by
2230 nm) identifiseer as belangrike beskrywers van maalprestasie. Daarbenewens, is Rapid Visco
Analyser (RVA) viskogramme gebruik om voorspellingsmodelle te bou deur gebruik te maak van
plaaslik geweegte gedeeltelike kleinstekwadrate (PG-GKK) wat hardheidseienskappe kon voorspel
met laer, of in dieselfde orde, laboratorium foute van die verwysingsmetodes, ongeag die gebruik
van verskillende RVA profiele.
Klassifikasie tussen harde en sagte mieliebasters was moontlik, gebasseer op
digtheidsmetings soos bepaal met ‘n X-staal mikro-berekende tomografie (µBT) digtheids
kalibrasie gebou vanaf polimere met bekende digthede. Ontvanger bedryf kenmerkende (OBK)
kurwe drempelwaardes van 1.48 g.cm-3, 1.67 g.cm-3 en 1.30 g.cm-3 is bepaal vir hele pit, glasagtige
en melerige endosperm digthede, onderskeidelik, teen ‘n maksimum van 100% sensitiwiteit en
spesifisiteit.
Klassifikasie van die mieliebasters, gebasseer op maalprestasie en deur gebruik te maak van
X-straal µBT afgeleide digtheid en volume metings soos verkry teen lae resolusie (80 µm)
skanderings, was moontlik met goeie klassifikasie akkuraatheid. Vir heel pit digtheid en glasagtig-
tot-melerige endosperm verhouding metings is 93% en 92% akkurate klassifikasies verkry
wanneer OBK kurwes gebruik is. Verder is dit vasgestel (deur gebruik te maak van HKA en
Spearman’s rangkorrelasiekoëffisiënte) dat digtheidsmetings ingesluit moet word vir ‘n volledige
beskrywing van maalprestasie.
X-straal µBT afgeleide digtheid metings is gebruik as verwysings waardes om NIR
spektroskopie voorspellings modelle te bou. NIR spektra is verkry deur van ‘n miniatuur NIR
spektrofotometer, naamlik ‘n microNIR, bebruik te maak vanaf 908 – 1680 nm. Voorspellings
statestiek vir die groter monsterstel (waar elke pit beide kiem-bo en kiem-onder geskandeer is)
Stellenbosch University https://scholar.sun.ac.za

vii
was vir HPD: R2V = 0.60, RMSEP = 0.03 g.cm-3, RPD = 1.67 en vir die kleiner monsterstel (waar
elke pit was slegs kiem-onder geskandeer is) vir HPD: R2V = 0.32, RMSEP = 0.03 g.cm-3, RPD =
1.67. Die resultate van die groter monsterstel het aangedui dat redelike voorspellings moontlik is,
teen die vinnige NIR skaderings tempo wat as rowwe vertoningsmetode geskik sal wees vir telers.
Stellenbosch University https://scholar.sun.ac.za

viii
Table of contents
Declaration……………………………………………………………………………………………..……i
Acknowledgements…………………………..…………………………………………………………..ii
Abstract…………………….……………………………………………………………………...…..…...iv
Uittreksel………………………………………………………………………………..……………..……vi
List of Figures……………………………………….………….………………………………..….…...xii
List of Tables……………………………………….………………………….…………………...….…xv
List of Abbreviations…….……………………………………………………………………..…..…xvi
Chapter 1: Introduction…………………………………………………………………………..…..…1
References………………………………………………………………………………...….….…3
Chapter 2: Literature review………………………………………………………………...…...……6
Introduction………………………………………………………………………………...….…...6
Factors that affect maize hardness……………………………………………………….……6
Endosperm types……………………………………………………………………….…..6
Kernel morphology………………………………………………………………………....9
Environmental and postharvest factors…………………………………………………10
Factors affected by maize hardness………………………………………………………….11
Storage, handling and transportation…………………………………………………...11
Wet-milling…………………………………………………………………………………11
Dry-milling………………………………………………………………………………….12
Maize hardness determinations: a comparison of different test methods…………….12
Resistance to breakage…………………………………………………………………..12
Chemical analysis…………………………………………………………………………12
Physical analysis……………………………………………………………………….....13
Indirect tests……………………………………………………………………………….14
Near infrared spectroscopy……………………………………………………...14
Near infrared hyperspectral imaging…………………………………………...15
Other indirect tests……………………………………………………………….16
Less common methods…………………………………………………………………..16
Direct and time consuming methods……………………………………………………17
Micro-milling……………………………………………………………………………….18
Multivariate approach…………………………………………………………………….19
X-ray micro-computed tomography scanning………………………………….…………..21
The instrument…………………………………………………………………………….21
A radiograph……………………………………………………………………………….21
Reconstruction into a 3-D volume……………………………………………………….22
Stellenbosch University https://scholar.sun.ac.za

ix
Analysis of the 3-D volume………………………………………………………………23
Statistical interpretation……………………………………...………………...….……………24
Univariate statistical analysis…………………………………………………………….24
Spearman’s rank correlation coefficients………………………………………24
Interclass correlation coefficients……………………………………………….25
Analysis of variance……………………………………………………………...25
Receiver operating characteristic curve………………………………………..25
Multivariate statistical analysis…………………………………………………………..25
Principal component analysis…………………………………………………..26
Partial least squares regression………………………………………………..26
Multivariate image analysis……………………………………………………..27
Conclusion…………………………………………………………………….....….……………27
References……………………………………………..………………………...….……………28
Chapter 3: Application of Rapid Visco Analyser (RVA) viscograms and
chemometrics for maize hardness characterisation………………………….….……….….35
Abstract………………………………………………………………………………...….………35
Introduction………………………………………………………………………………………..36
Materials and methods…………………………………………………………………………..37
Maize samples…………………………………………………………………… ……..37
Methods…………………………………………………………………………………….38
Pasting properties (acquisition of RVA data)……………………………….....38
Determination of maize hardness by conventional reference methods…….39
Hectoliter mass…………………………………………………………..39
Hundred kernel mass……………………………………………………39
Protein content…………………………………………………………...39
Percentage chop…………………………………………………………40
Particle size index………………………………………...……………..40
Percentage vitreous endosperm (%VE)………………………...…….40
NIR absorbance at 2230 nm……………………………………………41
Chemometrics and statistical data analysis………………………………………...….42
Statistical analysis………………………………………………………………..42
Principal component analysis……………………………………..……….……42
Locally weighted partial least squares regression…………………………….42
Software…………………………………………………………………………...43
Results and discussion…………………………………………………………...…………….43
PCA and correlations……………………………………………………………………..43
RVA curves and hardness descriptors………………………………………………….44
Quantification of hardness properties in maize samples…………………………..…49
Stellenbosch University https://scholar.sun.ac.za

x
Conclusion………………………………………………………………………………………...50
References…………………………………………………………………………………………51
Supplementary material…………………………………………………………………………54
Chapter 4: Non-destructive estimation of maize (Zea mays L.) kernel hardness by
means of an X-ray micro-computed tomography (µCT) density calibration………..…58
Abstract……………………………………………………………………………………..……..58
Introduction………………………………………………………………………………………..59
Materials and methods…………………………………………………………………………..61
Maize samples……………………………………………………………..………….…..61
Polymers used for density calibration………………………………………………..…61
Hardness determination of maize kernels………………………………..………….…61
Particle size index………………………………………………………..….…...61
Floating test……………………………………………………………………….62
Scanning electron microscopy………………………………………..………………....63
X-ray micro-computed tomography scanning……………………………..…………...63
Data processing…………………………………………………………………………...64
Statistical procedures……………………………………………………………………..66
Analysis of variance……………………………………………………..…….…66
Comparison of density measurements (µCT and floating test)………..….…66
Validation of density calibration……………………………………..………….66
Correlation coefficients…………………………………………………………..67
Classification models…………………………………………………………….67
Principal component analysis…………………………………………………...67
Results and discussion………………………………………………………………………....67
Microstructure of maize kernels…………………………………………………………68
Density calculations using X-ray µCT…………………………………………………..70
Validating the accuracy of X-ray µCT density calibration……………………………..74
Conventional density measurements…………………………………………………...74
Principal component analysis for variable interpretation……………………………...74
Hardness classification…………………………………………………………………...76
Conclusion………………………………………………………………………………………...77
References…………………………………………………………………………………………77
Chapter 5: Milling quality classification of maize (Zea mays L.) using X-ray micro-
computed tomography (µCT)………………………………………………………………...……...81
Abstract…………………………………………………………………………………………….81
Introduction………………………………………………………………………………………..82
Materials and methods…………………………………………………………………………..83
Samples and preparation…………………………………………………………...……83
Stellenbosch University https://scholar.sun.ac.za

xi
Conventional hardness methods………………………………………………………..84
X-ray micro-computed tomography scanning………………………………………….84
Image processing and analysis………………………………………………………….85
Density calculations………………………………………………………………86
Volume analysis…………………………………………………………………..87
Statistical procedures……………………………………………………………………..88
Univariate methods…………………………………………………...………….88
Multivariate method: principal component analysis……………………...…...89
Results and discussion……………………………………...………………………………….89
X-ray µCT density calculations…………………………………………..……………...89
X-ray µCT volume analysis………………………………………………………...…….93
Importance of the X-ray µCT derived variables, as interpreted by principal
component analysis and correlation coefficients……………………………..….…….95
Importance of the X-ray µCT derived variables, in relation to conventional
hardness methods, as interpreted by principal component analysis and
correlation coefficients……………………………………………………………………96
Conclusion……………………………………………………………………………………….101
References……………………………………………………………………………………….102
Chapter 6: Prediction of kernel density of single maize (Zea mays L.) kernels using a
miniature near infrared (NIR) spectrophotometer……………………………………………105
Abstract…………………………………………………………………………………………..105
Introduction………………………………………………………………………………………106
Materials and methods…………………………………………………………………………107
Samples used for model building………………………………………………………107
X-ray µCT derived measurements used for model building………………………...107
Spectral acquisition……………………………………………………………………...107
Principal component analysis and partial least squares regression models………108
Results and discussion…………………………………………………………………...…...109
Conclusion……………………………………………………………………………………….114
References……………………………………………………………………………………….114
Chapter 7: General discussion and conclusions…………………………………………….117
References……………………………………………………………………………………….119
Stellenbosch University https://scholar.sun.ac.za

xii
List of Figures
Figure 2.1. A longitudinal digital image (Canon EOS 300D digital camera, fitted with a Canon 30 –
80 mm lens) of a maize kernel, depicting the internal structure of the maize kernel, i.e. floury and
vitreous endosperm, germ and pedicle. …………………………………………………………………..7
Figure 2.2. Scanning electron microscopy (SEM) micrographs (LEO1430 VP, Zeiss, Germany)
(4500X) of (a) tightly packed polygonal shaped starch granules from vitreous endosperm covered
in a thick protein matrix, (b) loosely packed irregularly shaped starch granules from floury
endosperm covered with a thin protein matrix and (c) protein (zein) bodies (inside dashed oval)
visible. ……………………………………………………………………………………………………..…8
Figure 2.3. Schematic representation (Anon., 1996) of the layers and structures of a maize kernel.
…………………………………………………………………………………………………………………9
Figure 2.4. Front white cob is that of flint maize with the characteristic long and flat kernels,
whereas the two maize cobs at the back of the picture are dent maize with short and flat kernels.10
Figure 2.5. A Rapid Visco Analyser (RVA) viscogram (Agu et al., 2006). ………………………….18
Figure 2.6. The fundamental components of any computed tomography instrument. ……………22
Figure 2.7. Schematic representation of tomographic reconstruction from 2-D to 3-D. …………..23
Figure 2.8. X-ray µCT segmentation of a bottle neck with screwed on bottle cap, creating regions-
of-interest (ROIs): grey = bottle neck; blue = bottle cap and red = contact areas. ……………...…24
Figure 3.1. (a) Loading of the PCA on the Y block. (b) Score plot on the Y block. The dots are
coloured as a function of the increasing %chop value. (HLM = hectoliter mass, HKM = hundred
kernel mass, Prot (Dumas) = protein content, PSI (c/f) = particle size index (coarse/fine), %VE = %
vitreous endosperm, NIR @ 2230 nm = near infrared absorbance at 2230 nm). …………………..45
Figure 3.2. (a) RVA viscograms of a random maize sample, using the soft, standard and hard
maize profile. (Green line = temperature; blue line = viscosity). (b) Viscograms using the standard
profile for 3 hard (red curves) and 3 soft (blue curves) maize samples and (c) zoomed in to
illustrate variability in peak viscosities. …………………………………………………………..………46
Figure S3.1. Histograms of the distribution of the values for each variable. (HLM = hectoliter
mass, HKM = hundred kernel mass, Protein = protein content (Dumas method) %, PSI (c/f) =
particle size index (coarse/fine), %VE = % vitreous endosperm, NIR @ 2230 nm = near infrared
spectroscopy (hardness index). ………………………………………………………………...………..54
Figure S3.2. LW-PLS2 modeling: plot of the error surface, reporting the RMSECV of the model
built with the RVA curves for the standard profile as a function of the number of nearest neighbours
and the number of latent variables, used for the selection of optimal model parameters. …………55
Figure 4.1. Stack of 7 polymer discs, used for the density calibration, along with 8 maize kernels
with (a) showing the florist oasis, used for mounting and (b) with the mounting material
removed……………………………………………………………………………………………………..64
Figure 4.2. 3-D µCT image of a maize kernel with its germ removed. …………………………..…65
Stellenbosch University https://scholar.sun.ac.za

xiii
Figure 4.3. 2-D X-ray µCT slice images of (a) a hard and (b) a soft maize kernel illustrating the
presence of distinct, large cavities (marked with white circles) present in mostly the soft
endosperm. Cavities are shown as black in X-ray images. ………………………………………..….69
Figure 4.4. (a) A longitudinal digital image (Canon EOS 300D digital camera, fitted with a Canon
30 – 80 mm lens) and (b) 2-D X-ray µCT image slice of the same maize kernel, depicting the
internal structure of the maize kernel, i.e. flour and vitreous endosperm, germ and pedicle. …….71
Figure 4.5. Scanning electron microscopy (SEM) micrographs (4500X) of (a) loosely packed
irregularly shaped starch granules covered with a thin protein matrix (1) from floury endosperm
with pores and air pockets (2) around and embedded into the granules and; (b) the tightly packed
polygonal shaped starch granules from vitreous endosperm covered in a thick protein matrix (3)
with protein (zein) bodies (4) visible. …………………………………………………………………….72
Figure 4.6. 2-D X-ray µCT slice image illustrating the endosperm microstructure of (a) a whole
maize kernel acquired at 6 µm resolution and (b) a sub-volume of the same kernel acquired at 3
µm resolution. (c) 3-D X-ray µCT image of the sub-volume of the maize kernel (acquired at 3 µm
resolution) with the larger cavities visualised in magenta and the smaller pores in blue. The colour
bar indicates the size (mm3) of the cavities (large; magenta) and pores (small; blue). ……………73
Figure 4.7. Principal component analysis bi-plot illustrating the interaction of the X-ray µCT
derived variables. ………………………………………………………………………………………….75
Figure 5.1. Digital images illustrating sample preparation: (a) five florist oasis discs used as
mounting material for the 150 good milling maize kernels, (b) the stack of discs, held upright with a
wooden stick and (c) a top view of the stack. The polymer discs used for the density calibration
are also visible in these images. …………………………………………………………………...…….85
Figure 5.2. The Phoenix V|Tome|X L240 micro-computed tomography scanner showcasing the (a)
direct tube and the sample manipulator, (b) lead-line cabinet with cooling unit and (c) the control
monitor. …………………………………………………………………………………………...………...86
Figure 5.3. The 3-D X-ray µCT image of a stack of five discs, containing 30 kernels each and with
the mounting material removed. ……………………………………………………………..…………..86
Figure 5.4. X-ray µCT slice images of (a) maize kernel with germ intact, and (b) with germ
removed, slice by slice. ……………………………………………………………………….…………..87
Figure 5.5. 2-D X-ray µCT slice images of the (a) vitreous endosperm (blue) and (b) floury
endosperm (yellow) present within a maize kernel. ………………………………………………..…..88
Figure 5.6. A zoomed in 2-D X-ray µCT slice image acquired at a 13.4 µm resolution of the internal
structures of a maize kernel. The light grey (more dense) region on the left is the vitreous
endosperm, whereas a section of the germ is visible at the bottom (white) and the loosely packed
floury endosperm is visible in darker grey (less dense) with intracellular airspaces (black). .……..90
Figure 5.7. ROC curves indicating milling quality classification, using (a) EKD, (b) VED and (c)
FED. ……………………………………………………………………………...………………………….92
Stellenbosch University https://scholar.sun.ac.za

xiv
Figure 5.8. ROC curves indicating milling quality classification, using (a) V:F, (b) VEV, (c) EKV and
(d) FEV. ……………………………………………………………………………………………………..96
Figure 5.9. A PCA bi-plot, illustrating the interaction between the X-ray µCT derived variable on
297 maize kernels. …………………………………………………………………………………………97
Figure 5.10. A PCA bi-plot, illustrating the interaction between the X-ray µCT derived variable, as
well as the variables from 6 conventional hardness methods, of 20 maize samples. ……………...99
Figure 6.1. (a) A MicroNIR spectrometer imaged next to a pen to illustrate the small size of the
device, and (b) a hollowed-out Teflon disk with a maize kernel inside as it was used when scanning
individual maize kernels. ……………………………………………………...…………………………108
Figure 6.2. Mean-centered and SNV pre-treated NIR reflectance spectra, as acquired using a
MicroNIR spectrophotometer, of the sample set, scanned both germ-up and germ-down. ….…..110
Figure 6.3. A principal component score plot of PC 2 vs. PC 3 (27.9% and 10.7%), illustrating both
PCs to be important with respect to the variation found between the good milling (red dots) and
poor milling (blue dots) kernels. …………………………………..…………………………………….110
Figure 6.4. A loading line plot for (a) PC 2 showing 2 prominent positive peaks: (1) 1225 nm and
(2) 1430 nm, associated with starch and protein, and (b) PC 3 showing 3 prominent positive peaks:
(1) 1170 nm, (2) 1395 nm and (3) 1660 nm, all associated with starch. ………………………...…111
Figure 6.5. Validation set predictions for EKD (g.cm-3) of the robust sample set (scanned germ-up
and germ-down). ………………………………………………………………………………………….112
Figure 6.6. (a) Principal component score plot of PC 1 vs. PC 2 (72.6% and 20.6%) illustrating the
good milling kernels (red dots) to cluster predominantly above PC 2 and the poor milling kernels
(blue dots) to cluster below PC 2. (b) A loading line plot for PC 2 revealing 2 prominent positive
peaks: (1) at 1195 nm and the other one at 1415 nm. …………………………………………………113
Figure 6.7. Validation set predictions for EKD (g.cm-3) of the sample set scanned germ-down. Four
samples encircled were investigate as possible outliers. ……………………………………..…..…114
Stellenbosch University https://scholar.sun.ac.za

xv
List of Tables
Table 2.1. Simple methods used in Southern Africa for maize grain quality evaluation, their
advantages, disadvantages and applicability (Chiremba et al., 2011)……………………………..…19
Table 3.1. Details of the RVA soft, standard and hard maize profiles (temperature and time)…....38
Table 3.2. Spearman’s rank correlation coefficients for the conventional reference hardness
methods results……………………………………………………………………………………………..44
Table 3.3. RMSECV results for the conventional hardness methods, using three different RVA
profiles……………………………………………………………………………………………………….49
Table 3.4. LW-PLS2 prediction statistics for cross-validation (n = 41) and external (n = 6) validation
for the conventional hardness methods, using the three RVA profiles………………………….……49
Table S3.1. Descriptive statistics of the conventional reference hardness methods results……....56
Table S3.2. LW-PLS2 prediction statistics for the conventional hardness methods, using the three
RVA profiles, as estimated by double cross-validation across the four localities..………………….57
Table 4.1. The results from PSI (n = 49) that was used to select two hybrids that differs maximally
in hardness………………………………………………………………………………………………….68
Table 4.2. %Cavity, %porosity, entire kernels density, vitreous endosperm density and floury
endosperm density results of 16 maize kernels as derived by X-ray µCT…………..……………….69
Table 4.3. Cavity and porosity percentages as well as entire kernel, vitreous endosperm and floury
endosperm densities as derived by X-ray µCT for hard (n = 8) and soft (n = 8) maize hybrids...…70
Table 4.4. Spearman’s rank correlation coefficients for the X-ray µCT derived variables…….…...76
Table 4.5 Receiver operating characteristic (ROC) curve results for hardness classification using
X-ray µCT derived variables……………………………………………………………………………….76
Table 5.1. List of white maize hybrids, localities and plantings from the 2012 harvest…………....84
Table 5.2. Entire kernel density, vitreous endosperm density and floury endosperm density results
as derived by X-ray µCT for the two milling classes, good (n = 150) and poor (n = 147), also
indicating ANOVA results…………………….……………………………………………………………91
Table 5.3. ROC curve classification results when using X-ray µCT densities………………………93
Table 5.4. Entire kernel volume, vitreous endosperm volume and floury endosperm volume results
as derived by X-ray µCT for the two milling classes, good (n = 150) and poor (n = 147), also
indicating ANOVA results……………………………………………………………….…………………94
Table 5.5. ROC curve classification results when using X-ray µCT volumes………………..……..95
Table 5.6. Spearman’s rank correlation coefficient matrix for the X-ray µCT variables done on
individual maize kernels (n = 297)…………………………………………………………………….….98
Table 5.7. Descriptive statistics of the averaged X-ray µCT variables, as well as the variables from
the 6 conventional hardness methods, for each of the milling groups…………………………....…100
Table 5.8. Spearman’s rank correlation coefficient matrix for the X-ray µCT derived variables
(averaged per sample), as well as for the variables from the 6 conventional methods………...…101
Stellenbosch University https://scholar.sun.ac.za

xvi
List of Abbreviations
%cavity: Percentage cavity
%chop: Percentage chop
%FE: Percentage floury endosperm
%porosity: Percentage porosity
%VE: Percentage vitreous endosperm
µCT: Micro-computed tomography
2-D: Two dimensional
3-D: Three dimensional
ANOVA: Analysis of variance
c/f: Coarse-over-fine ratio
CAF: Central Analytical Facility
CAT: Computerised axial tomography
CT: Computed tomography
dH2O: Distilled water
E: Residual
EKD: Entire kernel density
EKV: Entire kernel volume
FED: Floury endosperm density
FEV: Floury endosperm volume
FTNIR: Fourier transform near infrared
G x E: Genotype by environment interaction
HDPE: High density polyethylene
HKM: Hundred kernel mass
HLM: Hectoliter mass
HSI: Hyperspectral imaging
ICC: Interclass correlation coefficients
LV: Latent variable
LVF: Linear variable filter
LW: Locally weighted
LW-PLS2: Locally weighted partial least squares
MI: Milling index
MIA: Multivariate image analysis
MSC: Multiplicative scatter correction
N.S.: Non-significant
NIR: Near infrared
NIR @ 2230 nm: Near infrared spectroscopy (hardness index)
Stellenbosch University https://scholar.sun.ac.za

xvii
PC: Principal component
PCA: Principal component analysis
PET: Polyethylene terephthalate
PLS: Partial least squares
PP: Polypropylene
PSI: Particle size index
PTFE: Polytetrafluoroethylene
R2C: Coefficient of determination for calibration
R2V: Coefficient of determination for validation
RMSECV: Root mean square error of cross-validation
RMSEP: Root mean square error of prediction
ROC: Receiver operating characteristic
ROI: Region-of-interest
RVA: Rapid Visco Analyser
SAGL: Southern African Grain Laboratory
SD: Standard deviation
SE: Standard error
SEL: Standard error of laboratory
SEM: Scanning electron microscopy
SNV: Standard normal variate
T: Score vector
TADD: Tangential abrasive dehulling device
UHMW PE: Ultra-high molecular weight polyethylene
V: Loadings vector
V:F: Vitreous-to-floury endosperm ratio
VED: Vitreous endosperm density
VEV: Vitreous endosperm volume
Stellenbosch University https://scholar.sun.ac.za

1
Chapter 1
Introduction
Kernel hardness is the main physical parameter that determines the end-use of maize (Zea mays
L.) (Gaytán-Martínez et al., 2006). Eighty percent of a maize kernel consists of two types of
endosperm, i.e. a harder vitreous endosperm, and a softer floury endosperm (Watson, 1987). The
ratio of the vitreous to floury endosperm present determines the hardness of the kernel (Robutti et
al., 1974). Hardness is mainly a genetic trait (Johnson & Russell, 1982), although environmental
influences (Hamilton et al., 1951) and external factors such as postharvest handling (Peplinski et
al., 1989) will also affect this property. Maize processors, i.e. the dry-milling industry, favour hard
maize as hard kernels produce greater yield, as well as higher quality meals and grits, than soft
maize (Lee et al., 2007).
Numerous methods have been used for the last 60 years to determine maize hardness
(Fox & Manley, 2009). These methods include measuring resistance to grinding and abrasion (Lee
et al., 2007); yield of grits (Wu, 1992); starch gelatinisation properties (Almeida-Dominguez et al.,
1997); as well as the determination of particle size index (PSI) (Pomeranz et al., 1984; Wu, 1992).
The use of near infrared (NIR) spectroscopy has also been widely investigated (Pomeranz et al.,
1984; Robutti, 1995; Eyherabide et al., 1996). Other methods include hand dissection, which
determines the ratio of vitreous to floury endosperm, and machine vision technology for non-
destructive classification of maize kernels (Erasmus, 2003). Quality properties such as protein,
starch, fat and fiber contents (Blandino et al., 2010) and protein (zein) composition (Dombrink-
Kurtzman & Bietz, 1993; Robutti et al., 1997) have also been used to characterise kernel hardness.
Density measurements were performed by means of a floating test (Blandino et al., 2010; Blandino
et al., 2012) or gas pycnometry (Siska & Hurburgh, 1995).
Regardless of all the hardness methods that are available, no standardised method exists
(Fox & Manley, 2009; Blandino et al., 2010). Although maize hardness and milling quality are
correlated, the mechanism or relationship between these two properties is not clearly defined.
Currently, the most appropriate method for testing maize milling quality seems to be the actual
milling process, simulated on pilot plant scale.
The Rapid Visco Analyser (RVA) is a viscometric tool that has been shown to quantify maize
hardness differences between maize hybrids (Yamin et al., 1999; Seetharaman et al., 2001; Ji et
al., 2003; Sandhu & Singh, 2007). This is based on hard maize producing mainly coarse particles
when being milled, whereas soft maize produces smaller particles (Almeida-Dominguez et al.,
1997), therefore resulting in different rates of hydration and gelatinisation. For each of the
measurements, viscosity (cP), temperature (°C), speed (rpm) and the heat-cool ratio are recorded.
The resulting curve, a viscogram, can be subjected to multivariate data analysis techniques to
simultaneously predict multiple measurements (Visser, 2011).
Stellenbosch University https://scholar.sun.ac.za

2
NIR spectroscopy is one of a few non-destructive methods and is prominent among major
analytical technologies, as it is a fast and low-cost method with broad application possibilities
(McClure, 2004; Manley, 2014). NIR analysis has been successfully used for bulk maize
characterisation for a number of measurements, i.e. oil, protein, starch and moisture contents
(Osborne et al., 1993). As reviewed by Fox and Manley (2009), NIR spectroscopy has been used
to predict bulk kernel hardness traits for more than 20 years. However, the prediction of single-
kernel traits are not as widely studied due to the difficulty of collecting reliable and representative
spectra from a heterogeneous sample. Spectral changes are observed as a kernel’s orientation
towards the spectrometer and optics changes (Janni et al., 2008; Fox & Manley, 2014). Different
approaches have been studied to overcome these limitations (Armstrong, 2006; Spielbauer et al.,
2009).
In addition to NIR spectroscopy that only conveys average chemical (or physical) information of
a sample, NIR hyperspectral imaging (HSI) facilitates the visualisation of the distribution of the
chemical components in a sample (Manley, 2014). Predictions of heterogeneous samples will thus
benefit from this technology. Successful maize hardness predictions, using NIR HSI, were
achieved recently (Manley et al., 2009; Williams et al., 2009; McGoverin & Manley, 2012).
Micro-computed tomography (µCT) uses the differences in X-ray attenuation arising principally
from differences in density and atomic composition within the material (Chawanji et al., 2012; Zhu
et al., 2012; Cnudde & Boone, 2013). For a particular material (at a specific energy) the X-ray
attenuation is approximately proportional to the material’s density (Sinka et al., 2004). The main
advantage of the X-ray µCT technique is the ability to perform non-destructive and non-invasive
capturing of high resolution three dimensional (3-D) detail, as recently illustrated on maize kernels
(Gustin et al., 2013).
The aim of this study was to estimate maize hardness and maize milling quality and
consequently characterise maize endosperm texture, using RVA, X-ray µCT and MicroNIR
spectroscopy, combined with statistical and multivariate data analysis. Specific objectives were to:
determine the usefulness of RVA viscograms as milling quality descriptors;
construct an X-ray μCT density calibration to non-destructively estimate kernel hardness
from calculated density, percentage porosity and percentage cavity measurements of the
entire maize kernel as well as that of selected ROIs (vitreous and floury endosperm);
perform milling quality classification of maize kernels, based on X-ray µCT derived densities
and volumes (entire kernel, vitreous and floury endosperm); and
investigate the possibility of predicting whole kernel density, fast and non-destructively,
using single-kernel MicroNIR reflectance spectroscopy.
Stellenbosch University https://scholar.sun.ac.za

3
References
Almeida-Dominguez, H.D., Suhendro, E.L. & Rooney, L.W. (1997). Factors affecting Rapid Visco-
Analyser curves for the determination of maize kernel hardness. Journal of Cereal Science,
25, 93-102.
Armstrong, P. (2006). Rapid single-kernel NIR measurement of grain and oil-seed attributes.
Applied Engineering in Agriculture, 22, 767.
Blandino, M., Mancini, M.C., Peila, A., Rolle, L., Vanara, F. & Reyneri, A. (2010). Determination of
maize kernel hardness: comparison of different laboratory tests to predict dry milling
performance. Journal of the Science of Food and Agriculture, 90, 1870-1878.
Blandino, M., Sacco, D. & Reyneri, A. (2012). Prediction of the dry milling performance of maize
hybrids through hardness associated properties. Journal of the Science of Food and
Agriculture, 93, 1356-1364.
Chawanji, A.S., Baldwin, A.J., Brisson, G. & Webster, E. (2012). Use of X-ray micro tomography to
study the microstructure of loose-packed and compacted milk powders. Journal of
Microscopy, 248, 49-57.
Cnudde, V. & Boone, M.N. (2013). High-resolution X-ray computed tomography in geosciences: A
review of the current technology and applications. Earth-Science Reviews, 123, 1-17.
Dombrink-Kurtzman, M.A. & Bietz, J.A. (1993). Zein composition in hard and soft endosperm of
maize. American Association of Cereal Chemists, 70, 105-108.
Erasmus, C. (2003). Maize kernel translucency measurement by image analysis and its
relationship to vitreousness and dry milling performance. PhD Thesis. University of
Pretoria, Pretoria, South Africa.
Eyherabide, G.H., Robutti, J.L. & Borras, F.S. (1996). Effect of near-infrared transmission-based
selection on maize hardness and the composition of zeins. Cereal Chemistry, 73, 775-778.
Fox, G. & Manley, M. (2009). Hardness methods for testing maize kernels. Journal of Agricultural
and Food Chemistry, 57, 5647-5657.
Fox, G. & Manley, M. (2014). Applications of single kernel conventional and hyperspectral imaging
near infrared spectroscopy in cereals. Journal of the Science of Food and Agriculture, 94,
174-179.
Gaytán-Martínez, M., Figueroa-Cárdenas, J., Reyes-Vega, M., Rincón-Sánchez, F. & Morales-
Sánchez, E. (2006). Microstructure of starch granule related to kernel hardness in corn.
Revista Fitotecnia Mexicana, 29, 135-139.
Gustin, J.L., Jackson, S., Williams, C., Patel, A., Armstrong, P.R., Peter, G.F. & Settles, A.M.
(2013). Analysis of maize (Zea mays) kernel density and volume using micro-computed
tomography and single-kernel near infrared spectroscopy. Journal of Agricultural and Food
Chemistry, 61, 10872-10880.
Stellenbosch University https://scholar.sun.ac.za

4
Hamilton, T., Hamilton, B.C., Johnson, B.C. & Mitchell, H. (1951). The dependence of the physical
and chemical composition of the corn kernel on soil fertility and cropping system. Cereal
Chemistry, 28, 163-176.
Janni, J., Weinstock, B.A., Hagen, L. & Wright, S. (2008). Novel near-infrared sampling apparatus
for single kernel analysis of oil content in maize. Applied spectroscopy, 62, 423-426.
Ji, Y., Wong, K., Hasjim, J., Pollak, L.M., Duvick, S., Jane, J. & White, P.J. (2003). Structure and
function of starch from advanced generations of new corn lines. Carbohydrate Polymers,
54, 305-319.
Johnson, D.Q. & Russell, W.A. (1982). Genetic variability and relationships of physical grain-quality
traits in the BSSS population of maize. Crop Science, 22, 805-809.
Lee, K.M., Herrman, T.J., Rooney, L.W., Jackson, D.S., Lingenfelser, J., Rausch, K.D., McKinney,
J., Iiams, C., Byrum, L., Hurburgh, J.C.R., Johnson, L.A. & Fox, S.R. (2007). Corroborative
study on maize quality, dry-milling and wet-milling properties of selected maize hybrids.
Journal of Agricultural and Food Chemistry, 55, 10751-10763.
Manley, M. (2014). Near-infrared spectroscopy and hyperspectral imaging: non-destructive
analysis of biological materials. Chemical Society Reviews, 43, 8200-8214.
Manley, M., Williams, P., Nilsson, D. & Geladi, P. (2009). Near infrared hyperspectral imaging for
the evaluation of endosperm texture in whole yellow maize (Zea mays L.) kernels. Journal
of Agricultural and Food Chemistry, 57, 8761-8769.
McClure, W.F. (2004). Review: 204 years of near infrared technology: 1800–2003. Journal of Near
Infrared Spectroscopy, 11, 487-518.
McGoverin, C. & Manley, M. (2012). Classification of maize kernel hardness using near infrared
hyperspectral imaging. Journal of Near Infrared Spectroscopy, 20, 529-535.
Osborne, B.G., Fearn, T. & Hindle, P.H. (1993). Practical NIR Spectroscopy with Applications in
Food and Beverage Analysis. Harlow, UK: Longman Scientific and Technical.
Peplinski, A.J., Paulsen, M.R., Anderson, R.A. & Kwolek, W.F. (1989). Physical, chemical, and dry-
milling characteristics of corn hybrids from various genotypes. Cereal Chemisty, 66, 117-
120.
Pomeranz, Y., Martin, C.R., Traylor, D.D. & Lai, F.S. (1984). Corn hardness determination. Cereal
Chemistry, 61, 147-150.
Robutti, J.L. (1995). Maize kernel hardness estimation in breeding by near-infrared transmission
analysis. Cereal Chemistry, 72, 632-636.
Robutti, J.L., Borras, F.S. & Eyherabide, G.H. (1997). Zein compositions of mechanically separated
coarse and fine portions of maize kernels. Cereal Chemistry, 74, 75-78.
Robutti, J.L., Hoseney, R.C. & Wassom, C.E. (1974). Modified opaque-2 corn endosperms. ll.
Structure viewed with a scanning electron microscope. American Association of Cereal
Chemists, 51, 173-180.
Stellenbosch University https://scholar.sun.ac.za

5
Sandhu, K.S. & Singh, N. (2007). Some properties of corn starches II: Physicochemical,
gelatinization, retrogradation, pasting and gel textural properties. Food Chemistry, 101,
1499-1507.
Seetharaman, K., Tziotis, A., Borras, F., White, P.J., Ferrer, M. & Robutti, J. (2001). Thermal and
functional characterization of starch from Argentinean Corn1. Cereal Chemistry, 78, 379-
386.
Sinka, I.C., Burch, S.F., Tweed, J.H. & Cunningham, J.C. (2004). Measurement of density
variations in tablets using X-ray computed tomography. International Journal of
Pharmaceutics, 271, 215-224.
Siska, J. & Hurburgh, C.R. (1995). Corn density measurement by near-infrared transmittance.
Transactions of the ASAE, 38, 1821-1824.
Spielbauer, G., Armstrong, P., Baier, J.W., Allen, W.B., Richardson, K., Shen, B. & Settles, A.M.
(2009). High-throughput near-infrared reflectance spectroscopy for predicting quantitative
and qualitative composition phenotypes of individual maize kernels. Cereal Chemistry, 86,
556-564.
Visser, M.J. (2011). Evaluation of malted barley with different degrees of fermentability using the
Rapid Visco Analyser (RVA). MSc Thesis. Stellenbosch: University of Stellenbosch, South
Africa,
Watson, S.A. (1987). Structure and Composition. In: Corn Chemistry and Technology (edited by
S.A. Watson & P.E. Ramstad). Pp. 53-82. St. Paul, Minnesota, USA: American Association
of Cereal Chemists, Inc.
Williams, P., Geladi, P., Fox, G. & Manley, M. (2009). Maize kernel hardness classification by near
infrared (NIR) hyperspectral imaging and multivariate data analysis. Analytica Chimica
Acta, 653, 121-130.
Wu, Y.V. (1992). Corn hardness as related to yield and particle size of fractions from a micro
hammer-cutter mill. Cereal Chemistry, 69, 343-347.
Yamin, F., Lee, M., Pollak, L. & White, P. (1999). Thermal properties of starch in corn variants
isolated after chemical mutagenesis of inbred line B73 1. Cereal Chemistry, 76, 175-181.
Zhu, L.J., Dogan, H., Gajula, H., Gu, M.H., Liu, Q.Q. & Shi, Y.C. (2012). Study of kernel structure
of high-amylose and wild-type rice by X-ray microtomography and SEM. Journal of Cereal
Science, 55, 1-5.
Stellenbosch University https://scholar.sun.ac.za

6
Chapter 2
Literature Review
Introduction
Kernel hardness is an important quality feature of maize (Zea mays L.) and has been thoroughly
studied in the pursuit of understanding this characteristic better. An attempt of providing a snap
shot of the existing body of knowledge on the topic of maize hardness is presented in the literature
review chapter in a format where factors that influence maize hardness are discussed, followed by
the factors that are affected by maize hardness. The proportion in which the different endosperm
types are present in maize, as well as environmental and postharvest influences, are seen as the
factors that determine maize hardness. On the other hand, maize hardness affects storage and
handling, as well as the milling process. A comparison of the different hardness methods are given,
with discussion based on the different approaches, i.e. resistance to breakage, chemical analysis,
physical analysis, indirect tests, less common methods, direct and time consuming methods, as
well as micro-milling and a multivariate approach. X-ray micro-computed tomography is discussed
as a relatively new analytical tool in cereal science. Lastly, statistical methods, both univariate and
more advanced multivariate data analysis techniques, are addressed.
Factors that affect maize hardness
Maize hardness is determined and/or influenced by the compositional, morphological and
environmental factors associated with the respective kernels. The effects these factors have on
maize kernel hardness are addressed in this section.
Endosperm types
Maize kernels consist of, amongst others, two types of endosperm: i.e. vitreous and floury
endosperm. It is the ratio in which these endosperm types are present that determines whether a
kernel is hard or soft (Watson, 1987; Paiva et al., 1991; Delcour & Hoseney, 2010). The biggest
part of a maize kernel (80 – 84%) comprises of these endosperm cells, which can either be of the
harder vitreous type or the softer floury type. The harder and more translucent endosperm is
situated to the outside of the kernel and the softer and mealy textured endosperm is found in the
center of the kernel (Fig. 2.1) (Wolf et al., 1952; Watson, 1987; Lee et al., 2006; Delcour &
Hoseney, 2010).
The vitreous endosperm is tightly compacted and kept together with a thick continuous protein
matrix (Fig. 2.2a). The vitreous endosperm cells are also polygonal shaped and there are few or
no air spaces present (Fig. 2.2a), therefore appearing translucent when emitted with light (Gaytán-
Martínez et al., 2006; Lee et al., 2006). In the soft endosperm (Fig. 2.2b) starch granules are
spherical and covered with a protein matrix that is thinner than that of the vitreous endosperm and
Stellenbosch University https://scholar.sun.ac.za

7
that shrinks easily, consequently no longer completely covering the starch granules (Gaytán-
Martínez et al., 2006; Delcour & Hoseney, 2010). The floury endosperm is thus not as tightly
packed as the vitreous endosperm (Delcour & Hoseney, 2010). Due to the small air pockets
around the starch granules, the light is reflected and the endosperm appears opaque.
Figure 2.1. A longitudinal digital image (Canon EOS 300D digital camera, fitted with a Canon 30 – 80 mm
lens) of a maize kernel, depicting the internal structure of the maize kernel, i.e. floury and vitreous
endosperm, germ and pedicle.
Watson (1987) proposed that the ratio of the endosperm types present, were genetically
inherited with that of the vitreous endosperm linked to the zein composition and the floury
endosperm in turn produced by recessive genes. The zein composition refer to protein bodies that
function as the storage protein (prolamin proteins) (Fig. 2.2c) (Delcour & Hoseney, 2010). Four
classes of zein bodies have been identified: alpha (α), beta (β), gamma (γ), and delta (δ) (Lending
& Larkins, 1989). It is generally agreed that there is a relationship between vitreous and floury
endosperm and the proportion of zein types present in each (Paiva et al., 1991; Dombrink-
Kurtzman & Bietz, 1993; Eyherabide et al., 1996; Mestres & Matencio, 1996; Robutti et al., 1997;
Chandrashekar & Mazhar, 1999; Lee et al., 2006). It is thus apparent that maize kernels will
develop with a specific ratio of vitreous and floury endosperm depending on the genetic code of
that hybrid of maize (Erasmus, 2003).
Recently, it has been reported by Manley et al. (2009) that a third type of endosperm exists that
differs from the vitreous and floury endosperm in terms of chemical composition and physical
properties. O’Kennedy referred to this endosperm as the transition phase (O'Kennedy, 2011) and
it might be similar to the region referred to as “the junction” by Dombrink-Kurtzman (1994).
Floury endosperm
Vitreous endosperm
Germ
Pedicle
Stellenbosch University https://scholar.sun.ac.za

8
(a)
(b)
(c)
Figure 2.2. Scanning electron microscopy (SEM) micrographs (LEO1430 VP, Zeiss, Germany) (4500X) of
(a) tightly packed polygonal shaped starch granules from vitreous endosperm covered in a thick protein
matrix, (b) loosely packed irregularly shaped starch granules from floury endosperm covered with a thin
protein matrix and (c) protein (zein) bodies (inside dashed oval) visible.
Stellenbosch University https://scholar.sun.ac.za

9
Kernel morphology
Apart from the endosperm, a maize kernel also consists of a hull and a germ (Wolf et al., 1952).
The hull (or bran) includes the pericarp and the seed coat (testa) and is roughly equivalent to 5 -
6% of the weight of the kernel (Wolf et al., 1952; Delcour & Hoseney, 2010). The seed coat lies
inside the pericarp and covers the entire kernel except the base (or tip cap or pedicle), which is
covered by the hilar layer (Wolf et al., 1952). The germ (embryo) is embedded in the lower portion
of the endosperm and comprises about 10 – 14% of the weight of the kernel (Wolf et al., 1952;
Watson, 1987). The scutellum functions as a nutritive organ for the embryo (Watson, 1987) and
the plumule will form the vegetative part of the plant.
Where the endosperm is comprised mainly of starch and protein, the germ does not have
starch; it is high in oil, protein, soluble sugars and hormones (Serna-Saldivar, 2010). All cells of
the germ and scutellum are potentially metabolically active upon hydration (Watson, 1987). Refer
to Figure 2.3 for a schematic representation of the morphology of a maize kernel. Note that the
vitreous endosperm is presented as horny endosperm in this figure.
Figure 2.3. Schematic representation (Anon., 1996) of the layers and structures of a maize kernel.
The classes of maize (flint, flour, dent, sweet and pop) differ according to the physical shape of
the kernels, as well as the structures of the individual components, and thus have an effect on
maize hardness (Fox & Manley, 2009). Although flint and dent maize kernels are both
intermediate with respect to their vitreous to floury endosperm ratio of about 2:1 (Wolf et al., 1952),
dent maize is generally softer than flint maize (flint kernels are long and flat, whereas dent kernels,
are short and flat) (Fig. 2.4) (Fox & Manley, 2009). Pop maize kernels are round and short with a
large portion of vitreous endosperm, and flour maize has predominantly floury endosperm. South
African white maize falls within the dent maize class (dent maize is a derivative of flint-flour
crosses) (Watson, 1987).
Stellenbosch University https://scholar.sun.ac.za

10
Figure 2.4. Front white cob is that of flint maize with the characteristic long and flat kernels, whereas the two
maize cobs at the back of the picture are dent maize with short and flat kernels.
Environmental and postharvest factors
Even though maize hardness is mainly a genetic trait, another factor that has an effect on maize
hardness, is the environment in which the crop is grown (Fox & Manley, 2009). This takes the soil
nutrient profile into account, as well as the available moisture and environmental conditions prior to
and during grain filling (Fox & Manley, 2009). It has been proven that nitrogen fertilisers greatly
impact the final protein content of maize, and thus increase the vitreousness and hardness (Duarte
et al., 2005). Lee et al. (2012) conducted a genotype by environment interaction (G x E) study
where they included environmental effects, correlations among quality parameters and genetic
effects at the same time as they examined maize breeding crosses. They concluded that the
correlations among the kernel quality traits were influenced both by hybrid type and environment.
Another G x E study has been done by Robutti et al. (2000) on Argentinian hybrids. They had
access to the Pergamino Maize Germplasm Bank where samples of more than 2500 localities
were stored, as collected since the 1960’s throughout Argentina. Correlating the kernel hardness to
starch content was of great importance to their study and an inverse association between hardness
and starch was indicated. They recognised other, more subtle, factors than the obvious factors
such as thermal and storage history, and moisture content, to also affect kernel hardness (Robutti
et al., 2000).
Along with environmental factors, the manner in which the maize has been handled after
harvesting can also influence the hardness thereof. Factors such as storage conditions, microbial
infestation and germination are of importance (Peplinski et al., 1989). A study by Peplinski et al.
Stellenbosch University https://scholar.sun.ac.za

11
(1989) reflected that the temperature used to dry (air temperatures from 25 to 60°C) maize kernels,
greatly influenced the hardness thereof (seen by the increase in stress-cracked kernels and
breakage susceptibility).
Factors affected by maize hardness
Currently, the factors that influence maize hardness have been discussed. It is just as important to
understand how parameters, such as storage, handling and transport, as well as milling, can be
affected by maize hardness. It should be clear from this section that the dry-milling industry would
benefit from the inclusion of hardness parameters into the grading regulations. This would ensure
the segregation (separate storage) of maize differing in hardness and would potentially assist the
milling industry with respect to end product quality and milling performance.
Storage, handling and transportation
When looking at storage performance of maize, the harder kernels tend to store better than the
softer kernels. This is also the case for handling and transportation, probably due to the limited
breakage susceptibility as little or no stress cracks are present in hard maize compared to soft
maize (Dorsey-Redding & Johnson, 1991; Lee et al., 2007). Often maize is handled many times
from harvest to end user, especially when exported, and the preferred maize is those resistant to
breakage during handling as it results in better quality upon arrival at the destination (Mestres et
al., 1991; Wu, 1992; Lee et al., 2006). Storage time is reduced with increased cracked kernels as
these are more prone to increased moisture uptake and insect and mold infestation, and therefore
reduced quality (Fox & Manley, 2009). The loss of economic value due to lower grading and less
compensation is also a very important factor to consider as maize is not only a food and feed
commodity, but also an export commodity (Peplinski et al., 1989).
Wet-milling
The United States of America’s main use of maize is for the production of ethanol and it entails the
fermentation of the maize that is extracted during the wet-milling process (Hespell, 1998; Voca et
al., 2009). The hybrids planted for this purpose differ greatly from the South African hybrids as
maize used for bio-fuel production contains large portions of floury endosperm and not significant
amounts of vitreous endosperm. By-products from this process include protein (gluten meal), oil,
germ meal, maize fiber (hulls or bran) and steep liquor (Hespell, 1998). Softer kernels perform
better (Lee et al., 2007) as they require less steeping and gives better starch-protein separation
(Wu, 1992). The production of bio-fuel from maize is not yet widely practiced in South Africa.
Dry-milling
Maize meal is the main product of the dry-milling process. This process entails the removal of the
germ and pericarp from the maize kernels during a de-germing process (Serna-Saldivar, 2010).
Stellenbosch University https://scholar.sun.ac.za

12
With the addition of water (conditioning step) the germ and pericarp is softened and easily
removed (Serna-Saldivar, 2010). The endosperm that is obtained, is subjected to grinding and
sieving (Watson, 1987). A series of mills with different roller gaps results in fractions with different
particle sizes (Serna-Saldivar, 2010). Based on particle size, the isolated endosperm is reduced
by sifting into predetermined classes (Watson, 1987). In dry-milling, a high yield of pure
endosperm grits are desirable (Chiremba et al., 2011).
There are 18 grades of maize products for sale in South Africa (Anon., 2008): i.e. fine maize
bran, fine crushed maize, sifted maize meal, sifted crushed maize, coarse maize bran, mixed
maize meal, maize rice, maize grits, maize flour, maize germ meal, No. 1 straightrun maize, No. 2
straightrun maize, unsifted crushed maize, unsifted maize meal, unspecified maize product, special
maize meal, super maize meal and maize samp. To be graded special or super maize meal, the
fineness by mass must fall within the following parameters: for super at least 90% shall pass
through a 1.4 mm sieve and less than 90% shall pass through a 300 µm sieve; for special at least
90% shall pass through a 1.4 mm sieve (Anon., 2008). This results in super maize meal having a
particle size distribution of 0.3 – 0.65 mm and for special maize meal 0.17 – 0.3 mm (Erasmus,
2003). The grit size of maize meal influences the porridge stickiness and texture (Bello et al.,
1995).
Maize hardness determinations: a comparison of different test methods
In an attempt to measure maize hardness, many diverse test methods have been established.
Some of the methods test resistance to breakage, others test the chemical or physical composition
of the kernels. Different hardness methods are mentioned and compared in this section.
Resistance to breakage
There are two types of mechanical breakage tests: the type that uses the impact of a moving
blade (Stein breakage tester); and the other type that uses centrifugal impaction of individual
kernels against a stationary surface (Wisconsin breakage tester (Paulsen & Hill, 1985; Mestres
et al., 1991). Hard kernels have lower breakage susceptibility than soft kernels (Paulsen & Hill,
1985). Not surprising, breakage susceptibility has been found to be strongly correlated (R2 = 0.99)
to stress crack percentage (Paulsen & Hill, 1985). This is in accordance to the study of Peplinski
et al. (1989) where elevated drying temperatures resulted in an increase in stress-cracked kernels
and subsequent breakage susceptibility.
Chemical analysis
Chemical analyses that are associated with maize hardness, are the determination of dry matter
(residue weight after heating), ash content (residue weight after incineration) and lipid and
nitrogen content (Mestres et al., 1991). The analysis of protein (as the variation in zein-classes
cause variation in hardness (Robutti et al., 1997) starch, moisture and fiber are also associated
Stellenbosch University https://scholar.sun.ac.za

13
with maize hardness (Blandino et al., 2010). Correlations that seem to be agreed upon between
Blandino et al. (2010) and Mestres et al. (1991) are those between vitreousness and ash content,
as well as density. Contradictory results are regularly found between kernel hardness and protein
content. Mestres et al. (1991) found these factors to correlate, whereas Delcour & Hoseney (2010)
agreed with Paulsen and Hill (1985) that hardness and protein content did not correlate. Robutti et
al. (2000) found no significant correlation between protein content and kernel hardness. The
inconsistency of results with respect to the association between hardness and protein, suggests
that protein methods differ greatly and that specific types of proteins should be tested, individually.
Phenolic acids were quantified in maize bran, using high performance liquid chromatographic
and mass spectrometric techniques, and it was shown that harder maize hybrids had more
phenolic acids than softer maize hybrids (Chiremba et al., 2012). The process of chemical
bonding, through cross linking of compounds within plant cell walls, can be explained as the
mechanism by which phenolic acids may influence maize hardness (Chiremba et al., 2012).
Furthermore, this study suggested that a correlation existed between phenolic acid content and the
TADD method, which expressed kernel physical properties (Chiremba et al., 2012). Due to the
negative correlation, it was implied that hybrids with low phenolic acid content would break more
easily than hybrids with a higher phenolic acid content (Chiremba et al., 2012).
Physical analysis
Test weight, thousand kernel weight and sphericity calculated from measurements of three
dimensions (length, width and depth) and kernel density are examples of physical traits of maize
kernels, influencing maize hardness (Lee et al., 2006; Blandino et al., 2010). Abrasiveness is
another similar method, measured using the tangential abrasive dehulling device (TADD)
(Wehling et al., 1996) where the remaining material is weighed after a set time of abrasion. This
method results in a TADD index % that reveals kernel hardness. Lee et al. (2006) also used the
TADD method when they assessed biochemical properties of maize and found it to have strong
association with amylose content (r = 0.89, P < 0.01). Chiremba et al. (2012) did not only indicate
phenolic acid content as an indicator of maize hardness, but also showed that the ferulic acid
content was strongly correlated with TADD hardness (r = -0.78, P < 0.001).
Paulsen and Hill (1985) differentiated between incoming maize quality factors and dry-milling
quality factors. For the incoming maize quality factors they made use of physical tests i.e. test
weight and percentage floaters (density measurements). As both these factors are indicators of
density, the results showed, not surprisingly, significant (P < 0.05) correlation (r = 0.99) between
floating test results and test weight. This is in agreement with the conclusion drawn by Kirleis and
Stroshine (1990) that a combination of test weight and kernel density are the best predictors of
milling quality. Most density related studies used pycnometry as a measure of density (Wu, 1992;
Lee et al., 2006), but the floating test is also well used (Paulsen & Hill, 1985; Gaytán-Martínez et
al., 2006; Blandino et al., 2010), as well as displacing a volume of water (Gaytán-Martínez et al.,
Stellenbosch University https://scholar.sun.ac.za

14
2006). The study by Gaytán-Martínez et al. (2006) indicated that both density measurements
significantly (P < 0.05) correlated with hardness (r = -0.74 for the floating test and r = 0.69 for water
displacement ). Blandino et al. (2010) modified the floating test to obtain density results in the form
of an area beneath a precipitation curve. This research group found the floating test to be
significantly (P < 0.05) related to physical kernel characteristics observed by methods such as test
weight (r = -0.89), the coarse over fine ratio (r = -0.93) and the Stenvert test (r = -0.70). But
according to them, the test weight method is the simplest estimator of maize hardness and should
be the first parameter to consider when determining maize hardness (Blandino et al., 2010).
When interpreting density results, it should be noted that cracks and fissures can be present in
kernels, mainly due to dehydration, which in turn lowers kernel density. Wu (1992) cautions that
density results must be reported in combination with breakage susceptibility results.
Gaytán-Martínez et al. (2006) strongly expressed their viewpoint that physical traits, such as
density, starch granules size and crystallinity are as important descriptors of maize hardness as
that of the chemical composition of the maize. In their study, granule size and crystallinity were
measured with scanning electron microscopy and an X-ray diffractometer, respectively. They found
a positive correlation (r = 0.69) between hardness and density, as well as starch granule size and
endosperm (r = 0.44), which contributed towards the description of the microstructure of the
endosperm (Gaytán-Martínez et al., 2006)
The particle size index (PSI) is a method that involves milling and sieving and although it is
often used as a hardness method, Wu (1992) warns that the relatively high oil content present in
maize may cause agglomeration which will conceal differences in particle size. For Blandino et al.
(2010) the coarse-over-fine ratio (c/f), derived from the respective fractions obtained using this
method, was the best descriptor of maize milling ability when using a sieve size of 2 mm. This c/f
correlated better with milling quality than the floating test, test weight, the Stenvert test, sphericity
and texture analysis, probably due to the clear evaluation of the vitreous (hard) and floury (soft)
fractions (Blandino et al., 2010).
Indirect tests
Near infrared spectroscopy
Near infrared (NIR) reflectance and transmittance spectroscopy are examples of indirect testing
methods of maize hardness. These spectroscopic methods are non-destructive and can be
calibrated against an unlimited choice of reference methods. The use of Fourier transform near
infrared (FTNIR) spectroscopy has shown increased spectral reproducibility and wavelength
precision and is thus a preferred technology in many types of analyses (Rotar et al., 2009). In
combination with chemometric techniques the analysis of materials can be achieved, without time-
consuming practices such as sample preparation.
In past studies, NIR transmittance spectra were obtained from whole maize kernels
(wavelengths between 850 and 1050 nm) and after data analysis only the absorbance values at
Stellenbosch University https://scholar.sun.ac.za

15
860 nm were used to measure kernel hardness, as this wavelength depicted particle size
differences (Robutti et al., 2000; Lee et al., 2006). In other studies, a wider wavelength range was
used (1000 to 2500 nm) to obtain reflectance spectra of whole kernels. A study by Orman &
Schumann (1991) predicted protein, oil and starch content, whereas a study by Berardo et al.
(2005) predicted kernel rot and mycotoxin infected kernels. With respect to milled samples, two
wavelengths are of interest (1680 and 2230 nm) as they do not carry any chemical information and
reflectance varies only with regards to particle size difference Downey et al. (1986).
Besides spectral absorbance differences found when scanning intact (whole) kernels versus
ground samples, the scanning of bulk (multiple) maize samples are found to be less complicated
compared to that of single maize kernels. Single kernel applications are far less common than
that of bulk calibrations. This is due to the non-uniformity found within maize kernels as a result of
the relatively large portion of germ present (Spielbauer et al., 2009). Some researchers collect
spectra from only the germ-down side of a kernel (Baye et al., 2006), while others overcome the
obstacle by developing sampling systems, such as that by Janni et al. (2008) that uses an
airstream to tumble the individual kernels during spectral acquisition. In doing so, an average
reflectance spectrum is obtained over the whole kernel surface. Armstrong (2006) and Baye et al.
(2006) developed systems that collected the spectra as the kernels fell through glass tubes. Other
single kernel applications include that of Pearson et al. (2001) and Dowell et al. (2006) where a
probe was attached to the respective spectrophotometers. In the study by Pearson et al. (2001),
aflatoxin concentration was predicted for single kernels with a 95% classification accuracy as
containing either high (> 100 ppb) or low (< 10 ppb) levels of aflatoxin. Whereas, in the study by
Dowell et al. (2006), fumonisin was detected on single maize kernels showing spectroscopy to be a
useful tool for screening samples for online detection.
A new portable instrument, namely the microNIR (JDSU Corporation, Santa Rosa, CA, USA)
has recently been introduced as a qualitative and quantitative analytical tool when applied to
pharmaceuticals by Alcala et al. (2014). This device differs from conventional NIR
spectrophotometers in that it is small (weight of only 60 g), hand-held and fitted with a linear
variable filter (LVF) technology as monochromator (O'Brien et al., 2012; Alcalà et al., 2014). This
instrument can be used in reflectance as well as transmission mode and can be applied for single
kernel applications.
Near infrared hyperspectral imaging
A hyperspectral imaging system integrates conventional imaging and spectroscopy to produce a
three-dimensional (spatial and spectral) hypercube from an object (Schweizer & Moura, 2001;
Grahn & Geladi, 2007). Hyperspectral imaging is also called chemical or spectroscopic imaging or
mapping, and is thus a technique that generates a spatial map of spectral variation (Sun, 2010). As
explained by Burger (2006), spectral prediction or processing results can be mapped back to a
Stellenbosch University https://scholar.sun.ac.za

16
spatial location thereby demonstrating a major advantage (spatial information) of this
spectroscopic technique.
As a single hyperspectral image with 256 x 320 pixels and 128 wavelength channels contains
over ten million data values, simple multivariate statistical analysis are inadequate and need to be
enhanced and adapted for these large data sets. These chemometric techniques will be discussed
in a later section of this chapter.
Near infrared hyperspectral imaging (NIR-HSI) has been used to distinguish between individual
maize kernels differing in hardness (Manley et al., 2009; Williams et al., 2009). It was also shown
that NIR HSI could be used to classify maize kernels into hardness classes without the need for
hardness reference data (McGoverin & Manley, 2012).
Other indirect tests
As studied by Pomeranz et al. (1985), reporting the grinding time of maize could also be a good
method to estimate maize hardness. Another method described by Pomeranz et al. (1985) is that
of the Stenvert test. This method is based on the measurement of the power consumption utilised
during the milling process and the results are expressed as total milling energy and milling time
(Blandino et al., 2010). Li et al. (1996) also used the Stenvert test to derive hardness properties
and found sound correlations with the vitreous to floury endosperm ratio. Principal component
analysis revealed that milling energy and resistance time were the most effective parameters to
asses grain hardness, and both these variables also correlated strongly with the vitreous to floury
endosperm ratio (Li et al., 1996).
Less common methods
Compression and pearling (Tran et al., 1981) are two less common methods used to determine
maize hardness. The first method involves textural properties and will be discussed shortly with
reference to a study by Gaytan-Martinez et al. (2006) whereas the latter refers to a study where a
barley pearler and a disk grinding mill was modified to record torque and energy during pearling
and grinding (Tran et al., 1981). Pearling resistance (torque) measures the resistance of a train to
pearl and hard kernels ultimately result in higher resistance than soft kernels (Tran et al., 1981).
The relevance of this study was shown by the changes observed in hardness along with moisture
content in maize kernels (Tran et al., 1981). In the study by Gaytan-Martinez et al. (2006) they
established a relationship between microstructural properties of maize kernels and physical
variables (i.e. density), because they interpreted maize hardness more as a textural property.
These researchers used a texture analyser to puncture maize kernels at their vitreous endosperm
region to a depth of 2 mm. Blandino et al. (2010) also recognised the use of a puncture test as a
method that has the potential for measuring single maize kernels’ hardness.
Stellenbosch University https://scholar.sun.ac.za

17
Almeida-Dominguez et al. (1997) estimated maize hardness based on the viscosity of ground
maize samples, using the Rapid Visco Analyser (RVA). Using this viscometric procedure the
thermal and rheological properties of a milled grain sample are provided, which in turn provide
valuable information about the functionality thereof (Narváez-González et al., 2006). RVA detects
the changes in viscosity (pasting properties) of starches i.e. the viscosity developed during
hydration and subsequent gelatinisation of starch granules during heating and stirring in excess
water (Almeida-Dominguez et al., 1997). Other researchers (Yamin et al., 1999; Seetharaman et
al., 2001; Ji et al., 2003; Sandhu & Singh, 2007) also observed differences in pasting properties
between different maize hybrids, although they did not specifically link the results to maize
hardness, but rather to starch and functional properties. The rationale behind hardness
discrimination, using RVA, is as follows:
hard maize has mainly coarse particles when milled, and soft maize smaller particles
(Almeida-Dominguez et al., 1997);
coarse particles have slower water diffusion, limited swelling of the starch granules and
slow viscosity development (Sahai et al., 2001; Narváez-González et al., 2006);
smaller particles have bigger surface areas that result in better and more rapid
hydration, thus better gelatinisation and higher viscosity (Almeida-Dominguez et al.,
1997);
hard kernels show a more prominent protein-to-starch adhesion effect compared to soft
kernels and require more time to gelatinise (Almeida-Dominguez et al., 1997); and
the protein matrix of vitreous (hard) endosperm is thicker than that of floury (soft)
endosperm (Wang & Eckhoff, 2000) and forms a barrier that slows hydration and
gelatinisation (Narváez-González et al., 2006).
For each RVA test the viscosity (cP), temperature (°C), speed (rpm) and the heat-cool ratio are
recorded every four seconds. The resulting curve, reporting the viscosity as a function of time
(sometimes together with the temperature ramp, to improve interpretation), is called a viscogram
as shown in Figure 2.5. Hard kernels thus reached peak viscosities sooner than soft kernels, but
have lower peak viscosity times (Almeida-Dominguez et al., 1997; Seetharaman et al., 2001;
Narváez-González et al., 2006).
Direct and time consuming methods
A few researchers (Dombrink-Kurtzman & Knutson, 1997; Gaytán-Martínez et al., 2006) separated
parts of the maize kernel, in order to weigh and calculate respective percentages (usually of the
pericarp, endosperm and germ). Mestres et al. (1991) also acknowledged that the cross-secional
areas of the endosperm types, vitreous and floury, could be measured, but Blandino et al. (2010)
did not agree with the practicality of this method, although they also went through this tedious
process of hand dissection.
Stellenbosch University https://scholar.sun.ac.za

18
Figure 2.5. A Rapid Visco Analyser (RVA) viscogram (Agu et al., 2006).
Mestres et al. (1991) found that vitreousness (as determined through hand-dissection) is not
relevant for the prediction of dry-milling performance. It should have been significantly correlated
with semolina recovery, a procedure similar to chop recovery, but it was not. In their study, ash
content and sphericity explained most of the variation in semolina yield (Mestres et al., 1991). In a
prior study Paulsen and Hill (1985) found that tests for density and floaters usually correlate highly
with the ratio of vitreous-to-floury endosperm.
Similar methods include the calculation of the percentage vitreousness by measuring the area
from an enhanced photograph (Mestres et al., 1991), or digital image analysis as in the study by
Erasmus and Taylor (2004) who also used a light box to visually assess the endosperm types.
Micro-milling
To acquire an index of dry-milling performance, micro-milling can be considered as the total grit
yield corresponding to the main products obtained in the conventional dry-milling industry
(Blandino et al., 2010). A micro-milling method novel to South Africa is the Roff Milling method,
with the results known as the Milling Index (MI). The Southern African Grain Laboratory (SAGL)
applies this method, along with kernel whiteness and size tests, to assess milling performance. A
roller mill system brakes the maize up into meal and bran fractions which are used to calculate the
MI (Erasmus & Taylor, 2004). Van Loggerenberg and Pretorius (2004) used this method to
develop a NIR transmittance calibration for whole grain predictions. These calibrations have in
turn been used by Chiremba et al. (2011) for their characterisation of maize hardness.
Stellenbosch University https://scholar.sun.ac.za

19
Multivariate approach
A sensible summary to this section on different hardness methods, is to make reference to the
conclusion of Blandino et al. (2010) where they described kernel hardness as a combination of
physical and chemical characteristics and also state that there is no single method that describes
dry-milling behaviour. They propose the use of a multivariate approach to take various properties
into consideration. A multivariate approach was also followed by Chiremba et al. (2011) where
principal component analysis revealed that a combination of TADD hardness and NIR Milling
Index, or TADD hardness and test weight could be used to describe maize hardness.
A very useful summary (Table 2.1) of maize hardness testing methods used in Southern
Africa, and their relevance to end-use quality, was published by Chiremba (2011). In this study it
was found that TADD and test weight correlated (r = -0.64), as well as TADD and NIR
transmittance (r = -0.66), and that the other hardness methods did not show any useful correlation.
Two methods that are not depicted in Table 2.1 for maize hardness determination, are RVA and X-
ray micro-computed tomography. Both these methods were used in the current study. Literature
on the latter method will be reviewed in the following section.
Table 2.1. Simple methods used in Southern Africa for maize grain quality evaluation, their advantages,
disadvantages and applicability (Chiremba et al., 2011)
Method Parameter/quality indicator measured
Advantages Disadvantages Applicability
Test weight Test weight per bushel or kg.hL-1
Grain density Inexpensive device, low maintenance cost, rapid, high repeatability and reproducibility, non-destructive method
Affected by grain packing in measuring apparatus, moisture content, kernel shape, broken kernels and foreign material, not suitable for early generation breeding
Applicable to breeding programs and cultivar evaluation with limited grain sample size, rapid test on dockage for commercial large and small- scale milling plants and grading for grain marketing
Thousand kernel weight (g)
Grain size and grain density
High repeatability and reproducibility, non-destructive indirect measure of grain density
Time consuming if done manually (without a seed counter)
Suitable for breeding programs with limited grain sample size. Also applicable in commercial grain quality control and processing, both large and small-scale
Abrasive Decortication Tangential Abrasive
Ease of grain to be abraded- indirect measure of grain hardness and
TADD is robust, high repeatability and reproducibility,
The abrasive disk may be worn out with the time and vary milling yields
Potential use at commercial level (both small and large scale),
Stellenbosch University https://scholar.sun.ac.za

20
Dehulling Device (TADD)
milling quality low maintenance cost, equipment can be manufactured locally
although this can be monitored with the use of a standard sample of known yield
the multi-cup sample holder allows several samples to be decorticated simultaneously within a short time (5 to 10 min)
Stress cracks Light box
Proportion of grain with cracks and number of cracks
Apparatus cheap to set up, stress cracks may be quantified using the Stress Crack Index
Stress crack counting tedious and time consuming and to a degree subjective
Time consuming for routine analysis, but suitable for small sample size
Stein breakage susceptibility
Susceptibility of grain to break under stress
Allows quantification of the potential of grain to break, rapid analysis (4 min)
Apparatus is no longer manufactured, although other mills may be used
Suitable for commercial grain evaluation, destructive, could have limited use in breeding programs where grain sample size is limiting
Milling Index Near Infrared (NIR)Transmittance spectrometry
Grain milling quality
Automated and rapid analysis once a calibration is developed, calibration can be used by other users, non-destructive method
Requires calibration against physical or chemical data which could be time consuming and costly, very sensitive to sample preparation affecting precision and accuracy, high initial cost to purchase the instrument and operating software, regular software and service upgrade required, requires a relatively large grain sample size (approx. 500 g), limited use in breeding programs where grain sample size is limiting
Rapid for online processing at commercial milling plants and routine analysis in breeding programs and cultivar evaluation, skilled technical maintenance required, use could be limited to well established institutions; not economically appropriate for small-scale grain quality control and processing.
Kernel size: Set of sieves and sieve shaker
Kernel size Analysis is relatively cheap, non-destructive, direct measure of kernel size, does not require a large grain sample size
Can be time-consuming especially if batches are very heterogeneous in terms of kernel size
Due to lengthy analysis time, it is not applicable in commercial grain quality analysis, applicable in research laboratories
Stellenbosch University https://scholar.sun.ac.za

21
X-ray micro-computed tomography scanning
The first use of X-rays was not for a medical application, but to produce a radiograph of a set of
weights in a box. In later years (1907) John Radon generated the mathematical transformation
algorithms that was later utilised to produce 3D reconstructed images from the X-ray scans (De
Beer, 2005). A South African born American physicist, Alan M. Cormack, developed the diagnostic
technique of computerised axial tomography (CAT) scanning in the 1970s (and received the Nobel
Prize for Physiology in Medicine in 1979) (De Beer, 2005). This work of Cormack was further
developed into X-ray computed tomography (CT), utilising the basic principles of CAT scanning
(De Beer, 2005).
X-rays have a wavelength in the range of 0.01 to 10 nm, corresponding to frequencies from 30
to 30 000 Pentahertz and energies ranging from 120 eV to 120 keV (Kotwaliwale et al., 2011).
These are short electromagnetic waves and when they interact with matter, they behave like both
particles (energy bundles, i.e. photons) and waves (Kotwaliwale et al., 2011).
X-ray micro-computed tomography (µCT), or high-resolution CT, is a recent method that found
use for the inspection of materials in many applications and settings (Singhal et al., 2013).
Information is gained of the micro-architecture or micro-structure of these materials, which leads to
a better understanding of their performance or functionality (Singhal et al., 2013). The high
resolution (up to 300 nm) obtained, allows for the visualisation of fine-scale features (Singhal et al.,
2013). The data from the µCT results in a virtual rendering of the object under investigation, which
allows one to travel through the volume in any direction and angle, revealing complex hidden and
inaccessible structures within the object (Brunke, 2010; Singhal et al., 2013).
The instrument
The fundamental components of any CT instrument, as seen in Figure 2.6 are (1) penetrating
ionising radiation (X-ray radiation when using X-ray µCT), (2) a sample manipulator and (3) a
detector (Duliu, 1999). The sample manipulator (or translation table) positions the sample in the
path of the radiation beam and rotates it through a specific angle (usually 360°). The detector
converts the attenuated radiation, which passes through the sample along a straight line, into a 2-D
digital image, called a radiograph.
A radiograph
An X-ray radiograph image is essentially a map of the linear attenuation coefficient of every point in
the sample (Singhal et al., 2013). The radiograph consists of different scales of grey, depending
on the different magnitudes of attenuation by the sample and components within the sample
(Schena et al., 2007). For 2-D visualisation, X-ray densities are mapped from black (low X-ray
density = background) to white (high X-ray density = material). Therefore, a higher density phase
appears brighter and is distinguishable from a lower density material.
Stellenbosch University https://scholar.sun.ac.za

22
Figure 2.6. The fundamental components of any computed tomography instrument.
X-ray attenuation (µ) follows an exponential relationship with the incoming and outgoing X-rays
from the sample. Differentiation of features within the sample is possible because of this linear
attenuation coefficient that depends directly on the electron density (effective atomic number (Z) of
the material comprising the sample) and the energy of the X-ray beam (E) (Lin & Miller, 2002).
A linear relationship exists between the sample-to-focal spot distance as a function of the voxel
size achieved (Singhal et al., 2013). Depending on the specific instrument used, the largest
diameter and height of the object that can be imaged is 300 mm x 400 mm. The tube power
(accelerating voltage x filament current) for any image acquisition is limited by the voxels size,
because the tube has a focal spot size that dynamically increases with power. A focal spot size
larger than the voxel size results in blurring of the pixels in the CT image (Singhal et al., 2013).
Therefore, for higher density objects, a lower resolution may be seen if a greater power penetration
is required.
Reconstruction into a 3-D volume
Filtered back-projection algorithms are used to reconstruct the 3-D image volumes from the
acquired 2-D data sets. Through this process a 3-D digital virtual volume of the sample is created
from the series of radiographs through tomographic reconstruction (Schena et al., 2007), as
illustrated in Figure 2.7.
For a cone beam back-projection geometry, the reconstruction process requires that a whole 3-
D data set is acquired within only one rotation of the sample (Lin & Miller, 2002). The projections
displayed by the detector are proportional to the amount of radiation reaching the detector (Lin &
Miller, 2002). Imaging is accomplished with a cone beam, providing a geometric magnification at
the detector. For 3-D visualisation, the background will be rendered transparent, showing the
material opaque white.
Stellenbosch University https://scholar.sun.ac.za

23
Figure 2.7. Schematic representation of tomographic reconstruction from 2-D to 3-D.
Analysis of the 3-D volume
Techniques to analyse µCT data sets are available in dedicated software packages such as
VGStudio MAX software (Volume Graphics GmbH, Heidelberg, Germany). The measurement of
specific areas or regions-of-interest (ROIs) can be accomplished by using a region grower tool that
identifies voxels belonging to a selected grey value interval. In an example where the contact area
of a thread from a capped bottle had to be measured, a ROI was created for the bottle (seen as the
grey coloured area in Fig. 2.8). Another ROI was created for the bottle cap (coloured blue in Fig.
2.8), using the ROI of the bottle as the border. The result was the points of contact between the
two ROIs and by using the option to extend the ROI of the cap with one voxel, this region extended
into the bottle surface and points of contact could be displayed (seen as the red coloured area in
Fig. 2.8) and quantified, using the Volume Analyser function. Using these analytical tools the exact
contact area between bottle and cap of the closed bottle could be presented (Anon., 2014).
Other techniques available for µCT analysis are: defect detection (detection and analysis of
pores/voids/cracks); nominal/actual comparison (compare geometries of two voxel data sets); wall
thickness analysis and orientation analysis (orientation of fibers in 3-D and projected into a 2-D
plane) (Singhal et al., 2013).
Applications to maize
When considering X-ray µCT studies on maize, only few have been done, including Takhar et al.
(2011) that focussed on moisture transport within maize kernels and De Carvalho et al. (1999) that
studied stress cracks formation. The study of Gustin et al. (2013) recognised the potential of X-ray
µCT as a method to determine kernel density and volume. Other cereal related studies are those
Stellenbosch University https://scholar.sun.ac.za

24
of Van Dalen et al. (2007) on pore structures of cereal products and that of Chaunier et al. (2007)
that investigated the porosity of maize flakes.
Figure 2.8. X-ray µCT segmentation of a bottle neck with screwed on bottle cap, creating regions-of-interest
(ROIs): grey = bottle neck; blue = bottle cap and red = contact areas.
Statistical interpretation
When capturing data, a process is started with the aim to retrieve useful information and to draw a
meaningful and significant conclusion. Statistics is crucial to complete the process, as it is through
statistical analysis that the data can be interpreted and evaluated. Choosing the appropriate
statistical method to fit a respective model, requires a lot of thought and consideration, a skill that is
acquired through experience. When making use of single variables, the analysis is referred to as
univariate statistical analysis, but when more than one variable is used simultaneously, multivariate
data analyses are performed.
Univariate statistical analysis
Spearman’s rank correlation coefficients
The correlation of ranks, as introduced by Spearman in the early 1900’s, is a very appropriate
procedure to use when non-parametric (values are replaced by ranks) results are expected (Zar,
1972). The Spearman correlation can be interpreted by its sign: the correlation will be positive
(plus sign in front of the value) if the independent variable (Y) increases when the dependent
variable (X) increases. If Y tends to decrease when X increase, the correlation will be indicated
with a minus sign, and is thus negatively correlated. A Spearman correlation of zero indicates that
there is no tendency for Y to either increase or decrease when X increases.
Stellenbosch University https://scholar.sun.ac.za

25
Intraclass correlation coefficients
When quantitative measurements of units within groups are made, the intraclass correlation
coefficients (ICC) can be used to describe how strongly the units in the same groups resemble
each other (Koch, 2004). The ICC assesses two factors: (a) the agreement that correlates the
measurements with each other, while taking into account the differences in absolute values of the
respective measurements, and (b) the consistency that only correlates the measurements (Bartko,
1976). If an ICC has a high agreement, very similar results are obtained from the comparing
methods; a low agreement indicates a large bias amongst the methods (Bartko, 1976). ICC is thus
a descriptive statistic and a useful tool to indicate the relationship among groups.
Analysis of variance
Analysis of variance (ANOVA) is a statistical model used to analyse variation among and between
groups and to compare statistical significance thereof (Olson, 1976; Scheffe, 1999). ANOVA tests
hypotheses from which decisions regarding the significance of a result can be made. Testing
the null hypothesis, the result is seen as being statistically significant and the hypothesis will not be
rejected, if it is deemed unlikely to have occurred by chance (Scheffe, 1999). For such a test, the
probability (p-value) must be more than a threshold (significance level). To reject the null
hypothesis, the p-value has to be less than the likely threshold value of 0.05, and is then seen as
not significant (Olson, 1976).
Receiver operating characteristic curve
A receiver operating characteristic curve, or simply ROC curve, is a plot of the true positive rate or
sensitivity against the false positive rate or 1 – specificity, at various threshold settings (DeLong et
al., 1988). The sensitivity defines how many correct positive results occur among all positive
samples available during the test; 1 - specificity, on the other hand, defines how many incorrect
positive results occur among all negative samples available during the test (Hanley & McNeil,
1983; DeLong et al., 1988). The optimal threshold is determined by maximising the sum of
sensitivity (no false negatives) and specificity (no false positives) and a tool is thus provided to
select optimal models. The area under the ROC curve is also used to assess the fit of the logistic
regression model and the closer the area value is to 1, the better the fit (Hanley & McNeil, 1983).
Multivariate statistical analysis
A multivariate statistical approach is followed when the simultaneous effect of many variables and
the relationship amongst the samples are evaluated (Li Vigni et al., 2013). In many instances,
such as grain science, where instrumental analysis can provide many variables for each sample,
the complexity of the data increases rapidly and requires multivariate data analysis techniques.
Examples of multivariate statistical analysis are principal component analysis (PCA), used as an
Stellenbosch University https://scholar.sun.ac.za

26
instrument of descriptive statistics, and partial least squares (PLS) regression models, allowing
predictions and classification accuracies. Multivariate image analysis (MIA), a technique
developed to analyse hyperspectral imaging data incorporates both PCA and PLS, will also be
explained.
Principal component analysis (PCA)
PCA was first introduced by Karl Pearson (1901) as “(a way of finding) lines and planes of closest
fit to systems of points in the data space.” PCA is a bi-linear decomposition technique which is
responsible for reducing large amounts of data by creating principal components (PCs) (Massart,
1998). Also known as latent variables, these PCs capture the differences and similarities among
the samples and variables of the modelled data (Li Vigni et al., 2013). The decomposition of the
data, using PCA, is as follows:
X = TAVAT+ E
where A is the number of PCs, T are the score vectors, V are the loading vectors and E represents
the residual or noise. Another way to interpret the number of PCs, or A, is that they are the
underlying structures or chemical rank of the matrix. In addition, the score vectors (T) give the
coordinates of the samples in the PC space and allow the inspection of sample
similarity/dissimilarity. Furthermore, the loadings vectors (V) represent the weight with which each
original variable contributes to the PCs, enabling the inspection of the correlation structure among
the variables through the loading scatter plots. The residual (E) is the part of the data that is not
explained by the model and is used as an indicator of outlying samples and/or variables (Li Vigni et
al., 2013).
Partial least squares regression (PLS)
Regression is an approach where two or more sets of variables are associated with each other
(Martens & Naes, 1991). When defining the variables to be modelled in a regression context, the
Y-variable is seen as the dependent variable and the X-variables as the predictor or independent
variables (Westad et al., 2013). A regression technique such as partial least squares (PLS) is
often used to build models that can be used to classify data or to make predictions. When using
PLS, PCs are created which are associated with the maximum variance of X, as in PCA, but also
incorporating the covariance associated with Y (Burger, 2006). These components are determined
on the basis of decreasing significance, and with caution, as the incorrect number of PCs included
in the calibration model will lead to unrealistic predictions (Burger, 2006).
When non-linearities in the relation between dependent and predictor variables occur (due to,
e.g. clustering of the samples or different sub-populations), the global linear calibration models do
not fit data correctly, leading to biased predictions. One way of dealing with this problem is to use
a locally weighted (LW) regression approach (Martens & Næs, 1985) where, for each new sample
to be predicted, a local model is developed based on its nearest neighbours, i.e. the calibration
Stellenbosch University https://scholar.sun.ac.za

27
objects nearest to it. LW regression based on PLS (Wold et al., 1983) makes use of Euclidean
distances on the original space variables and a uniform weighted scheme for the sample, as
suggested by Centner and Massart (1998). In order to perform such a regression (LW-PLS2) for
every new object (test), a different local calibration model must be built using only a defined
number of closest samples, called nearest neighbours (nlocal). To estimate the optimal number of
neighbours to be considered in local modeling, together with the appropriate number of latent
variables, a cross-validation procedure is normally used.
Multivariate image analysis
Simple multivariate statistical tools are not sufficient for hyperspectral imaging data analysis and
these techniques need to be adapted for the large data sets produced by imaging (Burger &
Geladi, 2006). A technique was developed to “unfold” the three dimensional image to create a two
dimensional data set where second order analysis procedures (i.e. PCA) can be used (Geladi &
Grahn, 1996). This technique involves the removal of spectra from a hyperspectral image, one
row of pixels at a time, to create a long matrix of spectra. PLS is also often applied to spectral data
to build models useful for making chemical classification or quantification predictions. However,
when such models are applied to a single hyperspectral image as described above, over eighty
thousand predictions will be produced (Burger, 2006). Again, the unfolding technique is used to
simplify the data to achieve a successful calibration.
Conclusion
As maize hardness is an important quality trait for breeders, producers and processors, it is
necessary to have access to reliable hardness methods. Up to date, no standardised hardness
method exists, and therefore a wide range of methods, differing in methodologies and approaches,
exist.
Hardness methods measure different properties, such as particle size subsequent to grinding
and sieving, resistance to grinding and abrasion and the yield of grits. Other methods measure
starch gelatinisation properties or polyphenol content to describe hardness. One of the older
methods makes use of hand-dissection to determine the ratio of vitreous-to-floury endosperm. A
similar method is machine vision technology that also quantifies the endosperm types in order to
describe hardness.
NIR hyperspectral imaging can also be used to quantify endosperm types, whereas traditional
NIR spectroscopy can predict maize hardness properties. Quality properties, such as protein,
starch, fat and fiber contents are also seen as hardness descriptors, as well as kernel density.
What is apparent from literature, is that many of these hardness methods do not correlate with
each other, and that contradictory results are found between different studies.
X-ray µCT is an analytical technique that has found many applications in grain science and is
increasingly used as a research tool. The 3-D visualisation of the imaged object permits functions
Stellenbosch University https://scholar.sun.ac.za

28
such as quantification and defect detection. Along with appropriate data analysis techniques and
statistical methods, maize hardness can adequately be expressed.
References
Agu, R., Bringhurst, T. & Brosnan, J. (2006). Production of grain whisky and ethanol from wheat,
maize and other cereals. Journal of the Institute of Brewing, 112, 314-323.
Alcalà, M., Blanco, M., Moyano, D., Broad, N., O'Brien, N., Friedrich, D., Pfeifer, F. & Siesler, H.
(2014). Qualitative and quantitative pharmaceutical analysis with a novel handheld
miniature near-infrared spectrometer. Journal of Near Infrared Spectroscopy, 21, 445-457.
Almeida-Dominguez, H.D., Suhendro, E.L. & Rooney, L.W. (1997). Factors affecting Rapid Visco-
Analyser curves for the determination of maize kernel hardness. Journal of Cereal Science,
25, 93-102.
Anonymous (1996). Corn: layers and structures of corn kernel. [Internet document]. URL
http://www.britannica.com/EBchecked/media/162/The-outer-layers-and-internal-structures-
of-a-kernel-of. Accessed 19/07/2013.
Anonymous (2008). Regulations relating to the grading, packing and marking of maize products
intended for sale in the Republic of South Africa. Act No 119 of 1990, No. 30681.
Johannesburg, South Africa: Goverment Gazette.
Anonymous (2014). Volume Graphics: Industrial applications. [Internet document]. URL
http://www.volumegraphics.com/en/case-studies/industry/plastic-bottle-cap/. Accessed
22/05/2014.
Armstrong, P. (2006). Rapid single-kernel NIR measurement of grain and oil-seed attributes.
Applied Engineering in Agriculture, 22, 767.
Bartko, J.J. (1976). On various intraclass correlation reliability coefficients. Psychological Bulletin,
83, 762-765.
Baye, T.M., Pearson, T.C. & Settles, A.M. (2006). Development of a calibration to predict maize
seed composition using single kernel near infrared spectroscopy. Journal of Cereal
Science, 43, 236-243.
Bello, A., Waniska, R., Gomez, M. & Rooney, L. (1995). Starch solubilization and retrogradation
during preparation of Tô (a Food Gel) from different sorghum cultivars. Cereal Chemistry,
72, 80-84.
Berardo, N., Pisacane, V., Battilani, P., Scandolara, A., Pietri, A. & Marocco, A. (2005). Rapid
detection of kernel rots and mycotoxins in maize by near-infrared reflectance spectroscopy.
Journal of Agricultural and Food Chemistry, 53, 8128-8134.
Blandino, M., Mancini, M.C., Peila, A., Rolle, L., Vanara, F. & Reyneri, A. (2010). Determination of
maize kernel hardness: comparison of different laboratory tests to predict dry milling
performance. Journal of the Science of Food and Agriculture, 90, 1870-1878.
Stellenbosch University https://scholar.sun.ac.za

29
Brunke, O. (2010). High-resolution CT-based defect analysis and dimensional measurement.
Insight-Non-Destructive Testing and Condition Monitoring, 52, 91-93.
Burger, J. & Geladi, P. (2006). Hyperspectral NIR imaging for calibration and prediction: a
comparison between image and spectrometer data for studying organic and biological
samples. Analyst, 131, 1152-1160.
Burger, J.E. (2006). Hyperspectral NIR image analysis: data exploration, correction and
regression. PhD Thesis. Swedish University of Agricultural Sciences, Umeå, Sweden.
Centner, V. & Massart, D.L. (1998). Optimization in locally weighted regression. Analytical
Chemistry, 70, 4206-4211.
Chandrashekar, A. & Mazhar, H. (1999). The biochemical basis and implications of grain strength
in sorghum and maize. Journal of Cereal Science, 30, 193-207.
Chaunier, L., Della Valle, G. & Lourdin, D. (2007). Relationships between texture, mechanical
properties and structure of cornflakes. Food Research International, 40, 493-503.
Chiremba, C., Rooney, L.W. & Taylor, J.R.N. (2011). Relationships between simple grain quality
parameters for the estimation of sorghum and maize hardness in commercial hybrid
cultivars. Cereal Chemistry, 88, 570-575.
Chiremba, C., Taylor, J., Rooney, L.W. & Beta, T. (2012). Phenolic acid content of sorghum and
maize cultivars varying in hardness. Food Chemistry, 134, 81-88.
De Beer, F. (2005). Characteristics of the neutron/X-ray tomography system at the SANRAD
facility in South Africa. Nuclear Instruments and Methods in Physics Research Section A:
Accelerators, Spectrometers, Detectors and Associated Equipment, 542, 1-8.
De Carvalho, M.L.M., Van Aelst, A.C., Van Eck, J.W. & Hoekstra, F.A. (1999). Pre-harvest stress
cracks in maize (Zea mays L.) kernels as characterized by visual, X-ray and low
temperature scanning electron microscopical analysis: effect on kernel quality. Seed
Science Research, 9, 227-236.
Delcour, J. & Hoseney, R.C. (2010). Principles of Cereal Science and Technology. Pp. 1-22.
Minnesota, USA: AACC International Press.
DeLong, E.R., DeLong, D.M. & Clarke-Pearson, D.L. (1988). Comparing the areas under two or
more correlated receiver operating characteristic curves: a nonparametric approach.
Biometrics, 44, 837-845.
Dombrink-Kurtzman, M. & Knutson, C. (1997). A study of maize endosperm hardness in relation to
amylose content and susceptibility to damage. Cereal Chemistry, 74, 776-780.
Dombrink-Kurtzman, M.A. (1994). Examination of opaque mutants of maize by reversed-phase
high-performance liquid chromatography and scanning electron microscopy. Journal of
Cereal Science, 19, 57-64.
Dombrink-Kurtzman, M.A. & Bietz, J.A. (1993). Zein composition in hard and soft endosperm of
maize. Cereal Chemistry, 70, 105-108.
Stellenbosch University https://scholar.sun.ac.za

30
Dorsey-Redding, H. & Johnson, F. (1991). Relationships among maize quality factors. Cereal
Chemistry, 68, 602-605.
Dowell, F., Maghirang, E., Graybosch, R., Baenziger, P., Baltensperger, D. & Hansen, L. (2006).
An automated near-infrared system for selecting individual kernels based on specific quality
characteristics. Cereal Chemistry, 83, 537-543.
Downey, G., Byrne, S. & Dwyer, E. (1986). Wheat trading in the Republic of Ireland: The utility of a
hardness index derived by near infrared reflectance spectroscopy. Journal of the Science of
Food and Agriculture, 37, 762-766.
Duarte, A.P., Mason, S.C., Jackson, D.S. & de C Kiehl, J. (2005). Grain quality of Brazilian maize
genotypes as influenced by nitrogen level. Crop Science, 45, 1958-1964.
Duliu, O.G. (1999). Computer axial tomography in geosciences: an overview. Earth-Science
Reviews, 48, 265-281.
Erasmus, C. (2003). Maize kernel translucency measurement by image analysis and its
relationship to vitreousness and dry milling performance. PhD Thesis. University of
Pretoria, Pretoria, South Africa.
Erasmus, C. & Taylor, J.R.N. (2004). Optimising the determination of maize endosperm
vitreousness by a rapid non-destructive image analysis technique. Journal of the Science of
Food and Agriculture, 84, 920-930.
Eyherabide, G.H., Robutti, J.L. & Borras, F.S. (1996). Effect of near-infrared transmission-based
selection on maize hardness and the composition of zeins. Cereal Chemistry, 73, 775-778.
Fox, G. & Manley, M. (2009). Hardness methods for testing maize kernels. Journal of Agricultural
and Food Chemistry, 57, 5647-5657.
Gaytán-Martínez, M., Figueroa-Cárdenas, J., Reyes-Vega, M., Rincón-Sánchez, F. & Morales-
Sánchez, E. (2006). Microstructure of starch granule related to kernel hardness in corn.
Revista Fitotecnia Mexicana, 29, 135-139.
Geladi, P. & Grahn, H. (1996). Multivariate Image Analysis. In: Encyclopedia of Analytical
Chemistry. UK: Wiley Chichester.
Grahn, H.F. & Geladi, P. (2007). Multivariate images, hyperspectral imaging: background and
equipment. In: Techniques and Applications of Hyperspectral Image Analysis (edited by
P.L.M. Geladi, H.F. Grahn & J.E. Burger). Pp. 1-16. West Sussex, UK: John Wiley & Sons,
Ltd.
Gustin, J.L., Jackson, S., Williams, C., Patel, A., Armstrong, P.R., Peter, G.F. & Settles, A.M.
(2013). Analysis of maize (Zea mays) kernel density and volume using micro-computed
tomography and single-kernel near infrared spectroscopy. Journal of Agricultural and Food
Chemistry, 61, 10872-10880.
Hanley, J.A. & McNeil, B.J. (1983). A method of comparing the areas under receiver operating
characteristic curves derived from the same cases. Radiology, 148, 839-843.
Stellenbosch University https://scholar.sun.ac.za

31
Hespell, R.B. (1998). Extraction and characterization of hemicellulose from the corn fiber produced
by corn wet-milling processes. Journal of Agricultural and Food Chemistry, 46, 2615-2619.
Janni, J., Weinstock, B.A., Hagen, L. & Wright, S. (2008). Novel near-infrared sampling apparatus
for single kernel analysis of oil content in maize. Applied spectroscopy, 62, 423-426.
Ji, Y., Wong, K., Hasjim, J., Pollak, L.M., Duvick, S., Jane, J. & White, P.J. (2003). Structure and
function of starch from advanced generations of new corn lines. Carbohydrate Polymers,
54, 305-319.
Kirleis, A. & Stroshine, R. (1990). Effects of hardness and drying air temperature on breakage
susceptibility and dry-milling characteristics of yellow dent corn. Cereal Chemistry, 67, 523-
528.
Koch, G.G. (2004). Intraclass Correlation Coefficient. In: Encyclopedia of Statistical Sciences. UK:
John Wiley & Sons, Inc.
Kotwaliwale, N., Singh, K., Kalne, A., Jha, S.N., Seth, N. & Kar, A. (2011). X-ray imaging methods
for internal quality evaluation of agricultural produce. Journal of Food Science and
Technology, 51, 1-15.
Lee, E.A., Young, J.A., Frégeau-Reid, J.A. & Good, B.G. (2012). Genetic architecture underlying
kernel quality in food-grade maize. Crop Science, 52, 1561-1571.
Lee, K.M., Bean, S.R., Alavi, S., Herrman, T.J. & Waniska, R.D. (2006). Physical and biochemical
properties of maize hardness and extrudates of selected hybrids. Journal of Agricultural
and Food Chemistry, 54, 4260-4269.
Lee, K.M., Herrman, T.J., Rooney, L.W., Jackson, D.S., Lingenfelser, J., Rausch, K.D., McKinney,
J., Iiams, C., Byrum, L., Hurburgh, J.C.R., Johnson, L.A. & Fox, S.R. (2007). Corroborative
study on maize quality, dry-milling and wet-milling properties of selected maize hybrids.
Journal of Agricultural and Food Chemistry, 55, 10751-10763.
Lending, C.R. & Larkins, B.A. (1989). Changes in the zein composition of protein bodies during
maize endosperm development. The Plant Cell Online, 1, 1011-1023.
Li, P.X.P., Hardacre, A.K., Campanella, H. & Kirkpatrick, K.J. (1996). Determination of endosperm
characteristics of 38 corn hybrids using the Stenvert hardness test. Cereal Chemestry, 73,
466-471.
Li Vigni, M., Durante, C. & Cocchi, M. (2013). Exploratory data analysis. In: Chemometrics in Food
Science. Pp. 55-126. Oxford, England: Elsevier.
Lin, C. & Miller, J. (2002). Cone beam X-ray microtomography-a new facility for three-dimensional
analysis of multiphase materials. Minerals and Metallurgical Processing, 19, 65-71.
Manley, M., Williams, P., Nilsson, D. & Geladi, P. (2009). Near infrared hyperspectral imaging for
the evaluation of endosperm texture in whole yellow maize (Zea mays L.) kernels. Journal
of Agricultural and Food Chemistry, 57, 8761-8769.
Martens, H. & Næs, T. (1985). Multivariate calibration. II. Cemometric methods. Trends in
Analytical Chemistry, 3, 266-271.
Stellenbosch University https://scholar.sun.ac.za

32
Martens, H. & Naes, T. (1991). Multivariate calibration. New York, USA: John Wiley & Sons Ltd.
Massart, D.L. (1998). Data handling in science and technology series, part A. In: Handbook of
Chemometrics and Qualimetrics (edited by B. Vandeginste, L. Buydens, S. De Jong, P.
Lewi & J. Smeyers-Verbeke). Pp. 519-556. Amsterdam: Elsevier.
McGoverin, C. & Manley, M. (2012). Classification of maize kernel hardness using near infrared
hyperspectral imaging. Journal of Near Infrared Spectroscopy, 20, 529-535.
Mestres, C., Louis-Alexandre, A., Matencio, F. & Lahlou, A. (1991). Dry-milling properties of maize.
Cereal Chemistry, 68, 51-56.
Mestres, C. & Matencio, F. (1996). Biochemical basis of kernel milling characteristics and
endosperm vitreousness of maize. Journal of Cereal Science, 24, 283-290.
Narváez-González, E.D., de Dios Figueroa-Cárdenas, J., Taba, S., Tostado, E.C., Peniche, R.Á.M.
& Sánchez, F.R. (2006). Relationships between the microstructure, physical features, and
chemical composition of different maize accessions from Latin America. Cereal Chemistry,
83, 595-604.
O'Brien, N.A., Hulse, C.A., Friedrich, D.M., Van Milligen, F.J., von Gunten, M.K., Pfeifer, F. &
Siesler, H.W. (2012). Miniature near-infrared (NIR) spectrometer engine for handheld
applications. In: Defense, Security, and Sensing SPIE. Pp. 837404-837408.Baltimore,
Maryland, USA.
O'Kennedy, K. (2011). Characterisation of zein from South African maize of varying endosperm
texture. MSc Thesis. Stellenbosch University, South Africa.
Olson, C.L. (1976). On choosing a test statistic in multivariate analysis of variance. Psychological
Bulletin, 83, 579-586.
Orman, B.A. & Schumann Jr, R.A. (1991). Comparison of near-infrared spectroscopy calibration
methods for the prediction of protein, oil, and starch in maize grain. Journal of Agricultural
and Food Chemistry, 39, 883-886.
Paiva, E., Kriz, A.L., Peixoto, M.J.V.V.D., Wallace, J.C. & Larkins, A.B. (1991). Quantitation and
distribution of ã–zein in the endosperm of maize kernels. Cereal Chemistry, 68, 276-279.
Paulsen, M. & Hill, L. (1985). Corn quality factors affecting dry milling performance. Journal of
Agricultural Engineering Research, 31, 255-263.
Pearson, K. (1901). LIII. On lines and planes of closest fit to systems of points in space. The
London, Edinburgh, and Dublin Philosophical Magazine and Journal of Science, 2, 559-
572.
Pearson, T., Wicklow, D., Maghirang, E., Xie, F. & Dowell, F. (2001). Detecting aflatoxin in single
corn kernels by transmittance and reflectance spectroscopy. American Society of
Agricultural Engineers, 44, 1247-1254.
Peplinski, A.J., Paulsen, M.R., Anderson, R.A. & Kwolek, W.F. (1989). Physical, chemical, and dry-
milling characteristics of corn hybrids from various genotypes. Cereal Chemisty, 66, 117-
120.
Stellenbosch University https://scholar.sun.ac.za

33
Pomeranz, Y., Czuchajowska, Z., Martin, C. & Lai, F. (1985). Determination of corn hardness by
the Stenvert hardness tester. Cereal Chemistry, 62, 108-112.
Robutti, J.L., Borras, F., Ferrer, M.o., Percibaldi, M. & Knutson, C.A. (2000). Evaluation of quality
factors in Argentine maize races. Cereal Chemistry, 77, 24-26.
Robutti, J.L., Borras, F.S. & Eyherabide, G.H. (1997). Zein compositions of mechanically separated
coarse and fine portions of maize kernels. Cereal Chemistry, 74, 75-78.
Rotar, I., Dale, L.M., Vidican, R., Mogos, A. & Ceclan, O. (2009). Research on Protein Content and
Total Nitrogen and a Cob of Maize Strains by FT-NIR Spectrometry. Bulletin of University of
Agricultural Sciences and Veterinary Medicine Cluj-Napoca. Agriculture, 66.
Sahai, D., Buendia, M. & Jackson, D. (2001). Analytical techniques for understanding nixtamalized
corn flour: particle size and functionality relationships in a Masa flour Sample 1. Cereal
Chemistry, 78, 14-18.
Sandhu, K.S. & Singh, N. (2007). Some properties of corn starches II: Physicochemical,
gelatinization, retrogradation, pasting and gel textural properties. Food Chemistry, 101,
1499-1507.
Scheffe, H. (1999). The Analysis of Variance. New York, United States of America: John Wiley &
Sons.
Schena, G., Santoro, L. & Favretto, S. (2007). Conceiving a high resolution and fast X-ray CT
system for imaging fine multi-phase mineral particles and retrieving mineral liberation
spectra. International Journal of Mineral Processing, 84, 327-336.
Schweizer, S.M. & Moura, J.M.F. (2001). Efficient detection in hyperspectral imagery. Image
Processing, 10, 584-597.
Seetharaman, K., Tziotis, A., Borras, F., White, P.J., Ferrer, M. & Robutti, J. (2001). Thermal and
functional characterization of starch from Argentinean Corn1. Cereal Chemistry, 78, 379-
386.
Serna-Saldivar, S.O. (2010). Cereal Grains: Properties, Processing, and Nutritional Attributes. Pp.
1-752. London, UK: CRC Press Inc.
Singhal, A., Grande, J.C. & Zhou, Z. (2013). Micro/Nano CT for visualization of internal structures.
Microscopy Today, 21, 16-22.
Spielbauer, G., Armstrong, P., Baier, J.W., Allen, W.B., Richardson, K., Shen, B. & Settles, A.M.
(2009). High-throughput near-infrared reflectance spectroscopy for predicting quantitative
and qualitative composition phenotypes of individual maize kernels. Cereal Chemistry, 86,
556-564.
Sun, D. (2010). Principles of hyperspectral imaging technology. In: Hyperspectral Imaging for Food
Quality Analysis and Control (edited by D.-W. Sun). Pp. 3-44. Oxford, UK: Elsevier.
Takhar, P.S., Maier, D.E., Campanella, O.H. & Chen, G. (2011). Hybrid mixture theory based
moisture transport and stress development in corn kernels during drying: Validation and
simulation results. Journal of Food Engineering, 106, 275-282.
Stellenbosch University https://scholar.sun.ac.za

34
Tran, T., Deman, J. & Rasper, V. (1981). Measurement of corn kernel hardness. Canadian Institute
of Food Science and Technology Journal, 14, 42-48.
Van Dalen, G., Nootenboom, P. & Van Vliet, L.J. (2007). 3D Imaging and analysis of porous cereal
products using X-ray microtomography. In: The 12th International Congress for Stereology
(ICSXII), 2007. September 3-7, 2007.Saint-Etienne, France.
Van Loggerenberg, D. & Pretorius, A.J. (2004). Determining the milling index of maize with a NIT
calibration. In: Proceedings of the South African Society of Crop Producers Congress.
January 2004.Bloemfontein, South Africa.
Voca, N., Varga, B., Kricka, T., Curic, D., Jurisic, V. & Matin, A. (2009). Progress in ethanol
production from corn kernel by applying cooking pre-treatment. Bioresource Technology,
100, 2712-2718.
Wang, D. & Eckhoff, S.R. (2000). Effect of broken corn levels on water absorption and steepwater
characteristics. Cereal Chemistry, 77, 525-528.
Watson, S.A. (1987). Structure and Composition. In: Corn Chemistry and Technology (edited by
S.A. Watson & P.E. Ramstad). Pp. 53-82. St. Paul, Minnesota, USA: American Association
of Cereal Chemists, Inc.
Wehling, R., Jackson, D. & Hamaker, B. (1996). Prediction of corn dry-milling quality by Near-
Infrared Spectroscopy. Cereal Chemistry, 73, 543-546.
Westad, F., Bevilacqua, M. & Marini, F. (2013). Regression. In: Chemometrics in Food Science.
Pp. 127-170. Oxford, UK: Elsevier.
Williams, P., Geladi, P., Fox, G. & Manley, M. (2009). Maize kernel hardness classification by near
infrared (NIR) hyperspectral imaging and multivariate data analysis. Analytica Chimica
Acta, 653, 121-130.
Wold, S., Martens, H. & Wold, H. (1983). The multivariate calibration problem in Chemistry 576
solved by the PLS method. Heidelberg, Germany: Springer-Verlag.
Wolf, M.J., Buzan, C.L., MacMasters, M.M. & Rist, C.E. (1952). Structure of the mature corn
kernel. I. Gross anatomy and structural relationships. Cereal Chemistry, 29, 321-333.
Wu, Y.V. (1992). Corn hardness as related to yield and particle size of fractions from a micro
hammer-cutter mill. Cereal Chemistry, 69, 343-347.
Yamin, F., Lee, M., Pollak, L. & White, P. (1999). Thermal properties of starch in corn variants
isolated after chemical mutagenesis of inbred line B73 1. Cereal Chemistry, 76, 175-181.
Zar, J.H. (1972). Significance testing of the Spearman rank correlation coefficient. Journal of the
American Statistical Association, 67, 578-580.
Stellenbosch University https://scholar.sun.ac.za

35
Chapter 3
Application of Rapid Visco Analyser (RVA) viscograms and chemometrics for
maize hardness characterisation*
Abstract
It has been established in this study that the Rapid Visco Analyser (RVA) can describe maize
hardness, irrespective of the RVA profile, when used in association with appropriate multivariate
data analysis techniques. Therefore, the RVA can complement or replace current and/or
conventional methods as a hardness descriptor. Hardness modelling based on RVA viscograms
was carried out using seven conventional hardness methods (hectoliter mass (HLM), hundred kernel
mass (HKM), particle size index (PSI), percentage vitreous endosperm (%VE), protein content,
percentage chop (%chop) and near infrared (NIR) spectroscopy) as references and three different
RVA profiles (hard, soft and standard) as predictors. An approach using locally weighted partial least
squares (LW-PLS) was followed to build the regression models. The resulted prediction errors (root
mean square error of cross-validation (RMSECV) and root mean square error of prediction
(RMSEP)) for the quantification of hardness values were always lower or in the same order of the
laboratory error of the reference method.
*Published as: Guelpa A, Bevilacqua M, Marini F, O’Kennedy K, Geladi P & Manley M (2014). Application of Rapid Visco
Analyser (RVA) viscograms and chemometrics for maize hardness characterisation. Food Chemistry, 173, 1220–1227.
Stellenbosch University https://scholar.sun.ac.za

36
Introduction
Maize hardness is an important quality characteristic for the dry-milling industry. In South Africa, the
dry-milling industry is significant as maize is the largest crop produced, of which two-thirds (ca. 4
million tons per annum) are processed into maize meal used to make porridge (SAGIS, 2013). For
its definition, numerous aspects have to be considered. Even with careful consideration, the
interpretation and measurement of maize hardness can still be confusing and needs further
investigation. Nonetheless, the hardness of maize is important when determining the processing
settings, such as for dry-milling. Similar to other grains, maize kernel hardness is principally a
genetic characteristic (Johnson & Russell, 1982), although environmental influences (Hamilton et
al., 1951) and external factors such as postharvest handling (Peplinski et al., 1989) will also affect
the hardness. Maize (Zea mays L.) is anatomically made up of two types of endosperm, i.e. a harder
(vitreous) endosperm situated to the outside of the kernel, and a softer (floury) endosperm found in
the center of the kernel (Watson, 1987; Paiva et al., 1991). It is known that hard kernels are favoured
by industry as hard maize produces greater yield and a higher quality meals and grits than soft maize
(Lee et al., 2007).
There are many methods available to determine maize hardness, as extensively reviewed by
Fox and Manley (2009). Yet, it is not clear which method best describes hardness. It is even more
difficult to decide on a method that best describes milling quality. In this study, the samples were
ranked according to their milling performance as measured during the actual milling process,
although on pilot plant-scale. The outcome of good milling is indicated by a small percentage of
hominy chop. Hominy chop (comprising the pericarp, tip cap, germ and some endosperm) is of lesser
value than maize meal and grits and predominantly used as animal feed. Maize that mill poorly
delivers a larger percentage chop (%chop) as soft endosperm is also included into the chop.
Percentage chop is therefore used as an indication of the milling quality of maize, although it is not
a recognised hardness measurement method as such. In this study, the relationship of %chop to
other conventional hardness methods was investigated. These conventional methods were chosen
to include many different descriptors, i.e. density, size and soundness (hectoliter mass and hundred
kernel mass), particle size or breakage susceptibility (particle size index and near infrared
absorbance) and quality properties (protein content and near infrared hyperspectral imaging).
Great financial losses experienced in the Australian wheat industry in the 1980’s lead to the
development of the Rapid Visco Analyser (RVA) (Ross et al., 1987). This viscometric method has
since found meaningful applications in a vast range of applications, especially in grain science due
to the large amount of starch present in cereals (Doublier et al., 1987; Agu et al., 2006). The RVA
measures the viscosity developed with hydration and subsequent gelatinisation of starch granules
during heating and stirring in excess water (Almeida-Dominguez et al., 1997). It has been reported
that the RVA can be used to quantify maize hardness differences between maize hybrids (Yamin et
al., 1999; Seetharaman et al., 2001; Ji et al., 2003; Sandhu & Singh, 2007). This was due to hard
Stellenbosch University https://scholar.sun.ac.za

37
maize producing mainly coarse particles when milled, and soft maize smaller particles (Almeida-
Dominguez et al., 1997). Coarse particles have slower water diffusion, limited swelling of the starch
granules and slow viscosity development (Sahai et al., 2001; Narváez-González et al., 2006).
Smaller particles have bigger surface areas that result in better and more rapid hydration, thus better
gelatinisation and higher viscosity (Almeida-Dominguez et al., 1997). Furthermore, hard kernels
show a more prominent protein-to-starch adhesion effect compared to soft kernels (Almeida-
Dominguez et al., 1997). The protein matrix of vitreous endosperm is thicker than that of floury
endosperm (Wang & Eckhoff, 2000), and forms a barrier that slows hydration and gelatinisation
(Almeida-Dominguez et al., 1997; Narváez-González et al., 2006).
Based on these considerations, determination of the usefulness of the RVA as a hardness
descriptor was a key concern in the current study. With this aim, RVA viscograms were recorded on
different maize samples which were also quantified and characterized for hardness by the seven
conventional (reference) methods. The objective was to define whether it was possible to obtain
information about properties (such as density, breakage susceptibility and protein content), that are
commonly associated with hardness, from RVA curves obtained through single measurements. In
order to analyse such a complex data set, the use of appropriate chemometrics techniques was
required. At first, principal component analysis (PCA) was used to achieve a better understanding
of the relations among the seven reference methods. Subsequently, the use of a non-linear
regression technique, i.e. locally weighted partial least squares (LW-PLS) regression (Centner &
Massart, 1998; Bevilacqua et al., 2012) was used to build a regression model to predict maize
hardness from the RVA curves. This was done for all seven reference methods individually.
Materials and methods
Maize samples
Nineteen pure hybrids of South African white maize, originating from maize breeding trials, were
used. These hybrids, kindly supplied by PANNAR Seeds (Greytown, South Africa) came from three
localities (Greytown, Delmas and Klerksdorp, South Africa) and two plantings in 2012 (early and
late). A local farmer from Schweizer-Reneke also supplied some of the samples, resulting in a total
of 49 samples. Before being milled, the samples were stored at ambient temperature in sealed
plastic containers.
Stellenbosch University https://scholar.sun.ac.za

38
Methods
Pasting properties (acquisition of RVA data)
Maize samples were milled using a hammer type cyclone Laboratory Mill 3100 (Perten, Hägersten,
Sweden) fitted with a 1 mm sieve. Milling was conducted on the same day as moisture content
determination and RVA measurement. The moisture content of the milled maize samples was
determined prior to RVA analysis according to a method used by Emvula (2012) which is an adapted
method of the AACC modified vacuum oven method (AACC, 1999a).
Pasting properties of maize were determined using a Rapid Visco Analyser (RVA) model 4500
(Perten Instruments, Australia). Distilled water (25 ± 0.01 g) was added to the milled maize (3 ±
0.01 g, db) in an aluminium RVA canister to obtain a total constant sample weight of 28 ± 0.01 g.
The masses of the dH2O and maize were adjusted (± 0.01 g) to compensate for the differences in
moisture content of each sample. In all the tests a moisture level of 15% was maintained, resulting
in a relative high solid percentage. Clumping was prevented by stirring with a plastic paddle after
which pre-programmed profiles were initiated.
The three profiles used to capture rheological information (RVA curves) were: a soft maize profile
(Almeida-Dominguez et al., 1997), a standard profile (AACC, 1999c) and a hard maize profile
(Almeida-Dominguez et al., 1997). The respective holding times, heating rates and final
temperatures used are summarised in Table 3.1.
Table 3.1 Details of the RVA soft, standard and hard maize profiles (temperature and time)
Stage Soft maize profile Standard profile Hard maize profile
Initial temperature (°C) 50 50 50
Initial holding time (min) 2:00 1:00 2:00
Heating time (min) 4:30 3:42 19:00
Max temperature (°C) 95 95 95
Hold at max temperature
(min)
4:30 2:30 4:00
Cooling time (min) 4:00 3:48 -
Final temperature (°C) 50 50 95
Final holding time (min) 10:00 2:00 2:00
Total test time (min) 25:00 13:00 27:00
For each of the tests, viscosity (cP), temperature (°C), speed (rpm) and the heat-cool ratio were
recorded every four seconds, therefore generating for each sample three measurement vectors of
376 (soft profile), 196 (standard profile), and 406 (hard profile) data points, respectively. The resulting
Stellenbosch University https://scholar.sun.ac.za

39
curve, reporting the viscosity (sometimes together with the temperature ramp, for the sake of better
clarity) as a function of time, is called a viscogram. All the RVA tests were done in triplicate.
Determination of maize hardness by conventional reference methods
Seven conventional methods were used to explain the differences in kernel hardness: hectoliter
mass (HLM), hundred kernel mass (HKM), protein content, %chop, particle size index (PSI), NIR
hyperspectral imaging (percentage vitreous endosperm, %VE) and NIR absorbance value at 2230
nm.
Hectoliter mass
The HLM of the samples was determined using a German Kern 220/222 Grain Sampler (KERN &
SOHN GmbH, Balingen-Frommern, Germany). The sampler was placed on a firm, non-flexible,
vibration-free horizontal base. The scraper blade was inserted in the empty 1 L measuring container.
The pre-filling measure was filled to the marked level with the maize. It was then emptied within 3
or 4 cm from the upper edge of the filling hopper in such a way that the maize could flow evenly into
the middle of the filling hopper in 11 to 13 s. After filling, the straight edge was quickly pulled out,
but without shaking the equipment. When the piston and the maize have fallen into the measuring
container, the straight edge was placed back in the slit and pushed through the maize in a single
stroke. If a kernel became jammed between the slit edges, the pouring was repeated. The excess
maize lying on the straight edge was thrown out. The filling hopper and straight edge was removed.
The maize was weighed (in g) and the HLM was read from the conversion chart supplied with the
device in kg.hL-1. This test was done in duplicate at the research and development facility of Sasko
(Essential Foods, Division of Pioneer Foods (Pty.) Ltd., Paarl, South Africa).
Hundred kernel mass
The HKM of the samples was determined using an industry accepted method that provides a
measure of grain size and density. One hundred whole maize kernels were obtained using a
Numigral Seed Counter (Chopin Technologies, France) and weighed in grams. These
determinations were done in triplicate at the research and development facility of Sasko (Essential
Foods, Division of Pioneer Foods (Pty.) Ltd., Paarl, South Africa).
Protein content
The protein content was determined using the official method for crude protein (Dumas method)
(AACC, 1999b). A LECO TruMac N (LECO Corporation, Saint Joseph, Michigan, USA) was used,
which is a macro combustion nitrogen determinator that utilises a pure oxygen environment in a
ceramic horizontal furnace operating at a high temperature (1200 ºC). Protein content was
determined at 12 % moisture base (mb), and the results were expressed as nitrogen multiplied by
the protein factor of 6.25. Duplicate determinations were done and the averaged results were used.
Stellenbosch University https://scholar.sun.ac.za

40
Protein content results were kindly supplied by Sasko (Essential Foods, Division of Pioneer Foods
(Pty.) Ltd., Paarl, South Africa).
Percentage chop
The %chop was determined using a pilot plant scale de-germer and maize mill. De-germed maize
was subjected to the milling process and the chop (combination of pericarp, germ and to a lesser
extent endosperm) was calculated as a percentage of the total mass of the maize. The observed
trend, when using this method, indicated that maize with a %chop below 22% was good milling
maize, between 22% and 25% was good intermediate, between 26% and 30% was poor
intermediate and above 30% was poor milling maize. Only single determinations were done. Results
were kindly supplied by Sasko (Essential Foods, Division of Pioneer Foods (Pty.) Ltd., Paarl, South
Africa). Due to the sensitivity of the data, the method cannot be described in detail.
Particle size index
The PSI method was used to differentiate between hard and soft maize samples. The samples were
milled using a hammer type cyclone Laboratory Mill 3100 (Perten, Hägersten, Sweden) fitted with a
1 mm sieve. A two sieve method was used, where a 150 µm sieve was placed on a 75 µm sieve,
fitted with a receiving pan (O'Kennedy, 2011). The pans and sieves (Retsch, Haan, Germany) were
stacked on top of each other and placed in a Retsch AS 200 Tap Sieve Shaker for 10 min (Retsch,
Haan, Germany). Three fractions, PSI1 (particles > 150 µm), PSI2 (particles < 150 µm, but > 75 µm)
and PSI3 (particles < 75 µm) were determined. The higher PSI1 the harder the kernels; high PSI2
and PSI3 values indicate soft kernels. In addition, the ratio between larger (PSI1) and smaller particle
sizes (PSI2 + PSI3) was calculated to give a course over fine (c/f) ratio, where a higher number
indicated harder samples (more dense) and vice versa. The PSI measurements were done in
duplicate.
Percentage vitreous endosperm (%VE)
NIR hyperspectral images were acquired using an Umbio Inspector SWIR (short wave infrared)
(Umbio AB, Umeå, Sweden) pushbroom hyperspectral imaging system. The Umbio pushbroom
imager comprised an imaging spectrograph coupled to a 2-D array Mercury-Cadmium-Tellurium
detector. Line illumination was obtained with two arrays of quartz-halogen lamps with regulated
current. The samples were scanned on a moving belt. Individual images were acquired with a
spectral range of 1151 – 2199 nm with 6 – 7 nm spacing. Images were made with a width of 320
pixels and variable length in 239 wavelength bands.
Six to ten maize kernels per sample were placed germ-down (endosperm rich) onto a plastic
sample holder (75 mm x 110 mm) fitted with double sided tape. For each scanned sample an internal
dark reference was measured. The external white reference was a Spectralon (ACAL BFi Nordic,
Stellenbosch University https://scholar.sun.ac.za

41
Uppsala, Sweden) strip measured just before the sample. The sample holders were put on the
moving belt with the longest dimension in the direction of the movement.
The raw images were processed in Evince 2.5.5 (Umbio, Umeå, Sweden), converted to
absorbance using the individual white and dark reference files and cleaned from unnecessary
background. Absorbance images were subjected to PCA for further cleaning. PCA score plots, as
well as the PCA score images, were used to identify outliers, bad pixels, illumination and shading
errors, edge effects and background. Due to the huge number of pixels in these images, criteria
normally used for smaller data sets (such as residuals and Hotelling’s T2 values) were not used in
this case. Unwanted pixels were simply removed after visual inspection. PCA was recalculated using
6 PCs and all pairwise combinations of PC 1 to PC 6 were examined for any further pixel outliers.
Outliers are usually found in the first two components, but after removal of the most obvious outliers,
more components may be needed for further analysis. Six PCs were used for recalculating the
models in order to obtain the best suited image for mosaic creation. No data pre-treatment (except
mean centering) was used as multiplicative scatter correction (MSC) as an example of a pre-
treatment method, would reduce information relating to scattering effects or differences which were
necessary for this study.
A mosaic of the images of the samples was constructed. A mosaic is a number of images merged
into a new single image. No pre-treatment was used and PCA was applied after mean centering.
PCA score plots and images were used interactively to assign pixels (i.e. individual spectra) to
endosperm (floury and vitreous) and non-endosperm (germ and pedicle) regions. After exclusion of
the non-endosperm regions, PCA was re-applied. Two distinct clusters were observed in PC 1 vs
PC 3 and these regions were identified as representing the respective endosperm types, i.e. vitreous
and floury endosperm. The method of identification was based on selecting groups of points within
the score plot and observing where the pixels were located within the score image. Two classes
were subsequently created and the number of pixels within each class was determined for each
individual kernel. The pixel counts were expressed as a percentage floury endosperm (%FE) and a
percentage vitreous endosperm (%VE). Only the %VE results were used in this study as a measure
of kernel hardness.
NIR absorbance at 2230 nm
This method, proposed by Downey et al. (1986), makes use of a wavelength (2230 nm), where
reflectance is effectively independent of the samples’ composition, but varies only with regards to
the milled samples’ particle size. Therefore, maize samples were ground using a hammer mill
(Retsch, Haan, Germany) fitted with a 0.8 mm sieve. A BÜCHI NIRFlex N-500 Fourier transform
near-infrared (FTNIR) spectrophotometer (BÜCHI Labortechnik GmbH, Flawil, Switzerland) with
NIRLabWare (version 3.0) (BÜCHI Labortechnik GmbH, Flawil, Switzerland) near infrared (NIR)
measurement software was used to perform the measurements of the ground maize samples in
diffuse reflectance mode. The samples were presented to the instrument in rotating glass Petri
Stellenbosch University https://scholar.sun.ac.za

42
dishes, and the NIR spectra were collected from 1100 to 2500 nm (9090-4000 cm-1) at an optical
resolution of 32 cm-1. The raw spectra (no pre-treatment) were used to measure the absorbance
(log 1/R) at 2230 nm. Hardness values were derived by the following equation:
Hardness = a + b(log 1/R)
Values for a = -40 and b = 100 were selected arbitrarily to produce a scale of hardness from 0 to 15.
Chemometrics and statistical data analysis
Statistical analysis
Spearman’s rank correlation coefficients were used to test the strength of the relationships between
pairs of conventional methods (HLM, HKM, PSI, %VE, protein content, %chop and NIR at 2230 nm)
in a bivariate fashion.
Principal component analysis
PCA reduces large data sets into fewer principal components (PCs) which are then used in the
model. PC scores images and scores plots were used interactively to investigate samples for special
features or irregularities and the observed explained variation studied by means of the
accompanying PC loadings plots. The seven conventional methods (HLM, HKM, PSI, %VE, protein
content, %chop and NIR at 2230 nm), used to assess the maize hardness, were compared using
PCA to gain a holistic view of the entire reference data set.
Locally weighted partial least squares regression
When non-linearities in the relation between responses and predictors occur (due to, e.g. clustering
of the samples or different sub-populations), the global linear calibration models do not fit data
correctly, leading to biased predictions. One way of dealing with this problem is to use a locally
weighted (LW) regression approach (Martens & Næs, 1985) where, for each new sample to be
predicted a local model is developed based on its nearest neighbours, i.e. the calibration objects
nearest to it. In this case, the use of LW regression based on partial least squares (PLS) (Wold et
al., 1983) using Euclidean distances on the original space variables and a uniform weighted scheme
for the sample, was employed, as suggested by Centner and Massart (1998). In order to perform
such a regression (LW-PLS2) for every new object (test), a different local calibration model must be
built using only a defined number of closest samples, called nearest neighbours (nlocal). To estimate
the optimal number of neighbours to be considered in local modeling, together with the appropriate
number of latent variables, a cross-validation procedure is normally used.
The hardness results from HLM, HKM, PSI, %VE, protein content, %chop and NIR at 2230 nm
where used as reference when RVA viscograms were used to predict the same hardness
descriptors. To present the results, error measures have been used, i.e. root mean square error of
cross-validation (RMSECV) and root mean square error of prediction (RMSEP).
Stellenbosch University https://scholar.sun.ac.za

43
Software
Correlation analysis was performed using Microsoft Excel 2010 (Microsoft Corporation, Seattle, WA).
Chemometric data processing was carried out by means of in-house functions and PLS Toolbox v
7.02 (Eigenvector Research Inc., Wenatchee, WA) running under MATLAB 2012b environment (The
MathWorks, Natick, MA, USA).
Results and discussion
Descriptive statistics of the seven hardness related reference methods are summarised in Table
S3.1.
PCA and correlations
A PCA model was built on the Y-block (reference data) to check for correlations and any possible
relations between these variables (hardness methods). To account for the hardness indices being
measured with different number of replicates (some in triplicate, some in duplicate and the remaining
singular), the reference values for the respective hardness measurements (that was used for the
PCA model) was taken as the averages of the respective number of replicates for each sample.
From the loadings plot (Fig. 3.1a) it can be seen that all the hardness measurement methods
investigated were important in defining the characteristics of the samples, since no variables were
lying in the center of the plot. At the same time, the PCA models showed that most of the reference
methods correlated with each other, with respect to maize hardness properties. In particular, it can
be observed how strongly correlated the variables in the rightmost part of plot (NIR, %VE, HLM and
HKM) were and how they were negatively correlated with %chop. All these considerations were
confirmed by the Spearman’s rank correlation coefficients (Table 3.2).
Since, among these variables %chop is the more related to the actual quality of the milling
process it was considered in this study as the true measure for milling quality. This assumption, and
the practicality of %chop as reference method, was confirmed by the scores plot of the PCA model
(Fig. 3.1b). In Figure 1b the dots have been coloured according to increasing (from blue to red)
values of %chop. The progressive spread of the samples along the diagonal of the plot (thus both
PCs 1 and 2 required to explain the direction of variation) can be seen as a further confirmation of
how the samples differed in milling quality, and how all the variables shown in the PCA loadings plot
(Fig.3.1a) contributed to describe this overall quality.
It can be seen from the histograms of the distribution of the reference data (Fig.S3.1) that for
most of the variables, the values do not follow a normal distribution around their mean values. It is
possible to clearly identify two different populations among the samples, in particular for %chop and
PSI. These considerations led to the hypothesis of the presence of strong non-linearities in the data
that could hinder the use of a linear method for building a regression model among the RVA curves
and the reference values for maize kernel hardness.
Stellenbosch University https://scholar.sun.ac.za

44
Table 3.2. Spearman’s rank correlation coefficients for the conventional reference hardness methods results
HKM
Protein
%chop
PSI (c/f)
%VE
NIR @ 2230 nm
HLM
0.58
0.40
-0.71
0.38
0.77
0.75
HKM
0.27
-0.43
0.72
0.81
0.86
Protein
-0.51
0.11
0.44
0.48
%chop
-0.33
-0.55
-0.61
PSI (c/f)
0.63
0.69
%VE
0.84
HLM: Hectoliter mass (g.hL-1)
HKM: Hundred kernel mass (g)
Protein: Protein content (Dumas method) %
PSI (c/f): Particle size index (coarse over fine ratio)
%VE: % vitreous endosperm as determined using NIR HSI
NIR @ 2230 nm: Near infrared spectroscopy (hardness index)
Based on observations made during unsupervised inspection of the reference methods
(variables) by means of PCA loading and scores plots and the Spearman’s rank correlation
coefficients, the correlation structure of the Y-block (reference data) had to be taken into account.
This indicated the need to use partial least squares – and, in particular the PLS2 algorithm – for
building the regression models. To be able to deal with non-linearities among the reference data, a
regression approach based on local modeling was chosen for the analysis. Therefore, the relation
between the results of conventional hardness descriptors and RVA profile was expressed by means
of a locally weighted-PLS2 approach.
RVA curves as hardness descriptor
In addition to the conventional methods, the RVA was investigated as another method to describe
maize hardness. When using the RVA, the profile (length, heating and cooling rates, holding time)
will influence the results. Therefore, three different profiles have been compared to determine an
optimum profile for describing hardness. As expected, all three profiles resulted in different
viscograms (Fig. 3.2a).
Hardness differences were evident for all three of the profiles. For example, from the standard
profile variation in peak viscosity values (equilibrium point reached between viscosity increase or
swelling and decrease or rupture) could easily be observed (Figs. 3.2b-2c). The hydration and
gelatinisation process of starch from hard maize is slower than that of soft maize due to the thicker
protein network present within hard maize (Wang & Eckhoff, 2000; Narváez-González et al., 2006).
Stellenbosch University https://scholar.sun.ac.za

45
(a)
(b)
Figure 3.1. (a) Loading of the PCA on the Y block. (b) Score plot on the Y block. The dots are coloured as a
function of the increasing %chop value. (HLM = hectoliter mass, HKM = hundred kernel mass, Prot (Dumas)
= protein content, PSI (c/f) = particle size index (coarse/fine), %VE = % vitreous endosperm, NIR @ 2230 nm
= near infrared absorbance at 2230 nm).
Stellenbosch University https://scholar.sun.ac.za

46
(a)
(b)
(c)
Figure 3.2. (a) RVA viscograms of a random maize sample, using the soft, standard and hard maize profile.
(Green line = temperature; blue line = viscosity). (b) Viscograms using the standard profile for 3 hard (red
curves) and 3 soft (blue curves) maize samples and (c) zoomed in to illustrate variability in peak viscosities.
Stellenbosch University https://scholar.sun.ac.za

47
The RVA curve data of all three the profiles showed promising results for RVA to be used for
hardness characterisation and was subjected to further multivariate data analysis (chemometrics).
Quantification of hardness properties in maize samples
The collected RVA curves were pretreated with multiplicative scatter correction (Geladi et al., 1985).
The pretreated RVA viscograms were then used to build calibration models to predict the same
hardness properties as those determined by the conventional methods. The correlations among the
reference methods and the presence of non-linearities in the RVA data suggested the use of a non-
linear method that can also take into account the correlation structure of the Y-block. For this reason,
a LW-PLS2 approach was used to compute the regression models. This entailed correlating each of
the three different RVA profiles to each of the seven conventional reference methods used to
characterise maize hardness. In particular, LW-PLS2 regression was implemented using Euclidean
distance to identify the neighbouring samples and a uniform weighting scheme (Bevilacqua et al.,
2012).
The optimal number of nearest neighbours and the optimal complexity of the PLS2 models have
been chosen during a cross-validation procedure, i.e. choosing the numbers of these parameters as
the ones leading to the minimum averaged RMSECV for the seven reference methods considered.
Since, for each RVA profile, three different analytical replicates have been collected for each
sample, each of those had been considered as an individual measurement in building and validating
the regression models. However, to be sure of not being prone to over-fitting when performing the
cross-validation for model optimisation, the three measurements of each sample were always left
out together. Leave-one-out cross-validation approach is normally used in LW-PLS2 regression to
select the best number of nearest neighbours and latent variables, but in this case this would not
represent the analytical replicates and thus the validation would not be performed at the correct level.
Accordingly, in the present study, to deal with the presence of replicate measurements and to limit
the risk of over-fitting, an alternative bootstrap-like scheme for cross-validation was adopted. At
each splitting iteration 20% of the samples were randomly selected and left out as the cross-
validation set (keeping together all the replicates corresponding to the same samples). For the
training set, resampling with repetitions was adopted as occurs in the bootstrap procedure: a random
subset of the samples not selected in the cross-validation set was chosen to constitute the training
set, allowing the possibility of being selected multiple times. This was done to have all the samples
included in the calibration and for a proper estimation of the optimal number of nearest neighbours.
In this study, the procedure had been repeated 500 times in order to compute the average prediction
error based on which model parameters were optimised.
Using the developed regression method, a different model for each RVA profile was computed,
and each resulted in an error surface fit (Fig. S3.2), where the RMSECV is reported as a function of
the latent variables and the number of nearest neighbours. Based on the results in cross-validation,
the optimal number of latent variables was set at 1 for all three the RVA profiles and the number of
Stellenbosch University https://scholar.sun.ac.za

48
nearest neighbours at 100 for the soft and standard profile, and 71 for the hard profile. The difference
in milling quality could be considered as one of the factors that introduce a non-linear response.
Therefore, once the PLS model became linear in the local space of the nearest neighbours, the
impact of this source of variability was limited, if not absent. This was consistent with the observation
that in LW-PLS only 1 LV was selected for the local models. The corresponding RMSECV for each
of the models are summarised in Table 3.3.
Optimisation of the regression model required the selection of the number of nearest neighbours
and latent variables on the basis of the minimum error in cross-validation. In spite of the limited
number of samples available, the data set was split into a training and test set to account for an
external validation of the results. For this purpose, and also to take into account that the same test
samples should be used to validate the predictions for each of the three RVA profiles, an ad hoc
procedure based on the duplex algorithm was used for representative splitting. A duplex algorithm
(Snee, 1977) was run on each of the data sets with a splitting ratio of 7:1. The relatively high splitting
ratio was chosen, given the overall number of samples, to have enough training objects to build a
reliable non-linear model. The need to adopt a non-linear approach required a higher number of
training samples than what would have been necessary when using standard PLS regression. An
intelligent criterion based on the duplex algorithm was adopted to choose the samples to be included
in the test set. This included the same diversity as the training data, in order to limit the bias toward
over-optimistic results. All the samples which were selected at least twice were included in the final
test set. Accordingly, 41 samples constituted the training set and the remaining 6 were left out as
external validation samples. For the three RVA profiles and the seven conventional hardness
methods the LW-PLS2 prediction statistics for cross- and external validation are summarised in
Table 3.4.
The RMSECV and RMSEP obtained when the RVA regression models were used to predict the
reference values were quite low. They were often lower than those of the respective analytical
reference methods. Although the seven Y variables all express hardness, each of them is based on
a particular instrumental determination, with different associated errors and produces a result which
is defined on a different scale. The order of magnitude of the errors would thus be expected to differ.
Similar results were obtained when estimating the RMSEP in double cross-validation. When the
same accuracy could not be reached, the errors of the RVA regression methods were always
comparable with the laboratory errors of the reference methods. In particular, the developed RVA
regression models allowed higher accuracies than those associated with the reference data for HLM
and HKM, for which an error of 2.0 g.hL-1 and 4.0 g can be expected (Voca et al., 2009). The PSI
method can be associated with a laboratory error of 2.24% (Manley et al., 2002) although this error
was reported for mean PSI results and not the ratio between the PSI fractions as in this study.
Stellenbosch University https://scholar.sun.ac.za

49
Table 3.3. RMSECV results for the conventional hardness methods, using three different RVA profiles.
HLM HKM Protein %chop PSI (c/f) %VE
NIR @
2230 nm
RVA Soft
profile
0.8 3.54 0.39 1.71 0.49 3.69 1.52
RVA
Standard
profile
0.82 3.37 0.38 1.7 0.47 3.53 1.45
RVA
Hard
profile
0.83 3.71 0.36 1.79 0.52 3.78 1.65
HLM: Hectoliter mass (g.hL-1)
HKM: Hundred kernel mass (g)
Protein: Protein content (Dumas method) %
PSI (c/f): Particle size index (coarse over fine ratio)
%VE: % vitreous endosperm as determined using NIR HSI
NIR @ 2230 nm: Near infrared spectroscopy (hardness index)
Table 3.4. LW-PLS2 prediction statistics for cross-validation (n = 41) and external (n = 6) validation for the
conventional hardness methods, using the three RVA profiles
RVA soft profile RVA standard profile RVA hard profile
RMSECV RMSEP RMSECV RMSEP RMSECV RMSEP
HLM 0.91 1.5 0.92 1.45 0.9 2.09
HKM 3.74 3.78 3.81 3.92 4.09 4.94
Protein 0.45 0.35 0.43 0.36 0.42 0.28
%chop 1.87 1.9 1.91 2.1 1.91 2.75
PSI (c/f) 0.54 0.62 0.58 0.64 0.58 0.82
%VE 4.15 6.52 4.46 6.55 4.48 7.78
NIR @
2230 nm
1.64 1.99 1.74 1.89 1.84 2.84
HLM: Hectoliter mass (g.hL-1)
HKM: Hundred kernel mass (g)
Protein: Protein content (Dumas method) %
PSI (c/f): Particle size index (coarse over fine ratio)
%VE: % vitreous endosperm as determined using NIR HSI
NIR @ 2230 nm: Near infrared spectroscopy (hardness index)
Stellenbosch University https://scholar.sun.ac.za

50
At the same time, the method under study enabled an objective measure of the %VE whose
reference method is known to be very subjective to the operator and, consequently, affected by a
high uncertainty of the results. On the contrary, the Dumas protein method is known to be very
accurate and reproducible with an expected error of 0.2%. The accuracy of the %chop reference
method has been found to be 0.6%, by repeating the same measure 7 times. It should, however, be
stressed that this method requires big and expensive equipment, large samples and is also time-
consuming. The method proposed in this work allows an accurate estimation (with only a slightly
higher error) of the same parameters without any further measure. NIR absorbance values at 2230
nm were only single measurements with no known errors.
These results confirm the assumption that the RVA viscograms used with chemometrics offer an
easy and simple way to predict the hardness of maize samples which can be related to milling quality.
The results obtained from the three respective profiles did not differ. Irrespective of the RVA profile
prediction of hardness properties should be possible.
Finally, as a further validation, a hybrid double cross-validation procedure was followed to assess
whether the model could also be applicable to the crops harvested in different locations. Four
cancelation groups were considered, each corresponding to a different geographical location. To
take into account the relatively low number of samples available, each of the different locations was
in turn selected to constitute the external validation set. The remaining samples were used to build
the model, whose optimal complexity and dimension of the local neighbourhood were estimated
according to a bootstrap procedure similar to that described earlier.
The prediction errors obtained by this procedure are summarised in Table S3.2. These results
are comparable to those obtained from the use of a single representative test set (Table 3.4) and
also to the results of the internal validation only (Table 3.3). This suggests that the proposed
approach could be in principle applicable also to samples coming from different locations.
Conclusion
This study attempted to provide a solution to the problem of selecting the most appropriate method
that best describe maize hardness milling quality. The different conventional methods were all
shown to contribute towards describing hardness with %chop being the most appropriate to
determine milling quality. The RVA was shown as being useful, not only for describing pasting
properties of starch, but also to characterise maize hardness. Using LW-PLS2 regression, calibration
models were developed that predicted the conventional hardness methods with accuracies lower or,
at least, comparable to the laboratory error. Using different RVA profiles did not influence the
RMSECV and RMSEP results thus, any RVA profile could be used to predict the hardness of maize
samples once a regression model has been developed and appropriately validated.
Stellenbosch University https://scholar.sun.ac.za

51
References
AACC (1999a). Approved Methods of Analysis, 11 th Ed. Method 44-40.01. Moisture - Modified
Vacuum-Oven Method. Approved November 3, 1999. St Paul, MN, U.S.A.: AACC
International.
AACC (1999b). Approved Methods of Analysis, 11th Ed. Method 46-30.10. Crude Protein -
Combustion Method. Approved November 3, 1999.: St. Paul, MN, U.S.A.: AACC
International.
AACC (1999c). Approved Methods of Analysis, 11th Ed. Method 76-21.01. General Pasting Method
for Wheat or Rye Flour or Starch Using the Rapid Visco Analyser. Approved November 3,
1999.: St. Paul, MN, U.S.A.: AACC International.
Agu, R., Bringhurst, T. & Brosnan, J. (2006). Production of grain whisky and ethanol from wheat,
maize and other cereals. Journal of the Institute of Brewing, 112, 314-323.
Almeida-Dominguez, H.D., Suhendro, E.L. & Rooney, L.W. (1997). Factors affecting Rapid Visco-
Analyser curves for the determination of maize kernel hardness. Journal of Cereal Science,
25, 93-102.
Bevilacqua, M., Bucci, R., Materazzi, S. & Marini, F. (2012). Application of near infrared (NIR)
spectroscopy coupled to chemometrics for dried egg-pasta characterization and egg content
quantification. Food Chemistry, 140, 726-734.
Centner, V. & Massart, D.L. (1998). Optimization in locally weighted regression. Analytical
Chemistry, 70, 4206-4211.
Doublier, J.L., Llamas, G. & Le Meur, M. (1987). A rheological investigation of cereal starch pastes
and gels. Effect of pasting procedures. Carbohydrate Polymers, 7, 251-275.
Downey, G., Byrne, S. & Dwyer, E. (1986). Wheat trading in the Republic of Ireland: The utility of a
hardness index derived by near infrared reflectance spectroscopy. Journal of the Science of
Food and Agriculture, 37, 762-766.
Emvula, S. (2012). Assessment of hectolitre mass (HLM) equipment and HLM measurements of
oats. Masters. Stellenbosch University,
Fox, G. & Manley, M. (2009). Hardness methods for testing maize kernels. Journal of Agricultural
and Food Chemistry, 57, 5647-5657.
Geladi, P., MacDougall, D. & Martens, H. (1985). Linearization and scatter-correction for near-
infrared reflectance spectra of meat. Applied spectroscopy, 39, 491-500.
Hamilton, T., Hamilton, B.C., Johnson, B.C. & Mitchell, H. (1951). The dependence of the physical
and chemical composition of the corn kernel on soil fertility and cropping system. Cereal
Chemistry, 28, 163-176.
Ji, Y., Wong, K., Hasjim, J., Pollak, L.M., Duvick, S., Jane, J. & White, P.J. (2003). Structure and
function of starch from advanced generations of new corn lines. Carbohydrate Polymers, 54,
305-319.
Stellenbosch University https://scholar.sun.ac.za

52
Johnson, D.Q. & Russell, W.A. (1982). Genetic variability and relationships of physical grain-quality
traits in the BSSS population of maize. Crop Science, 22, 805-809.
Lee, K.M., Herrman, T.J., Rooney, L.W., Jackson, D.S., Lingenfelser, J., Rausch, K.D., McKinney,
J., Iiams, C., Byrum, L., Hurburgh, J.C.R., Johnson, L.A. & Fox, S.R. (2007). Corroborative
study on maize quality, dry-milling and wet-milling properties of selected maize hybrids.
Journal of Agricultural and Food Chemistry, 55, 10751-10763.
Manley, M., Van Zyl, L. & Osborne, B. (2002). Using Fourier transform near infrared spectroscopy
in determining kernel hardness, protein and moisture content of whole wheat flour. Journal
of Near Infrared Spectroscopy, 10, 71-76.
Martens, H. & Næs, T. (1985). Multivariate calibration. II. Cemometric methods. Trends in Analytical
Chemistry, 3, 266-271.
Narváez-González, E.D., de Dios Figueroa-Cárdenas, J., Taba, S., Tostado, E.C., Peniche, R.Á.M.
& Sánchez, F.R. (2006). Relationships between the microstructure, physical features, and
chemical composition of different maize accessions from Latin America. Cereal Chemistry,
83, 595-604.
O'Kennedy, K. (2011). Characterisation of zein from South African maize of varying endosperm
texture. Masters Thesis in Food Science. Stellenbosch University, South Africa.
Paiva, E., Kriz, A.L., Peixoto, M.J.V.V.D., Wallace, J.C. & Larkins, A.B. (1991). Quantitation and
distribution of ã–zein in the endosperm of maize kernels. Cereal Chemistry, 68, 276-279.
Peplinski, A.J., Paulsen, M.R., Anderson, R.A. & Kwolek, W.F. (1989). Physical, chemical, and dry-
milling characteristics of corn hybrids from various genotypes. Cereal Chemisty, 66, 117-120.
Ross, A., Walker, C., Booth, R., Orth, R. & Wrigley, C. (1987). The Rapid Visco-Analyzer: a new
technique for the estimation of sprout damage. Cereal Foods World, 32, 827-829.
Anonymous (2013). SAGIS (South African Grain Information Services). Demand and supply table.
[Internet document]. http://www.sagis.org.za/Flatpages/SMB%20Summary.asp. 29.7.2013.
Sahai, D., Buendia, M. & Jackson, D. (2001). Analytical techniques for understanding nixtamalized
corn flour: particle size and functionality relationships in a Masa flour Sample 1. Cereal
Chemistry, 78, 14-18.
Sandhu, K.S. & Singh, N. (2007). Some properties of corn starches II: Physicochemical,
gelatinization, retrogradation, pasting and gel textural properties. Food Chemistry, 101, 1499-
1507.
Seetharaman, K., Tziotis, A., Borras, F., White, P.J., Ferrer, M. & Robutti, J. (2001). Thermal and
functional characterization of starch from Argentinean Corn1. Cereal Chemistry, 78, 379-386.
Snee, R.D. (1977). Validation of regression models: methods and examples. Technometrics, 19,
415-428.
Voca, N., Varga, B., Kricka, T., Curic, D., Jurisic, V. & Matin, A. (2009). Progress in ethanol
production from corn kernel by applying cooking pre-treatment. Bioresource Technology,
100, 2712-2718.
Stellenbosch University https://scholar.sun.ac.za

53
Wang, D. & Eckhoff, S.R. (2000). Effect of broken corn levels on water absorption and steepwater
characteristics. Cereal Chemistry, 77, 525-528.
Watson, S.A. (1987). Structure and composition. In: Corn chemistry and technology (edited by S.A.
Watson & P.E. Ramstad). Pp. 53-82. St. Paul, Minnesota, USA: American Association of
Cereal Chemists, Inc.
Wold, S., Martens, H. & Wold, H. (1983). The multivariate calibration problem in Chemistry 576
solved by the PLS method. Heidelberg, Germany: Springer-Verlag.
Yamin, F., Lee, M., Pollak, L. & White, P. (1999). Thermal properties of starch in corn variants
isolated after chemical mutagenesis of inbred line B73 1. Cereal Chemistry, 76, 175-181.
Stellenbosch University https://scholar.sun.ac.za

54
Supplementary material:
Figure S3.1. Histograms of the distribution of the values for each variable. (HLM = hectoliter mass, HKM =
hundred kernel mass, Protein = protein content (Dumas method) %, PSI (c/f) = particle size index (coarse/fine),
%VE = % vitreous endosperm, NIR @ 2230 nm = near infrared spectroscopy (hardness index).
Stellenbosch University https://scholar.sun.ac.za

55
Figure S3.2. LW-PLS2 modeling: plot of the error surface, reporting the RMSECV of the model built with the
RVA curves for the standard profile as a function of the number of nearest neighbours and the number of latent
variables, used for the selection of optimal model parameters.
Stellenbosch University https://scholar.sun.ac.za

56
Table S3.1. Descriptive statistics of the conventional reference hardness methods results
Unit n Range Mean SD
Hectoliter mass g.hL-1 48 71.9 – 81.7 77.05 2.18
Hundred kernel mass g 49 20.7 – 46.7 36.13 0.58
Protein content % 45 6.6 – 12.1 8.13 1.14
Chop content % 49 19 – 34.33 22.55 4.19
Particle size index
(coarse/fine)
49 0.9 – 3.9 1.9 0.86
Vitreous endosperm
content
% 49 5.59 – 46.49 23.17 9.78
NIR absorbance at 2230 nm 49 0 – 13.68 6.97 3.84
Stellenbosch University https://scholar.sun.ac.za

57
Table S3.2. LW-PLS2 prediction statistics for the conventional hardness methods, using the three RVA
profiles, as estimated by double cross-validation across the four localities
Unit RVA soft profile RVA standard
profile
RVA hard
profile
RMSEP RMSEP RMSEP
Hectoliter mass g.hL-1 1.66 1.65 1.79
Hundred kernel mass g 3.91 4.01 5.02
Protein content % 0.37 0.36 0.32
Chop content % 1.93 2.15 2.97
Particle size index
(coarse/fine)
0.63 0.70 0.81
Vitreous endosperm content % 6.49 6.80 7.98
NIR absorbance at 2230 nm 1.87 1.97 2.87
Stellenbosch University https://scholar.sun.ac.za

58
Chapter 4
Non-destructive estimation of maize (Zea mays L.) kernel hardness by means
of an X-ray micro-computed tomography (µCT) density calibration*
Abstract
An X-ray micro-computed tomography (µCT) density calibration was constructed for whole maize
(Zea mays L.) kernels from polymers ranging in absolute densities from 0.9 to 2.2 g.cm-3. The
resulting linear equation was used to estimate the densities of two regions-of-interest, i.e. vitreous
and floury endosperm, as well as that of the entire maize kernel. The sample set comprised 16 maize
kernels (8 hard and 8 soft). Validation of entire kernel density was performed by comparing
estimated and measured (actual) masses (r = 0.99; standard error of measurement = 0.01 g). In
addition percentage cavity (%cavity) and percentage porosity (%porosity) were quantified from the
X-ray images. As determined with ANOVA, floury, vitreous and entire kernel endosperm densities
as well as %cavity and %porosity significantly (P < 0.05) contributed to the variation within the
hardness classes. Hardness classification was attempted using a receiver operating characteristic
(ROC) curve. Threshold values of 1.48 g.cm-3, 1.67 g.cm-3 and 1.30 g.cm-3 were determined for the
entire kernel, vitreous and floury endosperm densities, respectively at a maximum of 100% sensitivity
and specificity. Classification was possible from % porosity values of the entire kernel, which are
easier to determine, at 88% accuracy. Efficient maize kernel hardness classification is required by
the dry-milling industry when maize is milled into a meal and used as a food source. Optimum quality
and yield can only be obtained during the milling process if maize of appropriate hardness is used
as raw material.
*Submitted for publication as: Guelpa A, Du Plessis A, Kidd M & Manley M (2014). Non-destructive estimation of maize
(Zea mays L.) kernel hardness by means of an X-ray micro-computed tomography (µCT) density calibration. Food and
Bioprocess Technology.
Stellenbosch University https://scholar.sun.ac.za

59
Introduction
Maize (Zea mays L.) is a vital source of energy and one of the most important dietary staple foods
globally. It is used for human consumption in different forms, from specialised foods in developed
countries to staple food in undeveloped countries (Malvar et al., 2008). Maize is predominantly
processed into maize meal using dry-milling, comprising milling into different particle sizes, after de-
germing (removal of germ and pericarp).
Two types of endosperm, vitreous and floury, are present in maize kernels (Watson, 1987; Paiva
et al., 1991). The vitreous endosperm is harder, of higher density, more translucent and situated to
the outside of the kernel, whereas the floury endosperm is softer, of lower density, mealy textured
and found in the center of the kernel (Watson, 1987; Paiva et al., 1991). Due to the starch granules
of the floury endosperm being less compacted, many intergranular air spaces are present. These
are absent in vitreous endosperm (Robutti et al., 1974; Dombrink-Kurtzman & Knutson, 1997).
Furthermore, cavities (or cracks) exist within maize kernels (Chang, 1988; Huber & BeMiller, 1997;
De Carvalho et al., 1999; Huber & BeMiller, 2000; Gustin et al., 2013), predominantly due to
dehydration when the endosperm collapses to leave relative large air spaces. It is thus apparent that
the microstructure of the endosperm types present in maize kernels differs.
Hard maize kernels have better milling quality (resulting in a higher milling yield) compared to
softer maize. Many methods have been used since the 1950’s to determine the hardness of maize.
These methods have been extensively reviewed by Fox and Manley (2009) and include measuring
resistance to grinding and abrasion (Lee et al., 2007); yield of grits (Wu, 1992); starch gelatinisation
properties (Almeida-Dominguez et al., 1997); as well as determination of particle size index (PSI)
subsequent to grinding and sieving (Pomeranz et al., 1984; Wu, 1992). The use of near infrared
(NIR) reflectance and NIR transmittance spectroscopy have also been widely investigated
(Pomeranz et al., 1984; Robutti, 1995; Eyherabide et al., 1996). Other methods include hand
dissection which determines the ratio of vitreous and floury endosperm and machine vision
technology for non-destructive classification of maize kernels (Erasmus, 2003). Near infrared
hyperspectral imaging (NIR HSI) has been used to distinguish between individual maize kernels
differing in hardness (Manley et al., 2009; Williams et al., 2009). It was also shown that NIR HSI
could be used to classify maize kernels without the need for hardness reference data (McGoverin &
Manley, 2012). This was possible due to the spatial dimension, in addition to the spectral dimension,
offered by NIR HSI. Quality properties such as protein, starch, fat and fiber contents (Blandino et
al., 2010); kernel density (Blandino et al., 2010) and protein (zein) composition (Dombrink-Kurtzman
& Bietz, 1993; Robutti et al., 1997) have also been used to characterise kernel hardness and thus
dry-milling performance. Density measurements were performed by means of a floating test where
a variable density solution separated the kernels based on density differences (Blandino et al., 2010;
Blandino et al., 2012). A similar method, i.e. gas pycnometry was used to characterise genotypic
and phenotypic diversity in maize (Siska & Hurburgh, 1995).
Stellenbosch University https://scholar.sun.ac.za

60
Micro-computed tomography uses the differences in X-ray attenuation arising principally from
differences in density and atomic composition within the material (Chawanji et al., 2012; Zhu et al.,
2012; Cnudde & Boone, 2013). For a particular material (at a specific energy) the X-ray attenuation
is approximately proportional to the material’s density (Sinka et al., 2004). The main advantage of
the X-ray µCT technique is the ability to perform non-destructive and non-invasive capturing of high-
resolution three dimensional (3-D) detail, thus visualising and characterising microstructural
features.
Measurement of density variation in pharmaceutical tablets (Sinka et al., 2004; Busignies et al.,
2006), wood test pieces (Lindgren et al., 1992), commercial plastics (Du Plessis et al., 2013) and
compacted parts, i.e. ceramics (Burch, 2002) has been investigated using X-ray µCT. In the case
of pharmaceutical tablets compaction of the tablets may impact on efficient packaging and storage.
This was effectively measured in terms of density variation using X-ray µCT (Sinka et al., 2004).
Similarly, Meincken and Du Plessis (2013) observed the impact of forest fires on the decomposition
of major chemical components in wood by determining the density and dimension of the wood
samples.
X-ray µCT has been successfully applied in food studies, i.e. Italian salami (Frisullo et al., 2009),
mayonnaise (Laverse et al., 2012), cream cheese (Laverse et al., 2011b) and yoghurt (Laverse et
al., 2011a). The microstructure of loose-packed and compacted milk powders has also been studied
(Chawanji et al., 2012). The increasing number of X-ray imaging applications for food and agricultural
produce have been illustrated recently in reviews by Donis-González et al. (2014) and Kotwaliwale
et al. (2011). X-ray µCT has been applied to whole grain rice specifically to study kernel structure of
high-amylose and wild-type rice (Zhu et al., 2012). The structure of porous cereal products (Van
Dalen et al., 2007) and maize flakes (Chaunier et al., 2007) has also been evaluated. The study of
porous products is possible since X-ray µCT enables imaging of cavities and thus real density
variations within a kernel; this is not possible with other imaging methods. The development of a
density calibration and subsequent measurement of densities have not been considered in these
food studies, although a recent study by Gustin et al. (2013) demonstrated that individual kernel
density and volume could be accurately measured using X-ray µCT. It is not clear how the latter
measurements were made. It is assumed that the pycnometer was used as reference method.
Gustin et al. (2013) showed that the embryo (germ) had little impact on overall kernel density and
that grain fill showed a strong correlation with density. The usefulness of single kernel near infrared
(NIR) predictions of density and volume was also illustrated.
X-ray µCT poses to be very useful when a region within a sample under investigation needs to
be excluded (i.e. germ and cavities) non-destructively. X-ray µCT therefore allows for true
determination of volumes and densities of desired regions-of-interest (ROIs). The most prominent
maize kernel characteristics, along with size, that determines kernel quality are density which are
closely related with kernel hardness (Lee et al., 2006). Mestres et al. (1991) showed that maize
hardness could be evaluated through density measurements with almost 90% accuracy. Similarly,
Stellenbosch University https://scholar.sun.ac.za

61
Wu and Bergquist (1991) reported that grit yield (an indicator of maize hardness) correlated with
density (r = 0.89).
This paper presents the application of an X-ray μCT density calibration to non-destructively
estimate kernel hardness from calculated density, percentage porosity (%porosity) and percentage
cavity (%cavity) of the entire maize kernel as well as that of the selected ROIs (vitreous and floury
endosperm).
Material and methods
Maize samples
Sixteen whole maize kernels (eight kernels from each hybrid) were randomly selected from two white
maize hybrids, PAN6Q445B and H2D1 (not released as commercial hybrid as yet), differing in kernel
hardness. These two hybrids were chosen, as extremes based on hardness determinations, from a
sample set of 49. The hybrids originated from the 2012 harvest maize breeding trials and were
kindly supplied by PANNAR Seeds (Greytown, South Africa).
Polymers used for density calibration
The polymers, used as calibration standards, were acquired from Maizey Plastics (Cape Town,
South Africa) and each was cut into a cylinder of 10 mm thickness and 25 mm diameter. These
polymers included: polytetrafluoroethylene (PTFE) (2.15 g.cm-3); sustanat polycarbonate (PC) (1.2
g.cm-3); ultra-high molecular weight polyethylene (UHMW PE) (0.92 g.cm-3); polypropylene (PP)
(0.91 g.cm-3); high density polyethylene (HDPE) (0.91 g.cm-3); polyethylene terephthalate (PET)
(1.38 g.cm-3); and sustarin C acetal / nylon (1.15 g.cm-3) (Du Plessis et al., 2013). The polymers used
to construct the linear density calibration were selected as such that their densities (0.9 to 2.2 g.cm-
3) overlapped with typical densities of whole maize kernels (ca. 1.18 to 1.36 g.mL-1) as determined
with the floating test.
Hardness determination of maize kernels
Particle size index
The particle size index (PSI) method, using milling followed by sieving, was used to differentiate
between hard and soft maize hybrids. The samples were milled using a cyclone Laboratory Mill
3100 (Perten, Hägersten, Sweden) fitted with a 1 mm sieve. A two sieve method (O'Kennedy, 2011)
was used, where a 150 µm sieve was placed on a 75 µm sieve, fitted with a receiving pan and lid.
Two sets of pans and sieves (Retsch, Haan, Germany) were stacked on top of each other and placed
in a Retsch AS 200 Tap Sieve Shaker (Retsch, Haan, Germany) for 10 minutes. Three fractions,
PSI1, PSI2 and PSI3 were determined. For the determination of the first fraction (PSI1), the 150 µm
sieve was weighed (W150 µm sieve) to the nearest 0.001 g. Thereafter, 10 ± 0.01 g of ground maize
was weighed (Wmaize) into the 150 µm sieve together with 10 ± 0.01 g whole wheat (Wwheat on 150 µm
Stellenbosch University https://scholar.sun.ac.za

62
sieve). Whole wheat was added to facilitate efficient sieving. After the sieving and tapping process,
the fine maize meal adhering to the bottom of the 150 µm sieve was gently brushed off into the 75
µm sieve and the 150 µm sieve was weighed (W1). Equation 1 was used to determine PSI1:
PSI1 = (W1 – (W150 µm sieve + Wwheat on the 150 µm sieve)) / Wmaize […eq. 1]
Thereafter, the fine maize meal adhering to the bottom of the 75 µm sieve was gently brushed off
into the receiving pan and the 75 µm sieve was weighed (W2). The weight of the 75 µm sieve was
recorded (to the nearest 0.001g) when it was still empty (W75 µm sieve) as well as that of the whole
wheat 10 ± 0.01 g placed on the 75 µm sieve (Wwheat on 75 µm sieve). The second PSI fraction (PSI2) was
determined according to equation 2:
PSI2 = (W2 - (W75 µm sieve + Wwheat on the 75 µm sieve)) / Wmaize […eq. 2]
For the determination of PSI3 (eq. 3), the empty receiving pan weight (Wpan) (to the nearest 0.001g)
was deducted from that of the pan, weighed after the sieving and shaking step (W3).
PSI3 = (W3 – Wpan) / Wmaize […eq. 3]
The higher the value of PSI1 the harder the kernels; high PSI2 and PSI3 values indicated soft kernels.
In addition, the ratio between larger (PSI1) and smaller particle sizes (PSI2 + PSI3) was calculated to
give a course over fine (c/f) ratio, where a higher value indicated harder (more dense) samples and
vice versa (eq. 4):
c/f = PSI1 / (PSI2 + PSI3) […eq. 4]
The PSI measurements were done in duplicate for each sample.
Floating test
A floating test (Blandino et al., 2010; Blandino et al., 2012) was used to determine the densities
(g.mL-1) of the whole maize kernel samples (n = 16). Each individual kernel was placed in a 120 mL
tetrachloroethylene (Kimix, Epping Industrial, South Africa; density 1.62 g.mL-1) and 40 mL petroleum
ether (Kimix, Epping Industrial, South Africa; density 0.653 g.mL-1) solution in individual Erlenmeyer
flasks (250 mL). Petroleum ether was added, after a twenty second waiting period, in 5 mL
increments to each flask in order to gradually decrease the solution’s density. The moment a kernel
sank to the bottom of the flask, the density of that solution was calculated which equated the density
of the kernel. After sufficient drying of the kernel with a paper towel the test was repeated with the
Stellenbosch University https://scholar.sun.ac.za

63
same kernel (duplicate measurements). After completion of the floating test, the same 16 kernels
were subjected to X-ray µCT scanning.
Scanning electron microscopy
A thin slice (ca. 1 mm) of a maize kernel (sliced with a Solingen blade) was mounted onto double
sided carbon tape. The slice was coated with gold dust, using a 5150A sputter coater (HHV,
Crawley, United Kingdom). The scanning electron microscopy (SEM) micrographs were taken
with a LEO1430 VP Scanning electron microscope (Zeiss, Germany) at a voltage of 7 kV and
4500 times magnification.
X-ray micro computed tomography scanning
X-ray scans were acquired using a commercial micro-focus X-ray computed tomography system,
i.e. the Phoenix V|Tome|X L240 (General Electric Sensing and Inspection Technologies / Phoenix
X-ray, Wunstorff, Germany), equipped with a nano-focus tube at the Stellenbosch University CT
Scanner facility (www.sun.ac.za/ctscanner). The system was integrated with Phoenix Datos
acquisition and reconstruction software (General Electric Sensing and Inspection Technologies /
Phoenix X-ray, Wunstorff, Germany). Image acquisition was set at 1 s per image with 1300 images
recorded in one rotation at 13.4 µm voxel size. A scan took approximately 30 minutes to complete.
In this work 60 kV was used for X-ray generation after it was determined that the grey value
differences at each of two different energies (60 and 230 kV) resulted in normalised values close to
one for both the polymers and maize kernels as explained earlier by (Du Plessis et al., 2013). This
also enabled the use of polymers for the calibration construction.
The polymer discs were stacked on top of each other and placed on florist oasis, along with 8
single maize kernels, also mounted in florist oasis as illustrated in Figure 4.1. The low density of
florist oasis makes it a suitable mounting material due to it being easily distinguishable from the
subjects of interest. The mounted samples were placed on the specimen stage and rotated along
the axis, perpendicular to the beam direction. Two such scans were required to collect the images
of all 16 kernels (8 kernels per scan), according to the method of Du Plessis (2013). The aim of
scanning 8 kernels in one scan volume at lower resolution was to demonstrate the possibility of
having high throughput µCT scans.
A further high resolution scan was acquired from one of the 16 maize kernels, using a Phoenix
Nanotom S system (General Electric Sensing and Inspection Technologies / Phoenix X-ray,
Wunstorff, Germany) with Molybdenum target. Energies of 50 kV accelerating voltage was needed
to obtain a 6 µm resolution for the entire kernel. Averaging and skipping of images were included to
improve image quality resulting in scan time of 2 h. In addition a 3 µm resolution scan of a sub-
volume of the kernel was also done.
Stellenbosch University https://scholar.sun.ac.za

64
(a)
(b)
Figure 4.1. Stack of 7 polymer discs, used for the density calibration, along with 8 maize kernels with (a)
showing the florist oasis, used for mounting and (b) with the mounting material removed.
Data processing
A series of two-dimensional (2-D) X-ray projection images were obtained from a sample rotating
through 360 degrees. The projections images are reconstructed into a volume data set using General
Electric Datos software. The process of reconstruction comprises filtered back-projection algorithms
and the grey values in a rendered CT image then represent the attenuation in each pixel (Singhal et
al., 2013). This relates to a higher density phase that appears brighter compared to the darker
representation of the lower density material. This 3-D data set was rendered and analyzed using
VGStudio MAX 2.2 (Volume Graphics, Heidelberg, Germany).
During the image processing step, the maize kernels were scanned simultaneously with the
polymer discs to facilitate calibration and direct comparison of different scans. In µCT the resulting
grey values depend on the densest object in the scan volume (in this case the PTFE disc with a
density of 2.15 g.cm-3). This is because the filtered back projection reconstruction algorithm
normalises the grey values within the range, from minimum to maximum (Kak & Slaney, 1988). By
using the same densest object in subsequent scans, and using that object for normalisation, the grey
values between scans could be directly compared.
The grey values of the polymer discs were acquired by selecting a representative volume from
each disk. Each voxel had an associated grey value depending on the material’s density and atomic
number. The average grey value of each homogeneous polymer disk was therefore a measure of
its density. To generate the calibration function, a linear function (eq. 5) was used:
Stellenbosch University https://scholar.sun.ac.za

65
Actual density (g.cm-3) = m x grey value + c […eq. 5]
where, m = the slope and c = intercept.
The average grey values for the entire kernels and ROIs were obtained from VGStudio MAX 2.2
after excluding the germ (Fig. 4.2). The densities of the germ and vitreous endosperm regions were
very similar and prevented accurate separation between the vitreous and floury endosperm regions.
Therefore, the germ region was manually removed for each of the maize kernels, using the VGStudio
Max 2.2 Drawing tool.
Figure 4.2. 3-D µCT image of a maize kernel with its germ removed.
Large air spaces (cavities) present in whole maize kernels were selected using the Region
growing tool (VGStudio MAX 2.2). These areas were selected manually and the volumes were
acquired on the 13.4 µm scans, using the Volume analyser function (VGStudio MAX 2.2). For each
kernel the cavities were calculated as a percentage of the total volume of the entire kernel
(%cavaties).
To indicate the arrangement and quantity of pores (intergranular air pockets) present in the
endosperm, the Thresholding function (VGStudio MAX 2.2) was used in combination with the Defect
detection module (VGStudio MAX 2.2). These functions were also applied to the 13.4 µm scans
Stellenbosch University https://scholar.sun.ac.za

66
after the cavities were excluded. Air pore volumes comprising more than 8 adjacent dark voxels
were seen as pores. Hence, minimum detectable pore size is dependent on scan resolution, making
typical spherical pores of approximately 27 µm in diameter detectable in the 13.4 µm scan. For each
kernel the porosity was calculated as a percentage of the total volume of the entire kernel (%porosity)
(Gondek et al., 2013).
Statistical procedures
Analysis of variance
One-way analysis of variance (ANOVA) was performed to compare average measurements for the
respective measures (%cavity, %porosity, entire kernel density, vitreous endosperm density and
floury endosperm density) with respect to hardness classes, i.e. hard and soft. ANOVA analyses
were performed using STATISTICA version 11 (StatSoft, Inc., Tulsa, USA).
Comparison of density measurements (μCT and floating test)
The floating test and X-ray scans were performed on the same 16 kernels. In spite of the results not
recorded in the same units (g.mL-1 and g.cm-3, respectively), were they comparable and the
intraclass correlation (ICC) coefficients could be determined. The ICC coefficients were determined
as the ICC agreement that correlates measurements with each other, while taking into account the
differences in absolute values of the respective measurements, and the ICC consistency that only
correlates measurements. The ICC agreement was determined to express variation in density
measured with the two respective density measurement methods (μCT and floating test). The ICC
consistency, on the other hand, was determined to reflect the correlation between the two density
measurement methods. All ICC calculations were done using the R statistical programming language
(R Package Concord). The correlation coefficient (r), which is a less strict correlation method than
the ICC, and the standard error of measurement (SE) between the two measurement methods were
determined using STATISTICA version 11 (StatSoft, Inc., Tulsa, USA).
Validation of density calibration
The density calibration was validated by measuring the mass of each of the 16 kernels, using a
laboratory scale (Precisa, Instrulab, Johannesburg, South Africa) (accurate to 3 decimals) and
comparing these to the estimated masses (Gustin et al., 2013). The mass of each kernel was
calculated from the volume (mm3) and density (g.cm-3) as determined from the µCT images. The
respective volumes were determined using the Volume analysis tool (VGStudio MAX 2.2) and the
densities were acquired from the density calibration. The mathematical relationship between mass,
volume and density was used to calculate the predicted masses (eq. 6):
Mass = volume x density […eq. 6]
Stellenbosch University https://scholar.sun.ac.za

67
Correlation coefficients
Spearman’s rank correlation coefficients were used to test the strength of the relationships between
pairs of microstructural traits: %cavity, %porosity, entire kernel density, vitreous endosperm density
and floury endosperm density. Correlation analysis was performed using Microsoft Excel 2010
(Microsoft Corporation, Seattle, WA).
Classification models
A receiver operating characteristic (ROC) curve was used to separate the maize kernels into hard
and soft hybrid classes based on entire kernel density, vitreous and floury endosperm densities as
well as %cavity and %porosity. An ROC curve is a plot of sensitivity on the y-axis against 1-
specificity on the x-axis for varying values of the threshold. The optimal threshold is determined by
maximising the sum of sensitivity and specificity. Sensitivity is the percentage hard kernels correctly
classified and specificity is the percentage soft kernels correctly classified. ROC analyses were
performed using STATISTICA version 11 (StatSoft, Inc., Tulsa, USA).
Principal component analysis
Principal component analysis (PCA) was performed on the X-ray µCT derived variables (entire kernel
density, vitreous and floury endosperm densities as well as %cavities and %porosity). To determine
the relationship amongst the variables, a PCA bi-plot, which combines the scores and loadings, were
used. PCA analyses was performed using STATISTICA version 11 (StatSoft, Inc., Tulsa, USA).
Results and discussion
Although originally used to determine wheat hardness, the PSI method (AACC, 1999) is also
recognised as a suitable method for maize hardness measurements (Pomeranz et al., 1984; Wu,
1992). For maize hardness PSI determinations, a two sieve method is however more appropriate.
Also, the c/f ratio correlated better with milling quality compared to other conventional tests such as
the floating test, hectolitre mass and the Stenvert test, probably due to the efficient separation of the
vitreous and floury fractions (Blandino et al., 2010). In the current study the c/f ratio (c/f = PSI1 / (PSI2
+ PSI3)) was thus used to select two maize hybrids which differed maximally in hardness properties
and thus kernel density, from a set of 49 samples. The c/f ratio for the 49 samples was 1.92±0.88
(mean±SD) with that of the selected hard and soft hybrids determined as 3.90±0.37 and 1.56±0.31,
respectively (Table 4.1).
Stellenbosch University https://scholar.sun.ac.za

68
Table 4.1. The results from PSI (n = 49) that was used to select two hybrids that differs maximally in hardness
Range Mean±SD
PSI1 0.47 – 0.80 0.64±0.09
PSI2 0.12 – 0.33 0.20±0.06
PSI3 0.08 – 0.26 0.18±0.06
c/f 0.85 – 3.92 1.92±0.88
SD: Standard deviation
Microstructure of maize kernels
In the 2-D μCT slices, taken longitudinally from approximately the same plane and region (center of
the kernel) of both the hard (Fig. 4.3a) and soft (Fig. 4.3b) hybrids, large cavities in the floury
endosperm were evident. This was observed in all 16 scanned kernels, but much more prominent in
the soft hybrid kernels (Table 4.2). Proportionally, soft kernels have more floury endosperm that is
prone to form cracks, than in the case of hard kernels. When moisture loss is experienced the
absence of a thick continues protein matrix covering the starch granules in the floury endosperm
causes the formation of these cracks that later develop into cavities. Such cavities have been
reported to account for up to 13% of the volume of some hybrid kernels (Chang, 1988; Gustin et al.,
2013). The %cavities quantified for all 16 kernels (1.79%), as determined in this study, are depicted
in Table 4.2. The %cavities of the soft hybrid (2.68%) was significantly (P < 0.05) higher than that of
the hard hybrid (0.89%) (Table 4.3). The %porosity for the 16 kernels was 0.0116% (Table 4.2). As
expected %porosity of the soft hybrid (0.0164%) was significantly (P < 0.01) higher than that of the
hard hybrid (0.0069%) (Table 4.3). A good relationship existed between %cavity and %porosity (r =
0.78).
The digital image in Figure 4.4a of a longitudinal slice of a maize kernel depicts the vitreous
(glassy) and the floury (powdery) endosperm as the translucent and white areas, respectively. In the
2-D X-ray µCT image (Fig. 4.4b), the brighter grey region represents the denser vitreous endosperm
and the darker region the less dense floury endosperm. In the SEM micrographs pores and air
pockets could be observed in the soft endosperm on the surface and between the loosely packed,
less structured starch granules (Fig. 4.5a). Due to the air pockets and the granules not as tightly
packed, light is reflected and the endosperm appears opaque (Dombrink-Kurtzman & Knutson, 1997)
as illustrated in the digital image (Fig. 4.4a). The protein matrix covering the starch granules is thin
and shrinks easily, consequently not covering the granules completely (Fig. 4.5a) (Delcour &
Hoseney, 2010; O'Kennedy, 2011). The polygonal more structured starch granules of the vitreous
endosperm were shown to be tightly packed with no or very little air pockets (Fig.4.5b). The vitreous
endosperm thus appeared translucent (Fig. 4.4a) due to no light being reflected (Figueroa-Cárdenas
et al., 2006; Lee et al., 2006; Delcour & Hoseney, 2010). A continuous protein matrix covered the
Stellenbosch University https://scholar.sun.ac.za

69
starch granules in the vitreous endosperm with the small, round protein (zein) bodies clearly visible
(Fig. 4.5b). This microstructural difference between floury and vitreous endosperm could now be
quantified by means of %porosity determinations from X-ray μCT scans.
(a)
(b)
Figure 4.3. 2-D X-ray µCT slice images of (a) a hard and (b) a soft maize kernel illustrating the presence of
distinct, large cavities (marked with white circles) present in mostly the soft endosperm. Cavities are shown as
black in X-ray images.
Table 4.2. %Cavity, %porosity, entire kernels density, vitreous endosperm density and floury endosperm
density results of 16 maize kernels as derived by X-ray µCT
Range Mean±SD
Cavities (%) 0.17 – 6.1 1.79±1.55
Porosity (%) 0.0014 – 0.0298 0.0116±0.0069
Entire kernel density (g.cm-3) 1.28 – 1.62 1.49±0.12
Vitreous endosperm density (g.cm-3) 1.60 – 1.75 1.67±0.07
Floury endosperm density (g.cm-3) 1.21 – 1.53 1.34±0.11
SD: Standard deviation
Stellenbosch University https://scholar.sun.ac.za

70
Table 4.3. Cavity and porosity percentages as well as entire kernel, vitreous endosperm and floury endosperm
densities as derived by X-ray µCT for hard (n = 8) and soft (n = 8) maize hybrids
Hard maize hybrid Soft maize hybrid P-values
Mean±SD Mean± SD
Cavity (%) 0.89±0.62 2.68±1.72 0.01
Porosity (%) 0.0069±0.0039 0.0164±0.0060 < 0.01
Entire kernel density (g.cm-3) 1.6±0.03 1.37±0.05 < 0.01
Vitreous endosperm density (g.cm-3) 1.74±0.01 1.61±0.01 < 0.01
Floury endosperm density (g.cm-3) 1.43±0.07 1.25±0.03 < 0.01
SD: Standard deviation
Figure 4.6a shows a CT image obtained at a resolution of 6 µm and Figure 4.6b an internal sub-
volume image of the same maize kernel at a resolution of 3 µm. Microstructural detail could be
observed when the Nanotom S system was used that was not detectable with the µCT instrument
(13.4 µm resolution). In particular, the endosperm “bridges” that cross the cavity areas were
visible. The results of the Defect detection function applied on the high resolution image, also
revealed in very clear manner the porosity within the kernel’s floury endosperm (Fig. 4.6c). The
higher resolution made it possible to visualise pores as small as 6 µm in diameter (coloured blue
in Fig. 4.6c). At 13.4 µm resolution, the smallest detectable pore was 30 µm. The mean %porosity
was calculated to be 0.0152% for this specific kernel.
Density calculations using X-ray µCT
For true estimation of maize kernel density, a density function was constructed where the average
grey values (arbitrary units) produced by the scans of the 7 polymers at 60 kV were used. Since the
16 kernels were scanned in 2 batches of 8 kernels each, two equations (eq. 7 and eq. 8) were
required:
Density (g.cm-3) = 4.98909 x 10⁻⁵ x grey value – 0.28237 […eq. 7]
Density (g.cm-3) = 4.83039 x 10⁻⁵ x grey value – 0.40171 […eq. 8]
Mean kernel density of all 16 kernels was 1.49 (Table 4.2) with the entire kernel density for the hard
hybrid (1.6 g.cm-3) significantly (P < 0.01) higher than that of the soft hybrid (1.37 g.cm-3) (Table 4.3).
These densities were in the same range than those obtained by Gustin et al. (2013), i.e. 1.50 g.cm-
3 for entire kernel density estimations.
Stellenbosch University https://scholar.sun.ac.za

71
(a)
(b)
Figure 4.4. (a) A longitudinal digital image (Canon EOS 300D digital camera, fitted with a Canon 30 – 80 mm
lens) and (b) 2-D X-ray µCT image slice of the same maize kernel, depicting the internal structure of the maize
kernel, i.e. flour and vitreous endosperm, germ and pedicle.
When attempting to select the two respective ROIs, it was observed that the density of the germ was
similar to that of the vitreous endosperm. It was thus required to manually select the germ region
and excluded it from each image, using the Drawing tool (VGStudio MAX 2.2). Similar densities
interfere with thresholding as the interface between the ROIs (germ and vitreous endosperm) is not
well defined. After the removal of the germ region, the automated Region growing tool was applied
to separate the remaining ROIs (vitreous and floury endosperm) for density determination. Both the
vitreous and floury endosperm regions of the hard hybrid were subsequently determined to be
significantly (P < 0.01) higher in density than those of the soft hybrid (Table 4.3).
Pedicle
Germ
Vitreous
endosperm
Floury
endosperm
Stellenbosch University https://scholar.sun.ac.za

72
(a)
(b)
Figure 4.5. Scanning electron microscopy (SEM) micrographs (4500X) of (a) loosely packed irregularly shaped
starch granules covered with a thin protein matrix (1) from floury endosperm with pores and air pockets (2)
around and embedded into the granules and; (b) the tightly packed polygonal shaped starch granules from
vitreous endosperm covered in a thick protein matrix (3) with protein (zein) bodies (4) visible.
Stellenbosch University https://scholar.sun.ac.za

73
(a)
(b)
(c)
Figure 4.6. 2-D X-ray µCT slice image illustrating the endosperm microstructure of (a) a whole maize kernel
acquired at 6 µm resolution and (b) a sub-volume of the same kernel acquired at 3 µm resolution. (c) 3-D X-
ray µCT image of the sub-volume of the maize kernel (acquired at 3 µm resolution) with the larger cavities
visualised in magenta and the smaller pores in blue. The colour bar indicates the size (mm3) of the cavities
(large; magenta) and pores (small; blue).
Stellenbosch University https://scholar.sun.ac.za

74
Validating the accuracy of X-ray µCT density calculations
The accuracy of the µCT density measurements (validation of density calibration) was tested by
comparing the estimated (µCT) kernel mass with the measured (weighed) mass (Gustin et al., 2013).
The estimated masses ranged from 0.234 to 0.704 g (mean±SD; 0.396±0.114 g) with the actual
masses ranging from 0.220 to 0.633 g (0.368±0.101 g). The high ICC consistency (0.99) and
agreement (0.96) and low SE of measurement (0.01) confirmed that the two methods resulted in
very similar masses and indicated the accuracy of the X-ray µCT method. This confirms the use of
X-ray µCT to predict whole maize kernel densities by means of a density calibration developed from
polymers.
Conventional density measurements
Conventionally, the density of whole maize kernels is determined using pycnometry (Siska and
Hurburgh 1995) or the floating test (Blandino et al. 2012). The floating test and X-ray scans were
performed on the same 16 kernels. Maize kernel densities results obtained with the floating test
were constantly lower than those obtained with µCT. The average density of all 16 maize kernels
were recorded as 1.29±0.05 (mean±SD) g.mL-1 with that of the hard and soft hybrids recorded as
1.32±0.02 g.mL-1 and 1.26±0.05 g.mL-1, respectively. Although the results were not recorded in the
same units (g.mL-1 and g.cm-3, respectively), were they comparable and the intraclass correlation
(ICC) coefficients could be determined. While the two methods correlated (r = 0.78; ICC consistency
= 0.74), the very low ICC agreement (0.035) indicated a large bias. This was expected due to the
distinct cavities observed in the kernels (Fig. 4.3). These cavities were not included in the µCT
density measurements. The feasibility of using X-ray µCT is evident from the ability of this method
to exclude cavities, that would negatively influence results (Gustin et al., 2013). Because of the
reasonable high r and ICC consistency results it appeared possible that the results from the
respective density methods could be made comparable by means of correction factors. The SE
between the two measurement methods was 0.023 g.mL-1 (or g.cm-3).
Principal component analysis for variable interpretation
The interaction of the X-ray µCT derived variables is illustrated in the PCA bi-plot (Fig. 4.7). The first
two principal components (PCs) described 91% of the variation within the model, with PC 1
describing the major percentage (78%). The hard kernels are found on the left of PC 1, whereas the
soft kernels are found on the right of PC 1. The loadings indicated the relationship between the
variables, and in particular, it can be observed that a stronger correlation existed between entire
kernel density, vitreous endosperm density and floury endosperm density, whereas %porosity and
%cavity were correlated. All these considerations were confirmed by the Spearman’s rank correlation
coefficients (Table 4.4), with the strongest correlation (r = 0.92, P < 0.01) indicated to be that between
the entire kernel density and vitreous endosperm density. This strong correlation was expected as
Stellenbosch University https://scholar.sun.ac.za

75
the vitreous endosperm is the denser endosperm present in a maize kernel. Hard kernels also
consisted of a higher percentage vitreous endosperm than soft kernels.
A larger variance was found between the soft kernels than the hard kernels, predominantly due
to a bigger range in %cavities for the soft kernels (2.68±1.72%) compared to that of the hard kernels
(0.89±0.62%). The outlier, also a soft kernel, had an exceptionally high %cavities (6.1%). It was
important to note that, although the variance between the density measurements were not as large
as that of the %cavities and %porosity, there were still significant differences (P < 0.05) between all
the variables. The density variables, as well as the %cavity and %porosity variables, all contributed
towards describing the hardness of individual maize kernels. The variance between the hard kernels
were more pronounced by the density variables, whereas the soft kernels were better described by
%cavities and %porosity.
Figure 4.7. Principal component analysis bi-plot illustrating the interaction of the X-ray µCT derived variables.
Stellenbosch University https://scholar.sun.ac.za
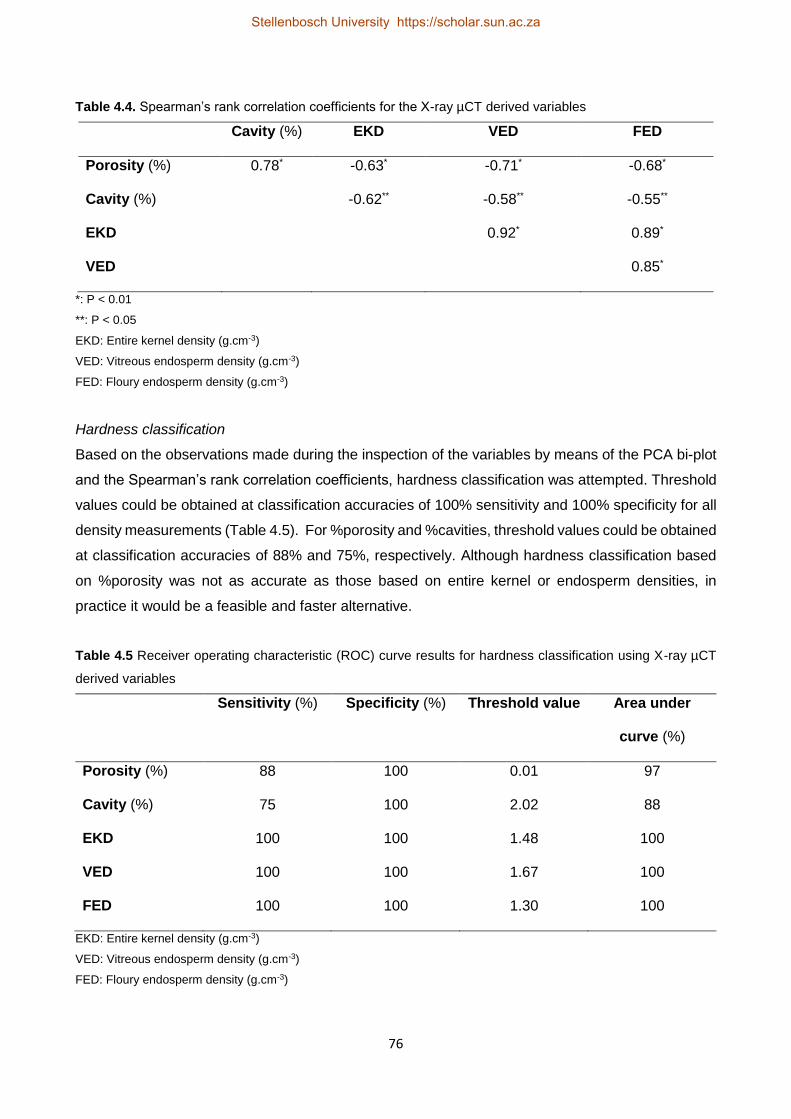
76
Table 4.4. Spearman’s rank correlation coefficients for the X-ray µCT derived variables
Cavity (%) EKD VED FED
Porosity (%) 0.78* -0.63* -0.71* -0.68*
Cavity (%) -0.62** -0.58** -0.55**
EKD 0.92* 0.89*
VED 0.85*
*: P < 0.01
**: P < 0.05
EKD: Entire kernel density (g.cm-3)
VED: Vitreous endosperm density (g.cm-3)
FED: Floury endosperm density (g.cm-3)
Hardness classification
Based on the observations made during the inspection of the variables by means of the PCA bi-plot
and the Spearman’s rank correlation coefficients, hardness classification was attempted. Threshold
values could be obtained at classification accuracies of 100% sensitivity and 100% specificity for all
density measurements (Table 4.5). For %porosity and %cavities, threshold values could be obtained
at classification accuracies of 88% and 75%, respectively. Although hardness classification based
on %porosity was not as accurate as those based on entire kernel or endosperm densities, in
practice it would be a feasible and faster alternative.
Table 4.5 Receiver operating characteristic (ROC) curve results for hardness classification using X-ray µCT
derived variables
Sensitivity (%) Specificity (%) Threshold value Area under
curve (%)
Porosity (%) 88 100 0.01 97
Cavity (%) 75 100 2.02 88
EKD 100 100 1.48 100
VED 100 100 1.67 100
FED 100 100 1.30 100
EKD: Entire kernel density (g.cm-3)
VED: Vitreous endosperm density (g.cm-3)
FED: Floury endosperm density (g.cm-3)
Stellenbosch University https://scholar.sun.ac.za

77
Conclusion
This study attempted to provide a potential solution to classify maize kernels based on hardness.
Conventional density hardness methods, such as the floating test, unintentionally overlook the
influence of the cavities present in kernels. In this study, µCT scanning allowed the estimation of the
true densities of the two endosperm types, vitreous and floury, as well as the density of entire maize
kernels, using an appropriate density calibration. Hardness classification was possible based on
ROC curve threshold values. Entire kernel density, as well as both vitreous and floury endosperm
densities contributed to the variation. Additionally, X-ray µCT was shown to enable quantification of
endosperm microstructural properties such as porosity and cavities. Hardness classification was
also possible based on these variables with %porosity being more accurate and thus the preferred
X-ray µCT measurement for this purpose.
References
AACC (1999). Approved Methods of Analysis, 11th Ed. Method 55-30.01. Particle Size Index for
Wheat Hardness. Approved November 3, 1999. AACC International: St. Paul, MN, U.S.A.
Almeida-Dominguez, H.D., Suhendro, E.L. & Rooney, L.W. (1997). Factors Affecting Rapid Visco
Analyser Curves for the Determination of Maize Kernel Hardness. Journal of Cereal Science,
25, 93-102.
Blandino, M., Mancini, M.C., Peila, A., Rolle, L., Vanara, F. & Reyneri, A. (2010). Determination of
maize kernel hardness: comparison of different laboratory tests to predict dry milling
performance. Journal of the Science of Food and Agriculture, 90, 1870-1878.
Blandino, M., Sacco, D. & Reyneri, A. (2012). Prediction of the dry milling performance of maize
hybrids through hardness associated properties. Journal of the Science of Food and
Agriculture, 93, 1356-1364.
Burch, S. (2002). Measurement of density variations in compacted parts using X-ray computerised
tomography. Metal Powder Report, 57, 24-28.
Busignies, V., Leclerc, B., Porion, P., Evesque, P., Couarraze, G. & Tchoreloff, P. (2006).
Quantitative measurements of localized density variations in cylindrical tablets using X-ray
microtomography. European Journal of Pharmaceutics and Biopharmaceutics, 64, 38-50.
Chang, C.S. (1988). Measuring density and porosity of grain kernels using a gas pycnometer. Cereal
Chemistry, 65, 13-15.
Chaunier, L., Della Valle, G. & Lourdin, D. (2007). Relationships between texture, mechanical
properties and structure of cornflakes. Food Research International, 40, 493-503.
Chawanji, A.S., Baldwin, A.J., Brisson, G. & Webster, E. (2012). Use of X-ray micro tomography to
study the microstructure of loose-packed and compacted milk powders. Journal of
Microscopy, 248, 49-57.
Cnudde, V. & Boone, M.N. (2013). High-resolution X-ray computed tomography in geosciences: A
review of the current technology and applications. Earth-Science Reviews, 123, 1-17.
Stellenbosch University https://scholar.sun.ac.za

78
De Carvalho, M.L.M., Van Aelst, A.C., Van Eck, J.W. & Hoekstra, F.A. (1999). Pre-harvest stress
cracks in maize (Zea mays L.) kernels as characterized by visual, X-ray and low temperature
scanning electron microscopical analysis: effect on kernel quality. Seed Science Research,
9, 227-236.
Delcour, J. & Hoseney, R.C. (2010). Principles of Cereal Science and Technology. Pp. 1-22.
Minnesota, USA: AACC International Press.
Dombrink-Kurtzman, M. & Knutson, C. (1997). A study of maize endosperm hardness in relation to
amylose content and susceptibility to damage. Cereal Chemistry, 74, 776-780.
Dombrink-Kurtzman, M.A. & Bietz, J.A. (1993). Zein composition in hard and soft endosperm of
maize. Cereal Chemistry, 70, 105-108.
Donis-González, I.R., Guyer, D.E., Pease, A. & Barthel, F. (2014). Internal characterisation of fresh
agricultural products using traditional and ultrafast electron beam X-ray computed
tomography imaging. Biosystems Engineering, 117, 104-113.
Du Plessis, A., Meincken, M. & Seifert, T. (2013). Quantitative determination of density and mass of
polymeric materials using microfocus computed tomography. Journal of Nondestructive
Evaluation, 32, 413-417.
Erasmus, C. (2003). Maize kernel translucency measurement by image analysis and its relationship
to vitreousness and dry milling performance. PhD Thesis. University of Pretoria, Pretoria,
South Africa.
Eyherabide, G.H., Robutti, J.L. & Borras, F.S. (1996). Effect of near-infrared transmission-based
selection on maize hardness and the composition of zeins. Cereal Chemistry, 73, 775-778.
Figueroa-Cárdenas, J.D., Reyes-Vega, M.L., Rincón-Sánchez, F., Gaytán-Martínez, M. & Morales-
Sánchez, E. (2006). Microstructure of starch granule related to kernel hardness in corn.
Revista Fitotecnia Mexicana, 29, 135-139.
Fox, G. & Manley, M. (2009). Hardness methods for testing maize kernels. Journal of Agricultural
and Food Chemistry, 57, 5647-5657.
Frisullo, P., Laverse, J., Marino, R. & Nobile, M.A.D. (2009). X-ray computed tomography to study
processed meat microstructure. Journal of Food Engineering, 94, 283-289.
Gondek, E., Jakubczyk, E., Herremans, E., Verlinden, B., Hertog, M., Vandendriessche, T.,
Verboven, P., Antoniuk, A., Bongaers, E. & Estrade, P. (2013). Acoustic, mechanical and
microstructural properties of extruded crisp bread. Journal of Cereal Science, 58, 132-139.
Gustin, J.L., Jackson, S., Williams, C., Patel, A., Armstrong, P.R., Peter, G.F. & Settles, A.M. (2013).
Analysis of maize (Zea mays) kernel density and volume using micro-computed tomography
and single-kernel near infrared spectroscopy. Journal of Agricultural and Food Chemistry,
61, 10872-10880.
Huber, K.C. & BeMiller, J.N. (1997). Visualization of channels and cavities of corn and sorghum
starch granules. Cereal Chemistry, 74, 537-541.
Stellenbosch University https://scholar.sun.ac.za

79
Huber, K.C. & BeMiller, J.N. (2000). Channels of maize and sorghum starch granules. Carbohydrate
Polymers, 41, 269-276.
Kak, A.C. & Slaney, M. (1988). Principles of computerized tomographic imaging Pp. 104-107. New
York: IEEE Press.
Kotwaliwale, N., Singh, K., Kalne, A., Jha, S.N., Seth, N. & Kar, A. (2011). X-ray imaging methods
for internal quality evaluation of agricultural produce. Journal of Food Science and
Technology, 51, 1-15.
Laverse, J., Mastromatteo, M., Frisullo, P., Albenzio, M., Gammariello, D. & Del Nobile, M.A.
(2011a). Fat microstructure of yogurt as assessed by X-ray microtomography. Journal of
Dairy Science, 94, 668-675.
Laverse, J., Mastromatteo, M., Frisullo, P. & Del Nobile, M.A. (2011b). X-ray microtomography to
study the microstructure of cream cheese-type products. Journal of Dairy Science, 94, 43-
50.
Laverse, J., Mastromatteo, M., Frisullo, P. & Del Nobile, M.A. (2012). X-ray microtomography to
study the microstructure of mayonnaise. Journal of Food Engineering, 108, 225-231.
Lee, K.M., Bean, S.R., Alavi, S., Herrman, T.J. & Waniska, R.D. (2006). Physical and biochemical
properties of maize hardness and extrudates of selected hybrids. Journal of Agricultural and
Food Chemistry, 54, 4260-4269.
Lee, K.M., Herrman, T.J., Rooney, L.W., Jackson, D.S., Lingenfelser, J., Rausch, K.D., McKinney,
J., Iiams, C., Byrum, L., Hurburgh, J.C.R., Johnson, L.A. & Fox, S.R. (2007). Corroborative
study on maize quality, dry-milling and wet-milling properties of selected maize hybrids.
Journal of Agricultural and Food Chemistry, 55, 10751-10763.
Lindgren, O., Davis, J., Wells, P. & Shadbolt, P. (1992). Non-destructive wood density distribution
measurements using computed tomography. Holz als Roh-und Werkstoff, 50, 295-299.
Malvar, R.A., Revilla, P., Moreno-González, J., Butrón, A., Sotelo, J. & Ordás, A. (2008). White
maize: genetics of quality and agronomic performance. Crop Science, 48, 1373-1381.
Manley, M., Williams, P., Nilsson, D. & Geladi, P. (2009). Near infrared hyperspectral imaging for
the evaluation of endosperm texture in whole yellow maize (Zea mays L.) kernels. Journal of
Agricultural and Food Chemistry, 57, 8761-8769.
McGoverin, C. & Manley, M. (2012). Classification of maize kernel hardness using near infrared
hyperspectral imaging. Journal of Near Infrared Spectroscopy, 20, 529-535.
Meincken, M. & du Plessis, A. (2013). Visualising and quantifying thermal degradation of wood by
computed tomography. European Journal of Wood and Wood Products, 71, 387-389.
Mestres, C., Louis-Alexandre, A., Matencio, F. & Lahlou, A. (1991). Dry-milling properties of maize.
Cereal Chemistry, 68, 51-56.
O'Kennedy, K. (2011). Characterisation of zein from South African maize of varying endosperm
texture. MSc Thesis. Stellenbosch University, South Africa.
Stellenbosch University https://scholar.sun.ac.za

80
Paiva, E., Kriz, A.L., Peixoto, M.J.V.V.D., Wallace, J.C. & Larkins, A.B. (1991). Quantitation and
distribution of ã–zein in the endosperm of maize kernels. Cereal Chemistry, 68, 276-279.
Pomeranz, Y., Martin, C.R., Traylor, D.D. & Lai, F.S. (1984). Corn hardness determination. Cereal
Chemistry, 61, 147-150.
Robutti, J.L. (1995). Maize kernel hardness estimation in breeding by near-infrared transmission
analysis. Cereal Chemistry, 72, 632-636.
Robutti, J.L., Borras, F.S. & Eyherabide, G.H. (1997). Zein compositions of mechanically separated
coarse and fine portions of maize kernels. Cereal Chemistry, 74, 75-78.
Robutti, J.L., Hoseney, R.C. & Wassom, C.E. (1974). Modified opaque-2 corn endosperms. ll.
Structure viewed with a scanning electron microscope. Cereal Chemistry, 51, 173-180.
Singhal, A., Grande, J.C. & Zhou, Z. (2013). Micro/Nano CT for visualization of internal structures.
Microscopy Today, 21, 16-22.
Sinka, I.C., Burch, S.F., Tweed, J.H. & Cunningham, J.C. (2004). Measurement of density variations
in tablets using X-ray computed tomography. International Journal of Pharmaceutics, 271,
215-224.
Siska, J. & Hurburgh, C.R. (1995). Corn density measurement by near-infrared transmittance.
Transactions of the ASAE, 38, 1821-1824.
Van Dalen, G., Nootenboom, P. & Van Vliet, L.J. (2007). 3D Imaging and analysis of porous cereal
products using X-ray microtomography. In: The 12th International Congress for Stereology
(ICSXII), 2007. September 3-7, 2007.Saint-Etienne, France.
Watson, S.A. (1987). Structure and Composition. In: Corn Chemistry and Technology (edited by S.A.
Watson & P.E. Ramstad). Pp. 53-82. St. Paul, Minnesota, USA: American Association of
Cereal Chemists, Inc.
Williams, P., Geladi, P., Fox, G. & Manley, M. (2009). Maize kernel hardness classification by near
infrared (NIR) hyperspectral imaging and multivariate data analysis. Analytica Chimica Acta,
653, 121-130.
Wu, Y.V. (1992). Corn hardness as related to yield and particle size of fractions from a micro
hammer-cutter mill. Cereal Chemistry, 69, 343-347.
Wu, Y.V. & Bergquist, R.R. (1991). Relation of corn grain density to yields of dry-milling products.
Cereal Chemistry, 68, 542-544.
Zhu, L.J., Dogan, H., Gajula, H., Gu, M.H., Liu, Q.Q. & Shi, Y.C. (2012). Study of kernel structure of
high-amylose and wild-type rice by X-ray microtomography and SEM. Journal of Cereal
Science, 55, 1-5.
Stellenbosch University https://scholar.sun.ac.za

81
Chapter 5
Milling quality classification of maize (Zea mays L.) using X-ray micro-
computed tomography (µCT)
Abstract
This study has shown that good classification of maize hybrids, differing in milling quality, was
possible when using X-ray µCT derived density and volume measurements. These variables were
obtained from low resolution (80 µm) µCT scans as 150 kernels were imaged at once, thereby
reducing acquisition time and cost. When using entire kernel density (EKD) and vitreous-to-floury
endosperm ratio (V:F) measurements, good classification accuracies of 93% and 92% were obtained
respectively. Furthermore, it was established that milling quality could not be described without the
inclusion of density measurements. Conventional hardness methods should therefore be used with
caution when intended to describe milling quality, as they intrinsically contribute towards volume
related properties. A conventional density hardness method, such as the floating test, is also not
adequate for describing milling quality, as this method overlooks the influence of cavities present in
maize kernels.
Stellenbosch University https://scholar.sun.ac.za

82
Introduction
Kernel hardness is one of the most important factors in determining the functionality of grains.
Hardness is a characteristic often used in the milling industry to identify the varieties or hybrids
desirable for milling (Neethirajan et al., 2006). Dry-milling is the industrial practise used to process
maize (Zea mays L.) into maize flour, and is dependent on the hardness of the maize for optimal
yield. Due to the complexity of maize hardness, the interpretation and measurement thereof can be
difficult. As yet, no standardised hardness method exists, resulting in an extensive range in
approaches (Fox & Manley, 2009).
In an earlier study, percentage chop (%chop) was used as milling quality descriptor where de-
germed maize was subjected to the milling process and the chop (combination of pericarp, germ and
to a lesser extent endosperm) was calculated as a percentage of the total mass of maize (Guelpa et
al., 2014a). It had been established that hectoliter mass (HLM) correlated (r = -0.71) with %chop
and that the coarse-over-fine ratio as derived from the particle size index (PSI) method, milling index
(from near infrared (NIR) absorbance values), percentage vitreous endosperm (based on NIR
hyperspectral imaging) and hundred kernel mass (HKM) all contributed to describing the overall
milling quality of the respective hybrids (Guelpa et al., 2014a).
Eighty percent of the volume of a typical maize kernel consists of two types of starch tissue, i.e.
vitreous and floury endosperm (Paiva et al., 1991). The vitreous endosperm is hard and translucent
(glassy) and lies mainly at the sides and back of the kernel, whereas the floury endosperm is softer
and mealy textured and found in the centre of the kernel (Watson, 1987; Paiva et al., 1991). White
maize is classed as dent maize, which is a cross between flint and flour types (Benson & Pearce,
1987) and intermediate between flour (soft) and popcorn (hard) with respect to hardness (Wolf et al.,
1952). The ratio of vitreous and floury endosperm volume averages about 2:1 in dent maize (Wolf
et al., 1952), but variations occur due to genetic make-up (Johnson & Russell, 1982), environmental
influences (Hamilton et al., 1951) and postharvest handling (Peplinski et al., 1989).
With the discovery of X-rays by Prof Wilhelm Röntgen in 1895 (Cnudde & Boone, 2013), this
type of radiation has become a prominent technique for medical diagnostics (Kotwaliwale et al.,
2011). As X-rays are capable of penetrating material in varying degrees as expressed by Beer’s
law (Cnudde & Boone, 2013), this attenuated radiation can be converted by a detector into a two
dimensional (2-D) digital image, called a radiograph. Only with the development of modern computer
technology in the 1960s, computed tomography became feasible (Kalender, 2006). Computed
tomography (CT) refers to the reconstruction of 2-D images mathematically, to display and archive
them in digital three dimensional (3-D) format (Kalender, 2006). In the 1980’s a new research field
emerged as high-resolution X-ray tomography, or commonly called micro-CT (µCT) was first
discussed (Cnudde & Boone, 2013). X-ray µCT has seen a period of rapid growth over the last 15
years, mainly due to considerable improvements in spatial resolution and image reconstruction times
(Maire & Withers, 2014).
Stellenbosch University https://scholar.sun.ac.za

83
In a study on a limited number of maize kernels, it was shown how X-ray µCT could estimate
maize hardness when constructing a density calibration (Guelpa et al., 2014b). Threshold values
were determined for entire kernel density, and vitreous and floury endosperm densities, respectively
which allowed for hardness classification (Guelpa et al., 2014b). When considering other X-ray µCT
studies on maize, Takhar et al. (2011) focussed on moisture transport within maize kernels and De
Carvalho et al. (1999) studied stress cracks formation. Both found the technique of X-ray µCT to be
successful to be applied in food processing studies. The study of Gustin et al. (2013), recognised
the potential of X-ray µCT as a method to determine kernel density and volume. They also
demonstrated that single kernel density correlated (r = 0.8) with test weight (Gustin et al., 2013),
which in turn is seen as a conventional method of describing maize hardness (Lee et al., 2006).
The aim of this study was to perform milling quality classification based on X-ray µCT densities
and volumes (entire kernel, vitreous and floury endosperm).
Material and methods
Samples and preparation
From a set of 49 samples, consisting of 19 hybrids, four localities and three plantings, 300 maize
kernels were selected, as depicted in Table 5.1. The sample set (n = 49) originated from maize
breeding trials of South African white maize, either supplied by PANNAR Seeds (Greytown, South
Africa) or a farmer from Schweizer-Reneke. The four localities represented in the sample set were
Greytown, Delmas, Klerksdorp and Schweizer-Reneke and the three plantings refer to an early,
normal and late planting of the 2012 harvest.
The sample set was ranked according to the samples’ milling performance, using an industrial
guideline known as percentage chop (%chop). To determine the %chop, a pilot plant scale de-
germer was used and the de-germed maize was subjected to the milling process, also on a pilot
plant scale. The chop (combination of pericarp, germ and endosperm) was then calculated as a
percentage of the total mass of the maize. A %chop below 22% indicated good milling maize,
between 22% and 25% was good intermediate, between 26% and 30% was poor intermediate and
above 30% was poor milling maize.
Consequently, 150 maize kernels were selected from the 10 samples that illustrated the best
milling performance (15 kernels per sample), and another 150 kernels were selected from the 10
samples that showed poorest milling performance (again 15 kernels per sample).
Florist oasis discs (10 cm diameter; 2 cm height) were prepared in order to facilitate simultaneous
X-ray µCT scanning of multiple kernels. The low density of the florist oasis provided for clear
distinction from the subjects of interest and was therefore a suitable medium for mounting purposes.
Thirty maize kernels were placed in a specific order in each of 10 florist oasis discs, without touching
each other (Fig. 5.1). Polymer discs (25 mm in diameter and 10 mm in height) that were used for the
density calibrations were also placed in the florist oasis discs. Five discs were stacked on top of each
Stellenbosch University https://scholar.sun.ac.za

84
other (150 kernels) and secured with a wooden stick to prevent any movement during X-ray
acquisition.
Table 5.1. List of white maize hybrids, localities and plantings from the 2012 harvest
Kernels Hybrid Locality Planting
Good milling 1 – 15 1 Greytown Early
16 – 30 2 Delmas Early
31 – 45 3 Greytown Early
46 – 60 3 Greytown Late
61 – 75 2 Greytown Early
76 – 90 2 Greytown Late
91 – 105 11 Schweizer-Reneke Normal
106 – 120 1 Delmas Early
121 – 135 16 Schweizer-Reneke Normal
135 – 150 3 Delmas Early
Poor milling 1 – 15 8 Greytown Early
16 – 30 10 Greytown Early
31 – 45 19 Schweizer-Reneke Normal
46 – 60 17 Schweizer-Reneke Normal
61 – 75 18 Schweizer-Reneke Normal
76 – 90 8 Greytown Late
91 – 105 10 Delmas Late
106 – 120 5 Delmas Late
121 – 135 5 Delmas Early
135 – 150 12 Schweizer-Reneke Normal
Conventional hardness methods
The particle size index (PSI) coarse-over-fine (c/f) ratio, hundred kernel mass (HKM), hectoliter mass
(HLM), protein content as determined with the Dumas method, a NIR spectroscopy hardness index
and a vitreous endosperm percentage value derived from NIR hyperspectral imaging (HSI) were
determined for each of the 20 samples as described in Guelpa et al. (2014a).
X-ray micro-computed tomography scanning
X-ray scans were acquired using a commercial micro-focus X-ray computed tomography system,
i.e. Phoenix V|Tome|X L240 (General Electric Sensing and Inspection Technologies / Phoenix X-
ray, Wunstorff, Germany). The system depicted in Fig. 5.2 is located at the CT Scanner Facility of
the Central Analytical Facility (CAF), Stellenbosch University, South Africa. It comprises of a lead-
lined cabinet that houses the X-ray direct tube and the sample manipulator, along with a cooling unit
Stellenbosch University https://scholar.sun.ac.za

85
and an external control module. Image acquisition was set at 500 ms per image with 2000 images
recorded in one rotation at 80 µm voxel size or resolution. A 0.1 mm copper filter was used to reduce
beam hardening artefacts and a scan took 1 h to complete. In this work a tungsten target, 60 kV
and 240 µA was used for X-ray generation.
The florist oasis stacks containing 150 maize kernels each were placed one at a time on the
specimen stage and rotated along the axis, perpendicular to the beam direction. Two scans were
required to image all 300 kernels, illustrating a cost-effective and time-saving application of µCT.
(a)
(b)
(c)
Figure 5.1. Digital images illustrating sample preparation: (a) five florist oasis discs used as mounting material
for the 150 good milling maize kernels, (b) the stack of discs, held upright with a wooden stick and (c) a top
view of the stack. The polymer discs used for the density calibration are also visible in these images.
Image processing and analysis
The acquired 2-D X-ray images were rendered into 3-D volumes, using the integrated Phoenix Datos
acquisition and reconstruction software (General Electric Sensing and Inspection Technologies /
Phoenix X-ray, Wunstorff, Germany). The process of reconstruction comprises of filtered back-
projection algorithms where the grey values in a rendered CT image represent the attenuation in
each pixel (Singhal et al., 2013) (Fig. 5.3). The 3-D images were further analysed with VGStudio
Max 2.2 (Volume Graphics, Heidelberg, Germany).
Each maize kernel was analysed independently as sub volume extraction was possible.
Therefore, density calculations, as well as volume analysis, were performed per kernel.
Stellenbosch University https://scholar.sun.ac.za

86
(a)
(b)
(c)
Figure 5.2. The Phoenix V|Tome|X L240 micro-computed tomography scanner showcasing the (a) direct tube
and the sample manipulator, (b) lead-line cabinet with cooling unit and (c) the control monitor.
Figure 5.3. The 3-D X-ray µCT image of a stack of five discs, containing 30 kernels each and with the mounting
material removed.
Density calculations
Densities of entire maize kernels (EKD), as well as two regions of interest (ROIs) i.e. the vitreous
endosperm (VED) and the floury endosperm (FED), were calculated using a density calibration
method as described in Guelpa et al. (2014b). EKD did not include cavities (large air spaces). This
Stellenbosch University https://scholar.sun.ac.za

87
method made use of a set of polymers with known densities that was included in each X-ray scan to
facilitate the construction of a density calibration. To generate the calibration function (eq. 1), the
average grey values of each polymer disk, as well as their actual density values, were used.
Actual density (g.cm-3) = m x grey value + c …[eq. 1]
Where:
m: is the slope
c: is the intercept
It was found that the densities of the germ and vitreous endosperm regions were very similar and
thus prevented accurate separation. Therefore, the germ region was removed, slice by slice, for
each kernel (Guelpa et al., 2014b) as illustrated in Figure 5.4. After the manual removal of the germ,
the remaining endosperm could be separated and mean grey values for the respective ROIs could
be obtained. Mean grey values for the entire kernel were acquired prior to the separation. The grey
values were substituted into the calibration equations (one for each X-ray scan) and subsequent
densities could be calculated, expressed as g.cm-3.
(a)
(b)
Figure 5.4. X-ray µCT slice images of (a) maize kernel with germ intact, and (b) with germ removed, slice by
slice.
Volume analysis
Entire kernel volume (EKV) and the volumes of the two endosperm types, i.e. vitreous (VEV) and
floury endosperm (FEV), was determined using the automated Region growing tool, in combination
Stellenbosch University https://scholar.sun.ac.za

88
with the Volume analyser function of VGStudio Max 2.2. The endosperm type volumes (VEV and
FEV) were expressed as a percentage of the total volume of endosperm per kernel. Additionally, a
vitreous-to-floury endosperm ratio (V:F) was calculated from the VEV and FEV. Figure 5.5 illustrates
the segmentation into respective regions, allowing quantification, non-destructively.
(a)
(b)
Figure 5.5. 2-D X-ray µCT slice images of the (a) vitreous endosperm (blue) and (b) floury endosperm (yellow)
present within a maize kernel.
Statistical procedures
Univariate methods
Mean differences for the X-ray µCT derived variables (densities: entire kernel, vitreous and floury
endosperm and volumes: entire kernel, vitreous and floury endosperm, also vitreous-to-floury
endosperm volume ratio) were evaluated by one-way analysis of variance (ANOVA) using
STATISTICA version 11 (StatSoft, Inc., Tulsa, USA).
Furthermore, a receiver operating characteristic (ROC) curve was used to classify the maize
kernels into good milling and poor milling classes, based on the respective constituents, using
STATISTICA version 11 (StatSoft, Inc., Tulsa, USA). An ROC curve is a plot of sensitivity on the y-
axis against 1-specificity on the x-axis, for varying values of the threshold. The optimal threshold is
determined by maximising the sum of sensitivity and specificity. Sensitivity is the percentage good
milling kernels correctly classified and specificity is the percentage poor milling kernels correctly
classified.
Spearman’s rank correlation coefficients were used to test the strength of the relationships
between pairs of X-ray µCT derived results (densities: entire kernel, vitreous and floury endosperm
Stellenbosch University https://scholar.sun.ac.za

89
and volumes: cavities, entire kernel, vitreous and floury endosperm, also vitreous-to-floury
endosperm volume ration), using STATISTICA version 11 (StatSoft, Inc., Tulsa, USA).
Multivariate method: principal component analysis
Principal component analysis (PCA) was performed on X-ray µCT derived variables (densities: entire
kernel, vitreous and floury endosperm and volumes: entire kernel, vitreous and floury endosperm,
also vitreous-to-floury endosperm volume ration) and variables derived from 6 conventional
hardness methods. To inspect the relationship between the variables, PCA bi-plots were used as it
combines the scores and the loadings. STATISTICA version 11 (StatSoft, Inc., Tulsa, USA) was
used to perform the PCA.
Results and discussion
X-ray µCT density calculations
When considering the accuracy of conventional density measurements, it was reasoned that internal
air spaces or cavities would greatly influence the result, possibly dominate the important density
differences found between the endosperm types and in doing so, cause misleading results. This was
seen when floating test densities of the same kernels were compared to densities calculated with X-
ray µCT data (Guelpa et al., 2014b). The floating test consistently produced lower densities than the
latter method and a large bias was apparent.
Based on an advantage of X-ray µCT, i.e. allowing the exclusion of undesired regions (such as
cavities), this method was seen as more suited for accurate density measurements (Gustin et al.,
2013). Another advantage being each voxel having an associated grey value depending on the
material’s density and atomic number. Areas of low density cause less attenuation of the X-ray
beams and are portrayed as darker regions. Black areas represents air that do not attenuate at all.
Areas of high density causes lots of attenuation and therefore fewer X-rays can reach the detector.
It has been considered that the structural arrangement of the starch, of which endosperm
predominantly consist of, affects maize hardness more than any other morphological features within
maize kernels (Figueroa Cárdenas et al., 2006). The different starch granule patterns of vitreous
endosperm, tightly packed within the protein matrix, as opposed to the loosely packed floury
endosperm with intergranular air spaces (or pores) were revealed by scanning electron microscopy
(Figueroa Cárdenas et al., 2006). A 2-D µCT slice image of a maize kernel, acquired at 13.4 µm
resolution, revealed similar endosperm textural properties as the vitreous endosperm was portrayed
as the denser endosperm with tightly packed starch granules, whereas the floury endosperm
revealed loosely packed granules (Fig. 5.6).
Stellenbosch University https://scholar.sun.ac.za

90
Figure 5.6. A zoomed in 2-D X-ray µCT slice image acquired at a 13.4 µm resolution of the internal structures
of a maize kernel. The light grey (more dense) region on the left is the vitreous endosperm, whereas a section
of the germ is visible at the bottom (white) and the loosely packed floury endosperm is visible in darker grey
(less dense) with intracellular airspaces (black).
Figueroa-Cárdenas et al. (2006) saw a significant (P < 0.05) correlation (r = 0.69) between kernel
density (determined using water replacement and a floating test) and hardness (as expressed by a
puncture test). Similarly, Guelpa et al. (2014b) showed a significant correlation (P < 0.05) between
kernel density (determined using X-ray µCT) and hardness (using the PSI (c/f)). In the latter study,
16 maize kernels scanned at a resolution of 13.4 µm, were used for density calculations. The same
was attempted, using 300 maize kernels acquired at 80 µm resolution.
The respective densities were calculated in a similar fashion as explained in Guelpa et al.
(2014b). EKD, VED and FED were determined by obtaining grey values from each respective
region-of-interest (ROI) and substituting these values into density equations (eq. 2 and 3). The mean
grey values obtained for EKD did not include cavities, which was possible by setting an appropriate
threshold to exclude air spaces. After manual exclusion of the germ region, a higher grey value
threshold was applied to select the vitreous endosperm region, while excluding the floury endosperm
region. Consequently, the mean grey value for the vitreous endosperm ROI was obtained. The
Stellenbosch University https://scholar.sun.ac.za

91
mean grey value for the floury endosperm ROI was obtained in a similar fashion, but by selecting
the higher grey value interval in the histogram.
Two scans were required to image all 300 kernels (150 kernels per scan), therefore two linear
equations had to be constructed, as shown in equations 2 and 3:
Density (g.cm-3) = 3.58158 x 10⁻⁵ x grey value – 0.11004 …[eq. 2]
Density (g.cm-3) = 3.52309 x 10⁻⁵ x grey value – 0.0659 …[eq. 3]
As a result of artifacts that were present in three of the imaged maize kernels, these respective
kernels could not be used for image analysis. Consequently, there were only 297 samples used
throughout this study.
The average EKD of all 297 maize kernels were 1.30 g.cm-3, while that of the VED and FED were
1.36 g.cm-3 and 1.12 g.cm-3, respectively. Mean EKD of the good milling hybrids (1.31 g.cm-3) was
significantly (P < 0.05) higher than that of the poor milling hybrids (1.23 g.cm-3) (Table 5.2) as
expected with the higher proportion of vitreous endosperm present within good milling (or hard)
hybrids (Watson, 1987), which would increase the density. The protein matrix within this endosperm
type keeps the starch granules tightly packed, thus dense, as opposed to more intracellular air
spaces found within the loosely packed floury endosperm (Robutti et al., 1997). The same trend was
found for the mean VED and FED, as these values were also significantly higher for the good milling
hybrids (1.38 g.cm-3 and 1.14 g.cm-3, respectively) compared to the poor milling hybrids (1.35 g.cm-
3 and 1.10 g.cm-3, respectively) (Table 5.2). It was expected that the VED would be significantly
higher for the hybrids with the higher proportion of vitreous endosperm, i.e. the good milling hybrids.
Table 5.2. Entire kernel density, vitreous endosperm density and floury endosperm density results as derived
by X-ray µCT for the two milling classes, good (n = 150) and poor (n = 147), also indicating ANOVA results
Good milling hybrids Poor milling hybrids P-value
Range Mean±SD Range Mean±SD
EKD (g.cm-3) 1.22 – 1.36 1.31±0.03 0.97 – 1.32 1.23±0.05 < 0.01
VED (g.cm-3) 1.26 – 1.42 1.38±0.03 1.23 – 1.40 1.35±0.03 < 0.01
FED (g.cm-3) 1.04 – 1.26 1.14±0.04 0.89 – 1.27 1.10±0.04 < 0.01
SD: Standard deviation
EKD: Entire kernel density
VED: Vitreous endosperm density
FED: Floury endosperm density
Stellenbosch University https://scholar.sun.ac.za

92
(a)
0.0 0.1 0.2 0.3 0.4 0.5 0.6 0.7 0.8 0.9 1.0
1-specificity
0.0
0.1
0.2
0.3
0.4
0.5
0.6
0.7
0.8
0.9
1.0
sensitiv
ity
EKD=1.275
Area under curve=0.93
(b)
0.0 0.1 0.2 0.3 0.4 0.5 0.6 0.7 0.8 0.9 1.0
1-specificity
0.0
0.1
0.2
0.3
0.4
0.5
0.6
0.7
0.8
0.9
1.0
se
ns
itiv
ity
VED=1.375
Area under curve=0.79
(c)
0.0 0.1 0.2 0.3 0.4 0.5 0.6 0.7 0.8 0.9 1.0
1-specificity
0.0
0.1
0.2
0.3
0.4
0.5
0.6
0.7
0.8
0.9
1.0
se
nsitiv
ity
FED=1.125
Area under curve=0.78
Figure 5.7. ROC curves indicating milling quality classification, using (a) EKD, (b) VED and (c) FED.
Using an appropriate statistical method, i.e. ROC curves, classification based on milling quality
was possible (Table 5.3). The highest classification accuracy was obtained for EKD (Fig. 5.7a) (area
under curve = 93%) with a threshold value of 1.28 g.cm-3 classifying kernels with higher densities as
Stellenbosch University https://scholar.sun.ac.za

93
good milling hybrids (with 85% sensitivity) and with lower densities as the threshold value as poor
milling hybrid (with 88% specificity) (Table 5.3). VED (Fig. 6.7b) and FED (Fig. 5.7c) were also
responsible for good classifications (area under curve = 79% and 78%, respectively).
Better classification accuracies (100% sensitivity and 100% specificity) were observed in an
earlier study (Guelpa et al., 2014b), but it must be noted that a significantly higher resolution (13.4
µm) was used for the image acquisition, resulting in more density variation being captured. However,
the classification accuracies obtained at the lower resolution (80 µm) were still good (78% - 93%),
while simultaneously scanning 150 kernels. Consequently, a more robust classification model was
obtained, as well as a faster (as 300 vs. 16 kernels were scanned in the same time frame) and more
cost effective method of estimating maize kernel densities, therefore making it more applicable for
industry.
Table 5.3. ROC curve classification results when using X-ray µCT densities
Sensitivity
(%)
Specificity
(%)
Threshold
(g.cm-3)
Area under
curve (%)
EKD (g.cm-3) 85 88 1.28 93
VED (g.cm-3) 68 77 1.37 79
FED (g.cm-3) 71 74 1.12 78
EKD: Entire kernel density
VED: Vitreous endosperm density
FED: Floury endosperm density
X-ray µCT volume analysis
X-ray µCT allowed the quantification of the following volumes: EKV, VEV and FEV, based on grey
value thresholding of the respective ROIs. EKV included all volume inside the contour lines drawn
around the entire kernel, after removal of cavities. To segment the other 2 ROIs, the germ region
had to be excluded manually. Thereafter, a higher grey value threshold was applied to select the
vitreous endosperm region, while excluding the floury endosperm region. A region growing tool
identified voxels belonging to the selected grey value interval and respectively quantified the
volumes, using a volume analyser tool. Floury endosperm was quantified using the same method,
although a higher grey value interval had to be selected for segmentation.
Mean volumes for the entire sample set were: 251.64 mm3, 161.85 mm3 and 90.28 mm3 for
EKV, VEV and FEV, respectively. This is in accordance with an earlier finding of Wolf et al. (1952)
that the vitreous endosperm is approximately double the volume of floury endosperm in dent maize.
Wolf et al. (1952) made use of hand dissection to quantify the endosperm types.
For the two milling classes, it was evident that the EKV of the good milling hybrids were
significantly (P < 0.01) bigger (321.50 mm3) than that of the poor milling hybrids (255.56 mm3) (Table
Stellenbosch University https://scholar.sun.ac.za

94
5.4). The mean VEV (199.70 mm3) for the good milling hybrids were significantly (P < 0.01) bigger
than that of the poor milling hybrids (123.23 mm3), whereas the mean FEV (78.88 mm3) for the good
milling hybrids were significantly (P < 0.01) smaller than that of the poor milling hybrids (101.91
mm3). The obtained results agree with the higher proportion of vitreous endosperm present in good
milling kernels (Weber et al., 2014).
Numerous studies inspected the ratio of vitreous-to-floury endosperm (V:F) (Pomeranz et al.,
1984; Watson, 1987; Robutti, 1995; Siska & Hurburgh, 1995) as this ratio expresses maize hardness
(Delcour & Hoseney, 2010). Only few of these studies make use of non-destructive techniques, as
demonstrated by Erasmus and Taylor (2004) that developed a maize translucency detection
instrument and Weber et al. (2014) that used biospeckle and fuzzy granularity to quantify vitreous
and floury endosperm proportions. Near infrared (NIR) hyperspectral imaging (HSI) has also shown
to quantify the respective endosperm types (McGoverin & Manley, 2012), non-destructively. The V:F
was calculated for the X-ray µCT derived densities and the results obtained indicated a significantly
(P < 0.01) higher V:F for the good milling kernels (2.77) compared to that of the poor milling kernels
(1.27) (Table 5.4).
Table 5.4. Entire kernel volume, vitreous endosperm volume and floury endosperm volume results as derived
by X-ray µCT for the two milling classes, good (n = 150) and poor (n = 147), also indicating ANOVA results
Good milling hybrids Poor milling hybrids P-value
Range Mean±SD Range Mean±SD
EKV (mm3) 158.41 – 147.68 321.50±51.42 143.09 – 443.96 255.56±70.09 < 0.01
VEV (mm3) 66.36 – 313.67 199.70±39.72 35.92 – 282.79 123.23±51.79 < 0.01
FEV (mm3) 34.51 – 188.42 78.88±23.51 51.98 – 218.14 101.91±26.67 < 0.01
V:F 0.69 – 7.18 2.77±1.04 0.2 – 3.71 1.27±0.58 < 0.01
SD: Standard deviation
EKD: Entire kernel density
VED: Vitreous endosperm density
FED: Floury endosperm density
V:F: Vitreous-to-floury endosperm ratio
As volume measurements were easier to obtain than density measurements, classification using
ROC curves was attempted based on volumes and summarised in Table 5.5. Very good
classification accuracies of 87% and 92% were obtained for VEV and V:F, respectively (Figs. 6.8a
and b). The fact that V:F was an excellent descriptor of maize hardness in many previous studies,
it was also shown that this ratio was equally useful in describing maize milling quality. The efficacy
of X-ray µCT as a non-destructive quantitative method was also shown. Slightly poorer classification
accuracies were obtained for EKV (75%) and FEV (77%) (Figs. 5.8c and d).
Stellenbosch University https://scholar.sun.ac.za

95
Table 5.5. ROC curve classification results when using X-ray µCT volumes
Sensitivity
(%)
Specificity
(%)
Threshold
(mm3)
Area under
curve (%)
EKV (mm3) 79 68 251.60 75
VEV (mm3) 81 82 176.14 87
FEV (mm3) 78 67 84.3 77
V:F 85 90 1.99 92
EKD: Entire kernel density
VED: Vitreous endosperm density
FED: Floury endosperm density
V:F: Vitreous-to-floury endosperm ratio
The importance of the X-ray µCT derived variables, as interpreted by principal component
analysis and correlation coefficients
The interaction of all the variables (densities and volumes) of the entire sample set was illustrated in
the PCA bi-plot (Fig. 5.9). All these measurements were done on individual kernels (n = 297). The
first two principal components (PCs) described 76% of the variation within the model, with PC 1
describing the most (56%). Milling quality was described in the direction of PC 1. This was in
accordance with the hardness (hard and soft kernels) study of Guelpa et al. (2014b).
The loadings indicated the relationship between the variables, and in particular, it could be
observed that a stronger correlation existed between V:F, EKD, VEV, VED, FED and EKV. FEV
showed no correlation. Considering the Spearman’s rank correlation coefficients, as listed in Table
5.6, it was apparent that FEV was indeed poorly correlated with the other variables, except with V:F
(r = -0.70, P < 0.01). Although FEV showed a poor relationship with the other variables in the PCA
bi-plot, a good classification accuracy of 77% was obtained when classifying good and poor milling
kernels based on this measurement. The PCA bi-plot, consequently illustrated that FEV described
another milling quality feature that the other measurements did not describe.
The strongest correlations were indicated to be that of VEV and EKV. (r = 0.89, P < 0.01) and
VEV and V:F (r = 0.85, P < 0.01). When considering the ROC curve classification results, V:F and
EKD had the best classification accuracies (92% and 93%, respectively) when predicting milling
quality. From the PCA bi-plot it was also evident that V:F and EKD, as well as VEV, were more
strongly correlated with the good milling hybrids (good milling kernels lying closer to the respective
variables on the plot).
Stellenbosch University https://scholar.sun.ac.za

96
It was also important to note that there were significant differences (P < 0.05) between all the
variables, except between FED and FEV (P > 0.1) and that the variables (except FEV) thus
contributed towards describing the milling quality of the individual maize kernels.
(a)
0.0 0.1 0.2 0.3 0.4 0.5 0.6 0.7 0.8 0.9 1.0
1-specificity
0.0
0.1
0.2
0.3
0.4
0.5
0.6
0.7
0.8
0.9
1.0
sensitiv
ity
V:F=1.99
Area under curve=0.92
(b)
0.0 0.1 0.2 0.3 0.4 0.5 0.6 0.7 0.8 0.9 1.0
1-specificity
0.0
0.1
0.2
0.3
0.4
0.5
0.6
0.7
0.8
0.9
1.0
sensitiv
ity
VEV=176.14
Area under curve=0.87
(c)
0.0 0.1 0.2 0.3 0.4 0.5 0.6 0.7 0.8 0.9 1.0
1-specificity
0.0
0.1
0.2
0.3
0.4
0.5
0.6
0.7
0.8
0.9
1.0
se
nsitiv
ity
EKV=251.6
Area under curve=0.75
(d)
0.0 0.1 0.2 0.3 0.4 0.5 0.6 0.7 0.8 0.9 1.0
1-specificity
0.0
0.1
0.2
0.3
0.4
0.5
0.6
0.7
0.8
0.9
1.0
sensitiv
ity
FEV=84.295
Area under curve=0.77
Figure 5.8. ROC curves indicating milling quality classification, using (a) V:F, (b) VEV, (c) EKV and (d) FEV.
The importance of the X-ray µCT derived variables, in relation to conventional hardness
methods, as interpreted by principal component analysis and correlation coefficients
Six conventional hardness methods were compared to the X-ray µCT method, in order to determine
and interpret the functionality of X-ray µCT as hardness descriptor. The first conventional method
was particle size index (PSI), which involved milling and sieving and contributed breaking
Stellenbosch University https://scholar.sun.ac.za

97
susceptibility properties of maize kernels. Secondly, a hardness index (HI) was used where NIR
absorption values at 2230 nm were used to calculate the HI. These measurements also conveyed
particle size information, similar to PSI. Then, physical properties, such as volume and soundness,
were expressed by hectoliter mass (HLM) and hundred kernel mass (HKM) measurements which
were the fourth and fifth conventional methods. And lastly, protein content was determined as a
descriptive quality parameter, along with NIR HSI that was used to quantify the proportion of vitreous
endosperm. In order to perform these correlations, the X-ray µCT variables were taken as the
averages of the 15 kernels per samples, as summarised in Table 5.7.
FEV
PC 1(56%)
V:F
EKV
FED
VED
VEV
EKD
PC
2(2
0%
)
good
poor
0.50 alpha elipses
Figure 5.9. A PCA bi-plot, illustrating the interaction between the X-ray µCT derived variables on 297 maize
kernels.
The interaction of the X-ray µCT derived variables, as well as variables derived from 6
conventional hardness methods, was illustrated in another PCA bi-plot (Fig. 5.10). The first two PCs
describe 80% of the variation within the model, with PC 1 describing the major percentage (64%).
Again, milling quality was described in the direction of the first PC. As indicated by the loadings,
V:F, VEV and EKV were the X-ray µCT derived variables that showed strong correlations, along with
PSI, HLM, NIR, protein, HKM and HSI (all the conventional methods). EKD, FED and VED did not
correlate with the other variables, and FEV was not describe in either PC 1, nor in PC 2, therefore
not indicated on the PCA bi-plot.
As PCA does not consider the variability (range) within the measurements, Spearman’s rank
correlation coefficients had to be interpreted along with the PCA bi-plot to better understand the
relationship between the variables. The poor milling samples included 2 obvious outliers, one very
Stellenbosch University https://scholar.sun.ac.za

98
high in density (1.36 g.cm-3), and the other with a very low density (1.11 g.cm-3). For the X-ray µCT
derived variables, the strongest correlations were that of V:F and VEV (r = 0.92, P < 0.01) and VED
and FED (r = 0.90, P < 0.01). EKD, VED and FED were also strongly correlated, and was in
agreement with the PCA bi-plot.
Table 5.6. Spearman’s rank correlation coefficient matrix for the X-ray µCT variables done on individual maize
kernels (n = 297)
EKD VED FED EKV VEV FEV V:F
EKD 1.00
VED 0.80* 1.00
FED 0.76* 0.64* 1.00
EKV 0.27* 0.31* 0.17** 1.00
VEV 0.76* 0.39* 0.39* 0.89* 1.00
FEV -0.45* -0.16* -0.04**** 0.20* -0.26* 1.00
V:F 0.77* 0.36* 0.30* 0.53* 0.85* -0.70* 1.00
EKD: Entire kernel density (g.cm-3)
VED: Vitreous endosperm density (g.cm-3)
FED: Floury endosperm density (g.cm-3)
EKV: Entire kernel volume (mm3)
VEV: Vitreous endosperm volume (mm3)
FEV: Floury endosperm volume (mm3)
V:F: Vitreous-to-floury endosperm ratio
*: P < 0.01
**: P < 0.05
***: P < 0.1
****: non-significant
When interpreting the relationship of the conventional methods with the X-ray µCT variables, it
was evident that the density variables correlated poorly with the conventional methods. The
conventional methods did not convey density information and it was thus expected that none of the
conventional methods would correlate with the density variables. When considering the good
classification accuracies that were obtained from the density measurements, using the ROC curves,
densities were still seen as milling quality descriptors, despite of not being presented as contributing
variables in the PCA bi-plot. Compared to all the other measurements, density measurements were
also narrow in range, a factor that is not interpreted by a PCA bi-plot.
The volume variables, on the other hand, were strongly correlated with all the conventional
methods, except protein. It was interesting to observe that PSI, HKM, HLM, NIR and HSI were so
Stellenbosch University https://scholar.sun.ac.za

99
similar in their descriptive properties. The strongest correlations were those between HSI and VEV
(r = 0.95, P < 0.01), HKM and EKV (r = 0.90, P < 0.01), NIR and VEV (r = 0.88, P < 0.01), as well as
NIR and V:F (r = 0.88, P < 0.01). The very strong correlation between HSI and VEV was expected,
as the NIR HSI method also determined the percentage vitreous endosperm within individual maize
kernels. Due to the available spatial information, pixels belonging to vitreous endosperm could be
quantified. These results confirmed the usability of NIR HSI to quantify maize endosperm types.
PC 1(64%)
EKD FED VED
NIR HISHKMEKVProtNIR
HLMPSI
VEV
V:FPC
2(1
6%
)
good poor
0.50 apha elipses
Figure 5.10. A PCA bi-plot, illustrating the interaction between the X-ray µCT derived variables, as well as the
variables from 6 conventional hardness methods, of 20 maize samples.
Although PSI, HLM, HKM, NIR, NIR HSI and protein content had been shown to describe maize
hardness, the PCA bi-plot indicated that density variables were lacking for the description of milling
quality. It was evident that dedicated density methods were needed to describe milling quality, and
as conventional density methods overlook the influence of cavities, X-ray µCT measured densities
were very useful.
Stellenbosch University https://scholar.sun.ac.za

100
Table 5.7. Descriptive statistics of the averaged X-ray µCT variables, as well as the variables from the 6
conventional hardness methods, for each of the milling groups
Good milling Poor milling P-value
Mean±SD Mean±SD
EKD (g.cm-3) 1.30±0.03 1.22±0.07 < 0.01
VED (g.cm-3) 1.37±0.04 1.35±0.06 < 0.05
FED (g.cm-3) 1.14±0.04 1.10±0.06 N.S.
EKV (mm3) 277.87±21.42 225.22±53.08 < 0.05
VEV (mm3) 199.69±22.49 123.59±40.70 < 0.01
FEV (mm3) 78.88±8.32 101.90±14.05 < 0.01
V:F 2.76±0.48 1.27±0.29 < 0.01
PSI (c/f) 2.74±0.97 1.57±0.62 < 0.05
HKM (g) 40.72±5.45 31.45±9.64 N.S.
HLM (kg.hL-1) 79.56±1.20 75.03±1.67 < 0.01
Protein (%) 8.94±0.73 7.79±0.73 < 0.01
NIR @ 2230 nm 10.89±3.03 3.10±3.15 < 0.01
%VE 33.60±8.44 16.11±7.70 < 0.01
SD: Standard deviation
EKD: Entire kernel density
VED: Vitreous endosperm density
FED: Floury endosperm density
EKV: Entire kernel volume
VEV: Vitreous endosperm volume
FEV: Floury endosperm volume
V:F: Vitreous-to-floury endosperm ratio
PSI (c/f): Particle size index (coarse over fine ratio)
HKM: Hundred kernel mass
HLM: Hectoliter mass
Protein: Protein content (Dumas method)
NIR @ 2230 nm: Near infrared spectroscopy (hardness index)
%VE: % vitreous endosperm as determined using NIR HSI
N.S.: Non-significant (P > 0.05)
Stellenbosch University https://scholar.sun.ac.za

101
Table 5.8. Spearman’s rank correlation coefficient matrix for the X-ray µCT derived variables (averaged per
sample), as well as for the variables from the 6 conventional methods
EKD VED FED EKV VEV FEV V:F PSI HKM HLM Prot. NIR
EKD 1.00
VED 0.77* 1.00
FED 0.81* 0.90* 1.00
EKV 0.36*** 0.27*** 0.36*** 1.00
VEV 0.60* 0.38*** 0.53** 0.88* 1.00
FEV -0.51*** -0.26*** -0.39*** -0.07*** -0.48** 1.00
V:F 0.68* 0.45*** 0.62* 0.69* 0.92* -0.65* 1.00
PSI 0.40*** 0.32*** 0.48** 0.65* 0.78* -0.55** 0.76* 1.00
HKM 0.34*** 0.35*** 0.40*** 0.90* 0.80* -0.06*** 0.68* 0.72* 1.00
HLM 0.59* 0.29*** 0.47** 0.71* 0.88* -0.53** 0.87* 0.62* 0.57* 1.00
Prot. 0.35*** 0.27*** 0.43*** 0.48** 0.67* -0.65* 0.71* 0.76* 0.57* 0.58* 1.00
NIR 0.55* 0.40** 0.48** 0.74* 0.88* -0.55** 0.88* 0.83* 0.75* 0.83* 0.65* 1.00
%VE 0.42** 0.40** 0.53** 0.85* 0.95* -0.41*** 0.89* 0.81* 0.85* 0.82* 0.71* 0.81*
EKD: Entire kernel density (g.cm-3)
VED: Vitreous endosperm density (g.cm-3)
FED: Floury endosperm density (g.cm-3)
EKV: Entire kernel volume (mm3)
VEV: Vitreous endosperm volume (mm3)
FEV: Floury endosperm volume (mm3)
V:F: Vitreous-to-floury endosperm ratio
PSI (c/f): Particle size index (coarse over fine ratio)
HKM: Hundred kernel mass
HLM: Hectoliter mass
Protein: Protein content (Dumas method) (%)
NIR @ 2230 nm: Near infrared spectroscopy (hardness index)
%VE: % vitreous endosperm as determined using NIR HSI
*: P < 0.01
**: P < 0.05
***: Non-significant (P > 0.05)
Conclusion
An attempt was made to classify maize hybrids, based on X-ray µCT determined densities and
volumes. Density measurements, in particular EKD, obtained from low resolution (80 µm) scans,
allowed for good classification accuracies (93%). The more easily obtained volume measurements
ranged in classification accuracies of 77% to 92%, also indicating good classification, especially for
V:F (sensitivity = 85% and selectivity = 90%). The loadings of a PCA bi-plot indicated a relationship
Stellenbosch University https://scholar.sun.ac.za

102
between all the density and volume variables, except that of FEV, which were confirmed with
Spearman’s rank correlation coefficients. But, when conventional hardness methods were added as
supplementary properties to describe milling quality, the density measurements were not associating
with the rest of the variables any more. Conventional hardness methods, i.e. PSI, HLM, HKM, NIR,
NIR HSI and protein content contributed towards describing the same features that the volume
measurements described. To discriminate between milling quality, it seemed that density properties
had to be present.
References
Benson, G.O. & Pearce, R.B. (1987). Corn Perspective and Culture. In: Corn: chemistry and
technology. (edited by S.A. Watson & P.E. Ramstad). St. Paul, Minnesota; USA: American
Association of Cereal Chemists.
Cnudde, V. & Boone, M.N. (2013). High-resolution X-ray computed tomography in geosciences: A
review of the current technology and applications. Earth-Science Reviews, 123, 1-17.
De Carvalho, M.L.M., Van Aelst, A.C., Van Eck, J.W. & Hoekstra, F.A. (1999). Pre-harvest stress
cracks in maize (Zea mays L.) kernels as characterized by visual, X-ray and low temperature
scanning electron microscopical analysis: effect on kernel quality. Seed Science Research,
9, 227-236.
Delcour, J. & Hoseney, R.C. (2010). Principles of Cereal Science and Technology. Pp. 1-22.
Minnesota, USA: AACC International Press.
Erasmus, C. & Taylor, J.R.N. (2004). Optimising the determination of maize endosperm vitreousness
by a rapid non-destructive image analysis technique. Journal of the Science of Food and
Agriculture, 84, 920-930.
Figueroa Cárdenas, J.D., Reyes Vega, M.L., Rincón Sánchez, F., Gaytán Martínez, M. & Morales
Sánchez, E. (2006). Microstructure of starch granule related to kernel hardness in corn.
Revista Fitotecnia Mexicana, 29, 135-139.
Fox, G. & Manley, M. (2009). Hardness methods for testing maize kernels. Journal of Agricultural
and Food Chemistry, 57, 5647-5657.
Guelpa, A., Bevilacqua, M., Marini, F., O'Kennedy, K., Geladi, P. & Manley, M. (2014a). Application
of Rapid Visco Analyser (RVA) viscograms and chemometrics for maize hardness
characterisation. Food Chemistry, 173, 1220-1227.
Guelpa, A., Du Plessis, A., Kidd, M. & Manley, M. (2014b). Non-destructive estimation of maize (Zea
mays L.) kernel hardness by means of an X-ray micro-computed tomography (µCT) density
calibration. Food and Bioprocess Technology. Submitted.
Gustin, J.L., Jackson, S., Williams, C., Patel, A., Armstrong, P.R., Peter, G.F. & Settles, A.M. (2013).
Analysis of maize (Zea mays) kernel density and volume using micro-computed tomography
and single-kernel near infrared spectroscopy. Journal of Agricultural and Food Chemistry,
61, 10872-10880.
Stellenbosch University https://scholar.sun.ac.za

103
Hamilton, T., Hamilton, B.C., Johnson, B.C. & Mitchell, H. (1951). The dependence of the physical
and chemical composition of the corn kernel on soil fertility and cropping system. Cereal
Chemistry, 28, 163-176.
Johnson, D.Q. & Russell, W.A. (1982). Genetic variability and relationships of physical grain-quality
traits in the BSSS population of maize. Crop Science, 22, 805-809.
Kalender, W.A. (2006). X-ray computed tomography. Physics in medicine and biology, 51, R29.
Kotwaliwale, N., Singh, K., Kalne, A., Jha, S.N., Seth, N. & Kar, A. (2011). X-ray imaging methods
for internal quality evaluation of agricultural produce. Journal of Food Science and
Technology, 51, 1-15.
Lee, K.M., Bean, S.R., Alavi, S., Herrman, T.J. & Waniska, R.D. (2006). Physical and biochemical
properties of maize hardness and extrudates of selected hybrids. Journal of Agricultural and
Food Chemistry, 54, 4260-4269.
Maire, E. & Withers, P.J. (2014). Quantitative X-ray tomography. International Materials Reviews,
59, 1-43.
McGoverin, C. & Manley, M. (2012). Classification of maize kernel hardness using near infrared
hyperspectral imaging. Journal of Near Infrared Spectroscopy, 20, 529-535.
Neethirajan, S., Karunakaran, C., Symons, S. & Jayas, D.S. (2006). Classification of vitreousness in
durum wheat using soft X-rays and transmitted light images. Computers and Electronics in
Agriculture, 53, 71-78.
Paiva, E., Kriz, A.L., Peixoto, M.J.V.V.D., Wallace, J.C. & Larkins, A.B. (1991). Quantitation and
distribution of ã–zein in the endosperm of maize kernels. Cereal Chemistry, 68, 276-279.
Peplinski, A.J., Paulsen, M.R., Anderson, R.A. & Kwolek, W.F. (1989). Physical, chemical, and dry-
milling characteristics of corn hybrids from various genotypes. Cereal Chemisty, 66, 117-120.
Pomeranz, Y., Martin, C.R., Traylor, D.D. & Lai, F.S. (1984). Corn hardness determination. Cereal
Chemistry, 61, 147-150.
Robutti, J.L. (1995). Maize kernel hardness estimation in breeding by near-infrared transmission
analysis. Cereal Chemistry, 72, 632-636.
Robutti, J.L., Borras, F.S. & Eyherabide, G.H. (1997). Zein compositions of mechanically separated
coarse and fine portions of maize kernels. Cereal Chemistry, 74, 75-78.
Singhal, A., Grande, J.C. & Zhou, Z. (2013). Micro/Nano CT for visualization of internal structures.
Microscopy Today, 21, 16-22.
Siska, J. & Hurburgh, C.R. (1995). Corn density measurement by near-infrared transmittance.
Transactions of the ASAE, 38, 1821-1824.
Takhar, P.S., Maier, D.E., Campanella, O.H. & Chen, G. (2011). Hybrid mixture theory based
moisture transport and stress development in corn kernels during drying: Validation and
simulation results. Journal of Food Engineering, 106, 275-282.
Stellenbosch University https://scholar.sun.ac.za

104
Watson, S.A. (1987). Structure and Composition. In: Corn Chemistry and Technology (edited by S.A.
Watson & P.E. Ramstad). Pp. 53-82. St. Paul, Minnesota, USA: American Association of
Cereal Chemists, Inc.
Weber, C., Dai Pra, A.L., Passoni, L.I., Rabal, H.J., Trivi, M. & Poggio Aguerre, G.J. (2014).
Determination of maize hardness by biospeckle and fuzzy granularity. Food Science &
Nutrition, 2, 557-564.
Wolf, M.J., Buzan, C.L., MacMasters, M.M. & Rist, C.E. (1952). Structure of the mature corn kernel.
I. Gross anatomy and structural relationships. Cereal Chemistry, 29, 321-333.
Stellenbosch University https://scholar.sun.ac.za

105
Chapter 6
Prediction of kernel density of single maize (Zea mays L.) kernels using a
miniature near infrared (NIR) spectrophotometer
Abstract
Single maize (Zea mays L.) kernels (n = 297) from a variety of breeding materials were scanned
using a miniature near infrared (NIR) spectrophotometer, i.e. a microNIR. As maize kernel density
affects milling performance, X-ray µCT determined entire kernel density (EKD) measurements were
used as reference values for the NIR prediction model building. Spectra were acquired in the
wavelength range from 908 - 1680 nm at a resolution of 30 x 250 µm / 50 µm. Maize kernels were
positioned both germ facing towards the detector (germ-up) and facing away from the detector
(germ-down). Mean centered and standard normal variate (SNV) pre-processed spectra were
subjected to partial least squares (PLS) regression model building of EKD measurements. The use
of microNIR spectroscopy as a possible non-destructive and fast single-kernel analysis method for
predicting EKD, was investigated. Prediction statistics for the larger sample set (where each kernel
was scanned both germ-up and germ-down) for EKD was: R2V = 0.60, RMSEP = 0.03 g.cm-3, RPD
= 1.67 and for the smaller sample set (where each kernel was scanned only germ-down) for EKD
was: R2V = 0.32, RMSEP = 0.03 g.cm-3, RPD = 1.67. There is a need to develop cost-effective
technologies for fast sorting of small amounts of grain samples, such as those from breeding
programmes. These results indicated that reasonable predictions can be made at the fast NIR scan
rate that would be suitable for breeders as a rough screening method.
Stellenbosch University https://scholar.sun.ac.za

106
Introduction
The hardness of maize is a critical quality parameter that defines the suitability thereof for different
processes and end-product quality (Armstrong & Tallada, 2012). Hard maize hybrids are favoured
by the dry-milling industry for the production of high quality grits and optimal yields (Lee et al., 2007).
Near infrared (NIR) reflectance spectroscopy is prominent among major analytical technologies and
used routinely in the grain industries to predict quality attributes, as it is a non-destructive, fast and
a low-cost method (McClure, 2004; Manley, 2014). NIR absorption bands occur due to C-H,N-H, O-
H and S-H functional groups that causes overtone and combination vibrations. Therefore, any
organic molecule, which is abundant in biological material, is suitable for NIR analysis, including
maize kernels. NIR analysis has been successfully used for bulk maize characterisation for a number
of measurements, i.e. oil, protein, starch and moisture (Jiang et al., 2007).
Grain quality, linked to processing quality, has been identified by researchers as an area for
further single-kernel calibration development (Fox & Manley, 2014). However, the prediction of
single-kernel traits poses obstacles as it is difficult to collect reliable and representative spectra from
a heterogeneous sample (such as a maize kernel). To overcome the presented limitation, Armstrong
(2006) developed a device where the kernels passed through a glass tube as the spectra were
collected. Spielbauer et al. (2009) modified this approach by integrating kernel weight
measurements along with the spectral acquisition. Janni et al. (2008) managed to obtain averaged
reflectance spectra from individual kernels as they tumbled within an airstream during acquisition.
The microNIR is a new portable spectrophotometer designed for hand-held applications. This
pocket-sized spectrophotometer makes use of linear variable filter (LVF) technology that is known
for stable and reliable optics (Macleod, 2010). The LVF comprises of a thin film used as a dispersive
element, and apart from reducing costs, the LVF technology results in a compact and rugged
spectral engine with no moving parts (O'Brien et al., 2012; Alcalà et al., 2014). Successful
applications of the microNIR spectrophotometer was for predicting authentic or counterfeit medical
tables (Alcalà et al., 2014) and for identifying similar species of fish fillets (Friedrich et al., 2014).
As maize hardness is predominantly a genetic trait (Watson, 1987), plant breeding programmes
have the opportunity to improve some of these quality characteristics (Fox & Manley, 2014). The
evaluation of the success of respective breeding efforts, is best performed on a single-kernel basis
as single cobs with the value added trait are sometimes produced, resulting in a limited amount of
kernels (Janni et al., 2008). There is thus still a need to develop cost-effective methods for fast
sorting that can be used on limited samples, as those from breeding programmes (Fox & Manley,
2014).
Among the many methods that are available for hardness measurements, it had been
established that milling quality requires density measurements to be adequately described (Chapter
5). As density measurements from conventional density methods are influenced by large cavities
present in maize kernels, misleading results can be obtained. Therefore, using an X-ray micro-
computed tomography (µCT) density calibration (Guelpa et al., 2014) true kernel densities could be
Stellenbosch University https://scholar.sun.ac.za

107
calculated. The X-ray µCT method of determining kernel density is, however, not ideal for fast
screening as an experienced technician is needed, along with tedious data analysis.
The aim of this study was to investigate the use of microNIR spectroscopy as a possible non-
destructive and fast single-kernel analysis method for predicting EKD.
Material and methods
Samples used for model building
Maize hybrids, ranging in milling quality, were kindly supplied by PANNAR Seeds (Greytown, South
Africa). The sample set consisted of 10 good milling hybrids and 10 poor milling hybrids, as described
in Chapter 5 and listed in Table 5.1. For the single-kernel prediction model, 15 kernels from each of
the 20 hybrids were scanned, both germ-up and germ-down, resulting in a sample set of 600 spectra.
X-ray µCT density measurements were done on the same 300 kernels that were scanned with the
microNIR spectrometer.
X-ray µCT derived measurements used for model building
Entire kernel density (EKD) was determined using a commercial micro-focus X-ray computed
tomography system, i.e. Phoenix V|Tome|X L240 (General Electric Sensing and Inspection
Technologies / Phoenix X-ray, Wunstorff, Germany). The acquisition of the images and the data
analysis and processing is described in Chapter 5. In order to facilitate the calculation of the maize
kernel densities, a density calibration had to be constructed from a range of polymers, using their
averaged grey values, as obtained by X-ray µCT, and their respective known densities. Successful
density calculations, using the density calibration, required simultaneous scanning of the polymers
and maize kernels.
Data processing of 3 maize kernels were not possible due to artefacts, and the actual number of
samples used for EKD measurements were 297.
Spectral acquisition
The absorbance of reflectance spectra was measured in the NIR region (908 - 1680 nm) of the
electromagnetic spectrum at 6.2 nm intervals, resulting in 125 wavelength bands. The scans of 297
maize kernels were individually acquired, scanned germ-up as well as germ-down, using a microNIR
1700. The microNIR is a miniature NIR spectrometer (Fig. 6.1a) developed and manufactured by
JDSU Corporation (Santa Rosa, CA, USA). A 128-pixel InGaAs detector was used to achieve a
resolution of 30 x 250 µm / 50 µm. Each spectrum was the average of 64 scans. The microNIR was
fitted with a LVF filter which can be compared to a scanning Fabry-Perot interferometer that scans
with position instead of time (Macleod, 2010; O'Brien et al., 2012). Two tungsten lamps allowed for
illuminating a spot (3 mm in diameter) on the sample with the optimal focal distance being 3 mm
from the sample.
Stellenbosch University https://scholar.sun.ac.za

108
The external white reference was a 99% diffuse reflectance standard (JDSU Corporation, Santa
Rosa, CA, USA) measured once every 15 minutes during the sample acquisition period. The maize
kernels were placed, one at a time, in a hollowed-out Teflon (PFTE) disk (Maizey’s (Pty) Ltd, Kuils
River, South Africa) (Fig. 6.1b) that completely covered the microNIR’s connectable collar upon
scanning. In order to keep the optimal focal distance of 3 mm constant, in spite of maize kernels
differing in thickness, a range of hollowed-out disks were developed, varying in depth from 5 mm to
10 mm. MicroNIR software (JDSU Corporation, Santa Rosa, CA, USA) was used to perform the
spectroscopic measurements and the data was saved in Microsoft Excel format for analysis in
Evince 2.5.5 software (Umbio, Umeå, Sweden).
(a)
(b)
Figure 6.1. (a) A microNIR spectrometer imaged next to a pen to illustrate the small size of the device, and
(b) a hollowed-out Teflon disk with a maize kernel inside as it was used when scanning individual maize
kernels.
Principal component analysis and partial least squares regression models
Data was explored, using principal component analyses (PCA), whereas partial least squares (PLS)
regression models were built to perform predictions on single-kernel spectra. EKD measurements
were used as reference values. Spectra were mean-centered and standard normal variate (SNV)
and multiplicative scatter correction (MSC) spectral pre-treatment were explored during model
development. To test prediction ability, the samples were divided into a calibration set to build the
regression models and a test set to independently validate the regression models. This was done
by sorting the reference density values into ascending order and selecting every third sample for
validation with the remaining used to develop the calibration model. This assured that both models
had the same broad range of reference values. Full cross-validation (leave-one-out exclusion)
regression modeling of the calibration set was used to establish a preliminary number of factors for
the model. The calibration and validation models were evaluated individually, reporting the errors as
Stellenbosch University https://scholar.sun.ac.za

109
root mean square error of cross-validation (RMSECV) and root mean square error of prediction
(RMSEP), as well as coefficients of determination for both the calibration and validation sets, R2C
and R2V, respectively. RPD and standard error of laboratory (SEL) values were also reported.
Results and discussion
The performance of NIR prediction calibrations can be influenced by many factors, with the two most
important ones being the representative nature of the samples and the accuracy of the
measurements from the reference methods (Wang & Paliwal, 2007). In the current study, an attempt
was made to optimise the presentation of the samples by making minor technical modifications.
Custom designed Teflon sample holders were used to ensure that the kernels were maintained in
the center of the sample area, when scanned. Furthermore, the sample holders differed in depth
and could thereby ensure a constant optical focal distance, irrespective of kernel thickness.
Additionally, the accuracy of the measurements of the reference method (entire kernel density as
calculated using X-ray µCT) was validated by comparing estimated and measured masses (r = 0.99)
and a very low standard error of measurement of 0.01 g.cm-3 was obtained, confirming the
measurements as very accurate (Guelpa et al., 2014).
Reflectance measurements are surface-biased and the position of the germ, either showing
towards or away from the detector, influences calibration accuracies (Jiang et al., 2007). Therefore,
the current study included both the orientations of the germ (germ-up and germ-down) into the
prediction calibration, including more variation in the prediction model.
Only the wavelength range of 1000 - 1680 nm was considered for performing PCA and PLS
regression modelling because of the low signal-to-noise ratio at the edge of the spectra. SNV was
selected as a pre-treatment method as it resulted in the best calibration models. The mean-centered
and SNV pre-treated spectral profile (n = 594) (Fig. 6.2) had the usual significant absorption peaks
at 1450 nm for moisture and 1175 – 1225 nm for protein.
As the sample set consisted of both good milling and poor milling hybrids, a PCA model was
calculated with the samples coloured according to their respective class. It was observed that milling
quality properties were distinguishable when both the second and third PCs were interpreted. A
degree of clustering was visible between the good milling samples (red dots) and the poor milling
samples (blue dots) (Fig. 6.3). From the loading line plot of PC 2 (Fig. 6.4a) it was evident that this
PC was important as it represented variation associated with protein (N-H stretch first overtone of
CONH2 as indicated by 1430 nm), as well as starch (C-H stretch second overtone of CH, indicted by
1225 nm). The three positively loaded peaks in PC 3 were associated with starch, as 1170 nm was
associated with C-H stretch second overtone (HC=CH), 1395 nm with 2 x C-H stretch + C-H (CH2)
and 1660 nm was in turn associated with C-H stretch first overtone (cis-RCH+CHR1) (Osborne et
al., 1993).
Stellenbosch University https://scholar.sun.ac.za

110
Figure 6.2. Mean-centered and SNV pre-treated NIR reflectance spectra, as acquired using a microNIR
spectrophotometer, of the sample set, scanned both germ-up and germ-down.
Figure 6.3. A principal component score plot of PC 2 vs. PC 3 (27.9% and 10.7%), illustrating both PCs to be
important with respect to the variation found between the good milling (red dots) and poor milling (blue dots)
kernels.
Stellenbosch University https://scholar.sun.ac.za

111
(a)
(b)
Figure 6.4. A loading line plot for (a) PC 2 showing 2 prominent positive peaks: (1) 1225 nm and (2) 1430 nm,
associated with starch and protein, and (b) PC 3 showing 3 prominent positive peaks: (1) 1170 nm, (2) 1395
nm and (3) 1660 nm, all associated with starch.
Ten latent variables (LVs) were selected for optimal model building as they resulted in the lowest
RMSECV, following full-cross validation of the calibration set of the mean-centered and SNV pre-
processed germ-up and germ-down scanned spectra. The mean±SD for the calibration (130±0.05
g.cm-3, n = 423) and external validation (1.27±0.05 g.cm-3, n = 171) sets were very similar, which
ensured accurate error estimation by external validation. An RMSECV of 0.02 g.cm-3 and RMSEP
of 0.03 g.cm-3 was determined for EKD. Plotting predicted EKD versus actual EKD values for the
external validation set, showed that the regression model predicted the variable reasonably good
(R2V = 0.60) (Fig. 6.5). Although a SEL of 0.01 g.cm-3 was obtained with the X-ray µCT measurement
method, it should, however, be stressed that large and expensive equipment was needed, and was
also time-consuming.
Guidelines for interpretation of modeling results make use of RPD values, which is a ratio of the
SD of the reference data to the SECV. RPD values can also be determined for the validation data.
As suggested by Williams (1991), RPD values of 2.5 to 3 were suitable for rough screening; a value
of 5 to 8 could be used for quality control.
In an earlier study, a RPD value of 2.53 was obtained for a regression model of total kernel
density, determined using X-ray µCT, and single-kernel NIR Grain Analyser spectra (Gustin et al.,
2013). The latter study indicated the model as an effective screening tool, with a RMSEP of 0.03
g.cm-3 and R2V of 0.78. The prediction model of EKD for the current study obtained a RPD value of
1
2
3
1
2
Stellenbosch University https://scholar.sun.ac.za

112
only 1.67 (RMSEP = 0.03 g.cm-3 and R2V = 0.60) as a smaller SD (of 0.05 g.cm-3 compared to) was
present. The current study included 20 hybrids, whereas the former study sampled from 64 hybrids,
incorporating more variation in their sample set, therefore the larger SD of 0.07 g.cm-3 was found.
Figure 6.5. Validation set predictions for EKD (g.cm-3) of the robust sample set (scanned germ-up and germ-
down).
A second calibration was built, considering only kernels that was scanned germ-down. Milling
quality properties were already distinguishable in the PCA score plot of PC1 vs. PC 2 (Fig. 6.6a),
with the good milling kernels (red dots) separating from the poor milling kernels (blue dots) in the
direction of PC 2. The loading line plot for PC 2 (Fig. 6.6b) revealed two positively loaded peaks, i.e.
at 1195 nm and 1415 nm, both being associated with starch (CH2) (Osborne et al., 1993), which is
the main constituent of endosperm. The spectra from the larger sample set (scanned both germ-up
and germ-down) described variation in both protein and starch, with the germ contributing the protein
constituents.
Three latent variables were selected, based on lowest RMSECV, after performing full-cross
validation on the calibration set (n = 205), followed with mean-centering and SNV, for model building
of spectra collected from germ-down kernels. EKD measurements were used as reference values.
A better RMSECV, compared to that of the large sample set, was obtained (0.01 g.cm-3), but the
RMSEP stayed the same (0.03 g.cm-3) and the R2c was 0.40. For the validation set (n = 91) a R2
V of
0.32 was obtained for the predicted EKD versus actual EKD values (Fig. 6.7), with a RPD value of
1.67.
1.16
1.21
1.26
1.31
1.36
1.41
1.16 1.21 1.26 1.31 1.36 1.41
Y p
red
icte
d (
EKD
)
Y measured (EKD)
R2V = 0.60
RMSEP = 0.03 g.cm-3
LVs = 10n = 171
Stellenbosch University https://scholar.sun.ac.za

113
(a)
(b)
Figure 6.6. (a) Principal component score plot of PC 1 vs. PC 2 (72.6% and 20.6%) illustrating the good milling
kernels (red dots) to cluster predominantly above PC 2 and the poor milling kernels (blue dots) to cluster below
PC 2. (b) A loading line plot for PC 2 revealing 2 prominent positive peaks: (1) at 1195 nm and the other one
at 1415 nm.
Four samples (encircled with red dotted line in Figure 6.7) were investigated as possible outliers.
All four were poor milling samples, and although their measured densities were lower than the rest
of the validation set, they were still presented as fitting into the corresponding PCA models, therefore
they were not excluded as outliers.
The smaller model (using only spectra form germ-down scanned kernels) did not predict as well
as the larger model (kernels were scanned both sides). Using NIR spectroscopy in industry, samples
would be scanned from different orientations and a suitable prediction model would have to include
this variability. Therefore, the better prediction model for the larger sample set indicated industrial
application possibilities. It was, however, evident that a prediction model based on density
measurements, derived from X-ray µCT, had to incorporate as much variability as possible to
increase predictability.
1 2
Stellenbosch University https://scholar.sun.ac.za

114
Figure 6.7. Validation set predictions for EKD (g.cm-3) of the sample set scanned germ-down. Four samples
encircled were investigate as possible outliers.
Conclusion
This study demonstrated that EKD, as derived from X-ray µCT, could be predicted to a fair extent,
using the fast single-kernel microNIR spectrophotometer. As density measurements showed
relatively small differences between kernels, the prediction models could be improved by extending
the variability within the sample sets, thereby including the maximum number of hybrids and
scanning the kernels positioned in different orientations. X-ray µCT measured densities of individual
maize kernels, as used in the prediction models, were related to maize milling quality and
consequently expanded the functionality of the models. The predictive performance demonstrated
the ability to be a rough screening tool for breeding programmes.
References
Alcalà, M., Blanco, M., Moyano, D., Broad, N., O'Brien, N., Friedrich, D., Pfeifer, F. & Siesler, H.
(2014). Qualitative and quantitative pharmaceutical analysis with a novel handheld miniature
near-infrared spectrometer. Journal of Near Infrared Spectroscopy, 21, 445-457.
Armstrong, P. (2006). Rapid single-kernel NIR measurement of grain and oil-seed attributes. Applied
Engineering in Agriculture, 22, 767.
Armstrong, P.R. & Tallada, J.G. (2012). Prediction of kernel density of corn using single-kernel near
infrared spectroscopy. Applied Engineering in Agriculture, 28, 569-574.
1.15
1.2
1.25
1.3
1.35
1.15 1.2 1.25 1.3 1.35 1.4
Y p
red
icte
d (
EKD
) ge
rm-d
ow
n
Y measured (EKD) germ-down
R2V = 0.32
RMSEP = 0.03 g.cm-3
LVs = 3n = 91
Stellenbosch University https://scholar.sun.ac.za

115
Fox, G. & Manley, M. (2014). Applications of single kernel conventional and hyperspectral imaging
near infrared spectroscopy in cereals. Journal of the Science of Food and Agriculture, 94,
174-179.
Friedrich, D.M., Hulse, C.A., von Gunten, M., Williamson, E.P., Pederson, C.G. & O'Brien, N.A.
(2014). Miniature near-infrared spectrometer for point-of-use chemical analysis. In: SPIE
OPTO. Pp. 899203-899211.
Guelpa, A., Du Plessis, A., Kidd, M. & Manley, M. (2014). Non-destructive estimation of maize (Zea
mays L.) kernel hardness by means of an X-ray micro-computed tomography (µCT) density
calibration. Food and Bioprocess Technology. Submitted.
Gustin, J.L., Jackson, S., Williams, C., Patel, A., Armstrong, P.R., Peter, G.F. & Settles, A.M. (2013).
Analysis of maize (Zea mays) kernel density and volume using micro-computed tomography
and single-kernel near infrared spectroscopy. Journal of Agricultural and Food Chemistry,
61, 10872-10880.
Janni, J., Weinstock, B.A., Hagen, L. & Wright, S. (2008). Novel near-infrared sampling apparatus
for single kernel analysis of oil content in maize. Applied spectroscopy, 62, 423-426.
Jiang, H.Y., Zhu, Y.J., Wei, L.M., Dai, J.R., Song, T.M., Yan, Y.L. & Chen, S.J. (2007). Analysis of
protein, starch and oil content of single intact kernels by near infrared reflectance
spectroscopy (NIRS) in maize (Zea mays L.). Plant breeding, 126, 492-497.
Lee, K.M., Herrman, T.J., Rooney, L.W., Jackson, D.S., Lingenfelser, J., Rausch, K.D., McKinney,
J., Iiams, C., Byrum, L., Hurburgh, J.C.R., Johnson, L.A. & Fox, S.R. (2007). Corroborative
study on maize quality, dry-milling and wet-milling properties of selected maize hybrids.
Journal of Agricultural and Food Chemistry, 55, 10751-10763.
Macleod, H.A. (2010). Thin-film optical filters. Baco Raton, Florida, USA: CRC Press.
Manley, M. (2014). Near-infrared spectroscopy and hyperspectral imaging: non-destructive analysis
of biological materials. Chemical Society Reviews, 43, 8200-8214.
McClure, W.F. (2004). Review: 204 years of near infrared technology: 1800–2003. Journal of Near
Infrared Spectroscopy, 11, 487-518.
O'Brien, N.A., Hulse, C.A., Friedrich, D.M., Van Milligen, F.J., von Gunten, M.K., Pfeifer, F. & Siesler,
H.W. (2012). Miniature near-infrared (NIR) spectrometer engine for handheld applications.
In: Defense, Security, and Sensing SPIE. Pp. 837404-837408.Baltimore, Maryland, USA.
Osborne, B.G., Fearn, T. & Hindle, P.H. (1993). Practical NIR Spectroscopy with Applications in
Food and Beverage Analysis. Harlow, UK: Longman Scientific and Technical.
Spielbauer, G., Armstrong, P., Baier, J.W., Allen, W.B., Richardson, K., Shen, B. & Settles, A.M.
(2009). High-throughput near-infrared reflectance spectroscopy for predicting quantitative
and qualitative composition phenotypes of individual maize kernels. Cereal Chemistry, 86,
556-564.
Wang, W. & Paliwal, J. (2007). Near-infrared spectroscopy and imaging in food quality and safety.
Sensing and Instrumentation for Food Quality and Safety, 1, 193-207.
Stellenbosch University https://scholar.sun.ac.za

116
Watson, S.A. (1987). Structure and Composition. In: Corn Chemistry and Technology (edited by S.A.
Watson & P.E. Ramstad). Pp. 53-82. St. Paul, Minnesota, USA: American Association of
Cereal Chemists, Inc.
Williams, P.C. (1991). Prediction of wheat kernel texture in whole grains by near-infrared
transmittance. Cereal Chemistry, 68, 112-114.
Stellenbosch University https://scholar.sun.ac.za

117
Chapter 7
General discussion and conclusion
Maize (Zea mays L.) is, amongst others, cultivated for human consumption and is a staple food in
many countries. Dry-milling is used to process maize into maize meal and maize hardness
methods are being used to measure maize milling quality, due to a lack of milling quality methods.
This study intended to determine to what extent maize hardness and milling quality is related. For
this purpose, a sample set of maize from different hybrids, localities and plantings, was ranked
based on milling performance. An industrial guideline for assessing milling quality was used and
was referred to as the estimation of the chop percentage. During an unsupervised inspection of
seven conventional hardness methods by means of principal component analysis (PCA) score
plots and loadings, as well as Spearman’s rank correlation coefficients, it could be seen that all the
hardness methods were important with respect to describing maize milling quality. The
conventional methods that were used, were hectoliter mass (HLM), hundred kernel mass (HKM),
protein content, particle size index (PSI c/f), percentage vitreous endosperm (%VE) as determined
using near infrared (NIR) hyperspectral imaging (HSI) and NIR absorbance at 2230 nm (NIR @
2230 nm).
As endosperm is the main constituent of a maize kernel (Watson, 1987), this study investigated
the fundamental textural properties thereof. Digital images, scanning electron microscopy (SEM)
micrographs and X-ray µCT images revealed that the morphology of the two endosperm types i.e.
vitreous and floury, both present in a maize kernel, presented density and volume differences. The
vitreous endosperm appeared much denser than the floury endosperm, due to a thicker protein
network that compacts the starch granules, whereas the floury endosperm revealed loosely
packed granules with intracellular air spaces present, as the protein network was mostly absent. It
was also seen that the proportion in which the endosperm types was present, differed between
individual kernels. Cavities or relatively large air spaces were also observed and considered as a
possible influence on milling quality.
The choice of analytical methods, use for investigating maize endosperm texture, was based
on the success of former studies to discriminate between hardness properties, and the availability
of new technologies that seemed viable. The Rapid Visco Analyser (RVA) would not typically be
used to describe hardness differences in maize, but as this grain consists of mainly starch, the
functionality of the RVA to capture pasting properties seemed just as useful to capturing milling
quality differences. In this study, the RVA viscograms were subjected to partial least squares
(PLS) regression model building and showed to be able to predict hardness properties, without
being influenced by different profiles.
Furthermore, it was apparent that X-ray µCT would be able to characterise the differences
(density and volume) related to maize endosperm, due to the advanced technology associated
Stellenbosch University https://scholar.sun.ac.za

118
with this method. Micro-computed tomography detects density differences as it identifies
attenuation changes with X-rays passing through a material (Chawanji et al., 2012). Individual
maize kernels could be segmented, non-destructively, into desired regions-of-interest (ROIs), i.e.
vitreous endosperm, floury endosperm and cavities. Depending on the resolution of the images,
textural properties such as porosity (intra-cellular air spaces) could also be detected. Using X-ray
µCT, a density calibration was constructed that facilitated density calculations of the respective
ROIs, as well as that of the entire kernels. Quantification of the ROIs and porosity (when imaged
at high resolution) was also achieved. Formerly, quantification of the different endosperm types
was only possible using hand-dissection (Erasmus, 2003), or more recently, using NIR HSI
(McGoverin & Manley, 2012).
This study demonstrated the versatility of X-ray µCT as it was possible to acquire very high
resolution images (3 µm) containing detailed information of single kernels or sub sections thereof,
or imaging multiple kernels (150) simultaneously, achieving a lower resolution (80 µm), but still
adequate for density and volume analysis. The usefulness of X-ray µCT was also illustrated by the
ability to exclude ROIs that would ensure more accurate measurements. This was demonstrated
with the removal of the cavities when calculating entire kernel density. Conventional hardness
methods measuring density, such as the floating test, overlook the importance of this feature and
misleading results are obtained.
Discrimination between hard and soft maize hybrids were achieved based on all three X-ray
µCT derived entire kernel densities (EKD), vitreous endosperm densities (VED), floury endosperm
densities (FED), as well as the percentage porosity quantified within each kernel. Receiver
operator characteristic (ROC) curves contributed threshold values that were used to establish
classification accuracies.
Milling quality classification of maize hybrids was also accomplished, using X-ray CT derived
densities (EKD, VED, FED) and volumes (entire kernel volume (EKV), vitreous endosperm volume
(VEV), floury endosperm volume (FEV) and the vitreous-to-floury endosperm ratio (V:F)). The best
classifications were possible when using EKD and V:F.
In order to interpret the relationship of the X-ray µCT derived measurements with respect to
conventional hardness methods (PSI, HLM, HKM, NIR HSI and protein content), PCA bi-plots and
Spearman’s rank correlation coefficients were examined. These statistical data analysis methods
indicated that milling quality could not be described without including density measurements. This
was a very important finding as it indicated that density properties were the discriminatory factor
with respect to maize hardness and maize milling quality.
Lastly, an attempt was made to combine the X-ray µCT derived EKD measurements with fast
and simple NIR spectroscopy by building a prediction model, from spectra acquired using a
miniature hand-held microNIR instrument. Due to not enough variation in the sample set, the PLS
model was only good enough to be used as a rough screening method in industry. It was,
however, established that the prediction model was better when it included spectra from kernels
Stellenbosch University https://scholar.sun.ac.za

119
scanned both sides, i.e. germ-up and germ-down. This confirmed that a model with maximum
variability would improve the prediction capability.
The findings from this study imply that milling quality can only be partially assessed using
conventional hardness methods. For a true reflection of maize kernel milling quality, a kernel’s
density needs to be measured, after the exclusion of the cavities present. X-ray µCT is a
technology capable of such manipulations due to the 3-D nature of the captured data. The
applicability of the findings resolves around the ability to incorporate the milling quality
measurements (as obtained by X-ray µCT) into functional NIR spectroscopy calibrations. The
inclusion of maximum variability in the data sets, as well as using suitable chemometrical tools, will
ensure optimal milling quality prediction models that can be purposefully applied in the industry.
References
Chawanji, A.S., Baldwin, A.J., Brisson, G. & Webster, E. (2012). Use of X-ray micro tomography to
study the microstructure of loose-packed and compacted milk powders. Journal of
Microscopy, 248, 49-57.
Erasmus, C. (2003). Maize kernel translucency measurement by image analysis and its
relationship to vitreousness and dry milling performance. PhD Thesis. University of
Pretoria, Pretoria, South Africa.
McGoverin, C. & Manley, M. (2012). Classification of maize kernel hardness using near infrared
hyperspectral imaging. Journal of Near Infrared Spectroscopy, 20, 529-535.
Watson, S.A. (1987). Structure and Composition. In: Corn Chemistry and Technology (edited by
S.A. Watson & P.E. Ramstad). Pp. 53-82. St. Paul, Minnesota, USA: American Association
of Cereal Chemists, Inc.
Stellenbosch University https://scholar.sun.ac.za