The AGL62 MADS domain protein regulates cellularization during endosperm development in Arabidopsis
Plant Biotechnology Journal
(2008)
6
, pp. 855–869 doi: 10.1111/j.1467-7652.2008.00368.x
© 2008 The AuthorsJournal compilation © 2008 Blackwell Publishing Ltd
855
Blackwell Publishing LtdOxford, UKPBIPlant Biotechnology Journal1467-76441467-7652© 2008 Blackwell Publishing LtdXXXOriginal Article
Maize endosperm development and starch filling
Jean Louis Prioul
et al.
A joint transcriptomic, proteomic and metabolic analysis of maize endosperm development and starch filling
Jean Louis Prioul
1,2,
*, Valérie Méchin
3,4
, Philippe Lessard
5
, Claudine Thévenot
1,2
, Mike Grimmer
6,
†, Sophie Chateau-Joubert
1,2
, Steve Coates
7
, Hans Hartings
8
, Monica Kloiber-Maitz
9
, Alain Murigneux
5
, Xavier Sarda
10,
‡, Catherine Damerval
4
and Keith J. Edwards
6
1
Université Paris-Sud, Institut de Biotechnologie des Plantes, Bât. 630, F-91405 Orsay, France
2
CNRS, UMR 8618, CNRS, F-91405 Orsay, France
3
UMR 206 Chimie Biologique, INRA, AgroParisTech, F-78850 Thiverval Grignon, France
4
UMR 8120, INRA, Université Paris Sud, CNRS, AgroParisTech, F-91190 Gif sur Yvette, France
5
Biogemma, 8, Rue des Frères Lumière, F-63028 Clermont-Ferrand Cedex 2, France
6
School of Biological Sciences, University of Bristol, Woodland Road, Bristol, BS8 1UG, UK
7
Advanced Technologies (Cambridge) Ltd., 210 Cambridge Science Park, Milton Road, Cambridge, CB4 0WA, UK
8
Consiglio per la Ricerca e la Sperimentazione in Agricoltura, Unità di Maiscoltura, Via Stezzano 24, 24126 Bergamo, Italy
9
KWS SAAT AG, Grimsehlstr. 31, D-37574 Einbeck, Germany
10
RhoBio Génomique Evry, 2 Rue Gaston Crémieux, F-91057 Evry, France
Summary
The maize endosperm transcriptome was investigated through cDNA libraries developed at
three characteristic stages: (i) lag phase [10 days after pollination (DAP)]; (ii) beginning of
storage (14 DAP); and (iii) maximum starch accumulation rate (21 DAP). Expressed
sequence tags for 711, 757 and 384 relevant clones, respectively, were obtained and
checked manually. The proportion of sequences with no clear function decreased from
35% to 20%, and a large increase in storage protein sequences (i.e. 5% to 38%) was
observed from stages (i) to (iii). The remaining major categories included metabolism
(11%–13%), transcription–RNA processing–protein synthesis (13%–20%), protein
destination (5%–9%), cellular communication (3%–9%) and cell rescue–defence (4%).
Good agreement was generally found between category rank in the 10-DAP transcriptome
and the recently reported 14-DAP proteome, except that kinases and proteins for RNA
processing were not detected in the latter. In the metabolism category, the respiratory
pathway transcripts represented the largest proportion (25%–37%), and showed a shift in
favour of glycolysis at 21 DAP. At this stage, amino acid metabolism increased to 17%,
whereas starch metabolism surprisingly decreased to 7%. A second experiment focused on
carbohydrate metabolism by comparing gene expression at three levels (transcripts, proteins
and enzyme activities) in relation to substrate or product from 10 to 40 DAP. Here,
two distinct patterns were observed: invertases and hexoses were predominant at the
beginning, whereas enzyme patterns in the starch pathway, at the three levels, anticipated
and paralleled starch accumulation, suggesting that, in most cases, transcriptional control
is responsible for the regulation of starch biosynthesis.
Received 7 April 2008;
revised 20 June 2008;
accepted 24 June 2008.
*
Correspondence
(fax 33 (0)1 69 15 34 24;
e-mail [email protected])
†
Present address
: ADAS Boxworth,
Battlegate Rd, Boxworth, Cambridge,
CB23 4NN, UK
‡
Present address
: Afssa, 10 rue Pierre Curie,
F-94704 Maisons-Alfort, France
Keywords:
carbohydrate metabolism,
coordinated development, expression
profiling, maize endosperm, starch
metabolism.
Introduction
The economic and nutritional value of the maize kernel is
derived mostly from the endosperm, a starch-rich tissue that
supports the embryo during germination. Thus, optimum
kernel filling is one of the most highly regarded traits in maize
breeding. Classical breeding approaches aimed at improving
the quality and quantity of stored carbohydrates and proteins
are currently complemented by the use of molecular markers
and genomics, which promise to provide new and more

856
Jean Louis Prioul
et al.
© 2008 The AuthorsJournal compilation © 2008 Blackwell Publishing Ltd,
Plant Biotechnology Journal
,
6
, 855–869
efficient selection criteria. Quantitative trait locus approaches
allow the identification of small genomic segments that
account for the variation in quantitative traits. However, the
identification of the candidate genes at the critical loci has so
far limited this approach, for example as discussed in the
context of starch metabolism (Prioul
et
al
., 1999), and a know-
ledge of the interconnection of metabolic and developmental
processes is lacking.
Cereal kernel development has been analysed thoroughly
from cytological (Olsen, 2001), genetic and epigenetic
(Chaudhury
et
al
., 2001) points of view. Development can be
divided into three partially overlapping stages: (i) the ‘lag
phase’, occurring from fertilization to 12 days after pollination
(DAP) and consisting of three substages (coenocytic,
cellularization and differentiation) that result in rapid
expansion of the endosperm; (ii) the ‘kernel filling’ stage,
ranging from 12 to 40 DAP and corresponding to the conver-
sion of imported sucrose and amino acids into starch and
storage proteins which accumulate in the endosperm; and
(iii) the ‘desiccation–maturation stage’, occurring from 40 to
70 DAP and leading to the mature kernel. The metabolic
steps from sucrose import to the synthesis of amylose and
amylopectin, the starch granule components, are well
established, especially in the maize kernel, where a collection
of mutants affecting filling have enabled the determination
of all of the key steps (Schultz and Juvik, 2004). However,
the interrelationships with developmental and energetic
processes remain to be clarified. High-throughput genomic
and post-genomic approaches are now providing new tools
for a better understanding of the genetic and biochemical
networks operating during kernel development. The first
full-length cDNA libraries of maize endosperm (Lai
et
al
., 2004)
were constructed from early and middle mature stages (4–6
and 7–23 DAP), leading to the creation of a 5504 unigene set
comprising 2911 cDNAs with an assigned function. However,
the earliest microarray profiling on maize endosperm dealt
with a comparison of RNA expression in the endosperm vs.
immature ear or other organs (Cho
et
al
., 2002; Fernandes
et
al
., 2002). The same slide comprising 5000 expressed
sequence tag (ESTs) was also used to analyse the effect of
water deficit at 9 DAP (Yu and Setter, 2003). Lee
et
al
. (2002),
comparing 900 metabolism-targeted cDNAs during kernel
development from 5 to 10 DAP and embryo development
from 10 to 45 DAP, established coordinated gene expression
in the tricarboxylic acid (TCA) cycle and glycolysis, which showed
a large decrease after 20 DAP, and in fatty acid biosynthesis.
Similar developmental studies performed in barley grain on
1421 cDNAs showed a strong relationship between the
accumulation of storage product and the transcript level of
respiratory metabolism genes (Sreenivasulu
et
al
., 2004). On a
larger scale, Zhu
et
al
. (2003), starting from 21 000 rice cDNAs,
focused on 491 genes belonging to three major pathways of
nutrient partitioning, and identified 269 genes preferentially
expressed during grain filling (0–21 DAP). Proteomics has
also been used successfully to characterize gene product
accumulation in grain from rice (Koller
et
al
., 2002), barley
(Finnie
et
al
., 2002; Ostergaard
et
al
., 2004), wheat (Vensel
et
al
., 2005) and, within the European Union (EU)–Zeastar
programme, maize (Méchin
et
al
., 2004, 2007).
Although metabolic pathways for starch and storage
proteins during the accumulation period have been analysed
thoroughly in a number of papers, the developmental aspects,
especially at the transcript level, are less well documented
and are limited to a few enzymes or proteins (Ober
et
al
.,
1991; Carlson
et
al
., 2002). Changes in the flux pattern of
central carbohydrate metabolism were analysed during
kernel development, considering the kernel as a single
compartment (Ettenhuber
et
al
., 2005), but it is known that
starch accumulation is polarized from distal layers to the base
of the kernel (Brangeon
et
al
., 1997). The relationship between
enzyme activity and the corresponding mRNA and protein
enzyme content has been examined for some key enzymes, such
as adenosine diphosphate (ADP)-glucose pyrophosphorylase
(AGPase) (Prioul
et
al
., 1994) and pyruvate orthophosphate
dikinase (PPDK) (Chastain
et
al
., 2006), but, to our knowledge,
no comparison of the developmental expression of the
endosperm storage pathways has been made encompassing
biochemistry to proteomic and transcriptomic measurements.
Taking advantage of the earlier work of Méchin
et
al
. (2004,
2007) on the endosperm proteome, the aim of this article is
to link gene expression, enzyme content, enzymatic activities
and some key enzyme localizations to metabolite variations,
and to provide an overview of the regulation of carbohydrate
metabolism during endosperm development in relation to
general kernel metabolism.
Results
Changes in transcript profiling during development
An analysis of the functional distribution of endosperm cDNAs
was performed for three kernel libraries of the F-2 genotype
obtained at 10, 14 and 21 DAP. From the 1849 sequences
analysed, 711 were obtained at 10 DAP, 757 at 14 DAP and
381 at 21 DAP. Each of the automated annotations was
checked in order to verify the naming consistency and to
ensure that the same classification of functional categories
was used as for the proteomic data (Méchin
et
al
., 2007).

Maize endosperm development and starch filling
857
© 2008 The AuthorsJournal compilation © 2008 Blackwell Publishing Ltd,
Plant Biotechnology Journal
,
6
, 855–869
The most striking variation in transcript abundance was
observed for storage protein transcripts, which changed
from 5% at 10 DAP to 32% and 38% at 14 and 21 DAP,
respectively (Figure S1, see ‘Supporting information’). Excluding
storage protein transcripts and so-called function not yet
clearly identified (NYC) and non-identified (NI) transcripts
(35% to 20%, from 10 to 21 DAP), the largest individual
category was metabolism, with the relative proportion of
transcripts increasing from 21% to 28% during development
(Figure 1). The protein synthesis (including RNA processing)
and transcriptional function categories together constituted
a major group, the abundance of which remained approxi-
mately constant at about one-third of the total (32%, 27%
and 29% of transcripts for 10, 14 and 21 DAP, respectively).
The protein destination category (12%–14% of transcripts)
mainly consisted of degradation proteins associated with the
ubiquitin–proteasome complex, which represented 53%
of the transcripts in this category at 14 DAP. The cellular
communication/signal transduction-related transcripts were
at 15%–16% at 10 and 14 DAP, and later dropped to 7%, but
this variation hid a large increase in the proportion of kinases,
from 18% at 10 DAP to 34% and 42% at 14 and 21 DAP,
respectively (Table S1, see ‘Supporting information’). Cell
rescue–defence/cell death and ageing represented a
significant but almost constant category, amounting to 6%–
9%, with transcripts commonly involved either in defence or
detoxification reactions. The distribution of the most numerous
categories was highly significantly different between the
three stages (
χ
2
= 163.3, d.f. = 21,
P
< 0.001). The largest
divergence occurred between the 10-DAP and 21-DAP
stages (main functional categories were protein synthesis
and cellular communication at 10 DAP vs. metabolism and
protein destination at 21 DAP), whereas the 14-DAP stage
was intermediate, with a high proportion of metabolism and
cellular communication categories.
The distribution of metabolism transcripts showed significant
variation over the time course considered (
χ
2
= 34.5, d.f. = 21,
P
< 0.05). The energetic metabolism obtained by summing
together glycolysis, the TCA cycle, C4 photosynthesis
(C4P) (PPDK), the hexose monophosphate (HMP) pathway,
fermentation and energy accounted for 32%, 25% and 37%
at 10, 14 and 21 DAP, respectively (Figure 2); TCA cycle and
fermentation transcripts were not detected at 21 DAP. The
amino acid metabolism category increased from 11% at
10 DAP to 16%–17% at 14 and 21 DAP. C4P transcripts
appeared at 21 DAP, all belonging to the same enzyme:
PPDK. Starch metabolism transcripts tended to decrease
at 21 DAP, but the cumulative proportion of both starch
and carbohydrate metabolism was approximately constant,
accounting for 21%, 15% and 23% at 10, 14 and 21 DAP,
respectively. The nucleotide metabolism transcripts decreased
slightly over the time course, but their proportion was always
higher than 10%. Secondary metabolism compounds were
also well represented, and showed large variations from a
12% minimum to a 23% peak at 14 DAP.
Carbohydrate and respiratory metabolism
As starch is valuable and forms the largest component of the
mature endosperm, the genes related to carbohydrate
metabolism were examined in more detail. Starch and soluble
carbohydrate metabolism transcripts represented 15%–23%
of the sequenced transcripts (Figure 2) and 15% of the
processed proteins (Figure 2, inset), whereas the proportions
of respiration–energy metabolism transcripts and proteins were
25%–39% and 47%, respectively. Placing the transcriptomic
and proteomic information on a metabolic scheme for
carbohydrate and respiration (Figure 3) showed that 41 of
the 55 enzymes involved were detected either as transcripts
(33) or proteins (34), or both (26). Time courses of transcript
and protein were in agreement, and transcript levels increased
in anticipation of protein abundance. Enzymes of the two
respiratory pathways (i.e. glycolysis + TCA cycle and HMP
pathways) were represented. For carbohydrate metabolism,
all the enzymes of the starch pathway, from sucrose cleavage
to amylose and amylopectin synthesis, were found. The cell
wall metabolism enzymes uridine diphosphate (UDP)-glucose
dehydrogenase and UDP-glucosyl transferase were also
present. Sucrose-phosphate synthase was detected as a
transcript at an early stage (10 DAP). This expression may be
related to invertase, which is active at this stage in all three
forms: cell wall, vacuolar and cytosolic (see below). This
probably indicates a re-synthesis of sucrose to provide a
substrate for sucrose synthase (Susy), which is a mandatory
step in starch and cellulose synthesis. Similarly, HMP enzymes,
such as phosphogluconate dehydrogenase and transketolase,
were detected at an early stage, which is consistent with the
involvement of this pathway in the synthesis of the nucleic
acid components necessary for cell development. By contrast,
the presence of transcripts for glycolysis extended to 14 and
21 DAP, whereas TCA enzyme transcripts were notably
absent at 21 DAP, concurrent with the decreasing trend
noted at the protein level. This raises the question of the
origin of adenosine triphosphate (ATP) needed for starch and
storage protein accumulation, and may be related to the hypoxic
conditions in the endosperm at this stage, as discussed later.
PPDK (C4P metabolism) was detected in the proteome data
at 14 DAP, but only at 21 DAP in the transcript data, a result

858
Jean Louis Prioul
et al.
© 2008 The A
uthorsJournal com
pilation © 2008 Blackw
ell Publishing Ltd,
Plant Biotechnology Journal
,
6
, 855–869 Figure 1 Distribution into functional categories of endosperm transcripts from maize sampled at 10, 14 and 21 days after pollination (DAP). Non-identified (NI), not yet clearly identified (NYC) and storage protein
transcripts were omitted (see Figure S1 and Table S1 for the complete set of transcripts). Inset: proteome distribution in the same categories at 14 DAP (from Méchin et al., 2007).

Maize endosperm
development and starch filling
859
© 2008 The A
uthorsJournal com
pilation © 2008 Blackw
ell Publishing Ltd,
Plant Biotechnology Journal
,
6
, 855–869
Figure 2 Distribution into functional subcategories of metabolism-related transcripts from maize endosperm sampled at 10, 14 and 21 days after pollination (DAP). Inset: proteome distribution in the same subcategories at 14 DAP (data from Méchin et al., 2007). C4p, C4 photosynthesis; HMP, hexose monophosphate; TCA, tricarboxylic acid.

860
Jean Louis Prioul
et al.
© 2008 The AuthorsJournal compilation © 2008 Blackwell Publishing Ltd,
Plant Biotechnology Journal
,
6
, 855–869
that may reflect low transcript abundance. PPDK reversibly
converts pyruvate and ATP into phosphoenolpyruvate and
pyrophosphate. This typical enzyme of the C4 cycle in leaves
has been reported in cereal grains for a long time (Aoyagi and
Bassham, 1984).
Starch metabolism: compared expression at the
transcriptomic, proteomic and enzyme activity levels
The activity of starch metabolic enzymes was measured at 10,
14, 21, 30 and 40 DAP in parallel with the changes in the
g6P
Figure 3 Time course of transcript and protein at 10, 14 and 21 days after pollination (DAP) for the respiration and starch metabolism pathways. T, transcript data: black/white squares, presence/absence of transcript in the cDNA libraries; black to grey squares, amount of transcripts by quantitative polymerase chain reaction (Q-PCR). P, proteomic data from two-dimensional gels: green, black and red squares, low, medium and high protein quantities, respectively; black square, proteins identified at 14 DAP but not reliable for quantification. 1cw, cell wall invertase Incw2; 1n, neutral invertase; 2, sucrose synthase; 3, hexokinase; 4, glucose-6-phosphate isomerase; 5, UDP-glucose pyrophosphorylase; 6, UDP-glucose dehydrogenase; 7 and 7′, phosphoglucomutase; 8 and 8′, AGPase; 9 and 9′, granule-bound starch synthase II-1 (GBSSII-1); 10, starch branching enzyme (SBE); 11, isoamylase; 12, pullulanase; 13, sucrose phosphate synthase; 14, sucrose phosphatase; 15, fructose-1,6-bisphosphatase; 16, fructokinase-II; 16′, diphosphate-fructose-6-phosphate-1-phosphotransferase; 17, fructose bisphosphate aldolase; 18, triosephosphate isomerase; 19, phosphoglycerate dehydrogenase; 20, phosphoglycerate kinase-3; 21, phosphoglycerate mutase (bis); 22, phosphoglycerate mutase; 23, enolase; 24, pyruvate kinase; 25, pyruvate orthophosphate dikinase; 26 A, pyruvate dehydrogenase; 26 B, dihydrolipoamide S-acetyltransferase; 27, acetyl-CoA carboxylase; 28, phosphoenolpyruvate carboxylase; 29, citrate synthase; 30, aconitate hydratase = citrate hydrolyase; 31, isocitrate dehydrogenase; 31′, NADP-specific isocitrate dehydrogenase; 32, oxoglutarate dehydrogenase; 33, dihydrolipoamide dehydrogenase precursor; 34, dihydrolipoamide S-succinyltransferase; 35, succinyl-CoA ligase (synthetase); 36, succinate dehydrogenase; 37, fumarase; 38, malate dehydrogenase; 39, glucose-6-phosphate 1-dehydrogenase; 40, phosphogluconate dehydrogenase-6; 41, ribose-5-phosphate epimerase; 42, ribulose phosphate 3-epimerase; 43, transketolase; 44, transaldolase; 45, starch phosphorylase; 46, endo-1,4-β-glucanase; 47, pyruvate decarboxylase; 48, alcohol dehydrogenase; A, adenylate translocator; B, glucose-6-phosphate translocator; OAA, oxaloacetate.

Maize endosperm development and starch filling
861
© 2008 The AuthorsJournal compilation © 2008 Blackwell Publishing Ltd,
Plant Biotechnology Journal
,
6
, 855–869
substrate or product concentrations. Data covering protein
accumulation over the same period of time are available from
Méchin
et
al
. (2007). Proteins were identified on 14-DAP
two-dimensional gels and quantified at the other stages by
comparison with the 14-DAP stage, which corresponds to
the end of the lag phase and the start of starch accumulation.
Therefore, some enzymes accumulating poorly at 14 DAP
[such as granule-bound starch synthase (GBSS) and debranch-
ing enzyme (DBE)] are missing from the quantitative proteomic
data set. In addition, some enzyme monomers that have high
relative molecular mass (
M
r
) and/or basic isoelectric point (pI),
which are poorly resolved, were excluded from the quantifi-
cation. Quantitative reverse transcriptase-polymerase chain
reaction (RT-PCR) was used to assess gene expression.
Two main patterns were observed (Figure 4). Firstly, the
three invertase activities (cell wall, cytosolic and vacuolar)
reached a maximum at 21 DAP, declining thereafter. The
concentrations of their substrate (sucrose) and products
(glucose and fructose) varied accordingly. Secondly, all the
enzymes of the starch pathway had low or undetectable
activity before 14 DAP. Activity progressively increased to
reach a maximum at 30 DAP and then declined. This time
course is consistent with the starch and amylose accumulation
rates, which reached a maximum at 30 DAP and declined
thereafter. Similarly, ADP-glucose, the AGPase substrate,
had a concentration which varied with the enzyme activity.
Glucose-6-phosphate and fructose-6-phosphate, the main
primary substrates of glycolysis, declined after 21 DAP, which
is in agreement with the relative decrease observed at the
proteome level for glycolytic enzymes during the late grain-
filling period (Méchin
et
al
., 2007). The relatively constant
level of UDP-glucose may be the result of two biosynthetic
pathways occurring successively: from glucose-6-phosphate
or fructose-6-phosphate through the sequential action
of three enzymes, namely phospho-glucose isomerase,
phosphoglucomutase and UDP-glucose pyrophosphorylase,
during the first 20 DAP, and through Susy during the starch
accumulation period. The high glucose-6-phosphate/fructose-
6-phosphate ratio during the early phase is indicative of a
phospho-glucose-fructose isomerase functioning near its
thermodynamic equilibrium. The difference in the time course
for amylose and starch suggests an imbalance in the amylose/
amylopectin ratio during development.
Time courses for transcript accumulation generally showed
parallel variations to the corresponding enzyme activity, and
two main types of profile were discernible. When several
transcripts could be quantified for a given enzyme, they
exhibited similar [Susy, AGPase, starch branching enzyme
(SBE)] or slightly different [soluble starch synthase (SSS)] time
courses, but one transcript was always predominant over the
others. In most cases, the maximum transcript levels were
reached earlier than enzyme activity or protein accumulation.
Few data were available for protein accumulation, but here
again the time course was consistent with the activity pattern.
In situ
localization of carbohydrate and starch
metabolism enzymes
Enzyme activities were directly located on tissue sections
from frozen kernel samples using enzyme-specific substrates
and optimum pH, i.e. ADP-glucose and pyrophosphate for
AGPase, UDP and sucrose at neutral pH for Susy, and sucrose
at acid pH for acid invertases. As both cell wall and vacuolar
invertases have an acidic optimum pH, they could only be
distinguished on thin sections after resin embedding. With
such preparations, most of the labelling occurred in the basal
endosperm tissue layer up to 21 DAP and earlier in the
pericarp, but, as some background labelling was also observed
in the control endosperm and vascular tissue (data not shown),
localization was checked using specific cell wall invertase
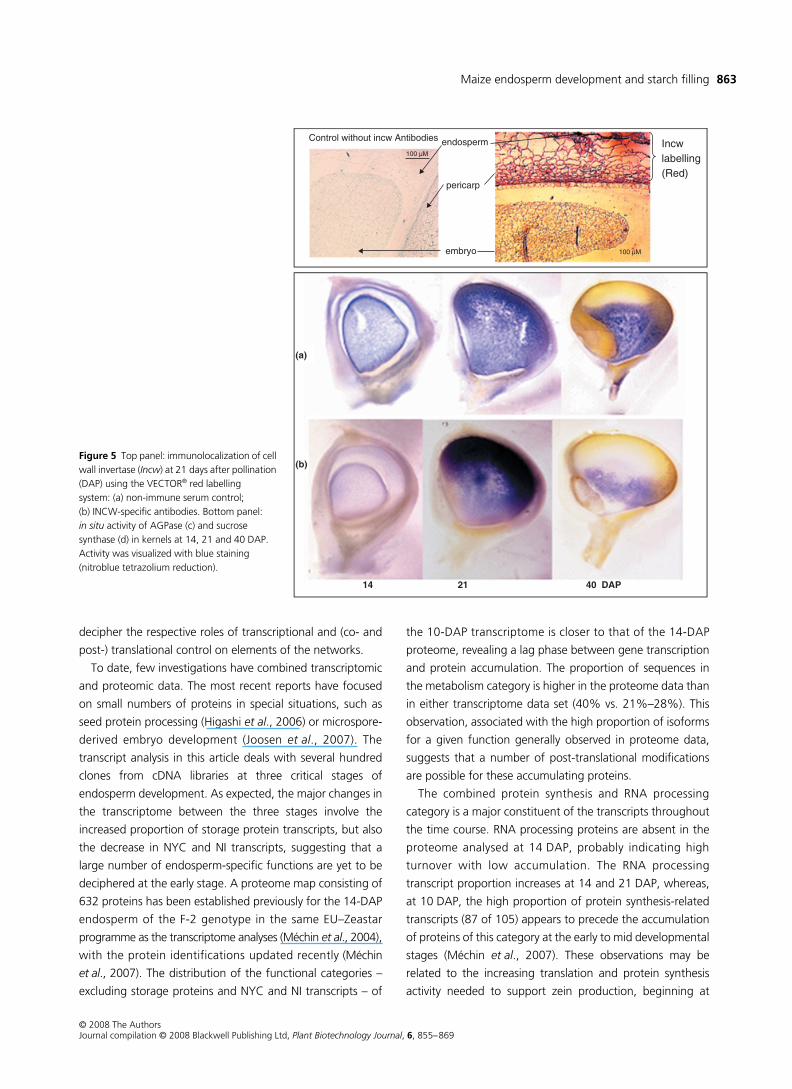
antibodies (Figure 5, top panel).
The tissue localization of AGPase (Figure 5c) and Susy
(Figure 5d) activity showed large developmental changes:
labelling was mainly located in the maternal tissues, in the
nucellus and then in the pericarp up to 14 DAP. Afterwards,
it increased massively, firstly in the outer endosperm (21 DAP)
and secondly in the basal zone (40 DAP). This polarization of
activity is consistent with the well-established progression of
starch accumulation in the kernel, which is also shown by the
yellow colour of the endosperm in cross-sections representing
flint regions (Figure 5). Starch accumulates from the distal
part of the endosperm towards the basal zone where sucrose
enters from maternal tissues. Thus, the localization of the
activity marked the active starch-synthesizing zones. The highly
similar pictures for AGPase and Susy are fully consistent
with the cooperative contribution of both enzymes to starch
synthesis.
Discussion
Transcriptome and proteome
Large-scale analyses of gene expression can provide information
on the regulation of gene networks underlying metabolic
and cellular processes. Transcript abundance primarily
reflects the transcriptional control of gene expression and has
been shown in many instances to be poorly related to protein
abundance (Gygi et al., 1999; Watson et al., 2003). Proteins

862 Jean Louis Prioul et al.
© 2008 The AuthorsJournal compilation © 2008 Blackwell Publishing Ltd, Plant Biotechnology Journal, 6, 855–869
are the actual cellular effectors. Their abundance depends on
the balance between translation and degradation which, in
turn, can be influenced by various co- and post-translational
processes. Comparison of the distribution of transcripts and
proteins in the different functional categories at a given
developmental stage can shed light on the relative importance
of these processes. Integration of the temporal dimension
may help to reveal sets of co-regulated gene products and to
Figure 4 Comparison of the time course of transcriptomic and proteomic data with the corresponding biochemical products and activity of the enzymes of the starch pathway from 10 to 40 days after pollination (DAP). Sucrose, glucose, hexoses, phosphorylated sugars, nucleotide sugars and starch concentration were expressed as milligrams per gram of endosperm fresh weight. Amylose was expressed as a percentage of starch; starch was expressed as a percentage of fresh weight. Enzyme activities were expressed as nanomoles per second per gram of product per endosperm fresh weight, except for granule-bound starch synthase (GBSS) and soluble starch synthase (SSS), analysed by zymograms. Protein quantification was performed by image analysis of two-dimensional gels, and was expressed in arbitrary units (Méchin et al., 2007). The star and the arrow indicate the approximate position of the endosperm-specific Sh2 subunit of AGPase. The mRNA content analysed by reverse transcriptase-polymerase chain reaction (RT-PCR) was expressed as a percentage of total RNA.
Maize endosperm development and starch filling 863
© 2008 The AuthorsJournal compilation © 2008 Blackwell Publishing Ltd, Plant Biotechnology Journal, 6, 855–869
decipher the respective roles of transcriptional and (co- and
post-) translational control on elements of the networks.
To date, few investigations have combined transcriptomic
and proteomic data. The most recent reports have focused
on small numbers of proteins in special situations, such as
seed protein processing (Higashi et al., 2006) or microspore-
derived embryo development (Joosen et al., 2007). The
transcript analysis in this article deals with several hundred
clones from cDNA libraries at three critical stages of
endosperm development. As expected, the major changes in
the transcriptome between the three stages involve the
increased proportion of storage protein transcripts, but also
the decrease in NYC and NI transcripts, suggesting that a
large number of endosperm-specific functions are yet to be
deciphered at the early stage. A proteome map consisting of
632 proteins has been established previously for the 14-DAP
endosperm of the F-2 genotype in the same EU–Zeastar
programme as the transcriptome analyses (Méchin et al., 2004),
with the protein identifications updated recently (Méchin
et al., 2007). The distribution of the functional categories –
excluding storage proteins and NYC and NI transcripts – of
the 10-DAP transcriptome is closer to that of the 14-DAP
proteome, revealing a lag phase between gene transcription
and protein accumulation. The proportion of sequences in
the metabolism category is higher in the proteome data than
in either transcriptome data set (40% vs. 21%–28%). This
observation, associated with the high proportion of isoforms
for a given function generally observed in proteome data,
suggests that a number of post-translational modifications
are possible for these accumulating proteins.
The combined protein synthesis and RNA processing
category is a major constituent of the transcripts throughout
the time course. RNA processing proteins are absent in the
proteome analysed at 14 DAP, probably indicating high
turnover with low accumulation. The RNA processing
transcript proportion increases at 14 and 21 DAP, whereas,
at 10 DAP, the high proportion of protein synthesis-related
transcripts (87 of 105) appears to precede the accumulation
of proteins of this category at the early to mid developmental
stages (Méchin et al., 2007). These observations may be
related to the increasing translation and protein synthesis
activity needed to support zein production, beginning at
Figure 5 Top panel: immunolocalization of cell wall invertase (Incw) at 21 days after pollination (DAP) using the VECTOR® red labelling system: (a) non-immune serum control; (b) INCW-specific antibodies. Bottom panel: in situ activity of AGPase (c) and sucrose synthase (d) in kernels at 14, 21 and 40 DAP. Activity was visualized with blue staining (nitroblue tetrazolium reduction).

864 Jean Louis Prioul et al.
© 2008 The AuthorsJournal compilation © 2008 Blackwell Publishing Ltd, Plant Biotechnology Journal, 6, 855–869
about 14 DAP (Méchin et al., 2007). The protein destination
category is also a major category over the time course,
with the proportion of transcripts devoted to degradation
increasing up to 14 DAP and decreasing afterwards (44%,
53% and 33%, respectively). This trend appears to be con-
sistent with the maximum accumulation of proteins involved
in degradation processes at the early stages (Méchin et al.,
2007). The relatively high proportion of expressed genes
devoted to degradation over the time course is indicative of
important protein turnover during endosperm development,
with a maximum at 14 DAP. Although it is not surprising to
see this transition from the lag phase to the accumulation
phase when the set of enzymes must be renewed to enable
new functions, it is less expected during the phase in which
the starch accumulation rate is constant. Of the transcripts
coding for protein-folding genes, another subcategory of
protein destination, it is tempting to associate the progressive
and large accumulation of one specific protein, disulphide
isomerase (gene index identification for protein: 1709619),
up to 30 DAP with folding of the most abundant protein, i.e.
zein. Transcription-related transcripts are the most abundant
at 21 DAP, which may be related to the preparation of the
maturation phase, which progresses after 30 DAP. Transcripts
for defence (antifungal and antimicrobial proteins, etc.) and
detoxification enzymes against reactive oxygen species (ROS)
and xenobiotics are always present, and the abundance
of proteins identified in this category at 14 DAP reaches a
maximum during the earliest stages and diminishes after-
wards. The presence of an anti-ROS protein at this early
stage can be explained by the large oxygen availability, as
opposed to the hypoxic situation which prevails after 14 DAP
(Rolletschek et al., 2005; Méchin et al., 2007). However,
superoxide dismutase (SOD) transcripts have been reported
at 28 DAP, and their expression is enhanced by xenobiotics
(Mylona et al., 2007). It has been suggested that this expres-
sion may be related to seed maturation. This would be
consistent with the presence of metallothioneins and
glutathione S-transferase transcripts at 21 DAP, which are
also associated with this process (Table S1, see ‘Supporting
information’). The communication/signal transduction func-
tional category is represented more by transcripts (12%–15%)
than by proteins (approximately 1%) at 14 DAP. A probable
explanation is that these transcripts, which mostly code for
kinases and transduction chain elements, are not detected on
two-dimensional gels because of their low abundance.
We investigated the metabolism category in more detail
in order to examine the relationships between energy
metabolism and storage compound synthesis. The decrease in
TCA cycle and mitochondrial transcripts to their disappearance
at 21 DAP, and the appearance of the PPDK transcript, are
consistent with the observations at the protein level,
although the variation is more dramatic and contrasting for
transcripts than for proteins. These data can be interpreted
by the near absence of oxygen at these late stages, which
impedes functioning of the mitochondrial electron transport
chain because of the deficit in the final electron acceptor. In
this context, starch synthesis, which does not need oxygen,
is favoured. In addition, the increase in PPDK may act on the
protein/starch balance at the end of starch filling, as discussed
by Méchin et al. (2007). The largest diversity of starch and
amino acid metabolism transcripts is observed at the
beginning of the starch accumulation phase, preparing for
the synthesis of the numerous enzymes needed for further
storage product synthesis. The large increase in carbohydrate
transcripts at 21 DAP corresponds to UDP-glucose metabolism
enzymes (conversion into UDP-galactose or UDP-glucuronate)
and to glucosidase, which is probably linked to cell wall
formation. Accordingly, a relatively high UDP-glucose level is
maintained at later stages. With regard to the proteome,
especially at the mid stage, the proportion of transcripts
for secondary compounds and nucleotide metabolism is
surprisingly high compared with those for carbohydrate
metabolism, suggesting that the contribution of these two
categories of metabolism may need to be re-evaluated.
Starch synthesis: towards a synthetic view from
transcripts, proteins and enzyme activities
The core reactions involved in the starch synthetic pathway
are well known, especially in maize kernels, thanks to a series
of mutants marking each step. Individual analyses of transcript
and protein expression have been made by classical techniques,
and post-translational modifications, possibly affecting in vivo
activity, have been demonstrated for some enzymes, such as
redox modification in AGPase and phosphorylation in SBE
(Tetlow et al., 2004). The coordination of individual reactions
has been tested genetically by assessing the effect of single
mutations on the rest of the pathway. Taking advantage of
the triploid structure of the endosperm, the dosage effect of
mutant alleles of Sh1, Bt2, Ae1 (encoding SBEIIb) and Su1
(encoding DBE) on the content of soluble sugars and starch
formation has been examined for various enzyme activities
(Singletary et al., 1997). These workers found a direct relation-
ship between the amount of starch produced and gene
dosage, and observed, for all three dose mutants, except su1,
large pleiotropic effects on the various enzyme activities,
associated with an elevated level of soluble sugars. Similarly,
sh2, bt2, ae1, du1 and waxy mutations resulted in both an

Maize endosperm development and starch filling 865
© 2008 The AuthorsJournal compilation © 2008 Blackwell Publishing Ltd, Plant Biotechnology Journal, 6, 855–869
increased transcription rate of the non-mutated genes of the
starch pathway and an effect on zein synthesis, which
suggested a coordinated transcriptional control of the genes
involved in storage compound biosynthesis in maize
endosperm (Giroux et al., 1994). In rice, the study of 269
genes belonging to different metabolic pathways that were
coordinately up-regulated during grain filling, as shown by
the monitoring of 21 000 microarrayed genes, has recently
provided some clues on the possible mechanisms involved in
coordinated expression (Zhu et al., 2003). Indeed, analysis of
available promoter sequences indicated a significant over-
representation of an AACA element in these grain-filling
genes when compared with other genes, suggesting that this
motif may play a role in the coordinated expression of various
pathways during grain filling. A group of transcription factors
potentially interacting with this element was identified.
The present approach in maize, which considers the
simultaneous developmental changes at key steps of starch
biosynthesis at the level of transcript and protein accumulation
and enzyme activity, in relation to substrate and/or product
concentration, provides information on the integrated
functioning of the pathway during endosperm development
and its relationship to the energy metabolism examined at
the transcript and protein level.
Two main patterns are observed for carbohydrates: (i)
hexoses present an early maximum followed by a decline;
and (ii) starch, ADP-glucose and sucrose present a low level
before 14 DAP and a progressive increase up to 30 or 40 DAP.
The enzymes involved in the cleavage/synthesis or accumula-
tion of these compounds display consistent activity patterns.
Initially high invertase activities decline thereafter, whereas
the activities of the core enzymes of the starch pathway (Susy,
AGPase, GBSS, SSS and SBE) progressively increase from a
low initial level to a maximum at 30–35 DAP, in parallel with
the ADP-glucose content. These two distinct patterns may be
interpreted with regard to the contribution of the metabolites
to development, either as signalling molecules or as trophic
components, during the lag and accumulation phases.
Invertases play a prominent role during the early phase,
producing hexoses from imported sucrose, as inferred from
the analysis of the miniature phenotype produced by the
mn1 mutation. This mutant is characterized by a deficiency in
both soluble and cell wall invertase activities, although
genetic and molecular analyses show that the mutation only
affects the cell wall gene Incw2. This gene is specifically
expressed in the basal endosperm tissue cell layer, where
carbohydrate transfer from the maternal placento-chalazal
zone to seminal tissue takes place (Cheng et al., 1996). As
cell wall and vacuolar activities vary in parallel in the mn1
mutant, a coordinated control of both isoforms has been
suggested. We confirm that the cell wall form is the most
active invertase in the endosperm, as noted previously
(Cheng et al., 1996; Qin et al., 2004). Four genes encode cell
wall invertase (Taliercio et al., 1999; Kim et al., 2000), but
only Incw2 and, to a much lesser extent, Incw1 are expressed
in the kernel. Accordingly, the main transcript detected is
Incw2, with maximum expression appearing earlier than
activity. However, the activity is relatively high at 10 DAP, but
the transcript level is still low, suggesting that, at the early
stage, few transcripts are required, and that, afterwards, the
cell wall invertase inhibitor recently reported in maize kernels
hinders activity (Bate et al., 2004). Invertase activity appears
to be critical for early kernel development (Cheng and
Chourey, 1999) because hexoses act as a positive signal on
cell division (Vilhar et al., 2002) and α-tubulin transcript
expression (Datta and Chourey, 2001). Accordingly, α-tubulin
transcripts are most numerous at 14 DAP and proteins are
mostly expressed in the lag phase (Méchin et al., 2007).
Susy and AGPase are two multimeric enzymes encoded by
small multigene families with specific tissue expression. Sh1
for Susy and Bt2 and Sh2 for AGPase are the main genes
expressed in the endosperm. Transcripts for two other Susy
genes, Sus1 and Sus3 (now called Sus2), have been reported
in the endosperm (Carlson et al., 2002). Indeed, very low
expression of these two genes compared with Sh1 was found,
but quantitative proteome data were only available for Sus1,
showing maximum expression at 30 DAP, consistent with the
enzyme activity pattern. The major transcripts of Sh1 peak at
21 DAP, which is earlier than for the enzyme activity, consistent
with a predominant role for transcriptional control of the expres-
sion of Susy in the endosperm, as also reported in developing
leaves (Nguyen-Quoc et al., 1990; Nguyen-Quoc, 1991).
For AGPase, the situation is even more complex as, in
addition to the small and large subunits encoded by the Bt2
and Sh2 genes expressed in the endosperm cytosol, another
subunit couple, Agp1 and Agp2, constitutes an AGPase
expressed in both the endosperm and embryo amyloplasts
(Denyer et al., 1996), but mainly in the embryo (Giroux and
Hannah, 1994). Transcripts for each AGPase subunit were
identified for the embryo forms, but no endosperm Bt2
transcript was detected in our cDNA library. The RT-PCR
results show that Sh2 is the most highly expressed overall. A
similar predominant expression of only one AGPase transcript
(OsAPL3, a Sh2-like gene) in the middle phase of seed
development has been reported from comparisons of the
expression profiles of six cDNAs encoding the two small
subunits and four large subunits in rice. Furthermore, OsAPL3
has been shown to be accumulated significantly in response

866 Jean Louis Prioul et al.
© 2008 The AuthorsJournal compilation © 2008 Blackwell Publishing Ltd, Plant Biotechnology Journal, 6, 855–869
to increasing levels of sucrose and abscisic acid (Akihiro et al.,
2005). The present sucrose time course is consistent with a
similar control of Sh2 expression in maize endosperm. Classical
Northern blot analyses with Bt2 and Sh2 probes of the time
course have shown previously that relative variations of both
transcripts coincide, but slightly precede AGPase protein and
activity levels (Prioul et al., 1994), a result consistent with the
present observations. It has also been noted, as in this study,
that the maximum activity coincides with the maximum rate
of starch accumulation. The low level of the AGPase protein
spot assigned to the large subunit of the embryo (plastid)
form at 10 DAP, in the absence of any measurable activity,
may originate from a contamination of the endosperm by
maternal tissues, which are difficult to separate at this stage.
Accordingly, up to 14 DAP, the AGPase transcripts and
peptides detected at low levels are mostly located in the
pericarp and nucellus (Brangeon et al., 1997). Afterwards,
the contribution of the plastid form to the total AGPase in the
endosperm has been estimated to be approximately 10%
(Denyer et al., 1996). In any case, the major form becomes
the typical endosperm AGPase from 14 DAP onwards.
Our in situ measurements of AGPase activity show that it
is concentrated in the endosperm, first in the distal part
and then towards the base. At 40 DAP, starch synthesis is
completed in the upper endosperm, as shown by the yellow
zone marking flint starch where the enzyme is no longer
active. The pattern is very similar for Susy, as is the time course
for both enzyme transcripts, supporting the cooperative
functioning of both enzymes and suggesting a similar tran-
scriptional control.
Three groups of enzymes are involved in starch synthesis
[the starch synthases (GBSS and SSS), SBEs and, finally, DBEs
hydrolysing branched linkages], yielding the highly ordered
and clustered structure of the amylopectin polymer. Pullulanase,
another DBE group, is more likely to be involved in starch
degradation. Of the starch synthases, the granule-bound
form (GBSSI) is dedicated to the synthesis of amylose, which
consists of long linear chains with a few branches. The very
low transcript and protein levels at 10 and 14 DAP increase
further as amylose accumulation increases, which may be
indicative of a coarse transcriptional control, although some
post-translational modification cannot be excluded because
of some discrepancies between the amlyose accumulation
rate and both transcript and protein levels. The SSSs are
involved in the elongation of amylopectin chains. Four SSS
isoforms (I, IIa, IIb, III = DU1) have been described, but most
of the activity has been reported to rely on SSSI and SSSIII
products (Cao et al., 1999). However, of the three transcripts
characterized here, SSSIIa is the most expressed overall,
which is consistent with our proteomic data. Thus, the con-
tribution of SSSIIa to global activity in the endosperm needs
to be re-evaluated. Three SBEs (I, IIa and IIb) have been
described (Ball and Morell, 2003); the transcripts assigned to
SBEII are expressed three times more highly than SBEI,
whereas SBEIIa is only weakly expressed, mainly in the early
phase. The activity and transcripts nearly disappear at 40 DAP,
suggesting rapid inactivation or degradation of the enzyme.
The present functional approach strongly suggests that
the primary control of enzyme activity leading to starch
biosynthesis takes place in a coordinated manner at the
transcriptional level. The explanation may be found by
searching for common specific motifs in gene promoters
when complete sequences become available, as performed
in rice (Zhu et al., 2003). However, in the case of cell wall
invertase, AGPase and SSS for example, the joint analysis of
the transcript, protein (when available) and activity level
suggests a potential control at the protein level. The various
controls [post-transcriptional modifications or feedback loops,
hexose signalling, as shown for Incw2 and kernel cell division
(Cheng and Chourey, 1999; Vilhar et al., 2002), and protein–
protein interactions producing metabolic channelling
(Hennen-Bierwagen et al., 2008)] remain to be elucidated.
Experimental procedures
Growth conditions for field experiments
The maize flint line F-2 was first grown in Bergamo (Italy) from Aprilto July 2001 to provide material for the cDNA endosperm librariesfrom 2 to 28 DAP. A second season in Clermont-Ferrand (France)from April to August 2002 was dedicated to parallel analysis ofkernel development at five sampling dates from 10 to 40 DAP bytranscriptomic, proteomic and biochemical methods. For this purpose,endosperm sets at the five sampling dates were ground in liquidnitrogen, and aliquots were used for the various experiments.
Transcriptomics procedures
RNA extractions were performed using a phenol–chloroform protocol(Baudo et al., 2006). Traces of genomic DNA were eliminated by adeoxyribonuclease (DNase) treatment. RNA was quantified spectro-photometrically, and ribonuclease (RNase) contaminations weretested by incubating the RNA for 5 min at 37 °C. The quality of theRNA was then checked by gel electrophoresis. Unamplified cDNAwas used to construct the various libraries in the vector pBluescript IISK+ using standard procedures. All libraries were directionally clonedbetween the EcoRI and XhoI restriction enzyme recognition sites.
EST sequencing
Clones from each library were subjected to a single-pass sequenceusing the SK primer. The number of clones sequenced for each library
Maize endosperm development and starch filling 867
© 2008 The AuthorsJournal compilation © 2008 Blackwell Publishing Ltd, Plant Biotechnology Journal, 6, 855–869
was 10 × 96 clones for 10, 14 and 21 DAP; however, the numberof readable sequences with a minimum quality threshold score ofPhred 10 over a minimum length of 100 bp was 783, 805, and 408,respectively. Only clones meeting this minimum quality were takenforward for further analysis. Sequences were submitted to theEuropean Molecular Biology Laboratory (EMBL) nucleotide sequencedatabase [EMBL Acc: FM180579 to FM196445 for cDNA (15867)].
Real-time RT-PCR
Real-time RT-PCR experiments were performed using an ABI Prism7000 Sequence Detection System (Applied Biosystems, Courtabeuf,France). Total RNA (10 μg per sample) was reverse transcribed witha polyadenylated-mRNA control. PCRs were prepared by adding10 μL of reaction mix (containing 1 μL of diluted RT reactions and100 pmol of gene-specific primer pair) (Table S2, see ‘Supportinginformation’) to 10 μL of 2 × QuantiTect-SYBR-Green-PCR mastermix (Qiagen, Courtabeuf, France). The amplification was performedin a MicroAmp-optical 96-well reaction plate (Applied Biosystems).The PCR parameters were as follows: 15 min at 95 °C, 45 cyclesof 95 °C for 30 s, 60 °C for 60 s and 72 °C for 60 s, with a finalincremental 1 °C increase up to 95 °C. The purity of the productswas analysed by agarose gel electrophoresis. Fluorescence readingswere analysed by associated software. Human β-globulin amplifica-tion over a range of human genomic DNA concentrations was usedas standard for quantification (Roche Applied Science, Meylan,France). The results were adjusted for the efficiency of reversetranscription and PCR amplification using the TRAF1 spike in eachsample. Primers were designed from the sequence of clones, whichwere checked by re-sequencing. The annotation of these clones,detailed in Table S2, was updated during manuscript preparation.Primer specificity was also re-checked in silico.
Carbohydrate metabolism
Invertases and Susy
Soluble and insoluble acid invertase activities were measured, afterextract desalting, by an enzyme coupling assay (Thévenot et al.,2005). The cell wall invertase activity was measured from the washedresuspended pellet, a method more effective than the commonlyused 1 M NaCl extraction (Qin et al., 2004). Susy and neutral inver-tase activities were measured in the same extract (Thévenot et al.,2005), except that N-2-hydroxyethylpiperazine-N′-2-ethanesulphon-ic acid (Hepes)–NaOH buffer was replaced by 50 mM sodium phos-phate buffer (pH 7) to avoid potential neutral invertase inhibition byHepes–NaOH buffer. Sucrose, glucose and fructose were assayedfrom the boiled extract by the same coupled enzyme assay as usedfor enzyme activities.
ADP-glucose pyrophosphorylase and
starch-synthesizing enzymes
The method used was derived from Sweetlove et al. (1996) within gel assays for SSS and GBSS essentially as described. Nativegel electrophoresis was performed using precast tris(hydroxymethyl)aminomethane (Tris)–glycine gels supplied by Invitrogen Ltd. (Cergy-Pontoise, France); staining of the gel for SSS activity was performedaccording to Kossmann et al. (1999). SBE activities were measured asdescribed in Smith (1988).
Starch
Total starch content and percentage amylose were determined byassaying starch samples solubilized by treatment with perchloric acid(Hovenkamp-Hermelink et al., 1988). Sodium dodecylsulphate-polyacrylamide gel electrophoresis (SDS-PAGE) was carried out using‘Novex NuPAGE’ precast gels and methods supplied by InvitrogenLtd.
Activated metabolites
A freshly harvested endosperm sample (or aliquot of endospermpowder, stored at –80 °C, up to 200 mg) was suspended in 0.5 mLof 1.41 M perchloric acid. After centrifugation, the supernatant wasneutralized with 5 M K2CO3. The supernatant collected after precipitationwas used for metabolite measurements. Glucose-6-phosphate, glucose-1-phosphate and fructose-6-phosphate were assayed spectrophoto-metrically using a coupled enzyme assay. UDP-glucose and ADP-glucosewere separated by high-performance liquid chromatography on aDIONEX column, and identified by high-performance anion exchangechromatography with pulsed amperometric detection.
In situ localization
Invertase, Susy and AGPase activities were evaluated on thin kernelsections (10 μm) from a cryomicrotome, using the same couplingenzyme principle as for in vitro measurement. The protocol wasadapted from Sergeeva and Vreugdenhil (2002). Frozen kernels werefixed (paraformaldehyde 2% in phosphate buffer) to keep theenzymes in tissue, and washed several times to remove all solublecompounds. Blue staining was performed by nitroblue tetrazoliumreduction after coupling enzyme reactions terminated by NADHproduction. Immunolocalization was performed on 2-μm sections,embedded in LR white medium, with a red fluorescent labellingsystem from Vector® (Paris, France), using two antibodies specificto cell wall invertase and vacuolar invertase, respectively (Kimet al., 2000).
Acknowledgements
The financial support of the European Union (EU), 6th PCR,
through the Zeastar project (QLK3-2000-00020), The Cell
Factory section, is gratefully acknowledged.
References
Akihiro, T., Mizuno, K. and Fujimura, T. (2005) Gene expression ofADP-glucose pyrophosphorylase and starch contents in rice cul-tured cells are cooperatively regulated by sucrose and ABA. PlantCell Physiol. 46, 937–946.
Aoyagi, K. and Bassham, J.A. (1984) Pyruvate orthophosphatedikinase of C3 seeds and leaves as compared to the enzyme frommaize. Plant Physiol. 75, 387–392.
Ball, S.G. and Morell, M.K. (2003) From bacterial glycogen to starch:understanding the biogenesis of the plant starch granule. Annu.Rev. Plant Biol. 54, 207–233.
Bate, N.J., Niu, X., Wang, Y., Reimann, K.S. and Helentjaris, T.G.(2004) An invertase inhibitor from maize localizes to the embryo

868 Jean Louis Prioul et al.
© 2008 The AuthorsJournal compilation © 2008 Blackwell Publishing Ltd, Plant Biotechnology Journal, 6, 855–869
surrounding region during early kernel development. Plant Physiol.134, 246–254.
Baudo, M.M., Lyons, R., Powers, S., Pastori, G.M., Edwards, K.J.,Holdsworth, M.J. and Shewry, P.R. (2006) Transgenesis has lessimpact on the transcriptome of wheat grain than conventionalbreeding. Plant Biotechnol. J. 4, 369–380.
Brangeon, J., Reyss, A. and Prioul, J.L. (1997) In situ detection ofADPglucose pyrophosphorylase expression during maizeendosperm development. Plant Physiol. Biochem. 35, 847–858.
Cao, H., Imparl-Radosevich, J., Guan, H., Keeling, P.L., James, M.G. andMyers, A.M. (1999) Identification of the soluble starch synthaseactivities of maize endosperm. Plant Physiol. 120, 205–216.
Carlson, S.J., Chourey, P.S., Helentjaris, T. and Datta, R. (2002) Geneexpression studies on developing kernels of maize sucrosesynthase (SuSy) mutants show evidence for a third SuSy gene.Plant Mol. Biol. 49, 15–29.
Chastain, C.J., Heck, J.W., Colquhoun, T.A., Voge, D.G. and Gu, X.Y.(2006) Posttranslational regulation of pyruvate orthophosphatedikinase in developing rice (Oryza sativa) seeds. Planta, 224, 924–934.
Chaudhury, A.M., Koltunow, A., Payne, T., Luo, M., Tucker, M.R.,Dennis, E.S. and Peacock, W.J. (2001) Control of early seeddevelopment. Annu. Rev. Cell Dev. Biol. 17, 677–699.
Cheng, W.H. and Chourey, P.S. (1999) Genetic evidence thatinvertase-mediated release of hexoses is critical for appropriatecarbon partitioning and normal seed development in maize.Theor. Appl. Genet. 98, 485–495.
Cheng, W.H., Taliercio, E.W. and Chourey, P.S. (1996) TheMiniature1 seed locus of maize encodes a cell wall invertaserequired for normal development of endosperm and maternalcells in the pedicel. Plant Cell, 8, 971–983.
Cho, Y., Fernandes, J., Kim, S.H. and Walbot, V. (2002) Gene-expression profile comparisons distinguish seven organs of maize.Genome Biol. 3: research00451–research 0045.16.
Datta, R. and Chourey, P.S. (2001) Sugar-regulated control ofalpha-tubulin in maize cell suspension culture. Plant Cell Rep. 20,262–266.
Denyer, K., Dunlap, F., Thorbjornsen, T., Keeling, P. and Smith, A.M.(1996) The major form of ADP-glucose pyrophosphorylase inmaize endosperm is extra-plastidial. Plant Physiol. 112, 779–785.
Ettenhuber, C., Spielbauer, G., Margl, L., Hannah, L.C., Gierl, A.,Bacher, A., Genschel, U. and Eisenreich, W. (2005) Changes influx pattern of the central carbohydrate metabolism during kerneldevelopment in maize. Phytochemistry, 66, 2632–2642.
Fernandes, J., Brendel, V., Gai, X., Lal, S., Chandler, V.L., Elumalai,R.P., Galbraith, D.W., Pierson, E.A. and Walbot, V. (2002) Com-parison of RNA expression profiles based on maize expressedsequence tag frequency analysis and micro-array hybridization.Plant Physiol. 128, 896–910.
Finnie, C., Melchior, S., Roepstorff, P. and Svensson, B. (2002)Proteome analysis of grain filling and seed maturation in barley.Plant Physiol. 129, 1308–1319.
Giroux, M.J. and Hannah, L.C. (1994) ADP-glucose pyrophosphorylasein shrunken-2 and brittle-2 mutants of maize. Mol. Gen. Genet.243, 400–408.
Giroux, M.J., Boyer, C., Feix, G. and Hannah, L.C. (1994) Coordinatedtranscriptional regulation of storage product genes in the maizeendosperm. Plant Physiol. 106, 713–722.
Gygi, S.P., Rochon, Y., Franza, B.R. and Aebersold, R. (1999) Correlationbetween protein and mRNA abundance in yeast. Mol. Cell. Biol.19, 1720–1730.
Hennen-Bierwagen, T.A., Liu, F., Marsh, R.S., Kim, S., Gan, Q., Tetlow,I.J., Emes, M.J., James, M.G. and Myers, A.M. (2008) Starchbiosynthetic enzymes from developing Zea mays endospermassociate in multisubunit complexes. Plant Physiol. 146, 1892–1908.
Higashi, Y., Hirai, M.Y., Fujiwara, T., Naito, S., Noji, M. and Saito, K.(2006) Proteomic and transcriptomic analysis of Arabidopsisseeds: molecular evidence for successive processing of seedproteins and its implication in the stress response to sulfurnutrition. Plant J. 48, 557–571.
Hovenkamp-Hermelink, J.H.M., Devries, J.N., Adamse, P., Jacobsen, E.,Witholt, B. and Feenstra, W.J. (1988) Rapid estimation of theamylose amylopectin ratio in small amounts of tuber and leaftissue of the potato. Potato Res. 31, 241–246.
Joosen, R., Cordewener, J., Supena, E.D., Vorst, O., Lammers, M.,Maliepaard, C., Zeilmaker, T., Miki, B., America, T., Custers, J. andBoutilier, K. (2007) Combined transcriptome and proteomeanalysis identifies pathways and markers associated with theestablishment of rapeseed microspore-derived embryo develop-ment. Plant Physiol. 144, 155–172.
Kim, J.Y., Mahé, A., Guy, S., Brangeon, J., Roche, O., Chourey, P.S.and Prioul, J.L. (2000) Characterization of two members of themaize gene family, Incw3 and Incw4, encoding cell-wall invertases.Gene, 245, 89–102.
Koller, A., Washburn, M.P., Lange, B.M., Andon, N.L., Deciu, C.,Haynes, P.A., Hays, L., Schieltz, D., Ulaszek, R., Wei, J., Wolters,D. and Yates, J.R., 3rd (2002) Proteomic survey of metabolicpathways in rice. Proc. Natl. Acad. Sci. USA, 99, 11 969–11 974.
Kossmann, J., Abel, G.J.W., Springer, F., Lloyd, J.R. and Willmitzer,L. (1999) Cloning and functional analysis of a cDNA encoding astarch synthase from potato (Solanum tuberosum L.) that ispredominantly expressed in leaf tissue. Planta, 208, 503–511.
Lai, J., Dey, N., Kim, C.S., Bharti, A.K., Rudd, S., Mayer, K.F., Larkins,B.A., Becraft, P. and Messing, J. (2004) Characterization of themaize endosperm transcriptome and its comparison to the ricegenome. Genome Res. 14, 1932–1937.
Lee, J.M., Williams, M.E., Tingey, S.V. and Rafalski, J.A. (2002) DNAarray profiling of gene expression changes during maize embryodevelopment. Funct. Integr. Genomics, 2, 13–27.
Méchin, V., Balliau, T., Chateau-Joubert, S., Davanture, M., Langella,O., Negroni, L., Prioul, J.L., Thévenot, C., Zivy, M. and Damerval,C. (2004) A two-dimensional proteome map of maizeendosperm. Phytochemistry, 65, 1609–1618.
Méchin, V., Thévenot, C., Le Guilloux, M., Prioul, J.L. and Damerval,C. (2007) Developmental analysis of maize endosperm proteomesuggests a pivotal role for pyruvate orthophosphate dikinase.Plant Physiol. 143, 1203–1219.
Mylona, P.V., Polidoros, A.N. and Scandalios, J.G. (2007) Anti-oxidant gene responses to ROS-generating xenobiotics in developingand germinated scutella of maize. J. Exp. Bot. 58, 1301–1312.
Nguyen-Quoc, B. (1991) Les saccharose synthases de mais et laregulation de leur expression dans la feuille en croissance. Thèse.Orsay: Université Paris-11.
Nguyen-Quoc, B., Krivitzky, M., Huber, S.C. and Lecharny, A. (1990)Sucrose synthase in developing maize leaves: regulation of activityby protein level during the import to export transition. Plant Physiol.94, 516–523.
Ober, E.S., Setter, T.L., Madison, J.T., Thompson, J.F. and Shapiro, P.S.(1991) Influence of water deficit on maize endosperm develop-ment: enzyme activities and RNA transcripts of starch and zein

Maize endosperm development and starch filling 869
© 2008 The AuthorsJournal compilation © 2008 Blackwell Publishing Ltd, Plant Biotechnology Journal, 6, 855–869
synthesis, abscisic acid, and cell division. Plant Physiol. 97, 154–164.
Olsen, O.A. (2001) Endosperm development: cellularization and cellfate specification. Annu. Rev. Plant Physiol. Plant Mol. Biol. 52,233–267.
Ostergaard, O., Finnie, C., Laugesen, S., Roepstorff, P. and Svennson,B. (2004) Proteome analysis of barley seeds: identification ofmajor proteins from two-dimensional gels (pI 4–7). Proteomics, 4,2437–2447.
Prioul, J.L., Jeannette, E., Reyss, A., Gregory, N., Giroux, M.,Hannah, L.C. and Causse, M. (1994) Expression of ADP-glucosepyrophosphorylase in maize (Zea mays L.) grain and source leafduring grain filling. Plant Physiol. 104, 179–187.
Prioul, J.L., Pelleschi, S., Sene, M., Thévenot, C., Causse, M.,deVienne, D. and Leonardi, A. (1999) From QTLs for enzymeactivity to candidate genes in maize. J. Exp. Bot. 50, 1281–1288.
Qin, L., Trouverie, J., Chateau-Joubert, S., Simond-Côte, E.,Thévenot, C. and Prioul, J.L. (2004) Involvement of the Ivr2-invertase in the perianth during maize kernel developmentunder water stress. Plant Sci. 166, 371–379.
Rolletschek, H., Koch, K., Wobus, U. and Borisjuk, L. (2005) Posi-tional cues for the starch/lipid balance in maize kernels andresource partitioning to the embryo. Plant J. 42, 69–83.
Schultz, J.A. and Juvik, J.A. (2004) Current models for starch synthesisand the sugary enhancer1 (se1) mutation in Zea mays. PlantPhysiol. Biochem. 42, 457–464.
Sergeeva, L.I. and Vreugdenhil, D. (2002) In situ staining of activitiesof enzymes involved in carbohydrate metabolism in plant tissues.J. Exp. Bot. 53, 361–370.
Singletary, G.W., Banisadr, R. and Keeling, P.L. (1997) Influence ofgene dosage on carbohydrate synthesis and enzymatic activities inendosperm of starch-deficient mutants of maize. Plant Physiol.113, 293–304.
Smith, A.M. (1988) Major differences in isoforms of starch-branchingenzyme between developing embryos of round-seeded andwrinkled-seeded peas (Pisum sativum L.). Planta, 175, 270–279.
Sreenivasulu, N., Altschmied, L., Radchuk, V., Gubatz, S., Wobus, U.and Weschke, W. (2004) Transcript profiles and deduced changesof metabolic pathways in maternal and filial tissues of developingbarley grains. Plant J. 37, 539–553.
Sweetlove, L.J., Burrell, M.M. and ap Rees, T. (1996) Characterizationof transgenic potato (Solanum tuberosum) tubers with increasedADPglucose pyrophosphorylase. Biochem. J. 320 (Pt 2), 487–492.
Taliercio, E.W., Kim, J.Y., Mahé, A., Shanker, S., Choi, J., Cheng, W.H.,Prioul, J.L. and Chourey, P.S. (1999) Isolation, characterizationand expression analyses of two cell wall invertase genes in maize.J. Plant Physiol. 155, 197–204.
Tetlow, I.J., Morell, M.K. and Emes, M.J. (2004) Recent develop-ments in understanding the regulation of starch metabolism inhigher plants. J. Exp. Bot. 55, 2131–2145.
Thévenot, C., Simond-Côte, E., Reyss, A., Manicacci, D., Trouverie,J., Le Guilloux, M., Ginhoux, V., Sidicina, F. and Prioul, J.L. (2005)QTLs for enzyme activities and soluble carbohydrates involved instarch accumulation during grain filling in maize. J. Exp. Bot. 56,945–958.
Vensel, W.H., Tanaka, C.K., Cai, N., Wong, J.H., Buchanan, B.B. andHurkman, W.J. (2005) Developmental changes in the metabolicprotein profiles of wheat endosperm. Proteomics, 5, 1594–1611.
Vilhar, B., Kladnik, A., Blejec, A., Chourey, P.S. and Dermastia, M.(2002) Cytometrical evidence that the loss of seed weight in theminiature1 seed mutant of maize is associated with reducedmitotic activity in the developing endosperm. Plant Physiol. 129,23–30.
Watson, B.S., Asirvatham, V.S., Wang, L. and Sumner, L.W. (2003)Mapping the proteome of barrel medic (Medicago truncatula).Plant Physiol. 131, 1104–1123.
Yu, L.X. and Setter, T.L. (2003) Comparative transcriptional profilingof placenta and endosperm in developing maize kernels inresponse to water deficit. Plant Physiol. 131, 568–582.
Zhu, T., Budworth, P., Chen, W., Provart, N., Chang, H.S., Guimil, S.,Su, W., Estes, B., Zou, G. and Wang, X. (2003) Transcriptionalcontrol of nutrient partitioning during rice grain filling. Plant Bio-technol. J. 1, 59–70.
Supporting information
Additional supporting information may be found in the
online version of this article:
Figure S1 Distribution into functional categories of endo-
sperm transcripts from kernels 10, 14 and 21 days after
pollination (DAP), including non-identified (NI), not yet clearly
identified (NYC) and storage protein transcripts.
Table S1 Functional classification of transcripts identified in
endosperm at 10, 14 and 20 days after pollination (DAP)
Table S2 Reverse transcriptase-polymerase chain reaction
(RT-PCR) primers and annotations
Please note: Wiley-Blackwell is not responsible for the con-
tent or functionality of any supporting materials supplied by
the authors. Any queries (other than missing material) should
be directed to the corresponding author for the article.
Copyright © 2022 FDOKUMEN