Good urodynamic practices: Uroflowmetry, filling cystometry, and pressure-flow studies
14
Neurourology and Urodynamics 21:261^274 (2002) Good Urodynamic Practices: Uro£owmetry, Filling Cystometry, and Pressure-Flow Studies Werner SchȄfer,* Paul Abrams, Limin Liao, Anders Mattiasson, Francesco Pesce, Anders Spangberg, Arthur M. Sterling, Norman R. Zinner, and Philip van Kerrebroeck International Continence Society O⁄ce, Southme Hospital, Bristol, BSIO 5NB, United Kingdom This is the ¢rst report of the International Continence Society (ICS) on the development of com- prehensive guidelines for Good Urodynamic Practice for the measurement, quality control, and documentation of urodynamic investigations in both clinical and research environments. This report focuses on the most common urodynamics examinations; uro£owmetry, pressure recording during ¢lling cystometry, and combined pressure^£ow studies. The basic aspects of good uro- dynamic practice are discussed and a strategy for urodynamic measurement, equipment set-up and con¢guration, signal testing, plausibility controls, pattern recognition, and artifact correction are proposed. The problems of data analysis are mentioned only when they are relevant in the judgment of data quality. In general, recommendations are made for one speci¢c technique. This does not imply that this technique is the only one possible. Rather, it means that this technique is well-estab- lished, and gives good results when used with the suggested standards of good urodynamic practice. Neurourol.Urodynam.21:261^274,2002. ß 2002 Wiley-Liss, Inc. Key words: urodynamics; standardisation; uro£owmetry; cystometry; pressure-£ow studies INTRODUCTION A Good Urodynamic Practice comprises three main elements: ^ A clear indication for and appropriate selection of, relevant test measurements and procedures ^ Precise measurement with data quality control and complete documentation ^ Accurate analysis and critical reporting of results The aim of clinical urodynamics is to reproduce symptoms whilst making precise measurements in order to identify the underlying causes for the symptoms, and to quantify the related pathophysiological processes. By doing so, it should be possible to establish objectively the presence of a dysfunction and understand its clinical implications. Thus, we may either con¢rm a diagnosis or give a new, speci¢cally urodynamic, diagnosis. The quantitative measurement may be supple- mented by imaging (videourodynamics). Urodynamic measurements cannot yet be completely auto- mated, except for the most simple urodynamic procedure, uro£owmetry.This is not an inherent problem of the measure- ment itself, but is due to the current limitations of urodynamic equipment and the lack of a consensus on the precise method of measurement, signal processing, quanti¢cation, documen- tation, and interpretation. With the publication of this ICS Standardisation document on good urodynamic practice, it is expected that the necessary technological developments in automation will follow. Urodynamics allows direct assessment of lower urinary tract (LUT) function by the measurement of relevant physio- logical parameters. The ¢rst step is to formulate the ‘urody- namic question or questions’ from a careful history, physical examination, and standard urological investigations. The patient’s recordings of micturitions and symptoms on a fre- quency volume chart, and repeated free uro£owmetry with determination of post-void residual volume provide important Urodynamic techniques were performed according to the ‘Good Urody- namic Practice’recommended by the International Continence Society. This report is from the Standardization Committee of the International Continence Society. *Correspondence to: Werner SchȄfer, International Continence Society O⁄ce, Southme Hospital, Bristol, BSIO 5NB, United Kingdom. E-mail: Vicky@icso⁄ce.org. DOI 10.1002/nau.10066 Published online inWiley InterScience (www.interscience.wiley.com). ß 2002 Wiley-Liss, Inc.
-
Upload
independent -
Category
Documents
-
view
1 -
download
0
Transcript of Good urodynamic practices: Uroflowmetry, filling cystometry, and pressure-flow studies
Neurourology and Urodynamics 21:261^274 (2002)
Good Urodynamic Practices: Uro£owmetry, FillingCystometry, and Pressure-Flow Studies
Werner Sch�fer,* Paul Abrams, Limin Liao, Anders Mattiasson, Francesco Pesce,Anders Spangberg, Arthur M. Sterling, Norman R. Zinner,
and Philip van KerrebroeckInternational Continence Society O⁄ce, Southme Hospital, Bristol, BSIO 5NB,
United Kingdom
This is the ¢rst report of the International Continence Society (ICS) on the development of com-prehensive guidelines for Good Urodynamic Practice for the measurement, quality control, anddocumentation of urodynamic investigations in both clinical and research environments. Thisreport focuses on the most common urodynamics examinations; uro£owmetry, pressure recordingduring ¢lling cystometry, and combined pressure^£ow studies. The basic aspects of good uro-dynamic practice are discussed and a strategy for urodynamic measurement, equipment set-up andcon¢guration, signal testing, plausibility controls, pattern recognition, and artifact correction areproposed. The problems of data analysis are mentioned only when they are relevant in the judgmentof data quality. In general, recommendations are made for one speci¢c technique. This does notimply that this technique is the only one possible. Rather, it means that this technique is well-estab-lished, and gives good results when used with the suggested standards of good urodynamic practice.Neurourol.Urodynam.21:261^274,2002. � 2002Wiley-Liss, Inc.
Key words: urodynamics; standardisation; uro£owmetry; cystometry; pressure-£ow studies
INTRODUCTION
A Good Urodynamic Practice comprises three mainelements:
^ A clear indication for and appropriate selection of,relevant test measurements and procedures
^ Precise measurement with data quality control andcomplete documentation
^ Accurate analysis and critical reporting of results
The aim of clinical urodynamics is to reproduce symptomswhilst making precise measurements in order to identifythe underlying causes for the symptoms, and to quantify therelated pathophysiological processes. By doing so, it should bepossible to establish objectively the presence of a dysfunctionand understand its clinical implications. Thus, we may eithercon¢rm a diagnosis or give a new, speci¢cally urodynamic,diagnosis. The quantitative measurement may be supple-mented by imaging (videourodynamics).
Urodynamic measurements cannot yet be completely auto-mated, except for the most simple urodynamic procedure,uro£owmetry.This is not an inherent problem of the measure-ment itself, but is due to the current limitations of urodynamicequipment and the lack of a consensus on the precise methodof measurement, signal processing, quanti¢cation, documen-tation, and interpretation. With the publication of this ICSStandardisation document on good urodynamic practice, it
is expected that the necessary technological developments inautomation will follow.Urodynamics allows direct assessment of lower urinary
tract (LUT) function by the measurement of relevant physio-logical parameters. The ¢rst step is to formulate the ‘urody-namic question or questions’ from a careful history, physicalexamination, and standard urological investigations. Thepatient’s recordings of micturitions and symptoms on a fre-quency volume chart, and repeated free uro£owmetry withdetermination of post-void residual volume provide important
Urodynamic techniques were performed according to the ‘Good Urody-namic Practice’ recommended by the International Continence Society.
This report is from the Standardization Committee of the InternationalContinence Society.
*Correspondence to: Werner Sch�fer, International Continence SocietyO⁄ce, SouthmeHospital, Bristol, BSIO 5NB,United Kingdom.E-mail: Vicky@icso⁄ce.org.
DOI 10.1002/nau.10066
Published online inWiley InterScience (www.interscience.wiley.com).
� 2002Wiley-Liss, Inc.
noninvasive, objective information that helps to de¢ne the spe-ci¢c ‘urodynamic question’or questions, prior to invasive uro-dynamics such as ¢lling cystometry and pressure-£ow studies.
Recommendations for good urodynamic practice are bulletpointed, inset, and printed in bold.
RECORDING MICTURITIONSAND SYMPTOMS
AMicturitionTime Chart records the time of each micturi-tion. The usefulness of such a record is signi¢cantly enhancedwhen the voided volumes are recorded in a Frequency VolumeChart. The Bladder Diary adds to this the relevant symptomsand events such as urgency, pain, incontinence episodes, andpad usage. Recording for a minimum of 2 days is recom-mended. From the recordings, the average voided volume,voiding frequency, and if, the patient’s time in bed is recorded,day/night urine production and nocturia can be determined.This information provides objective veri¢cation of the pati-ent’s symptoms, and furthermore, key values for plausibilitycontrol of subsequent urodynamic studies, for example, inorder to prevent over-¢lling of the patient’s bladder.
UROFLOWMETRY
Uro£owmetry is noninvasive and relatively inexpensive.Therefore, it is an indispensable, ¢rst-line screening test formost patients with suspected LUT dysfunction. Objectiveand quantitative information, which helps one to understandboth storage and voiding symptoms are provided by this sim-ple urodynamic measurement.
Adequate privacy should be provided and patients shouldbe asked to void when they feel a ‘‘normal’’ desire to void.Patients should be asked if their voiding was representativeof their usual voiding and their view should be documented.Automated data analysis must be veri¢ed by inspection of the£ow curve, artifacts must be excluded, and veri¢cation mustbe documented. The results from uro£owmetry should becompared with the data from the patient’s own recording ona frequency/volume chart. Sonographic estimation of post-void residual volume completes the noninvasive assessmentof voiding function.
Normal Uro£ow
Normal voiding occurs when the bladder outlet relaxes(is passive) and the detrusor contracts (is active). An easily dis-tensible bladder outlet with a normal detrusor contractionresults in a smooth arc-shaped £ow rate curve with high ampli-tude. Any other shapes, such as curves that are £at, asymmetric,orhavemultiplepeaks (£uctuatingand/or intermittent), indicateabnormal voiding, but are not speci¢c for it’s cause.
It is assumed that it is normal for the mechanical propertiesof a relaxed outlet to be constant, and that the properties canbe de¢ned by the dependency of the cross-sectional area of the
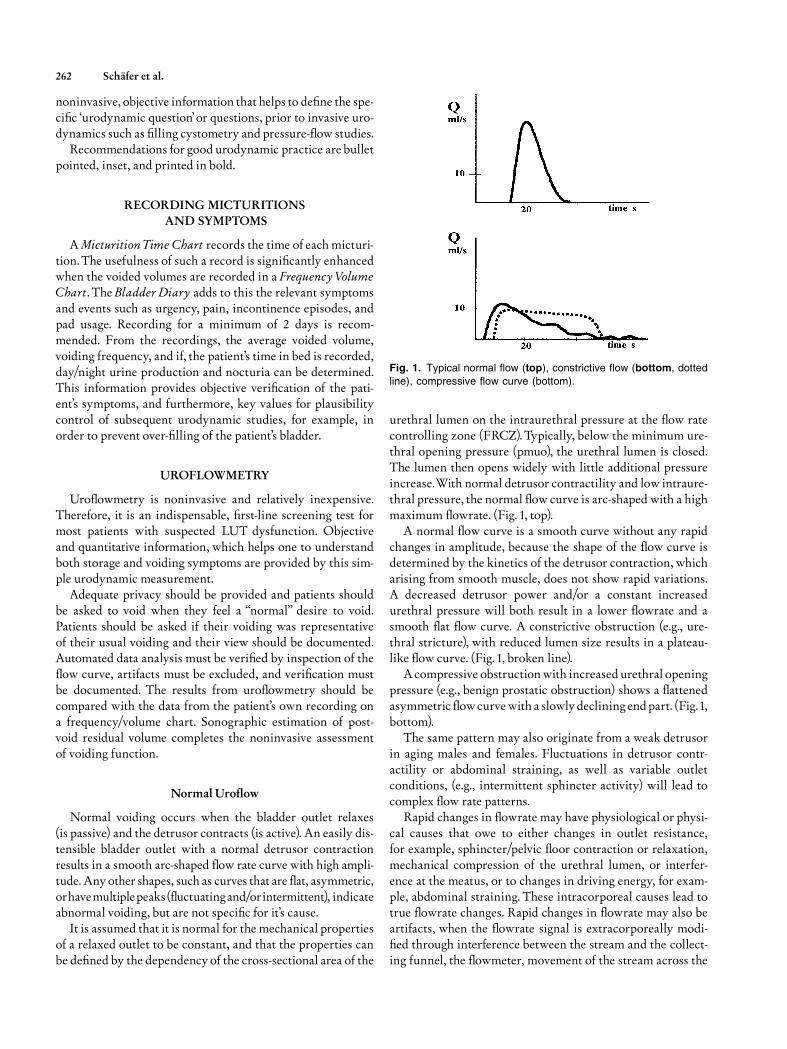
urethral lumen on the intraurethral pressure at the £ow ratecontrolling zone (FRCZ). Typically, below the minimum ure-thral opening pressure (pmuo), the urethral lumen is closed.The lumen then opens widely with little additional pressureincrease.With normal detrusor contractility and low intraure-thral pressure, the normal £ow curve is arc-shaped with a highmaximum £owrate. (Fig. 1, top).
A normal £ow curve is a smooth curve without any rapidchanges in amplitude, because the shape of the £ow curve isdetermined by the kinetics of the detrusor contraction, whicharising from smooth muscle, does not show rapid variations.A decreased detrusor power and/or a constant increasedurethral pressure will both result in a lower £owrate and asmooth £at £ow curve. A constrictive obstruction (e.g., ure-thral stricture), with reduced lumen size results in a plateau-like £ow curve. (Fig. 1, broken line).
A compressive obstructionwith increased urethral openingpressure (e.g., benign prostatic obstruction) shows a £attenedasymmetric £owcurve with a slowly declining endpart. (Fig. 1,bottom).
The same pattern may also originate from a weak detrusorin aging males and females. Fluctuations in detrusor contr-actility or abdominal straining, as well as variable outletconditions, (e.g., intermittent sphincter activity) will lead tocomplex £ow rate patterns.
Rapid changes in £owrate may have physiological or physi-cal causes that owe to either changes in outlet resistance,for example, sphincter/pelvic £oor contraction or relaxation,mechanical compression of the urethral lumen, or interfer-ence at the meatus, or to changes in driving energy, for exam-ple, abdominal straining. These intracorporeal causes lead totrue £owrate changes. Rapid changes in £owrate may also beartifacts, when the £owrate signal is extracorporeally modi-¢ed through interference between the stream and the collect-ing funnel, the £owmeter, movement of the stream across the
Fig. 1. Typical normal flow (top), constrictive flow (bottom, dotted
line), compressive flow curve (bottom).
262 Sch�fer et al.
surface of the funnel, or patient movements. (see £ow-curvesin Figs. 3^8).
Accuracy of Uro£owmeters
Uro£owmetry measures the £ow rate of the external urin-ary stream as volume per unit time in milliliters per second,(ml/s). The ICS Technical Report [Rowon et al., 1984] madetechnical recommendations with respect to uro£owmetry,but did not compare di¡erent £owmeters by speci¢c testing.There are, however, di¡erences in the accuracy and precisionof the £ow rate signals that depend on the type of £owmeter,on internal signal processing, and on the proper use and cali-bration of the £owmeter. The desired and actual accuracy ofuro£owmetry should be assessed in relation to the potentialinformation that could be obtained from the urinary streamcompared to the information actually abstracted for clinicaland research purposes. Some relevant aspects of the physiolo-gical and physical information contained in the urinarystream are outlined here.
The desired clinical accuracy may di¡er from the technicalaccuracy of a £ow meter. The ICS Technical report recom-mended the following standards: a range of 0^50 ml/s forQmax, and 0^1,000 ml for voided volume, maximum time con-stant of 0.75 s; an accuracy of � 5% relative to full scale,although a calibration curve representing the percentage errorover the entire range of measurement should be made available.However, technical speci¢cations from the manufacturersare rare and often not in accordance with ICS recommenda-tions: this situation should be recti¢ed.
Furthermore, as most £owmeters are mass £ow meters(e.g., a weight transducer or rotating disk), variations in thespeci¢c gravity of the £uid will have a direct in£uence on themeasured £ow rate. For example, urine of high concentrationmay increase apparent £ow rate by 3%.With X-ray medium,the £ow rate may be overestimated by as much as 10%. Thesee¡ects should be corrected by calibration software.
Thus, since the overall accuracy of £ow rate signals will notbe better than � 5%, it would not be meaningful to report amaximum £ow rate to a resolution better than a full milliliterper second (ml/s). Under carefully controlled research condi-tions, a better resolution may be possible by £owmeter cali-bration and instrument selection.However, such improvementsin resolution may not be required for routine clinical applica-tions. The dynamic properties of most £owmeters will begood enough for free uro£owmetry.When pressure £ow dataare analyzed, however, the limitation in signal dynamicsshould be taken into account because they will be di¡erentfor pressure than for £ow. Flow signals have a much slowerresponse, and are less accurate than pressure signals.
Problems inUrine Flow Rate Measurement
The problems in measurement, as well as the informationthat can be abstracted from the £ow rate signal are rather dif-
ferent for free uro£owmetry compared to combined pressure/£ow recordings.In free uro£owmetry, the shape of the £ow curve may sug-
gest speci¢c types of abnormality, but reliable, speci¢c, anddetailed information about the cause for abnormal voidingcannot be derived from a £ow curve alone. Only when uro-£owmetry is combined with intravesical and abdominalpressure recordings does it become possible, from the pres-sure^£ow relationship, to analyze separately the contribu-tions of detrusor contractility and bladder outlet function tothe overall voiding pattern. (Figs. 3^8)Urine £ow rate measurement is a¡ected by a number of
important factors.
Detrusor Contractility
As the voiding function re£ects the interaction between therelaxed outlet and the contracting detrusor, variation of bothwill a¡ect the £ow. For steady out£ow conditions, all varia-tions in £owrate are related to changes in detrusor activityalone. The detrusor contraction strength varies neurogeni-cally and myogenically, and can cause signi¢cant variabilityin urine £ow rate measurements. (Fig. 5).
Bladder Out£owResistance
If detrusor, contractility is constant, then changes inout£ow resistance will lead to changes in £ow rate, for ex-ample, in patients with detrusor^sphincter dyssynergia(Figs. 3, 7, 8).
BladderVolume
As the bladder volume increases and the detrusor muscle¢bers become more stretched, there is an increase in thepotential bladder power and work associated with a contrac-tion. This is most pronounced in the range from empty up to150^250 ml bladder ¢lling volume. It appears that at volumeshigher than 400^500 ml, the detrusor may become over-stretched and contractility may decrease again. Therefore,Qmax is physiologically dependent on the bladder volume.This dependency will vary between individuals and with thetype and degree of pathology, for example, in constrictiveobstruction, Qmax is almost independent of volume, and incompressive obstruction, the dependency becomes weakerwith increasingly obstructed outlet conditions and lower £owrate.
Technical Considerations
The £ow rate signal is in£uenced by the technique of mea-surement and by signal processing. The external urinarystream should reach the £owmeter unaltered and with mini-mal delay. However, any funnel or collecting device, as wellas the £owmeter, will inevitably introduce modi¢cations to
Good Urodynamic Practice Guidelines 263
the £ow rate recording. Physically, the external urinary streambreaks into drops not far from the meatus. This ¢ne structureof the stream has a high frequency, which can be assessedby drop spectrometry, and contains interesting information.For standard uro£owmetry, however, such high frequenciesshould be eliminated by signal processing.
For free uro£owmetry, all intracorporeal modulations ofthe £ow rate are physiological artifacts and should be mini-mized, for example by asking the patient to relax and not tostrain. Nevertheless, certain dynamic patterns of intracorpor-eal modulations can provide information about functionalobstruction, for example, typical patterns of the detrusor^sphincter dyssynergia, or abnormal straining. This informa-tion may be lost by excessive ¢ltering or during analog to digi-tal A/D conversion with a ¢lter speed of less than 10 Hz. Theprecise interpretation of dynamic variations in the £ow ratesignal is only possible when the £ow rate is viewed togetherwith the simultaneously recorded pressure signals. Thus, onlyin combined pressure^£ow recordings can the details of the£ow signal be fully understood.
For the determination of the ‘true’ maximum £ow ratevalue, particularly during free £ow, such high frequency signalvariations are more likely to be misleading, and consequentlythey should be suppressed electronically.
Recommendations for Uro£owmetry
In order to facilitate the recording of urine £ow rate andpattern recognition of £ow curves, it is recommended that gra-phical scaling should be standardized as follows:
� one millimeter should equal 1 s on the x-axis and 1ml/s and10 ml voided volume on the y-axis.
With respect to the technical accuracy of uro£owmeters,it is meaningful for routine clinical measurements to read£owrate values only to the nearest full ml/s and volumes tothe nearest 10 ml.
In order to make electronically-readQmax values more reli-able, comparable, and clinically useful, we recommend inter-nal electronic smoothing of the £ow rate curve. It isrecommended that:
� a sliding average over 2 s should be used to remove positiveand negative spike artifacts.
If curves are smoothed by hand, the same concept shouldbe applied. That is, when reading Qmax graphically, the lineshould be smoothed by eye into a continuous curve so thatineachperiodof 2 s,therearenorapidchanges.Sucha smoothed,clinically-meaningfulmaximum free £owQmax will be di¡erent(lower) from the peak value in the £ow rate recording of electro-nic instruments currently available. (seeFigs. 2, 5, 6, 8).
It is recommended that:
� only £ow rate values, which have been ‘smoothed’, eitherelectronically or manually, should be reported.
If a maximum £ow value is determined electronically bysimple signal peak detection without the recommended elec-tronic smoothing, it should be labeled di¡erently, Qmax.raw.Such raw data has meaning only if a detailed speci¢cation ofthe type of £owmeter used is given.
The interpretation of any dynamic variation (signal pat-terns) in free £ow will rely on personal experience, can be onlydescriptive, and in general will remain speculative.
For the documentation of the results of uro£owmetry, thefollowing recommendations are made:
� Maximum (smoothed) urine £ow rate should be roundedto the nearest whole number (a recording of 10.25 ml/swould be recorded as 10 ml/s);
� Voided volume and post void residual volume should berounded to the nearest 10 ml (a recording of a voidedvolume of 342 ml would be recorded as 340 ml);
� The maximum £ow rate should always be documentedtogether with voided volume and post void residual volumeusing a standard format: VOID: Maximum Flow Rate/VolumeVoided/PostVoid Residual Volume.
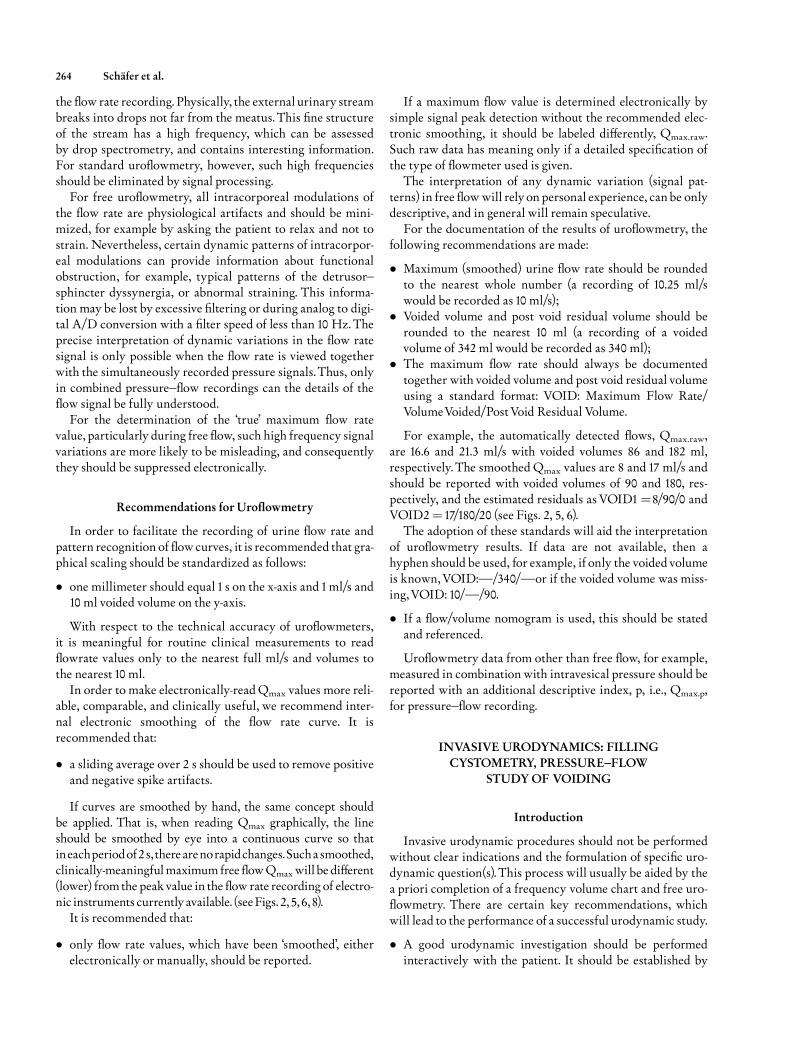
For example, the automatically detected £ows, Qmax.raw,are 16.6 and 21.3 ml/s with voided volumes 86 and 182 ml,respectively. The smoothed Qmax values are 8 and 17 ml/s andshould be reported with voided volumes of 90 and 180, res-pectively, and the estimated residuals as VOID1¼8/90/0 andVOID2¼17/180/20 (see Figs. 2, 5, 6).
The adoption of these standards will aid the interpretationof uro£owmetry results. If data are not available, then ahyphen should be used, for example, if only the voided volumeis known,VOID:�/340/�or if the voided volume was miss-ing,VOID: 10/�/90.
� If a £ow/volume nomogram is used, this should be statedand referenced.
Uro£owmetry data from other than free £ow, for example,measured in combination with intravesical pressure should bereported with an additional descriptive index, p, i.e., Qmax.p,for pressure^£ow recording.
INVASIVE URODYNAMICS: FILLINGCYSTOMETRY, PRESSURE^FLOW
STUDY OF VOIDING
Introduction
Invasive urodynamic procedures should not be performedwithout clear indications and the formulation of speci¢c uro-dynamic question(s). This process will usually be aided by thea priori completion of a frequency volume chart and free uro-£owmetry. There are certain key recommendations, whichwill lead to the performance of a successful urodynamic study.
� A good urodynamic investigation should be performedinteractively with the patient. It should be established by
264 Sch�fer et al.
discussion with the patient that the patient’s symptomshave been reproduced during the test;
� There should be continuous and careful observation of thesignals as they are collected, and the continuous assessmentof the qualitative and quantitative plausibility of all signals;
� Artifacts should be avoided, and any artifacts that occurshould be corrected immediately. It is always di⁄cult andis often impossible to correct artifacts during a retrospec-tive analysis. Furthermore, it is more time consuming thanif the signals are continuously observed and tested at regu-lar intervals and artifacts recognized during the uro-dynamic study and corrected.
At present, ambulatory urodynamic monitoring has torely on retrospective quality control and artifact corrections.However, in principle, the same quality criteria apply forambulatory urodynamic monitoring as for standard urody-
namics [vanWaalwijk et al., 2000]. This makes a consensus onquality even more important, because only when such criteriaare precisely de¢ned can they be implemented in an ‘‘auto-mated intelligent’’ambulatory system.Quality control relies on pattern recognition and a knowl-
edge of normal values as well as prior identi¢cation of usefulinformation obtained from noninvasive urodynamics and allother sources relevant for the urodynamic question. Thus,before invasive urodynamics, a frequency volume chartshould be completed and multiple free £ows should be evalu-ated. Useful information obtained from noninvasive testingincludes typical voided volumes and post-void residualvolumes as well as the expected values for Qmax.This informa-tion should be used for the control of subsequent invasive stu-dies. Only by good preparation can it be assured that (a) theproper answers to the urodynamic questions will be obtainedbefore the study is terminated and (b) necessary modi¢ca-
Fig. 2. Exclusion of artifactual spikes in the flow curve, Qmax.raw, and determination of a clinically
relevant maximum flow rate, Qmax, by manual smoothing. The results from uroflowmetry should be
reported in the standard format: Qmax/Vvoid/Vres.
Good Urodynamic Practice Guidelines 265
tions, additions, or repetitions of measurements will havebeen performed in order to derive the necessary information.
The e¡ective practice of urodynamics requires: (a) a theore-tical understanding of the underlying physics of the measure-ment, (b) practical experience with urodynamic equipment
and procedures, (c) an understanding of how to assure qualitycontrol of urodynamic signals, and (d) the ability to analyzecritically the results of the measurements. Because urody-namics deals largely with mechanical measurements such aspressure and volume and their related changes in time, and
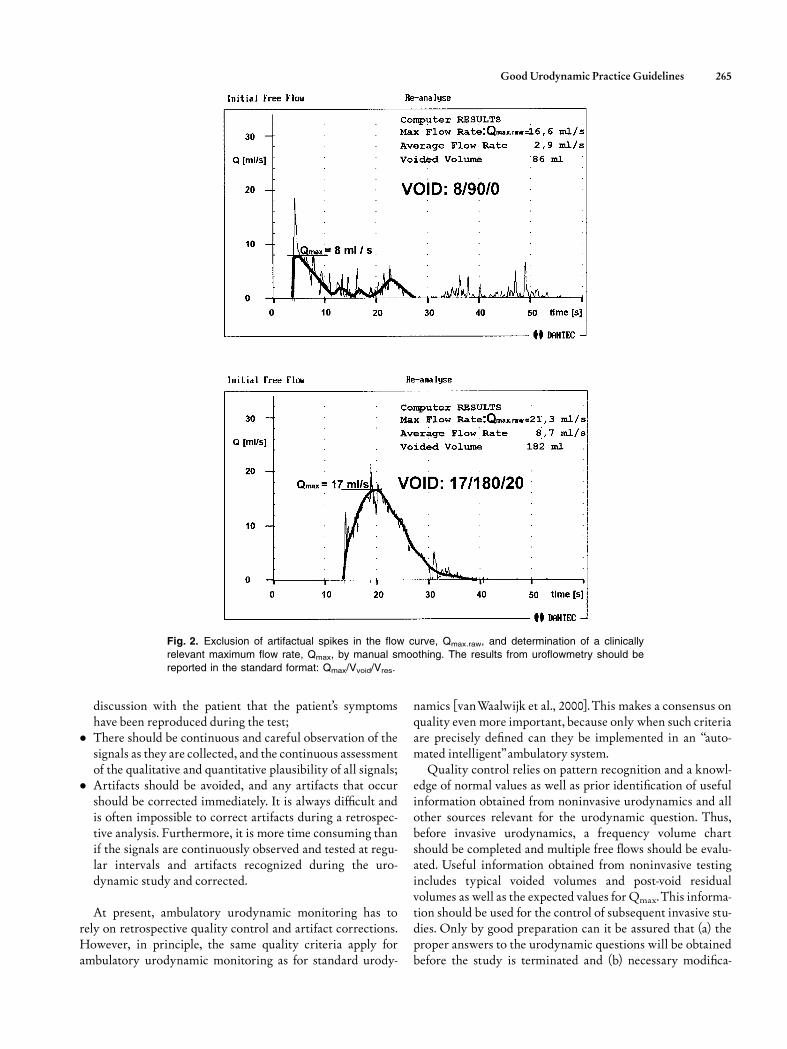
Fig. 3. Full recording of filling and voiding. Starting with initial values for pves, pabd of 32 cmH2O in the
typical range for a standing patient with zero pdet; testing signal quality with a vigorous cough
atbeginning, and regularly repeated (here less strong) coughs. Additionally, the pressure recordings
show the typical pattern of a talking patient, while the pdet trace is unaffected; a weak contraction atfirst desire FD; another vigorous cough before voiding; beginning of flow shows dyssynergic sphincter
activity as proven by decrease in flow with increase in pdet.
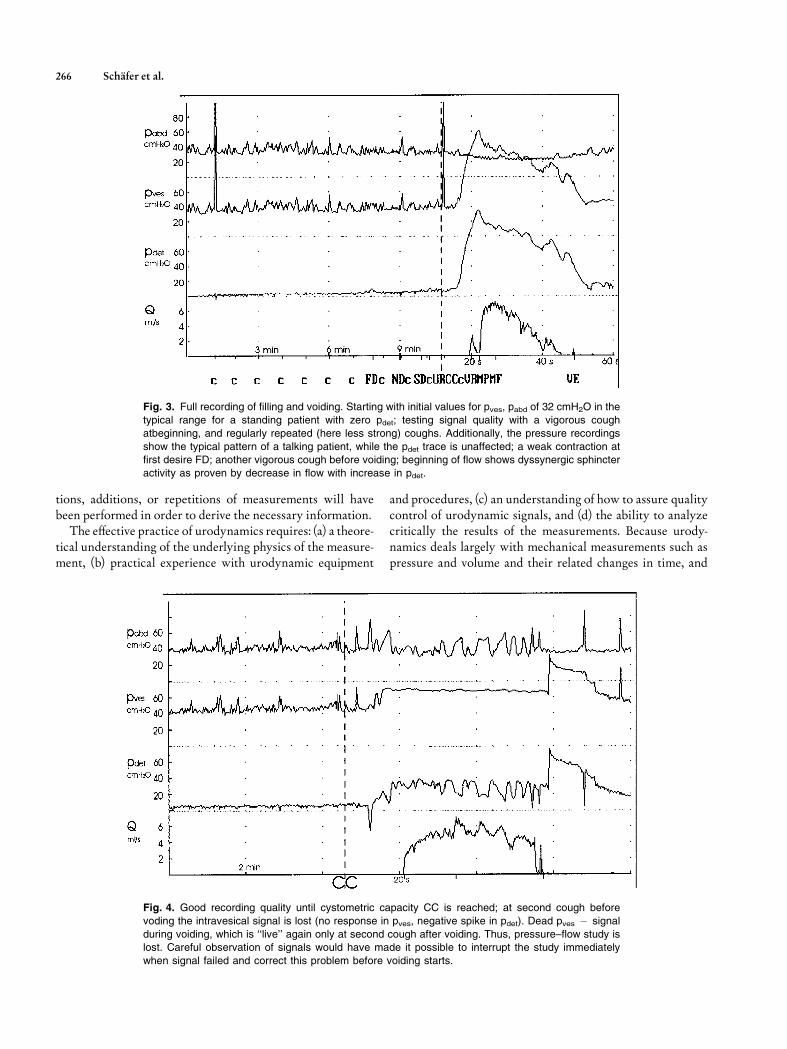
Fig. 4. Good recording quality until cystometric capacity CC is reached; at second cough before
voding the intravesical signal is lost (no response in pves, negative spike in pdet). Dead pves � signal
during voiding, which is ‘‘live’’ again only at second cough after voiding. Thus, pressure–flow study islost. Careful observation of signals would have made it possible to interrupt the study immediately
when signal failed and correct this problem before voiding starts.
266 Sch�fer et al.
because many analytical models use mechanical conceptssuch as resistance to £ow or contraction power, it is essentialthat the nature of these measurements and concepts, in parti-cular for pressure and £owrate, are understood. Therefore, inaddition to a comprehensive understanding of anatomy andphysiology, some basic knowledge of biomechanics and phy-sics is required.
The quality control of urodynamic measurements must beapproached on a holistic basis. Di¡erent types and levels of data
quality and plausibility control should be used: (a) on a physicaland technical level, (b) on a biomechanical level, and (c) on apathophysiological clinical level. A common problem in urody-namics is that clinicians often proceed immediately to a clinicalinterpretation, i.e., to level c without a critical analysis of thepotential pathophysiological information content,without con-sidering the plausibility of the signals (level a), without consid-ering the biomechanical context of the measurements (level b),and without taking into account the physical properties of the
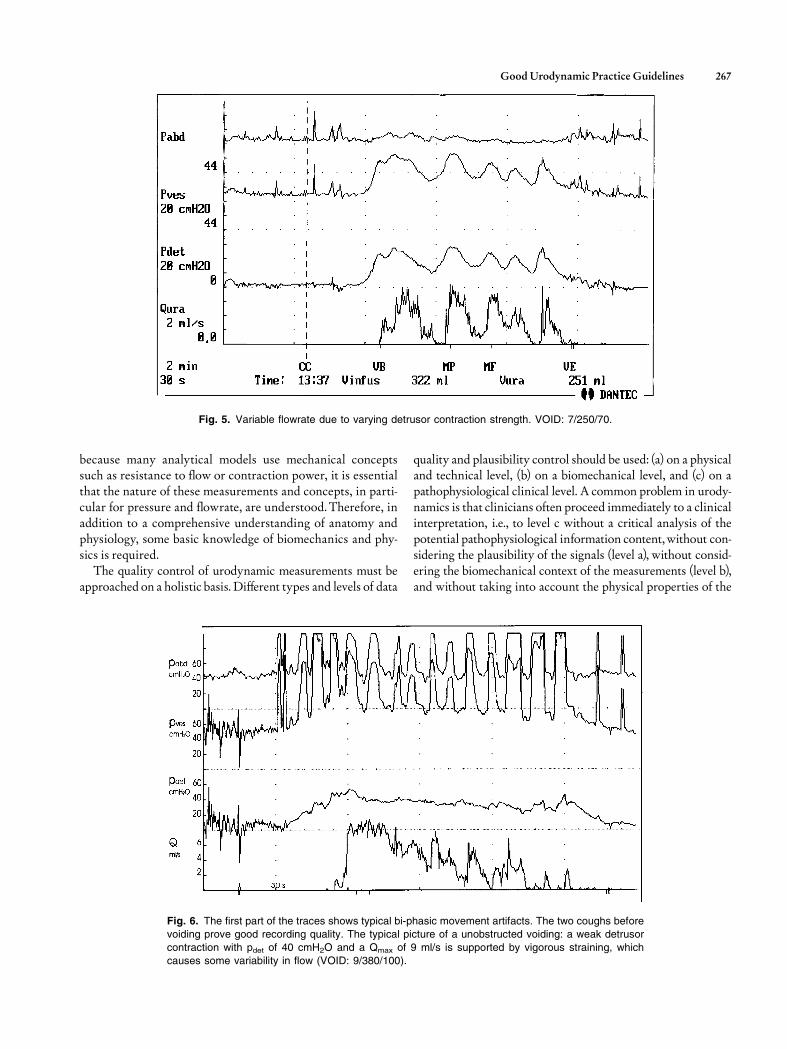
Fig. 5. Variable flowrate due to varying detrusor contraction strength. VOID: 7/250/70.
Fig. 6. The first part of the traces shows typical bi-phasic movement artifacts. The two coughs beforevoiding prove good recording quality. The typical picture of a unobstructed voiding: a weak detrusor
contraction with pdet of 40 cmH2O and a Qmax of 9 ml/s is supported by vigorous straining, which
causes some variability in flow (VOID: 9/380/100).
Good Urodynamic Practice Guidelines 267
parameters, technical limitations, and accuracy of the signals.Therefore, it is recommended that:
� Invasive urodynamics should not be performed withoutprecise indications and well-de¢ned ‘urodynamic ques-tions’ that are to be answered by the results of the urody-namic study.
Measurement of Urine Flow Rate DuringPressure^Flow Studies
The usefulness of the concept of a FRCZ for data analysisrequires that the recorded pressure and £ow rate signal be syn-chronized with respect to the FRCZ [Gri⁄ths et al. 1997].Normally, no measurable time delay will exist between
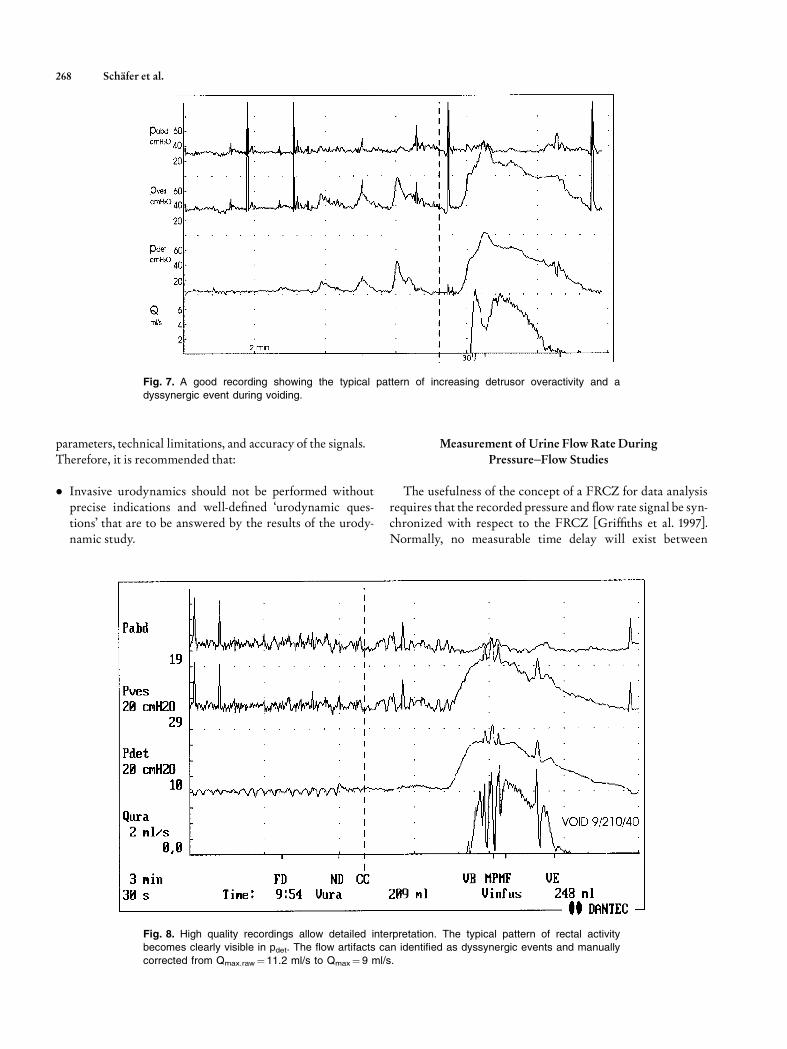
Fig. 7. A good recording showing the typical pattern of increasing detrusor overactivity and a
dyssynergic event during voiding.
Fig. 8. High quality recordings allow detailed interpretation. The typical pattern of rectal activitybecomes clearly visible in pdet. The flow artifacts can identified as dyssynergic events and manually
corrected from Qmax.raw¼11.2 ml/s to Qmax¼ 9 ml/s.
268 Sch�fer et al.
the intravesical pressure signal and the actual £ow at theFRCZ. However, a signi¢cant delay is to be expected for thetypical urodynamic £ow rate recorded extracorporeally. Thisdelay will vary with anatomy, pathology, £ow rate, and theset-up for measurement. Our understanding of the actualdynamics of £ow rate changes is limited, and the relativelyslow response of most £ow meters may not be su⁄cientto match the dynamics of the much-faster pressure signal.The actual time di¡erence may be from 0.5 to 2 s; the timedelay between urethral closure and the end of any £ow record-ing may be much longer, particularly in prostatic obstructionand terminal dribbling than between the opening of theurethra and the start of a £ow rate signal.Therefore,we recom-mend the use of more descriptive terminology for synchroniz-ing pressure and £ow values, such as pdet.Qbeg for the pressureat which £ow begins instead of pdet.open, and pdet.Qend when£ow ends instead of pdet.close. The time delay correctionneeds to be considered when analyzing pressure £ow studies[Gri⁄ths et al. 1997].
In average, the maximum £ow rate Qmax recorded duringPF studies, (Qmax.p), is lower than during free £ow (Qmax).This, however, is not due simply to a mechanical increase ofout£ow resistance by the intraurethral catheter, because sucha di¡erence is also found in suprapubic PF studies. A di¡er-ence has also been reported between Qmax.p during con-ventional and ambulatory urodynamics. This indicates morecomplex causes, possible psychogenic, but also physiologic,for example, that a di¡erence in detrusor contraction strengthmay be involved, and that the fast ¢lling rate used in clinicalstudies may lead to reduced contractility. This could alsoexplain the di¡erence in results between conventional andambulatory studies.
Measurement of Intravesical and Abdominal Pressure
� It is recommended that there is strict adherence to the ICSstandardization of zero pressure and reference height.Onlythen can pressure recordings be compared between patientsand centers.
Zero pressure and reference height are concepts whichare often confused in urodynamics. For example, by use ofthe misleading term ‘‘zero reference height’’. As both areindependent features of pressure, they must be consideredseparately, and both must follow recommended ICSmethodology.
� Zero pressure is the surrounding atmospheric pressure.
Zero pressure is the value recorded when a transducer isopen to the environment when disconnected from any tubesor catheters, or when the open end of a connected, £uid-¢lledtube is at the same vertical level as the transducer. Only thencan a‘‘set zero’’or ‘‘balance’’ be performed.
� The reference height is de¢ned as the upper edge of thesymphysis pubis.
The reference height is the level at which the transducersmust be placed so that all urodynamic pressures have the samehydrostatic component. It is often argued that it does notmakea di¡erence for the most relevant parameter, pdet, if the sameerror is introduce to pves and pabd, as they tend to cancel eachother out. This is not an acceptable argument.The hydrostaticpressure is real and important, and inevitably plays a rolein any intracorporeal pressure recording. Many importantaspects of quality and plausibility control, such as typical rest-ing value ranges at di¡erent patient position, are based on theproper recording of pressures, and will not apply if pressuresare not recorded according to ICS standards. Also, it is onlymeaningful to subtract one pressure from the other, for exam-ple (pves�pabd¼pdet), when both are recorded to the samereference level.
Pressure Transducers
Urodynamic techniques were developed using externalpressure transducers connected to the patient with £uid-¢lledlines, allowing easier compliance with the standards of correctzero and reference height. Catheter mounted pressure trans-ducers, so-called microtip transducer catheters have becomepopular due to their apparent higher accuracy, better dynamicresolution, and their apparent independence from hydrostaticpressure. A catheter mounted pressure transducer is an ad-vantage for dynamic recordings of urethral pressures duringcoughing (stress pro¢les) as well as for ambulatory urody-namics in mobile patients. Here only the application of cathe-termountedpressure transducers for intravesical andabdominalpressure recordings will be discussed as urethral pressures aredealt with in a separate report [Lose et al., 2002].All aspects of urodynamic pressure recording outlined in
the preceeding section are valid and independent of trans-ducer type. It is impossible to de¢ne the precise position ofan intravesical and a rectal catheter mounted pressure trans-ducers at to place them at any common level, and impossibleto position them at the standard level of the upper boarder ofthe symphysis pubis. It has become popular to circumvent thisproblem by setting the catheter mounted pressure transducersto zero pressure when inside the body at the start of pressurerecording. This, however, means that both the standard zeropressure as well the reference level are ignored, so that suchrecorded pressure cannot be compared between patients orcenters. The fact is, the initial intravesical and abdominalresting pressures are real, are di¡erent between patients, anddepend signi¢cantly on patient’s position. Thus, there are sig-ni¢cant potential errors; by ignoring the correct atmosphericzero pressure, an error of up to 50 cmH2O, and as the refer-ence height of the catheter mounted pressure transducers isusually undetermined, another potential error of 10 cmH2Ois possible for a full bladder can occur. In addition, when astudy starts with zero abdominal pressure then the commonlyobserved abdominal pressure decrease at pelvic £oor relaxa-tion during voiding will evidently result in negative abdom-inal pressure values, and thus in pdet being higher than pves.
Good Urodynamic Practice Guidelines 269
The same problems of apparent independence from theexisting hydrostatic pressure also applies to air-¢lled cathetersand/or connection tubings. Due to the absence of a water col-umn between the balloon-covered opening on the catheterand the external transducer, the reference height in an air-¢lled system will refer to the position of the sensing balloonon the catheter and not to the external transducer.
� It is recommended that for intravesical and abdominal pres-sure recording external transducers connected to £uid-¢lled tubings and catheters be used. If microtip or air-¢lledcatheters are used, any deviation from standard zero andreference level should beminimized and taken into accountat the time of data analysis.
Urodynamic Catheters
Comparison between patients and urodynamic studies per-formed in di¡erent centers would be facilitated by the use ofstandard catheters. It is recommended that:
� For the measurement of intravesical pressure and for blad-der ¢lling, the standard catheter for routine urodynamics isa transurethral double-lumen catheter.
Only in small children and patients with severe constrictiveobstruction (stricture) does suprapubic pressure recordinghave clear advantages. Intraurethral catheters should be asthin as possible, limited only by the practicality of insertionand by internal lumen sizes, which should be su⁄ciently largeto avoid excessive damping of pressure transmission and toachieve the desired ¢lling rate with standard pumps. A 6-Frdouble lumen catheter is the smallest practical size at present.
The major advantage of a double lumen catheter is thatthe ¢ll/void sequence can be repeated without the need forre-catheterization. Note that the use of a 6-Fr double lumencatheter can limit the infusion rate during cystometry to20^30 ml/min, as a typical roller pump may not manage totransport a higher perfusion rate through such a small lumen.This can result in a incorrect ¢lling volume being indicated bythe machine, when the ¢lling volume is calculated from thepump setting. For example, with a ¢lling rate set at 60 ml/min and an actually achieved ¢lling rate of 30 ml/min, themachine will show double the ¢lling volume. Thus after void-ing, a high calculated residual will occur. With some equip-ment, higher ¢lling rates are possible; it is essential that anysystem should be critically tested to (a) measure themaximum¢lling rate that can be achieved by a particular catheterattached to an individual pump and (b) correct or calibratethe indicated infused volume.
The use of two separate tubes for ¢lling and recording isless convenient. Removing the larger ¢lling tube for voidingmay appear to be an advantage because only a single smalltube is left in the urethra. However, there are no data to sug-gest that, for example, in a compressive obstruction such asBPO, a 6-F catheter has detrimental in£uence on the pressure
or £ow data. There are, however, data suggesting that resultsfrom a single study may be misleading. A double lumen cathe-ter facilitates a second ¢ll/void study to establish reproducibil-ity. Re-introduction of the separate ¢lling tube for a repeatedstudy is more invasive and complicated.
� The use of a rectal balloon catheter is recommended for themeasurement of abdominal pressure, pabd.
Although there are various methods for the successfulrecording of abdominal pressures, a £accid, air-free balloonin the rectal ampulla gives a suitable signal for pabd to deter-mine a meaningful pdet when pves is measured synchronously(pdet¼ pves�pabd). In females, vaginal recording may be moreacceptable and provides comparable results. The recording ofpabd allows the measurement of any abdominal (i.e., perivesi-cal) pressure component during changes in intravesical pres-sure.The role of the balloon is tomaintain a small £uid volumeat the catheter opening and to avoid fecal blockage, which canprevent or impair pressure transmission to the transducer.Additionally, as the rectal ampulla and the vagina are nothomogeneously £uid ¢lled spaces, the balloon prevents pres-sure artifacts arising from contact between the catheter open-ing and the wall tissue. The balloon serves this function bestwhen it is ¢lled only to 10^20% of its unstretched capacity.Over¢lling and elastic distention of the balloon is the mostcommon mistake in abdominal pressure recording. The resul-tant high balloon (not abdominal) pressure will produce amisleading pressure reading. Such an arti¢cially-elevated bal-loon distention pressure can be avoided by making a smallhole in the balloon, although this is unnecessary if the balloonis ¢lled properly as described above. It is also possible torecord reliable abdominal pressure with a very slowly per-fused (<2 ml/min) open ended catheter. However, excessive£uid volume in the rectal ampulla may cause problems.
Equipment: Minimum Requirements for Filling Cystometryand Pressure^Flow Studies of Voiding
The ICS has not yet speci¢ed de¢nite technical standards inrespect of minimum requirements for ¢lling cystometry andpressure £ow studies beyond the ICS Technical EquipmentReport [Rowan et al. 1997] and the appendix to the ICS docu-ment on pressure £ow [Gri⁄ths et al., 1997], where an dataexchange software standard is recommended. Some furtheraspects will be discussed in more detail here.
Equipment Recommendations
The minimum recommended requirements for a urody-namic system are:
� three measurement channels, two for pressure and one for£ow;
� a display (on printer and/or monitor) and secure storage ofthree pressures (pabd, pves, pdet,) and £ow (Q) as tracingsagainst time;
270 Sch�fer et al.
� infused volume and voided volume may be shown graphi-cally or numerically;
� on-line display of pressures and £ow, with adequate scaleand resolution; scales must be clearly given on all axes; noinformation should be lost electronically when tracings goo¡-scale on display;
� possibilities to record standard information about sensa-tion and additional comments (event recording).
Meaningful plausibility assessment and quality control ispossible only when the measured and derived signals are dis-played continuously as curves over time,without delay (in realtime), as the examination proceeds. Each displayed curve andnumber should be labeled according to ICS standards withclear scaling of amplitudes and the time axis. The followingsequential position of tracings is suggested: pabd at the top,then pves, pdet andQ (see Figs. 3^8 ). It is least important whenpabd goes o¡-scale and is cut o¡ (Fig. 6). Additional parameterssuch as EMG, bladder ¢lling, and voided volumes can be dis-played either as curves or digitally as numbers.
The following minimum technical speci¢cations arerecommended:
� Minimum accuracy should be �1 cmH2O for pressureand � 5% full scale for £ow and volume;
� Ranges of 0^250 cmH2O, 0^25(50) ml/s, and 1,000 ml forpressure, £ow, and volume, respectively;
� The software must ensure that no information for pressuresup to 250 cmH2O and for £ow rates up to 50 ml/s is lostinternally even when not displayed and that o¡-scale valuesare clearly identi¢ed;
� An analog/digital (A/D) frequency of 10 Hz per channel asthe lower limit for pressure and £ow;
� A higher frequency (minimum 20 kHz) is necessary forrecording EMG;
� Calibration of all measurements should be possible.
The scalings should be kept unchanged as much as possible,because urodynamic data quality control is based on patternrecognition, and the recognition of patterns depend on scal-ing. Therefore, it is recommended that:
� During recording and for analysis, minimum scaling forpressure be of 50 cmH2O per cm, for £ow 10 ml/s per cm,and for the time axis 1min/cm or 5 s/mm during ¢lling and2 s/mm during voiding.
To enable a retrospective judgment of the curves, urody-namic measurements should be documented as curves overtime with comments and explanations. It is usually insuf-¢cient to document urodynamic measurements by a fewnumerical values alone. The same amplitude of scaling shouldbe used for all documentation, although the time axis may becompressed. Only if there is no relevant information to be lostby reducing resolution, for example, during ¢lling, the timescale can be compressed.
For a print-out, maximum full scale de£ections of200 cmH2O, 50 ml/s, and 1,000 ml are su⁄cient for pressure,£ow and volume, respectively. In most cases, half the maxi-mum full scale will be su⁄cient to show all relevant parts ofcurves. Line resolution should be better than 0.10 mm.During interventions, for example, interruption of bladder
¢lling or manipulation of catheters, the continuation of bothmeasurement and recording must always be possible.On-line recording of comments should be possible, to com-
plete the documentation.
Calibration of Equipment
The need to calibrate pressure transducers, £owmeters, andpumps cannot be stated; simply ‘‘yes’’ if there is a need or ‘‘no’’there is not. The speci¢cation of the manufacturer should bestudied. Two aspects must be considered: the intended accu-racy of the system and the investigator’s experience with thesystem. If a new system is installed or new transducers arebeing used, it is recommended that regular calibration be car-ried out. If experience with daily calibration shows that thepotential error is small (e.g.,<2 cmH2O), then it will be su⁄-cient to calibrate once a month. However, calibration shouldnot be ignored and good urodynamic equipment makes ittechnically possible to perform a calibration. Calibrationshould not be confused with simple ‘zero balancing’, which isonly one part of a calibration. In addition to setting the zero, itmust possible to check and adjust the amplitudes of all mea-surement channels, i.e., to calibrate all signals.Calibration of a £owmeter can be achieved by pouring a
precisely measured volume at a constant £ow into the £ow-meter, typically 400 ml in 20^30 s (at 15^20 ml/s) and check-ing the recorded volume. Special constant-£owrate bottles areavailable for £ow calibration. Similarly, one can test a pumpbymeasuring the time to deliver a known volume, for example,100 ml into a measuring cylinder. It is recommended thatpump calibration be performed with the ¢lling catheter con-nected. Such a pump calibration can only be as good as thecylinder used, which needs to have good resolution and beaccurate. Some measuring beakers that are usually availablein clinics are not accurate.
Pressure Signal Quality Control: Qualitativeand Quantitative Plausibility
It is very important to observe and to test signals carefullyand to correct any problems before starting the urodynamicstudy. If the signals are perfect at the beginning of the study,they usually remain so without the need for major interven-tion. If the signals are not perfect, remedial action must betaken. If a quality problem does not disappear at once, when¢lling commences, it will usually deteriorate further duringthe study.Conscientious observation of the patient and of the signals,
in particular pdet, during all parts of the study, together with
Good Urodynamic Practice Guidelines 271
continuous signal testing, are the keys to high quality urody-namics. The ¢rst aim is to avoid artifacts and the second tocorrect the source of all artifacts immediately when theyoccur.
The following three criteria form the minimum recommen-dations for ensuring quality control of pressure recordings:
� Resting values for abdominal, intravesical, and detrusorpressure are in a typical range (see below);
� Theabdominal and intravesical pressure signals are‘live’,withminor variations caused bybreathing or talking being similarfor both signals; these variations shouldnot appear inpdet;
� Coughs are used (every I min. or, for example, 50 ml ¢lledvolume) to ensure that the abdominal and intravesical pres-sure signals respond equally. Coughs immediately beforevoiding and immediately after voiding should be included.
When standards are followed, i.e.,with the transducer zerosset to atmospheric pressure, and the transducers placed at thelevel of the upper edge of the symphysis, a typical range forinitial resting pressures values for pves and pabd is (Sch�fer,unpublished communications):
^ supine 5^20 cmH2O.^ sitting 15^40 cmH2O.^ standing 30^50 cmH2O.
Usually both recorded pressures are almost identical, sothat the initial pdet is zero, or close to zero, 0^6 cmH2O in80% of cases and in rare cases up to 10 cmH2O [Liao et al.,1999].
All initial pressure values should be veri¢ed and patients’position should be documented on the urodynamics trace.
All negative pressure values, except when caused by rectalactivity, should be corrected immediately. It should always bekept in mind that pabd is recorded not to know the actual rec-tal pressure, but to eliminate the impact of (abdominal) pres-sure changes on pves. The principal aim is to determine thedetrusor pressure, pdet, which is the pressure in the bladderwithout the in£uence of abdominal pressure. Therefore, pdetcannot be negative.
By talking to the patient during the study, the properdynamic response in the pressure signals can be observedand is ‘‘automatically’’documented (see Figs. 3, 4, 8).
Problem Solving
If either detrusor or rectal contractions occur, the recordedpressures in pves and in pabd will be di¡erent. Such changes canbe identi¢ed and interpreted with su⁄cient accuracy andreliability only when the patient is observed and the relationbetween signal changes and patient sensation/activity arechecked for plausibility and documented. Any pressurechange caused by smooth muscle contractions will show a‘‘smooth’’ pattern, (Figs. 5, 7, 8) i.e., there should be no rapid(‘‘stepwise’’) changes (Fig. 4). If pressures increase or decreasestep-wise, or with a constant slope over a long period of time,
a nonphysiological cause, such as catheter movement, shouldbe considered.
If a sudden drop or increase occurs in either the pves or pabdsignal, the usual cause is the movement, blockage (Fig. 4), ordisconnection of a catheter. When the patient changes posi-tion, sudden changes in resting values occur and are seenequally in both pressure signals. If pves (without change inpabd) increases slowly�as typical for a low compliance blad-der�it is important to test for any other possible cause for aslow pressure increase.One cause could be a problemwith theintravesical catheter measurement, for example, the hole forthe pressure conducting lumen is slowly moving into the blad-der neck region. This should be assessed by asking the patientto cough, if there is no other apparent artifact. Furthermore, itis recommended that bladder ¢lling is stopped, if the ¢llingrate was above a physiological limit of 10 ml/min. If the valueof pves drops after ¢lling is stopped, it is likely that ‘low com-pliance’ was, at least in part, related to fast ¢lling.
There are several common problems that must be solvedbefore the study is started or when observed during a study:Problem: Initial resting pdet is negative, for example,�5 cmH2O Possible explanations:
� because pabd is too high
Solution: If pves is in the typical range, and both pressures are‘live’, open the valve in the abdominal line and drain1 or 2drops from the rectal balloon ¢lling volume. This willusually cause pabd to fall to a proper value. If not, gently re-position the rectal balloon and/or make a small hole in theballoon.
� because pves is too low
Solution: This may be due to air bubbles trapped in the cathe-ter, the catheter not being in the bladder, or the catheterbeing blocked/kinked. Gently £ush through the pves line(max.10 ml). It is very important to £ush slowly while obser-ving the pressure signal because pressures above 300 cmH2Omay damage the transducer. If this does not solve the pro-blem, add some more volume to the bladder via the ¢llinglumen. If resistance to ¢lling is high and it does not draineasily when opened, it will be necessary to check catheterposition, and to re-position the catheter, if necessary.
Problem: Initial pdet too high, for example,15 cmH2OPossible explanations:
The key problem here is indicated by the measurement of15 cmH2O. The situation is di¡erent from the clear state-ment that ‘pdet cannot be negative’, as we do not have a de¢-nite upper limit for the normal maximum‘resting’ value forpdet. Thus, we can only follow the present guidelines that inmost tests, in an empty bladder pdet is between 0^5 cmH2O,and in some 90% it is between 0 1̂0 cmH2O. For any highervalue, stringent plausibility checking must be applied. If thepatient has no detrusor overactivity, a pdet of 15 cmH2O isunlikely to be valid and there may be a signal problem. First
272 Sch�fer et al.
check, if pabd and pves are in the expected ranges. For exam-ple, if in a standing patient, initial pves is 30 cmH2O andpabd is15 cmH2O, then by experience the value of pabd is toolow (because pabd is too low). If in a supine patient pabd is10cmH2O and pves is 25 cmH2O, then the value of pves is toohigh (because pves is too high). Check the zero balance andproper signal response to coughing for both signals.
� because pabd is too lowSolution to pabd being too low: Very slowly £ush the rectalballoon with1 or 2 ml.
� because pves is too high.Solution to pves being too high: This problem can be relatedto a misplaced catheter, a kink in the catheter, or contactwith the bladder wall in an empty bladder, which occludesthe eyehole(s) of the catheter. Proceed according to the solu-tion for pves being too high, in the ¢rst example above.
If no signal problem can be identi¢ed, the clinical study maybe started, but the pdet signal deserves particular attention. Ifcompliance is normal and the bladder normal at ¢lling, thenit is very important to record and check, for some period afterthe micturition, the post-voiding resting value of pdet .Only ifan elevated pdet is perfectly reproducible for repeated ¢llingand voiding studies can it be accepted. However, it is mostlikely that a high resting pdet will not be reproducible and willbe corrected by the measures described above.
In summary, if any resting value or cough response does not ¢tthe usual values or patterns, it should be corrected before blad-der ¢lling is started. If this is not possible, the signals must beobserved even more carefully and every e¡ort made to revealthe potential source of error or artifact during the study.
Retrospective Artifact Correction
In principle, a good pdet signal requires only that pves andpabd show the same ¢ne structure and quality of signals before¢lling, during ¢lling, and after a voiding. (Figs. 3, 4, 7, 8) Bothpves and pabd must have the same zero and reference level. Themost common mistake is to set (balance) the initial pressurevalues of pves and pabd to zero with the catheters connected tothe patient instead of setting zero to atmospheric pressure.This results in incorrect pves and pabd. If this is done, uro-dynamic studies cannot be compared between centers andbetween patients. Although it may seem convenient and easyto start with a value of pdet as zero, this practice will lead toproblems later in the test. As soon as pelvic £oor relaxationoccurs, which is particularly common during voiding, thevalue of pabd, if starting at zero, becomes negative.With a nega-tive pabd, pdet will be higher than pves, a conceptuallymeaning-less result. Furthermore, it will then be impossible to correct anegative pabd. Cough tests at regular intervals, particularlybefore voiding and after voiding, document the dynamicresponse of the pressure channels and are fundamentallyimportant.
A typical physiological artifact that can be easily recog-nized is a rectal contraction. Rectal contractions are usuallyof low amplitude and may or may not be felt by the patient(Fig. 8). The value of pabd shows a phasic rise with no changein the pdet signal�a potentially confusing fall in pdet resultsfrom the electronic subtraction, but this is, of course, an arte-fact.Usually rectal contractions are relevant only because theymay be misinterpreted as detrusor overactivity (Fig. 8): theyhave no relevance to voiding.Biphasic spikes as a response to cough tests are another
example of artifacts that are easy to correct. However, anyother artifacts such as a signal which is nonresponding (dead),has stepwise changes in pressure, or has negative pressures,often cannot be corrected or can be corrected only with a lotof speculation about the underlying causes of the problem.Studies with such artefacts, should be repeated see the nextsection).Retrospective corrections require the same strategies for
plausibility control as during recording, but then they aremuch more di⁄cult and less successful to perform.A few common artifacts (e.g., rectal activity, biphasic spikes
at cough tests, or insu⁄cient pabd response during straining)can be accepted during the study as they can be correctedretrospectively. Usually, this is easier to do manually thanthrough a computerized system.
Urodynamic Computer Software
Computer applications should allow the easy use of eventhe most complicated analytical algorithms. However, mostof the software o¡ered by the urodynamic equipment industryis neither original nor validated.The software may, in fact, notdo what the original developer(s) of the algorithm intended.Therefore, it is recommended that:
� When analytical urodynamic software is used to performdata analysis according to any published concept, thesource of the software should be speci¢ed. It should alsobe clearly stated if the software has been validated, i.e.,proven to provide results consistent with the algorithmsto which the analyses are attributed.
STRATEGY FOR REPETITION OFURODYNAMIC TESTS
� It is recommended that a urodynamic test should berepeated if the initial test suggests an abnormality, leavesthe cause of troublesome lower urinary tract symptomsunresolved, or if there are technical problems preventingproper analysis.
It may not be necessary, however, to repeat a study, whichbeyond any doubt, con¢rms the expected pathology, for exam-ple, detrusor overactivity which correlates with the patient’ssymptoms. However, if the study is inconclusive, then the
Good Urodynamic Practice Guidelines 273
consequences of not ¢nding a clear answer to the urodynamicquestion(s) should be considered. If an invasive therapy isplanned, the urodynamics should be repeated. Therefore, it isnecessary to analyze the signals during the study and docu-ment the study immediately upon its conclusion. Only thenis it possible to be sure that the urodynamic study is of a qual-ity that answers the urodynamic question and provides anunderstanding about the patient’s clinical problem. Therefore,it is recommended that:
� The urodynamic ¢ndings and the interpretation of theresults should be documented immediately after thestudy is ¢nished, i.e., before the patient has left the urody-namic laboratory. Doing so allows for a second test ifrequired.
The analysis of a good study is easy and straight-forward.Indeed, an easy analysis actually is the key criterion for goodurodynamics. A good study is one that is easy to read and onefromwhich a any experienced urodynamicist will abstract thesame results and come to the same conclusions. For computer-ized analyses, high data quality is even more important thanfor manual graphical data analysis. E¡orts to achieve urody-namic data of high quality during the study will produce greatbene¢ts at the time of data analysis.The future development ofurodynamic equipment and software should force investiga-tors to conduct proper on-line data quality control. Analysisof ambulatory studies will remain problematic, as it is less easyto conduct on-line assessment of quality, and analysis is timeconsuming. Hence, it will be necessary to ask the patient toreturn, on another occasion, should the investigation requirerepeating, for whatever reason.
CONCLUSIONS
This is the ¢rst report of the ICS Standardization commit-tee of GoodUrodynamic Practice. The authors are well awarethat this is just a ¢rst step and many more will have to follow.Only the essential aspects are considered, but if these basicstandards are followed, the quality of urodynamic studies willbe signi¢cantly improved.
ACKNOWLEDGMENTS
The Standardisation Committee is grateful for the exten-sive editing performed by Vicky Rees, ICS Administrator.The committee is also grateful for the detailed commentsreceived from Linda Cardozo, Paul Dudgeon, Guus Kramer,Joseph Macaluso, GerryTimm, and AlanWein.
REFERENCES
Gri⁄ths DJ, H˛fner K, van Mastrigt R, Rollema HJ, Spangberg A,Gleason DM. 1997. Standardization of terminology of lower urinarytract function: pressure-£ow studies of voiding, urethral resistance, andurethral obstruction. Neurourol Urodyn 16:1̂ 18.
Liao L, Kirshner-Hermanns R, Sch�ferW. 1999.Urodynamic quality control:quantitative plausibility control with typical value ranges. NeurourolUrodyn 18(abstract 99a):365^366.
Lose G,Gri⁄thsDJ, Hosker G, Kulseng-Hansen S, Perucchini D, Sch�ferW,Thind P,Versi E. 2002. Standardisation of urethral pressure measurement:Report of the sub-committee of the International Continence Society.Neurourol Urodyn 21:258^60.
Rowan D, James DE, Kramer AEJL, Sterling AM, Suhel PF. 1987. Urody-namic equipment: technical aspects. J Med EngTech 11:57^64.
van Waalwijk E, Anders K, Khullar V, Kulseng-Hanssen S, Pesce F,Robertson A, Rosario D, Sch�ferW. 2000. Standardisation of ambulatoryurodynamic monitoring: Report of the standardisation sub-committee ofthe International Continence Society. Neurourol Urodyn 19:113^125.
274 Sch�fer et al.